


Abstract
Vanya sericulture, comprising Muga (Antheraea assamensis Helfer) and Eri (Samia ricini Donovan) culture, is governed almost entirely by the microclimate prevailing during silkworm rearing and by host-plant management. Muga is reared semi-naturally on standing Som and Soalu trees, where temperature excursions, humidity imbalance, wind exposure and soil moisture variability act directly on larval development, cocoon weight and shell ratio. Conventional surveillance depends on discrete visual inspection and therefore cannot resolve sub-diurnal stress events or provide anticipatory warning. This paper specifies a four-tier Internet of Things (IoT) framework—perception, network, edge and application—designed for the operational constraints of Northeast India: absent grid power, dense canopy attenuation, monsoonal ingress and dispersed holdings. Node-level hardware, a LoRa–GSM hybrid communication plan, an edge quality-control chain and four derived agrometeorological indices (vapour pressure deficit, growing degree days, heat-stress hours and a cumulative deviation index) are defined. Species-specific thresholds compiled from published rearing norms are combined in a two-stage persistence-based decision logic that separates a low-cost ‘watch’ state from an actionable ‘alert’ state, with a machine-learning module providing a 6–48 h ahead stress probability. A synthetic 72 h demonstration shows that outdoor canopy conditions exceeded the 33 °C critical threshold for 19.0 h while a co-located indoor node never did, and that the logic escalated to alert state 2 h after first exceedance. A validation protocol linking alert records to effective rate of rearing, cocoon weight, shell ratio and disease incidence is proposed for pilot deployment.
1. Introduction
India remains the only country producing all four commercial silks, with an estimated 41,121 metric tonnes of raw silk in FY 2024–25, of which Eri contributed about 19.2% and Muga about 0.6% of national output [1]. The Vanya component is disproportionately important relative to its tonnage: it is concentrated in Northeast India, is largely practised by smallholder and tribal households, and depends on forest-based host plants rather than intensively managed field crops.
Muga silkworm is endemic to the Brahmaputra valley and adjoining hill tracts and is reared outdoors on standing Som (Persea bombycina) and Soalu (Litsea monopetala) trees [2]. Because rearing occurs on the tree canopy, the larval population experiences the ambient microclimate without buffering. Published rearing norms place optimum performance at 25–27 °C with 75–85% relative humidity, and a tolerable envelope of approximately 15–33 °C [3]. Deviations outside this envelope are consequential: relative humidity sustained above 86% together with temperatures of 32–37 °C during June–September has been associated with repeated seed-crop losses in traditional rearing belts [4], and season-wise analyses across recent years show measurable depression of cocoon weight, shell weight and shell ratio under adverse thermal regimes [5]. Species distribution modelling further indicates that the climate space jointly suitable for Muga silkworm and its primary host is expected to shift under future scenarios [6], which increases the value of site-level environmental evidence; broader reviews of climate impacts across the sericultural sector reach the same conclusion regarding the need for microclimate-aware management [7]. Eri silkworm, by contrast, is fully domesticated and reared indoors on castor and kesseru; extension norms specify incubation and early rearing at 24–26 °C and 75–85% relative humidity [8], while controlled experiments identify 28 ± 3 °C with about 70% relative humidity as optimal for larval, cocoon and grainage parameters [9].
Operationally, monitoring in both systems still rests on visual inspection at discrete intervals, typically once or twice daily. A single observation per day cannot resolve the afternoon excursions that generate thermal stress, cannot register night-time humidity saturation that favours bacterial and viral flacherie, and produces no retained record against which crop outcomes can later be regressed. The consequence is diagnostic rather than anticipatory management: intervention follows visible symptom expression, by which time larval mortality is already committed.
Sensor-based monitoring addresses this gap directly, and a body of work now exists on IoT and artificial intelligence in sericulture. Reported systems have coupled temperature, humidity and light sensing with microcontroller platforms and image processing for growth-stage identification [10], and recent syntheses document computer-vision disease detection, yield forecasting and environmental control across the sericultural value chain [11]. Almost all of this work, however, targets indoor mulberry rearing houses, where mains power, short communication distances and a bounded, controllable air volume make deployment comparatively straightforward. Vanya systems present a different constraint set: nodes must sit in plantations without grid supply, radio links must traverse a closed evergreen canopy, enclosures must survive monsoon rainfall, and holdings are dispersed across kilometres rather than metres. Comparable low-power wide-area deployments in agriculture indicate that these constraints are tractable but must be engineered explicitly rather than assumed away [12].
Accordingly, this paper has four objectives: (i) to specify a four-tier IoT architecture matched to the operational conditions of Muga and Eri rearing in Northeast India; (ii) to define node-level sensor and communication specifications, including a hybrid LoRa–cellular plan appropriate to canopy attenuation; (iii) to formalise a set of derived agrometeorological indices and a two-stage, persistence-based alert logic anchored to species-specific thresholds; and (iv) to define a validation protocol that links generated alerts to measured rearing outcomes so that system value can be quantified rather than asserted.
2. Materials and Methods
2.1. Target Production Systems and Site Context
The framework is specified for the agro-ecological conditions of upper Assam, taking the campus and adjoining host-plant blocks of CSB–Central Muga Eri Research and Training Institute, Lahdoigarh, Jorhat, (approximately 26.7° N, 94.2° E) as the reference site. The climate is humid subtropical with a pronounced pre-monsoon and monsoon regime, high cloud cover and extended periods of near-saturation humidity. Two contrasting rearing environments are addressed within a single system: an outdoor Som–Soalu plantation block supporting semi-natural Muga rearing, in which the sensing objective is to characterise the canopy microclimate actually experienced by larvae; and an indoor rearing and grainage house supporting Eri rearing and chawki operations, in which the objective is to verify that controlled conditions remain within prescribed bands.
2.2. System Architecture
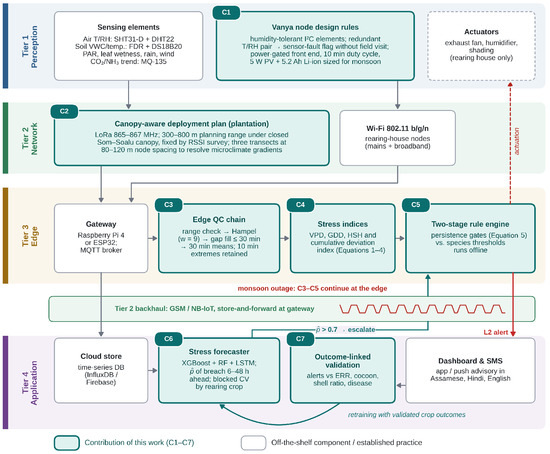
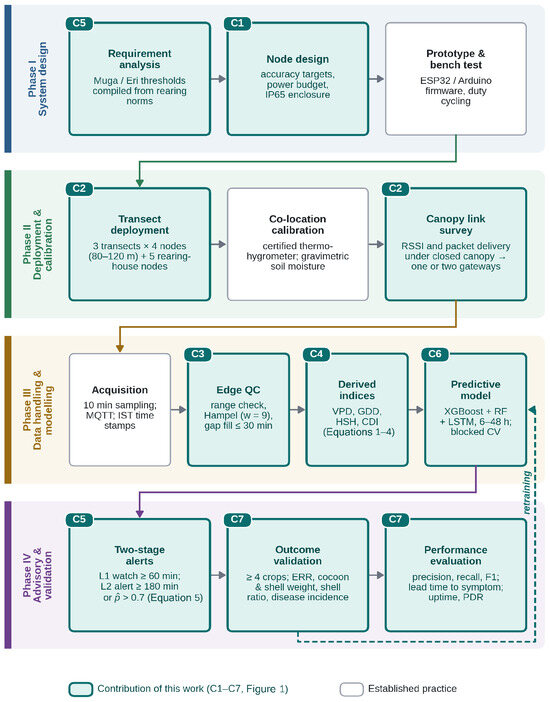
The system is organised into four tiers (Figure 1). The perception tier comprises heterogeneous sensor nodes deployed in the plantation and rearing house. The network tier carries measurements from nodes to a local aggregation point using LoRa in the plantation and Wi-Fi within the rearing house, with cellular backhaul from the gateway. The edge tier performs aggregation, quality control, feature extraction and rule evaluation locally, so that advisory generation does not fail when connectivity is lost—a non-trivial requirement in upper Assam during monsoon. The application tier holds the cloud time-series store, the machine-learning analytics engine, the dashboard and the messaging service that delivers advisories to rearers in local languages. A control feedback path is retained for rearing houses where actuation (exhaust fan, humidifier, shading) is available.
Figure 1.
Four-tier IoT architecture specified for Vanya sericulture monitoring. The edge tier retains an offline-capable rule engine so that threshold advisories continue to be generated during backhaul outages; the dashed path indicates optional actuation feedback available only in enclosed rearing houses. Solid arrows indicate the direction of data flow between components.
2.3. Methodological Workflow
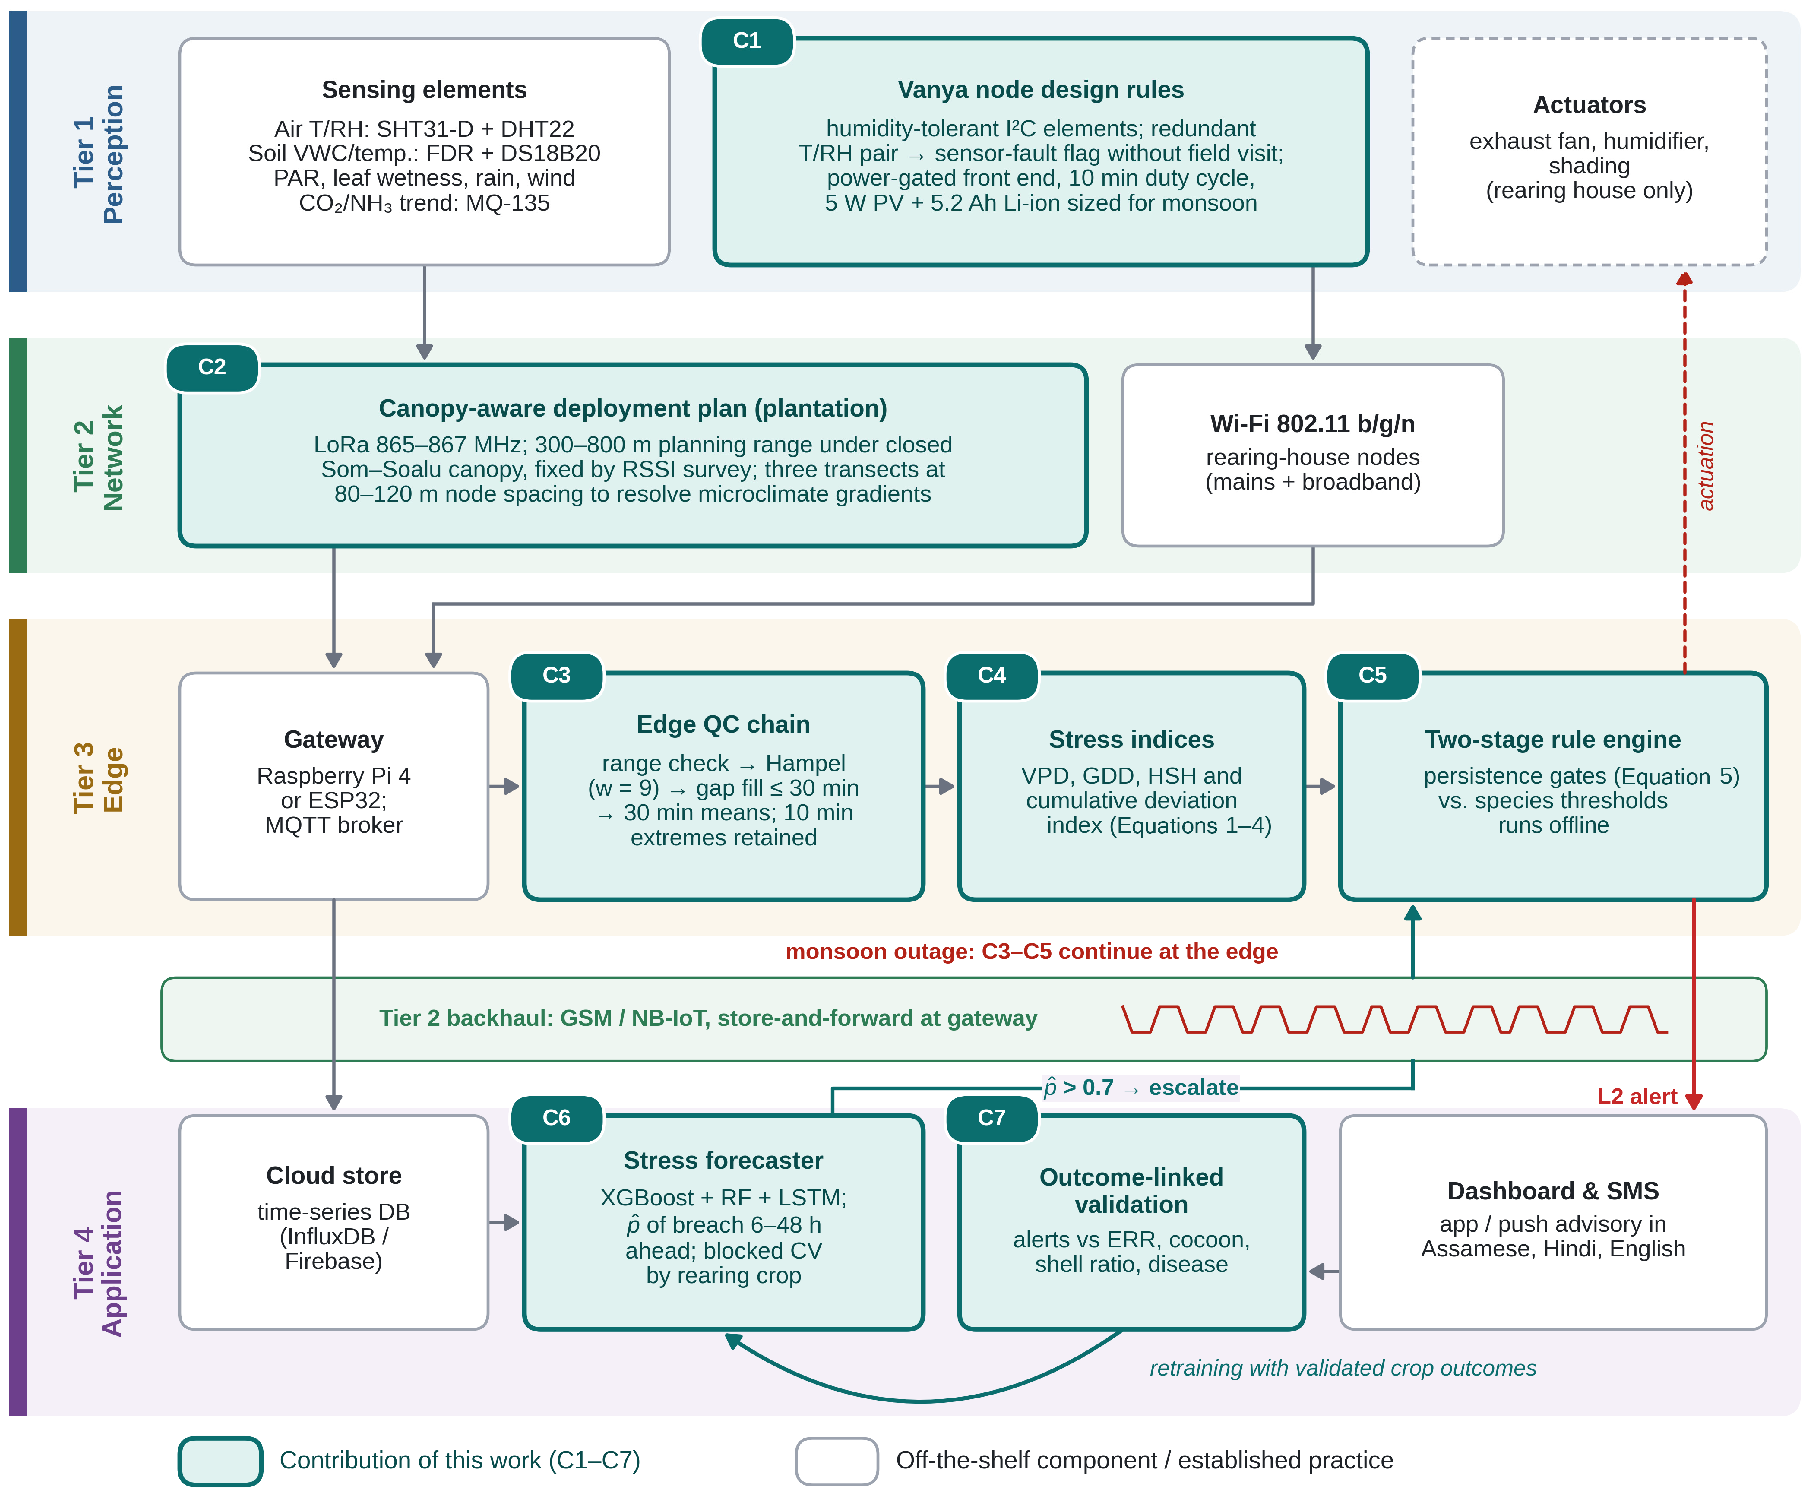
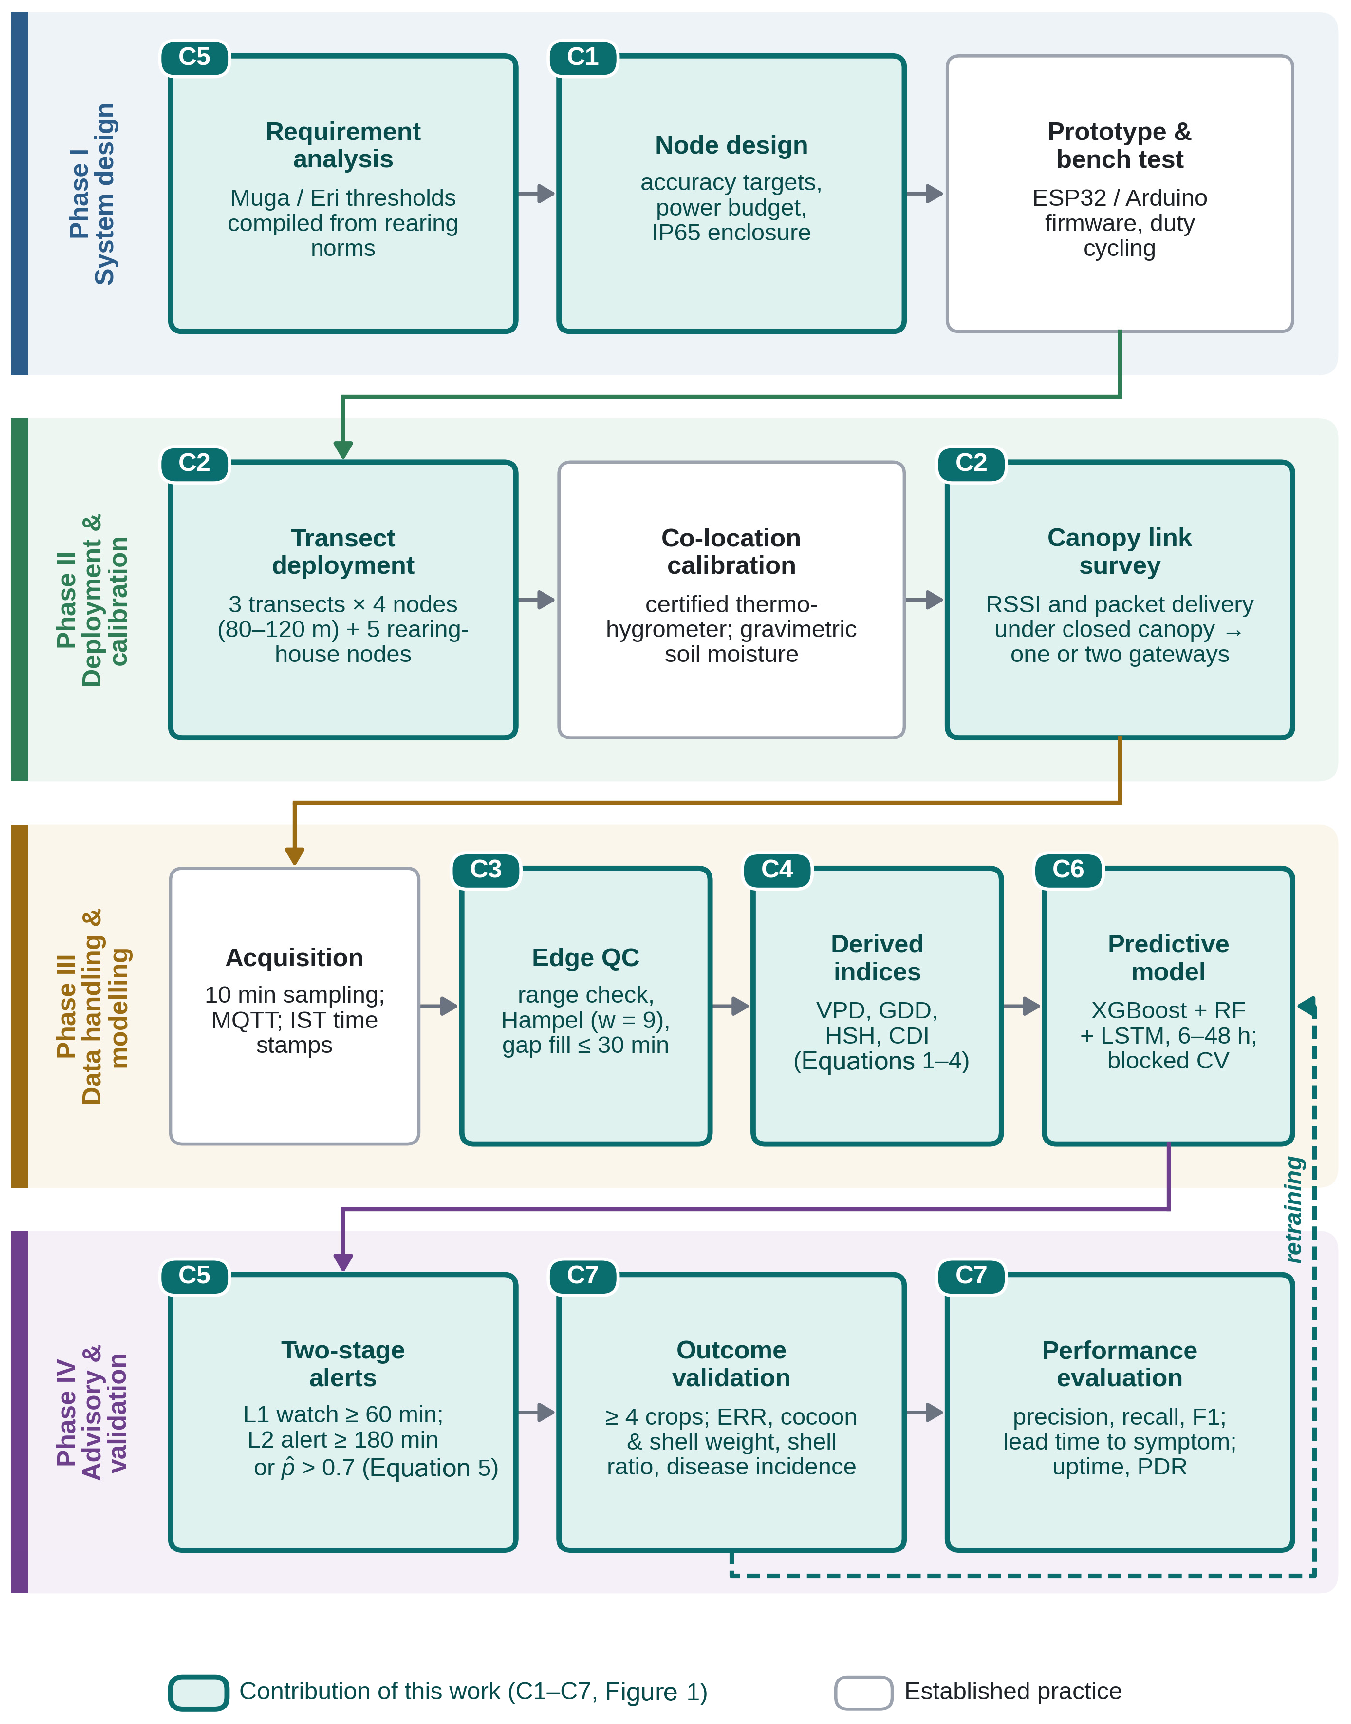
The complete workflow is organised into four sequential phases (Figure 2). Phase I derives measurement requirements from published rearing norms and translates them into node specifications, including accuracy targets, power budget and enclosure rating. Phase II covers field deployment, co-location calibration against reference instruments, and a radio survey to establish achievable link performance under a closed canopy. Phase III defines acquisition, pre-processing, index computation and predictive modelling. Phase IV covers advisory generation, validation against rearing outcomes, and performance evaluation, with a retraining loop that returns validated outcome records to the modelling stage.
Figure 2.
Four-phase methodological workflow, from requirement analysis and node design through field calibration, data handling and predictive modelling, to advisory generation and outcome-based validation. The retraining loop returns validated crop-outcome records to the modelling stage. Solid arrows indicate the sequence of steps and the dashed arrow indicates the retraining loop.
2.4. Sensor Node Configuration
Node composition (Table 1) was determined by three criteria: the parameter must have a documented physiological or epidemiological link to Vanya rearing performance; the sensing element must operate reliably at high ambient humidity; and the total node current draw must be supportable by a small photovoltaic panel under the low-insolation conditions typical of the monsoon months. Digital I2C elements were preferred over analogue elements wherever available, since analogue front ends drift appreciably under prolonged condensation. A low-cost redundant temperature–humidity element is included at each node to permit cross-checking and to flag sensor failure without a field visit.
Table 1.
Sensor node configuration specified for plantation and rearing-house deployment. Accuracy values are manufacturer-stated and require verification by co-location calibration (Section 2.3, Phase II).
2.5. Communication Subsystem
Communication technology was selected per deployment context rather than uniformly (Table 2). Within the rearing house, Wi-Fi is adequate and imposes no additional gateway cost where broadband already exists. In the plantation, Wi-Fi and short-range mesh protocols are unsuitable: the required inter-node spacing of 80–120 m across a multi-hectare block, combined with a dense evergreen canopy, places them outside their practical envelope. LoRa operating in the 865–867 MHz Indian ISM band is therefore specified for plantation nodes. Free-space range figures quoted for LoRa are not achievable under closed Som–Soalu canopy; a conservative planning figure of 300–800 m is adopted, subject to confirmation by the received signal strength survey defined in Phase II. Backhaul from the gateway uses GSM or NB-IoT depending on local operator coverage, with store-and-forward buffering at the gateway during outages.
Table 2.
Comparison of candidate communication technologies against Vanya deployment requirements. Canopy range figures are planning estimates to be confirmed by field link-budget survey.
2.6. Deployment Geometry
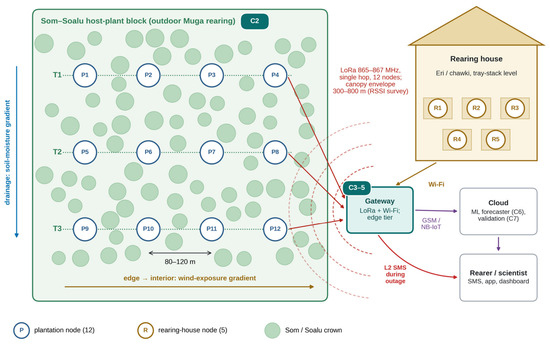
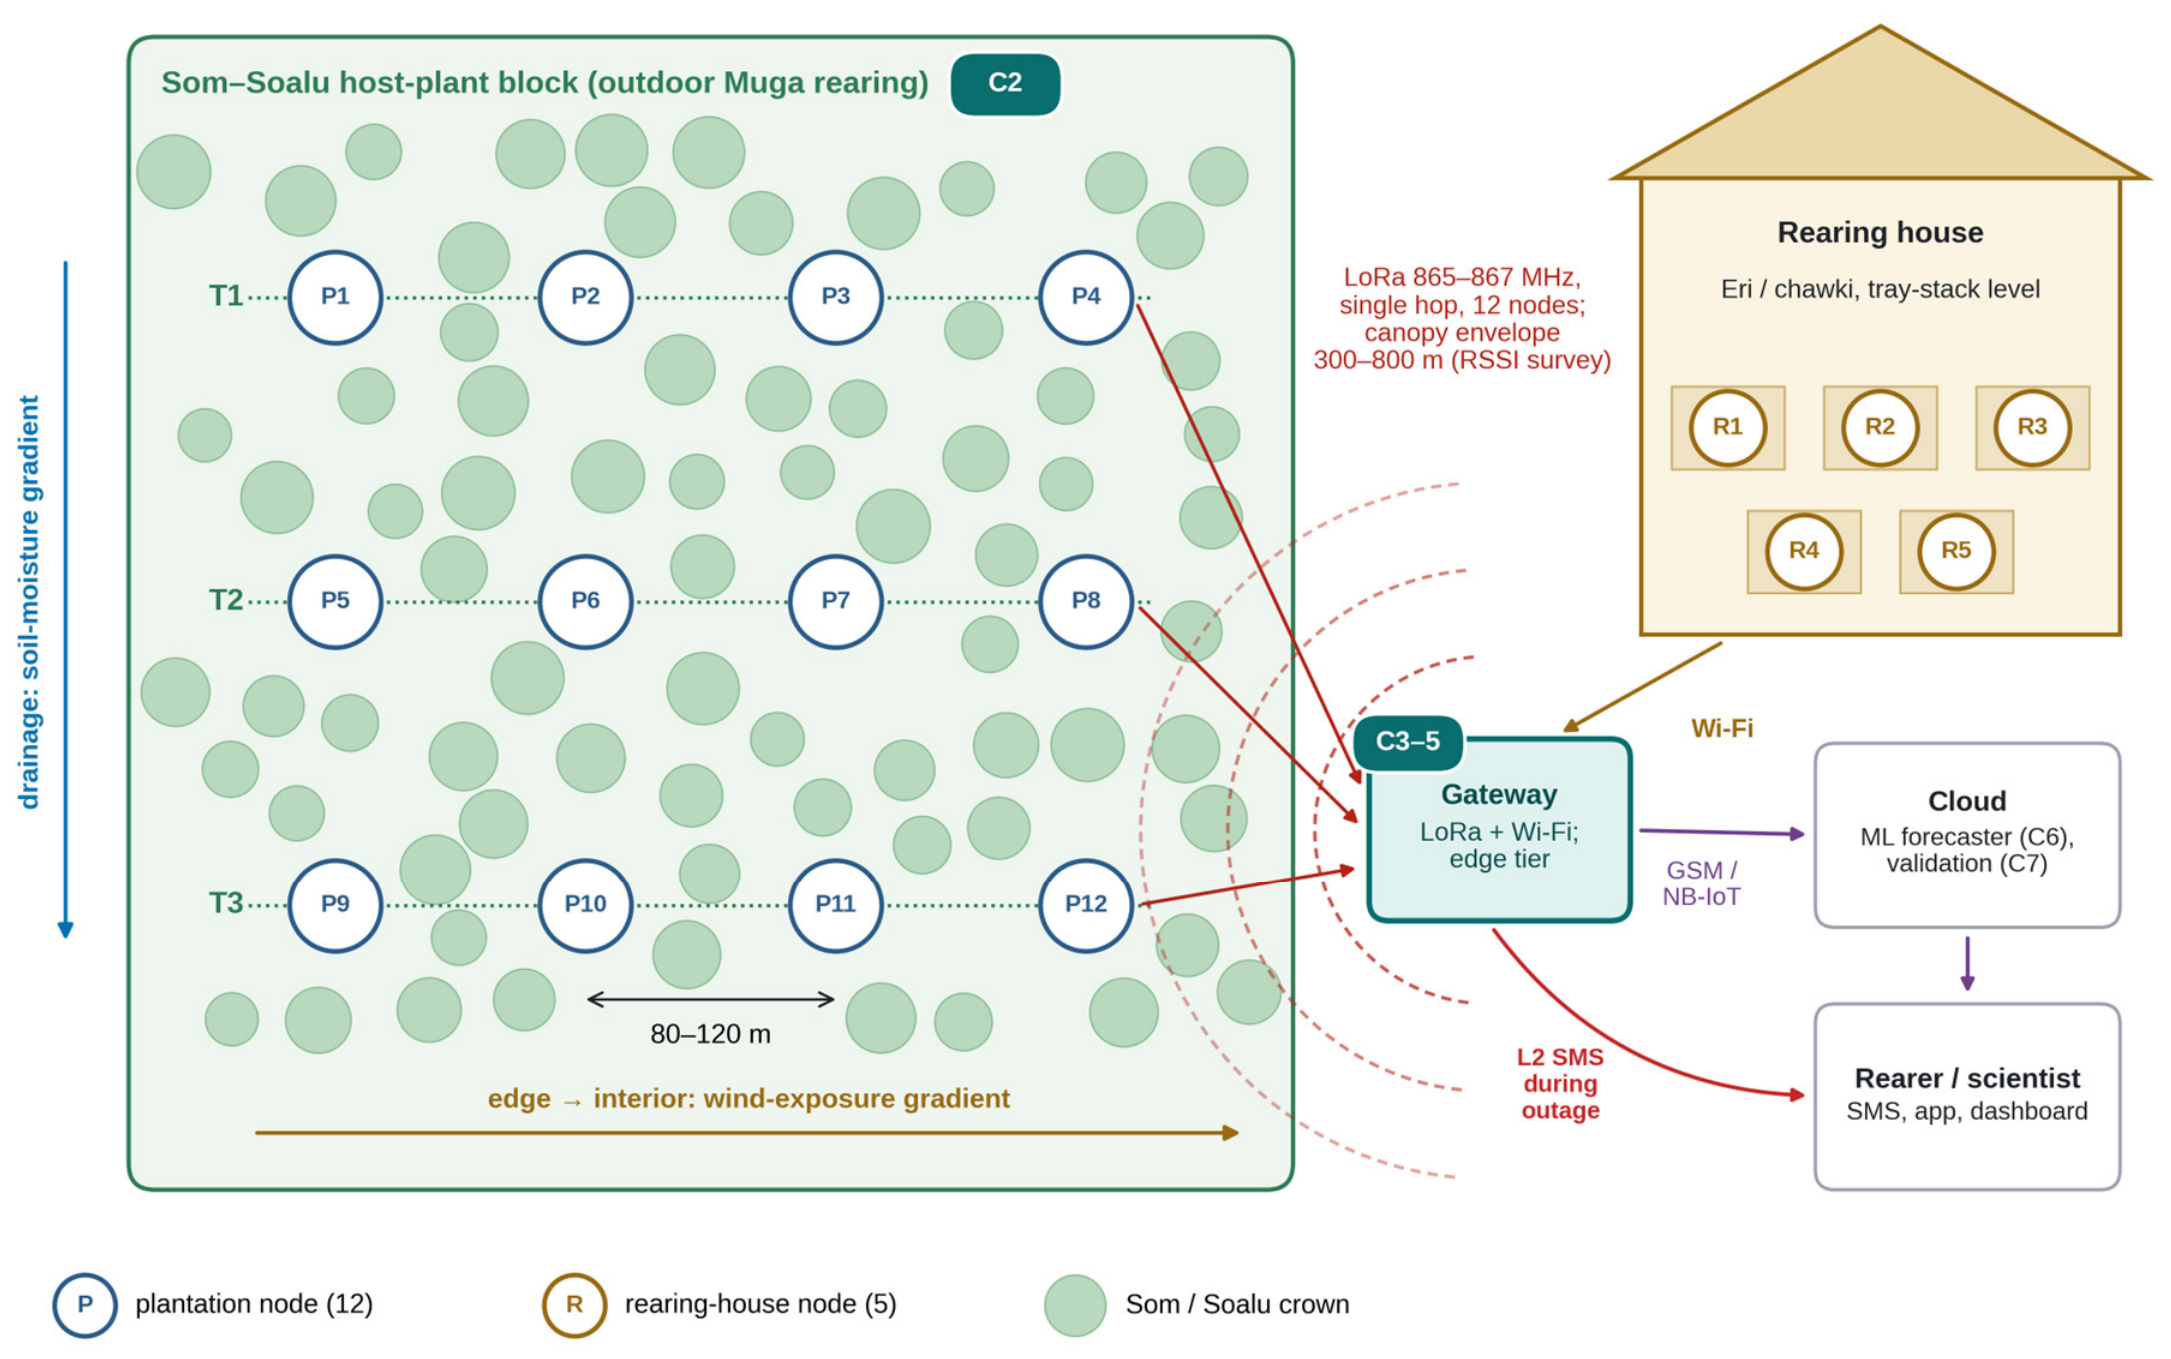
The pilot layout (Figure 3) places twelve nodes in the plantation block along three parallel transects, giving four nodes per transect at 80–120 m spacing, and five nodes within the rearing house at tray-stack level. Transect placement rather than random placement is specified so that horizontal microclimate gradients—particularly the edge-to-interior gradient in wind exposure and the drainage-related gradient in soil moisture—can be resolved. A single LoRa gateway sited between the two environments serves both, and the effective coverage envelope is defined by the field survey rather than by the manufacturer figure.
Figure 3.
Schematic pilot deployment (not to scale) showing transect-based node placement in the Som–Soalu host-plant block, rearing-house nodes, the shared LoRa gateway with its indicative coverage envelope, and cellular backhaul to cloud analytics and rearer-facing advisory delivery. Arrows indicate the direction of data transmission from nodes to the gateway, cloud and rearers; the long arrows beside the block indicate the drainage-related soil-moisture gradient and the edge-to-interior wind-exposure gradient.
2.7. Data Acquisition, Quality Control and Derived Indices
Nodes sample at a 10 min interval and publish over MQTT with timestamps referenced to Indian Standard Time. At the edge tier, each incoming record passes a fixed sequence: a physical range check that rejects values outside sensor specification; a Hampel filter over a rolling window of nine observations to remove isolated spikes without attenuating genuine ramps; linear interpolation of gaps not exceeding 30 min, with longer gaps retained as missing; and aggregation to 30 min means for storage and modelling, retaining 10 min extremes for threshold evaluation.
Four indices are computed from the cleaned series. Vapour pressure deficit is derived from the Tetens formulation, and is retained because it expresses the combined thermal–hydric evaporative load more faithfully than either temperature or humidity alone:
where T is air temperature (°C) and RH is relative humidity (%). Thermal accumulation over the larval period is expressed as growing degree days:
with Tbase provisionally set at 12 °C for Muga and subject to local recalibration against observed instar durations. Acute thermal exposure is quantified as heat-stress hours:
where I(·) is the indicator function and Δt the sampling interval. Finally, a cumulative deviation index integrates the magnitude and duration of departure from the optimum band in both directions:
with Tup and Tlov the upper and lower bounds of the species optimum band. CDI is the primary state variable for advisory escalation because, unlike an instantaneous threshold test, it distinguishes a brief excursion from a sustained physiological load.
VPD = 0.6108 · exp [17.27T/(T + 237.3)] · (1 − RH/100)
GDD = Σ [(Tmax,i + Tmin,i)/2 − Tbase]
HSH = Σ Δt · I(Ti > Tcrit)
CDI = Σ [max(0, Ti − Tup) + max(0, Tlov − Ti)] · Δt
2.8. Species-Specific Threshold Framework
Threshold values (Table 3) were compiled from published rearing norms and extension prescriptions rather than assigned arbitrarily, and the basis of each value is recorded so that thresholds can be revised as local evidence accumulates. Where no published value exists for a derived quantity, the entry is marked as operational and is explicitly a hypothesis to be tested during validation.
Table 3.
Species-specific environmental thresholds adopted in the rule engine. Entries marked operational are working hypotheses defined for this framework and are to be revised against the validation dataset.
2.9. Two-Stage Decision Logic
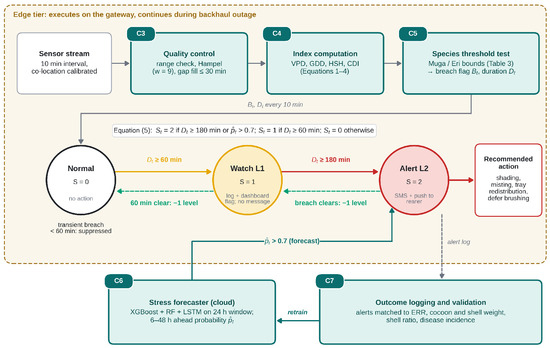
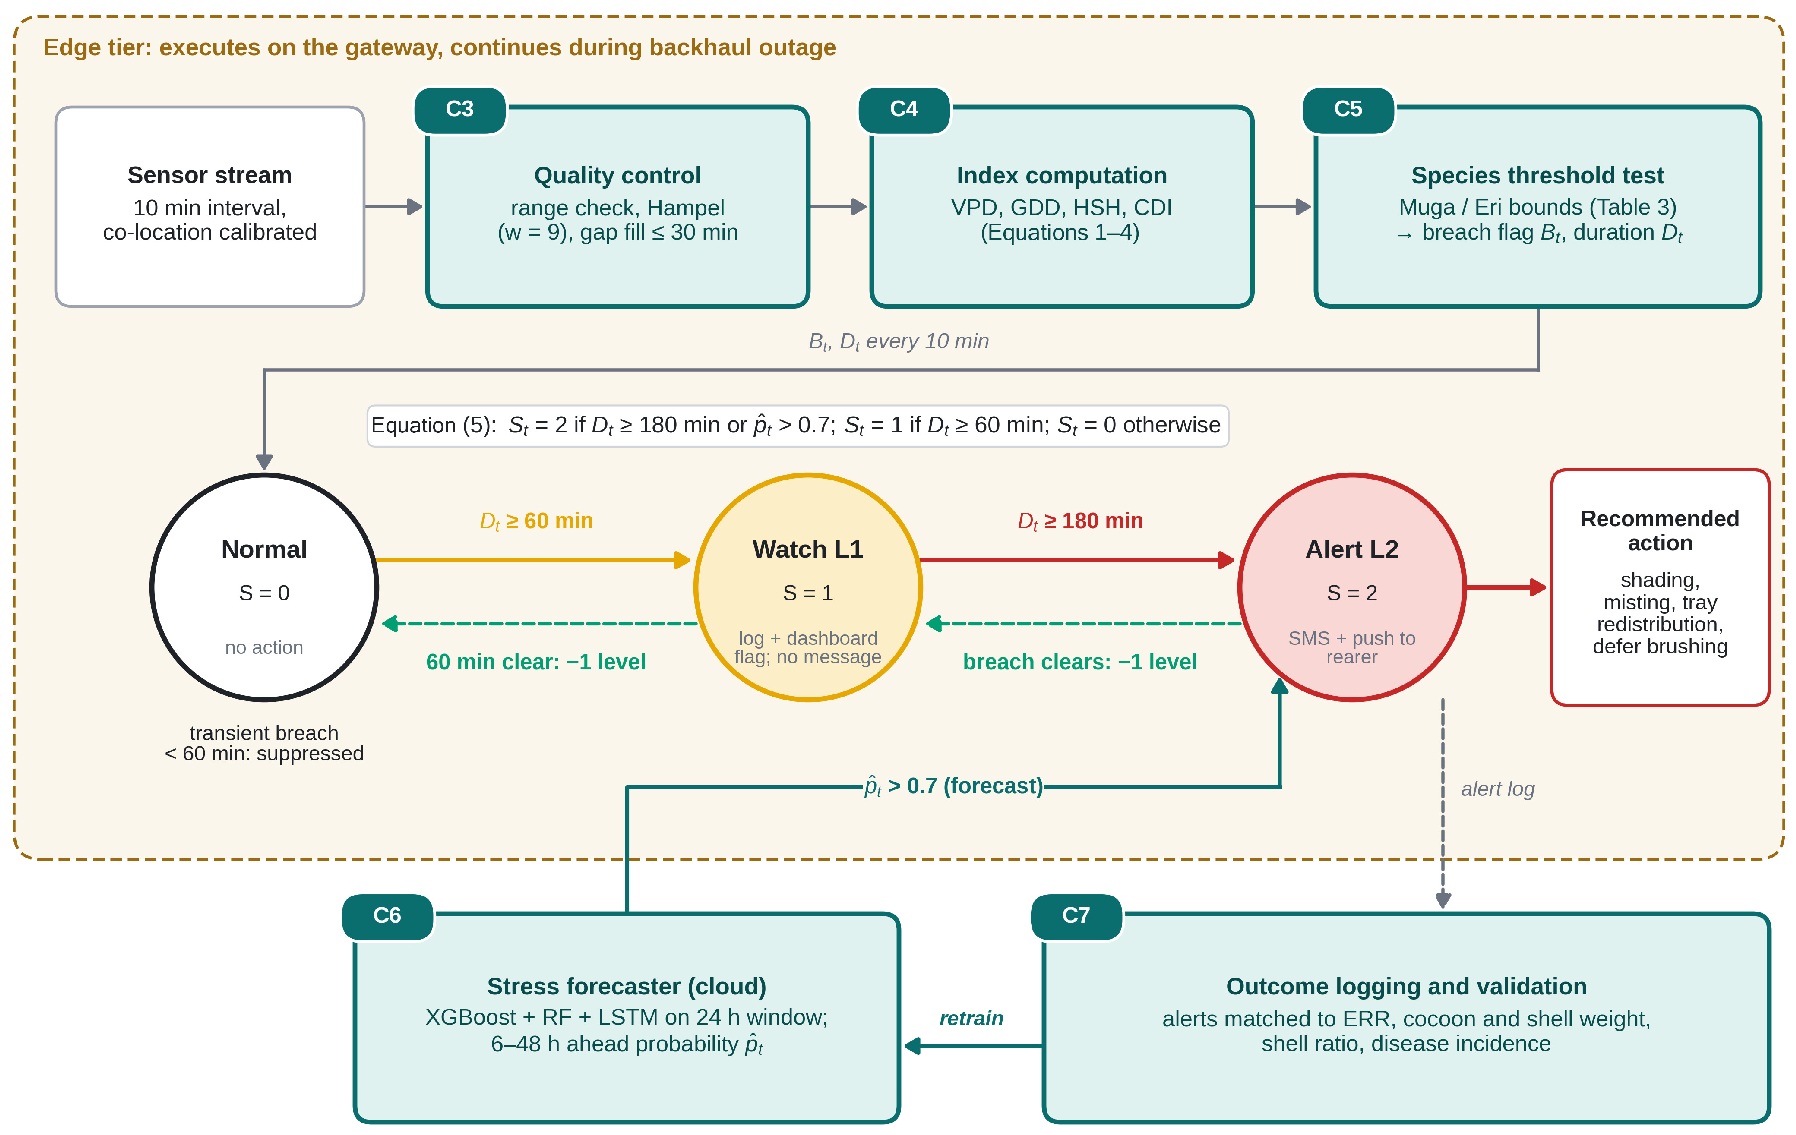
Advisory generation follows a two-stage state machine (Section 3.2) rather than a single threshold test, because a single test applied to 10 min data in an outdoor canopy generates an unusable volume of transient alarms. The system occupies one of three states. The normal state requires no action. A watch state (L1) is entered when a threshold is breached and the breach persists for at least 60 min; L1 is logged and flagged on the dashboard but does not generate an outbound message. An alert state (L2) is entered when the breach persists for at least 180 min, or when the machine-learning module returns a stress probability exceeding 0.7 for the forthcoming interval; L2 triggers SMS and application notification with a specific recommended action. Formally:
where Dt is the elapsed duration of the current breach and the predicted stress probability. Recovery uses a decay rule rather than immediate reset, so that intermittent oscillation across a threshold does not repeatedly re-trigger notification.
2.10. Predictive Modelling
The forecasting module is specified as an ensemble of a gradient-boosted tree classifier (XGBoost) and a random forest operating on engineered features—rolling means, ranges and rates of change of temperature, humidity and VPD over 3, 6, 12 and 24 h windows, together with cumulative GDD and CDI—with a long short-term memory network operating on the raw 24 h sequence. The target is a binary indicator of whether prescribed bounds will be breached within a 6–48 h horizon. Tree ensembles are specified alongside the neural component deliberately: they train adequately on the small datasets available at pilot scale and provide feature-importance output that scientists and extension officers can interrogate, which matters for a system whose recommendations are intended to be acted upon by farmers. Model selection uses blocked time-series cross-validation with whole rearing crops as blocks, avoiding the optimistic bias produced by random splitting of autocorrelated series. The same design consideration—tree ensembles for interpretability on modest sample sizes—has proved effective in related agricultural sensing work by this group on soil moisture retrieval and canopy trait estimation [13,14] and in hyperspectral disease detection [15]. The broader agricultural literature likewise reports that combining engineered spectral or environmental features with tree-based learners yields workable early-detection accuracy at field scale [16].
2.11. Validation Protocol
Validation is specified over a minimum of four consecutive commercial crops covering contrasting seasons. For each crop, alert records are matched to independently recorded rearing outcomes: effective rate of rearing, mature larval weight, single cocoon weight, shell weight, shell ratio and recorded incidence of pebrine, flacherie, grasserie, muscardine and uzi fly infestation. Three quantities are evaluated. First, detection performance is assessed by treating each alert as a prediction of a subsequently observed adverse outcome, reporting precision, recall and F1-score. Second, lead time is measured as the interval between L2 issuance and first field-visible symptom expression, which is the operationally meaningful quantity because it bounds the window available for corrective action. Third, system reliability is measured as node uptime, packet delivery ratio and the fraction of missing observations. Sensor accuracy itself is verified separately by co-location against a certified thermo-hygrometer and by gravimetric determination of soil moisture.
3. Results and Discussion
3.1. Specification Outcomes
The specification exercise produced three design conclusions worth stating explicitly. First, no single communication technology satisfies both deployment contexts; the hybrid LoRa–Wi-Fi–cellular plan of Table 2 is a consequence of the physical separation between an enclosed rearing house and a multi-hectare canopy block, not a preference. Second, the offline rule engine at the edge tier is not an optional refinement. In upper Assam the periods of greatest agronomic risk—monsoon depressions and pre-monsoon thunderstorm sequences—coincide with the periods of least reliable cellular backhaul, so a cloud-dependent alerting design would fail precisely when it is most needed. Third, the persistence requirement in the decision logic is what makes the system usable: without it, 10 min sampling of an outdoor canopy across a threshold boundary generates alarm volumes that rearers rapidly learn to ignore.
3.2. Illustrative System Behaviour
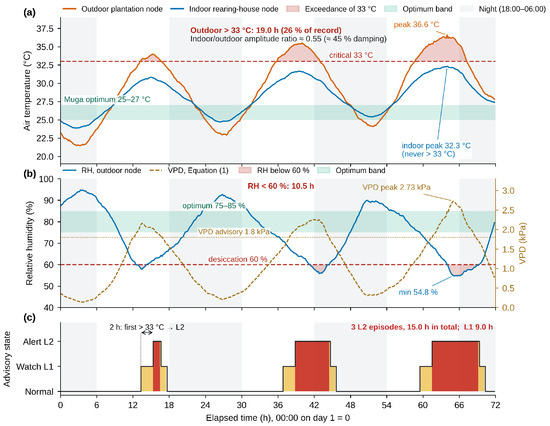
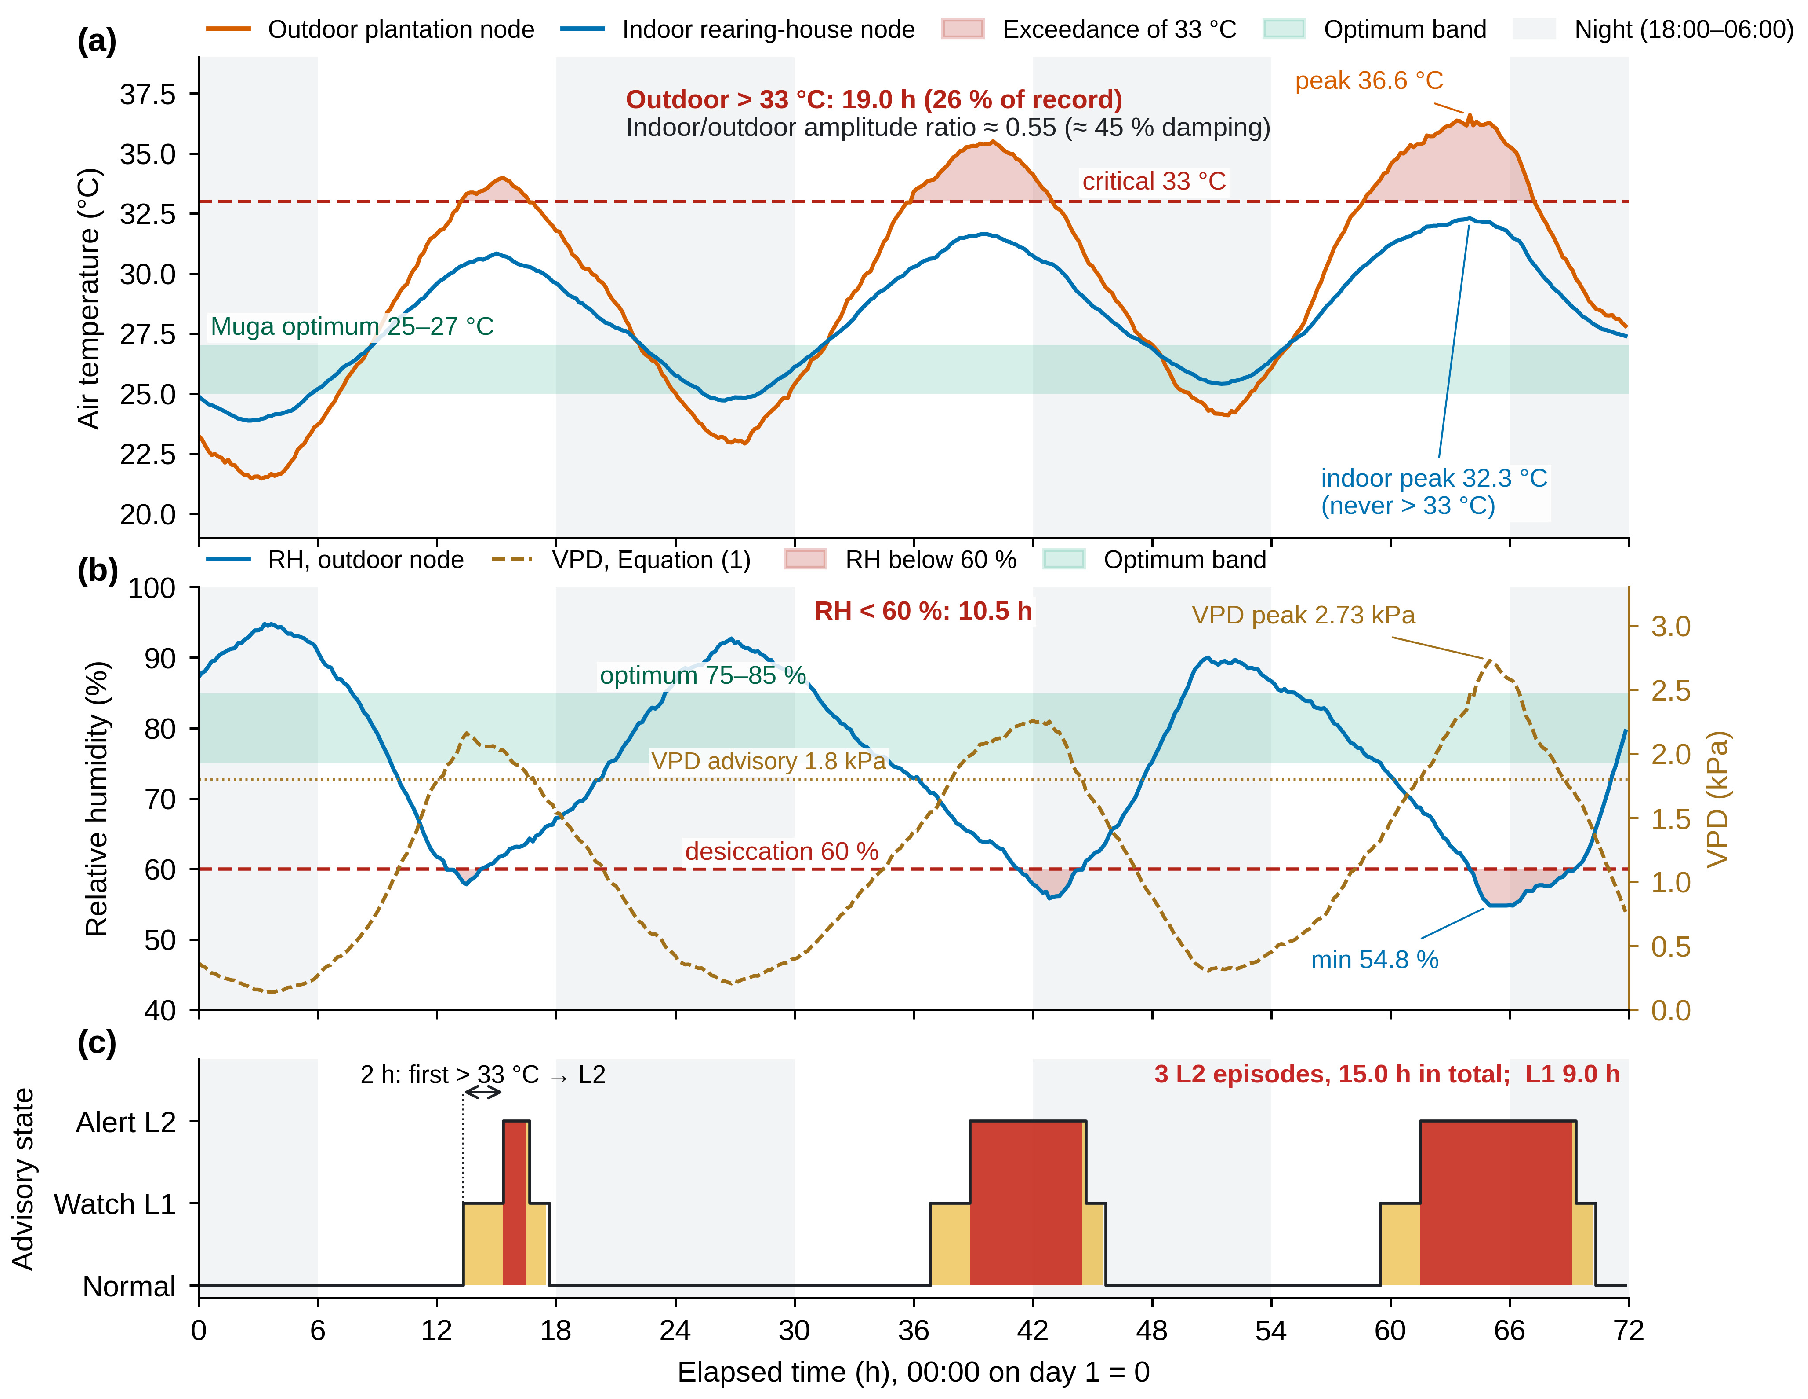
Figure 4 demonstrates the acquisition-to-advisory chain over a synthetic 72 h record. The state machine that generates the advisory states is summarised in Figure 5. The series was generated from a sinusoidal diurnal model with superimposed warming drift and Gaussian measurement noise, and is presented solely to illustrate the behaviour of the indices and the state machine; it is not field data and carries no empirical claim. In this demonstration the outdoor plantation node reached 36.6 °C and exceeded the 33 °C critical threshold for a cumulative 19.0 h, that is 26% of the record, whereas the co-located indoor node peaked at 32.3 °C and never breached the threshold; the indoor environment damped the diurnal amplitude by roughly 45%. Relative humidity fell to 54.8% and remained below the 60% desiccation threshold for 10.5 h, and VPD peaked at 2.73 kPa. The state machine produced three discrete L2 episodes totalling 15.0 h, preceded by 9.0 h in the L1 watch state, and escalated from L1 to L2 two hours after the first threshold breach.
Figure 4.
Illustrative 72 h record demonstrating the monitoring chain: (a) outdoor and indoor air temperature against the Muga optimum band and the 33 °C critical threshold, with exceedance shaded; (b) relative humidity with the derived vapour pressure deficit on the secondary axis; (c) resulting advisory state from the two-stage persistence logic (yellow, L1 watch; red, L2 alert). Data are synthetic and generated for demonstration of the logic only.
Figure 5.
Two-stage decision logic. Quality-controlled measurements feed index computation and threshold testing; persistence gates separate a logged watch state from an outbound alert, with the machine-learning forecast providing an independent escalation path. Validated crop outcomes return to the model as training data. Solid arrows indicate data flow and escalation; dashed green arrows indicate step-down to a lower state when a breach clears, and the dashed grey arrow indicates alert logging.
Two features of this behaviour are practically relevant. The contrast between the two nodes quantifies the buffering effect of an enclosed rearing structure and, by implication, the magnitude of the stress that outdoor Muga larvae absorb unmitigated—the same 72 h that produced no threshold breach indoors produced nearly a full day of cumulative exceedance in the canopy. This is the physical basis for the observation that Muga rearing is far more exposed to climatic variability than Eri rearing, and it is precisely what discrete visual inspection cannot capture. The two-hour L1-to-L2 escalation interval is also the operationally useful quantity: it represents the window in which shading, misting, tray redistribution or a decision to defer brushing can still alter the outcome.
3.3. Power and Link Considerations
The node energy budget is the binding constraint on the sampling design. With the specified 5 W panel and 5200 mAh cell, a duty-cycled node transmitting a compact payload every 10 min operates within budget through the monsoon months provided the radio remains in deep sleep between transmissions and the analogue front end is power-gated. Increasing sampling frequency beyond this interval yields limited additional information for the indices of Section 2.7, since the physiologically relevant integration timescale is hours rather than minutes, but it degrades autonomy substantially. Link performance is the corresponding uncertainty: attenuation through a closed evergreen canopy is highly site-specific, and the Phase II received-signal-strength survey is therefore not a formality but the step that determines whether the specified twelve-node layout requires one gateway or two.
3.4. Indicative Cost Structure
Table 4 gives an indicative capital structure at pilot scale. Figures are planning estimates at 2025–26 Indian component prices and exclude labour, and are presented to establish order of magnitude rather than a procurement basis. At these values a twelve-node plantation installation with one gateway falls in the range of one to one-and-a-half lakh rupees, which is material for an individual smallholder but readily supportable at the level of a cluster, a farmer producer organisation or a departmental demonstration unit—which is the deployment model the framework anticipates.
Table 4.
Indicative capital and recurring cost structure at pilot scale. Values are planning estimates only and are not procurement quotations.
3.5. Comparison with Conventional Monitoring
Table 5 sets the specified system against current practice. The substantive gains are not in measurement accuracy—a trained observer with a calibrated thermo-hygrometer is accurate—but in temporal density, continuity through the night and adverse weather, retention of a machine-readable record, and the possibility of anticipatory rather than reactive action. The retained record is arguably the most durable benefit: it converts each rearing crop into a dataset that can be regressed against outcomes, which is the precondition for evidence-based revision of the very thresholds in Table 3.
Table 5.
Comparison of conventional visual inspection with the specified IoT monitoring system across operationally relevant attributes.
3.6. Integration with Geospatial Layers
Point sensing and area-based remote sensing are complementary rather than alternative. Node records provide temporally dense truth at a handful of locations; satellite and UAV products provide spatially continuous but temporally sparse coverage. The natural integration is to use node time series as calibration and validation references for gridded soil moisture and canopy-condition retrievals over the wider plantation landscape, extending the effective footprint of a small node network well beyond the transects themselves. Cloud-based retrieval workflows of the kind previously implemented for Sentinel-1 soil moisture and Sentinel-2 canopy chlorophyll estimation [13,14] provide a direct route to this integration, and species distribution outputs for Muga and its host [6] supply the landscape-scale context within which node siting can be prioritised.
3.7. Limitations
Four limitations are acknowledged. First, the quantitative behaviour reported in Section 3.2 is derived from a synthetic series and demonstrates logic, not efficacy; no claim of field performance is made in advance of the validation described in Section 2.11. Second, several threshold entries in Table 3, particularly the VPD advisory and the persistence intervals, are operational hypotheses without direct experimental support in Vanya systems and may require substantial revision. Third, the semiconductor gas sensor specified for the rearing house provides a trend indicator rather than a calibrated concentration, and should not be interpreted quantitatively. Fourth, and most consequentially for adoption, environmental sensing detects the conditions that predispose to disease; it does not detect pebrine, flacherie or uzi fly infestation directly. Pathogen-specific confirmation still requires microscopy or molecular assay, and the framework should be understood as narrowing the window between stress onset and inspection rather than replacing inspection. Extending the perception tier with in-tray imaging and lightweight vision models, as reported for mulberry systems [10,11], is the logical next increment.
4. Conclusions
A four-tier IoT framework has been specified for continuous environmental monitoring of Muga and Eri rearing systems in Northeast India, addressing constraints—absent grid power, canopy radio attenuation, monsoonal exposure and dispersed holdings—that distinguish Vanya deployment from the indoor mulberry systems that dominate the existing literature. The specification comprises a defined sensor node configuration, a context-selective communication plan combining LoRa in the plantation with Wi-Fi indoors and cellular backhaul, an edge-resident quality-control and rule-evaluation chain that continues to function without connectivity, four derived agrometeorological indices, and a two-stage persistence-based decision logic anchored to species-specific thresholds compiled from published rearing norms. A synthetic demonstration confirms that the logic discriminates sustained physiological load from transient excursion and escalates within a two-hour window.
The framework’s value is contingent on field validation, and the protocol for that validation—four consecutive crops, alerts matched to effective rate of rearing, cocoon and shell parameters and disease incidence, with precision, recall, lead time and uptime reported—is specified here as an integral part of the contribution rather than deferred. Subject to that validation, the approach offers a route to reducing labour dependency, improving consistency of cocoon quality and, most importantly, converting Vanya rearing from a practice managed by discrete observation into one supported by a continuous, retained and analysable environmental record.
Author Contributions
Conceptualisation, S.R. and K.N.; methodology, S.R., O.P.P. and V.N.; system design, S.R.; validation protocol, S.R., H.R., V.H.T., K.S. and A.K.; data curation and visualisation, S.R., S.A. and G.J.A.; writing—original draft preparation, S.R.; writing—review and editing, all authors; supervision, K.N. All authors have read and agreed to the published version of the manuscript.
Funding
This research received no external funding.
Institutional Review Board Statement
Not applicable.
Informed Consent Statement
Not applicable.
Data Availability Statement
The original contributions presented in this study are included in the article. Further inquiries can be directed to the corresponding author.
Conflicts of Interest
The authors declare no conflict of interest.
References
- India Brand Equity Foundation. Indian Silk Industry. 2025. Available online: https://www.ibef.org/exports/indian-silk-industry (accessed on 1 November 2026).
- Jigyasu, D.K.; Patidar, O.P.; Kumar, A.; Shabnam, A.A. Muga silk insect (Antheraea assamensis). In Commercial Insects; CRC Press: Boca Raton, FL, USA, 2023; pp. 126–145. [Google Scholar]
- Ghosh, S. Assam’s Muga Silkworm Battles Climate Change. Mongabay-India. 23 February 2018. Available online: https://india.mongabay.com/2018/02/assams-muga-silkworm-battles-climate-change/ (accessed on 1 November 2026).
- Majumdar, M.; Guha, L.; Kumar, V.; Hridya, H.; Bhatia, N.K. Exploring the impact of cooler zones to enhance seed support for muga (Antheraea assamensis Helfer) cultivation. J. Sci. Res. Rep. 2026, 32, 201–216. [Google Scholar] [CrossRef] [Scilit]
- Chanotra, S.; Ravi Kumara, R.; Saicharan, D.; Guha, L.M.; Hemachandran, H. Variation in season-wise performance of muga silkworm (Antheraea assamensis Helfer) aimed to climate change trends: A descriptive study. Int. J. Zool. Appl. Biosci. 2024, 9, 78–83. [Google Scholar] [CrossRef] [Scilit]
- Sarma, K.; Chetry, V.; Bawri, A.; Borah, K.J.; Khanikor, B.; Kalita, T.; Mech, B.; Kakati Saikia, M.; Das, M. Ensemble distribution model of Muga Silkworm (Antheraea assamensis) and its primary host plant Soalu (Litsea monopetala) in defined climate space. Sci. Rep. 2025, 15, 22080. [Google Scholar] [CrossRef] [Scilit] [PubMed]
- Sujatha, G.; Kumar, G.A.; Teja, K.; Devi, D.L.; Rupali, J.; Gautam, S.K. A comprehensive review of the effect and mitigation of climate change on sericulture. Int. J. Environ. Clim. Change 2024, 14, 776–788. [Google Scholar] [CrossRef] [Scilit]
- Central Silk Board. Rearing of Eri Silkworm. Sericulture Information Linkages and Knowledge System (SILKS), Ministry of Textiles, Government of India. 2024. Available online: https://silks.csb.gov.in/golaghat/rearing-of-eri-silkworm/ (accessed on 1 November 2026).
- Vaidya, S.; Yadav, U.; Bhouraskar, J. Effects of temperature and relative humidity on rearing performances of eri silkworm (Philosamia ricini). Environ. Conserv. J. 2014, 15, 189–196. [Google Scholar] [CrossRef] [Scilit]
- Nivaashini, M.; Soundariya, R.S.; Dinesh Kumar, A. Silkworm growth monitoring smart sericulture system based on Internet of Things (IoT) and image processing. Int. J. Comput. Appl. 2018, 180, 29–33. [Google Scholar] [CrossRef] [Scilit]
- Harish Reddy, C.; Bhat, M.R.; Sandhya, N.; Kankanawadi, N.; Praveen Kumar Gowda, N.M. Artificial intelligence in the new era of sericulture. J. Sci. Res. Rep. 2025, 31, 788–803. [Google Scholar] [CrossRef] [Scilit]
- Singh, R.K.; Rahmani, M.H.; Weyn, M.; Berkvens, R. Joint communication and sensing: A proof of concept and datasets for greenhouse monitoring using LoRaWAN. Sensors 2022, 22, 1326. [Google Scholar] [CrossRef] [Scilit] [PubMed]
- Kondraju, T.T.; Ramalingam, S.; Rejith, R.G.; Bhandari, A.; Sahoo, R.N.; Ranjan, R. Soil moisture mapping using Sentinel-1 SAR data and cloud-based regression modeling on Google Earth Engine. Environ. Earth Sci. Proc. 2025, 36, 9. [Google Scholar] [CrossRef] [Scilit]
- Kondraju, T.T.; Sahoo, R.N.; Rejith, R.G.; Bhandari, A.; Ranjan, R.; Reddy, D.V.S.C.; Ramalingam, S. Retrieving canopy chlorophyll content from Sentinel-2 imagery using Google Earth Engine. Biol. Life Sci. Forum 2025, 54, 13. [Google Scholar] [CrossRef] [Scilit]
- Selvaprakash, R.; Sahoo, R.N.; Kumar, A.; Ranjan, R.; Viswanathan, C. Early detection of rice blast disease using hyperspectral remote sensing. Plant Sci. Today 2026, 13, 1–10. [Google Scholar] [CrossRef] [Scilit]
- Zhao, D.; Cao, Y.; Li, J.; Cao, Q.; Li, J.; Guo, F.; Feng, S.; Xu, T. Early detection of rice leaf blast disease using unmanned aerial vehicle remote sensing: A novel approach integrating a new spectral vegetation index and machine learning. Agronomy 2024, 14, 602. [Google Scholar] [CrossRef] [Scilit]

Disclaimer/Publisher’s Note: The statements, opinions and data contained in all publications are solely those of the individual author(s) and contributor(s) and not of MDPI and/or the editor(s). MDPI and/or the editor(s) disclaim responsibility for any injury to people or property resulting from any ideas, methods, instructions or products referred to in the content. |
© 2026 by the authors. Licensee MDPI, Basel, Switzerland. This article is an open access article distributed under the terms and conditions of the Creative Commons Attribution (CC BY) license.