


Abstract
Zakynthos is a small coastal city where environmental conditions, compact urban development, and strong seasonal tourism pressures influence everyday living conditions. This study examines how these factors shape urban quality of life (QoL) across the city using a GIS-based multicriteria framework. A literature review indexed in JSTOR, PubMed, and Scopus, completed in early 2026, guided indicator selection. Nine criteria—estimated population density, the Normalized Difference Vegetation Index (NDVI), public recreation, accessibility, Land Surface Temperature (LST), proximity to forests and the sea, road-related acoustic suitability, imperviousness, and nighttime lighting—were standardized to a 0–100 scale and combined using Analytic Hierarchy Process (AHP) weights. The analysis brings together satellite-derived environmental variables and detailed local information on buildings, recreational spaces, services, and roads on a common 10 m grid. This level of detail is particularly useful in a small Mediterranean city, a setting that remains underrepresented in GIS–AHP studies of QoL. Moderate QoL covered 30.86% of the study area, while the low and very low classes accounted for 41.24% together. Only 3.12% was classified as very high. Higher scores were primarily observed along the northern coast and in vegetated regions. In contrast, central and southwestern neighborhoods typically scored lower due to heat, impervious surfaces, traffic noise, and fewer recreational options. However, some central areas still maintain good access to services. The maps illustrate the local trade-offs between accessibility and environmental quality, providing a detailed baseline to identify zones where targeted planning actions may be necessary.
1. Introduction
Income and housing explain only part of how people experience a city. Much of daily life is shaped closer to home—by the streets and public spaces residents use, the services they can access, how safely and easily they move around, and whether their neighborhood supports health and social contact. In urban planning, these conditions are usually discussed as parts of QoL, together with people’s own sense of well-being. For planning purposes, environmental quality and QoL cannot be treated as unrelated concerns, since both are integral to the everyday urban experience [1]. QoL, however, has no fixed definition, and no single set of indicators fits every city. What is measured depends on the scale of the analysis, the population under consideration, local urban conditions, and the purpose of the study [2]. Research has approached the subject in several ways. Some studies use economic data, others ask residents to evaluate their own circumstances, while others rely on measurable characteristics of the urban environment [3]. Each approach reveals a different facet of urban life. Composite livability indices offer one way to bring these dimensions together in measures that can support urban planning and sustainability initiatives [4].
A common distinction is drawn between subjective and objective QoL [1,2,3]. Subjective assessments capture how residents evaluate their living conditions, including satisfaction, happiness, perceived safety, and attachment to place. They reflect experiences that cannot be adequately represented by spatial or statistical data alone. However, their results may also be influenced by survey design, individual expectations, prior experiences, and respondents’ social circumstances [2,3]. Objective assessments are based on measurable characteristics of the urban environment, including population and building density, green-space provision, access to services, land-surface temperature, noise exposure, and land-cover conditions [1,4].
Subjective and objective measures should be considered together, but neither can serve as a direct substitute for the other. Residents with different needs or expectations may evaluate the same neighborhood differently. At the same time, a favorable personal assessment does not necessarily indicate that local services or environmental conditions are adequate. The analysis presented here is limited to variables that can be measured and mapped. It therefore describes the environmental and infrastructural setting of everyday urban life rather than residents’ full subjective experience. Urban inequalities are often easier to identify at the neighborhood scale than at the citywide level. A municipal average may seem satisfactory even when specific areas face poor environmental conditions or limited access to services. Studies in the Athens metropolitan region identified spatial clusters of both favorable and unfavorable QoL conditions, showing that broad administrative averages can mask local concentrations of advantage and disadvantage [5,6]. Grid-based assessments have also documented substantial differences between locations just a short distance apart [7]. This level of spatial detail is useful for planning because it helps pinpoint where environmental improvements, better accessibility, or additional public spaces are most needed.
Geographic Information Systems (GIS) provide an appropriate framework for this type of assessment because many QoL variables are inherently spatial. These variables relate to services, travel distances, population concentrations, land-cover patterns, environmental exposure, and interactions among urban functions. GIS-based multicriteria evaluation allows indicators measured in different units to be standardized, weighted, combined, and mapped. The resulting maps also make the analysis easier to interpret by showing how individual criteria contribute and how weighting decisions affect outcomes [8]. Previous studies have integrated GIS, remote sensing, administrative data, points of interest, and other geospatial datasets to assess urban livability and environmental quality [9,10,11]. Their findings indicate that the resulting spatial pattern can vary with the selected indicators, weighting procedure, multicriteria method, and scale of analysis [12]. Therefore, a QoL framework developed for one city cannot be directly transferred to another without adjustment. The model should reflect local climatic conditions, topography, urban form, settlement structure, and planning priorities.
The need for local adaptation is evident in earlier applications. Research in India combined social, economic, housing, infrastructure, and environmental indicators and identified spatial inequalities that could not be explained by economic conditions alone [13]. In Kandy, Sri Lanka, vegetation, topography, accessibility, and urban development patterns were key factors in the final assessment [14]. In Buraidah, Saudi Arabia, GIS-based accessibility and location-allocation analyses were used to identify underserved neighborhoods with respect to public facilities [15]. These examples share several broad QoL dimensions, but the importance of individual variables varies considerably across cities.
Accessibility also involves more than the mere presence of a facility. Actual access depends on distance, travel time or effort, service capacity, population demand, frequency of use, and the geographical extent of the service area. An unequal distribution of facilities is not necessarily inequitable because different services operate at different spatial scales and have different acceptable travel distances [16]. Measured service quality may also differ from residents’ satisfaction with that service [17]. Facility availability, proximity, practical accessibility, and perceived adequacy should therefore be treated as related but distinct concepts. Before individual criteria can be combined into a composite QoL index, they must be made comparable. Their direction needs to be aligned, their values converted to a common scale, and their relative importance defined. In the present study, the weights were estimated using the Analytic Hierarchy Process (AHP), which uses pairwise comparisons and includes a consistency check for the judgments involved [18]. These weights should not be regarded as permanent characteristics of Zakynthos. They reflect the priorities adopted for this particular assessment and may change when different planning objectives or decision perspectives are considered.
Remote sensing provided several environmental variables used in the analysis. Vegetation indices mapped the extent and distribution of green cover, while land-surface temperature identified the warmer parts of the urban area. Impervious-surface data provided a separate indication of soil sealing and the intensity of built development. Examining vegetation and thermal conditions together can reveal some of the environmental effects of urban expansion [19]. When environmental variables are considered alongside accessibility, population density, traffic-related noise, and urban activity, clear spatial trade-offs often emerge. Central neighborhoods may offer better access to services but also face higher densities, greater heat exposure, more noise, and a larger share of sealed surfaces. Peripheral, coastal, or more vegetated areas may provide better environmental conditions while remaining less well connected to everyday services. Proximity to the coast has also been linked to health and well-being benefits, though these effects depend on actual accessibility and the condition of the surrounding environment [20]. Mediterranean landscapes are often characterized by vegetation mosaics shaped over time by climate, substrate, fire, grazing, and land use [21].
In small Mediterranean coastal towns, such contrasts often occur within a relatively small area. Commercial, administrative, cultural, and transportation activities usually cluster around the urban center and the waterfront. Just a short distance away, the coast and nearby vegetation can create markedly different environmental conditions. During the tourist season, the same streets must accommodate much higher traffic volumes and parking demand. Infrastructure is used more intensively, and waste production, evening activity, and noise levels also increase. Zakynthos exhibits many of these characteristics. Its port and historic commercial center form the main concentration of urban activity, while denser residential development extends mainly toward the southern and southwestern parts of the city. Areas with more vegetation are primarily located toward the north and west. Access to urban services therefore does not always coincide with favorable environmental conditions. Against this background, the present study develops a reproducible GIS-based multicriteria model to map objective urban QoL in Zakynthos and identify the main spatial inequalities within the city.
Much of the earlier GIS literature on QoL has worked at the metropolitan or regional scale, often through comparisons among administrative units. Other studies have focused on a limited range of environmental or accessibility variables [7,8,9,10,11,12,13,14,15,22,23,24]. This study took a different route. In Zakynthos, relevant conditions can change within only a few streets, so a city-wide ranking would conceal much of the local variation. We combined four satellite-derived measures—vegetation, surface temperature, imperviousness, and nighttime radiance—with locally mapped buildings, recreational facilities, services, and road-related acoustic suitability. All layers were placed on the same 10 m grid. The purpose was not to create an index for universal use, but to examine a small coastal city with strong seasonal tourism pressures at the scale at which local interventions are actually planned. The maps show where good access to services is accompanied by environmental pressure and where proximity to natural areas changes this balance. In this way, the study offers a reproducible point of reference for small Mediterranean municipalities, which remain rarely examined in GIS–AHP QoL research.
2. Materials and Methods
2.1. Study Area and Analytical Design
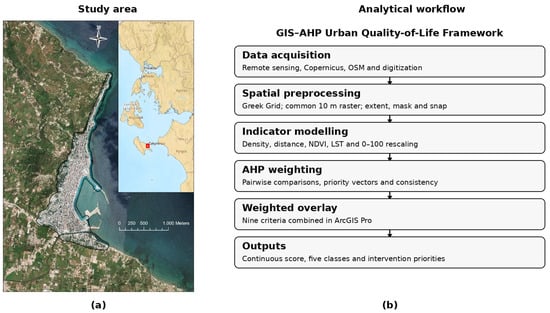
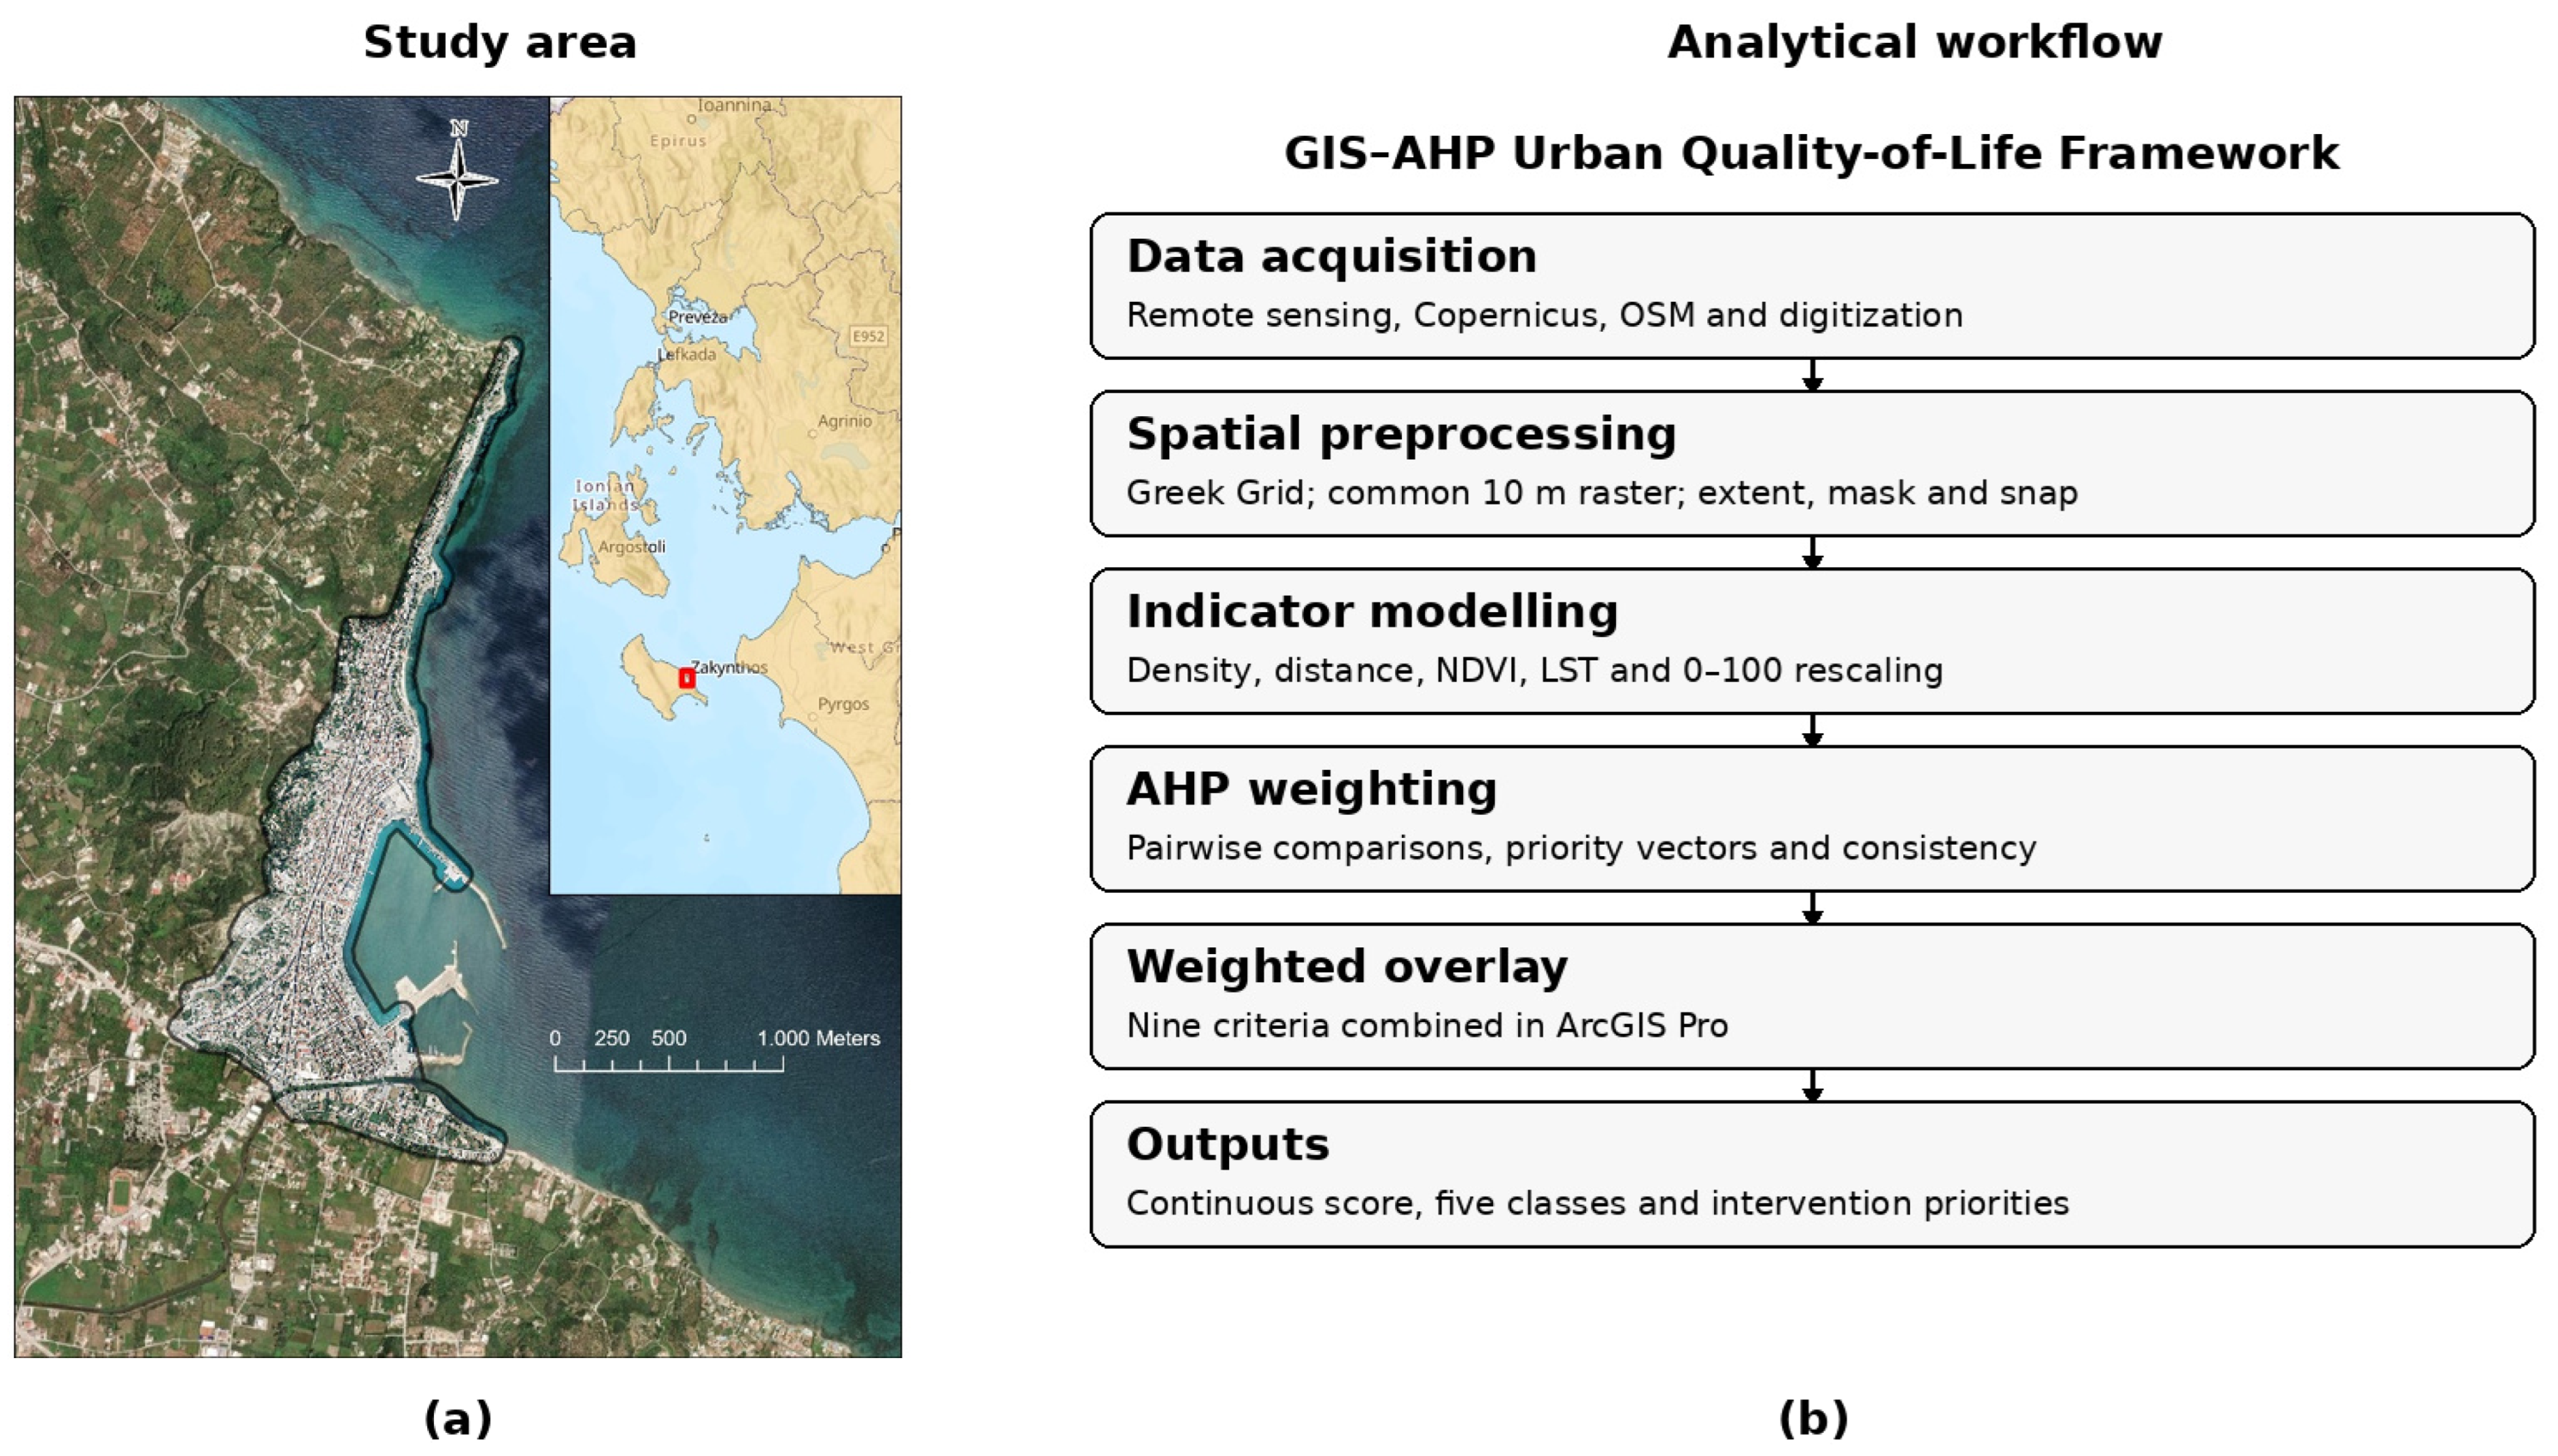
The study covers 168.24 ha within Zakynthos City, the island’s administrative, commercial, and maritime center. The urban area lies between the Ionian Sea and the Bohali–Strani uplands. Development is unevenly distributed. Most housing, commercial activity, and public services are concentrated in the central and southern districts, whereas the northern and western margins are more vegetated. Figure 1 summarizes the analytical process. After data collection and preprocessing, the individual indicators were calculated and converted to a 0–100 scale. AHP weights were then applied via weighted overlay, and the resulting QoL surface was classified. The input data combined satellite products with locally digitized spatial information. The building-point inventory used to calculate estimated population density was digitized from the 2007–2009 high-resolution color orthophotos provided by the Hellenic Cadastre. Most of the spatial analysis was carried out in ArcGIS Pro 3.5 (Esri, Redlands, CA, USA). Google Earth Engine (Google, Mountain View, CA, USA; https://earthengine.google.com/ accessed on 1 November 2026) was used specifically to process Sentinel-2, Landsat 8, and VIIRS data. Before the layers were combined, they were projected to the Greek Grid coordinate reference system (EPSG:2100), clipped to the study-area boundary, aligned to the same snap raster, and processed at a spatial resolution of 10 m.
Figure 1.
(a) Location of the study area in Zakynthos; (b) GIS–AHP analytical workflow.
2.2. Indicators, Standardization, and Weighting
The original layers could not be compared directly. Estimated population density, NDVI, surface temperature, and distance from a service, for example, describe different aspects of the city and use different units. We therefore recoded the cell values from 0 to 100. In every layer, 100 marked the condition considered most favorable for QoL. The recoding method depended on the indicator. A linear transformation was used for relationships expected to change steadily. Distances from services or natural features followed either a power or a logistic curve, with scores falling as distance grew. Pressure variables were scored in the opposite direction, so larger original values received lower scores. We manually placed a point on every building identified in the high-resolution imagery and linked the resulting building-point layer to population estimates. Recreation areas and urban points of interest were digitized locally, as were the coastline and forest boundaries. NDVI was calculated from Sentinel-2 imagery; Landsat 8 supplied the thermal layer. The road network was taken from OpenStreetMap for 2025. For the last two inputs, we used Copernicus Imperviousness Density for 2021 and the VIIRS annual radiance composite for 2024. Not every criterion was represented by a single component. Where several subcriteria were involved, we compared them in pairs using the Analytic Hierarchy Process (AHP). These comparisons provided the relative subcriterion weights. We also calculated a consistency ratio (CR) for each matrix to check the consistency of the judgments.
2.3. Environmental and Service Criteria
The estimated population density was calculated based on a building-point inventory derived from high-resolution color orthophotos provided by the Hellenic Cadastre. Each residential building was represented by a single point, while public buildings were excluded. To estimate occupancy, buildings were classified by roof type: tiled roofs (1522 points), mainly detached houses, were assigned five residents each; flat concrete roofs (1638 points), mostly apartment buildings, were assigned 15 residents each. These two-point layers were merged into a single dataset containing each building’s location and population estimate. Using the Density tool in ArcGIS Pro with the assigned population as the weighting field, a population-density surface was generated. These assumptions produced a modeled peak population of 32,180, compared with the 9760 residents recorded in the 2021 Population and Housing Census for the Municipal Community of Zakynthos [25]. The modeled value was used to represent peak summer conditions. The density surface was then inversely normalized to a 0–100 suitability scale, with lower estimated densities receiving higher suitability scores.
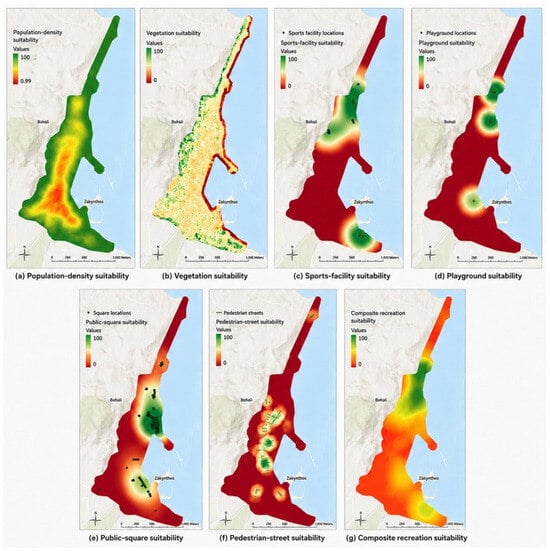
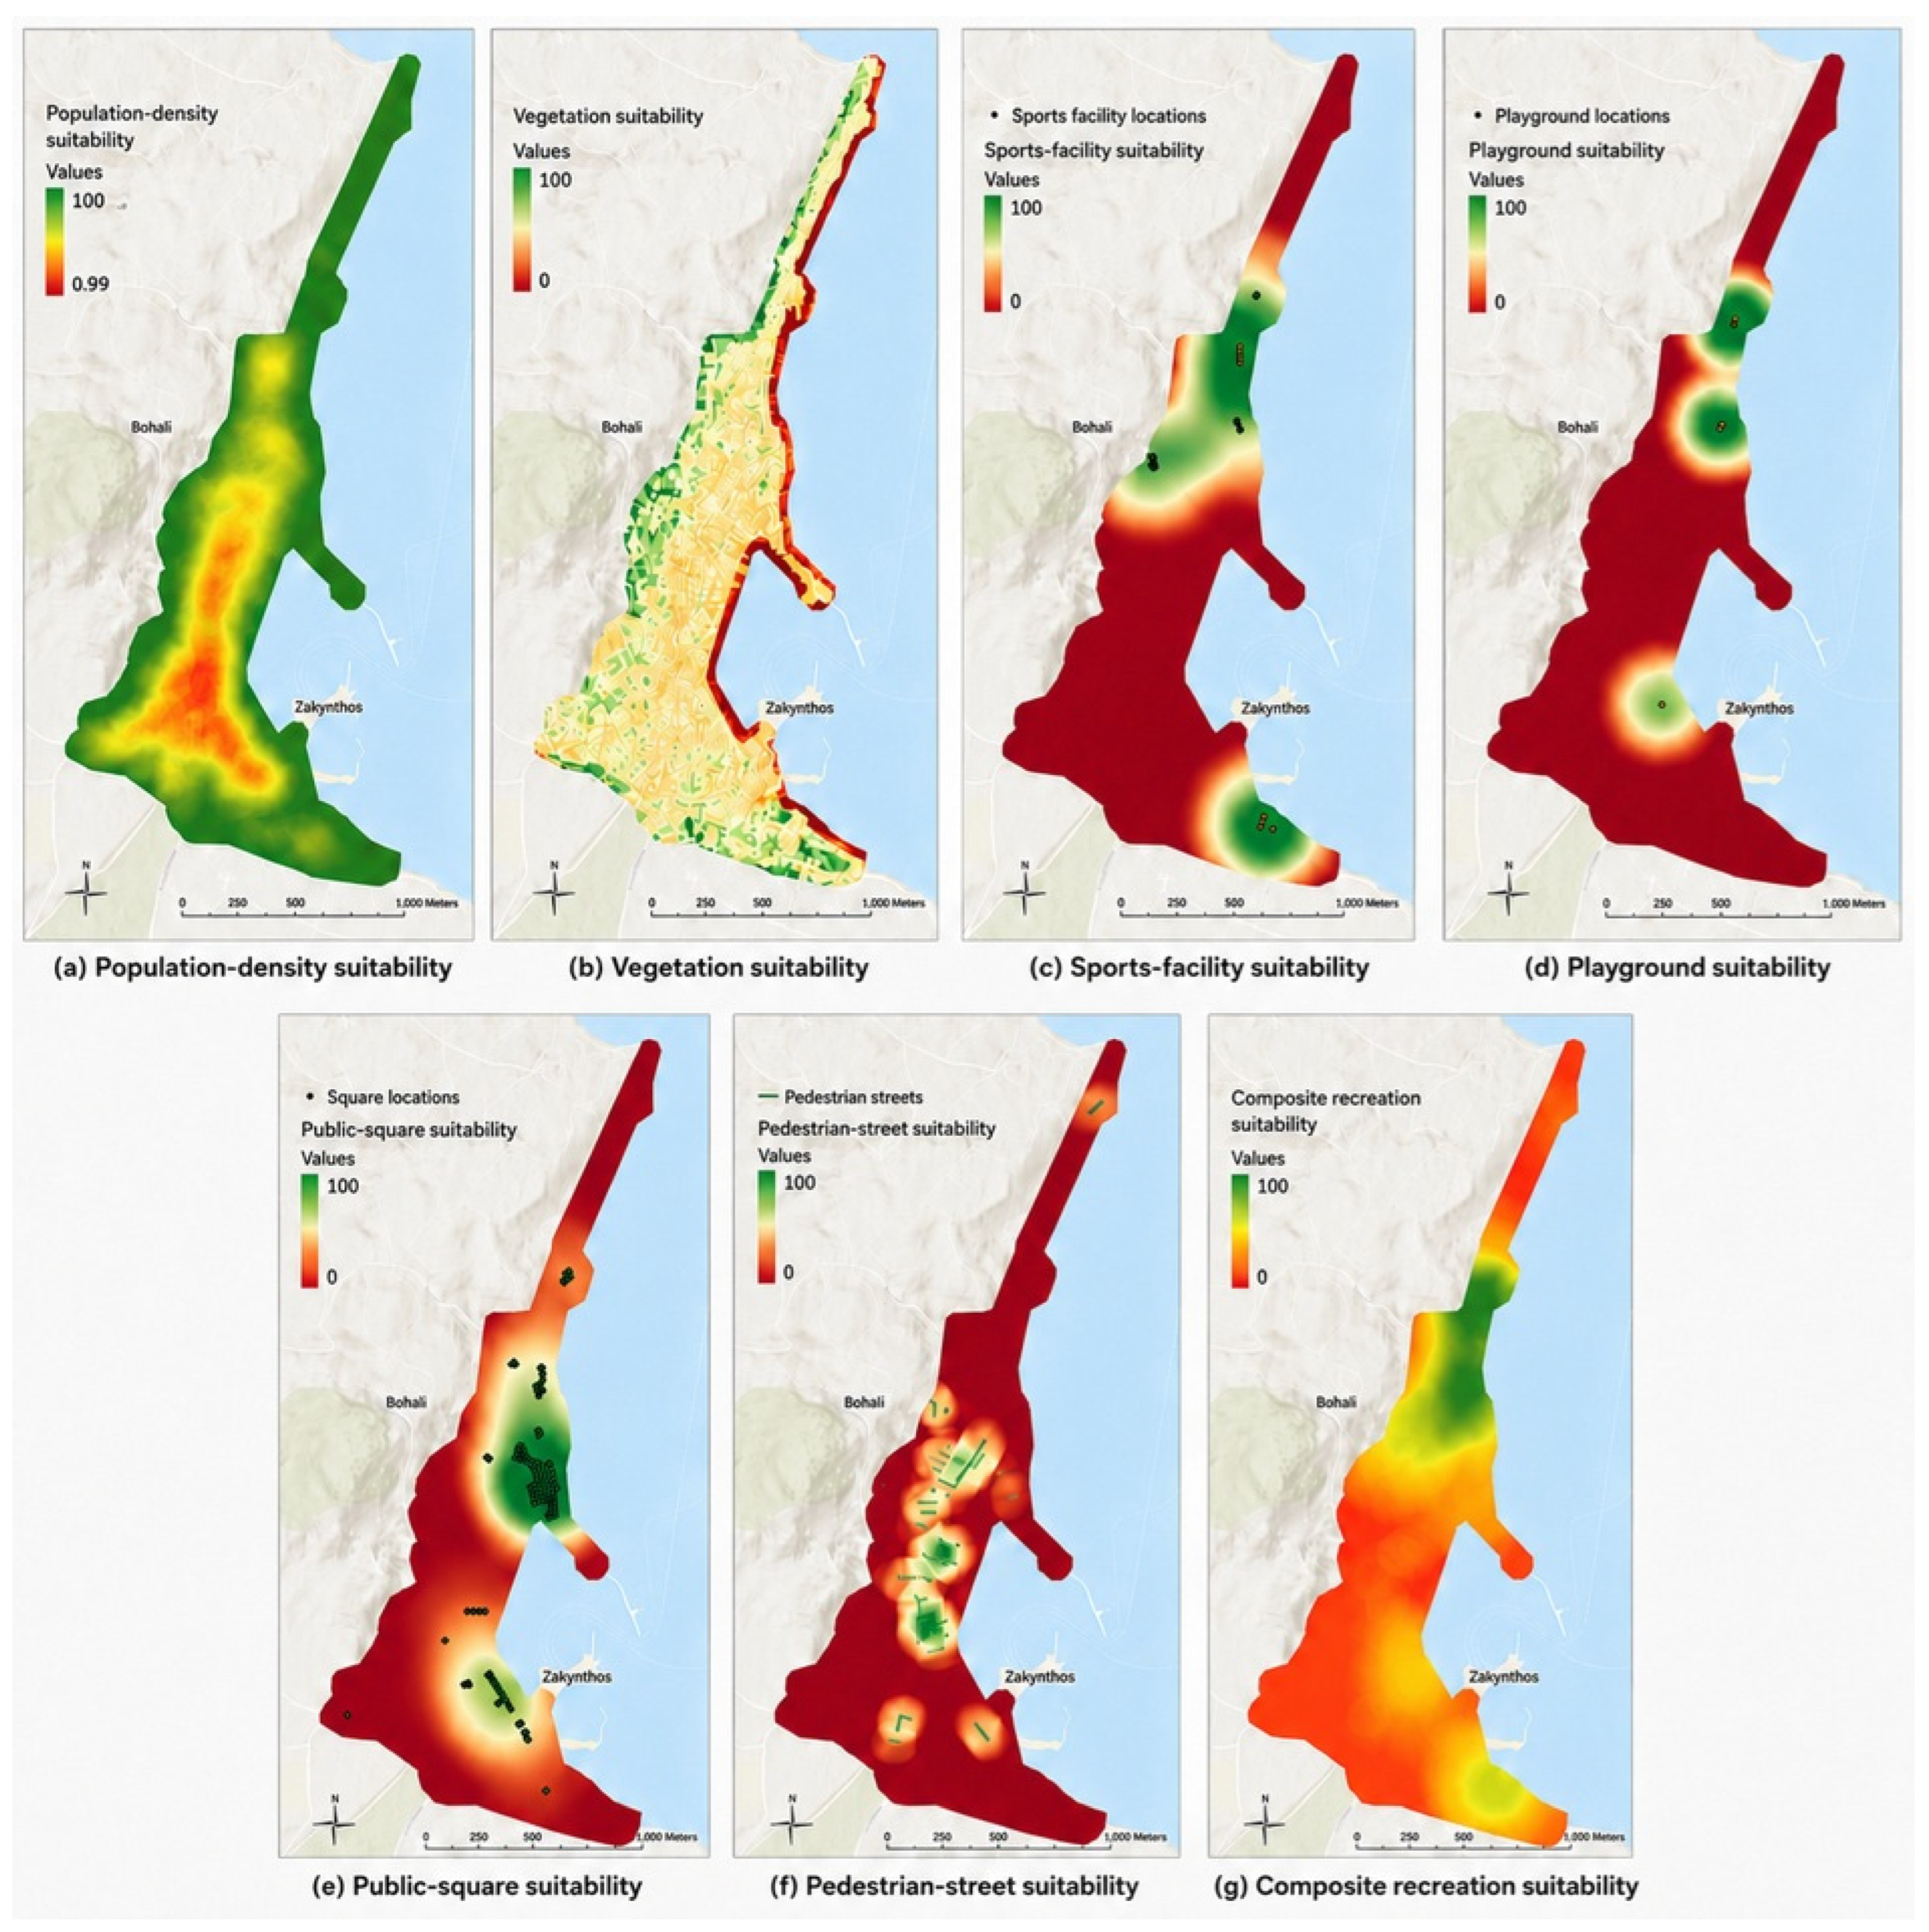
For the vegetation criterion, NDVI was calculated from a median composite of three Sentinel-2 images acquired between 1 and 20 August 2024, each with less than 5% cloud cover. The resulting values were linearly transformed, using −0.4 as the lower threshold, so denser vegetation received higher suitability scores. Public recreation included sports facilities, playgrounds, public squares, and pedestrian streets. Kernel density estimation was applied to sports facilities, playgrounds, and public squares. The search radius was 400 m for sports facilities and public squares and 300 m for playgrounds. Pedestrian streets were treated separately and represented through line-density analysis. Once these surfaces were produced, all four were rescaled to a 0–100 range. The upper standardization limit was set slightly below the observed maximum to reduce the influence of isolated extreme values. Within the resulting recreation criterion, sports facilities accounted for 46.6%, playgrounds for 27.7%, public squares for 16.1%, and pedestrian streets for 9.6%. The pairwise-comparison matrix was highly consistent (CR = 0.01). Figure 2 illustrates the estimated population-density surface, the NDVI layer, and the individual recreation components.
Figure 2.
Population, vegetation, and public recreation suitability indicators: (a) population-density suitability; (b) vegetation suitability based on NDVI; (c) sports-facility suitability; (d) playground suitability; (e) public-square suitability; (f) pedestrian-street suitability; and (g) AHP-weighted composite recreation suitability score.
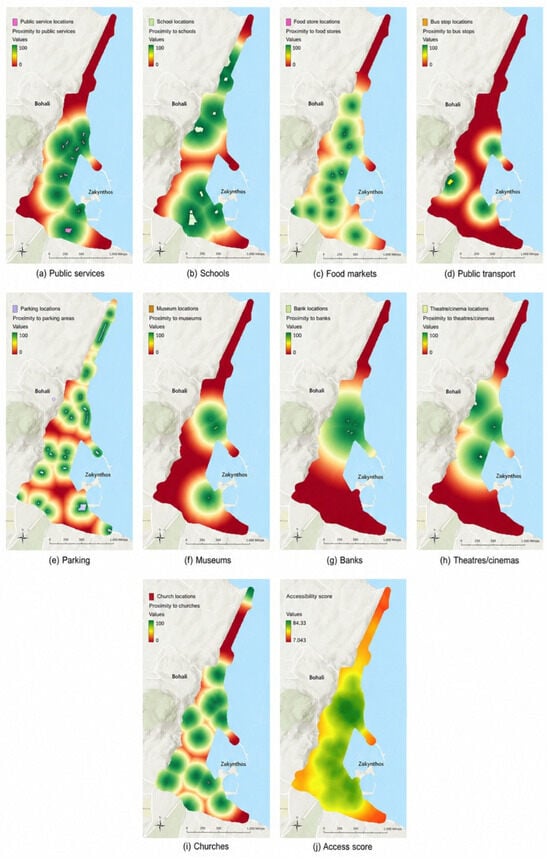
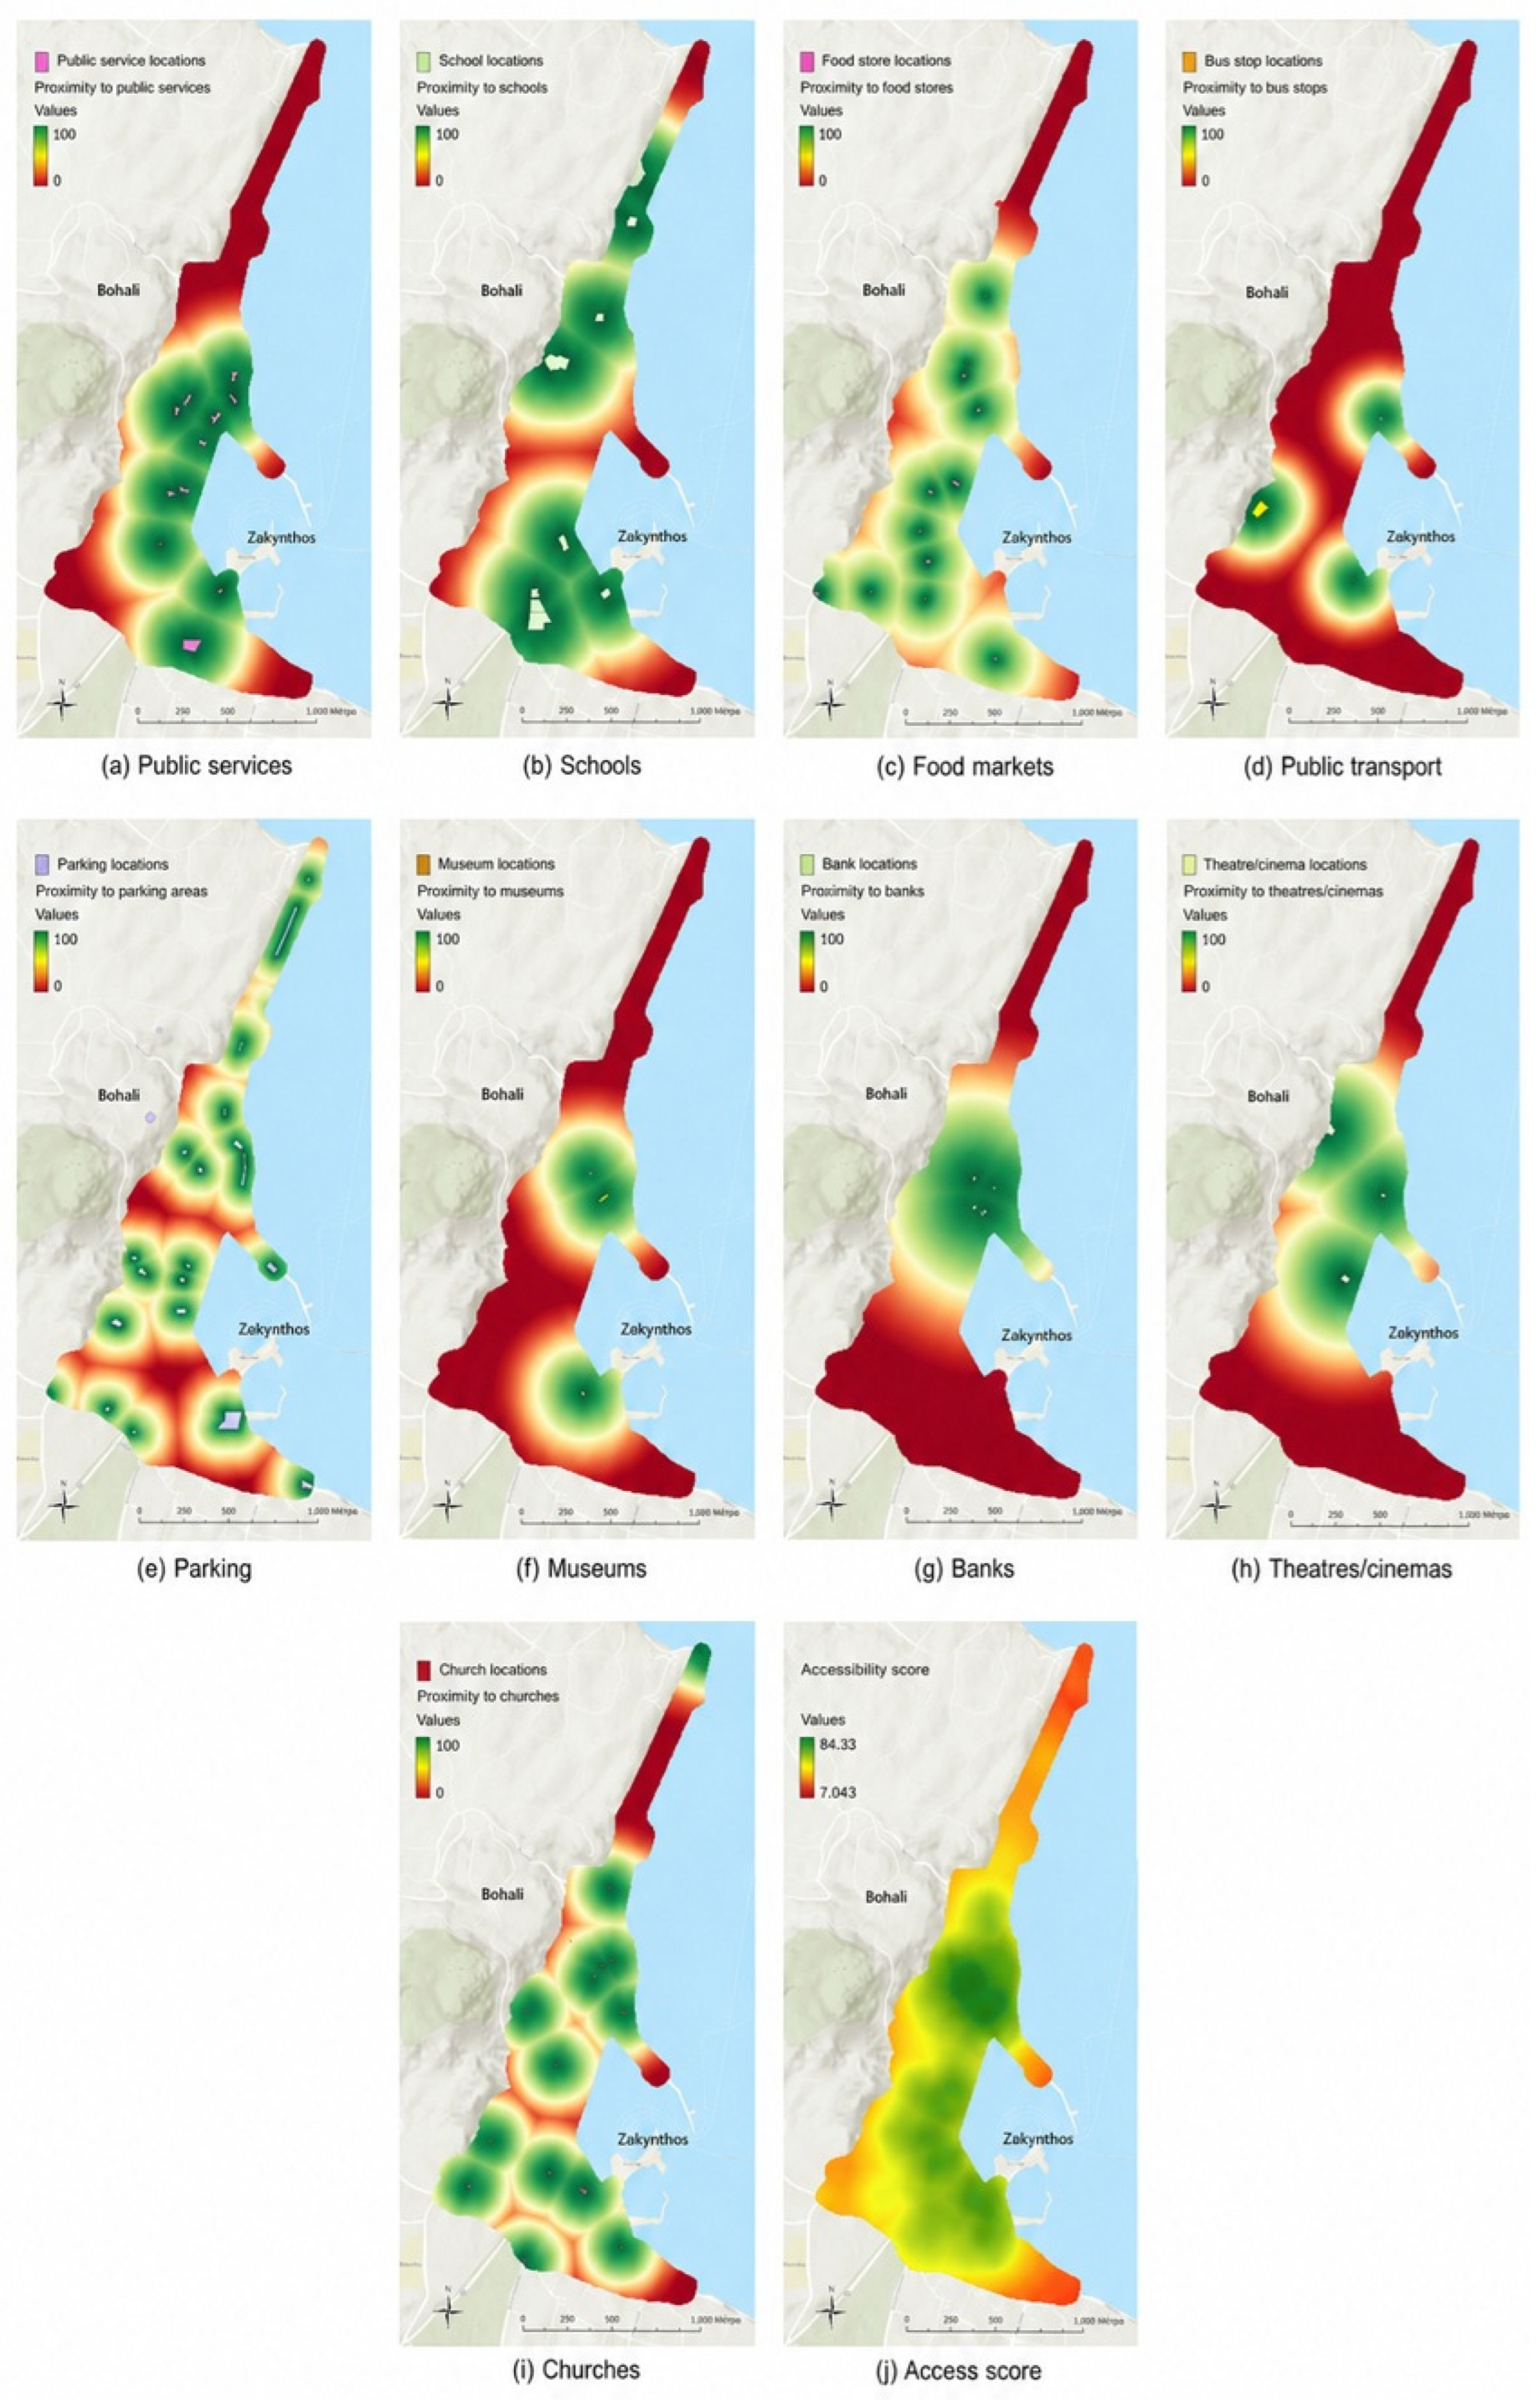
Accessibility was assessed by measuring Euclidean distances to public services, schools, food markets, bus stops, parking areas, museums, banks, theatres and cinemas, and churches. Each distance layer was converted to a 0–100 suitability score. The transformation in each case reflected the likely frequency of use and a realistic walking distance to the destination. Food-market accessibility was modeled with a power-decay function with an exponent of 0.8 and lower and upper thresholds of 20 and 500 m, respectively. The same function was used for parking areas, with thresholds of 10 and 300 m. Logistic-decay functions with a 95% intercept were applied to schools, public services, bus stops, and churches. Their upper thresholds were set at 600, 500, 400, and 400 m, respectively. Museums, banks, and theatres or cinemas were modeled with logistic-decay functions using a 90% intercept and upper thresholds of 500, 900, and 700 m. In each case, suitability was set to zero beyond the upper distance threshold. Food markets, schools, and public services each received an accessibility subweight of 20%. Bus stops and parking areas each contributed 10%, while museums, banks, theatres or cinemas, and churches each contributed 5%. The pairwise-comparison matrix was fully consistent (CR = 0). The individual accessibility layers and their combined score are shown in Figure 3.
Figure 3.
Accessibility indicators: (a) public services; (b) schools; (c) food markets; (d) public transport; (e) parking; (f) museums; (g) banks; (h) theatres/cinemas; (i) churches; and (j) composite accessibility.
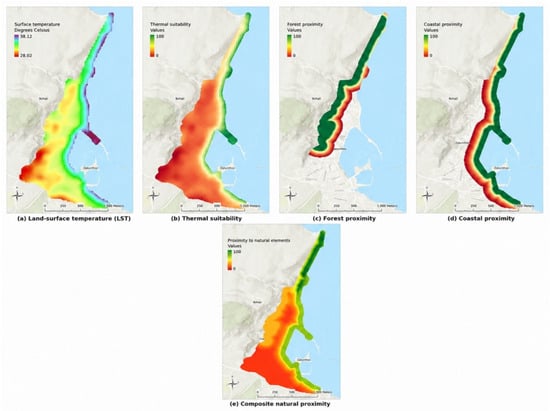
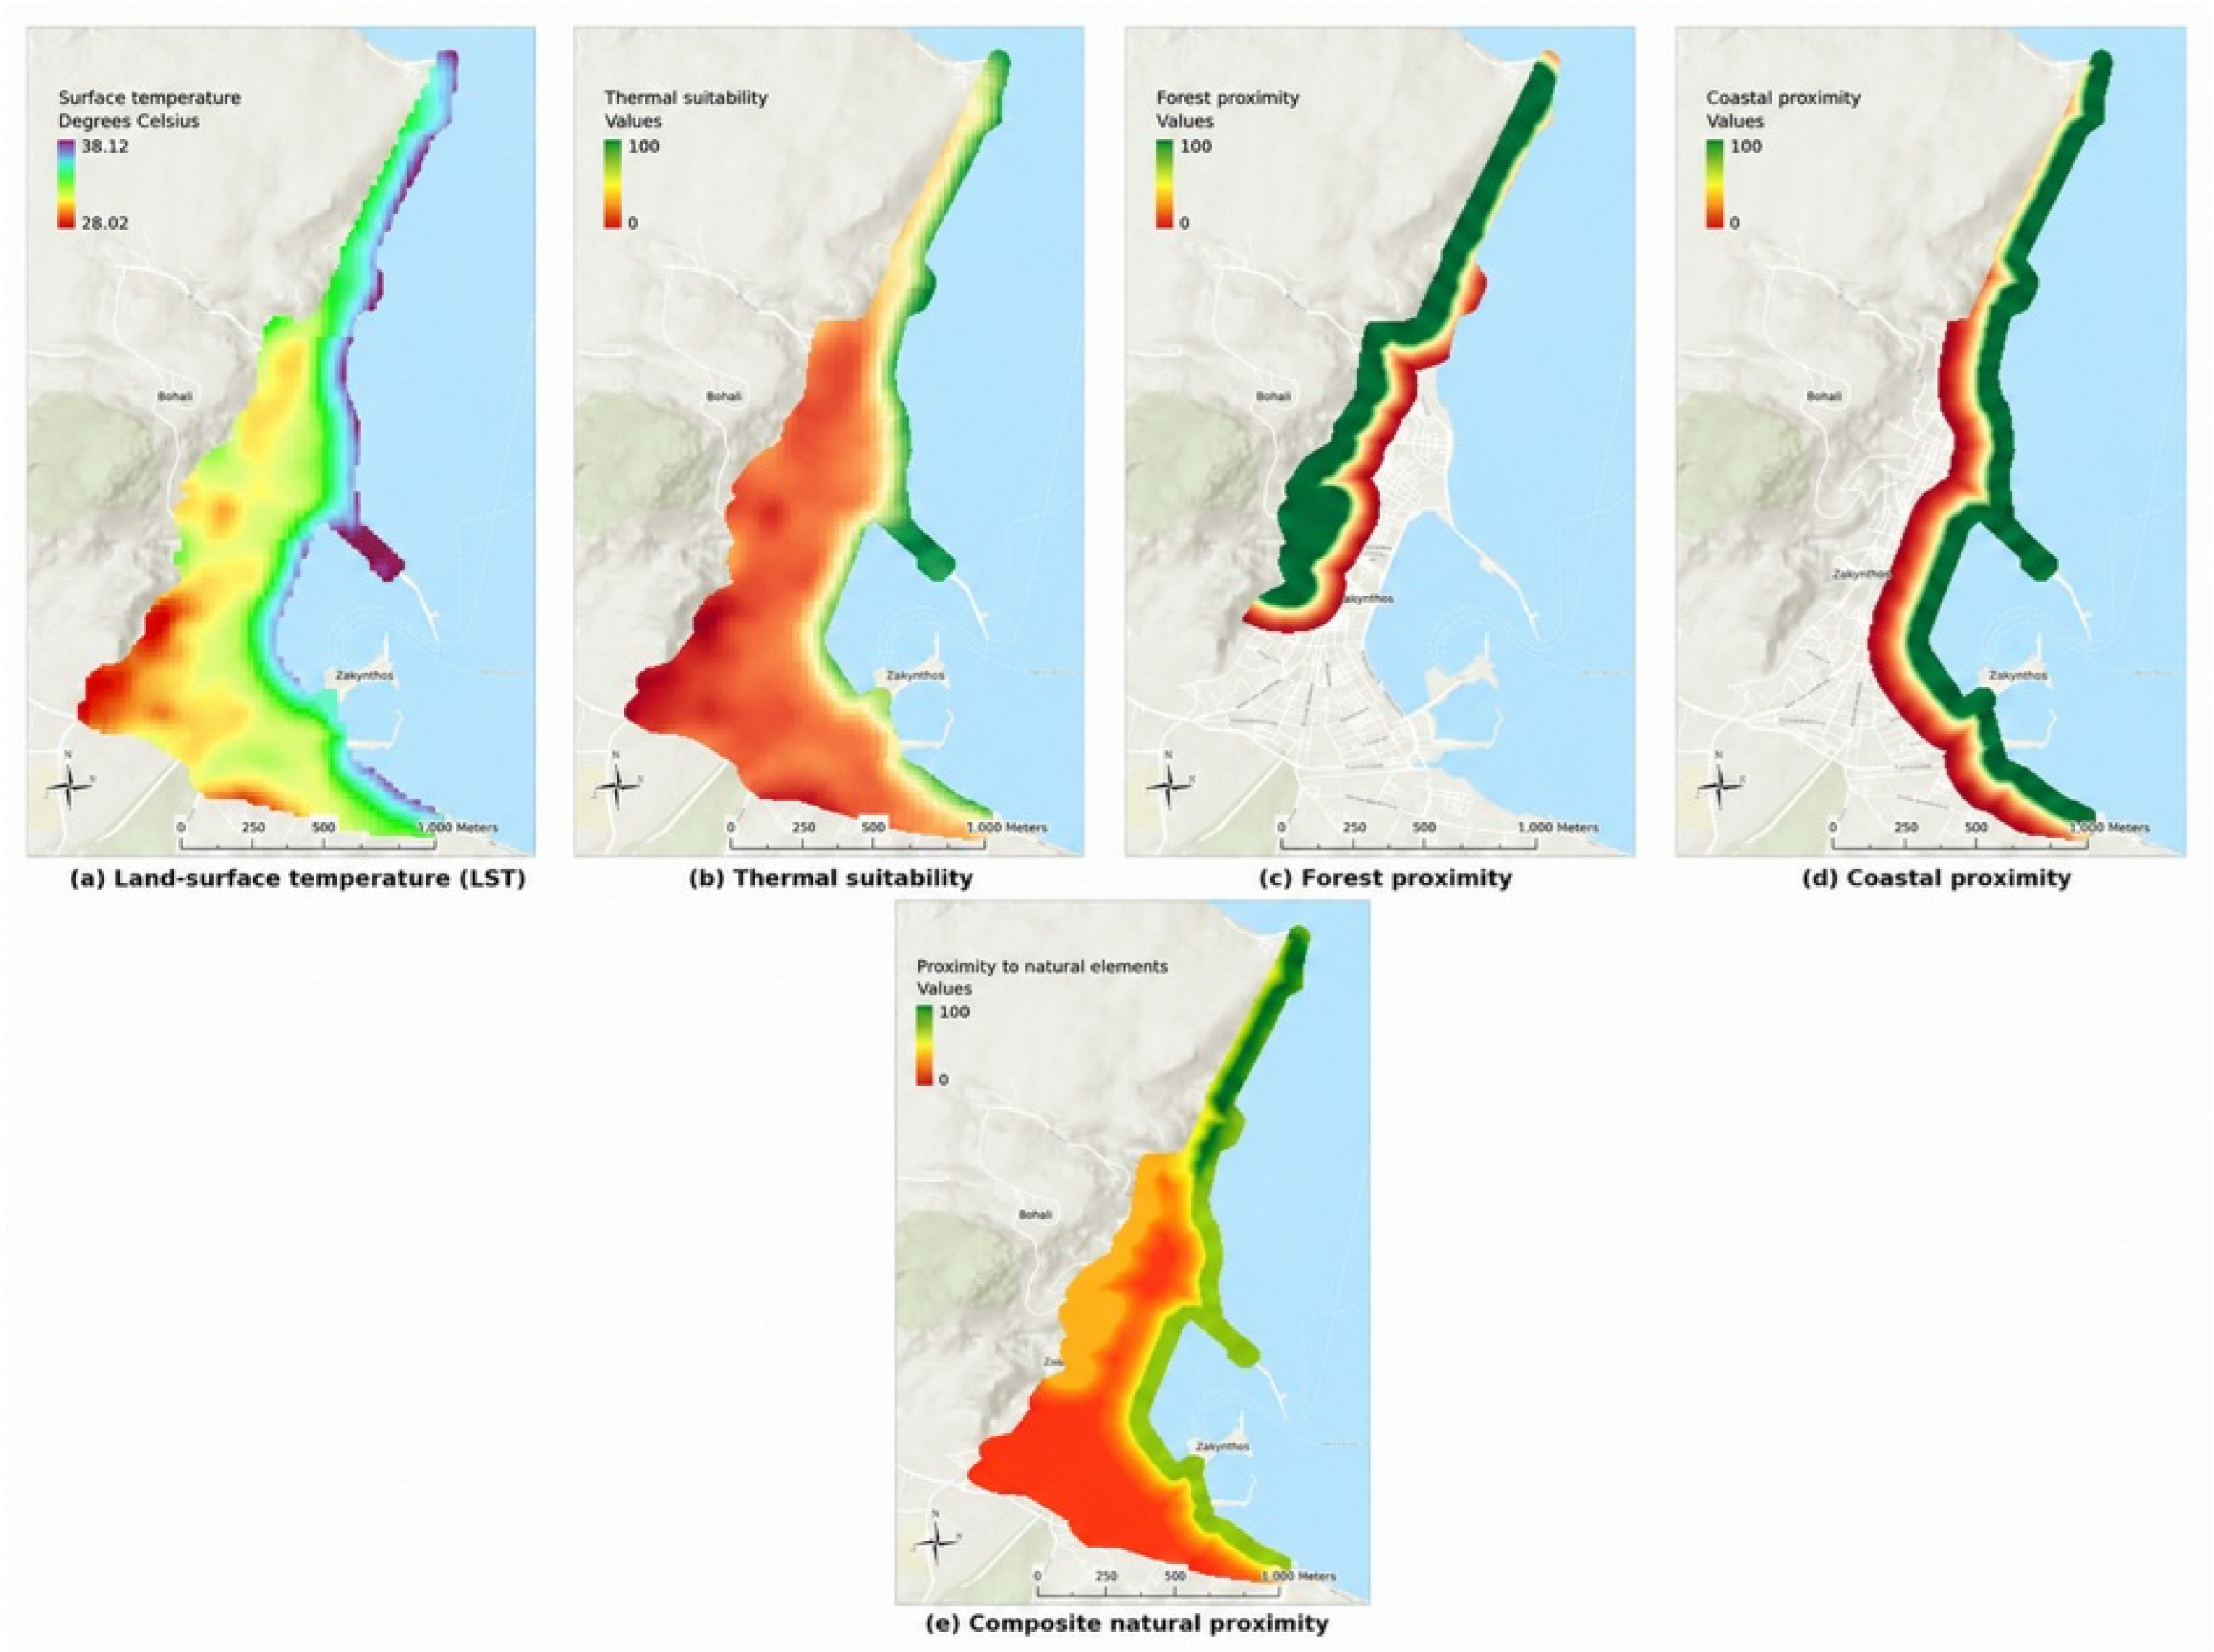
LST was derived from Landsat 8 Level-1 thermal imagery. Level-1 data were preferred because the corresponding Level-2 products contained extensive NoData gaps across the heterogeneous urban surface. To minimize cloud-related effects, the three clearest scenes acquired between 1 and 20 August 2024, each with cloud cover below 10%, were selected and combined into a single composite. Thermal values were converted to degrees Celsius and resampled from 30 to 10 m. Because lower surface temperatures were considered more favorable for urban QoL, the final LST layer was standardized inversely, assigning higher scores to cooler locations. Proximity to natural areas was evaluated using distances to the coastline and forest boundaries. For both variables, distances up to 200 m were considered. After standardization, the two proximity surfaces were combined using weights of 70% for the coast and 30% for forests. The thermal and natural-environment indicators are presented in Figure 4.
Figure 4.
Thermal and natural-environment indicators: (a) land surface temperature (LST); (b) thermal suitability; (c) proximity to forests; (d) proximity to the coast; and (e) AHP-weighted composite natural-proximity score.
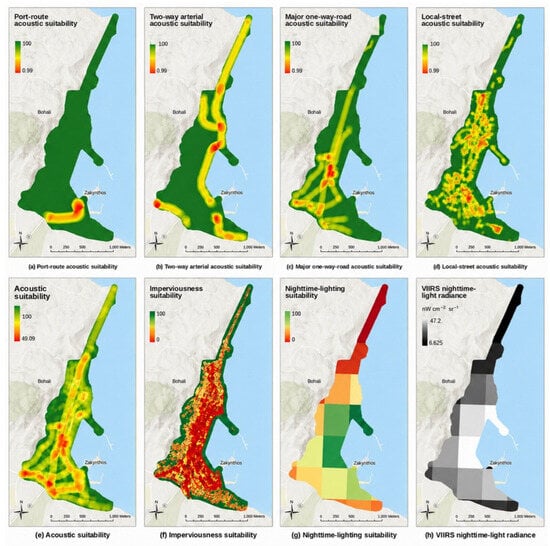
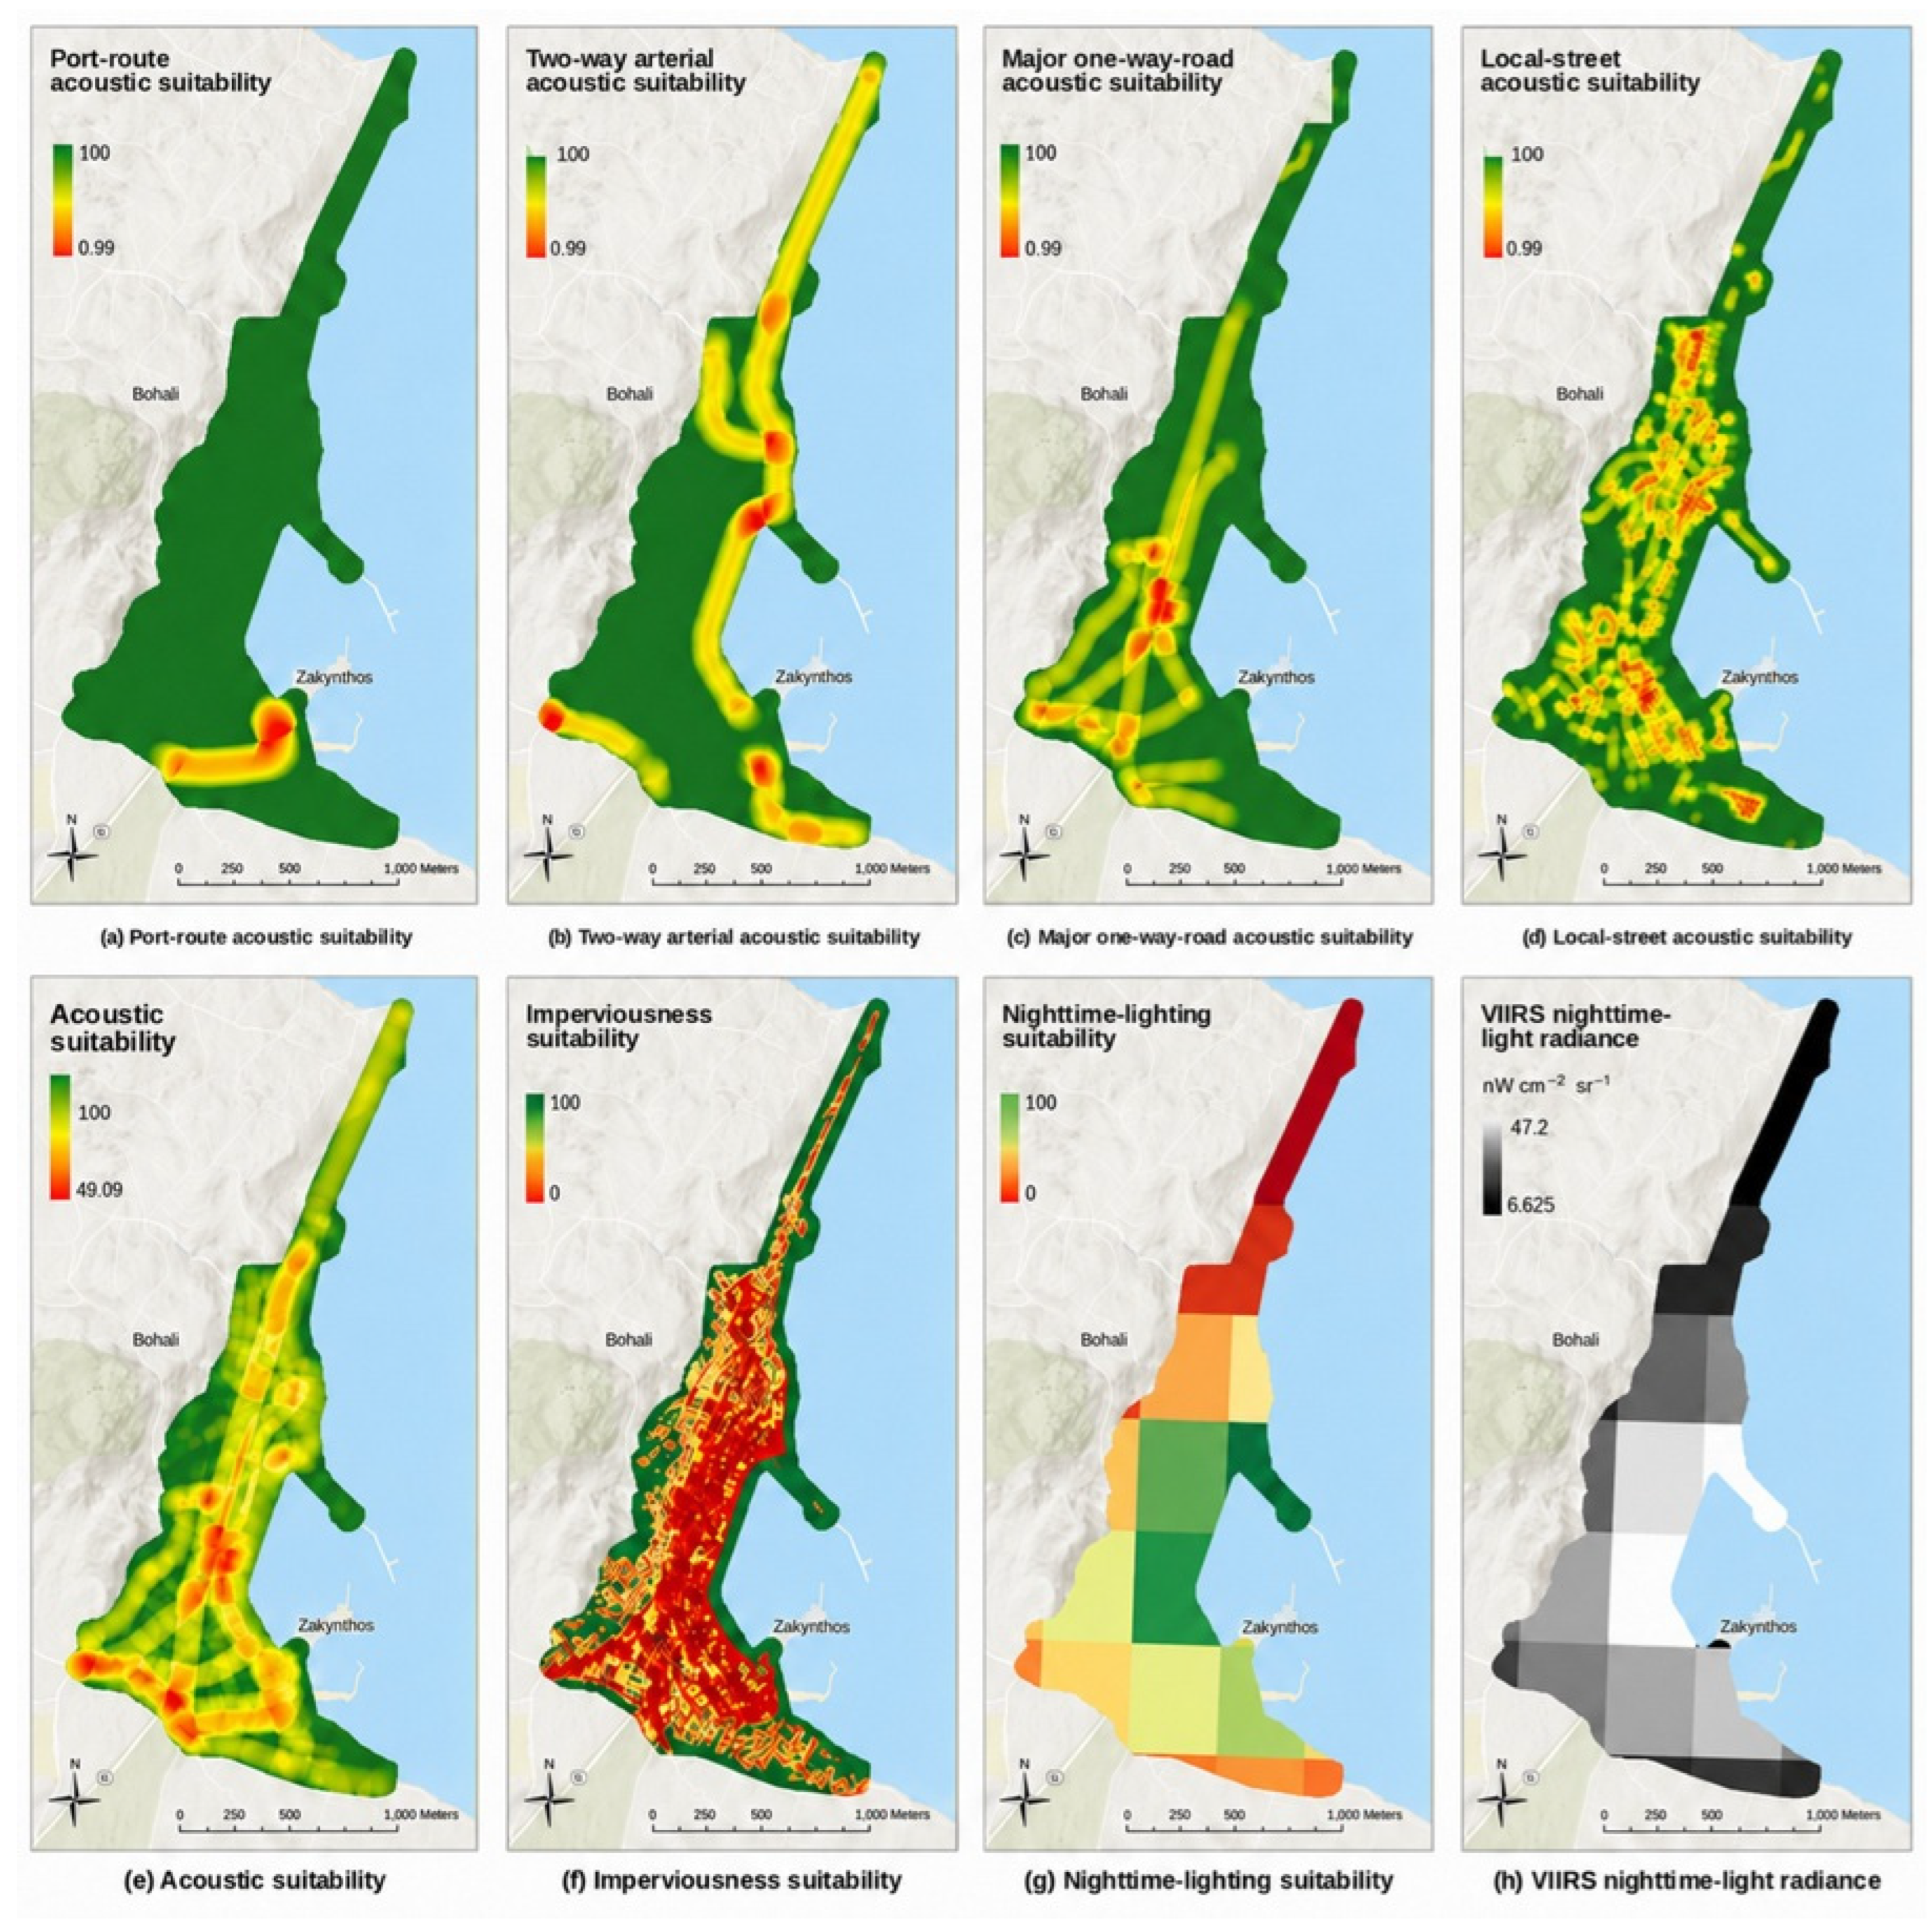
The road-related acoustic suitability indicator was based on proximity to four road classes: the heavy-vehicle corridor serving the port, two-way arterial roads, major one-way urban roads, and local streets. Their maximum influence distances were set at 100, 80, 60, and 30 m, respectively. In the subcriterion weighting, the port route and two-way arterial roads each received 23%, major one-way roads 42%, and local streets 12%. The corresponding comparison matrix remained within the acceptable consistency range (CR < 0.10). No field measurements of sound pressure were available; therefore, the resulting layer represents relative acoustic suitability rather than modeled or measured noise levels. Impervious surface cover was standardized inversely. VIIRS annual nighttime-light radiance was standardized directly, so higher radiance values received higher suitability scores. Because of its relatively coarse spatial resolution, the VIIRS layer was not interpreted at the street level but was used to represent broader spatial patterns of nighttime activity across the study area. Figure 5 presents the four road-class acoustic suitability layers and their AHP-weighted composite, together with imperviousness suitability, nighttime-lighting suitability, and the VIIRS radiance input.
Figure 5.
Road-related acoustic suitability, imperviousness, and nighttime-lighting indicators: (a) heavy-vehicle route serving the port; (b) two-way arterial roads; (c) major one-way urban roads; (d) local streets; (e) AHP-weighted composite acoustic suitability score; (f) imperviousness suitability; (g) nighttime-lighting suitability; and (h) VIIRS annual nighttime-light radiance.
2.4. Composite Model
At the criterion level, the AHP matrix was fully consistent (CR = 0). The two most influential criteria were estimated population density and NDVI, each weighted at 20%. Public recreation, accessibility, thermal suitability, natural proximity, and acoustic suitability each contributed 10%. Imperviousness and nighttime lighting were each weighted at 5%.
The composite urban QoL score was calculated as
where P, V, R, A, T, N, Q, I, and L represent estimated population-density suitability, vegetation suitability based on NDVI, recreation suitability, accessibility, thermal suitability, natural proximity, acoustic suitability, imperviousness suitability, and nighttime-lighting suitability, respectively. The continuous score was classified into five equal-interval classes, and the area of each class was calculated in hectares.
3. Results
3.1. Spatial Pattern of Individual Criteria
The estimated population density was highest in the compact central and southern areas, whereas NDVI showed the opposite pattern, with higher values around Bohali and the urban edge. Recreational facilities were unevenly distributed: only three playgrounds were identified; public squares clustered mainly in the historic center; sports facilities were located largely along the northern and southern edges; and pedestrian streets formed a small, fragmented network. Accessibility was likewise concentrated near the center. Food markets were relatively well distributed across the central and southern areas, but parts of the northern and western margins lay beyond the 500 m threshold. Schools covered large zones, although the closure of the second primary school created a central gap. Public services, banks, museums, and entertainment venues were concentrated in the central and coastal areas; bus stops were unevenly distributed; parking was limited in the city center; and churches were among the most evenly distributed facilities. Together, these patterns identify specific underserved locations rather than a general citywide lack of services.
3.2. Environmental Pressures and Natural Amenities
The surface-temperature map shows that the warmest conditions occurred in the densely built city center and the southwestern part of the study area. By contrast, lower temperatures were generally recorded along the seafront, on vegetated slopes, and toward the urban fringe. A similar spatial pattern was observed for imperviousness, with sealed surfaces concentrated mainly in the central and southern districts. Some narrow areas near the coast and forested zones, however, received relatively high suitability scores. The spatial pattern of road-related acoustic suitability closely followed the road hierarchy. The port access route had the largest modeled influence distance (100 m), reflecting its heavy-vehicle use, while arterial and major one-way roads extended the affected zone across a broader part of the city center. VIIRS radiance ranged from 6.625 to 47.2 nW cm−2 sr−1. Values were highest near the city center and port and decreased progressively toward the north.
3.3. Spatial Distribution of Urban Quality of Life
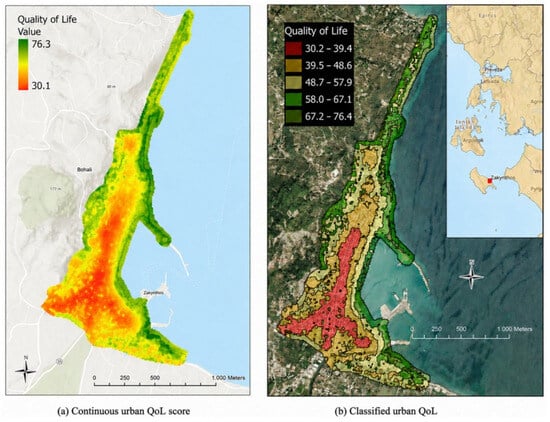
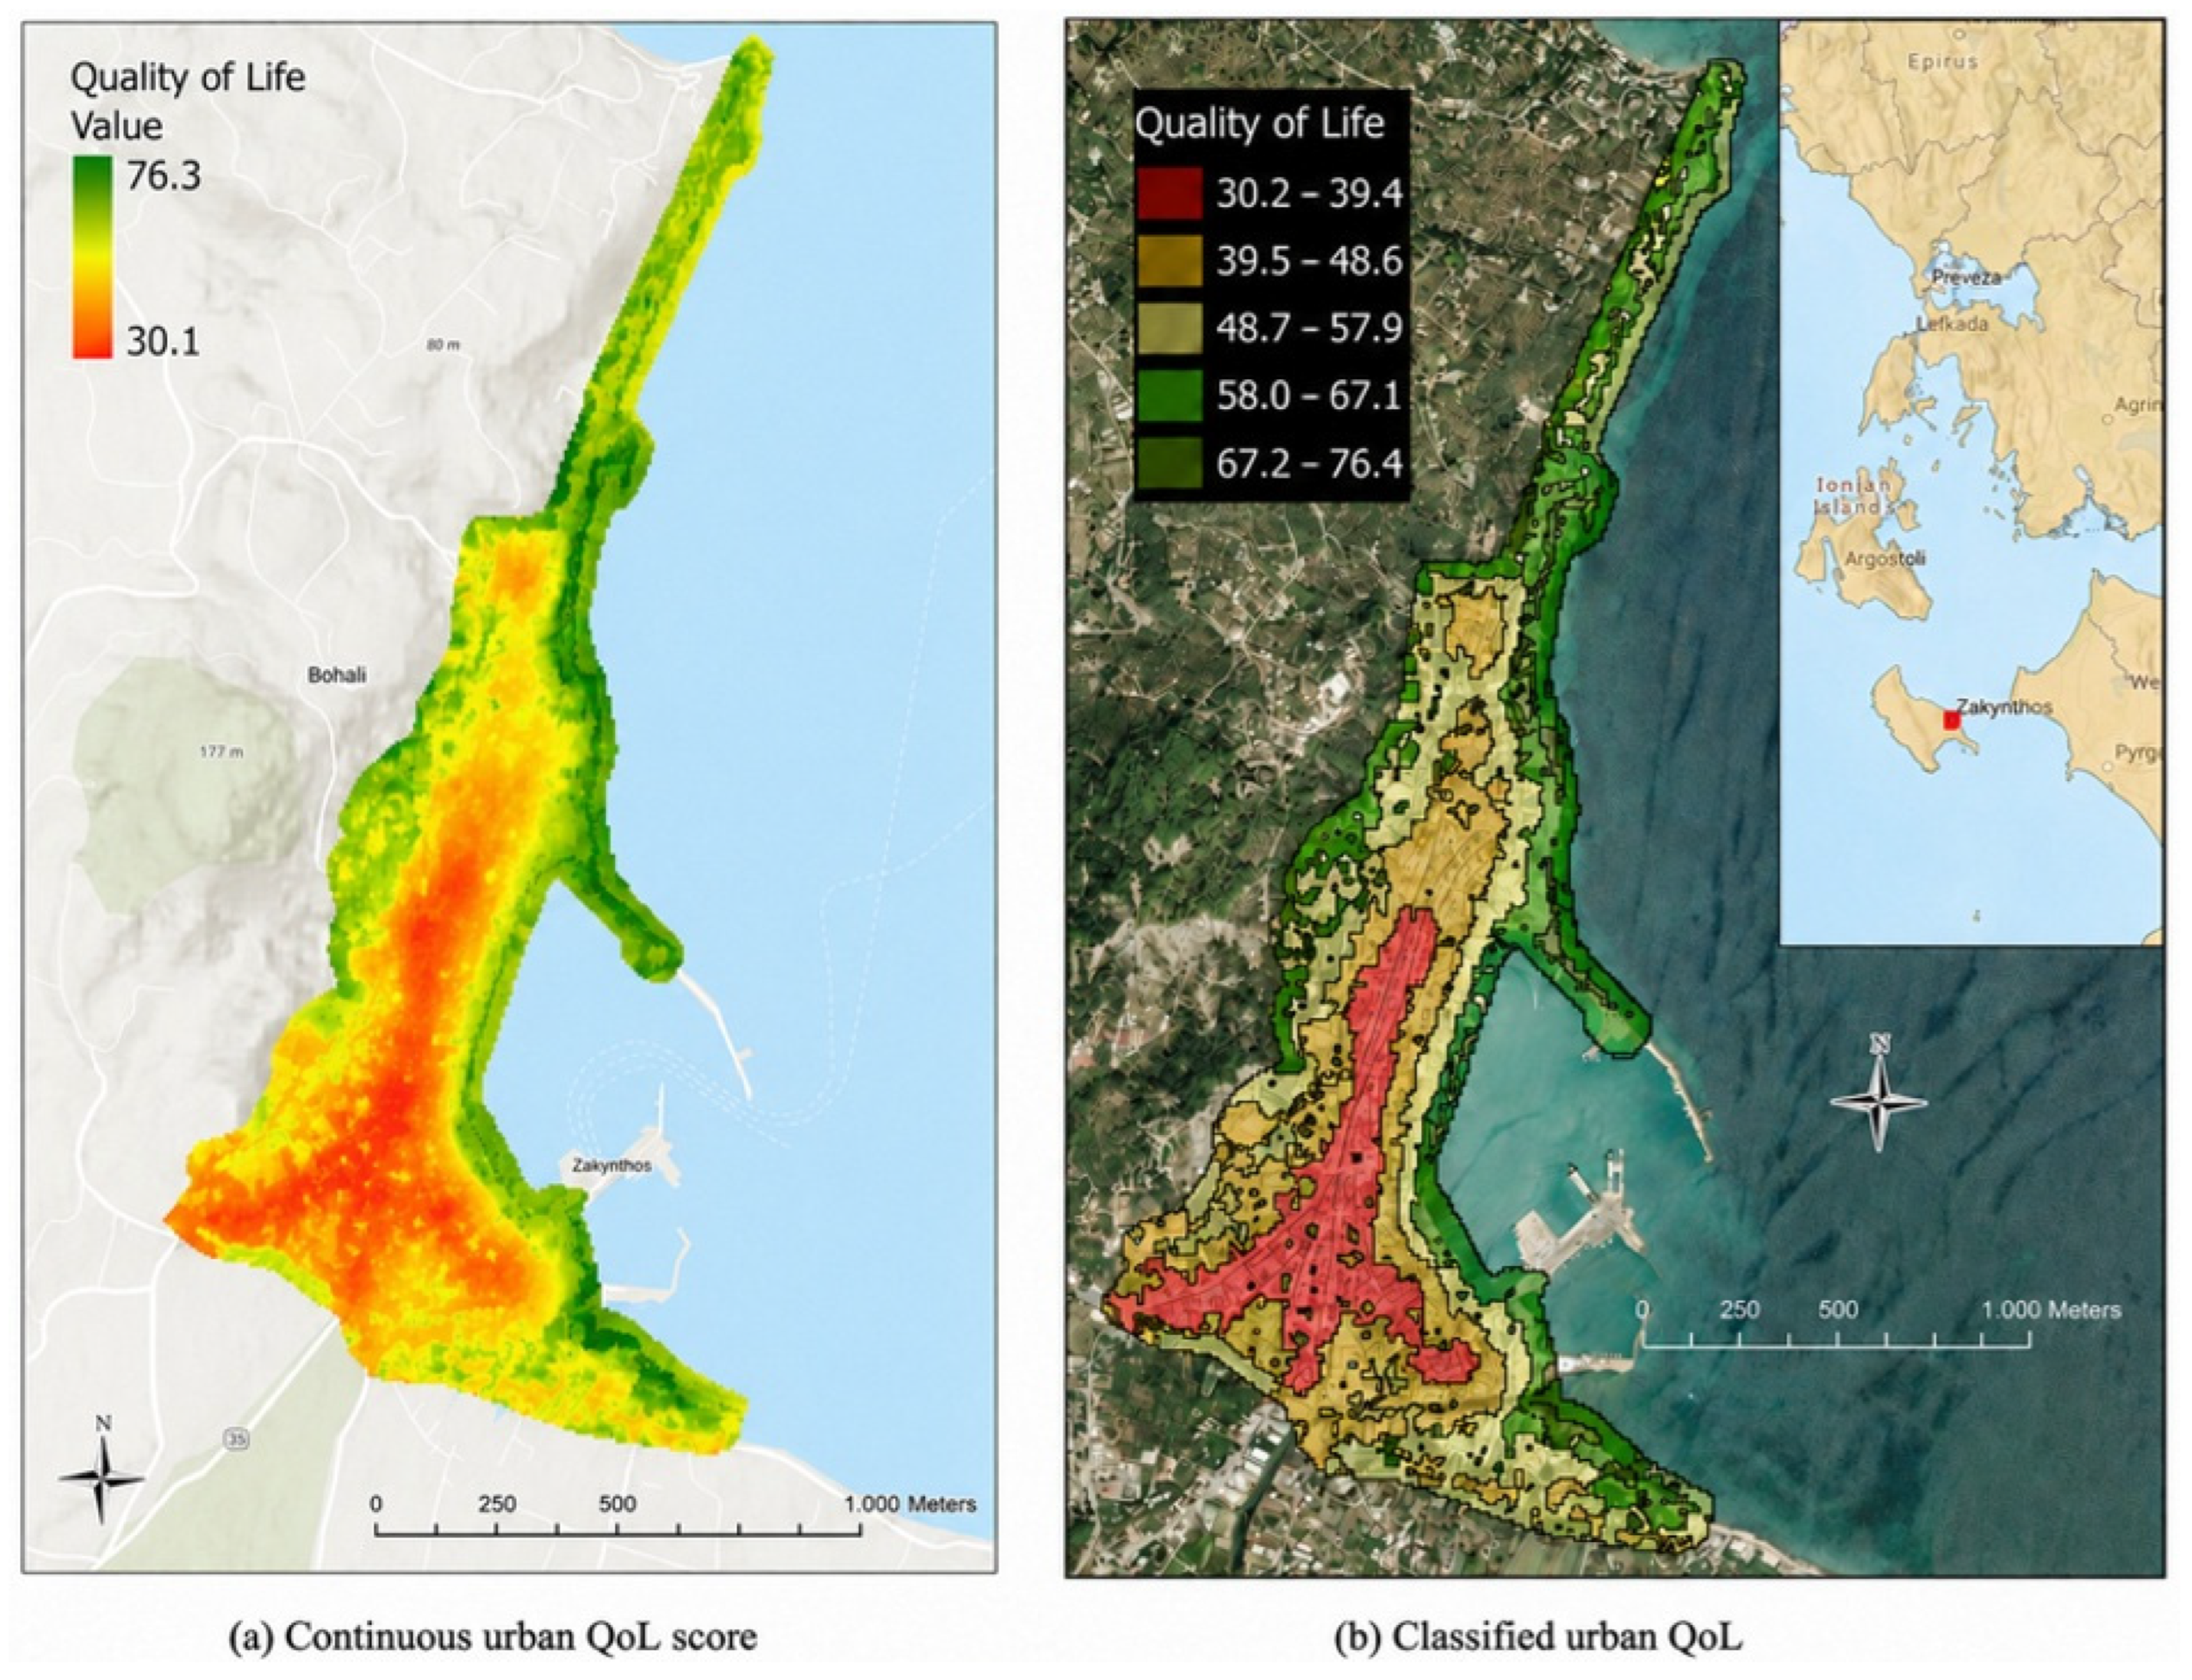
Although favorable locations were identified, they covered only a limited portion of the city and did not form a single continuous zone. The highest QoL scores were mainly found along sections of the northern and eastern coastal margins and around the greener edges of the study area. These locations were generally cooler and less densely built, while still maintaining reasonable access to everyday services. Lower scores were concentrated mainly in the central and southwestern parts of the city, where dense development, traffic, higher temperatures, limited recreational space, and extensive impervious surfaces occurred together. The city center showed a more mixed pattern. It benefited from very good access to services, but this advantage was partly offset by the environmental pressures associated with the densely built urban area (Figure 6).
Figure 6.
Spatial distribution of urban quality of life: (a) continuous composite QoL score and (b) classification into five equal-interval classes.
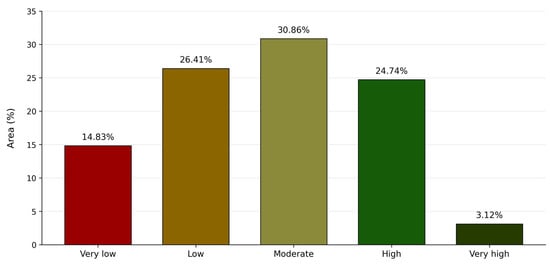
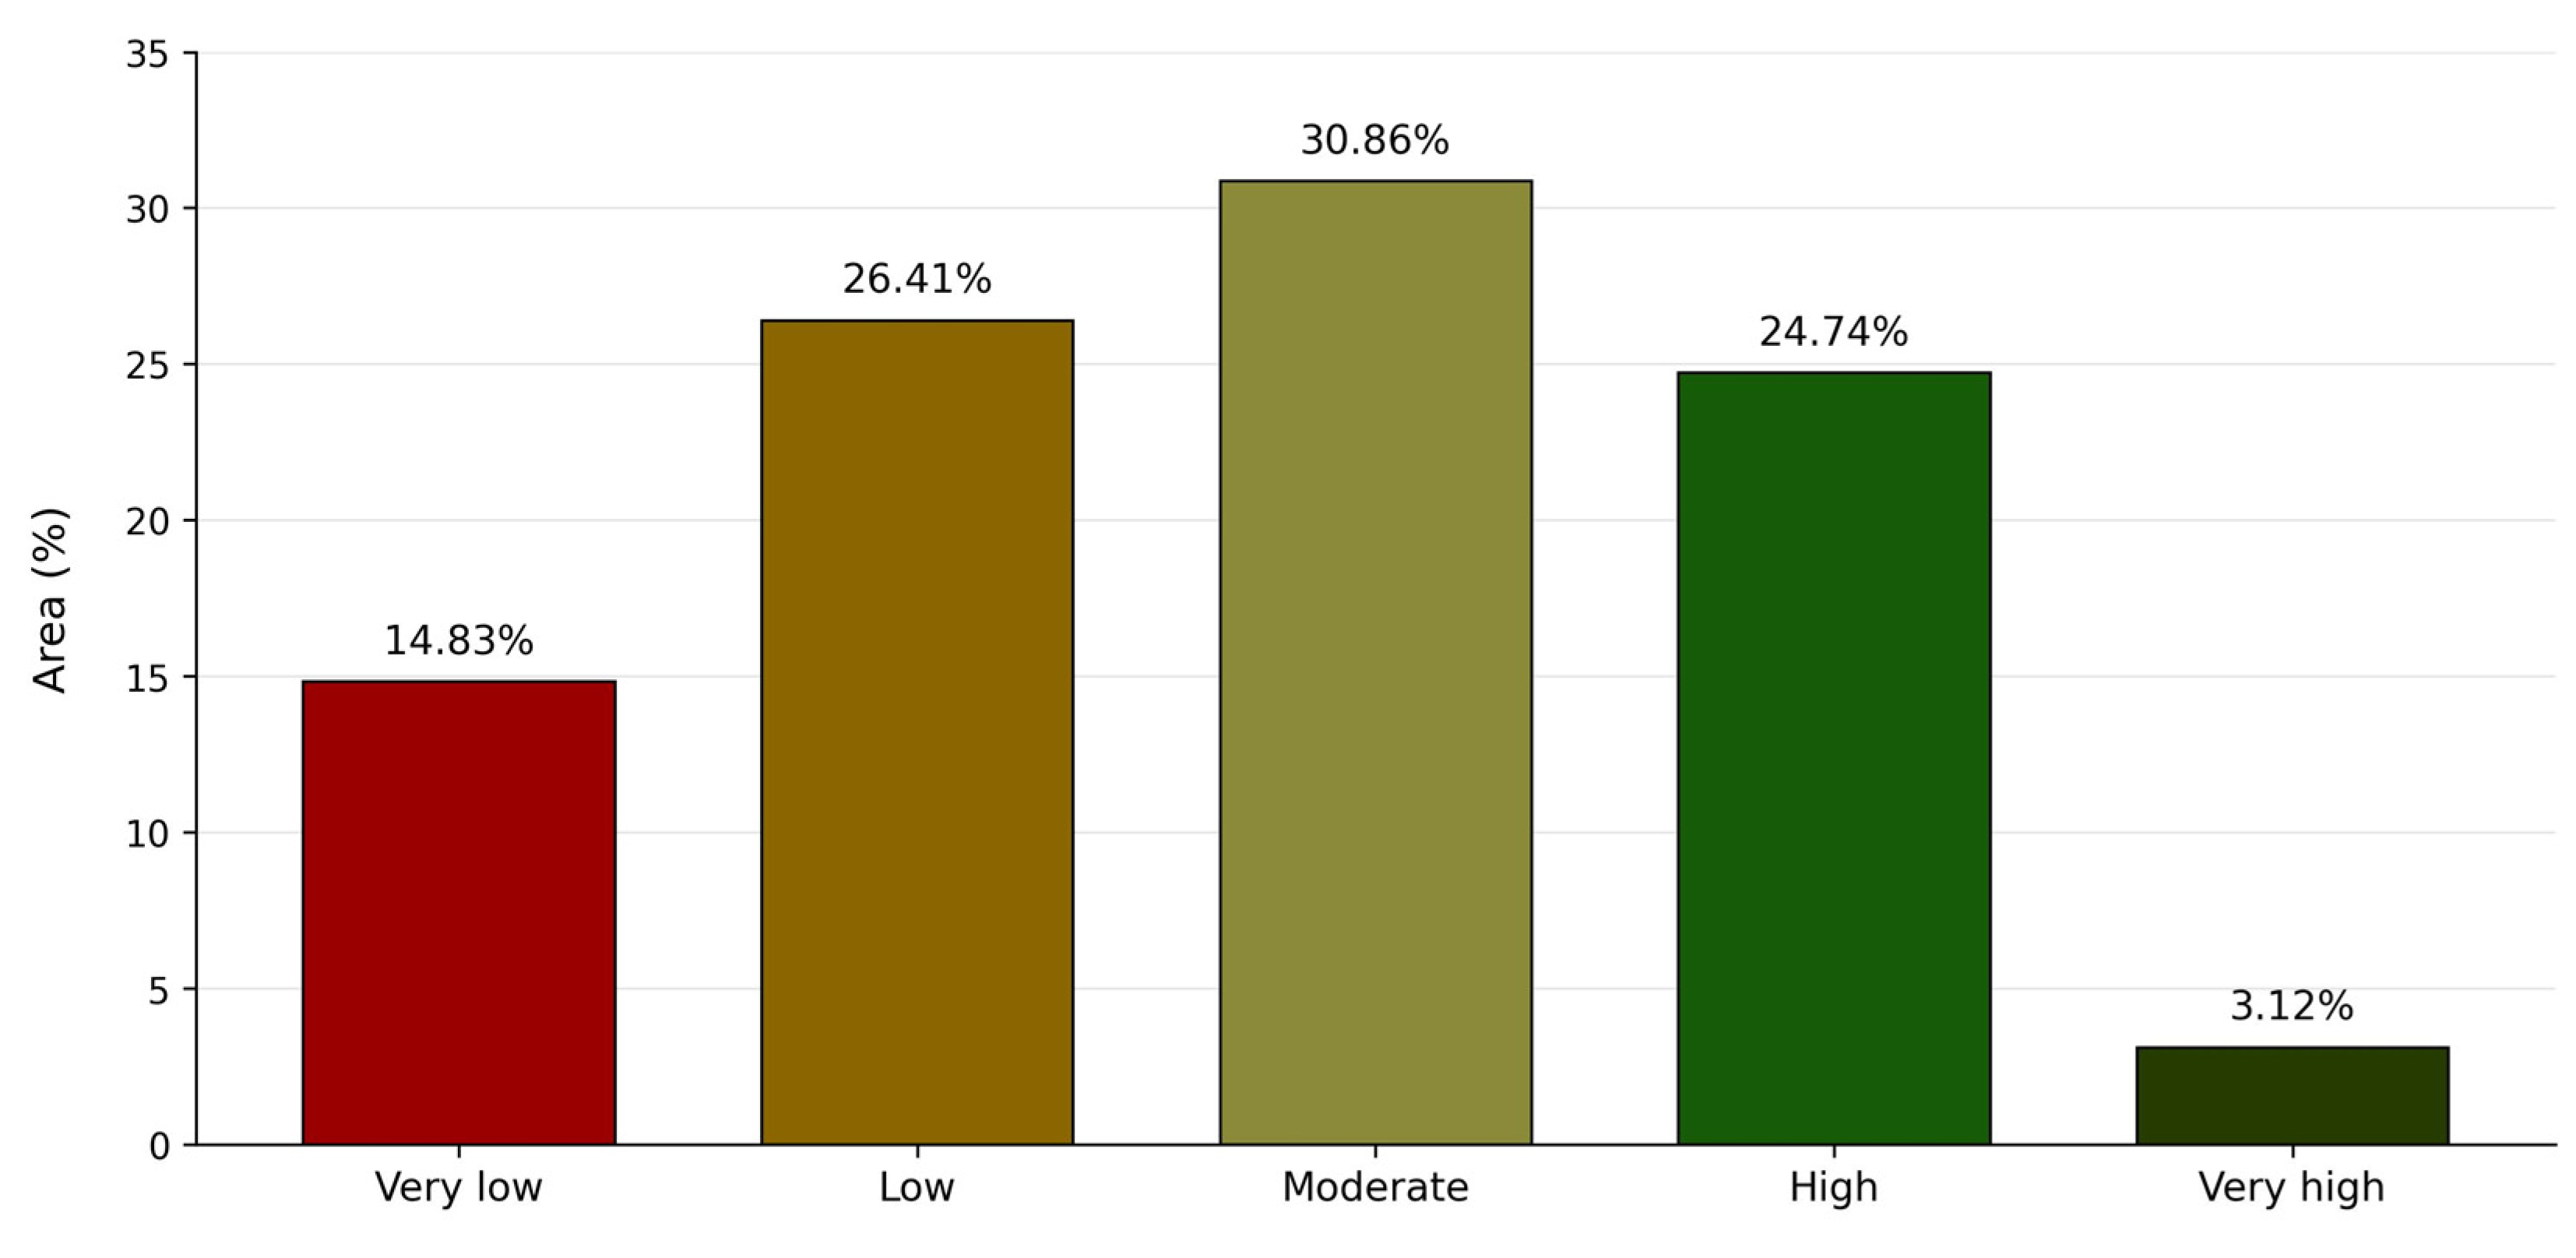
The moderate QoL class covered the largest area: 51.93 ha, or 30.86% of the study area, with scores ranging from 48.7 to 57.9. The low and very low classes together occupied 69.40 ha (41.24%), indicating that a substantial share of the city experienced less favorable conditions. By comparison, the high and very high classes covered 46.89 ha (27.86%). The very high class was particularly limited, occupying only 5.26 ha (3.12%) in small, scattered locations (Figure 7).
Figure 7.
Percentage distribution of the study area across the five urban quality-of-life classes.
4. Discussion
The final maps show that urban QoL in Zakynthos is shaped by two spatial patterns that do not fully align. Services, commercial activity, schools, cultural facilities, and several public spaces are concentrated in and around the center. Environmental advantages follow a different pattern. Cooler conditions, vegetation, and proximity to the coast are more evident toward the northern and eastern margins and around Bohali. As a result, the center performs well on accessibility but less well when the full set of criteria is considered. This is clearly visible in Figure 6. The lower-scoring zone is not confined to a few isolated blocks. It extends across a considerable part of the central and southwestern urban area, where several pressures overlap: high estimated population density and dense development, elevated LST, sealed surfaces, traffic, and limited access to recreational spaces. In the northern part of the study area, the opposite pattern is more common. Development is less dense, vegetation is more prominent, and temperatures are generally lower. Some of these areas also retain adequate access to services, allowing them to achieve higher composite scores. Similar differences between service-rich centers and environmentally favored peripheral areas have been observed in other fine-scale QoL assessments [5,6,7,8,9,10,11,19].
The class distribution supports the same interpretation. Low and very low QoL together account for 41.24% of the study area, whereas the very high class covers only 3.12%. Very high values occur in small sections rather than across a broad neighborhood. Moderate QoL is the largest single class, but this should not be taken as evidence of generally balanced conditions. Much of the city lies near the middle of the scale because accessibility advantages and environmental disadvantages partially offset one another. These changes can occur over quite short distances. A residential area may be close to services but also near a busy road, surrounded by impervious surfaces, and exposed to high summer temperatures. A few blocks farther away, vegetation or coastal influence may improve the environmental score. The 10 m grid makes these local changes visible. A municipal average, or even a large census zone, would smooth them out and give a much less useful picture of neighborhood planning [6,7,8,11].
The high values near the coast require careful interpretation. At first glance, the final pattern may suggest that proximity to the sea is the dominant factor but it is not. Natural proximity received 10% of the total weight, with the sea accounting for 70% of that criterion. This gave the sea a direct contribution of 7% to the final score. The coastal pattern emerged because several favorable conditions occur in the same general area: lower temperatures, greener spaces, public recreation, commercial and tourist activity, lighting, and access to selected services. The waterfront has also received more public and private investment than several inland neighborhoods. The resulting advantage is therefore partly environmental and partly the outcome of how urban functions and investment have been distributed. This distinction matters for planning. If the higher coastal values were caused only by the sea, there would be little scope for intervention elsewhere. The maps show something different. Many of the criteria that reduce QoL in the center and southwest can be changed through planning decisions. Vegetation can be increased, sealed surfaces can be reduced, traffic can be managed, and recreational spaces can be distributed more evenly. The environmental advantage of the coast cannot be replicated in the interior, but some of the gap can be reduced.
Applying AHP was important because it made the model’s priority structure explicit. Estimated population-density suitability and NDVI received the highest criterion weights, whereas accessibility, recreation, thermal suitability, natural proximity, and acoustic suitability had equal secondary weights. Within the more complex criteria, AHP also distinguished the relative importance of individual facilities or road categories. The consistency ratios were acceptable, and the final criterion matrix was fully consistent, indicating that the pairwise judgments followed a coherent internal logic. However, this does not demonstrate robustness to alternative weights: the consistency ratio measures internal coherence, not map stability. A qualitative direction-of-change assessment based on the individual criterion maps indicates that increasing the weights of accessibility and recreation would improve the central area’s relative position, whereas greater emphasis on thermal, acoustic, or imperviousness suitability would further penalize the central and southwestern zones. Increasing the weights of NDVI or estimated population-density suitability would favor the greener, less densely built northern and western margins. Because several disadvantages overlap within the main low-score zones, the criterion maps suggest that the broad contrast between the center/southwest and the greener margins would probably persist under moderate weight changes; cells close to class thresholds are more likely to change class. This inference is qualitative and is not a substitute for raster-based sensitivity analysis. A subsequent analysis should vary each main weight within a defined range, renormalize the remaining weights, and report rank correlation, class-transition matrices, and the spatial agreement of priority areas [8,12,22,23,24]. Previous applications of AHP have evaluated urban livability for elderly populations and examined the relationships among topography, biotopes, and population density [26,27]. Future research may expand upon this methodology by comparing the weights assigned by residents, experts, and municipal stakeholders.
Several results point directly to local planning needs. One is the shortage and uneven distribution of playgrounds and pedestrian streets. Squares and cultural facilities are concentrated near the center, while recreational opportunities are weaker in several densely populated neighborhoods. Creating small parks, playgrounds, and shaded spaces in the southern and southwestern districts would address an actual spatial gap rather than add more facilities to areas that are already relatively well served. The LST and imperviousness maps suggest that green infrastructure should be concentrated where heat and soil sealing occur together. Large parks may not be feasible in the dense center, but street trees, planted courtyards, pocket parks, green roofs, and permeable or cooler paving materials could still have a measurable local effect. Vacant or underused plots may also offer opportunities for small-scale interventions. These measures would be especially useful near schools, residential blocks, and heavily used pedestrian routes. Traffic pressure requires a broader approach. The port access road, arterial routes, and the dense local street network affect a substantial part of the southern and central areas. Simply adding parking spaces within the center is unlikely to solve the problem. Peripheral parking, more frequent public transport, safer pedestrian routes, and a connected cycling network would reduce the need for short car trips. Lower speed limits and traffic-calming measures would also improve safety and reduce some of the noise burden. Along the port route, vegetation could provide visual improvement and limited acoustic protection, although its actual performance should be tested with field measurements.
The study has several limitations. First, it maps objective conditions and does not capture how residents assess their neighborhoods. The model omits satisfaction, perceived safety, attachment to place, and the needs of different age or social groups. A location with a moderate objective score may still be viewed positively by its residents, while a high-scoring area may not meet everyone’s needs. Some input layers also involve approximation. Population estimates were based on the building inventory instead of detailed census data at the same spatial resolution. The inventory was digitized from 2007–2009 Hellenic Cadastre orthophotos and might not include later construction, demolitions, or changes in building use. Potential road-noise exposure was represented by road class and distance, not by recorded sound levels. The LST analysis used Landsat Level-1 imagery because the available Level-2 products contained extensive gaps. As a result, the relative contrast between warmer and cooler areas is more reliable than the absolute temperatures. VIIRS radiance is too coarse for interpretation at the level of individual streets. These limitations should be kept in mind, especially when the maps are used to guide specific projects. Even so, the framework has practical value. It identifies where several disadvantages occur together and where intervention is likely to have the greatest effect. Because the model is based on a common spatial grid, it can also be updated. New population data, revised road information, additional public facilities, more recent satellite imagery, or field measurements can be incorporated without rebuilding the entire analytical structure.
Future development of the framework should follow a single, integrated pathway. A geocoded resident survey could capture neighborhood satisfaction, perceived safety, heat and noise levels, barriers to everyday services, place attachment, and tourism-season pressures. Comparing these responses with the objective index would reveal where measured conditions and lived experience align or diverge; the same survey could also support participatory AHP weights derived separately for residents, experts, and municipal stakeholders. Stratifying the results by neighborhood, age, mobility, and household type would reduce the risk that average preferences mask vulnerable groups. Repeating the objective and subjective measurements before and after interventions would transform the framework from a diagnostic map into a monitoring tool.
5. Conclusions
Urban QoL in Zakynthos is not uniform. The final surface shows a clear contrast between the densely developed center and southwest and the greener coastal and northern parts of the city. Moderate QoL covered the largest share of the study area, while low and very low conditions together accounted for 41.24%. Very high QoL was rare, at 3.12%. The maps also explain these differences. The center has the highest concentration of services and everyday destinations, yet it is also affected by dense construction, high summer temperatures, impervious surfaces, traffic, and limited recreational space. Higher scores appear where several favorable conditions coincide rather than where a single criterion performs well. Beyond these local findings, the study integrates heterogeneous objective indicators on a common fine-scale grid and links individual criteria to neighborhood-level intervention priorities using an approach that can be reproduced and adapted to other small coastal municipalities. AHP made the weighting decisions explicit; however, the qualitative assessment indicates that alternative priorities would most affect locations near class thresholds, and a quantitative raster-based sensitivity analysis remains necessary.
For municipal planning, the priority areas are the central and southwestern neighborhoods. Relevant measures include street vegetation, pocket parks, permeable surfaces, safer pedestrian and cycling links, improved public transportation, traffic calming, and a better distribution of playgrounds and recreational facilities. These measures cannot eliminate all coast–interior differences, but they could reduce concentrated environmental burdens in densely populated areas. Future versions should incorporate measured noise, improved population estimates, and seasonal comparisons, and combine them with the geocoded resident survey and participatory weighting described above. This integration would provide a more comprehensive account of urban QoL and support the evaluation of interventions over time.
Author Contributions
Conceptualization, S.P. and K.P.; methodology, S.P. and K.P.; software, formal analysis, investigation, data curation, visualization, and writing—original draft preparation, S.P.; validation, K.K., P.S.A., and K.P.; writing—review and editing, K.K., P.S.A., and K.P.; supervision and project administration, K.P. All authors have read and agreed to the published version of the manuscript.
Funding
This research received no external funding.
Institutional Review Board Statement
Not applicable.
Informed Consent Statement
Not applicable.
Data Availability Statement
Public satellite and land-monitoring data were obtained from Copernicus, USGS/Google Earth Engine, and VIIRS collections; OpenStreetMap supported selected infrastructure and road-network layers. Intermediate geospatial products are available from the corresponding author upon reasonable request.
Acknowledgments
ChatGPT (OpenAI; https://chatgpt.com/ (accessed on 10 October 2026))was used for English-language editing and to improve selected parts of the text. The authors reviewed and revised the resulting text and take full responsibility for the final content of the manuscript.
Conflicts of Interest
The authors declare no conflicts of interest.
References
- Banzhaf, E.; de la Barrera, F.; Kindler, A.; Reyes-Paecke, S.; Schlink, U.; Welz, J.; Kabisch, S. A Conceptual Framework for Integrated Analysis of Environmental Quality and Quality of Life. Ecol. Indic. 2014, 45, 664–668. [Google Scholar] [CrossRef] [Scilit]
- Mittal, S.; Chadchan, J.; Mishra, S.K. Review of Concepts, Tools and Indices for the Assessment of Urban Quality of Life. Soc. Indic. Res. 2020, 149, 187–214. [Google Scholar] [CrossRef] [Scilit]
- D’Acci, L. Monetary, Subjective and Quantitative Approaches to Assess Urban Quality of Life and Pleasantness in Cities (Hedonic Price, Willingness-to-Pay, Positional Value, Life Satisfaction, Isobenefit Lines). Soc. Indic. Res. 2014, 115, 531–559. [Google Scholar] [CrossRef] [Scilit]
- Saeed, U.; Ahmad, S.R.; Mohey-ud-din, G.; Butt, H.J.; Ashraf, U. An Integrated Approach for Developing an Urban Livability Composite Index—A Cities’ Ranking Road Map to Achieve Urban Sustainability. Sustainability 2022, 14, 8755. [Google Scholar] [CrossRef] [Scilit]
- Faka, A.; Kalogeropoulos, K.; Maloutas, T.; Chalkias, C. Urban Quality of Life: Spatial Modeling and Indexing in Athens Metropolitan Area, Greece. IJGI 2021, 10, 347. [Google Scholar] [CrossRef] [Scilit]
- Faka, A.; Kalogeropoulos, K.; Maloutas, T.; Chalkias, C. Spatial Variability and Clustering of Quality of Life at Local Level: A Geographical Analysis in Athens, Greece. IJGI 2022, 11, 276. [Google Scholar] [CrossRef] [Scilit]
- Dobrowolska, E.; Kopczewska, K. Mapping Urban Well-Being with Quality of Life Index (QOLI) at the Fine-Scale of Grid Data. Sci. Rep. 2024, 14, 9680. [Google Scholar] [CrossRef] [Scilit] [PubMed]
- Rinner, C. A Geographic Visualization Approach to Multi-criteria Evaluation of Urban Quality of Life. Int. J. Geogr. Inf. Sci. 2007, 21, 907–919. [Google Scholar] [CrossRef] [Scilit]
- Zhang, Y.; Li, Q.; Wang, H.; Du, X.; Huang, H. Community Scale Livability Evaluation Integrating Remote Sensing, Surface Observation and Geospatial Big Data. Int. J. Appl. Earth Obs. Geoinf. 2019, 80, 173–186. [Google Scholar] [CrossRef] [Scilit]
- Joseph, M.; Wang, F.; Wang, L. GIS-Based Assessment of Urban Environmental Quality in Port-au-Prince, Haiti. Habitat Int. 2014, 41, 33–40. [Google Scholar] [CrossRef] [Scilit]
- Kazemzadeh-Zow, A.; Darvishi Boloorani, A.; Samany, N.N.; Toomanian, A.; Pourahmad, A. Spatiotemporal Modelling of Urban Quality of Life (UQOL) Using Satellite Images and GIS. Int. J. Remote Sens. 2018, 39, 6095–6116. [Google Scholar] [CrossRef] [Scilit]
- Vakilipour, S.; Sadeghi-Niaraki, A.; Ghodousi, M.; Choi, S.-M. Comparison between Multi-Criteria Decision-Making Methods and Evaluating the Quality of Life at Different Spatial Levels. Sustainability 2021, 13, 4067. [Google Scholar] [CrossRef] [Scilit]
- Prakash, M.; Shukla, R.; Chakraborty, A.; Joshi, P.K. Multi-Criteria Approach to Geographically Visualize the Quality of Life in India. Int. J. Sustain. Dev. World Ecol. 2016, 23, 469–481. [Google Scholar] [CrossRef] [Scilit]
- Dissanayake, D.; Morimoto, T.; Murayama, Y.; Ranagalage, M.; Perera, E. Analysis of Life Quality in a Tropical Mountain City Using a Multi-Criteria Geospatial Technique: A Case Study of Kandy City, Sri Lanka. Sustainability 2020, 12, 2918. [Google Scholar] [CrossRef] [Scilit]
- Abd El Karim, A.; Awawdeh, M.M. Integrating GIS Accessibility and Location-Allocation Models with Multicriteria Decision Analysis for Evaluating Quality of Life in Buraidah City, KSA. Sustainability 2020, 12, 1412. [Google Scholar] [CrossRef] [Scilit]
- Dadashpoor, H.; Rostami, F.; Alizadeh, B. Is Inequality in the Distribution of Urban Facilities Inequitable? Exploring a Method for Identifying Spatial Inequity in an Iranian City. Cities 2016, 52, 159–172. [Google Scholar] [CrossRef] [Scilit]
- Mukherjee, K.; Mondal, D. Spatial Equity in Urban Facility Versus Residents’ Satisfaction: Challenge for the Unplanned Cities—A Case Study of Barasat City, India. GeoJournal 2022, 87, 931–949. [Google Scholar] [CrossRef] [Scilit]
- Saaty, T.L. Decision Making with the Analytic Hierarchy Process. IJSSCI 2008, 1, 83. [Google Scholar] [CrossRef] [Scilit]
- Şahin Körmeçli, P.; Seçkin Gündoğan, G. Assessment of Vegetation Change Using NDVI, LST, and Carbon Analyses in Çankırı Karatekin University, Turkey. Environ. Monit. Assess. 2024, 196, 331. [Google Scholar] [CrossRef] [Scilit] [PubMed]
- White, M.P.; Alcock, I.; Wheeler, B.W.; Depledge, M.H. Coastal Proximity, Health and Well-Being: Results from a Longitudinal Panel Survey. Health Place 2013, 23, 97–103. [Google Scholar] [CrossRef] [Scilit] [PubMed]
- Tsiourlis, G.; Konstantinidis, P.; Xofis, P. Taxonomy and Ecology of Phryganic Communities with Sarcopoterium spinosum (L.) Spach of the Aegean (Greece). Isr. J. Plant Sci. 2007, 55, 15–34. [Google Scholar] [CrossRef] [Scilit]
- Dehimi, S. The Use of New Techniques in Spatial Modeling and Analysis of Urban Quality of Life: Multiple-Criteria Decision Analysis and GIS. Geoj. Tour. Geosites 2021, 35, 355–363. [Google Scholar] [CrossRef] [Scilit]
- Zhalehdoost, A.; Taleai, M. Enhancing Urban Quality of Life Evaluation Using Spatial Multi Criteria Analysis. Sci. Rep. 2025, 15, 22048. [Google Scholar] [CrossRef] [Scilit] [PubMed]
- Salavati, S.M.; Janalipour, M.; Abbaszadeh, T.N. Measuring the Environmental Quality of Life Using Remote Sensing Products and Fuzzy Analytic Hierarchy Process (Case Study: Mashhad City). Remote Sens. Earth Syst. Sci. 2025, 8, 273–282. [Google Scholar] [CrossRef] [Scilit]
- Hellenic Statistical Authority (ELSTAT). Results of the 2021 Population and Housing Census: Resident Population by Municipal Community; Hellenic Statistical Authority (ELSTAT): Piraeus, Greece, 2023. [Google Scholar]
- Aksoy, E.; Korkmaz-Yaylagul, N. Assessing Liveable Cities for Older People in an Urban District in Turkey Using the Analytical Hierarchy Process. Urban Plan. 2019, 4, 83–95. [Google Scholar] [CrossRef] [Scilit]
- Aksu, G.A.; Küçük, N. Evaluation of Urban Topography–Biotope–Population Density Relations for Istanbul–Beşiktaş Urban Landscape Using AHP. Environ. Dev. Sustain. 2020, 22, 733–758. [Google Scholar] [CrossRef] [Scilit]
Disclaimer/Publisher’s Note: The statements, opinions and data contained in all publications are solely those of the individual author(s) and contributor(s) and not of MDPI and/or the editor(s). MDPI and/or the editor(s) disclaim responsibility for any injury to people or property resulting from any ideas, methods, instructions or products referred to in the content. |
© 2026 by the authors. Licensee MDPI, Basel, Switzerland. This article is an open access article distributed under the terms and conditions of the Creative Commons Attribution (CC BY) license.