


Abstract
The electromechanical impedance (EMI) method has been extensively studied for damage detection in structural health monitoring (SHM). The method uses piezoelectric transducers to measure the electromechanical impedance and, as is well known, is highly sensitive to temperature, which alters the properties of both the monitored structure and the transducer. The effects of temperature have been extensively studied in recent years. Studies reported in the literature typically conduct experimental analyses with test specimens under uniform temperature distribution obtained using controlled chambers. However, in real-world applications where the environment is not controlled, the monitored structure may exhibit a non-uniform temperature distribution. Therefore, this paper presents a comparative experimental analysis of the impacts of uniform and non-uniform temperature distributions on the monitored structure. Tests were conducted on a carbon fiber-reinforced polymer (CFRP) plate as a test specimen under different temperature distributions. The test specimen was heated using a heat gun, and the temperature distribution was measured and controlled with a thermal camera. A piezoelectric transducer was attached to the test specimen, and the electromechanical impedance was obtained using a measurement system based on a data acquisition (DAQ) device. The effects of uniform and non-uniform temperature distributions were analyzed by observing the impedance signatures and quantified using damage indices. The results show that non-uniform temperature distribution can reduce the effectiveness of compensation techniques and hinder the correct diagnosis of the monitored structure.
1. Introduction
The electromechanical impedance (EMI) method has been extensively studied in recent years for damage detection in structural health monitoring (SHM), enabling the monitoring of various types of engineering structures and the detection of incipient structural damage before it becomes a serious problem [1]. Among the various types of structures that can be monitored, carbon fiber-reinforced polymer (CFRP) structures have received attention in recent research [2] and are the focus of the current study.
The principle of the EMI method consists of attaching a piezoelectric transducer, typically a thin lead zirconate titanate (PZT) ceramic, to the structure being monitored and measuring its electrical impedance using an impedance analyzer or another alternative measurement system. Due to the piezoelectric effect, a relationship is established between the mechanical impedance of the structure and the electrical impedance of the transducer, allowing the structural integrity to be analyzed via the transducer’s electrical impedance [3].
Although the EMI method has been extensively researched, certain practical issues have hindered its application to real-world structures, with the effect of temperature variation considered one of the most critical problems [4,5]. Temperature variation alters the properties of both the transducer and the structure, resulting in amplitude and frequency shifts in the impedance signatures, which can lead to an incorrect diagnosis of the monitored structure. Many techniques for compensating for temperature effects have been proposed in the literature [5]. One of the simplest and most generally applicable is effective frequency shifting (EFS) [6], which is used as a reference in the present study. These compensation techniques are typically tested in laboratories where the temperature of the monitored structure is uniformly distributed and controlled. However, in real-world applications and uncontrolled environments, the monitored structure may exhibit a non-uniform temperature distribution. Such non-uniform temperature distribution can be caused, for example, by the proximity of intermittent heat sources.
Therefore, this paper presents an experimental analysis of the effects of non-uniform temperature distribution on the EMI method, a problem that has received little attention in the literature. The analysis is similar to that presented in a previous study by Barnabé and Baptista [7] on aluminum structures, whereas the current study analyzes a CFRP structure. According to the experimental results obtained, the non-uniform temperature distribution causes changes in impedance signatures different from those observed in a uniform temperature distribution, which may reduce the effectiveness in detecting structural damage. Therefore, this study expands on lab-based uniform temperature tests by addressing real-world non-uniform conditions.
The remainder of this paper is organized as follows: Section 2 presents the principle of the EMI method and the effects of temperature; Section 3 presents the methodology used in the experimental tests; the results are presented and discussed in Section 4; and the conclusions drawn from the study are presented in Section 5.
2. EMI Method and Temperature Effects
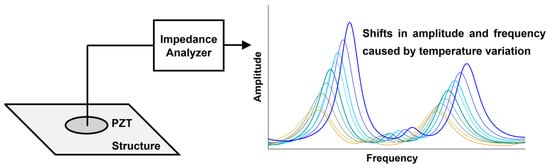
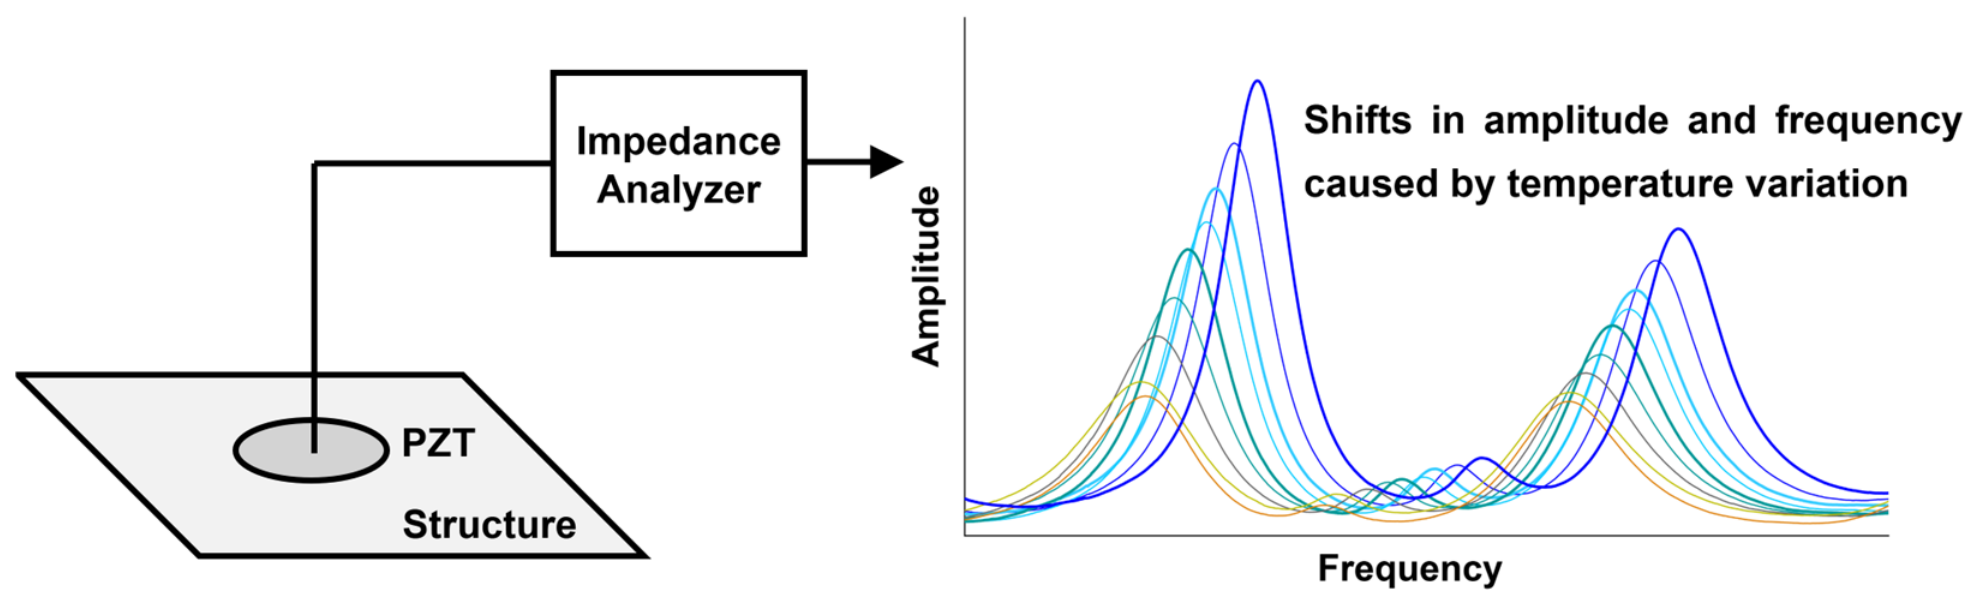
The principle of the EMI method is shown in Figure 1, where a PZT transducer is attached to the monitored structure and its electrical impedance is obtained using an impedance analyzer.
Figure 1.
Principle of the EMI method. The figure also illustrates shifts in amplitude and frequency in the impedance curves due to temperature variation.
The impedance analyzer excites the transducer while reading its electrical impedance. Therefore, the transducer operates simultaneously as an actuator and a sensor in the EMI method. Due to the piezoelectric effect, a relationship is established between the mechanical impedance of the structure and the electrical impedance of the transducer, resulting in resonance peaks in the impedance signatures that are primarily related to the structure’s natural frequencies. Thus, the structural integrity can be monitored by measuring and analyzing the transducer’s electrical impedance. Structural damage, such as cracks and corrosion, alters the structure’s mechanical impedance, which in turn shifts the resonance peaks of the transducer’s electrical impedance. Damage detection is typically performed using damage indices, which are statistical metrics employed to compare two impedance signatures, with one signature obtained from the structure in a condition considered healthy and used as a baseline.
A critical practical problem that has hindered the application of the EMI method to real structures is temperature variation. Both the structure and the piezoelectric transducer have temperature-sensitive properties [8,9]. As a result, temperature variation causes shifts in amplitude and frequency in the impedance signatures, as illustrated in Figure 1. Despite the shifts in frequency and amplitude, no significant changes are observed in the shape of the impedance signatures; that is, the number of resonance peaks within a certain frequency range, as well as the relative amplitude between them, remains unchanged.
Based on this result, in which the signature shape remains unchanged, many techniques for compensating for temperature effects have been proposed, and their effectiveness has been validated in experimental tests [5]. Laboratory tests are typically conducted with the monitored structure’s temperature controlled within chambers, where a uniform temperature distribution is achieved, that is, the same temperature throughout the structure. However, based on tests from a previous study by Barnabé and Baptista [7] on aluminum structures and the current study on CFRP structures, when the temperature distribution is non-uniform and exhibits hot spots, impedance signatures undergo changes similar to those caused by structural damage, which can reduce the effectiveness of certain compensation techniques. The experimental setup used in this study to analyze the effects of non-uniform temperature distribution is presented in the next section.
3. Experimental Setup
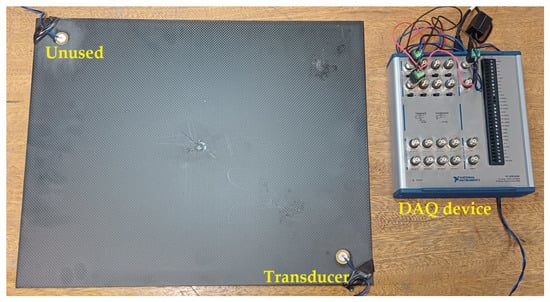
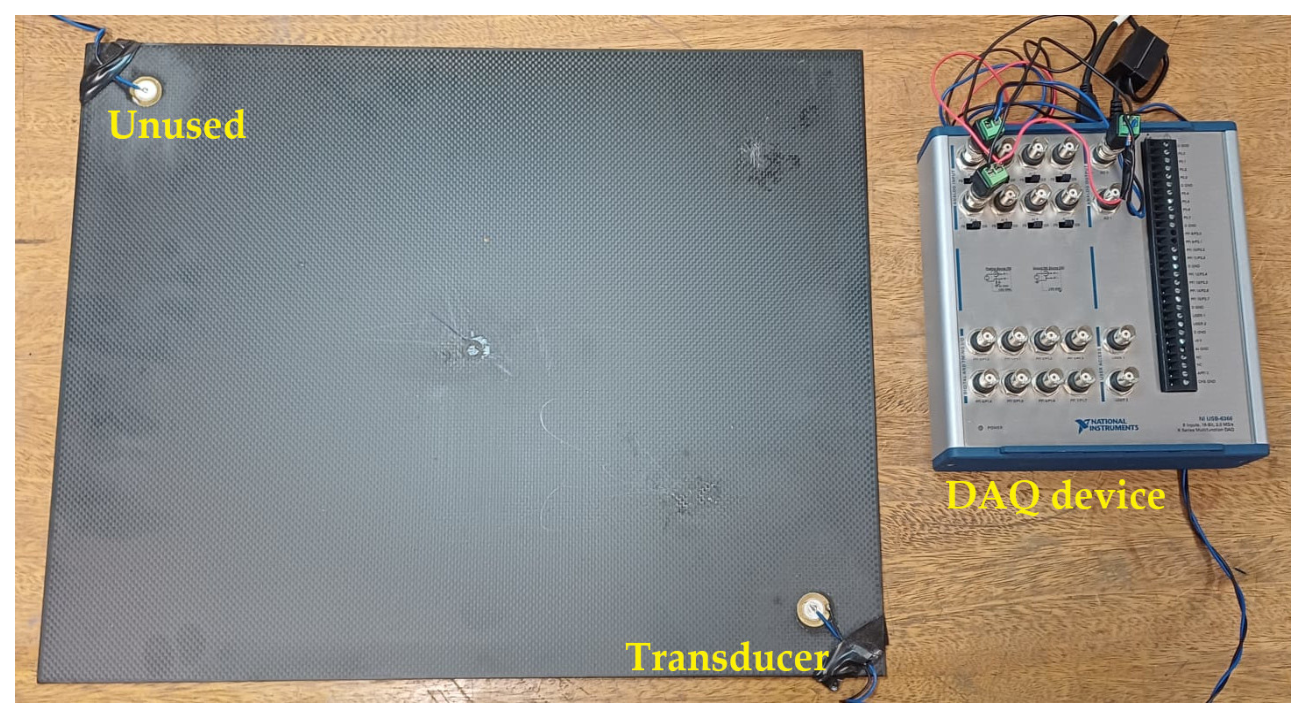
Figure 2 shows the experimental setup used in all tests. Tests were conducted on a 500 mm × 400 mm × 3 mm CFRP plate featuring a plain-weave carbon-fiber fabric with orthogonal 0°/90° fiber orientations. A Murata Manufacturing 7BB-20-6 piezoelectric diaphragm (Murata Manufacturing Co., Ltd., Kyoto, Japan) was attached 50 mm from the bottom-right corner using a cyanoacrylate-based adhesive. The transducer attached to the upper left corner was not used in the current study and remained disconnected throughout all tests to prevent interference with the impedance measurements of the active transducer.
Figure 2.
Experimental setup consisting of a CFRP plate, a piezoelectric transducer, and a DAQ device. The transducer attached to the top-left corner of the plate was not used in the current study.
The electrical impedance of the transducer was obtained using a National Instruments USB-6366 BNC data acquisition (DAQ) device (National Instruments Corporation, Austin, TX, USA) connected to a personal computer and controlled by a MATLAB (R2026a) program, similar to the measurement system proposed by Baptista and Vieira Filho [10]. The transducer was excited with a 5 V chirp signal with a frequency ranging from 0 to 200 kHz. The response signal was sampled at a rate of 2 MSa/s, resulting in impedance signatures with a frequency step of 1 Hz. The CFRP plate was heated using a heat gun for tests with the specimen under uniform and non-uniform temperature distributions. The temperature was measured using a FLIR C2 thermal imaging camera (Teledyne FLIR, Wilsonville, OR, USA), which allowed for both temperature measurement and the assessment of the temperature distribution across the test specimen. The images were processed using FLIR Thermal Studio software (https://www.flir.com/products/flir-thermal-studio-suite/, accessed on 21 October 2026).
To analyze the effects of non-uniform temperature distribution and compare them with uniform temperature distribution, the EFS compensation technique [6] was applied to the impedance signatures. The EFS technique consists of shifting the impedance signature following a temperature change until the maximum correlation coefficient is reached, as follows:
where ZE,T(f) is the electrical impedance of the transducer after the temperature change, f is the frequency, the subscript (i) indicates the current iteration and (i − 1) the previous iteration, and df is the frequency step, which in this study is 1 Hz.
For each frequency shift performed using Equation (1), the correlation coefficient (CC) with respect to the baseline signature is calculated as follows:
where cov is the covariance between the baseline impedance signature (ZE,B(f)) and the signature after temperature variation (ZE,T(f)), and σE,T and σE,B are the standard deviations of the signatures.
The frequency shifts given by Equation (1) are repeated until the maximum correlation coefficient given by Equation (2) is reached, which ideally is CC = 1. When this procedure is completed, the signature is compensated for temperature variation. The influence of uniform and non-uniform temperature distribution on impedance signatures was analyzed qualitatively by observing and comparing the impedance signatures, as well as quantitatively using a damage index. In this study, the correlation coefficient deviation (CCD) [11] was used, which is given by
where CC is the correlation coefficient given by Equation (2). The correlation coefficient (CC) quantifies the similarity between the two impedance signatures. When the signature under analysis is highly similar to the baseline, CC ≈ 1 and, consequently, CCD ≈ 0, indicating that the structure is in a healthy condition.
CCD = 1 − CC
Electrical impedance is complex, and the real part was used in all calculations in this study because it is known to be more sensitive to structural damage [11,12]. During the tests, the CFRP plate was supported on foam blocks to avoid the influence of external vibrations. For all tests, the values presented were obtained from the average of three measurements.
4. Results and Discussion
4.1. Uniform Temperature Distribution
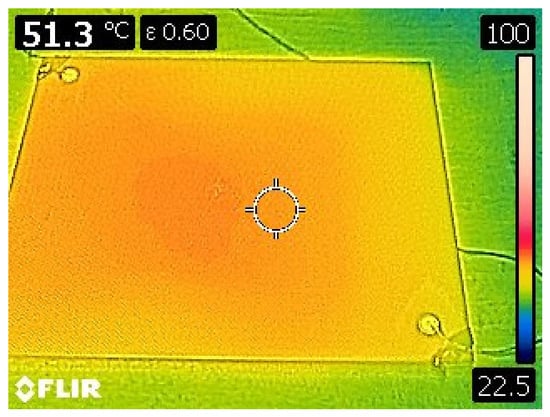
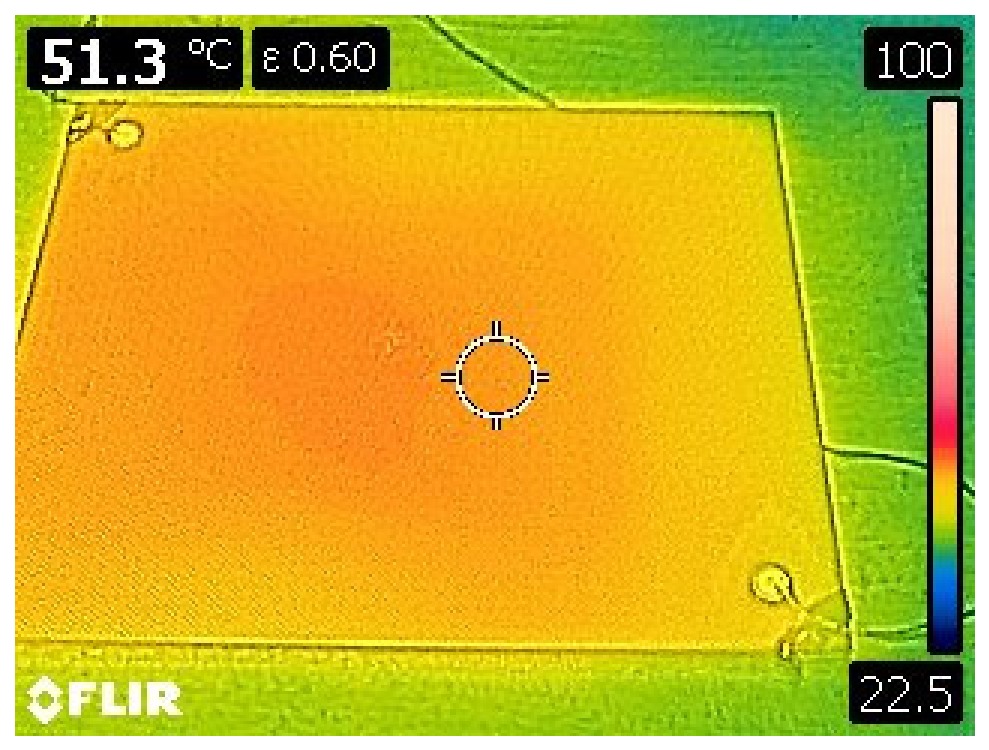
In the first test, the CFRP plate was heated to achieve a uniform temperature distribution of approximately 50 °C. Figure 3 shows the thermal image. Indeed, as observed in the image, the distribution is not perfectly uniform, measuring 51.3 °C at the center of the plate and decreasing slightly near the edges.
Figure 3.
Thermal image of the test specimen under uniform temperature distribution of approximately 50 °C.
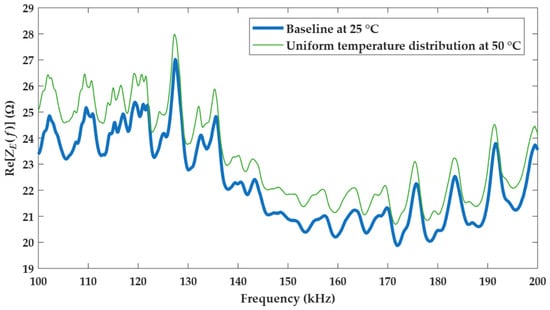
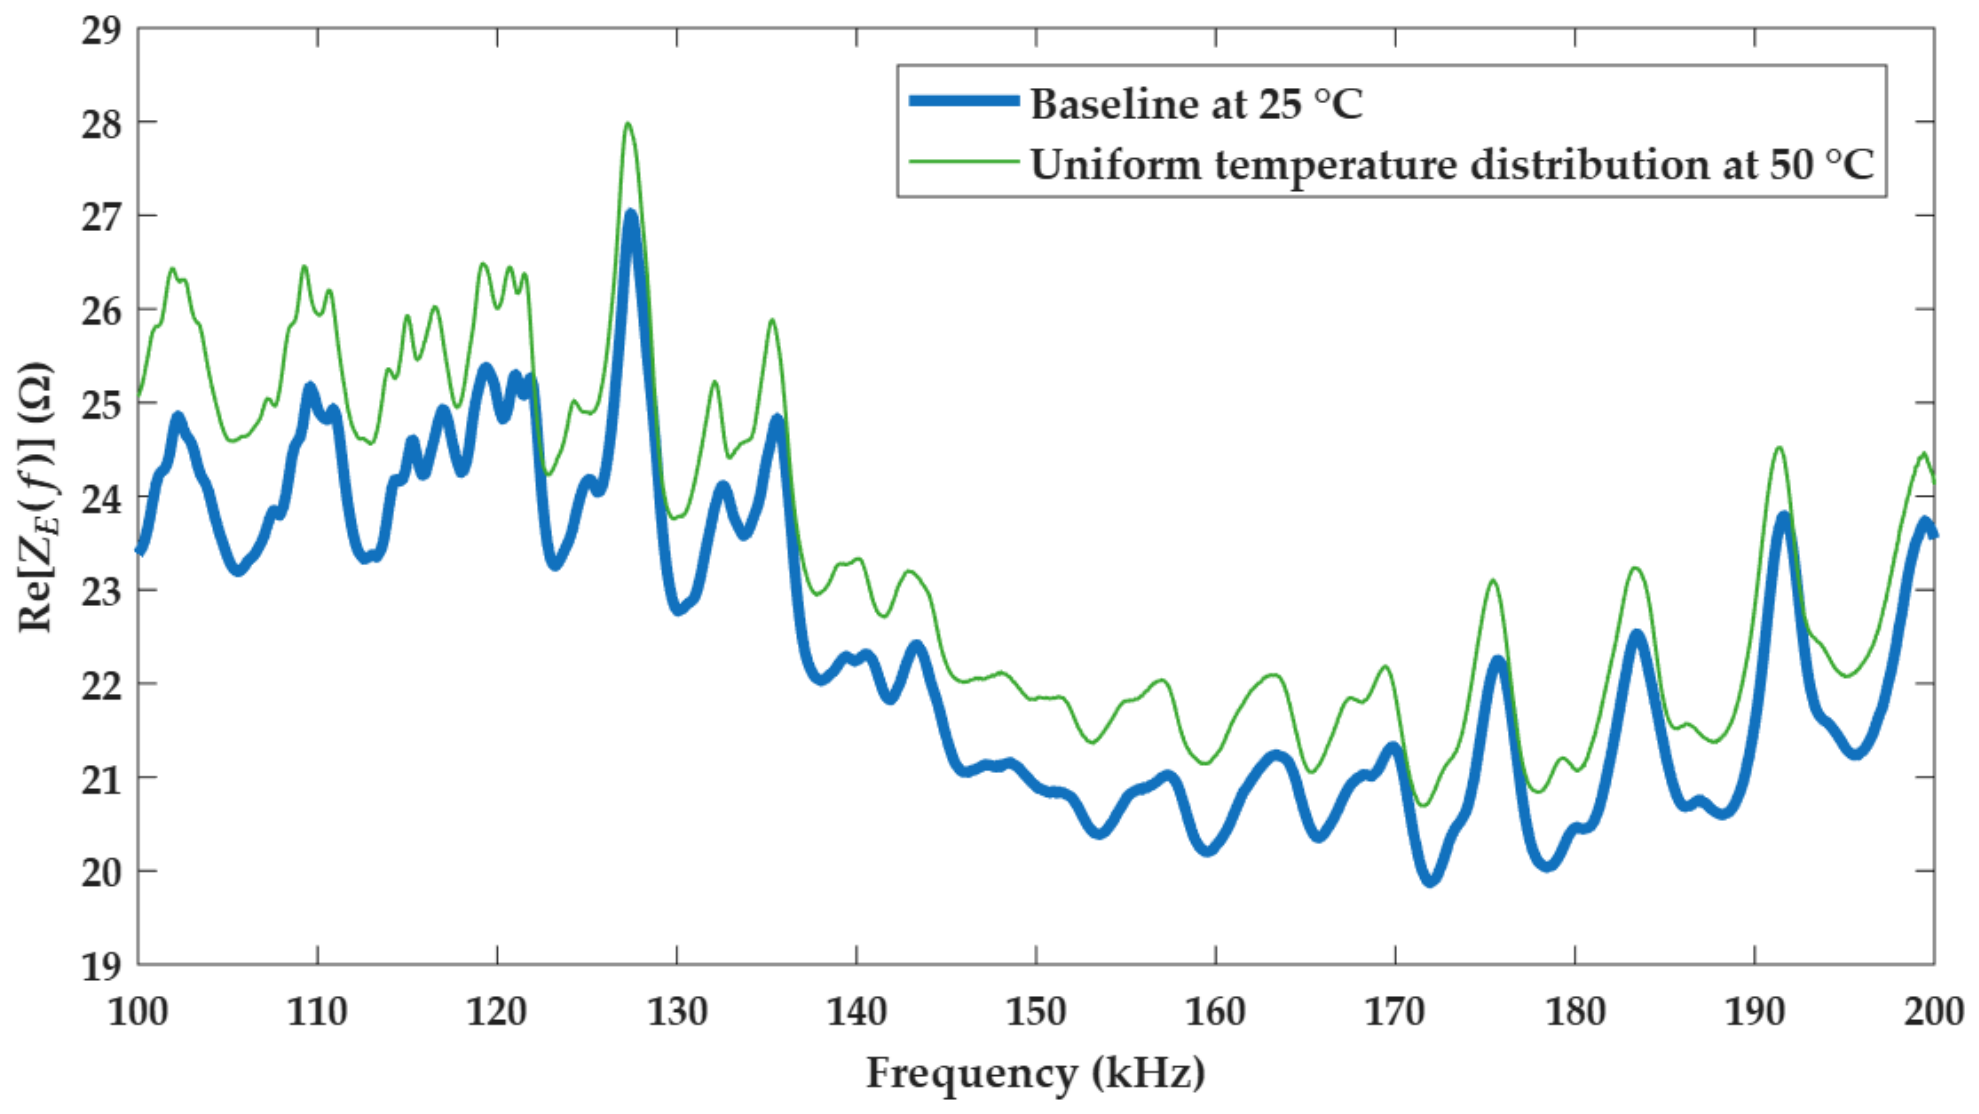
The impedance signature obtained for the plate under uniform temperature distribution, compared to the baseline signature obtained at an ambient temperature of approximately 25 °C, is shown in Figure 4.
Figure 4.
Impedance signatures for the CFRP plate under uniform temperature distribution.
The signatures in Figure 4 represent the real part of the impedance, obtained by averaging three measurements. Although the measurements were conducted over a frequency range of 0 to 200 kHz, the 100 kHz to 200 kHz band is presented here because it exhibited a significant number of resonance peaks. As can be observed, when the temperature distribution is uniform, the impedance signature is uniformly shifted in amplitude and slightly in frequency across the entire frequency range. There is no significant change in the shape of the signature compared to the baseline. Some minor shape alterations are likely due to the temperature distribution not being perfectly uniform.
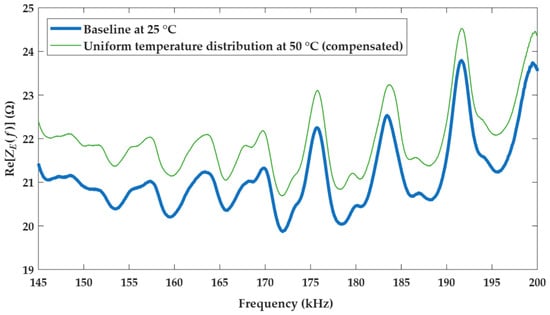
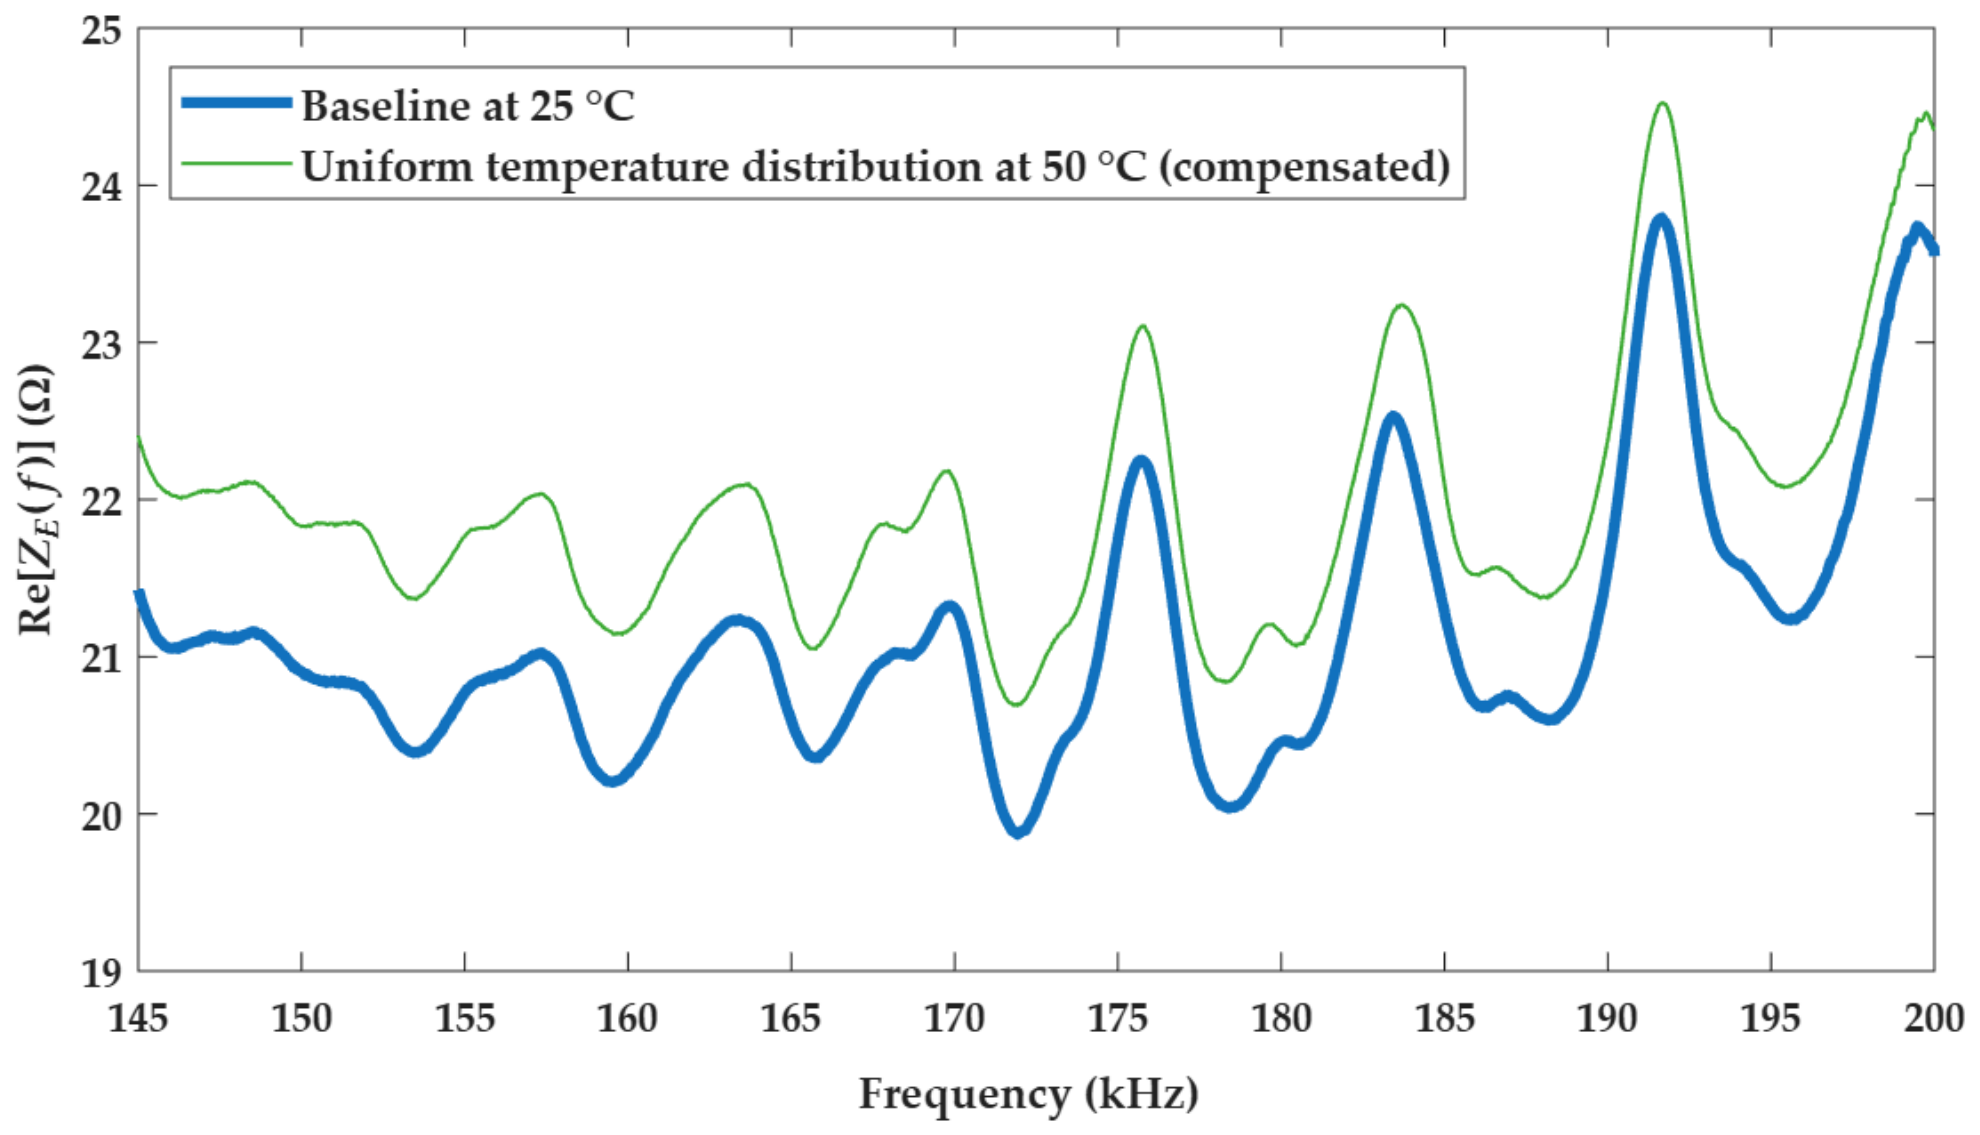
Therefore, the EFS compensation technique can be effectively applied to correct frequency shift. Figure 5 shows the same signatures after compensation. A band from 145 kHz to 200 kHz is displayed to enable proper comparison. Although there is still an amplitude shift between the signatures, the EFS technique effectively corrected the frequency shift by aligning the resonance peaks, resulting in a high correlation between the two signatures. Therefore, a damage index based on the correlation coefficient and insensitive to amplitude differences, such as the CCD index, can be applied for damage detection, yielding low index values for a healthy structure despite temperature variations.
Figure 5.
Impedance signatures for the CFRP plate under uniform temperature distribution compensated by the EFS technique.
However, when the temperature distribution is non-uniform, the shifts in the signatures are also non-uniform, resulting in low correlation, as shown in the following section.
4.2. Non-Uniform Temperature Distribution
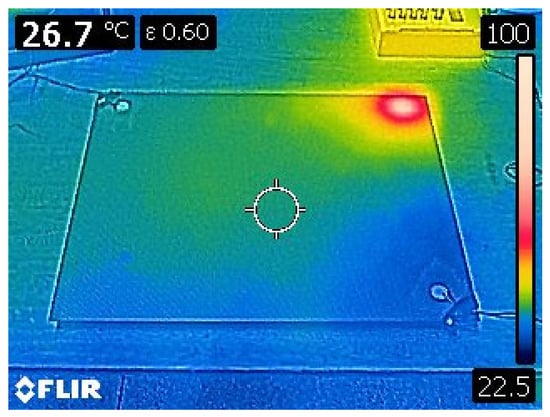
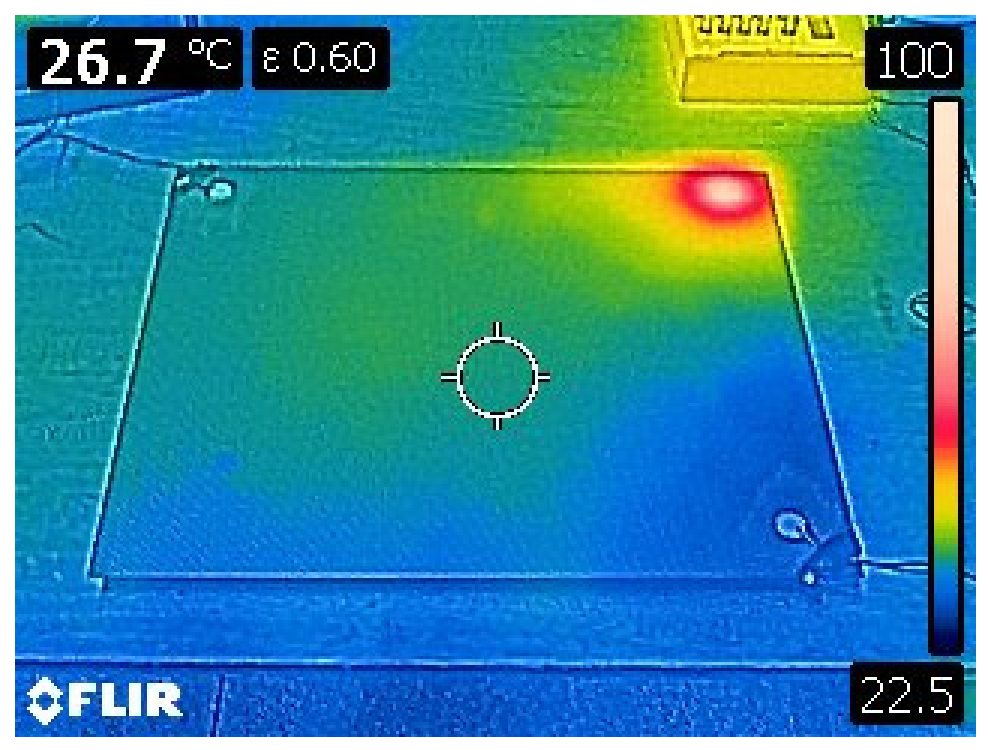
In the second test, only the upper-right corner of the CFRP plate was heated to obtain a non-uniform temperature distribution. Figure 6 shows the thermal image.
Figure 6.
Thermal image of the test specimen under non-uniform temperature distribution, where the upper-right corner was heated to approximately 90 °C.
According to Figure 6, the heated region is approximately circular, with the hottest area measuring approximately 60 mm in diameter and reaching around 90 °C. In the rest of the plate, the temperature is significantly lower, ranging around 26 °C.
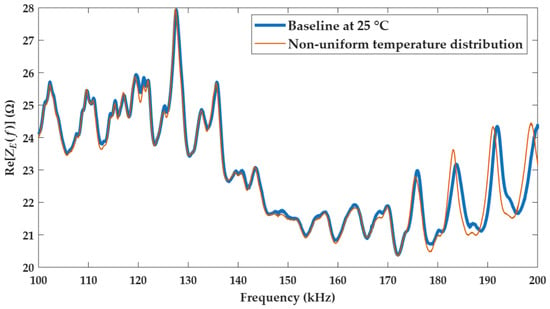
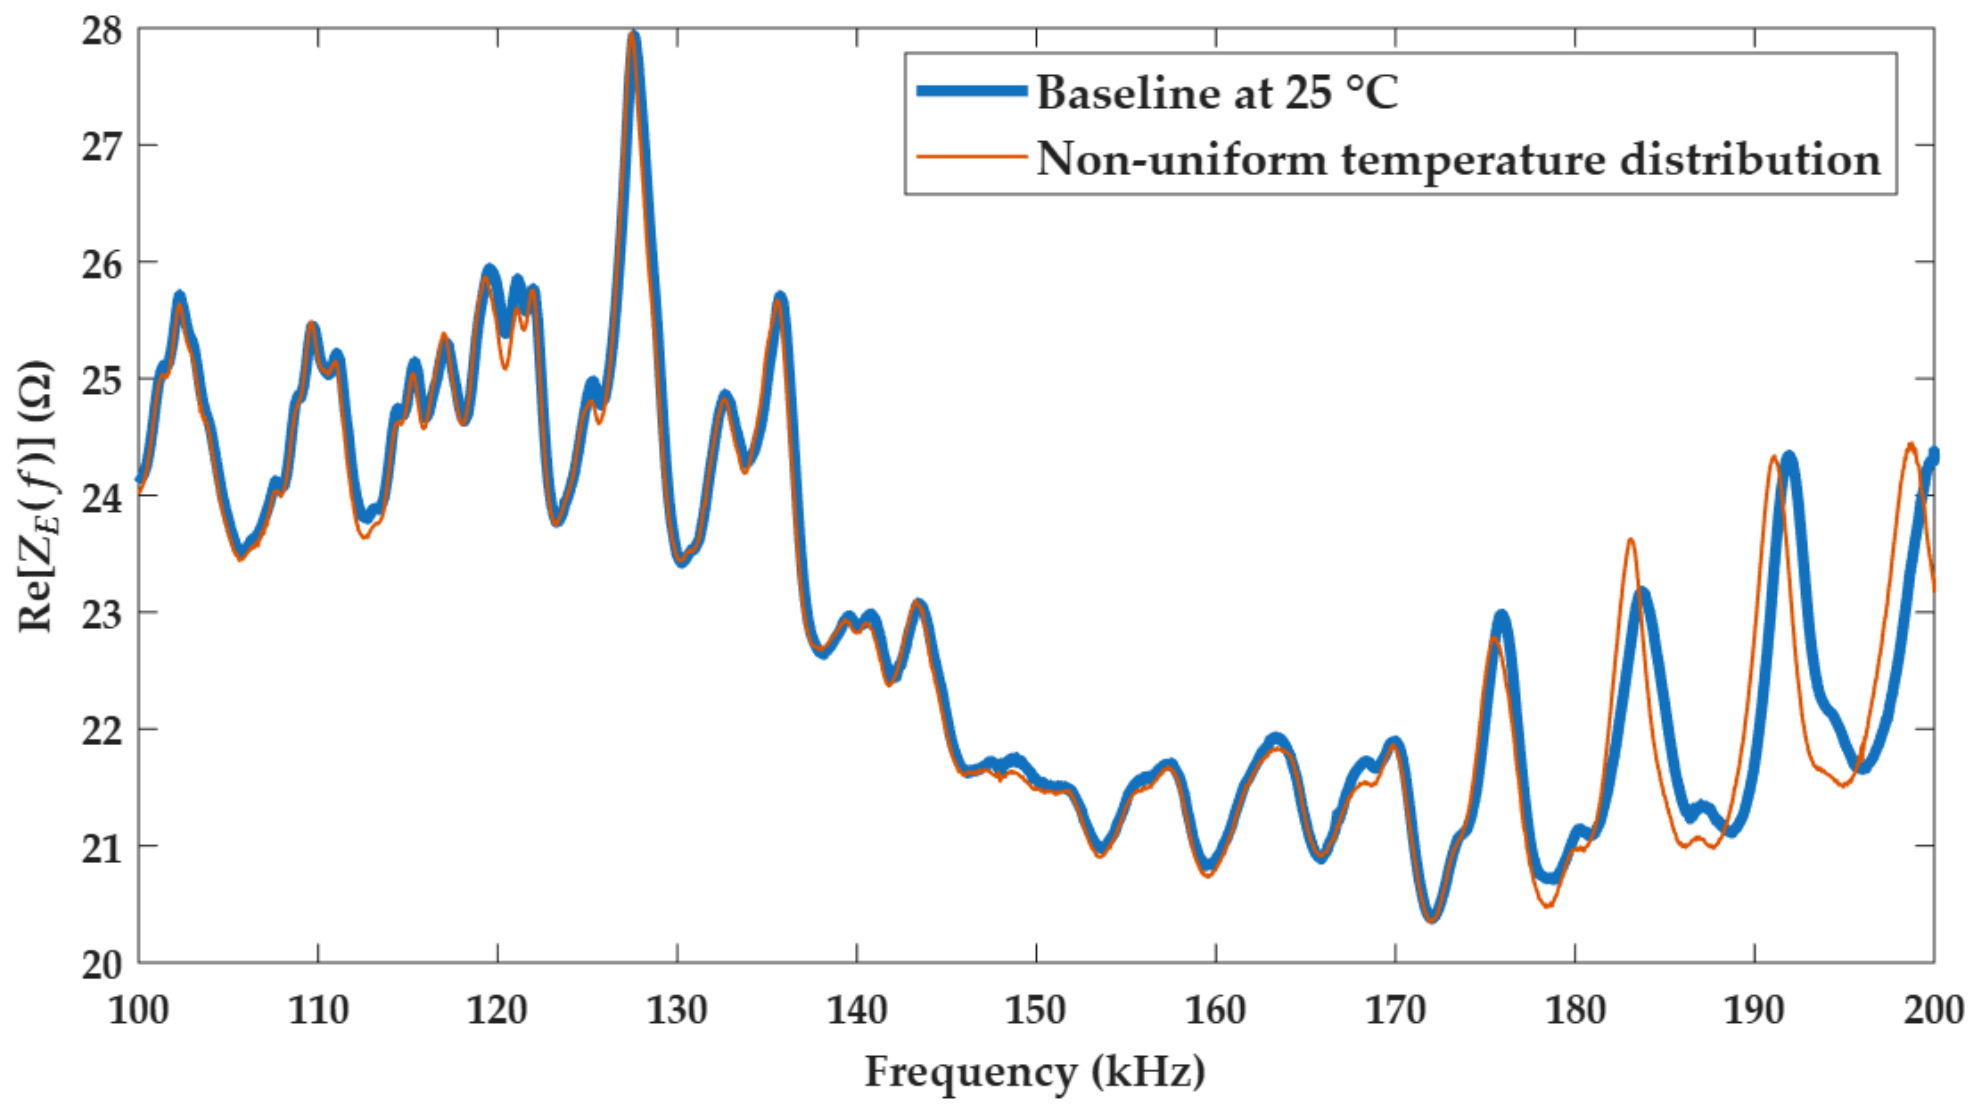
The impedance signature obtained under this condition, compared to the baseline signature, is shown in Figure 7. In contrast to the impedance signature obtained for a uniform temperature distribution shown in Figure 4 where frequency and amplitude shifts are uniform across the entire frequency range, the variations observed in the impedance signature for a non-uniform temperature distribution are random. Although generally smaller, the variations occur more significantly and randomly around certain resonance peaks, which is a pattern similar to variations caused by structural damage. According to Figure 7, the variations are more significant for frequencies above 170 kHz.
Figure 7.
Impedance signatures for the CFRP plate under non-uniform temperature distribution.
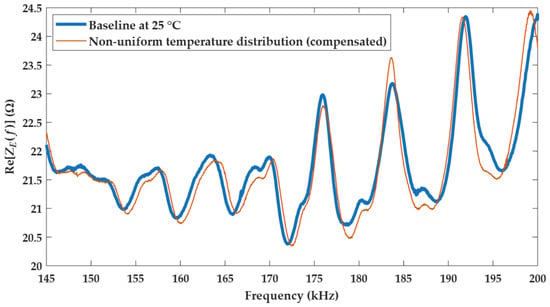
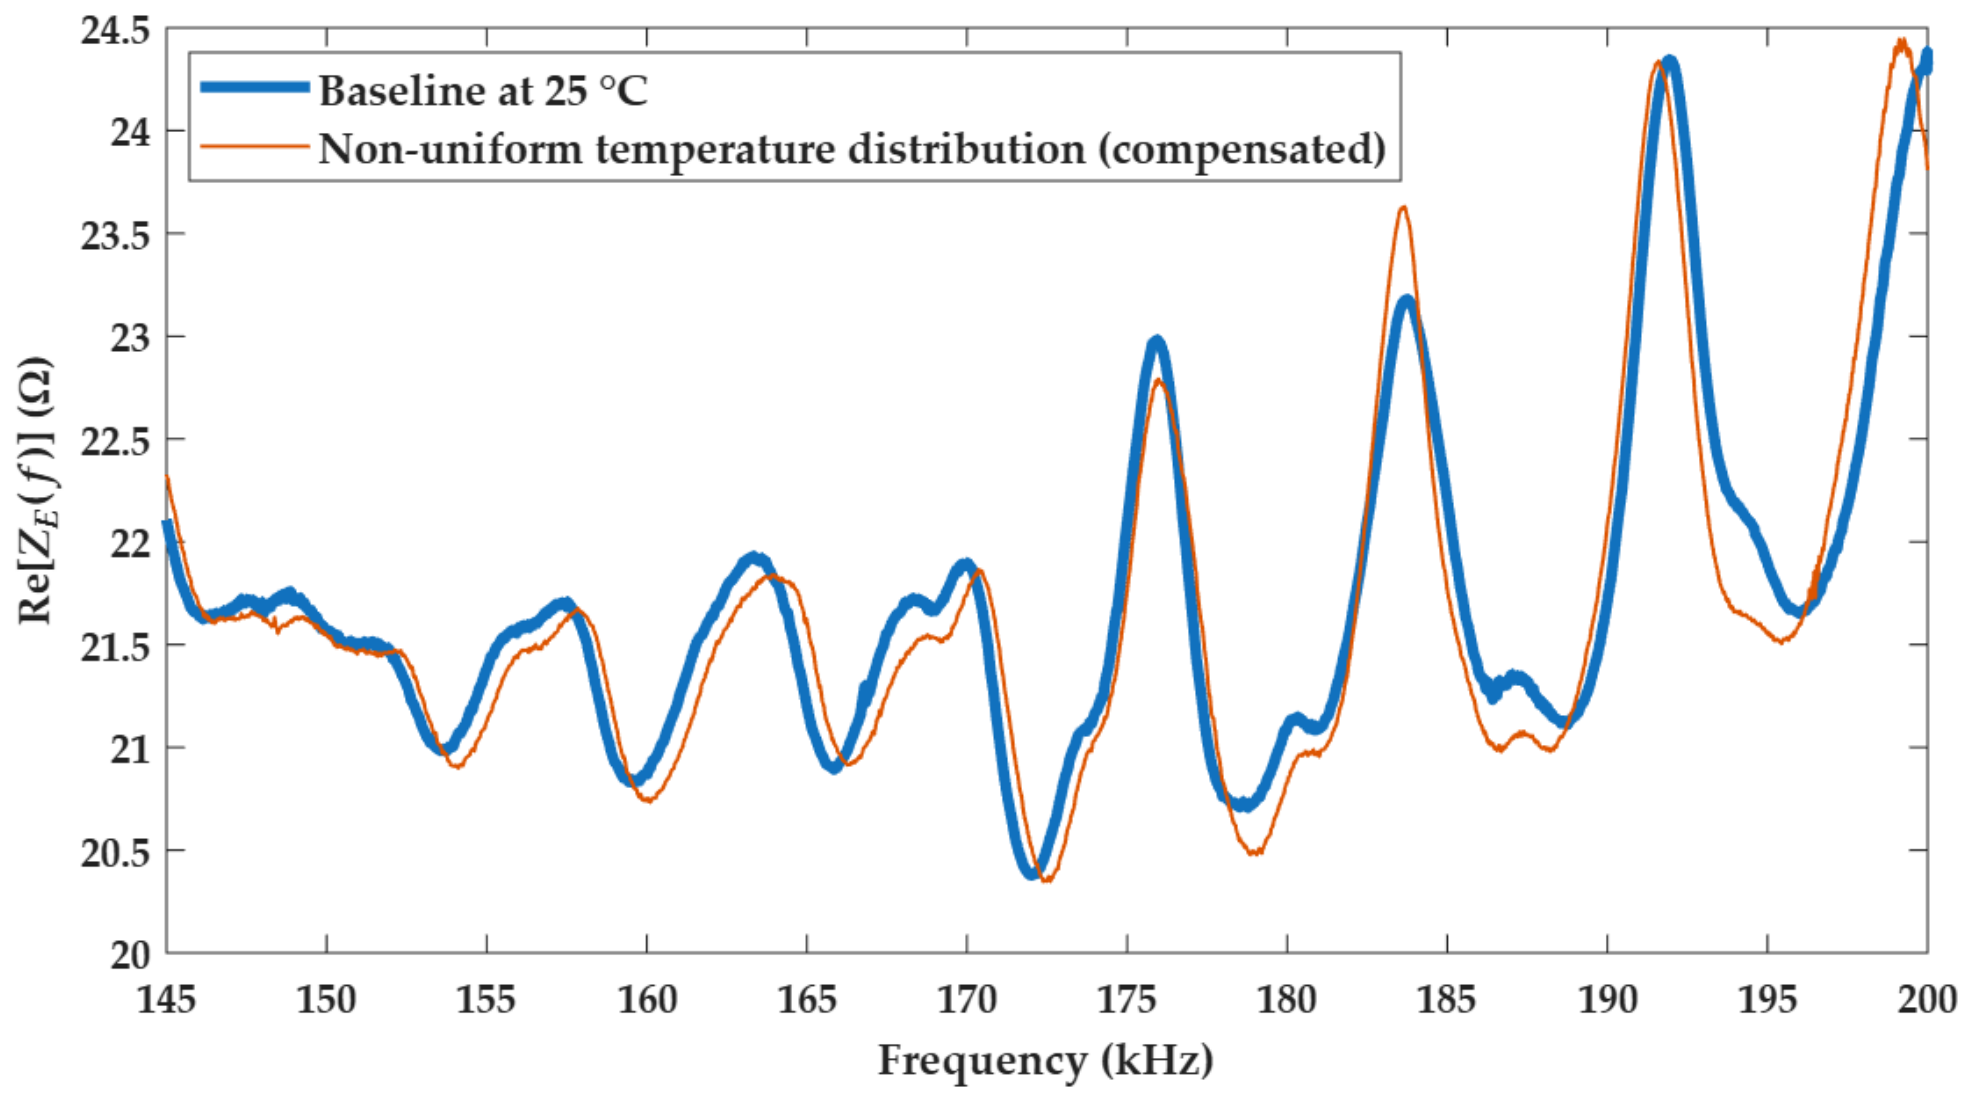
Due to these random variations, the EFS compensation technique is expected to be less effective for non-uniform temperature distribution. Figure 8 shows the compensated signatures, highlighting the 145 kHz to 200 kHz band for comparison with the previous result.
Figure 8.
Impedance signatures for the CFRP plate under non-uniform temperature distribution compensated by the EFS technique.
According to Figure 8, the compensation was not effective, as the resonance peaks are not aligned across the frequency band. The resonance peaks below 170 kHz are shifted to the right, and the peaks above 190 kHz are shifted to the left. Furthermore, there are slight variations in the shape of the signature. The use of a narrow frequency band can improve the performance of the EFS technique, especially for frequencies below 170 kHz. Conversely, narrow bands may reduce the effectiveness of structural damage detection.
4.3. Influence on Damage Indices
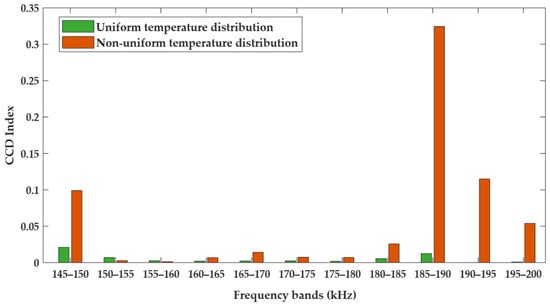
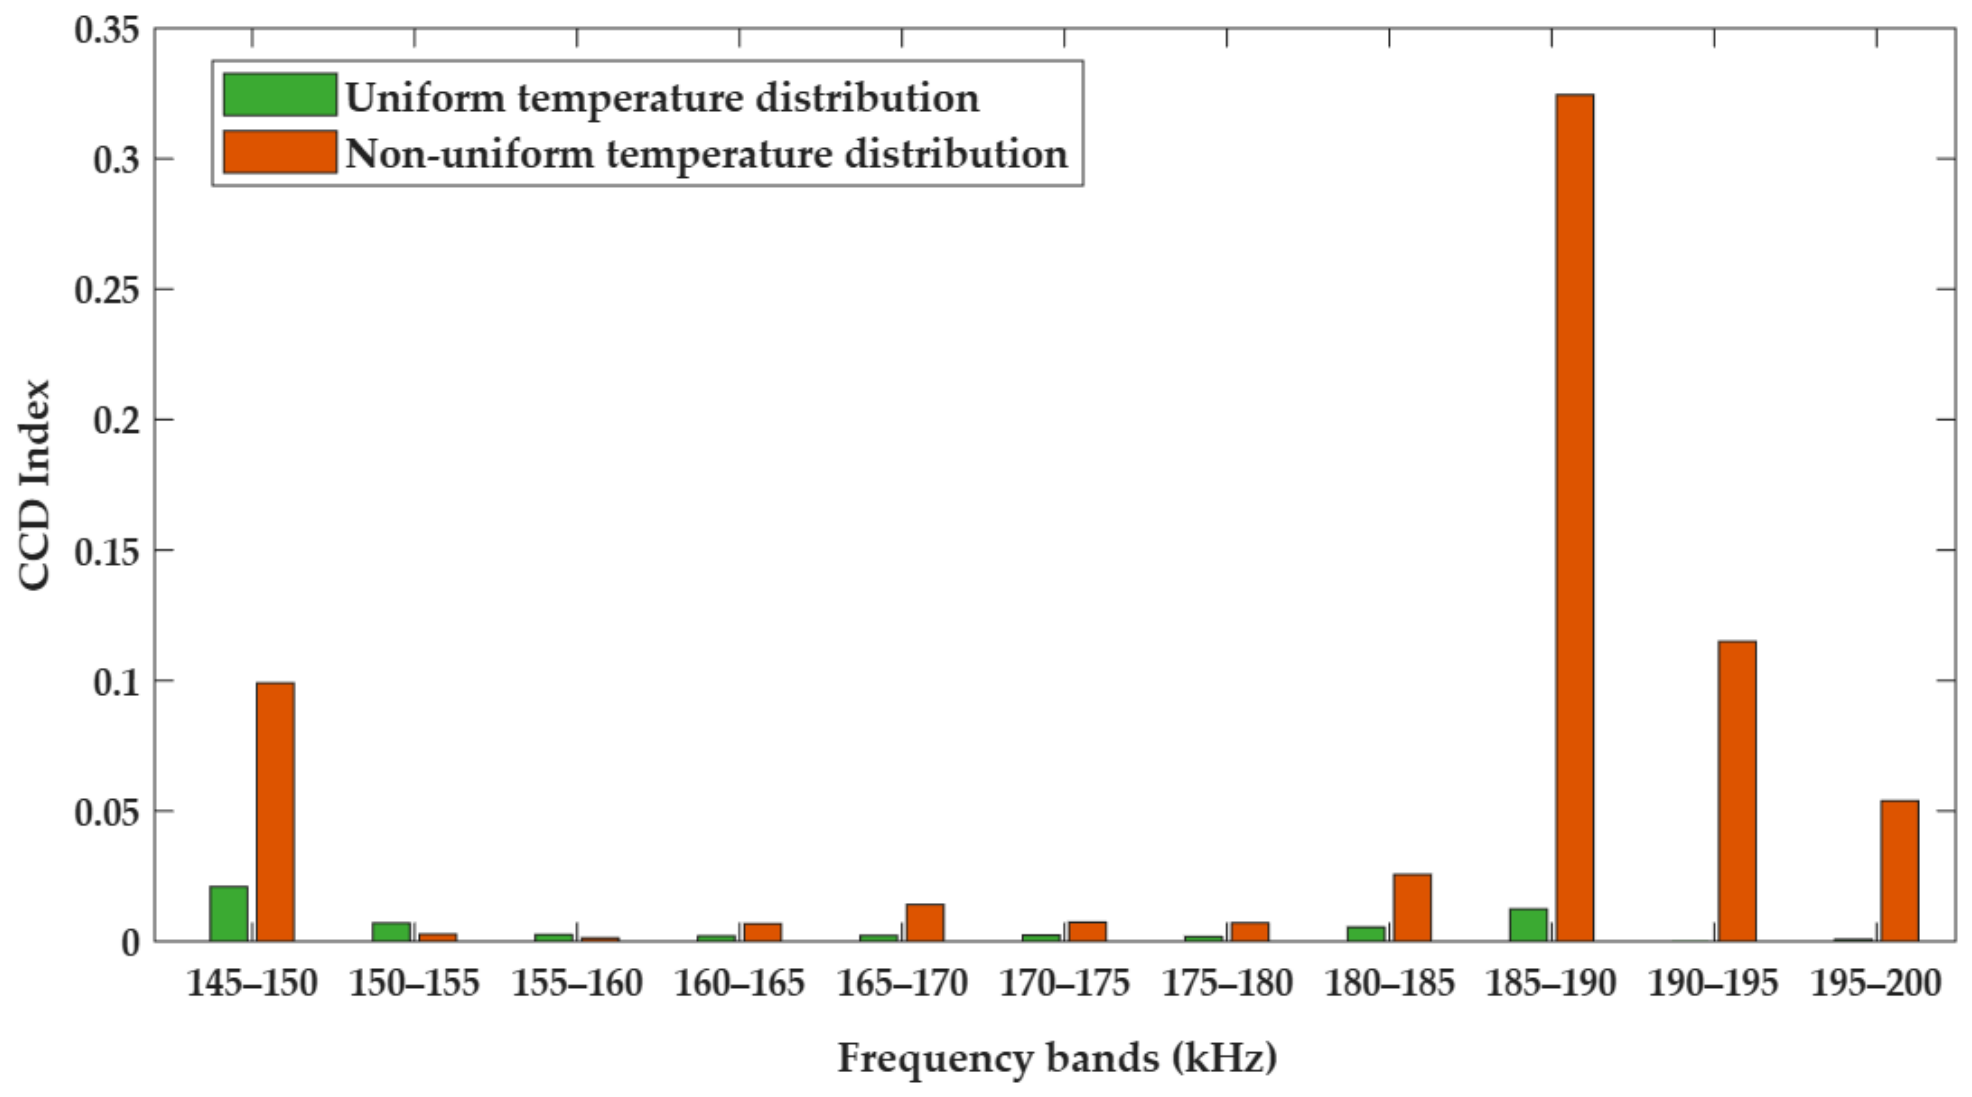
The reduced effectiveness of the EFS compensation technique for the structure under non-uniform temperature distribution can affect the damage indices. Figure 9 shows the CCD indices calculated using Equation (3) for the two temperature distribution conditions after compensation using the EFS technique.
Figure 9.
CCD indices obtained for the two temperature distribution conditions.
The CCD index was calculated in 5 kHz bands, and the 145 kHz to 200 kHz range is displayed for comparison with the compensated impedance signatures in Figure 5 and Figure 8. Except for the 150–155 kHz and 155–160 kHz bands where the index values obtained for the uniform temperature distribution were higher than those for the non-uniform temperature distribution, the indices for the non-uniform temperature distribution were significantly higher than those for the uniform temperature distribution in the other bands.
For example, for the 185–190 kHz band, the index for the non-uniform temperature distribution was approximately 0.32, whereas the index obtained for the uniform temperature distribution was only approximately 0.01. For other bands, the difference is also significant. This result shows that damage detection, especially of incipient damage, can be difficult in real structures subjected to non-uniform temperature distribution.
5. Conclusions
This article presents an experimental analysis of the influence of the non-uniform temperature distribution of a CFRP plate on the EMI method for structural damage detection. This topic remains relatively underexplored in the literature and warrants further attention regarding the application of the EMI method to real-world structures.
The results indicate that the variations in impedance signatures caused by non-uniform temperature distribution are different from those caused by uniform temperature distribution, being similar to those caused by structural damage. Consequently, it becomes difficult to distinguish temperature effects from structural damage, even when applying the compensation technique based on the EFS method tested in this study. Variations in impedance signatures were quantified using the CCD damage index after applying the EFS compensation technique. The influence of non-uniform temperature distribution on the indices was significant, exceeding 3000% the index obtained for uniform temperature distribution in some frequency bands.
It is important to note that this is an initial experimental study, where only one structure and one compensation technique were evaluated. The authors hope that the reported results may motivate future research with other compensation techniques and structures under non-uniform temperature distribution.
Author Contributions
Conceptualization, F.B. (Felipe Barnabé); methodology, F.B. (Felipe Barnabé); software, F.B. (Felipe Barnabé); validation, F.B. (Fabricio Baptista) and F.B. (Felipe Barnabé); formal analysis, F.B. (Felipe Barnabé); investigation, F.B. (Felipe Barnabé); resources, F.B. (Fabricio Baptista); data curation, F.B. (Fabricio Baptista); writing—original draft preparation, F.B. (Felipe Barnabé); writing—review and editing, F.B. (Fabricio Baptista); visualization, F.B. (Felipe Barnabé); supervision, F.B. (Fabricio Baptista); project administration, F.B. (Fabricio Baptista); funding acquisition, F.B. (Fabricio Baptista). All authors have read and agreed to the published version of the manuscript.
Funding
This work was supported in part by the Sao Paulo Research Foundation (FAPESP) under Grant 2022/15759-1, and in part by the National Council for Scientific and Technological Development (CNPq) under Grant 305067/2022-2.
Institutional Review Board Statement
Not applicable.
Informed Consent Statement
Not applicable.
Data Availability Statement
The original data presented in the study are openly available in Dryad at https://doi.org/10.5061/dryad.0000000kk.
Conflicts of Interest
The authors declare no conflicts of interest.
Abbreviations
The following abbreviations are used in this manuscript:
| EMI | Electromechanical impedance |
| SHM | Structural health monitoring |
| CFRP | Carbon fiber-reinforced polymer |
| DAQ | Data acquisition |
| PZT | Lead zirconate titanate |
| EFS | Effective frequency shifting |
| CCD | Correlation coefficient deviation |
References
- Khayatazad, M.; Loccufier, M.; De Waele, W. Electromechanical impedance-based measurements for damage detection and characterization in medium-thick plates. Measurement 2025, 248, 116841. [Google Scholar] [CrossRef] [Scilit]
- Vijayan, D.S.; Sivasuriyan, A.; Devarajan, P.; Stefańska, A.; Wodzyński, Ł.; Koda, E. Carbon fibre-reinforced polymer (CFRP) composites in civil engineering application—A comprehensive review. Buildings 2023, 13, 1509. [Google Scholar] [CrossRef] [Scilit]
- Singh, S.K.; Malinowski, P.H. Effective damage detection method based on electromechanical impedance and parallel connection of the transducers. NDT E Int. 2026, 160, 103667. [Google Scholar] [CrossRef] [Scilit]
- Dias, L.L.; Lopes, K.W.; Bueno, D.D.; Gonsalez-Bueno, C.G. An enhanced approach for damage detection using the electromechanical impedance with temperature effects compensation. J. Braz. Soc. Mech. Sci. Eng. 2023, 45, 228. [Google Scholar] [CrossRef] [Scilit]
- Shelgaonkar, T.; Narayanan, A.; Basappa, U. A review on the impact of thermal effects on electro-mechanical impedance technique-based structural health monitoring. J. Nondestruct. Eval. 2025, 44, 76. [Google Scholar] [CrossRef] [Scilit]
- Koo, K.Y.; Park, S.; Lee, J.J.; Yun, C.B. Automated impedance-based structural health monitoring incorporating effective frequency shift for compensating temperature effects. J. Intell. Mater. Syst. Struct. 2009, 20, 367–377. [Google Scholar] [CrossRef] [Scilit]
- Barnabé, F.A.; Baptista, F.G. Irregular Temperature Variation Effects on Damage Detection Based on Impedance Measurement from Piezoelectric Transducers. Eng. Proc. 2022, 27, 21. [Google Scholar] [CrossRef] [Scilit]
- Xia, Y.; Chen, B.; Weng, S.; Ni, Y.; Xu, Y. Temperature effect on vibration properties of civil structures: A literature review and case studies. J. Civ. Struct. Health Monit. 2012, 2, 29–46. [Google Scholar] [CrossRef] [Scilit]
- Moure, A.; Alemany, C.; Pardo, L. Temperature dependence of piezoelectric, elastic and dielectric coefficients at radial resonance of piezoceramics with an Aurivillius-type structure. IEEE Trans. Ultrason. Ferroelectr. Freq. Control 2005, 52, 570–577. [Google Scholar] [CrossRef]
- Baptista, F.G.; Vieira Filho, J. A new impedance measurement system for PZT-based structural health monitoring. IEEE Trans. Instrum. Meas. 2009, 58, 3602–3608. [Google Scholar] [CrossRef] [Scilit]
- De Freitas, F.B.A.; Pereira, L.R.; Cabral, L.D.; Cavallini, A.A., Jr.; Steffen, V., Jr. Numerical modeling and experimental analysis of structural integrity monitoring of mechanical systems based on electromechanical impedance. J. Nondestruct. Eval. 2026, 45, 41. [Google Scholar] [CrossRef] [Scilit]
- Yang, Y.; Hu, Y.; Lu, Y. Sensitivity of PZT impedance sensors for damage detection of concrete structures. Sensors 2008, 8, 327–346. [Google Scholar] [CrossRef] [Scilit]
Disclaimer/Publisher’s Note: The statements, opinions and data contained in all publications are solely those of the individual author(s) and contributor(s) and not of MDPI and/or the editor(s). MDPI and/or the editor(s) disclaim responsibility for any injury to people or property resulting from any ideas, methods, instructions or products referred to in the content. |
© 2026 by the authors. Licensee MDPI, Basel, Switzerland. This article is an open access article distributed under the terms and conditions of the Creative Commons Attribution (CC BY) license.