


Abstract
The required validity and reliability of measurement results in biosensing can be achieved by the use of highly sensitive and selective sensors, and also by accurate interpretation of measurement results. In order to optimize the sensor design and operating conditions in that sense, and assure the results accuracy, it is necessary to have mathematical models which encompass all physical processes that generate the sensor response and contribute to its stochastic fluctuations. In this paper, we develop the mathematical models of the response and noise of protein biosensors, which take into account the processes of reversible adsorption of protein molecules, mass transfer of molecules through the sensor microfluidic chamber, and protein conformational changes upon adsorption. The performed analysis shows the pronounced influence of mass transfer on the sensor response and noise. The presented models, results, and discussion provide guidelines for the development of microfluidic sensors of improved reliability, faster response, and lower noise.
1. Introduction
Highly sensitive detection of biomolecules and characterization of their interactions with other biomolecules, chemical substances, or physical structures is needed in many fields, including medicine, pharmacology, personal and public health protection, environmental monitoring, and food quality inspection [1]. Real-time in situ biomolecular detection and quantification is a key concept for point-of-care diagnostics and therapeutics, but also for monitoring the levels of water, air, and food pollution in urgent situations. Investigation and characterization of biomolecular interaction mechanisms enable a deeper understanding of vital life processes, leading to disease prevention and drug development. Microfluidic adsorption-based biosensors have great potential for these applications [2]. However, despite the tremendous progress in biosensor technologies, innovative design solutions, and novel, highly sensitive detection strategies, there are still challenges that hinder their widespread practical use. One of the reasons is limited fundamental understanding of the complex coupling of physical, chemical, and biological processes and phenomena that influence sensor response generation, which can lead to compromised reliability and validity of measurement results in many real-world applications. In order to optimize a sensing system design and operating conditions for better performance and lower detection limits, and also to improve the validity and accuracy of results, it is necessary to have mathematical models that encompass all relevant processes and phenomena that generate biosensor response and contribute to its stochastic fluctuations (i.e., to sensor noise). Especially valuable are analytical models that provide insight into the dependence of sensor response parameters and sensing performance metrics on the parameters of both the sensing system and processes that contribute to the response generation, but do not require excessive computing resources for complex calculations.
Due to its simplicity, the Langmuir adsorption model is the most commonly used mathematical model for describing the biosensor response kinetics [3]. It assumes an ideal case in which reversible binding (adsorption) of target molecules to uniform binding sites on the sensing surface is the only response-generating process. As this is not a valid assumption in many practical situations, the model is often misused, leading to incorrect results. For many practically relevant cases, more comprehensive analytical models of sensor response and its stochastic fluctuations have been developed, which consider combined effects of multiple parallel and mutually dependent adsorption processes. These processes together constitute a complex, multicomponent adsorption, such as non-specific adsorption (a set of competing adsorption processes of several analytes on binding sites of the same type), multilayer adsorption, and adsorption on non-uniform adsorption sites [4,5]. Specifically for microfluidic sensors, the models have encompassed the coupling of the mentioned adsorption processes and the mass transfer (convection and diffusion of analyte particles) in a microfluidic reaction chamber [5,6].
The interaction of biomolecules with the sensing surface (i.e., with the immobilized entities serving as selective binding sites) during adsorption often causes changes in the biomolecule conformation, and thus their functionality and binding affinity, inevitably affecting the kinetics of the response of affinity-based biosensors [7,8]. In this paper, we develop mathematical models of the temporal response and noise of adsorption-based microfluidic biosensors of proteins, which simultaneously take into account the processes of reversible adsorption of protein molecules on the sensing surface, mass transfer of molecules through the sensor’s microfluidic chamber, and protein conformational changes upon adsorption. We simplify the equations that describe the temporal change in the number of adsorbed molecules by introducing the two-compartment model (TCM) [5] for spatial distribution of the analyte concentration in the microfluidic chamber. The fluctuations of the number of adsorbed molecules are considered as a non-linear gain-loss stochastic process, and the corresponding noise model is devised by using the Langevin approach [9]. It is the first model to simultaneously consider the three mentioned processes, which exist in many real situations in biosensing. We present the results of the analysis of mass transfer influence on the sensor time response and noise for various rates of protein conformational changes and the mass transfer coefficient values. The presented work is useful for providing guidelines for the design of microfluidic sensors of improved performance regarding the results’ validity, reliability, and accuracy, the higher response rate, and the lower noise level.
2. Sensor Time Response and Noise Model
The time response of adsorption-based sensors of proteins is determined by the number of adsorbed molecules on the sensing surface, N, which changes according to the equation dN/dt = vi − vd, where vi and vd are the rates of increase and decrease in that number, respectively. vi and vd model the influence of the processes that contribute to the mentioned changes in N. In the simplest case, there are only the adsorption and desorption processes of target molecules, so vi and vd are the adsorption and desorption rates. Assuming the uniformity of surface binding sites, the uniformity of target molecules regarding the affinity toward the adsorption sites, the time invariance and spatial homogeneity of target molecule concentration in the sample during the adsorption–desorption (AD) process, as well as the absence of any process that would influence AD properties of the adsorbed molecules, the rates vi and vd are given by the Langmuir model. However, a characteristic of proteins is the variability of their structure after the transition from the unbound state in their native liquid environment to the bound state, while they interact with the surface adsorption sites. This change upon adsorption alters their binding properties so that in the new conformation their bond to the sensing surface becomes stronger, weaker, or even permanent. Also, proteins are large molecules with low diffusivity compared to gas particles (for which the Langmuir model was originally developed), which leads to time variance and spatial non-homogeneity of their concentration in the vicinity of binding sites. Additionally, microfluidic sensors in real conditions have a finite liquid sample flow (i.e., velocity of the analyte transport to the sensing surface), which, together with diffusion and AD process of molecules, influences the temporal and spatial change in their concentration in a flow-through reaction chamber. It is obvious that under such conditions the Langmuir model fails to describe the kinetics of binding of proteins to the sensing surface, i.e., the changes in N, and thus the sensor’s time response.
Let us assume that a protein to be detected has two conformations: the one (marked 1) that the protein has in the native conditions in a liquid sample, and the second (marked 2) to which the protein transitions upon its adsorption on the sensing surface. The rate constants that characterize this reversible protein transformation are k12 and k21, for the transition from form 1 to form 2 and vice versa, respectively. Adsorption sites on the sensing surface (whose total number is Nm) are receptor molecules that have the affinity for highly specific binding of the protein in form 1, with the adsorption rate constant ka1. Spontaneous detachment of adsorbed molecules from the adsorption sites is possible only for form 1, and this process is described by the desorption rate constant kd1. At time t, there are N1 molecules of form 1 and N2 molecules of form 2 adsorbed on the sensing surface. Then the equations describing the change in the numbers N1 and N2, essential for describing the sensor’s time response kinetics, have the form
where vi1 and vd1 include the processes that lead to the increase in the number of adsorbed form 1 molecules (adsorption and reverse structural transformation of molecules from form 2 to form 1), and to the decrease in N1 (desorption and structural change from form 1 to form 2); vi2 and vd2 are instantaneous rates of protein transformations from form 1 to form 2, and from form 2 to form 1, respectively, which are the only processes that cause the change in the number of form 2 adsorbed molecules. The protein concentration in the vicinity of adsorption sites, C, can be considered as constant and equal to the concentration in the sample only when the mass transfer processes (convection and diffusion) are sufficiently fast relative to the AD process, so that they transport the molecules through the solution to and from the sensing surface faster than the instantaneous net AD process can bind them from the solution or release them to it. However, in microfluidic biosensing, as explained earlier, it is necessary to consider the concentration as dependent on time and spatial coordinates. A model that encompasses the AD process, mass transfer, and transformation of molecular conformation then becomes very mathematically complex, as it is given in the form of a partial differential convection–diffusion equation [5,6], which can be, with the initial and boundary conditions for the given system, solved numerically for C by using the finite element method (FEM).
For the analysis of biosensor time response and its fluctuations, a more convenient model is in the form of Equations (1) and (2), where the variable concentration C is given by an analytical expression. Then, the rates of change in the number of adsorbed molecules would also be given by analytical expressions. Such a model can be obtained by introducing certain approximations. A general approximate model cannot be derived due to the wide variety of possible combinations of values of numerous parameters that determine the transport-adsorption conditions in a given system. The relations between the times of convection, diffusion, and adsorption in a given system are crucial for defining various transport-adsorption regimes and approximations which are justified in particular cases. In many sensors with a flow-through reaction chamber, especially those in which slow-diffusing analytes are detected (i.e., when the diffusion time scale is greater than the convection time scale), only the molecules in the vicinity of the sensing surface can participate in adsorption. Then, the two-compartment model approximation can be applied by identifying two compartments in the reaction chamber: the inner compartment, which is in contact with the sensing surface, and the outer compartment, which encompasses the remaining part of the chamber, and by introducing the simplified spatial dependence of the analyte concentration. It is experimentally confirmed that TCM provides a good approximation of the biomolecular binding kinetics influenced by mass transfer [10].
According to TCM, the protein concentration in the outer compartment is equal to the concentration in the sample, Co, while the expression for the concentration C in the inner compartment (adjacent to the sensing surface) is obtained from the condition of equality of the transport flux from the outer compartment and the net adsorption flux, i.e., km(Co − C) = (dNa/dt)/A [5], which in the analyzed case yields
here, A is the sensing surface area, and km = 1.463(D2vm/(Lh))1/3 is the mass transfer coefficient introduced in TCM as a parameter that characterizes particle transport in the flow-through reaction chamber between the outer and the inner compartment (L is the sensing surface dimension in the direction of convection, h is the height of the microfluidic chamber, and vm is the mean convection velocity) [5]. The rate of increase in the number of adsorbed form 1 particles can now be expressed analytically, so all the rates of the model represented by Equations (1) and (2), which determine the time evolution of the numbers of protein molecules of both forms on the sensing surface, are given by the expressions
The time response of the sensor is determined by the expression
assuming that the contributions of adsorbed form 1 and form 2 molecules are different, and they are r1 and r2 per molecule, respectively.
From the conditions dN1/dt = 0 and dN2/dt = 0, analytical expressions for the equilibrium numbers of adsorbed molecules are obtained as
Upon reaching equilibrium, all the processes relevant to molecular binding–unbinding events on the sensing surface continue according to the same physical rules as during the transient regime, and, due to their stochastic nature, the numbers of adsorbed molecules exhibit random fluctuations around their equilibrium values. Namely, the difference between the instantaneous stochastic rates of increase and decrease in both N1 and N2 results in the stochastic components ΔN1 and ΔN2, representing their fluctuations. These fluctuations in protein biosensors can result in significant noise, which can even be high enough to dominantly determine the ultimate sensing performance (e.g., detection limit or minimal detectable concentration). Equations (4) and (5), obtained by applying TCM, enable the fluctuations in the number of adsorbed molecules to be considered as members of the class of stochastic processes known in probability theory as gain–loss processes [9] and analyzed using the same approaches. Langevin approach is a common and efficient method for such analysis, as the Langevin equations stem directly from the kinetic equations (Equations (1), (2), (4), and (5)) in the form
where Bjk = −∂(vij − vdj)/∂Nk (j = 1 or 2, k = 1 or 2), Ne = Nm − N1e − N2e, and ξ1 and ξ2 are the Langevin source functions. The Langevin equations can also be obtained in a more formal way by using the approach based on the Master equation, which is explained in detail in the literature (Supplementary Data of [6]). If ΔN1(jω) and ΔN2(jω) are the solutions of Equation (8) in the frequency domain, where ω = 2πf, f is the Fourier frequency, then the power spectral and cross-spectral densities of fluctuations are ΔN1(jω)ΔN1(−jω), ΔN2(jω)ΔN2(−jω), ΔN1(jω)ΔN2(−jω) and ΔN2(jω)ΔN1(−jω). Subsequently, the power spectral density (PSD) of fluctuations of the sensor response is obtained as
3. Mass Transfer Influence—Results and Discussion
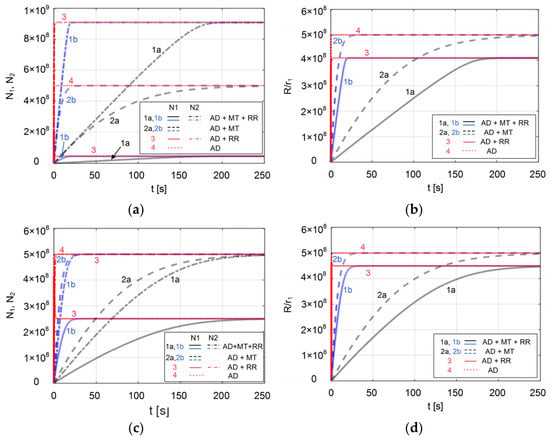
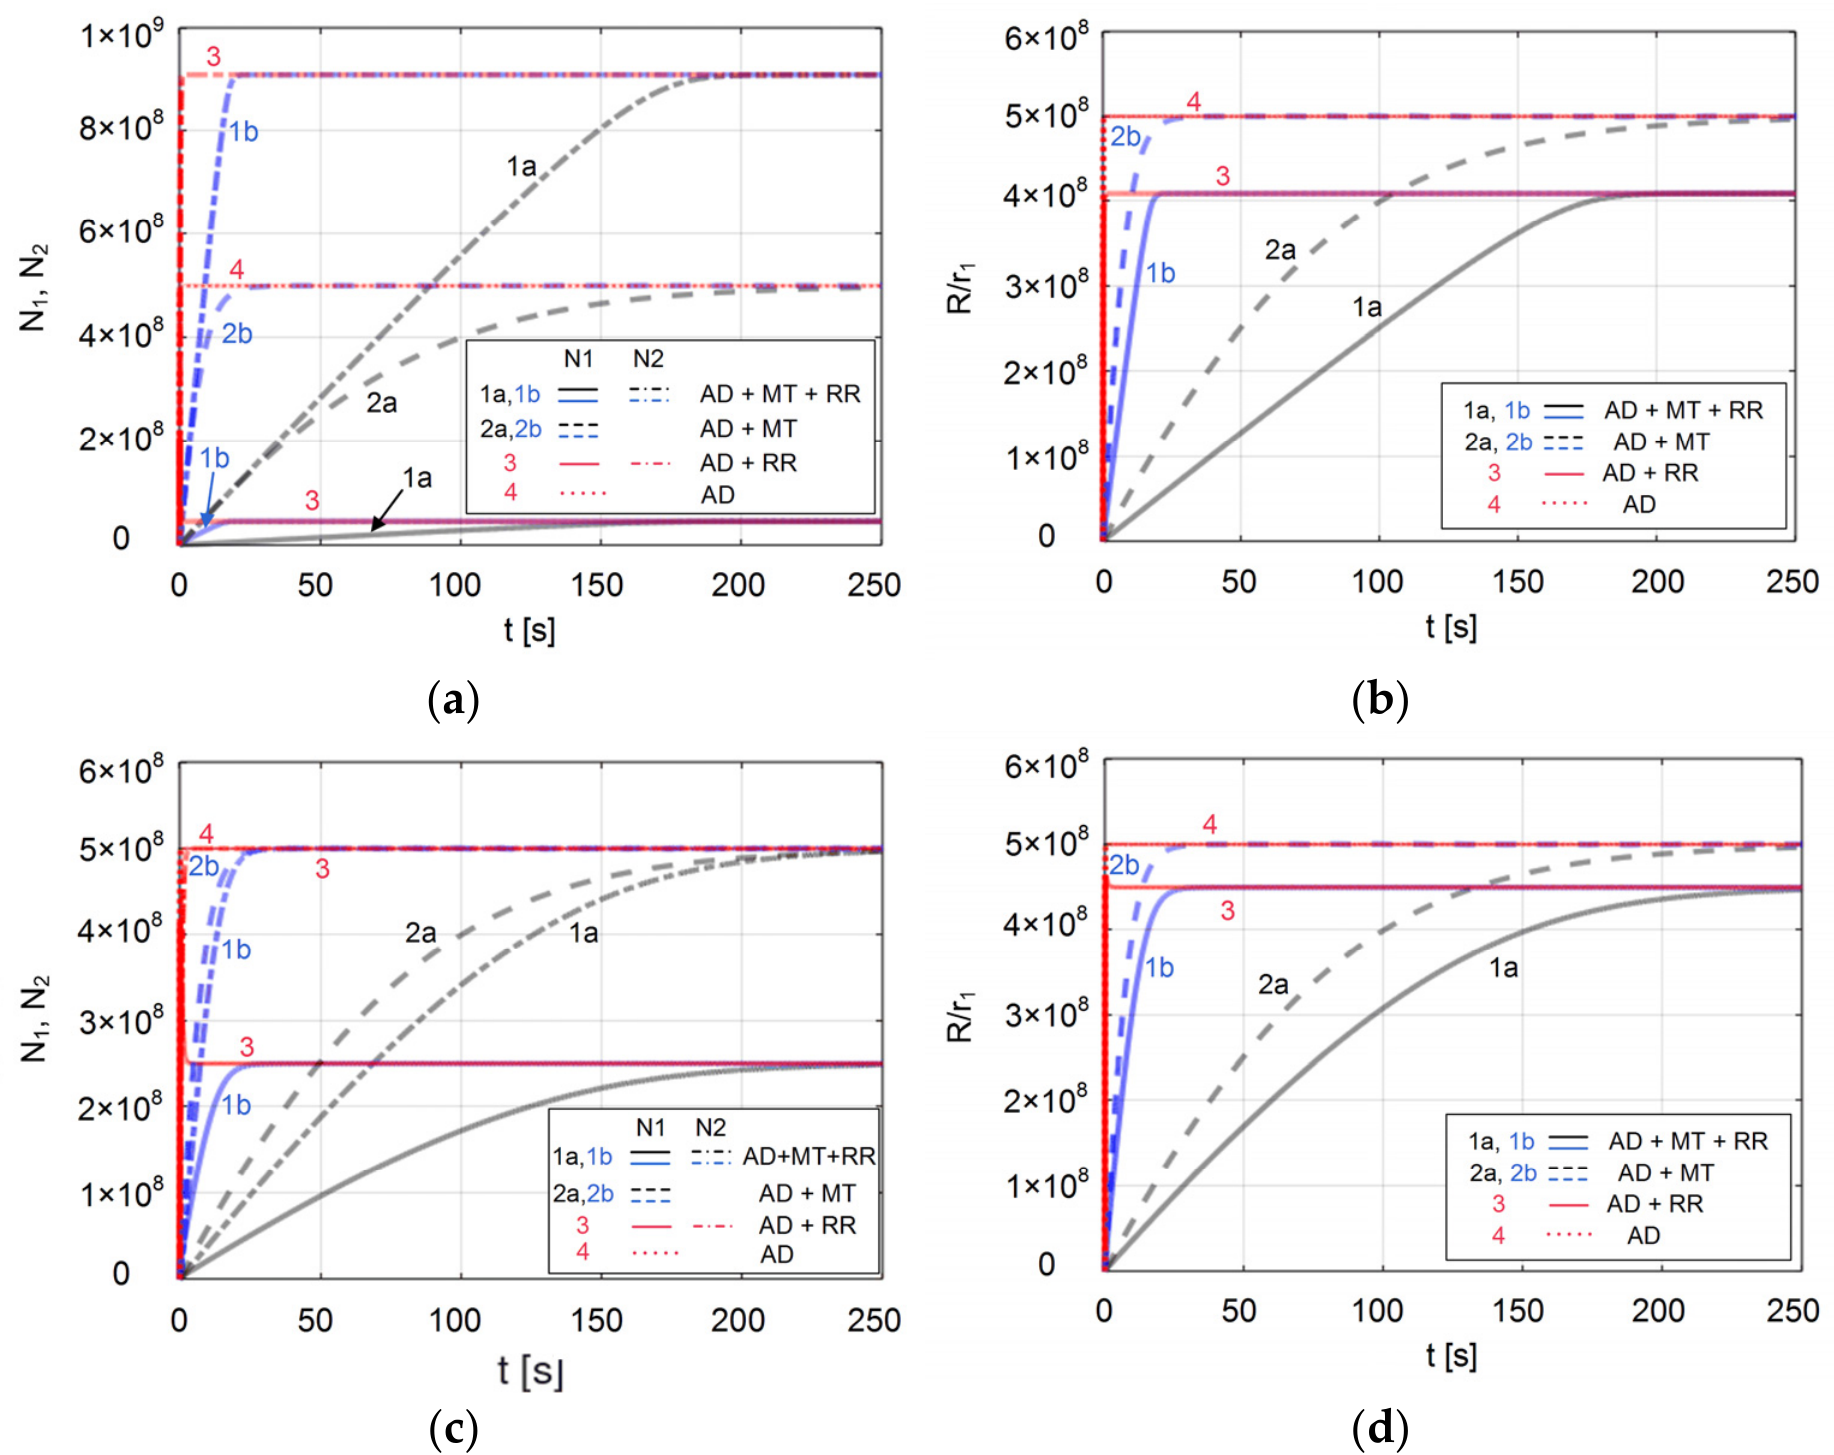
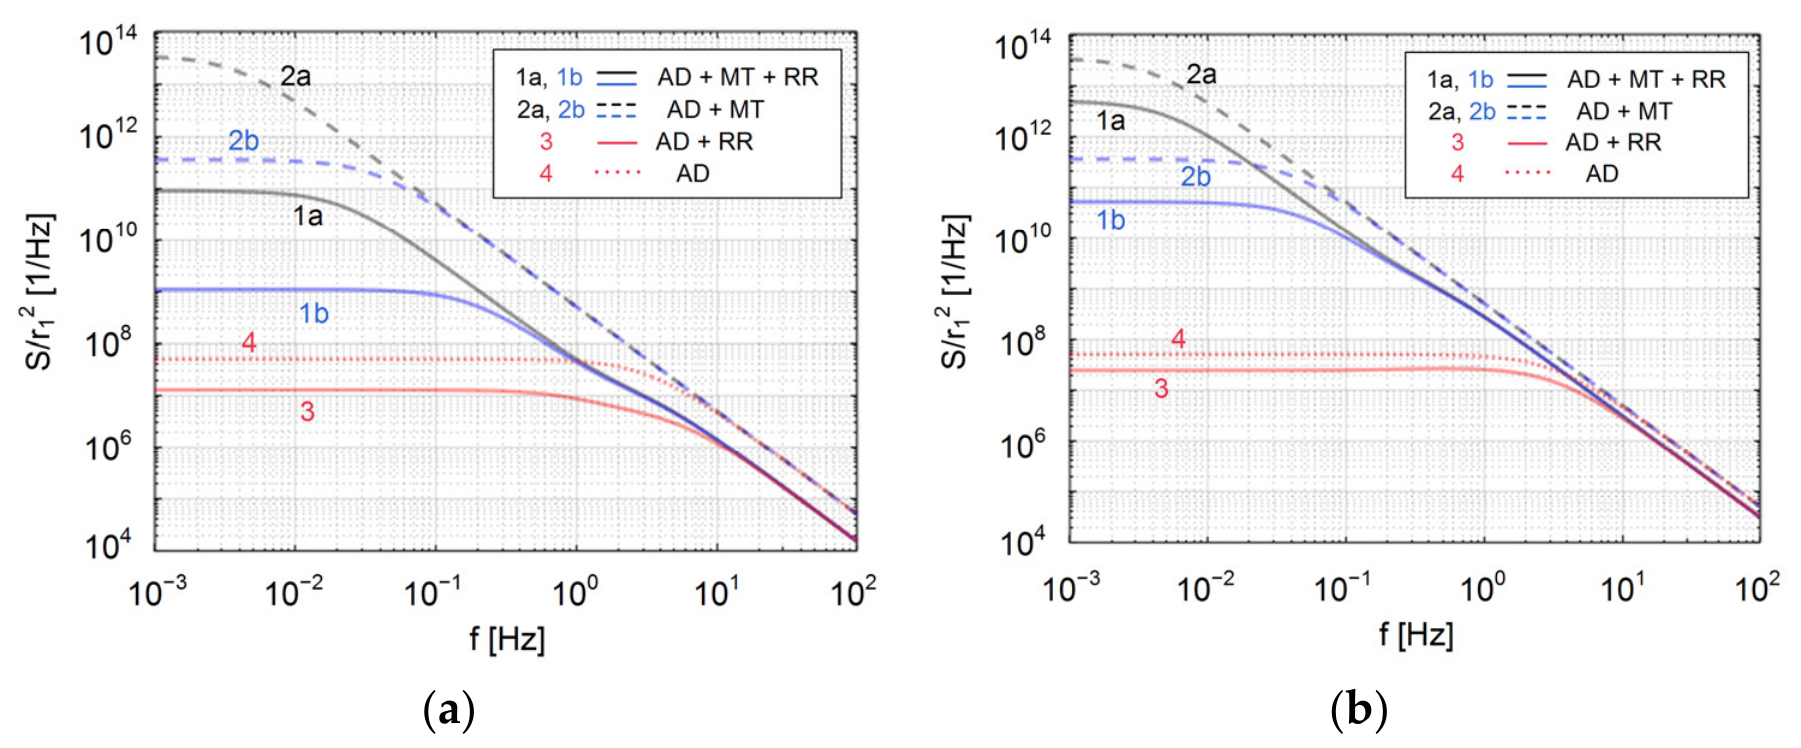
The developed models are simple and very convenient for the analysis of the influence of relevant processes and parameters of the sensing system on the sensor response and its fluctuations. Here we apply them for the analysis of the influence of mass transfer for the following parameter values, which belong to the ranges characteristic for protein biosensing [7,11,12]: Co = 5 × 10⁻⁷ M, ka1 = 2 × 10⁷ 1/(Ms), kd1 = 10 1/s, k21 = 1 1/s, the surface density of adsorption sites nm = 1 × 10¹⁸ 1/m2, the sensing area A = 1 × 10⁻⁹ m2, r1/r2 = 0.4, two different values of the rate of conformational transformation, k12 = 20 1/s and k12 = 2 1/s, and the mass transfer of km = 2 × 10⁻⁵ m/s and 10-times-faster mass transfer (km = 2 × 10⁻⁴ m/s). In order to make the analysis more general, i.e., independent of the kind of sensor’s measurement parameter (which can be the total adsorbed mass, the refractive index change, or the electrical charge, to mention a few) in which the number of adsorbed particles is converted by a certain transduction mechanism (as it is represented by the parameters r1 and r2), we observe the normalized response R/r1 and noise PSD S/r12, which depend only on the ratio r2/r1. Figure 1 and Figure 2 show the results obtained by the derived models (curves “AD + MT + RR”), the results that correspond to the cases when only AD and mass transfer of form 1 molecules are taken into account (“AD + MT”) or AD and molecular structural rearrangement (“AD + RR”), and also the case when both MT and conformational change are neglected (“AD”).
Figure 1.
Time evolution of (a) the number of form 1 adsorbed molecules (N1) and form 2 adsorbed molecules (N2), for the rate of direct conformational change k12 = 20 1/s, and (b) normalized sensor time response for k12 = 20 1/s. (c) Same as (a), but for k12 = 2 1/s. (d) Same as (b), but for k12 = 2 1/s. Different processes are taken into account: adsorption–desorption (AD), mass transfer (MT), and structural rearrangement (RR) of the adsorbed molecules. Blue lines are for the cases of faster mass transfer.
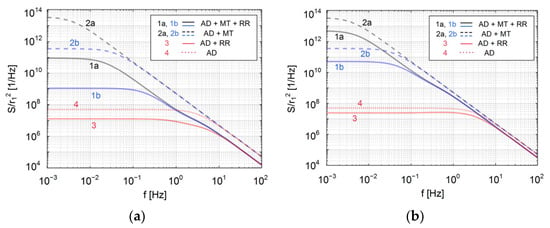
Figure 2.
Normalized power spectral density of response fluctuations for different processes taken into account (adsorption–desorption (AD), mass transfer (MT) and structural rearrangement (RR)), for the rate of change in form 1 adsorbed molecules: (a) k12 = 20 1/s, (b) k12 = 2 1/s. Blue lines are for the cases of faster mass transfer.
Diagrams in Figure 1a,c show the time evolution of the numbers of adsorbed protein molecules of each of the conformations in the mentioned cases, for k12 = 20 1/s and k12 = 2 1/s, respectively, while the diagrams in Figure 1b,d show the corresponding normalized sensor responses. It can be clearly seen that a slower mass transfer (black lines) significantly slows down the kinetics of change in N1, N2, and the response, while their equilibrium values are independent of mass transfer rates (all the curves of the same style for both values of the parameter km, shown in blue and black, converge towards the same equilibrium value as the red curves of the corresponding line style). The case “AD + RR” shows that the conformational change does not slow down the kinetics significantly compared to the ideal (“AD”) case, but can result in overshoots and significant changes in equilibrium values. By comparing the diagrams for different k12, it can be seen that conformation changes at different rates modify the mass transfer influence on kinetics deceleration differently, while the combined effect of MT and conformation change on equilibrium values reduces only to the influence on the conformation change.
Diagrams in Figure 2 show the normalized PSD of fluctuations of sensor response, i.e., the PSD of sensor noise, in the cases “AD + MT + RR”, “AD + MT”, “AD + RR” and “AD”, for k12 = 20 1/s and k12 = 2 1/s, respectively. Based on the characteristic noise spectrum shape with two “knees” in the cases that take into account conformation change upon adsorption (as shown by black, blue and red solid lines in the diagrams), three noticeable characteristic frequencies fi = 1/(2πτi) can exist in the spectrum, where i is I, II or III (τi are given by Equation (11) for the case “AD + MT + RR”, and for the case “AD + RR” by the same expressions, except that B11 and B12 are then determined by Equation (9) in which the denominator equals 1). All three curves shown as solid lines in Figure 2a have such a shape, which means that the presence of molecules with altered conformation (form 2) can be seen in the noise spectrum even when the shape of the time response does not indicate so (Figure 1a), regardless of the existence of mass transfer. By comparing the diagrams in Figure 2a,b, it can be seen that at a lower rate of change in the original protein conformation (k12), this characteristic spectral shape is less pronounced (in the case “AD + RR” for k12 = 2 1/s it is not present), but for the same k12 such shape is more pronounced at a slower mass transfer, as the characteristic frequencies are more separated at km = 2 × 10⁻⁵ m/s than at 10 times higher km. In all the cases (with or without structural rearrangement of molecules), mass transfer increases the noise spectrum magnitude, and the amount of that influence depends on the rate of conformational change.
4. Conclusions
In this paper, we presented new models of time response and noise of microfluidic protein sensors, which take into account the combined effects of adsorption–desorption, mass transfer processes in a flow-through sensor chamber, and reversible conformation changes in protein molecules upon adsorption. The derived models are simple and convenient for the analysis of the influence of relevant processes and parameters of sensing systems on the sensor’s response and noise. By using these models, an analysis was performed of the influence of mass transfer on the kinetics of sensor time response and the spectrum of response fluctuations, for parameter values typical for protein biosensing.
By comparing the sensor response and noise in the cases where the interplay of the mentioned three processes is observed, and when the influence of one or two of them is neglected, a significant influence of mass transfer was observed on the deceleration of sensor response kinetics and on the increase in the magnitude of noise power spectral density. Also observed was the dependence of this influence on the rate of protein conformation change. The presented models of sensor response and noise enable quantitative characterization of these influences to be performed in each practical case.
The amount of influence of combined mass transfer and protein conformation change on the response kinetics, response rate, and response equilibrium value in the analyzed realistic example shows the necessity of taking these processes into account when the measurement results are analyzed, so as to avoid incorrect conclusions about the concentration of the target protein in the sample, or about parameters of biomolecular interaction whose characterization is performed by analyzing the sensor response. Considering the pronounced increase in noise when the mass transfer is slow, the interplay of the mentioned processes also needs to be taken into account while performing sensor noise analysis, in order to ensure a valid assessment of the sensor’s ultimate performance. Additionally, it is shown that the noise spectrum is a rich source of information about all the involved processes, so the presented noise model has a role in the development of methods for their characterization based on noise spectrum analysis.
Author Contributions
Conceptualization, I.J. and M.F.; methodology, I.J.; software, I.J. and K.R.; validation, K.R., P.K. and P.P.; formal analysis, I.J.; investigation, I.J., M.F., K.R., P.K. and P.P.; writing—original draft preparation, I.J. and M.F.; writing—review and editing, P.K. and P.P.; visualization, I.J. All authors have read and agreed to the published version of the manuscript.
Funding
This research was funded by the Ministry of Science, Technological Development and Innovation of the Republic of Serbia, grant number 451-03-33/2026-03/200026.
Institutional Review Board Statement
Not applicable.
Informed Consent Statement
Not applicable.
Data Availability Statement
Data are contained within the article.
Conflicts of Interest
The authors declare no conflicts of interest.
References
- Naresh, V.; Lee, N. A Review on Biosensors and recent development of nanostructured materials-enabled biosensors. Sensors 2021, 21, 1109. [Google Scholar] [CrossRef] [Scilit] [PubMed]
- Kulkarni, M.B.; Ayachit, N.H.; Aminabhavi, M. Biosensors and microfluidic biosensors: From fabrication to application. Biosensors 2022, 12, 543. [Google Scholar] [CrossRef] [Scilit] [PubMed]
- Langmuir, I. The adsorption of gases on plane surfaces of glass, mica and platinum. J. Am. Chem. Soc. 1918, 40, 1361–1403. [Google Scholar] [CrossRef] [Scilit]
- Djurić, Z.; Jokić, I.; Frantlović, M.; Jakšić, O. Fluctuations of the number of particles and mass adsorbed on the sensor surface surrounded by a mixture of an arbitrary number of gases. Sens. Actuators B Chem. 2007, 127, 625–631. [Google Scholar] [CrossRef] [Scilit]
- Jokić, I. Microfluidic Adsorption-Based Biosensors: Mathematical Models of Time Response and Noise, Considering Mass Transfer and Surface Heterogeneity. In Biosensors—Current and Novel Strategies for Biosensing; Villarreal-Gómez, L., Ed.; Intech Open: London, UK, 2021; pp. 1–25. [Google Scholar]
- Frantlović, M.; Jokić, I.; Djurić, Z.; Radulović, K. Analysis of the Competitive Adsorption and Mass Transfer Influence on Equilibrium Mass Fluctuations in Affinity-Based Biosensors. Sens. Actuators B Chem. 2013, 189, 71–79. [Google Scholar] [CrossRef] [Scilit]
- Daniels, K.G.; Suo, Y.; Oas, T.G. Conformational kinetics reveals affinities of protein conformational states. Proc. Natl. Acad. Sci. USA 2015, 112, 9352–9357. [Google Scholar] [CrossRef] [Scilit]
- Amaral, M.; Kokh, D.B.; Bomke, J.; Wegener, A.; Buchstaller, H.P.; Eggenweiler, H.M.; Matias, P.; Sirrenberg, C.; Wade, R.C.; Frech, M. Protein conformational flexibility modulates kinetics and thermodynamics of drug binding. Nat. Commun. 2017, 8, 2276. [Google Scholar] [CrossRef] [Scilit] [PubMed]
- Van Vliet, K.M.; Fasset, J.R. Fluctuations due to electronic transitions and transport in solids. In Fluctuation Phenomena in Solids; Burgess, R.E., Ed.; Academic Press: New York, NY, USA, 1965; pp. 267–352. [Google Scholar]
- Anderson, H.; Wingqvist, G.; Weissbach, T.; Wallinder, D.; Katardjiev, I.; Ingemarsson, B. Systematic investigation of biomolecular interactions using combined frequency and motional resistance measurements. Sens. Actuators B Chem. 2011, 153, 135–144. [Google Scholar] [CrossRef] [Scilit]
- Canziani, G.; Zhang, W.; Cines, D.; Rux, A.; Willis, S.; Cohen, G.; Eisenberg, R.; Chaiken, I. Exploring Biomolecular Recognition Using Optical Biosensors. Methods 1999, 19, 253–269. [Google Scholar] [CrossRef] [Scilit] [PubMed]
- Bi, C.; Beeram, S.; Li, Z.; Zheng, X.; Hage, D.S. Kinetic analysis of drug-protein interactions by affinity chromatography. Drug Discov. Today Technol. 2015, 17, 16–21. [Google Scholar] [CrossRef] [Scilit] [PubMed]
Disclaimer/Publisher’s Note: The statements, opinions and data contained in all publications are solely those of the individual author(s) and contributor(s) and not of MDPI and/or the editor(s). MDPI and/or the editor(s) disclaim responsibility for any injury to people or property resulting from any ideas, methods, instructions or products referred to in the content. |
© 2026 by the authors. Licensee MDPI, Basel, Switzerland. This article is an open access article distributed under the terms and conditions of the Creative Commons Attribution (CC BY) license.