


Abstract
River floods are considered a serious threat to human life and infrastructure; therefore, effective monitoring and early warning solutions are required. In this paper, an intelligent system based on a distributed network of ESP32 sensor nodes is proposed for real-time monitoring of river water levels. The sensor nodes are deployed at multiple locations along the river, where hydrological data are continuously collected and transmitted to a central unit. The acquired time-series data are analyzed by means of a nonlinear autoregressive model with exogenous inputs (NARX) and artificial intelligence techniques, so that complex hydrological dynamics can be captured and future water-level variations can be predicted. The proposed system enables the early detection of potential flood events and supports timely decision-making. The solution is implemented as a low-cost Wireless Sensor Network (WSN), which makes it suitable for deployment in remote and resource-constrained areas and contributes to improved flood risk management. The architectures of the applied systems are presented, and an approach for implementing a NARX-based model for river water-level prediction is proposed.
1. Introduction
The increasing intensity and frequency of extreme hydrometeorological events have transformed real-time river monitoring and flood early warning systems from merely a technical possibility into a strategic necessity. Floods are still regarded as among the most destructive and costly natural disasters worldwide, as severe damage is caused to infrastructure, agriculture, public services, and human safety [1,2]. In flood-prone areas, delayed or missing warnings may cause local hydrological events to develop into large-scale disasters [3]. For this reason, river water-level measurement is no longer considered important only for hydrological observation, but has become a central component of flood risk reduction, emergency response, and water resource management [4,5].
Despite this urgent need, conventional monitoring infrastructure is still affected by significant practical limitations. Classical hydrometric stations are often expensive to install, difficult to maintain, and sparsely distributed, particularly in remote, mountainous, or poorly instrumented catchment areas [4,6]. Manual measurements, where they are still applied, are labor-intensive, prone to human error, and unsuitable for real-time decision-making [7]. Even when automated solutions are available, their cost and implementation complexity often prevent the development of dense monitoring networks capable of capturing river dynamics. This limitation is critical, since flood generation and propagation are inherently distributed processes, and a single station rarely provides a sufficiently reliable representation of the hydrological response at the catchment scale [6,8]. In the relevant scientific literature, a transition from isolated, high-cost stations toward scalable and distributed sensing architectures has increasingly been emphasized.
A promising response to this challenge has emerged through IoT-based monitoring systems. Numerous studies have demonstrated that low-cost sensor nodes, embedded microcontrollers, and wireless communication protocols can be integrated into practical platforms for river monitoring, enabling real-time data transmission and early warning functionalities. Systems based on GSM/GPRS remain relevant due to their simplicity and wide coverage, particularly for SMS alert delivery and cellular telemetry [9,10]. Other platforms have emphasized LoRa as a low-power and long-range solution for distributed river monitoring networks [7], whereas more recent implementations have employed Wi-Fi-enabled microcontrollers, cloud-based dashboards, and messaging applications such as Telegram or Blynk in order to provide community alerts and real-time remote monitoring [2,3,11]. Scalable architectures such as RiverCore, as well as broader IoT-based platforms for river monitoring, have further demonstrated that embedded telemetry, web services, and distributed sensor stations can form the foundation of modern hydrological observation systems [1,8]. Nevertheless, although the applicability of low-cost digital monitoring has been confirmed by these developments, many of them remain focused on hardware demonstrations or local deployments rather than on long-term operational robustness and integration with predictive models.
Ultrasonic sensors are among the most widely used solutions due to their affordability, ease of integration, and non-contact measurement principle [4,5,12]. LiDAR-based systems have also attracted attention, particularly in prototypes in which water-level measurement is combined with rainfall monitoring and visual inspection through ESP32-based embedded platforms [2,3]. Alternative approaches include the digitization of existing mechanical water-level gauges by means of rotary encoders [13], as well as autonomous laser level gauges with a float mechanism, designed for environments in which external power supply and frequent maintenance are difficult to ensure [14]. At the same time, optical solutions based on fiber Bragg grating (FBG) sensors offer high sensitivity, immunity to electromagnetic interference, and the capability for simultaneous level and temperature measurement, which makes them promising for harsh and environmentally complex conditions [15,16]. However, this technological diversity also highlights a methodological gap: a unified framework for selecting the most appropriate sensing architecture according to specific environmental, economic, and operational conditions is still lacking in the field.
Another important research direction is related to the replacement or supplementation of physical water-level gauges through remote sensing and computer vision. This trend is driven both by the vulnerability of local sensors during extreme flood events and by the possibility of observing larger areas with less invasive infrastructure. Recent studies on “virtual water gauges” based on convolutional neural networks, such as ResNet-50, have shown that standard CCTV images can be used for near-real-time water-level estimation with promising accuracy under favorable conditions [17]. Similarly, Visual IoT systems employing PTZ cameras and lightweight machine learning algorithms have demonstrated the potential for large-area river monitoring through resource-constrained edge devices [18]. At a broader observational scale, satellite SAR imagery provides an alternative for estimating river water levels in difficult-to-access areas by analyzing multiple-reflection signatures from bridge structures [19]. However, these approaches remain sensitive to adverse weather conditions, image instability, illumination variability, and limited training data availability, which means that their operational reliability is still conditional rather than universal [17,18]. Therefore, although remote observation methods are highly promising, they should be regarded as complementary to, rather than complete replacements for, reliable local sensing systems.
The increasing availability of real-time data naturally shifts the focus from monitoring to prediction. In this regard, the forecasting of river discharge and water levels remains a complex task due to the nonlinear, multi-scale, and climate-dependent nature of hydrological systems [20]. Classical statistical models, such as ARIMA, can still provide satisfactory results in certain cases, particularly for seasonal or monthly runoff forecasting [21]; however, their performance is often limited when abrupt changes and heterogeneous effects of input factors have to be represented. For this reason, machine learning and artificial intelligence have been assigned an increasingly important role. Artificial neural networks have been successfully applied to flood warning and river discharge forecasting [22,23], while Random Forest, MARS, Boosted Trees, and related intelligent models have demonstrated high effectiveness in daily runoff prediction based on meteorological inputs [20,24]. More advanced approaches have further improved prediction accuracy by combining ANN architectures with evolutionary optimization strategies [25]. Deep learning models, including EMD-LSTM, ViT-LSTM, and multi-attention encoder–decoder TCN architectures, have shown that hybrid architectures are particularly effective in capturing temporal dependencies and multimodal relationships relevant to flood prediction [26,27,28]. Nevertheless, the literature remains fragmented: studies focused on monitoring often terminate at the level of measurement and warning, whereas predictive studies often assume the availability of reliable, preprocessed, and sufficiently dense input data, without addressing in detail how such data are collected in practice.
This fragmentation outlines the main limitation of the current state of the field. Existing studies have achieved significant progress either in low-cost river monitoring through hardware platforms, communication architectures, and real-time warning mechanisms [1,8,10], or in predictive modeling and flood forecasting through machine learning and deep learning techniques [24,26,28]. Considerably fewer contributions have integrated these two dimensions into a complete end-to-end framework in which sensor-based observation, data transmission, visualization, and prediction are connected within a unified and practically deployable system. In many cases, prototypes have demonstrated technical feasibility, but limited attention has been paid to scalability, long-term robustness, uncertainty in data quality, or the relationship between real-time monitoring and subsequent predictive analysis. Therefore, a clear need remains for integrated solutions in which the reliability and affordability of embedded IoT monitoring systems are combined with the analytical capabilities of modern predictive models.
Against this background, the present paper is intended to contribute to the development of such an integrated perspective. Instead of monitoring and predictive modeling being treated as separate research problems, the study is based on the understanding that effective flood early warning depends on the close connection between them. Therefore, a low-cost architecture for real-time river monitoring is combined with advanced predictive modeling, so that actionable information can be extracted from continuously acquired hydrological data. By building upon the strengths of contemporary IoT monitoring platforms, modern sensing technologies, and current machine learning methods, the study is aimed at supporting the development of scalable, intelligent, and practically deployable river monitoring systems for flood risk reduction and more effective water resource management.
2. Design Requirements
In order for the complex challenges and constraints involved in the design of a river water-level measurement system to be properly understood, the main hydrographic characteristics, the factors contributing to flooding, and the operating environment of the system must be considered.
The characteristics related to the hydrographic network of a given region include its geographical location, river network, and soil structure. These factors determine the basic risk of water accumulation within the catchment area, which may be caused by rapid surface runoff and by the limited absorption capacity of the soil during prolonged rainfall. Climatic conditions also play an important role in the rapid increase in river water levels. The main contributing factors include intense precipitation, snowmelt, and climate change. Some of the most frequently underestimated flood-related factors are environmental ones. Among them, deforestation is particularly important, as the natural capacity for water retention is reduced. River pollution is another significant factor, since the hydraulic capacity of river channels may be decreased, thereby increasing the risk of blockages and overflow. Finally, historical flood data for the specific region should be examined and analyzed. Such information provides a basis for identifying the most relevant contributing factors, selecting the parameters that should be monitored, and determining the most appropriate approach for flood prediction.
When a flood early warning system is being planned, the specific coverage zones of the sensor network must also be taken into account. One of the main design challenges is related to the placement of the measurement sensor stations. As was already discussed in the literature review in Section 1, no unified approach has been established for selecting the variables and factors that should be monitored in order to identify the processes responsible for the formation of sudden flood waves in river channels. For this reason, it cannot be conclusively assumed that water-level measurements in short and steep ravines are unnecessary. On the contrary, when combined with precipitation data, such measurements may be used by the overall prediction system, since they can provide antecedent information regarding the expected water level in downstream and larger river sections. To some extent, flooding processes may occur more frequently in the upper parts of rivers and tributaries, although usually on a smaller scale and without causing significant damage. Nevertheless, these events may provide valuable information about the possible development of a flood in the main river section, particularly when this section passes through an urbanized area where potential damage would be considerably greater. In such cases, the inclusion of upstream measurements could improve the accuracy of the prediction model. However, this information may be difficult to use directly for warning purposes. Therefore, the deployment of sensors in the lower parts of river sections should be considered mandatory, whereas their installation in upper reaches and tributaries should be regarded as recommended and subject to further investigation. Considering that these locations are often difficult to access, proper optimization of available resources is required. The installation of local monitoring stations in every short ravine would require substantial financial and technical resources, which may not be justified in all cases. Therefore, the sensor network should be designed on the basis of a balanced strategy, in which critical downstream locations are prioritized, while selected upstream tributaries and ravines are instrumented only when their hydrological contribution is expected to improve the reliability of flood prediction.
3. System Architecture
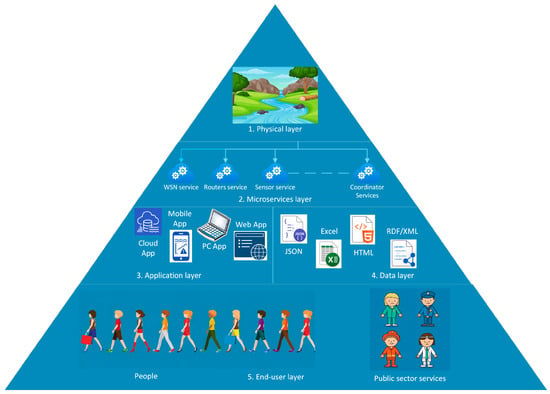
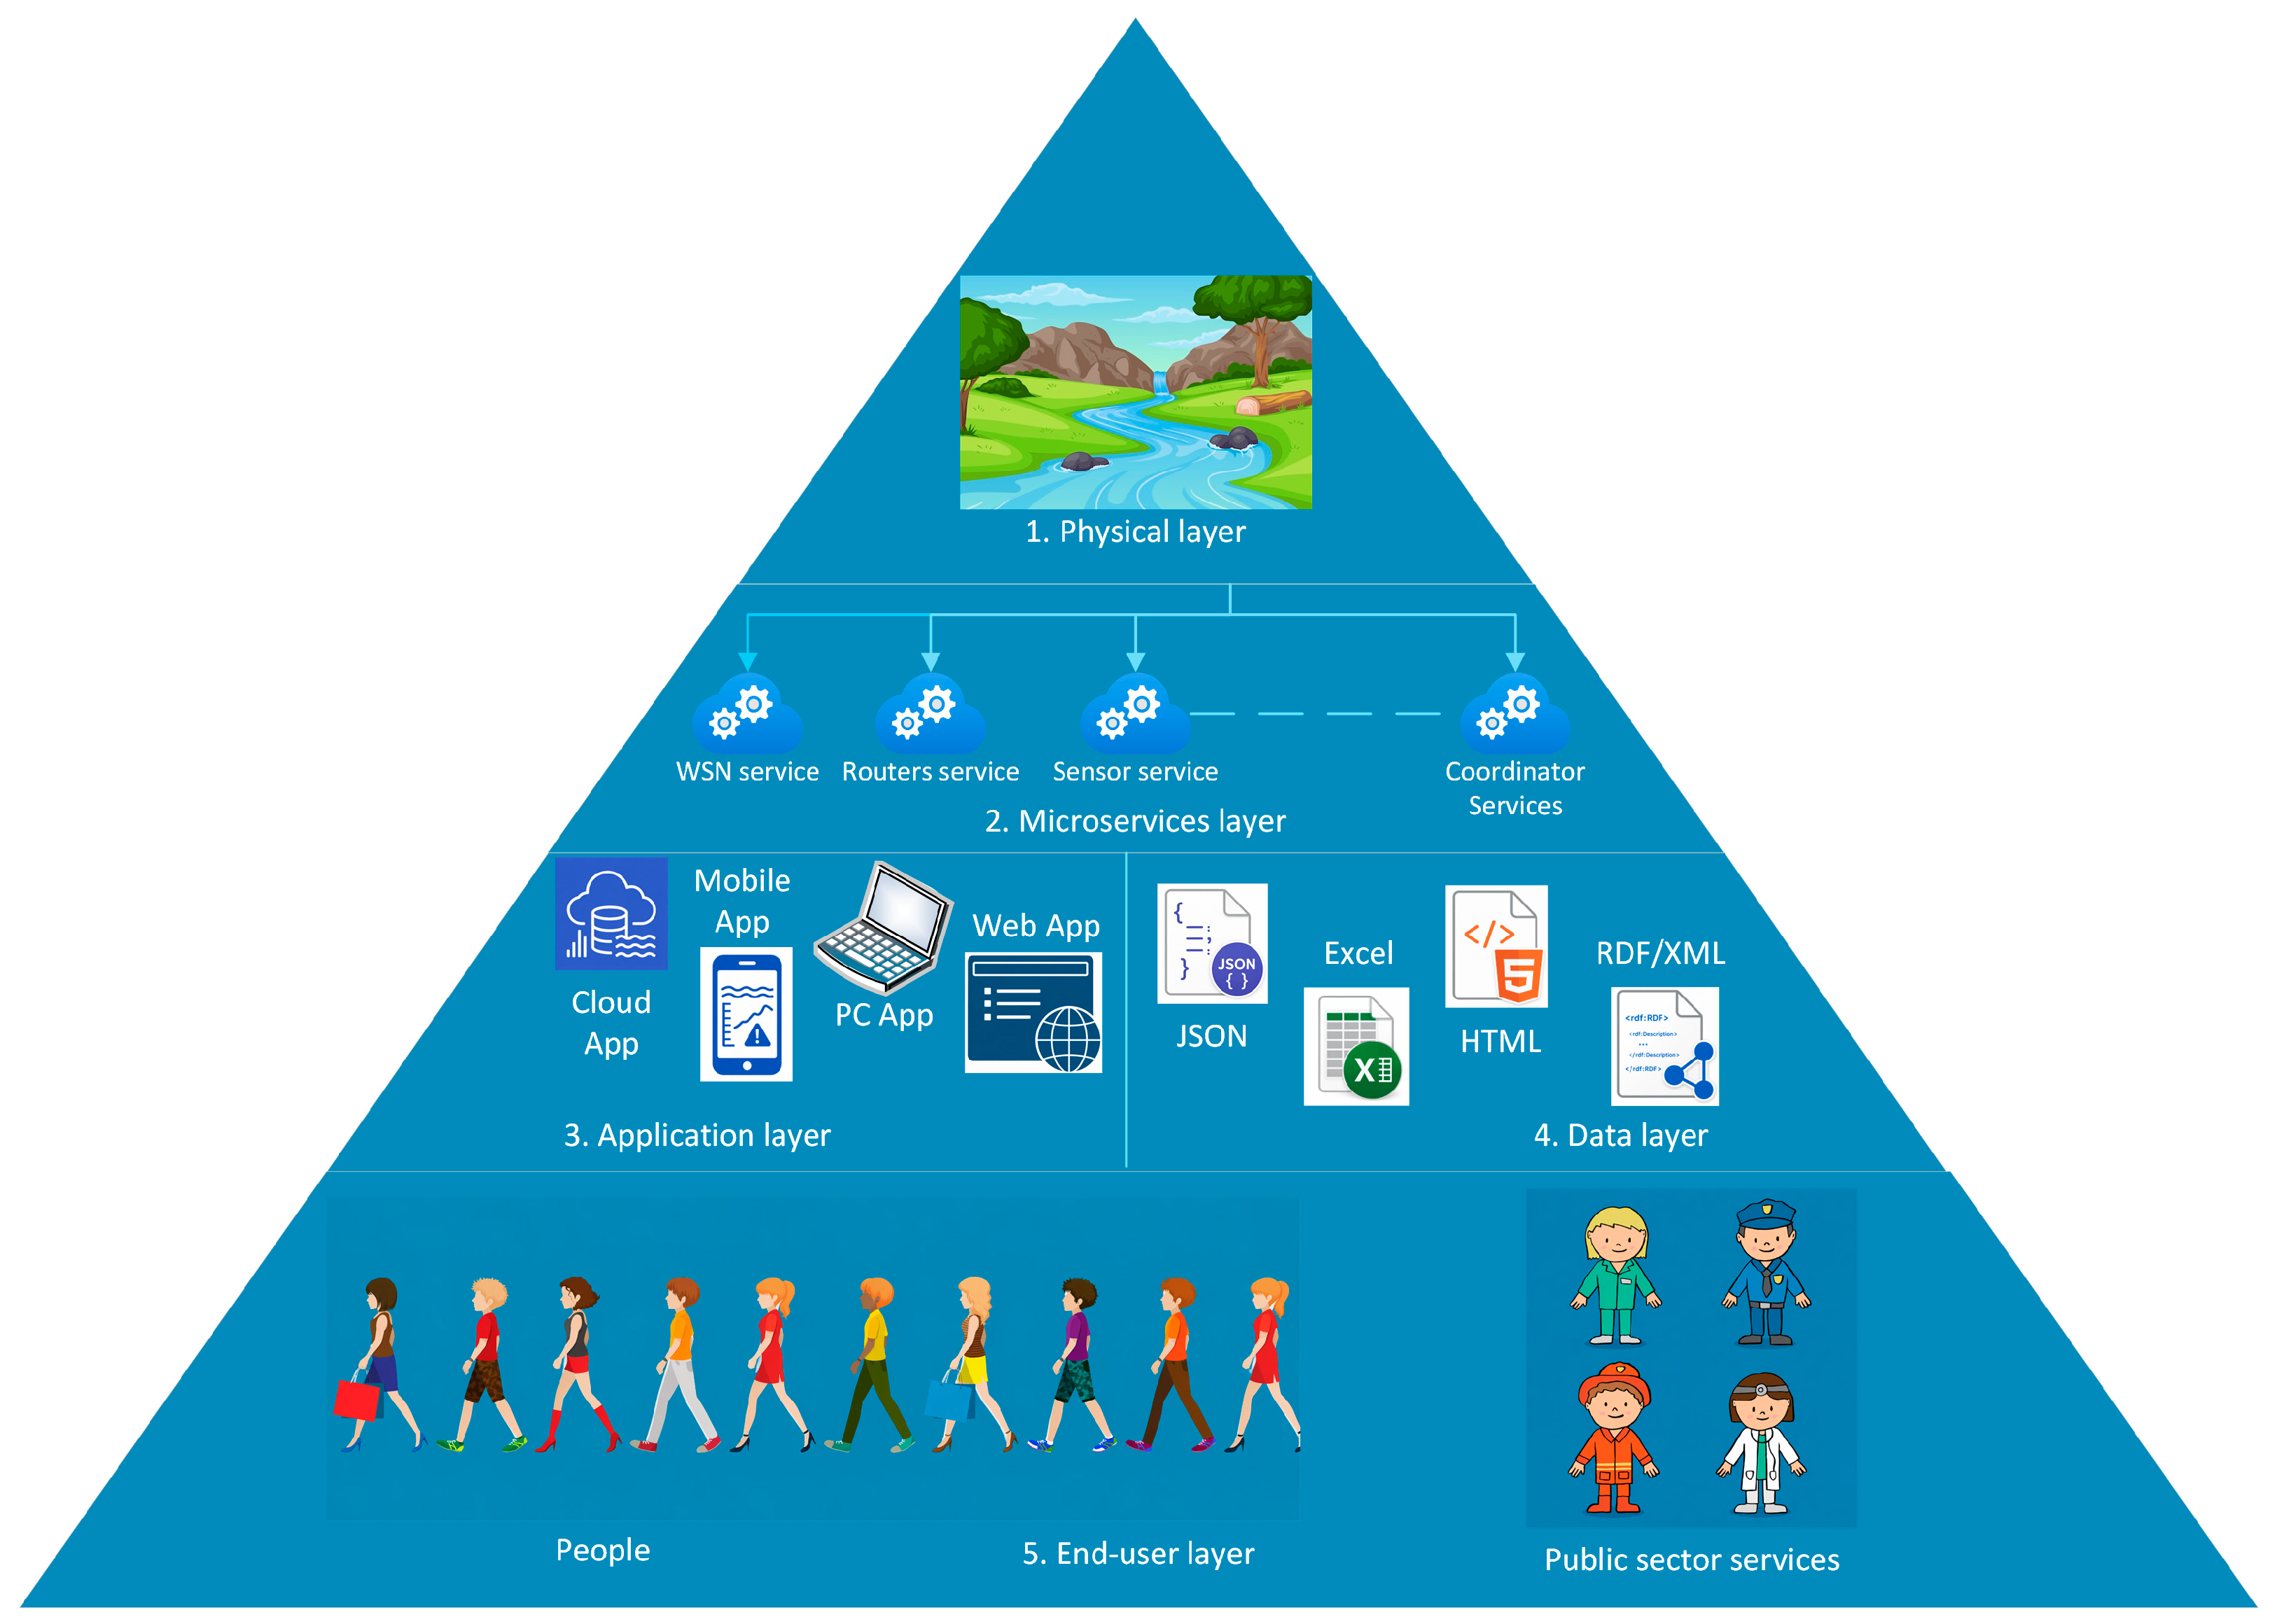
A typical architecture followed in most monitoring systems is a multilayer architecture based on a WSN. The proposed platform is presented in Figure 1. It is composed of microservices and is organized into five layers: the Physical Layer, the Microservice Layer, the Application Layer, the Data Layer, and the End-User Layer. In this context, the term microservices refers to the division of the system into small, independent modules or services. These modules act as intermediaries between the hardware components and the user applications. Each service is designed to be updated, deployed, and operated independently, which increases the flexibility, scalability, and maintainability of the overall system.
Figure 1.
Architecture of the multilayer system.
The first layer is the Physical Layer. It includes the measurement systems already deployed at appropriate locations along the river channel, i.e., a Wireless Sensor Network composed of sensor systems, routers, and coordinators, if required.
The second layer is the Microservice Layer. In this layer, each module is assigned a single specific function and is responsible for a defined aspect of transmitted information management. In this layer, the main focus is placed on the transmission of information to the servers, as well as on the reception and transmission of information to user applications and on compatibility between the different components.
The third layer includes the different software applications that will use the collected information and receive the warning messages.
Since systems of this type are considered part of the national security system, only open data cannot be used. Therefore, the information shared with stakeholders at different levels may be provided in different formats. The role of this layer is mainly related to controlled management, storage, and provision of access to the data, while the most appropriate format for their representation would be JSON, due to its ease of use in IoT, support for structured data, suitability for queries, and ease of integration.
The fifth layer refers to the users who will use the data shared or generated by the system. The most important objective of the system is to warn the population about a possible flood. However, the involvement of various public services and institutions, such as the police, fire department, medical facilities, municipality, and others, is also important. As stakeholders, they would have a significant role in the usefulness of such a system, as well as the corresponding responsibility with regard to this system.
4. Monitoring System Architecture
The main components of a typical flood monitoring and early warning system are sensors, a controller, a communication module, and a power supply. Thus, the example system is based on wireless sensor data transmission, i.e., a WSN system, and communication with other devices. A LoRa wireless network is implemented, and the devices included in it are the end sensor modules, the LoRa gateway, and the network server. In the current section, attention is focused on the end sensor modules and the quantities that will be measured by them.
4.1. Measurement System Based on ESP32 and a LoRa Module
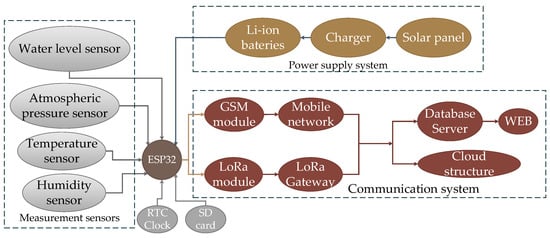
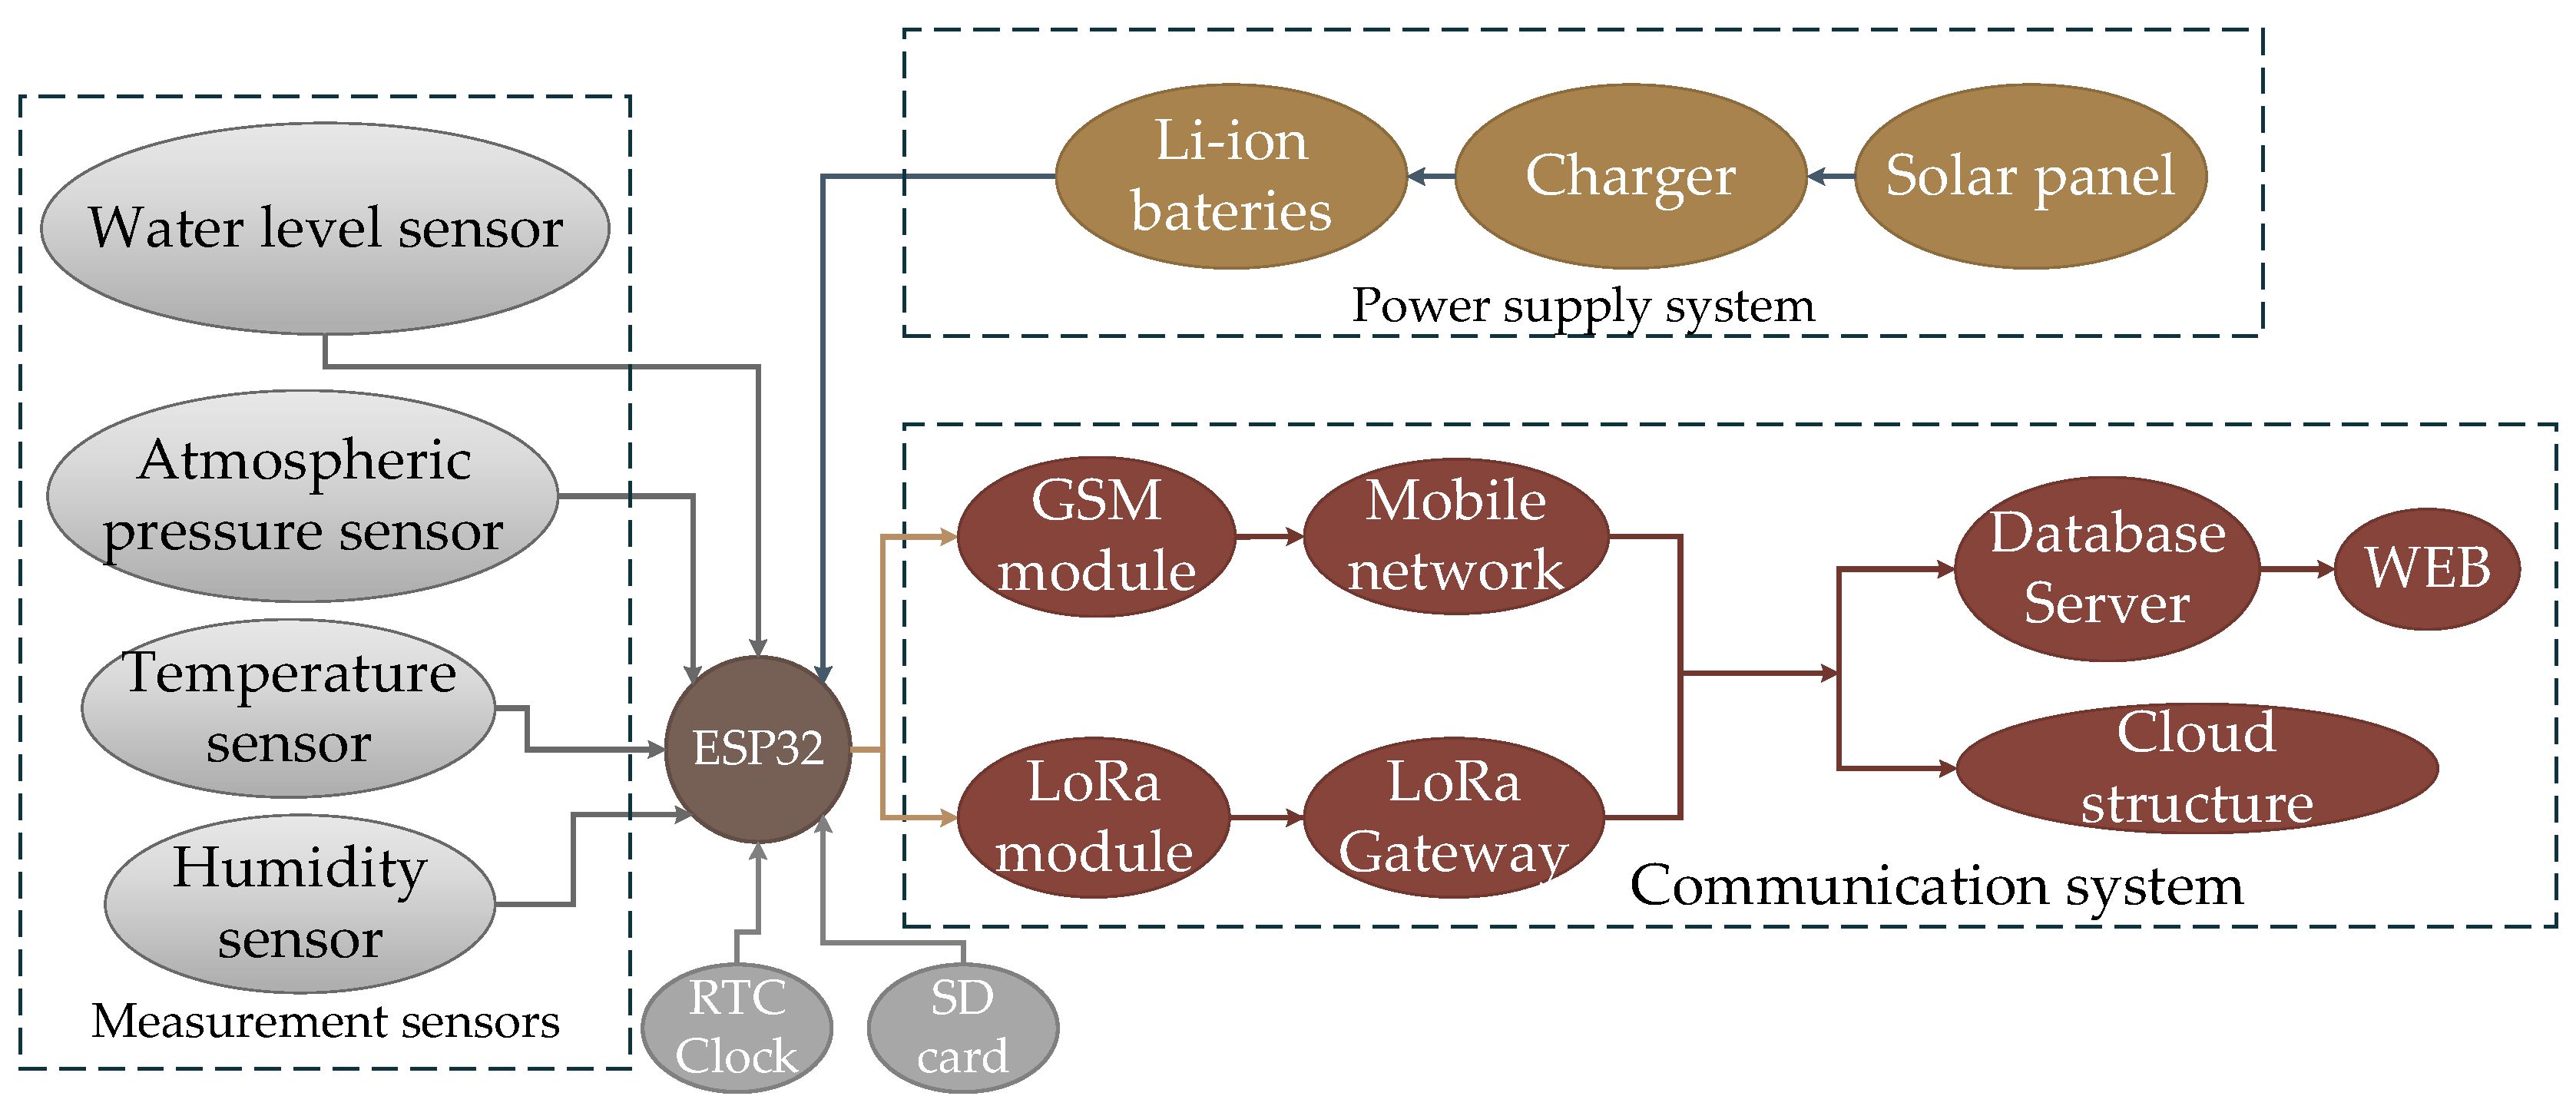
These monitoring devices are based on Heltec WiFi LoRa 32 (Heltec Automation, Chengdu, China) or LILYGO TTGO T-Call V1.4/V1.5 ESP32 (Shenzhen Xinyuan Electronic Technology Co., Ltd., Shenzhen, China). The main idea behind this type of device is that it should be designed according to the principles of low-cost implementation. The reason for this is that the devices will operate in harsh environments and, formally, may be irreversibly lost if a flood event occurs. These modules are installed along the river, in tributaries, and in selected ravines. A block diagram of the system is shown in Figure 2.
Figure 2.
Architecture of the measurement system.
Heltec WiFi LoRa 32 microprocessor system is proposed as the main control and communication platform. The controller is equipped with an integrated 32-bit Xtensa® 32-bit LX7 dual-core processor, 384 KBytes ROM, 512 KBytes embedded SRAM, an RTC timer with 16 KB SRAM memory accessible by the processor, and 8 MB Flash memory. A WiFi 802.11n 2.4 GHz transmitter with a maximum speed of 150 Mbps is integrated into the chip. A dual-mode Bluetooth v5 module (EDR and BLE) is also embedded. Connection to the controller can be established through SPI, I2C, I2S, UART, IR, CAN 2.0, and other interfaces. The system is also provided with an SX1262 LoRa node chip, supporting several frequency bands (470–510 MHz, 867–870 MHz, and 902–928 MHz) with a maximum power value of 21 dBm.
In addition, an SD card reader is added to the module for storing the incoming data. ESP32 series controllers are equipped with two processor cores and an integrated RTOS. This allows the execution of the two subsystems, namely the measurement subsystem and the communication subsystem, to be distributed across the separate processor cores. On each core, one or more threads are executed simultaneously, related to measurement, filtering, and secondary processing of the measured data, establishment of communication with the LoRa gateway, storage of the measured data, and their transmission.
The power supply of the system is provided by a solar panel in combination with a charging unit and lithium-ion batteries. Since these systems will not operate under direct sunlight, the solar panel itself must be relocated to a suitable position. The power supply system must be oversized, although the LoRa module consumes little energy. In order to save energy, the microcontroller is again placed in DeepSleep mode.
4.2. Measurement Parameters and Sensors
As already explained, a more generalized variant of a WSN monitoring system is proposed in order to achieve more accurate prediction of flood risk. This can be accomplished only by measuring direct and indirect parameters that influence this process, namely, water level in the river channel, atmospheric pressure, humidity, and temperature.
Water level is the main direct indicator of flooding, not only because it is directly related to flood occurrence, but also because flood risk can be assessed through water-level measurements as a quantity proportional to the change in level over a given period of time. This is particularly important, since, when the hydrograph of a river is analyzed, the peak value of the water-level change may precede the increase in flood risk by up to 12 h and the flood event itself by up to 24 h. Two options are proposed for water-level measurement: an ultrasonic sensor or a ToF laser range sensor.
The ultrasonic sensor is frequently used in systems of this type; however, filtering and temperature compensation are required in order for accurate measurements to be obtained. The measurement range of these sensors is up to 5 m, with an accuracy of 1 cm. This is also one of the lowest-cost options, which is probably the main reason for its wider use. A suitable option would be the JSN-SR04T sensor (Shenzhen Jieshenna Technology Co., Ltd., Shenzhen, China), which is intended for liquid-level measurement in industrial applications.
When a larger measurement range and higher accuracy are required, a ToF laser range sensor can be used. Its cost is not significantly higher, while the measurement range is increased up to 40 m, with an accuracy of 1 mm. A significant disadvantage of this type of sensor is its sensitivity to operating conditions, especially due to the fact that flowing water will be measured. This requires several values to be measured for each transmitted data packet and subsequent data processing to be performed. This sensor would be suitable for lower, wider, and slower-flowing river sections.
Atmospheric pressure is the most important among the indirect parameters. A decrease or increase in the value of this parameter is a well-known indication of precipitation and subsequent weather improvement. However, it is less commonly known that the duration and dynamics of atmospheric pressure variation can also be used to predict the duration and intensity of precipitation, while a sudden drop is a clear indication of severe atmospheric instability. From a temporal perspective, the lowest value reached during a decrease in atmospheric pressure may precede precipitation by up to 24 h.
Humidity and temperature belong to the group of indirect indicators and can be discussed together. Both parameters are seasonal in nature, but they are related to river water levels. Humidity and temperature play a role in cloud formation and, consequently, in precipitation, as they are involved in the two main principles of cloud formation:
- Through cooling: the air is cooled to its saturation point, i.e., the dew point, usually as a result of upward movement; as a result, water vapor is condensed and clouds are formed.
- Through evaporation and mixing: water vapor is added to the air when small droplets are evaporated, and humid air is mixed with drier air; this, in turn, leads to cloud formation and an increase in humidity.
In addition, temperature becomes a significant factor during the winter–spring months, when it is higher than the average value for the corresponding month. Under such conditions, intensive snowmelt may occur, leading to an increase in river water levels. Humidity is a factor over a relatively shorter time scale during precipitation events, with its increase and the decrease in temperature preceding precipitation by 1 to 2 h.
The last three parameters can be measured using a single combined sensor, such as the BME280 (Bosch Sensortec GmbH, Reutlingen, Germany). The measurement ranges of this sensor fully meet the technical requirements of systems of this type, while the accuracies are up to 3% for humidity, ±1 hPa for atmospheric pressure, and ±1 °C for temperature.
5. Communication System
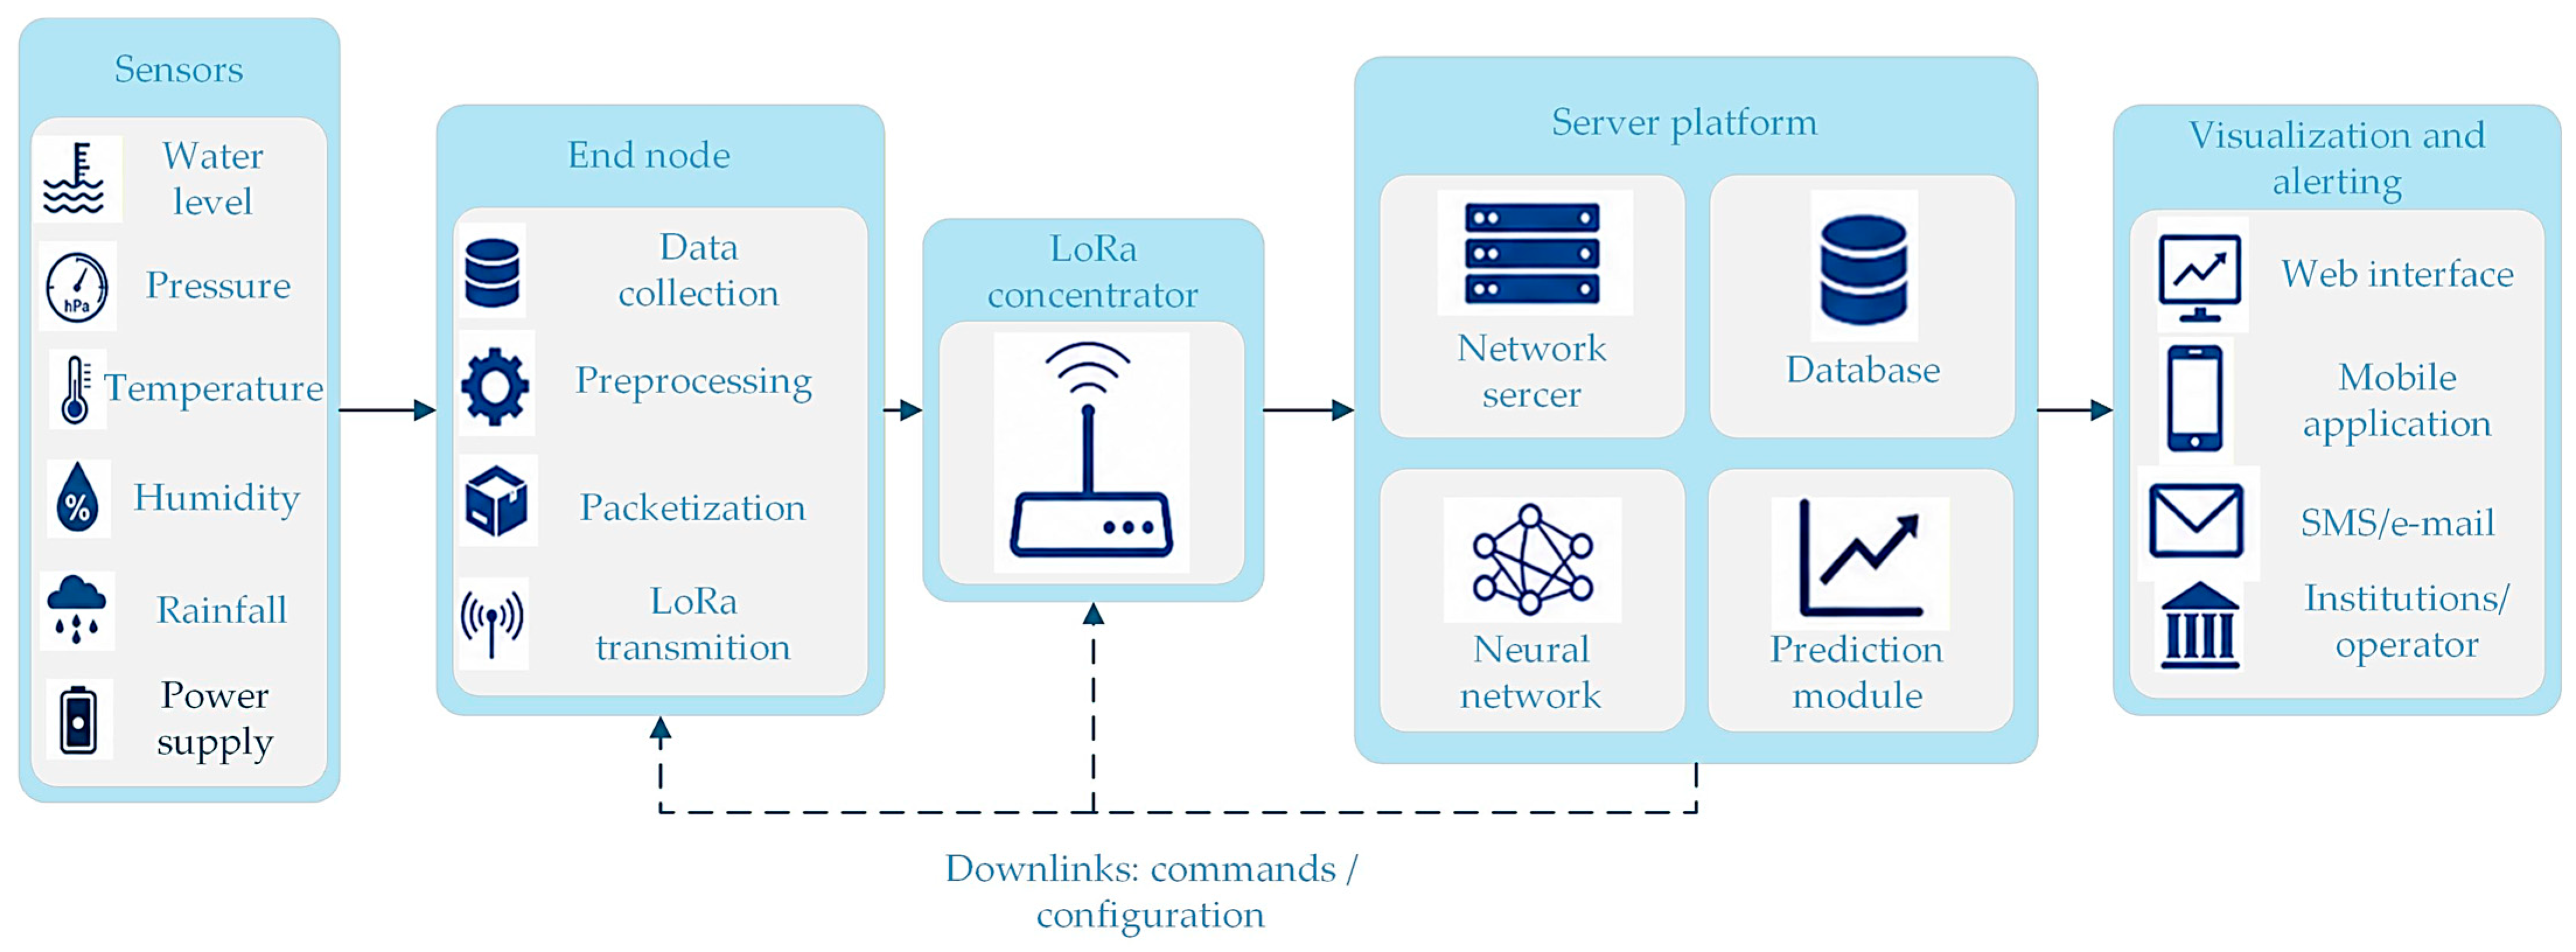
The proposed system for rural river water-level monitoring is designed as a distributed IoT architecture, in which the main communication task is the reliable transmission of measurement data from remote sensor points to a centralized server platform for analysis, prediction, and early warning. The use of LoRaWAN technology enables low-power, long-range communication to be implemented, which is particularly suitable for areas with limited infrastructure, difficult terrain, and a need for autonomous operation of the end devices.
The communication chain in the system can be represented as a sequence of several functional levels: the sensor level, LoRaWAN end devices, LoRa gateway, IP-based transmission network, server platform with an analytical module, and user layer for visualization and notification (Figure 3). Each of these levels performs a specific role in the process of data acquisition, transmission, processing, and interpretation.
Figure 3.
Communication system.
At the sensor level, the already presented measurement elements are deployed, which are intended to register hydrological and related parameters. These sensors are connected to an end device, which acts as a local communication and preprocessing node. The data from the sensors are collected by the end device, basic processing is performed, and the data are structured into a communication packet. This packet includes the device identifier, timestamp, and measured values. If necessary, local logic for adaptive transmission can be applied—for example, under normal conditions, data may be transmitted at longer intervals, whereas, when a sharp rise in the water level is detected, the transmission frequency may be increased. In this way, a balance between energy efficiency and timely reporting of critical events is achieved.
After the message has been formed, it is transmitted by the end device through the LoRa radio channel to one or more LoRa gateways. In LoRaWAN networks, end devices are not statically associated with a specific gateway. Each gateway located within the coverage range can receive the transmitted packet and forward it to the network server. This feature increases the reliability of the system, since the same message can be received through several independent communication paths.
The LoRa gateway acts as an intermediate unit between the radio network and the IP infrastructure. LoRaWAN packets are received from the end devices and are forwarded through the Internet to the server platform. This connection can be established through a mobile network or another available data transmission channel. No substantial interpretation of the payload is performed by the gateway; instead, message transport to the higher levels of the system is ensured.
At the server level, the incoming messages are received, validated, and processed. The network server is responsible for device authentication, duplicate packet removal, communication parameter management, and data routing to the application layer. The data are then stored in a database and are provided to an analytical module, in which a prediction model based on a nonlinear neural network is implemented. This model analyzes current and previous measurements, while the dynamics of the water level, the rate of change, local meteorological conditions, and the specific characteristics of the monitored river section can be taken into account.
The main task of the neural network is to forecast the future state of the river level within a short-term time horizon. Instead of reacting only after a critical threshold has already been reached, a preliminary risk assessment is enabled by the prediction model. This is a significant advantage for early warning systems, since additional response time is provided for the responsible institutions and the population.
In addition to the main data flow from the end devices to the server, the system can also support downlink communication. Through this communication, commands can be sent by the server to selected end devices, for example, to change the measurement interval, activate an emergency mode, request an additional measurement, or perform remote configuration. However, this functionality should be aligned with the energy profile of the LoRaWAN devices, since they generally do not maintain continuous active reception of incoming messages.
The security of data exchange is an essential characteristic of the system, since incorrect, manipulated, or lost data may lead to an inaccurate risk assessment. Encryption and authentication are provided by LoRaWAN through separate keys at the network and application levels. Thus, the network infrastructure can validate the origin of the messages without necessarily having access to the payload content, which is processed at the application level.
6. Time Stamping and Adaptive Measurement Intervals in a River Monitoring System
The proposed river monitoring system collects data in time series, which requires each measurement to be accurately time-stamped in order for reliable analysis and prediction to be ensured. Each sensor node is equipped with an RTC; however, at a defined time interval, its internal clock is synchronized with the gateway device, by which the current date and time are provided. Each node stores the timestamp together with the measured parameters. These data, associated with a specific point in time, are transmitted to the central system for subsequent processing, storage, and use in prediction models.
In order for uniform periodic measurements with minimal time drift to be ensured, the time for entering DeepSleep mode is calculated by the system itself when more frequent measurements are required. To save energy and optimize the amount of data to be processed, two time intervals for performing measurements are implemented: under normal conditions, data are collected at a fixed interval of 10 or 15 min; when critical conditions are detected, such as a rapid rise in water level or a sudden drop in atmospheric pressure, the interval is automatically reduced to 2 or 5 min.
7. Flood Prediction and Analysis
In the proposed system, the prediction of river level at specific points is intended to be implemented in a relatively simple manner which, according to the literature review, is both effective and feasible, namely by predicting the water level through an intelligent method based on nonlinear artificial neural networks. The difference between what is intended to be achieved here and in other systems is as follows:
- -
- The WSN architecture is used for predicting the level of the investigated river, rather than the data being used to predict the levels of other rivers;
- -
- The measured parameters are used for predicting the river level at downstream points and for assessing flood risk, rather than for predicting flood risk based on data and other historical preconditions.
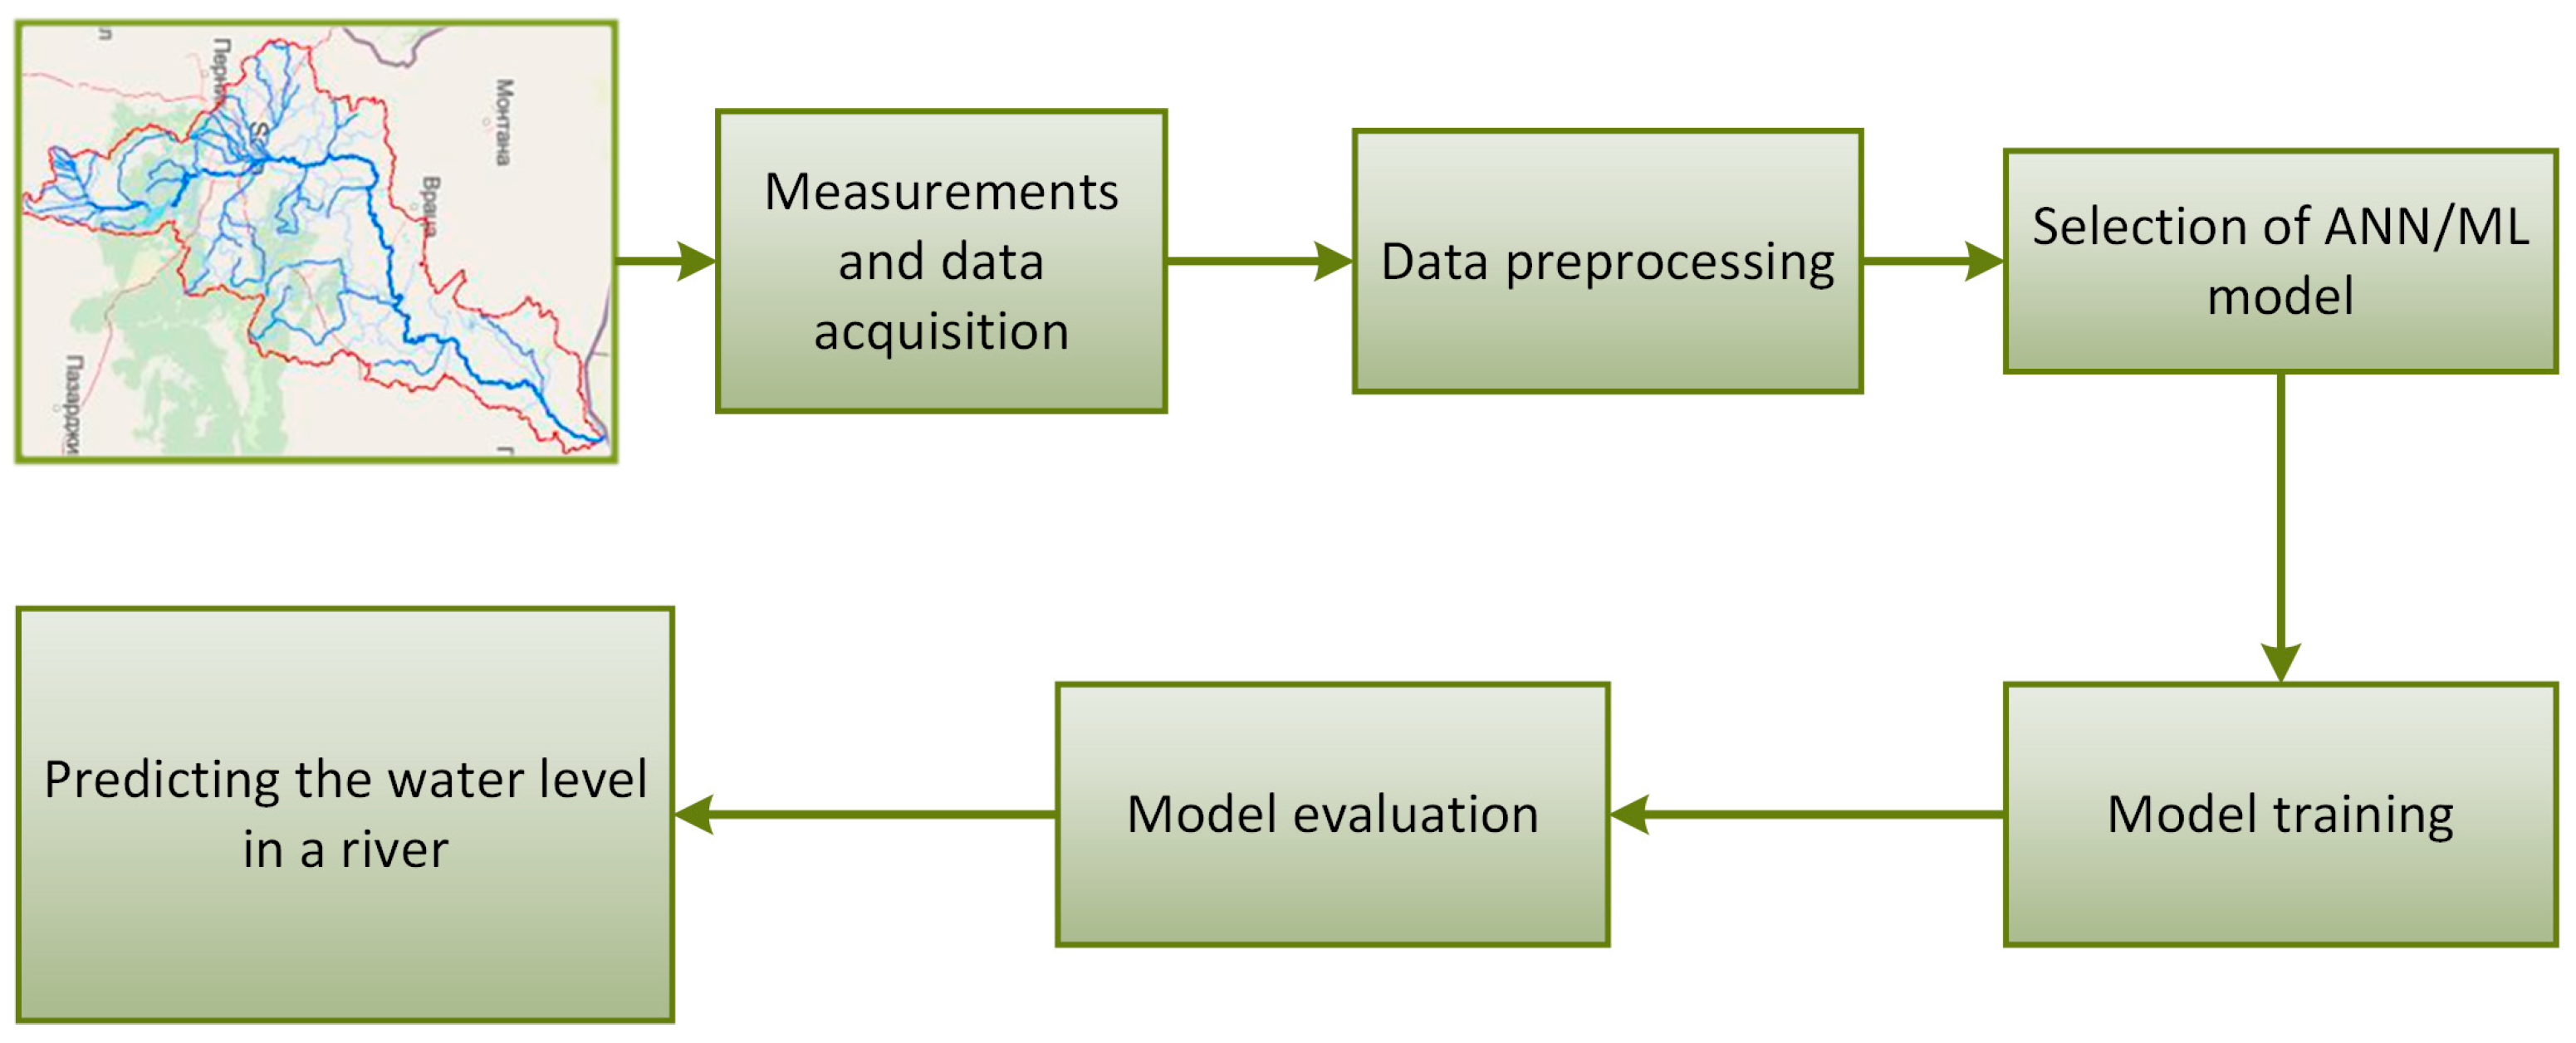
A block diagram of the process is shown in Figure 4.
Figure 4.
Block diagram of the river water-level prediction process.
7.1. Data Collection
Data are collected daily from each sensor module. As already described, in addition to the directly measured values, other quantities are also formed, which represent an estimate of the change in river level. In order for accurate prediction and good results to be achieved, data must be collected for at least one calendar year so that all seasons can be covered. In addition to the direct measurement and collection of data, two additional quantities are formed, which will be used for the training and operation of the prediction model: , representing the change in water level, and , representing an estimate of the incoming water from upstream sections.
7.2. Data Preprocessing
When prediction is aimed for, several stages of raw data preprocessing are required in order for the best possible results to be achieved, including filtering, anomaly removal, normalization, interpolation, and others. Data filtering is performed at a low level directly in the sensor modules, especially when ultrasonic and ToF sensors are used. Anomaly removal is a specific process and should not preferably be performed in the sensor modules, but subsequently, for example, by using a method for adaptive threshold processing. When data from many variables measured in different units and at different scales are used, normalization is required. Normalization is very important when artificial neural networks or machine learning are applied. Through normalization, it is aimed to ensure that no feature has an excessively large influence on the model. If data are missing due to a communication problem or a non-operating sensor, the implementation of some type of interpolation may also be considered in order to fill in the missing values. However, this process is more complex than it appears, since, when the real data are received, they must replace the values generated by interpolation.
7.3. Selection of a Model for River Flood Prediction
One of the main applications of artificial neural networks (ANNs) is the prediction of time series values. Particularly good results are obtained with so-called nonlinear ANN models. These models are suitable for dealing with nonlinear dynamic problems, such as the current one, namely the change in river water level. By selecting an appropriate ANN architecture and a corresponding number of neurons, a nonlinear system can be modeled with arbitrary accuracy.
In many forecasting tasks, a dependency exists between the studied chronological values and certain external information. The integration of this additional information contributes to the optimization of the analytical process and to the achievement of significantly more accurate results. One such type of ANN is the Nonlinear Autoregressive Neural Network with Exogenous Inputs (NARX model). This type of ANN predicts a series of values based on a given number of past values of the series and an additional external series , which may be univariate or multivariate. In order for an estimate of the upstream water-level measurements, which will affect the downstream section after a time delay , to be obtained, the same type of ANN model can again be used, or another approach may be applied after analysis of the acquired data, such as a weighted estimate from the upstream sensor systems:
where is the water level from the -th upstream station, is a weight according to the importance of the station, and is the delay to the downstream zone.
Thus, the mathematical definition of the NARX neural network can be described as:
where is the water level at the downstream station; are the water levels from the upstream stations; are the transport delays; and P, T and RH are atmospheric pressure, temperature, and relative humidity, respectively.
7.4. Model Training
Model training is a process not only of adjusting the weighting coefficients within the network, but also of ensuring the robustness and authenticity of the model. For this reason, the dataset is divided into three subsets: 70% for training, 15% for validation, and 15% for testing. The training method used is the Levenberg–Marquardt method. This method usually requires more memory, but is much faster. The training process is automatically terminated when the situation stops improving, which is observed when the mean squared error of the validation records begins to increase. For model training, the time series , composed of the values of and , represented as a vector containing the values of [], are formed. The resulting model can thus be used for early assessment of flood risk in the downstream part of the river.
7.5. Model Evaluation and Results Analysis
In order for the effectiveness of the proposed NARX model in predicting water levels to be evaluated, using both local measurements and upstream data, a set of key statistical indicators can be applied. Their purpose is to provide a comprehensive assessment of the accuracy and reliability of the neural network, as well as of its ability to capture the complex dynamics of the river water level.
The first of these indicators is the mean absolute error (MAE), which shows the average deviation of the predictions from the actual measurements. Accordingly, lower values indicate higher accuracy.
However, since even a single error at an unfavorable moment may have serious consequences in flood prediction, the mean squared error (MSE) is also used. Its advantage is that it is more sensitive to large deviations. In order for this indicator to be interpreted more intuitively, it is most often considered through its square root, namely the root mean squared error (RMSE), which returns the error value to the actual measurement units of the water level, for example centimeters or meters.
In order for a correct comparison to be made under different hydrological regimes, such as high-flow versus low-flow conditions, or between different river sections, relative indicators must also be included. Therefore, the root mean squared percentage error (RMSPE) and the normalized root mean squared error (NRMSE) are also included. These metrics scale the error relative to the data themselves, which makes them independent of the absolute values of the water level.
Finally, in order for the model to be evaluated as a whole, the coefficient of determination can also be used. It indicates what proportion of the variations in the water level is actually predicted by the trained NARX model. The closer the value is to 1, the more successfully the network has “learned” the patterns in the data.
8. Conclusions
In this paper, a proposal for a river water-level monitoring and flood early warning system based on a WSN architecture and ANN-based prediction is presented. A literature review was conducted, and the main limitation was identified as the lack of understanding that effective flood early warning is achieved through an integrated system based on a close relationship between monitoring and prediction. The main challenges and limitations in the design of this type of solution were presented, based on geographical characteristics, contributing factors, and the operating environment. The proposed architecture represents a perspective for the development of such systems based on a WSN multilayer structure consisting of five levels. The monitoring system itself is defined as a combination of an ESP32-based microprocessor system and a LoRaWAN module for communication. The development of the communication system based on a LoRa communication network provides the possibility for seamless transmission of the values of the predefined monitoring parameters in difficult-to-access environments. Early warning of a potential flood is implemented through the prediction of water levels in urbanized areas by using data from the sensor modules. By training a nonlinear ANN that operates with data from the measured parameters, as well as with an introduced approach based on the assessment of water levels in preceding upstream tributaries, high prediction efficiency is aimed to be achieved, and consequently, timely determination of flood risk is enabled.
Future work will focus on the deployment of the proposed sensor infrastructure and the collection of a representative real-world dataset. This will enable the training, testing, and validation of the proposed NARX-based prediction model, including graphical comparisons between predicted and observed river-level values and the computation of numerical performance metrics such as RMSE, MAE, and coefficient of determination.
Author Contributions
Conceptualization, H.S. and S.S.; methodology, H.S.; software, G.M.; validation, S.S., N.M. and B.K.; formal analysis, H.S.; investigation, S.S.; resources, N.M.; data curation, B.K.; writing—original draft preparation, H.S.; writing—review and editing, H.S.; visualization, N.M.; supervision, S.S.; project administration, S.S.; funding acquisition, S.S. All authors have read and agreed to the published version of the manuscript.
Funding
The publication is supported by the Project № BG16RFPR002-1.014-0013-C01 “Digitalization of Economy in Big Data Environment—Second Stage” (DIGD2) financed by the “Research, Innovation and Digitalization for Smart Transformation” Program 2021–2027 and co-funded by the European Union.
Institutional Review Board Statement
Not applicable.
Informed Consent Statement
Not applicable.
Data Availability Statement
The data are available from the corresponding author upon request.
Conflicts of Interest
The authors declare no conflicts of interest.
Abbreviations
The following abbreviations are used in this manuscript:
| WSN | Wireless Sensor Network |
| FBG | Fiber Bragg Grating |
| NARX | Nonlinear Autoregressive with eXogenous inputs |
| LoRaWAN | Long Range Wide Area Network |
References
- Moreno, C.; Aquino, R.; Ibarreche, J.; Pérez, I.; Castellanos, E.; Álvarez, E.; Rentería, R.; Anguiano, L.; Edwards, A.; Lepper, P.; et al. RiverCore: IoT Device for River Water Level Monitoring over Cellular Communications. Sensors 2019, 19, 127. [Google Scholar] [CrossRef] [Scilit] [PubMed]
- Zain, S.N.M.; Razif, M.R.M.; Misman, D.; Yusoff, A.H.; Sulaiman, M.S.; Zaik, M.A.; Bostaman, N.S.; Azis, M.N.A. Development of a Wireless Monitoring System to Monitor River Water Levels in Real Time. Int. J. Integr. Eng. 2023, 15, 249–256. [Google Scholar] [CrossRef] [Scilit]
- Kamarudin, A.A.; Razif, M.R.M.; Hassan, O.A.; Zaik, M.A.; Mustapha, N.H.M. Development of Flood Early Warning System by Monitoring Pagoh River Water Level and Rainfall Distribution. In Proceedings of the 7th International Conference on Electrical, Control and Computer Engineering–Volume 1. InECCE 2023; Zain, M., Sulaiman, Z., Mustafa, N., Shakib, M., Jabbar, M.N., Eds.; Lecture Notes in Electrical Engineering; Springer: Singapore, 2024; Volume 1212. [Google Scholar] [CrossRef] [Scilit]
- Masoudimoghaddam, M.; Yazdi, J.; Shahsavandi, M. A low-cost ultrasonic sensor for online monitoring of water levels in rivers and channels. Flow Meas. Instrum. 2025, 102, 102777. [Google Scholar] [CrossRef] [Scilit]
- Demir, F.; Sonmez, O. A Real-Time Water Level and Discharge Monitoring Station: A Case Study of the Sakarya River. Appl. Sci. 2025, 15, 1910. [Google Scholar] [CrossRef] [Scilit]
- Kalyanapu, A.; Owusu, C.; Wright, T.; Datta, T. Low-Cost Real-Time Water Level Monitoring Network for Falling Water River Watershed: A Case Study. Geosciences 2023, 13, 65. [Google Scholar] [CrossRef] [Scilit]
- Mathai, E.; George, A.; Babu, A.; Muhammed Yaseen, M.S.; Kumar, A. Design & Development of Smart River Water Level Monitoring System. In Proceedings of the Second International Conference on Intelligent Cyber Physical Systems and Internet of Things (ICoICI), Coimbatore, India, 28–30 August 2024. [Google Scholar]
- Acosta, J.; Mendez, D.; Moreno, D.; Montanez, G.; Trujillo, L.; Escobar, M.; Gonzalez, I. An IoT-based scalable river level monitoring platform. Int. J. Sens. Netw. 2022, 38, 263–272. [Google Scholar] [CrossRef]
- Wang, Y.J.; Liu, Z.G. GPRS based river water level monitoring and measuring system. In Proceedings of the 29th Chinese Control And Decision Conference (CCDC), Chongqing, China, 28–30 May 2017. [Google Scholar]
- Almazan, C.E.A.; Eleria, E.A.C.; Selibio, C.P.T. A Ups Water Level Monitoring Device for River Environments. ARPN J. Eng. Appl. Sci. 2021, 16, 106–111. [Google Scholar]
- Ibrahim, I.D.B.M.; Kadir, H.A.; Saon, S.; Mahamad, A.K.; Isa, K.; Ahmadon, M.A.; Yamaguchi, S. Smart Water Level River Monitoring System with IoT. In Proceedings of the 2024 IEEE 13th Global Conference on Consumer Electronics (GCCE), Kitakyushu, Japan, 29 October–1 November 2024. [Google Scholar]
- Sulistyowati, R.; Sujono, H.A.; Musthofa, A.K. A River Water Level Monitoring System Using Android-Based Wireless Sensor Networks for a Flood Early Warning System. In Proceedings of Second International Conference on Electrical Systems, Technology and Information 2015 (ICESTI 2015); Pasila, F., Tanoto, Y., Lim, R., Santoso, M., Pah, N., Eds.; Lecture Notes in Electrical Engineering; Springer: Singapore; Volume 365. [CrossRef] [Scilit]
- Soehartanto, T.; Radhy, A.; Alwi, A.M.I. Design of mechanical digitalization automatic water level recorder for river water level monitoring. J. Phys. Conf. Ser. 2023, 2673, 012019. [Google Scholar] [CrossRef] [Scilit]
- Pierret, A.; Silvera, N.; Latsachack, K.O.; Chanthavong, K.; Sounyafong, P.; Ribolzi, O. A float-controlled self-contained laser gauge for monitoring river levels in tropical environments. Hardwarex 2025, 23, e00682. [Google Scholar] [CrossRef] [Scilit] [PubMed]
- de Oliveira, L.A.; de Sousa, F.B.; de Sousa, F.M.; Tavares, S.C.C.; Paschoal, W., Jr.; Costa, M.B.C. Prototype of a sensor for simultaneous monitoring of water level and temperature of rivers in the Amazon using FBG. Opt. Quant. Electron. 2022, 54, 731. [Google Scholar] [CrossRef] [Scilit] [PubMed]
- Dalai, C.; Singh, M.; Sunad Kumara, A.N.; Patel, W.; Patil, H.; Maranan, R. Monitoring Water Levels in Rivers with optical fiber sensors. In Proceedings of the 5th International Conference on Innovative Trends in Information Technology (ICITIIT), Kottayam, India, 15–16 March 2024. [Google Scholar]
- Chen, J.-F.; Liao, Y.-T.; Wang, P.-C. Development and Deployment of a Virtual Water Gauge System Utilizing the ResNet-50 Convolutional Neural Network for Real-Time River Water Level Monitoring: A Case Study of the Keelung River in Taiwan. Water 2024, 16, 158. [Google Scholar] [CrossRef] [Scilit]
- Tiausas, F.; Murakami, Y.; Teranishi, Y.; Nagano, H.; Kikuta, K.; Murata, K.; Kobayashi, K. Towards Automated River Water Level Monitoring using Visual IoT Cameras. In Proceedings of the 27th International Conference on Distributed Computing and Networking, New York, NY, USA, 6–9 January 2026. [Google Scholar]
- Ding, Z.; Li, M.; Li, G.; Wei, Y.; Hu, Z. River Level Monitoring Based on Bridge Multi-Bounce in SAR Images. J. Signal Process. 2023, 39, 1673–1688. [Google Scholar] [CrossRef]
- Shiri, N.; Karimi, S.; Shiri, J. Machine Learning Approaches for Prediction of Daily River Flow. World J. Environ. Biosci. 2023, 12, 33–39. [Google Scholar] [CrossRef] [Scilit]
- Kamal, S.; Wang, J.; Dewan, M.A.A. Predicting Stream Flows and Dynamics of the Athabasca River Basin Using Machine Learning. Water 2024, 16, 3488. [Google Scholar] [CrossRef] [Scilit]
- Saba, T. Neural approach to predict flow discharge in river Chenab Pakistan. J. Adv. Comput. Intell. Intell. Inform. 2016, 20, 730–734. [Google Scholar] [CrossRef] [Scilit]
- Vásquez-Ramírez, L.; Vásquez-Paredes, L.F. Prediction of monthly flows in rivers of high Andean basins with an artificial neural network approach. Case: Crisnejas river, Peru. Tecnol. Y Cienc. Del. Agua 2023, 14, 124–199. [Google Scholar] [CrossRef] [Scilit]
- Kartal, V.; Karakoyun, E.; Akiner, M.E.; Katipoğlu, O.M.; Kuriqi, A. Optimizing river flow rate predictions: Integrating cognitive approaches and meteorological insights. Nat. Hazards 2025, 121, 5729–5756. [Google Scholar] [CrossRef] [Scilit]
- Ikram, R.M.A.; Wang, M.; Moayedi, H.; Gholizadeh, M.H.; Dehrashid, A.A.; Thi, Q.T. Developed strategies of artificial intelligence in the prediction flow river flood using evolutionary optimized algorithms of ANN. Environ. Dev. Sustain. 2024. [Google Scholar] [CrossRef] [Scilit]
- Wang, Y.; Sun, T.; Liang, X.; Xie, H. Prediction of river water flow and water level based on EMD-LSTM model. Adv. Sci. Technol. Water Resour. 2020, 40, 40–47. [Google Scholar] [CrossRef]
- Luo, Z. Predicting river flow using the ViT-LSTM deep learning model by fusing multimodal data. In Proceedings of the SPIE the International Society for Optical Engineering, Telok Blangah, Singapore, 18–20 January 2026. [Google Scholar]
- Selva Jeba, G.; Chitra, P. River flood prediction through flow level modeling using multi-attention encoder-decoder-based TCN with filter-wrapper feature selection. Earth Sci. Inform. 2024, 17, 5233–5249. [Google Scholar] [CrossRef] [Scilit]
Disclaimer/Publisher’s Note: The statements, opinions and data contained in all publications are solely those of the individual author(s) and contributor(s) and not of MDPI and/or the editor(s). MDPI and/or the editor(s) disclaim responsibility for any injury to people or property resulting from any ideas, methods, instructions or products referred to in the content. |
© 2026 by the authors. Licensee MDPI, Basel, Switzerland. This article is an open access article distributed under the terms and conditions of the Creative Commons Attribution (CC BY) license.