


Abstract
This study focuses on the fatigue resistance of aluminum friction-stir-welded (FSW) butt joints beyond the current design standards such as Eurocode 9 and CSA S6, which use generic S–N curves. A database of 1041 data points from 92 studies is analyzed using a statistical methodology by alloy, FSW variant, and stress ratio. The results show that fatigue strength more strongly depends on the alloy rather than on welding FSW variant. While existing codes give conservative estimation of the fatigue strength at a 50% probability of failure, they may be unconservative for lower probability of failure due to data scatter. This conclusion highlights the need for grade-specific S–N curves and additional guidance on scatter assessment.
1. Introduction
To date, aluminum remains underutilized in bridge construction compared to structural steel, despite its advantageous materials properties (density, corrosion resistance, high formability)and low carbon footprint [1]. The two major technical constraints limiting its wider adoption are the challenges related to conventional welding, and its fatigue resistance inferior to steel. In this context, the implementation of friction stir welding (FSW) presents a significant advantage. This technique, developed by the Welding Institute [2], relies on frictional heat generation and plastic deformation of the material, producing welds with few discontinuities. Consequently, FSW joints exhibit superior fatigue resistance, compared with its fusion weld joint counterpart, which is attributed to their refined microstructure, significantly fewer porosities, favorable residual stress distribution, and reduced distortion [3]. Given that approximately 90% of structural failures supporting cyclic loading [4] in metallic assemblies are attributed to fatigue, dimensioning welds for fatigue resistance is critical.
The fatigue design of welded structures is commonly based on the nominal stress methods, also known as the global approach. In this method, the nominal stress is calculated from the weld cross-section without considering the local geometric effects. The weld details (type of joint and geometry) are then used to select the appropriate stress–life (S–N) curve, which characterizes the fatigue strength of an assembly. This approach is described in the European code [5] (EC9) and in the International Institute of Welding [6] (IIW) recommendations. A similar design methodology is applied in the Canadian Highway Bridge Design Code [7] (CSA S6). The S–N curves specified in these design codes, for each detail, are obtained using linear regression of experimental data presented on a log(S)-log(N) graph. Recent versions of EC9 [5] (2023) and CSA S6 [7] (2025) include FSW butt joints as recognized weld details. These details are independent of the alloy type, hardening treatment, welding parameters, and FSW variants. Moreover, the current design curves do not explicitly account for mean stress effects or the possible high scatter of stress-life data due to different welding parameters.
To address these limitations, an extensive statistical analysis of the data available in the literature is proposed. The aim of this study is to provide a comprehensive overview of the fatigue performance of FSW joints based on the analysis of S–N curves.
2. Background Information
2.1. Description of Standards
To the author’s knowledge, the fatigue design curves 56-7 and B’ are the only ones specified by the EC9 and CSA S6 codes for FSW butt joints, respectively. In both codes, the proposed S–N curves are expressed by a Basquin-type linear regression, as shown in Equation (1):
where N is the number of stress cycles to failure, Δσ the fatigue strength range, and C and m are material parameters. In EC9 and CSA S6, the joint fatigue strength is assumed to be constant beyond 5 × 10⁶ cycles of constant amplitude solicitation. The fatigue strength range (Δσcalf) corresponding to this number of cycles is defined as the Constant Amplitude Fatigue Limit (CALF). The characteristics of the design S–N curves proposed by each code are summarized in Table 1. While the inverse logarithmic slope parameter m is the same in both codes, the intercept parameter C differs. This may be explained by the use of different datasets for the determination of the codes.
Table 1.
S–N curves characteristics.
2.2. Statistical Analysis of Fatigue Data
Table 2 presents the statistical analysis of fatigue strength data of FSWs conducted by several authors. Their main objective was to compare the fatigue strength of FSWs with their counterpart, fusion welds, for butt joints. All analysis combined data was acquired from 5 to 18 papers, 2 to 4 alloys, weld thickness ranging from 2 to 15 mm, and a 2 to 4 stress ratio (R = σmin/σmax). Havia et al. [9] considered the mean stress effect using the Smith Walker Topper (SWT) method, whereas other authors either grouped the data separately according to different stress ratios or reported them without applying any correction. While the aggregated datasets from these studies remain large compared to those presented in a single paper, the robustness of the statistical analysis benefits from the inclusion of modern data, specifically those characterizing the variants of conventional FSW (C-FSW), such as bobbin tool FSW (BT-FSW) or double-sided FSW (DS-FSW).
Table 2.
Previous statistical analysis of FSW fatigue data.
3. Methodology of Analysis
3.1. Description of the Dataset
The data gathered in this paper are experimental fatigue strength of FSW butt welds applying constant amplitude loading in the range of 1 × 10⁴ and 5 × 10⁶ cycles. Run-out tests are excluded. The data reported with the following characteristics are excluded from analysis: welds exhibiting defects classified as critical according to B quality class of ISO 25239-5 [13], welds showing a tensile efficiency below 60%, welds with a thickness inferior to 3 mm, and welds reporting less than 6 failures in the studied cycles range. The final dataset comprises 92 studies including 1041 data points from 46 references [14,15,16,17,18,19,20,21,22,23,24,25,26,27,28,29,30,31,32,33,34,35,36,37,38,39,40,41,42,43,44,45,46,47,48,49,50,51,52,53,54,55,56,57,58,59]. The global dataset combines data acquired from 4 alloys, 9 stress ratio, 3 FSW variants and weld thickness ranging from 3 to 26 mm. The details of the gathered data are summarized in Table 3.
Table 3.
Dataset description.
3.2. Assessment of Fatigue Curve for Individual Studies
For each individual study, C and m parameters in Equation (1) are determined using a least-squares regression method. Studies exhibiting less than 25% deviation in m determination and at least ten failures are labelled as ‘reliable’ using the recommendations in DIN50100 [60]. The fatigue strength data is assumed to follow a log-normal distribution in accordance with the EC9 code. Probabilistic curves are calculated for a 97.7% survival rate at 95% confidence using the confidence term proposed by Lomolino et al. [10]. Equation (1) becomes:
where is the median (p = 0.5) number of cycles from the regression line, is the p percentile from the inverse standard normal cumulative distribution, is the Heaviside function, is the one tail c = 0.95 percentile of Student’s t-distribution with (n − 2) degree of freedom, and is the standard deviation of cycles. The stress scatter index associated with the probabilistic curves is defined in Equation (3).
For each study the following fatigue parameters are calculated: m, C, Δσcalf,p=0.5, , Δσcalf,p=0.977 and . For each dataset, S–N curves were determined at confidence levels of p = 0.5 and p = 0.977. These curves, along with their data points, were compared against the design curves specified by the EC9 and CSA S6 codes.
3.3. Assessment of Fatigue Curve for Combined Dataset
In accordance with the recommendations of Maggiolini et al. [12], the studies were merged by alloy, stress ratio, and FSW variant. Surface conditions and prior welding treatment were not used as group-defining parameters. Although surface condition significantly influences fatigue performance, its inconsistent reporting in the literature prevents reliable stratification. Most alloys are reported under the same type of pre-welding treatments (Table 3), ensuring that this effect is implicitly represented. Groups consisting of fewer than ten failure points are excluded from this analysis. The aggregation of data across studies may affect the determination of the fatigue parameters. To mitigate this effect, Havia et al. [9] proposed using a weighted inverse slope. In this study, four inverse slope values are calculated for each aggregated group: natural, simple weighted, weighted ‘reliable’ and weighted variance. The different methods are described in Table 4.
Table 4.
Inverse slope determination methods.
For each group of aggregated studies and inverse slope type, a set of C, SEN, Δσcalf,p=0.5, Δσcalf,p=0.977 and are calculated. Following Politis and Romano’s [61] approach, parameter robustness is evaluated using subsampling: 80% empirical confidence intervals [CI80] = [mP10; mP90] are derived to quantify sensitivity to outliers by recalculating S–N curves randomly selecting 60% of the studies (minimum of 2 studies) in group for 10,000- iteration.
3.4. Mean Stress Effect Consideration
Since the experimental dataset is comprised of tests performed at different stress ratios, the influence of mean stress was explicitly considered. The data is analyzed at a stress ratio of R = 0.5, as the source data used in the codes were obtained under this same ratio (Table 1). The Walker model described by Equation (4) was used to obtain the equivalent stress range at = 0.5.
where is the material’s sensitivity to mean stress, named the Walker exponent, is the Walker equivalent stress range at , the stress ratio of data, the stress range at . is optimized on the datasets using an iterative multi-group approach, minimizing the stress deviation defined by Dowling [62] between Walker-corrected data and the experimental median S–N curve at each stress ratio. This optimization is applied to data groups with at least two different stress ratios. To mitigate inter-study variability, the optimization of is conducted a second time on restricted data subsets comprising of multiple stress ratios R reported within a single publication.
4. Results and Discussion
4.1. Fatigue Curves of Individual Datasets
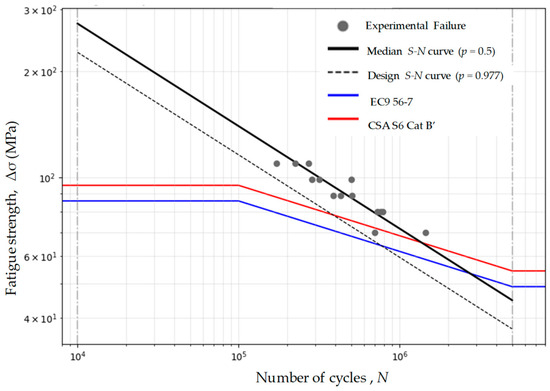
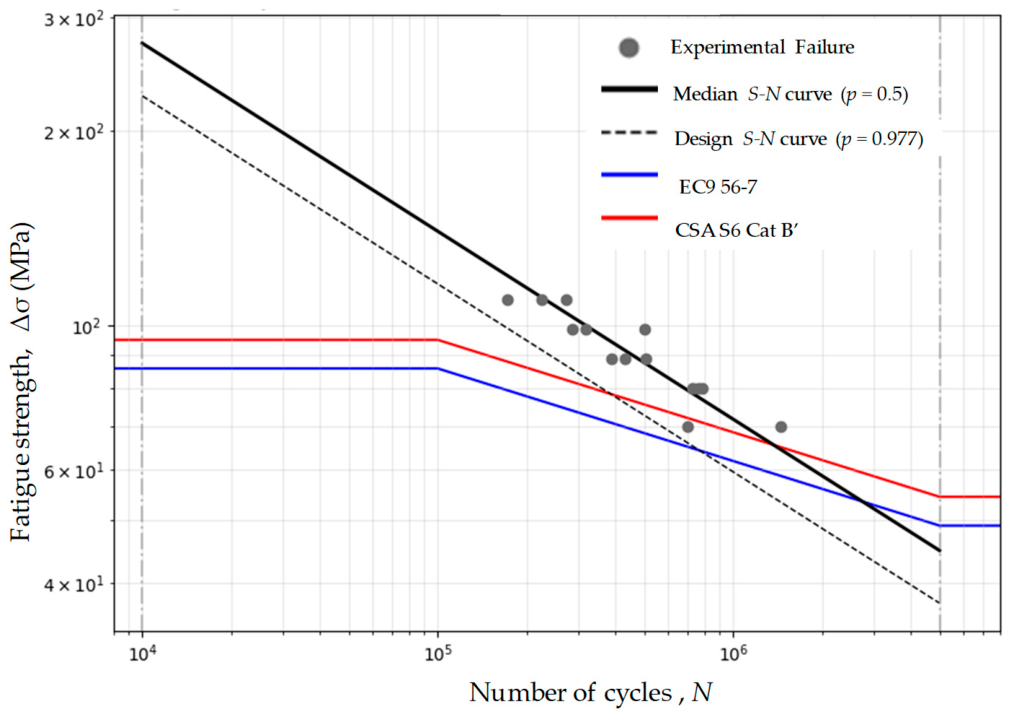
For each dataset, a 50% (median or mean) and 97.7% (design) survival probability curves are produced according to the method described above. The curves are compared with the design curves recommended by the EC9 and CSA S6 codes, as illustrated by the representative example in Figure 1. The normative curve is considered conservative if the entire curve calculated at p = 0.977 remains above the code-specified curve within high cycle fatigue (HCF) range. Conversely, if any portion of the p = 0.977 curve falls below the normative curve within the HCF range, the code is deemed non-conservative. Table 5 summarizes the number of datasets, both for the full groups and the “reliable” subsets, where the code was found to be non-conservative.
Figure 1.
Unconservative (UC) code curves predictions for a S–N curve and data point from [38].
Table 5.
Number of unconservative (UC) code predictions based on individual tests and on resulting S–N curves determined at a survival probability p = 0.977.
Thirty individual points do not meet the standard fatigue strength, and thirty-one (twelve reliable) studies produce S–N curve estimations that lead to unconservative code prediction. All thirty-one S–N curves leading to UC code prediction are characterized by a slope, 1/m, steeper (mw = −4.9) than the standard (m = −7), leading to smaller fatigue strength at high number of cycles. The presence of surface discontinuities reducing the number of cycles for crack initiation could explain a steeper SN curve as described by Verreman et al. [63]. Tool marks, flash at the shoulder edge [14,31,38], and high surface roughness are surface discontinuities known to reduce fatigue strength of FSW joints.
4.2. Assessment of Fatigue Curve for Aggregated Datasets
Data collected from various studies are aggregated by datasets characterizing a FSW variant, alloy, and stress ratio (FSW variant–alloy–stress ratio) resulting in 18 groups. In addition, one global group comprising all datasets is also analyzed. The inverse slopes values (m) are determined for each specific group, as well as for the global dataset using different methods. Results for the global dataset are presented in Table 6.
Table 6.
S–N curve parameters determined using all data with different slope definition.
The natural inverse slope results in excessive stress scatter (high Tσ values) and does not accurately represent weld fatigue behavior. While the other inverse slope types significantly reduce this scatter, Tσ values are above the calculated index from Eurocode recommendation (Tσ = 1.26 considering SEN = 0.18). This is expected, as the analysis aggregates multiple alloys without applying mean stress corrections. Subsampling shows that variance-based (m[CI80]range = mP10 − mP90 = 0.38) and simple weighted slopes (m[CI80]range = 0.33) are more robust against outliers than reliability-weighted versions (m[CI80]range = 0.64). To avoid possible incorrect variance determination in small sample datasets, the inverse simple-weighted slope is adopted for the remainder of this study.
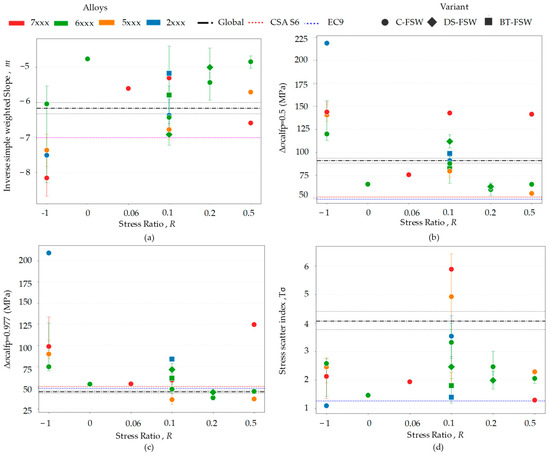
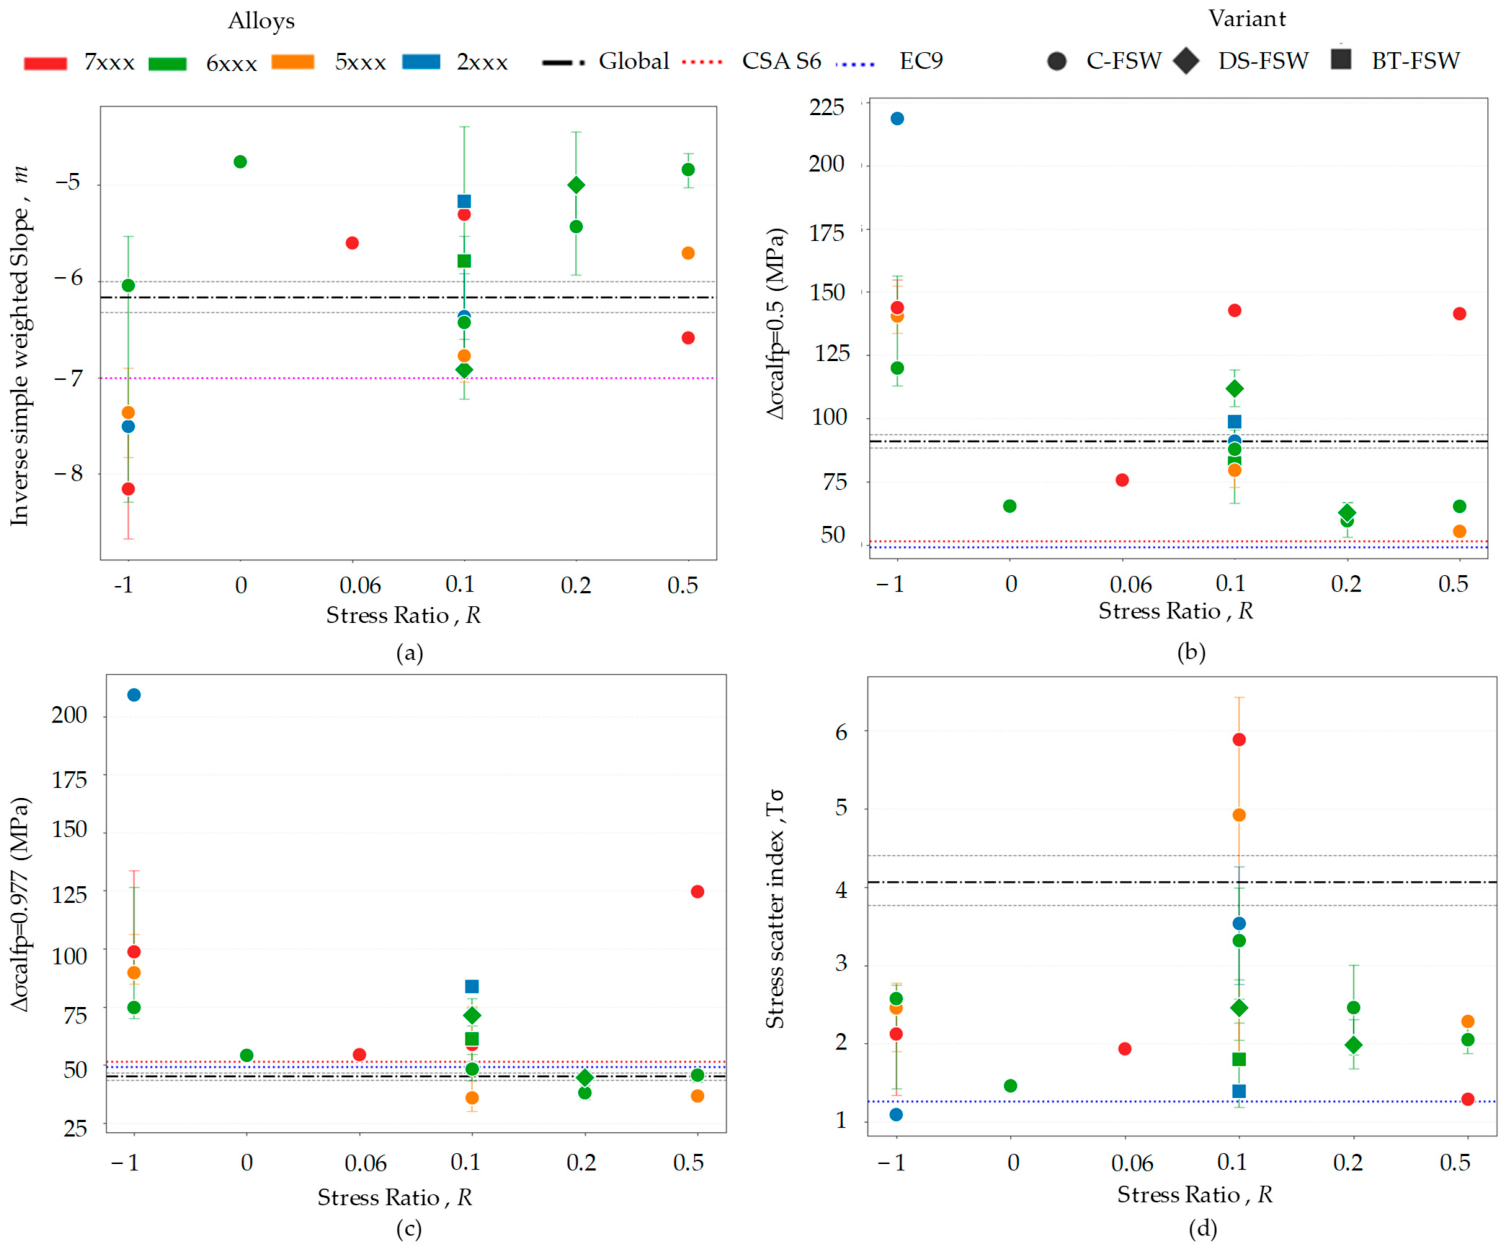
Figure 2 details the fatigue parameters of each aggregated group types, the global group and the code. It compares the inverse simple weighted slopes (m), the mean and probabilistic fatigue strength at 5 × 10⁶, cycles and the stress scatter index Tσ.
Figure 2.
Mean values of (a) inverse simple weighted slope m, (b) stress median CALF Δσcalf,p=0.5, (c) stress design CALF Δσcalf,p=0.977, and (d) stress index scatter Tσ per FSW variant–alloy–stress ratio, with error bar corresponding to 0.8 bootstrap CI, determined separately for each alloy and FSW variant and globally considering all datasets (confidence interval illustrated with dashed grey lines) according to the stress ratio, and comparison to the codes EC9 (blue dashed line) and CSA S6 (red dashed line), common slope code value (magenta dashed line).
The inverse slope values (m) of the aggregated S–N curves range from −8.16 to −4.76, with a mean global slope of −6.17 (Figure 2a). These values illustrate the difference in fatigue behavior across the groups, unlike the codes which assume a constant value (m = −7) indicated by the magenta line in Figure 2a.
As expected, for most data groups the median fatigue strength decreases with an increase in the stress ratio (Figure 2b) except from the CFSW-7xxx-(0.06, 0.1, 0.5) groups. This behavior is likely attributed to the limited sample size (one or two studies per groups), identifying these groups as statistical outliers. The 50% survival fatigue strength curves are above the design curves reported in the codes for all studied fatigue lives. This is expected since the codes are based on a higher survival probability (97.7%); however, for probabilistic stress assessments (Figure 2d), several groups with high stress ratios (R ≥ 0.1) lead to unconservative code prediction. This can be attributed to scatter within these groups, which affects slope determination and probabilistic stress value.
The determined values of Tσ (Figure 2d) range between 1.1 and 5.9 depending on the group. Groups obtained from more than one dataset exhibit a Tσ exceeding the value of 1.26 calculated from EC9. These values are characteristic of large scatter within groups. Grouping alloys of different compositions and welding parameter increases data scatter even if the FSW variant–alloy–stress ratio remains the same.
4.3. Determination of the Mean Stress Correction Coefficient
The γ exponent in the Walker method, optimized separately for each FSW variant–alloy group as well as for each author, are presented in Table 7 and Table 8, respectively.
Table 7.
Values of the Walker exponent optimized among FSW variant–alloy groups.
Table 8.
Values of the Walker exponent optimized among studies with same authors and corresponding test parameters.
As presented in Table 7, for each alloy, positive γ values range from 0.25 to 0.71 with a mean value of 0.48. Results for the DS-FSW-6xxx is excluded due to a non-physical negative γ value indicating that the Walker method could not accurately characterize the mean stress sensitivity. This inconsistency stems from data scatter and proximal R ratio (Figure 2), causing overlapping data points across the R ratio.
As reported for each author in Table 8, the author-specific γ values range from 0.19 to 0.50 with a mean at 0.41, except for the Sun et al. [54] study, where a non-typical behavior (γ = −0.2) was observed. In this particular case, the atypical value of this coefficient can be attributed to inconsistent failure locations. At R = 0.1, failure occurred within the weld (2/10), whereas at R = −0.3, failures predominantly occurred in the base metal (7/9). This leads to a comparison of two distinct materials, resulting in an inaccurate estimation of the Walker exponent. For the other studies, the observed variation in the Walker coefficient is consistent with its well established sensitivity to aluminum grades and specific hardening treatments [62].
The two mean γ values obtained after optimization (0.48 and 0.41 for FSW variant–alloy and author respectively) are close to the γ = 0.5 used in the SWT method, which is well established for mean stress correction in aluminum alloys [9,62], supporting its relevance and applicability for this study.
4.4. Mean Stress Correction for Aggregated Datasets
To account for the influence of mean stress on fatigue strength, the Walker method with γ = 0.5 is applied to the dataset with a common stress ratio R = 0.5. The SWT correction is applied to the 18 FSW variant–alloy–stress ratio groups resulting in 7 FSW variant–alloy groups and one global group at R = 0.5. Their fatigue parameters are shown in Figure 3.
Figure 3.
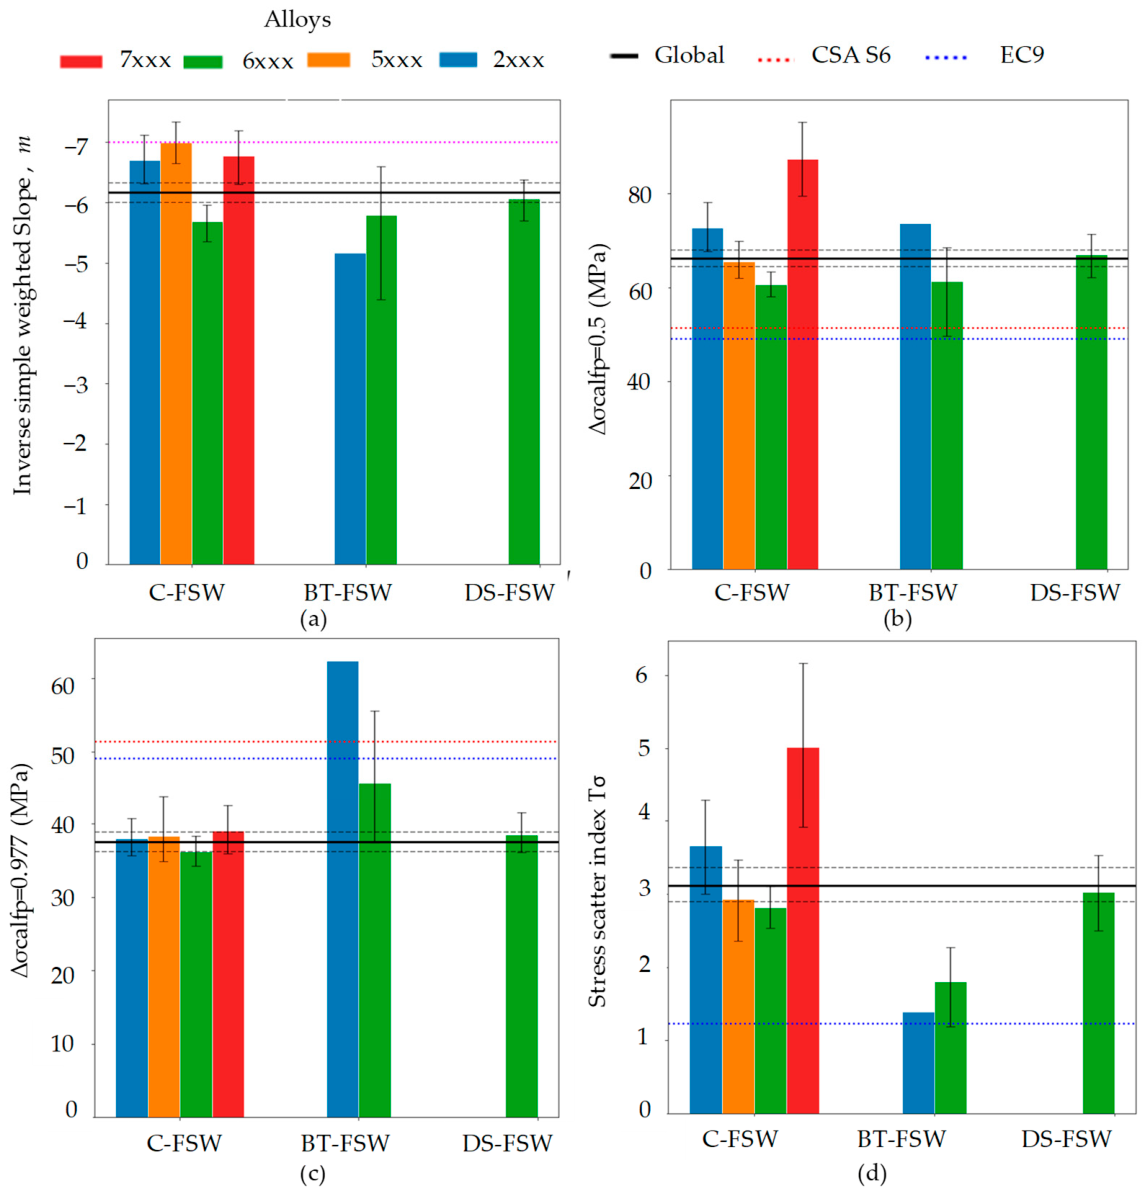
(a) Inverse simple weighted slope m, stress range at 5 × 10⁶ cycles (b) median Δσcalf,p=0.5, (c) design Δσcalf,p=0.977, and (d) scatter stress index Tσ, with error bar corresponding to 0.8 bootstrap CI, for each FSW variant and alloy, as well as for the global dataset (solid black line for mean value and dashed gray lines for the 0.8 bootstrap CI), with comparison to the codes EC9 (blue dashed line) and CSA S6 (red dashed line), common slope code value (magenta dashed line).
The inverse slope values of the aggregated S–N curves range from −7.00 to −5.17, with a mean global slope of −6.17 (Figure 3a). The obtained inverse slope values are steeper than the code-specified values, possibly due to the effect of surface discontinuities, as discussed in Section 4.1.
Figure 3b shows that no significant differences in Δσcalf,p=0.5 are observed between the different FSW variants for a given alloy, once the overlapping uncertainty intervals are considered. Considering all FSW variants achieve full penetration welds without internal discontinuities, fatigue performance is primarily governed by surface roughness, microstructure, and residual stress [51,64]. Any FSW variant-specific influence in these features remains insufficient to induce a significant divergence in mean fatigue properties. The Δσcalf,p=0.5 values vary across all alloy series for C-FSW (Figure 3b) and follow a decreasing trend: 7xxx (87.3 MPa) > 2xxx (72.7 MPa) > 5xxx (65.5 MPa) > 6xxx (60.7 MPa). This difference between alloys is consistent with the distinct strengthening mechanisms associated with each base alloy and its corresponding heat treatment [65,66], as well as with their response to the thermal and mechanical history induced by the FSW process.
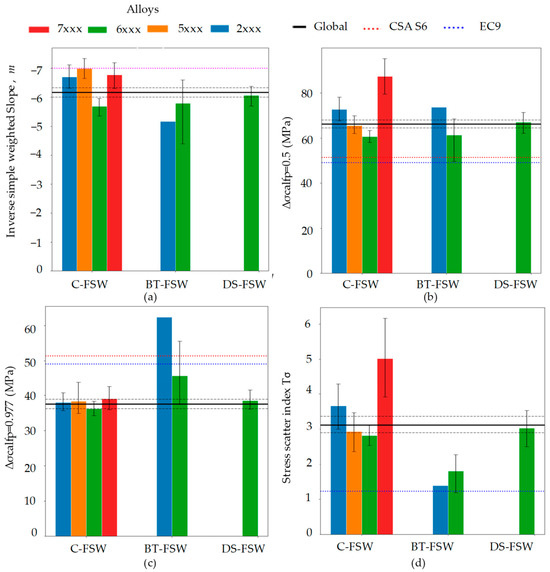
As shown in Figure 3c, the values of the design fatigue strength at 5 × 10⁶ cycles, Δσcalf,p=0.977, remain below the limits prescribed by the codes, except for the BT-FSW-2xxx group, which is composed of a single dataset. Although the values of Δσcalf,p=0.977 associated with the EC9 and CSA S6 design curves can appear non-conservative for the studied FSW variants and alloys, this observation must be interpreted with caution as it may result from a potential over-correction induced by the SWT approach coupled with significant data scatter. The mean stress scatter index is 3.3, and Tσ value exceed the EC9-calculated index (Figure 3c) for all groups, highlighting the scatter in fatigue strength caused by unaccounted materials and welding variables.
5. Conclusions
This work analyses S–N curves for friction stir butt welds under constant amplitude loading, using an extensive literature dataset to account for variations in alloy type, FSW variant, and stress ratio. By applying a statistical method to incorporate intra-group scatter, the data were assessed against current design codes. Based on the results presented above and their interpretation, the following conclusions are proposed:
- The simple weighted slope and variance-weighted methods account for intra-group scatter during S–N parameter estimation and provide robustness against outliers.
- There is no significant effect of the FSW variant on the mean fatigue resistance.
- The alloy type leads to different mean fatigue resistance ordered in the following descending order: 7xxx > 2xxx > 5xxx > 6xxx.
- Fatigue design specifications for friction stir butt welds provided by Eurocode 9 and the Canadian Highway Bridge Design Code CSA S6 may be unconservative when compared to individual or grouped studies, particularly when these codes are compared with data at high stress ratios exhibiting high scatter.
These findings are subject to limitations regarding the potential influence of surface conditions and residual stresses, which were often undocumented in the literature, as well as possible biases due to the uneven distribution of data among certain alloy–FSW variant groups. Despite these limitations, it is recommended to develop alloy-specific S–N curves for FSW butt joints. To improve fatigue life predictions, subsequent studies should systematically characterize surface conditions and residual stress while focusing on identifying the underlying causes of data scatter. This will help futures code revisions achieve more accurate fatigue strength predictions for FSW aluminum structures.
Author Contributions
Conceptualization, P.L.A. and M.B. methodology, P.L.A.; validation, P.L.A., M.B., L.S.-G. and M.F.; formal analysis, P.L.A.; investigation, P.L.A.; resources, M.B. and L.S.-G.; data curation, P.L.A.; writing—original draft preparation, P.L.A.; writing—review and editing, P.L.A., M.B., L.S.-G. and M.F.; visualization, P.L.A.; supervision, M.B. and L.S.-G.; project administration, M.B. and L.S.-G.; funding acquisition, M.B. and L.S.-G. All authors have read and agreed to the published version of the manuscript.
Funding
This research was funded by Fond de Recherche du Québec—Nature et Technologies (FRQNT), grant number 356524.
Data Availability Statement
The dataset used for the statistical study and the analysis code are available upon request.
Acknowledgments
During the preparation of this manuscript, the authors used large language models (ChatGPT-4 and Gemini 2) for translation and code generation purposes. The authors have carefully reviewed and edited the generated content and take full responsibility for the content of this publication. The authors thank REGAL support (https://doi.org/10.69777/340932). Paco Alvarez also acknowledge Mégane Morris’ help in data curation.
Conflicts of Interest
The authors declare no conflicts of interest.
Abbreviations
The following abbreviations and symbols are used in this manuscript in order of appearance:
| FSW | friction stir welding |
| S–N curve | linear regression of logarithmic stress range versus the number of cycles |
| EC9 | Eurocode 9: Design of aluminium structures |
| CSA S6 | CSA S6, Canadian Highway Bridge Design Code |
| N | number of stress cycles to failure |
| fatigue strength range | |
| C | intercept of S–N curve |
| m | inverse logarithmic slope of S–N curve |
| Δσcalf | fatigue strength range at 5 × 10⁶ |
| CALF | Constant Amplitude Fatigue Limit |
| R | stress ratio of fatigue testing |
| SWT | Smith Walker Topper method for mean stress correction |
| C-FSW | conventional friction stir welding |
| BT-FSW | bobbin tool friction stir welding |
| DS-FSW | double-sided friction stir welding |
| AA | artificially aged |
| NA | naturally aged |
| WH | work-hardened |
| Δσcalf,p=0.5 | 50% survival at 95% confidence fatigue strength range at 5 × 10⁶ |
| Δσcalf,p=0.977 | 97.7% survival at 95% confidence fatigue strength range at 5 × 10⁶ |
| SEN | standard deviation in term of cycles to failure |
| Tσ | stress scatter index |
| CI80 | 80% empirical confidence intervals by Bootstrap |
| γ | Walker exponent |
| UC | unconservative code predictions |
References
- Cusson, B. Modern Applications and Construction Details for Aluminium Bridges. Eng. Proc. 2023, 43, 13. [Google Scholar] [CrossRef] [Scilit]
- Friction Stir Welding. Available online: https://www.twi-global.com/technical-knowledge/job-knowledge/friction-stir-welding-147.aspx (accessed on 19 March 2026).
- Kumar Yadav, B.; Singh Bhadauria, S.; Sharma, V. A review on fracture and fatigue behaviour of FSW joints of Al alloys. Mater. Today Proc. 2024, 113, 193–199. [Google Scholar] [CrossRef] [Scilit]
- ASCE Committee on Fatigue and Fracture Reliability Fatigue Reliability: Introduction. J. Struct. Div. 1982, 108, 3–23. [CrossRef] [Scilit]
- EN 1999-1-3:2023; Eurocode 9: Design of aluminium structures—Part 1-3: Structures susceptible to fatigue. European Comittee for Standardization (CEN): Brussels, Belgium, 2023.
- Hobbacher, A.F.; Baumgartner, J. Recommendations for Fatigue Design of Welded Joints and Components; IIW Collection; Springer International Publishing: Cham, Switzerland, 2024. [Google Scholar] [CrossRef] [Scilit]
- Canadian Standards Association. Canadian Highway Bridge Design Code, 13th ed.; CSA Group: Toronto, ON, Canada, 2025. [Google Scholar]
- Canadian Standard Association. Commentary on CSA:25 Canadian Highway Bridge Design Code; CSA Group: Toronto, ON, Canada, 2025. [Google Scholar]
- Havia, J.; Ahola, A.; Björk, T. Fatigue strength of welded aluminum structures—A re-evaluation of fatigue data of welded aluminum joints with nominal stress approach. Mater. Des. 2025, 254, 114050. [Google Scholar] [CrossRef] [Scilit]
- Lomolino, S.; Tovo, R.; dos Santos, J. On the fatigue behaviour and design curves of friction stir butt-welded Al alloys. Int. J. Fatigue 2005, 27, 305–316. [Google Scholar] [CrossRef] [Scilit]
- de Oliveira Miranda, A.C.; Gerlich, A.; Walbridge, S. Aluminum friction stir welds: Review of fatigue parameter data and probabilistic fracture mechanics analysis. Eng. Fract. Mech. 2015, 147, 243–260. [Google Scholar] [CrossRef] [Scilit]
- Maggiolini, E.; Benasciutti, D.; Susmel, L.; Hattingh, D.G.; James, M.N.; Tovo, R. Friction stir welds in aluminium: Design S-N curves from statistical analysis of literature data. Fatigue Fract. Eng. Mater. Struct. 2018, 41, 2212–2230. [Google Scholar] [CrossRef] [Scilit]
- ISO 25239-5:2020; Soudage Par Friction-Malaxage—Aluminium—Partie 5: Exigences de Qualité et de Contrôle. ISO: Geneva, Switzerland, 2020.
- Krasnowski, K.; Dymek, S. A Comparative Analysis of the Impact of Tool Design to Fatigue Behavior of Single-Sided and Double-Sided Welded Butt Joints of EN AW 6082-T6 Alloy. J. Mater. Eng. Perform. 2013, 22, 3818–3824. [Google Scholar] [CrossRef] [Scilit]
- Yadav, V.K.; Gaur, V.; Singh, I.V. Combined effect of residual and mean stresses on fatigue behavior of welded aluminum 2024 alloy. Int. J. Fatigue 2022, 155, 106565. [Google Scholar] [CrossRef] [Scilit]
- Di, S.; Yang, X.; Luan, G.; Jian, B. Comparative study on fatigue properties between AA2024-T4 friction stir welds and base materials. Mater. Sci. Eng. A 2006, 435–436, 389–395. [Google Scholar] [CrossRef] [Scilit]
- Liu, Z.; Zhang, H.; Hou, Z.; Yan, Z.; Liaw, P.K.; Dong, P. Competitive relationship during fatigue-crack initiation of friction-stir-welded Al alloy. Mater. Sci. Eng. A 2021, 809, 141006. [Google Scholar] [CrossRef] [Scilit]
- Du, C.; Pan, Q.; Chen, S.; Tian, S. Effect of rolling process on fatigue performance of stir zone of AA6061-T6 doube-side friction stir welding joint. Fatigue Fract. Eng. Mater. Struct. 2021, 44, 748–761. [Google Scholar] [CrossRef] [Scilit]
- Wu, M.; Wu, C.; Gao, S. Effect of ultrasonic vibration on fatigue performance of AA 2024-T3 friction stir weld joints. J. Manuf. Process. 2017, 29, 85–95. [Google Scholar] [CrossRef] [Scilit]
- Le Jolu, T.; Morgeneyer, T.F.; Denquin, A.; Gourgues-Lorenzon, A.-F. Effect of welding defects on plastic behaviour and fatigue lifetime of friction stir welded Al-Cu-Li alloy. In Proceedings of the ICF 13, Beijing, China, 16–21 June 2013; p. 10. Available online: https://minesparis-psl.hal.science/hal-00853558 (accessed on 20 March 2026).
- Cavaliere, P.; Squillace, A.; Panella, F. Effect of welding parameters on mechanical and microstructural properties of AA6082 joints produced by friction stir welding. J. Mater. Process. Technol. 2008, 200, 364–372. [Google Scholar] [CrossRef] [Scilit]
- Wang, Z.; Wang, B.; Zhang, Z.; Xue, P.; Hao, Y.; Zhao, Y.; Ni, D.; Wang, G.; Ma, Z. Enhanced Fatigue Properties of 2219 Al Alloy Joints via Bobbin Tool Friction Stir Welding. Acta Metall. Sin. Engl. Lett. 2023, 36, 586–596. [Google Scholar] [CrossRef] [Scilit]
- Choudhary, S.; Gaur, V. Enhanced fatigue properties of AA5086 friction stir weld joints by Cu-reinforcement. Mater. Sci. Eng. A 2023, 869, 144778. [Google Scholar] [CrossRef] [Scilit]
- Kainuma, S.; Katsuki, H.; Iwai, I.; Kumagai, M. Evaluation of fatigue strength of friction stir butt-welded aluminum alloy joints inclined to applied cyclic stress. Int. J. Fatigue 2008, 30, 870–876. [Google Scholar] [CrossRef] [Scilit]
- Yang, X.Q.; Fang, D.; Luan, G.; Jian, B. Experimental investigation on fatigue properties of FSW in aircraft Al alloys. Presented at the 6th International Symposium on Friction Stir Welding, Saint-Sauveur, QC, Canada, 10–12 October 2006. [Google Scholar]
- Jain, N.; Kumar, R. Fatigue analysis of the friction stir welded AA6061-T6 aluminum alloy. Mater. Res. Express 2020, 8, 016501. [Google Scholar] [CrossRef] [Scilit]
- Hussein, W.; Al-Shammari, M.A. Fatigue and Fracture Behaviours of FSW and FSP Joints of AA5083-H111 Aluminium Alloy. IOP Conf. Ser. Mater. Sci. Eng. 2018, 454, 012055. [Google Scholar] [CrossRef] [Scilit]
- Mendoza, J.; Kahl, S. Fatigue and tensile properties of friction stir welds in AA6061-T6 and AA6082-T6 from production trials. Presented at the 9th International FSW Symposium, Huntsville, TX, USA, 15–18 May 2012. [Google Scholar]
- Okura, I.; Hagisawa, N.; Naruo, M.; Toda, H. Fatigue behavior of aluminum deck fabricated by friction stir welding. Doboku Gakkai Ronbunshu 2002, 2002, 255–266. [Google Scholar] [CrossRef] [Scilit] [PubMed]
- Costa, J.D.; Ferreira, J.A.M.; Borrego, L.P.; Abreu, L.P. Fatigue behaviour of AA6082 friction stir welds under variable loadings. Int. J. Fatigue 2012, 37, 8–16. [Google Scholar] [CrossRef] [Scilit]
- Moreira, P.M.G.P.; de Figueiredo, M.A.V.; de Castro, P.M.S.T. Fatigue behaviour of FSW and MIG weldments for two aluminium alloys. Theor. Appl. Fract. Mech. 2007, 48, 169–177. [Google Scholar] [CrossRef] [Scilit]
- Zhu, H.; Lacidogna, G.; Deng, C.; Gong, B.; Liu, F. Fatigue Characteristics of 7050-T7451 Aluminum Alloy Friction Stir Welding Joints and the Stress Ratio Effect. Materials 2022, 15, 8010. [Google Scholar] [CrossRef] [Scilit] [PubMed]
- He, C.; Liu, Y.; Dong, J.; Wang, Q.; Wagner, D.; Bathias, C. Fatigue crack initiation behaviors throughout friction stir welded joints in AA7075-T6 in ultrasonic fatigue. Int. J. Fatigue 2015, 81, 171–178. [Google Scholar] [CrossRef] [Scilit]
- Tinguery, K.M.S. Fatigue des Joints Soudés par Friction-Malaxage Dans Les Tabliers de Ponts en Aluminium D’alliage AA6061-T6. Master’s Thesis, Université du Québec à Chicoutimi, Saguenay, QC, Canada, 2023. [Google Scholar]
- Sun, G.; Niu, J.; Wang, D.; Chen, S. Fatigue experimental analysis and numerical simulation of FSW joints for 2219 Al–Cu alloy. Fatigue Fract. Eng. Mater. Struct. 2015, 38, 445–455. [Google Scholar] [CrossRef] [Scilit]
- Schubnell, J.; Müller, A.; Boywitt, R.; Maiß, O.; Farajian, M. Fatigue life improvement of similar and dissimilar aluminum friction stir welds by deep rolling. Weld. World 2023, 67, 721–732. [Google Scholar] [CrossRef] [Scilit]
- Langari, J.; Aliakbari, K.; Kolahan, F. Fatigue life simulation of AA7075-T651 FSW joints using experimental data. Eng. Fail. Anal. 2023, 154, 107690. [Google Scholar] [CrossRef] [Scilit]
- Ericsson, M.; Sandström, R. Sandstrom Fatigue of Friction Stir Welded AlMgSi-Alloy 6082. Mater. Sci. Forum 2000, 331–337, 1787–1792. [Google Scholar] [CrossRef] [Scilit]
- Dalle Donne, C.; Raimbeaux, G.; Biallas, G.; Allehaux, D.; Palm, F.; Ghidini, T. Fatigue Properties of Friction Stir Welded Aluminium Butt Joints. Presented at the ICAF 2003—Fatigue on Aeronautical Structures as an Engineering Challenge, Lucerne, Switzerland, 5–9 May 2003. [Google Scholar]
- Barsoum, Z.; Khurshid, M.; Barsoum, I. Fatigue strength evaluation of friction stir welded aluminium joints using the nominal and notch stress concepts. Mater. Des. 2012, 41, 231–238. [Google Scholar] [CrossRef] [Scilit]
- Kahl, S. Fatigue Strength of Friction Stir Welds in Aluminium Alloy AA6082-T6. In Proceedings of the 8th International FSW Symposium, Timmendorfer Strand, Germany, 18–20 May 2010. [Google Scholar]
- Alvarez, P. (Polytechnique Montréal, Montréal, Canada), Fatigue data of BT-FSW 6061-T6 aluminum alloy at R=0.1. 2026; (Unpublished work).
- Dawes, C.; Thomas, W. Friction Stir Welding of Aluminium Alloy. In TWI Reprint 493/6/95, Bulletin 6; The Welding Institute: Cambridge, UK, 1995. [Google Scholar]
- Lukács, J.; Meilinger, Á.; Pósalaky, D. High cycle fatigue and fatigue crack propagation design curves for 5754-H22 and 6082-T6 aluminium alloys and their friction stir welded joints. Weld. World 2018, 62, 737–749. [Google Scholar] [CrossRef] [Scilit]
- Sano, Y.; Masaki, K.; Gushi, T.; Sano, T. Improvement in fatigue performance of friction stir welded A6061-T6 aluminum alloy by laser peening without coating. Mater. Des. 2012, 36, 809–814. [Google Scholar] [CrossRef] [Scilit]
- Srivastava, H.K.; Balasubramanian, V.; Malarvizhi, S.; Rao, A.G. Influence of post weld aging treatment on microstructural features and fatigue behaviour of unnotched and notched specimens of friction stir welded AA6061-T651 aluminium alloy joints under completely reversed stress cycle. Weld. Int. 2023, 37, 579–596. [Google Scholar] [CrossRef] [Scilit]
- Costa, J.D.; Ferreira, J.A.M.; Borrego, L.P. Influence of spectrum loading on fatigue resistance of AA6082 friction stir welds. Int. J. Struct. Integr. 2011, 2, 122–134. [Google Scholar] [CrossRef] [Scilit]
- Su, M.; Qi, X.; Xu, L.; Feng, Q.; Han, Y.; Zhao, L. Microstructural and mechanical analysis of 6063-T6 aluminum alloy joints bonded by friction stir welding. J. Mater. Sci. 2022, 57, 15078–15093. [Google Scholar] [CrossRef] [Scilit]
- Biallas, G.; Dalle Donne, C.; Juricic, C. Monotonic and cyclic strength of friction stir welded aluminium joints Biallas. In Proceedings of the European Conference on Advances in Mechanical Behaviour, Plasticity and Damage (EUROMAT 2000), Tours, France, 7–8 November 2000. [Google Scholar]
- Jaisawal, R.; Gaur, V.; Ahmed, S. On improved fatigue properties of aluminum alloy 5086 weld joints. Int. J. Fatigue 2023, 174, 107712. [Google Scholar] [CrossRef] [Scilit]
- Malopheyev, S.; Vysotskiy, I.; Zhemchuzhnikova, D.; Mironov, S.; Kaibyshev, R. On the Fatigue Performance of Friction-Stir Welded Aluminum Alloys. Materials 2020, 13, 4246. [Google Scholar] [CrossRef] [Scilit] [PubMed]
- Maddox, S. Review of fatigue assessment procedures for welded aluminium structures. Int. J. Fatigue 2003, 25, 1359–1378. [Google Scholar] [CrossRef] [Scilit]
- Zhang, X.; Gao, S.; Li, G.; Zhang, H.; Zhou, L.; Wang, P. Study on the fatigue performance of bobbin tool friction stir welding of 6005A-T6 aluminum alloy. Hanjie XuebaoTransactions China Weld. Inst. 2023, 44, 30–36. [Google Scholar] [CrossRef]
- Sun, G.; Wei, X.; Shang, D.; Chen, S.; Long, L.; Han, X. Tensile and Fatigue Analysis Based on Microstructure and Strain Distribution for 7075 Aluminum FSW Joints. Metals 2020, 10, 1610. [Google Scholar] [CrossRef] [Scilit]
- Di, S.; Yang, X.; Fang, D.; Luan, G. The influence of zigzag-curve defect on the fatigue properties of friction stir welds in 7075-T6 Al alloy. Mater. Chem. Phys. 2007, 104, 244–248. [Google Scholar] [CrossRef] [Scilit]
- Li, X.; Fang, J.; Guan, X. Unified Principal S–N Equation for Friction Stir Welding of 5083 and 6061 Aluminum Alloys. Chin. J. Mech. Eng. 2021, 34, 15. [Google Scholar] [CrossRef] [Scilit]
- Vysotskiy, I.; Malopheyev, S.; Rahimi, S.; Mironov, S.; Kaibyshev, R. Unusual fatigue behavior of friction-stir welded Al–Mg–Si alloy. Mater. Sci. Eng. A 2019, 760, 277–286. [Google Scholar] [CrossRef] [Scilit]
- James, M.N.; Hattingh, D.G.; Bradley, G.R. Weld tool travel speed effects on fatigue life of friction stir welds in 5083 aluminium. Int. J. Fatigue 2003, 25, 1389–1398. [Google Scholar] [CrossRef] [Scilit]
- Yang, C.; Wang, B.B.; Yu, B.H.; Wu, L.H.; Xue, P.; Zhang, X.M.; He, G.Z.; Ni, D.R.; Xiao, B.L.; Wang, K.S.; et al. High-cycle fatigue and fracture behavior of double-side friction stir welded 6082Al ultra-thick plates. Eng. Fract. Mech. 2020, 226, 106887. [Google Scholar] [CrossRef] [Scilit]
- DIN 50100; Schwingfestigkeitsversuch—Durchführung und Auswertung von Zyklischen Versuchen Mit Konstanter Lastamplitude für Metallische Werkstoffproben und Bauteile. DIN Media: Berlin, Germany, 2022.
- Politis, D.N.; Romano, J.P. The Stationary Bootstrap. J. Am. Stat. Assoc. 1994, 89, 1303–1313. [Google Scholar] [CrossRef]
- Dowling, N.E.; Calhoun, C.A.; Arcari, A. Mean stress effects in stress-life fatigue and the Walker equation. Fatigue Fract. Eng. Mater. Struct. 2009, 32, 163–179. [Google Scholar] [CrossRef] [Scilit]
- Verreman, Y.; Limodin, N. Fatigue notch factor and short crack propagation. Eng. Fract. Mech. 2008, 75, 1320–1335. [Google Scholar] [CrossRef] [Scilit]
- Lemmen, H.J.K.; Alderliesten, R.C.; Benedictus, R. Evaluating the fatigue initiation location in friction stir welded AA2024-T3 joints. Int. J. Fatigue 2011, 33, 466–476. [Google Scholar] [CrossRef] [Scilit]
- ASM International. Heat Treating of Nonferrous Alloys; ASM International: Materials Park, OH, USA, 2016. [Google Scholar] [CrossRef] [Scilit]
- Dorward, R. Work Hardening and Annealing of Aluminum Alloys. In Aluminum Science and Technology; Anderson, K., Weritz, J., Kaufman, J.G., Eds.; ASM International: Materials Park, OH, USA, 2018; pp. 279–292. [Google Scholar] [CrossRef] [Scilit]

Disclaimer/Publisher’s Note: The statements, opinions and data contained in all publications are solely those of the individual author(s) and contributor(s) and not of MDPI and/or the editor(s). MDPI and/or the editor(s) disclaim responsibility for any injury to people or property resulting from any ideas, methods, instructions or products referred to in the content. |
© 2026 by the authors. Licensee MDPI, Basel, Switzerland. This article is an open access article distributed under the terms and conditions of the Creative Commons Attribution (CC BY) license.