1. Introduction
Road safety is the result of the complex interaction between infrastructure, traffic management, vehicle dynamics, and the reliability of their technical systems. Previous studies on signalized intersection optimization, signal interval dynamics, pedestrian safety, traffic density, and intelligent traffic management [
1,
2,
3,
4,
5,
6], as well as works on engine operating behavior, thermal loads on braking mechanisms, and the development of non-contact and multi-sensor diagnostic approaches [
7,
8,
9,
10], highlight the importance of component reliability for overall transport safety.
In this context, the hydraulic brake system, and in particular the brake fluid, is a critical element sensitive to thermal, chemical, and electrochemical degradation processes. Hygroscopic moisture absorption, boiling point depression, and changes in electrical conductivity are phenomena that are particularly evident in real-world operation, where intensive braking cycles and temperature peaks accelerate fluid aging.
The existing literature addresses various aspects of brake fluid degradation, including viscosity analysis through planned experimental studies [
11], which analyze the viscosity of engine oils, refractometric quality determination in new and service samples [
12], operational tests in real passenger cars [
13], assessments based on lubricant characteristics [
14], in-service wear analyses [
15], moisture content-temperature-boiling point relationships [
16], and studies under complex service conditions [
17], as well as highly sensitive optical methods at the laboratory level [
18]. In [
19], the influence of brake fluid temperature on viscosity was studied with the aim of improving performance in emergency braking. The authors of this study aimed to determine the response time of the brake system by measuring the change in brake fluid viscosity with temperature. However, published research remains fragmentary and limited in terms of methods that can be directly applied to routine automotive maintenance. The presented methodology and the developed system in [
20] use temperature-compensated electrical resistance measurement of new brake fluids from three different brands to determine moisture content, without considering the influence of actual contamination and degradation on their electrical properties.
The boiling point measurement by a miniature thermocouple, conducted by [
21], allows the assessment of the degradation of small quantities of brake fluid but remains limited by the very small and unrepresentative sample volume, the lack of control over moisture content, and the laboratory nature of the test, which reduces its reproducibility and applicability in real conditions.
An integrated assessment framework combining thermal, hygrometric, and electrical parameters measurable under conditions that reflect real-world service is lacking. The present study examines brake fluids from different manufacturers and with different service histories—new, stored in open containers, and drained from real brake systems—by simultaneously evaluating their boiling point, moisture content, and electrical conductivity. The goal is to formulate a reliable and practically applicable diagnostic approach that can assist in assessing the condition and safety of vehicles in real operation.
Hydraulic brake systems of passenger cars and light commercial vehicles use brake fluid as a working fluid, the reliability of which is crucial for safety. Regulatory documents [
22,
23,
24,
25] define the basic requirements for fluids based on polyglycol ethers/borate esters, including compatibility with rubber seals, viscosity, pH, and boiling point. Two indicators are defined: the dry boiling point (with a water content of up to 0.2%), as the equilibrium reflux boiling point, and the wet boiling point (with a water content of up to 3.7%). American and European standards classify fluids mainly according to these temperatures.
The study in [
26,
27] shows that despite the use of a standardized methodology for determining the boiling point under real operating conditions, practical limitations of the technical procedures do not allow sampling from random points of the brake system, leading to significant differences between the measurements in the tank and in the apparatus, which highlights the need for more detailed checks on the real state of the fluid.
Also, the authors in [
28] show through experimental tests that the moisture content and the lowering of the boiling point of the brake fluid lead to a measurable increase in the activation time of the hydraulic brake system, which should be taken into account when assessing its technical condition.
The literature also includes engineering developments, such as those in [
29,
30], which, through multidisciplinary thermal modeling, aim to limit thermal loads on the brake fluid at the design level; nevertheless, in real operation, there remains the need for a timely and reliable assessment of its actual condition.
In this context, this study offers a practical approach for the simultaneous determination of boiling point, moisture content, and electrical conductivity, which allows for a more realistic assessment of the condition of the brake fluid under real operating conditions.
2. Materials and Methods
For the purposes of this study, the condition of various brands of brake fluids was determined in laboratory conditions. The verification of the condition of the selected brake fluids was carried out using various diagnostic tools and methods. The research was conducted on brake fluids of the brands Ate, Febi, and TRW, as these brake fluids comply with the DOT4 standard. The brake fluids tested were stored in their unsealed factory containers. The Ate brand brake fluid was unused and stored in the unsealed factory containers, which were first opened 6 years ago. The Febi brake fluid is also unused and stored in an unsealed manufacturer’s container that was opened 1 year ago. The third brake fluid tested was a TRW brand used and drained from a vehicle 6 years ago and stored in the manufacturer’s original container.
All three samples of the different brake fluids were subjected to three different methods to determine their condition. For this purpose, the electrical conductivity, boiling point, and percentage moisture content of the three brake fluids were measured. The measurement of the electrical conductivity of the brake fluid was carried out by measuring the current passing through the fluid between two electrodes immersed in it and electrically powered by a direct current source. This is a method for measuring the current through the sample at an applied voltage for analyzing and comparing different samples of brake fluid with each other.
For the correct implementation of the Amperometric method for assessing the electrical conductivity of brake fluids, it is necessary to maintain a constant distance between the electrodes for each individual measurement, and the temperature of the samples must be the same for each individual measurement. These restrictions are imposed due to the fact that the temperature and the distance between the electrodes directly affect the measurement results, and to ensure comparability and uniqueness of the results, it is necessary to ensure the same initial conditions for the individual measurements.
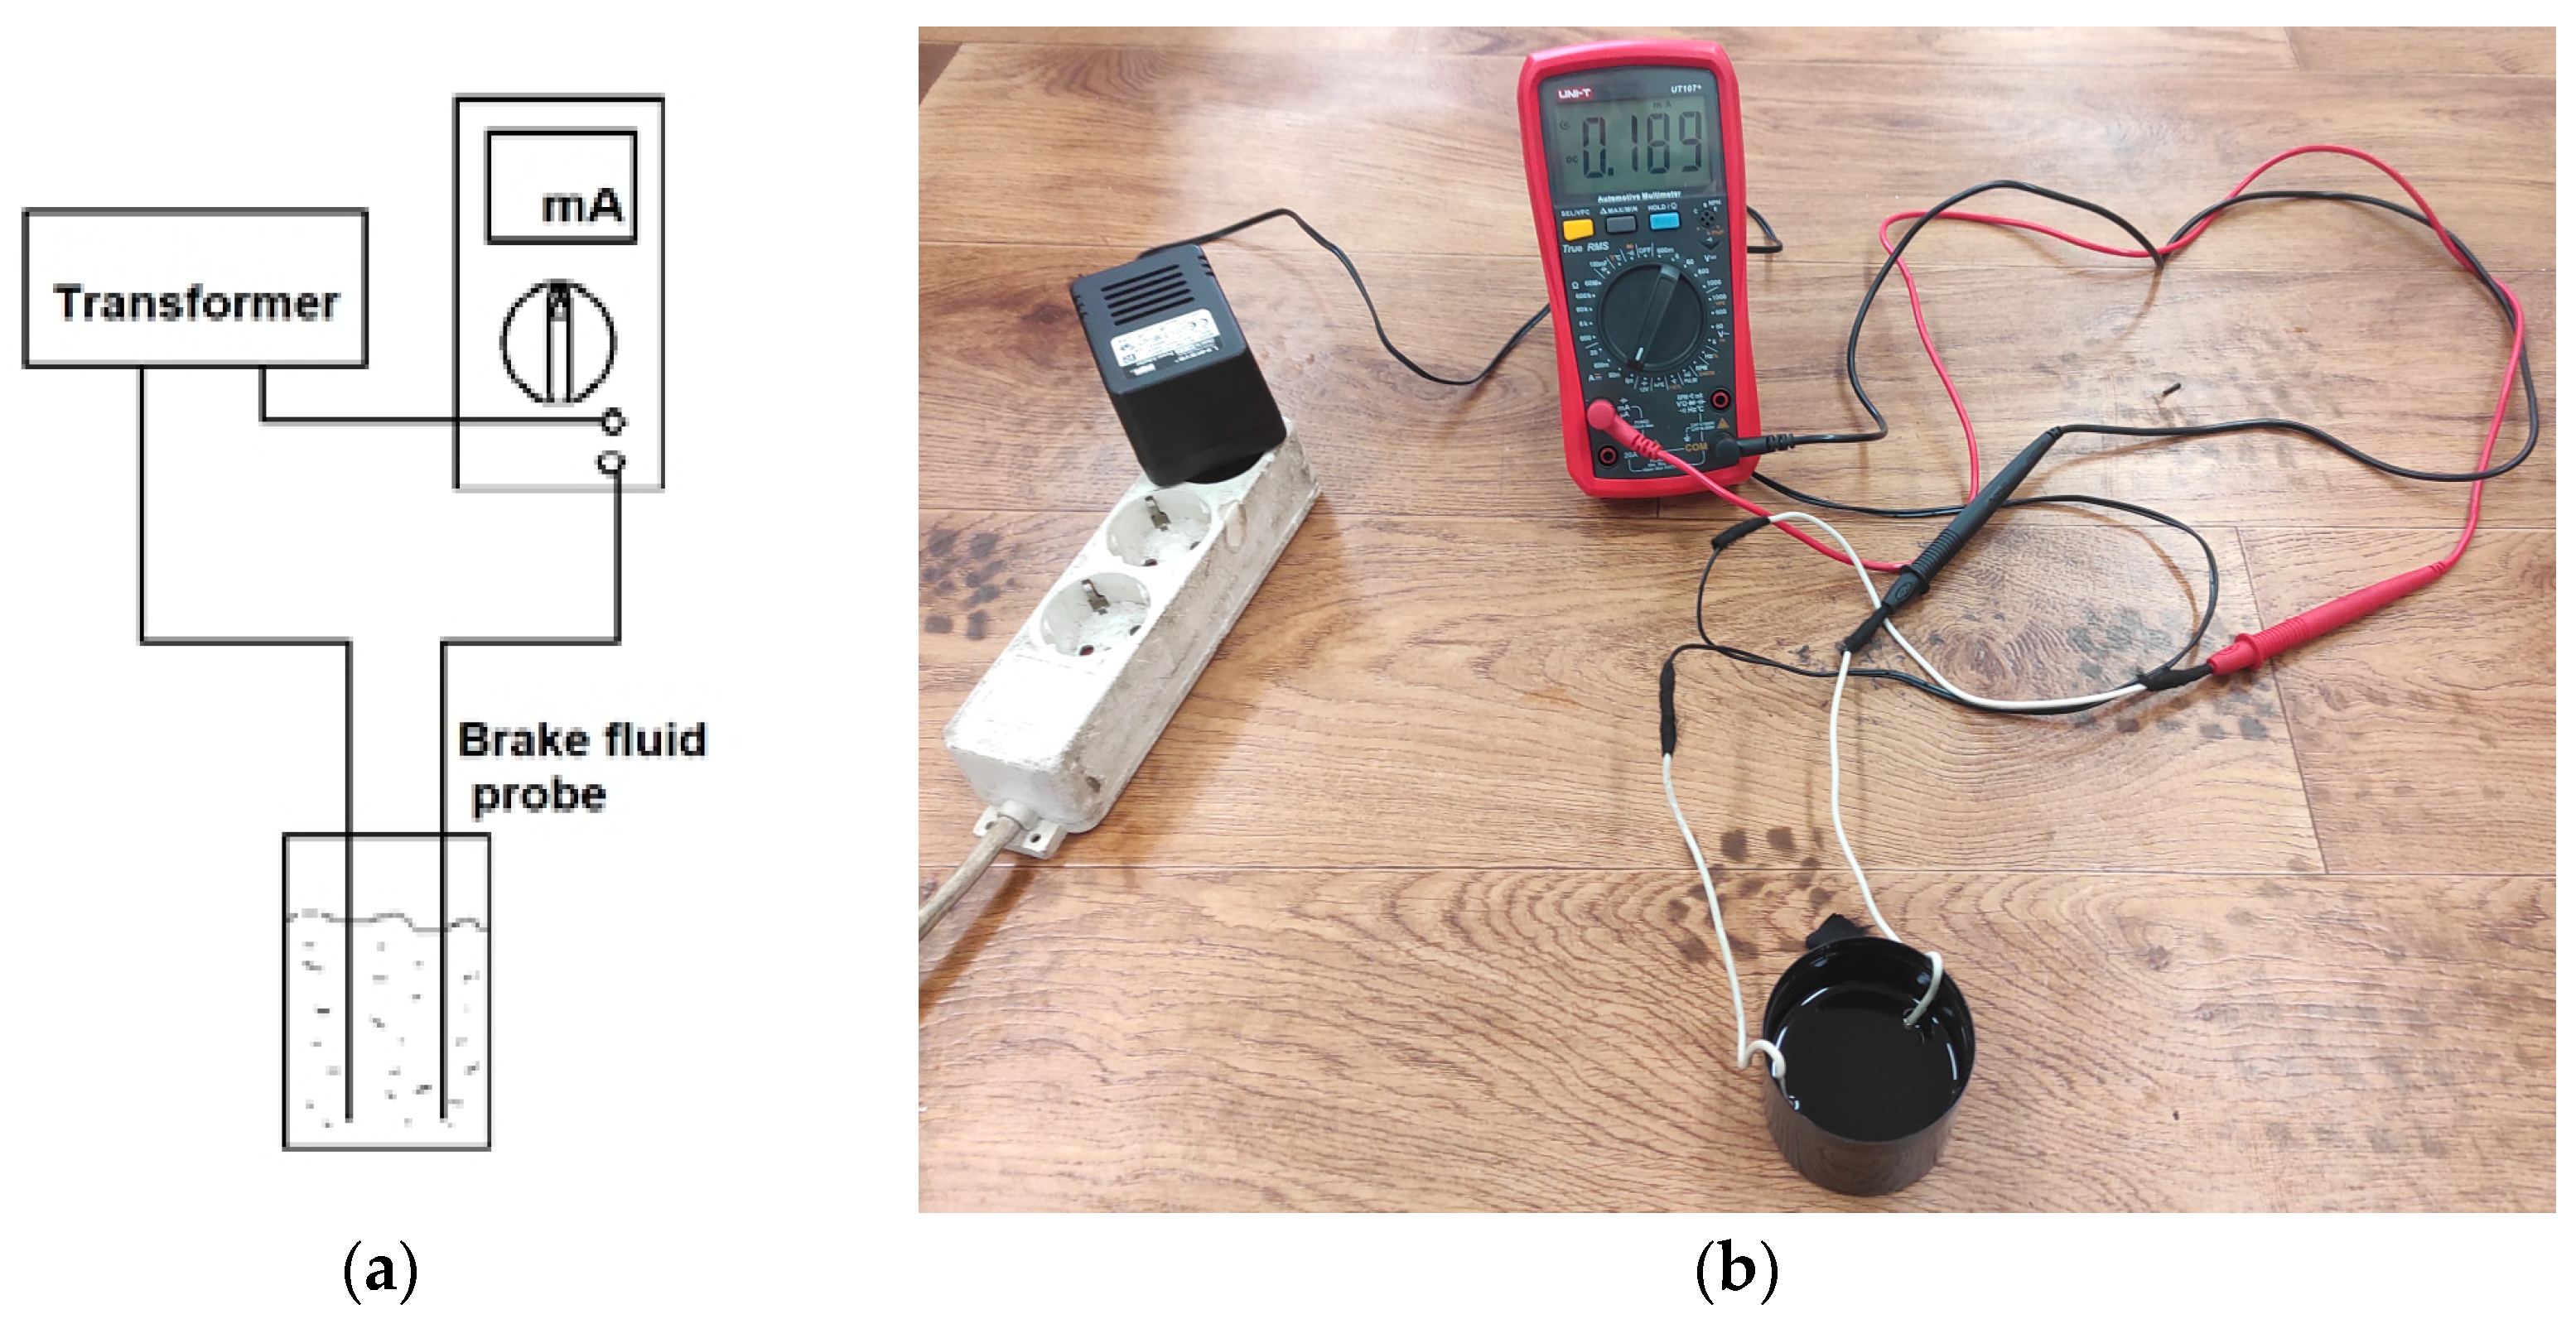
The measurement of the electric current flowing through the brake fluid sample is presented in
Figure 1.
Figure 1a presents a schematic of the experimental setup, while
Figure 1b shows the actually implemented methodology with the necessary technical devices.
To supply a constant voltage to the measuring electrodes, a transformer is used, with the following technical characteristics: Input AC voltage of 220 V with a frequency of 50 Hz and a maximum current of 150 mA, output DC voltage of 12 V and a maximum current of 1000 mA. To measure the current flowing through the brake fluid, an automotive multimeter from UNI-T, model UT 107+ (
Figure 1b), is used, set to direct current measurement mode. The same multimeter used for current measurement is used to monitor the temperature of the brake fluid samples during individual measurements. The temperature measurement is performed using a thermocouple immersed in the sample, which is connected to the multimeter set to temperature measurement mode.
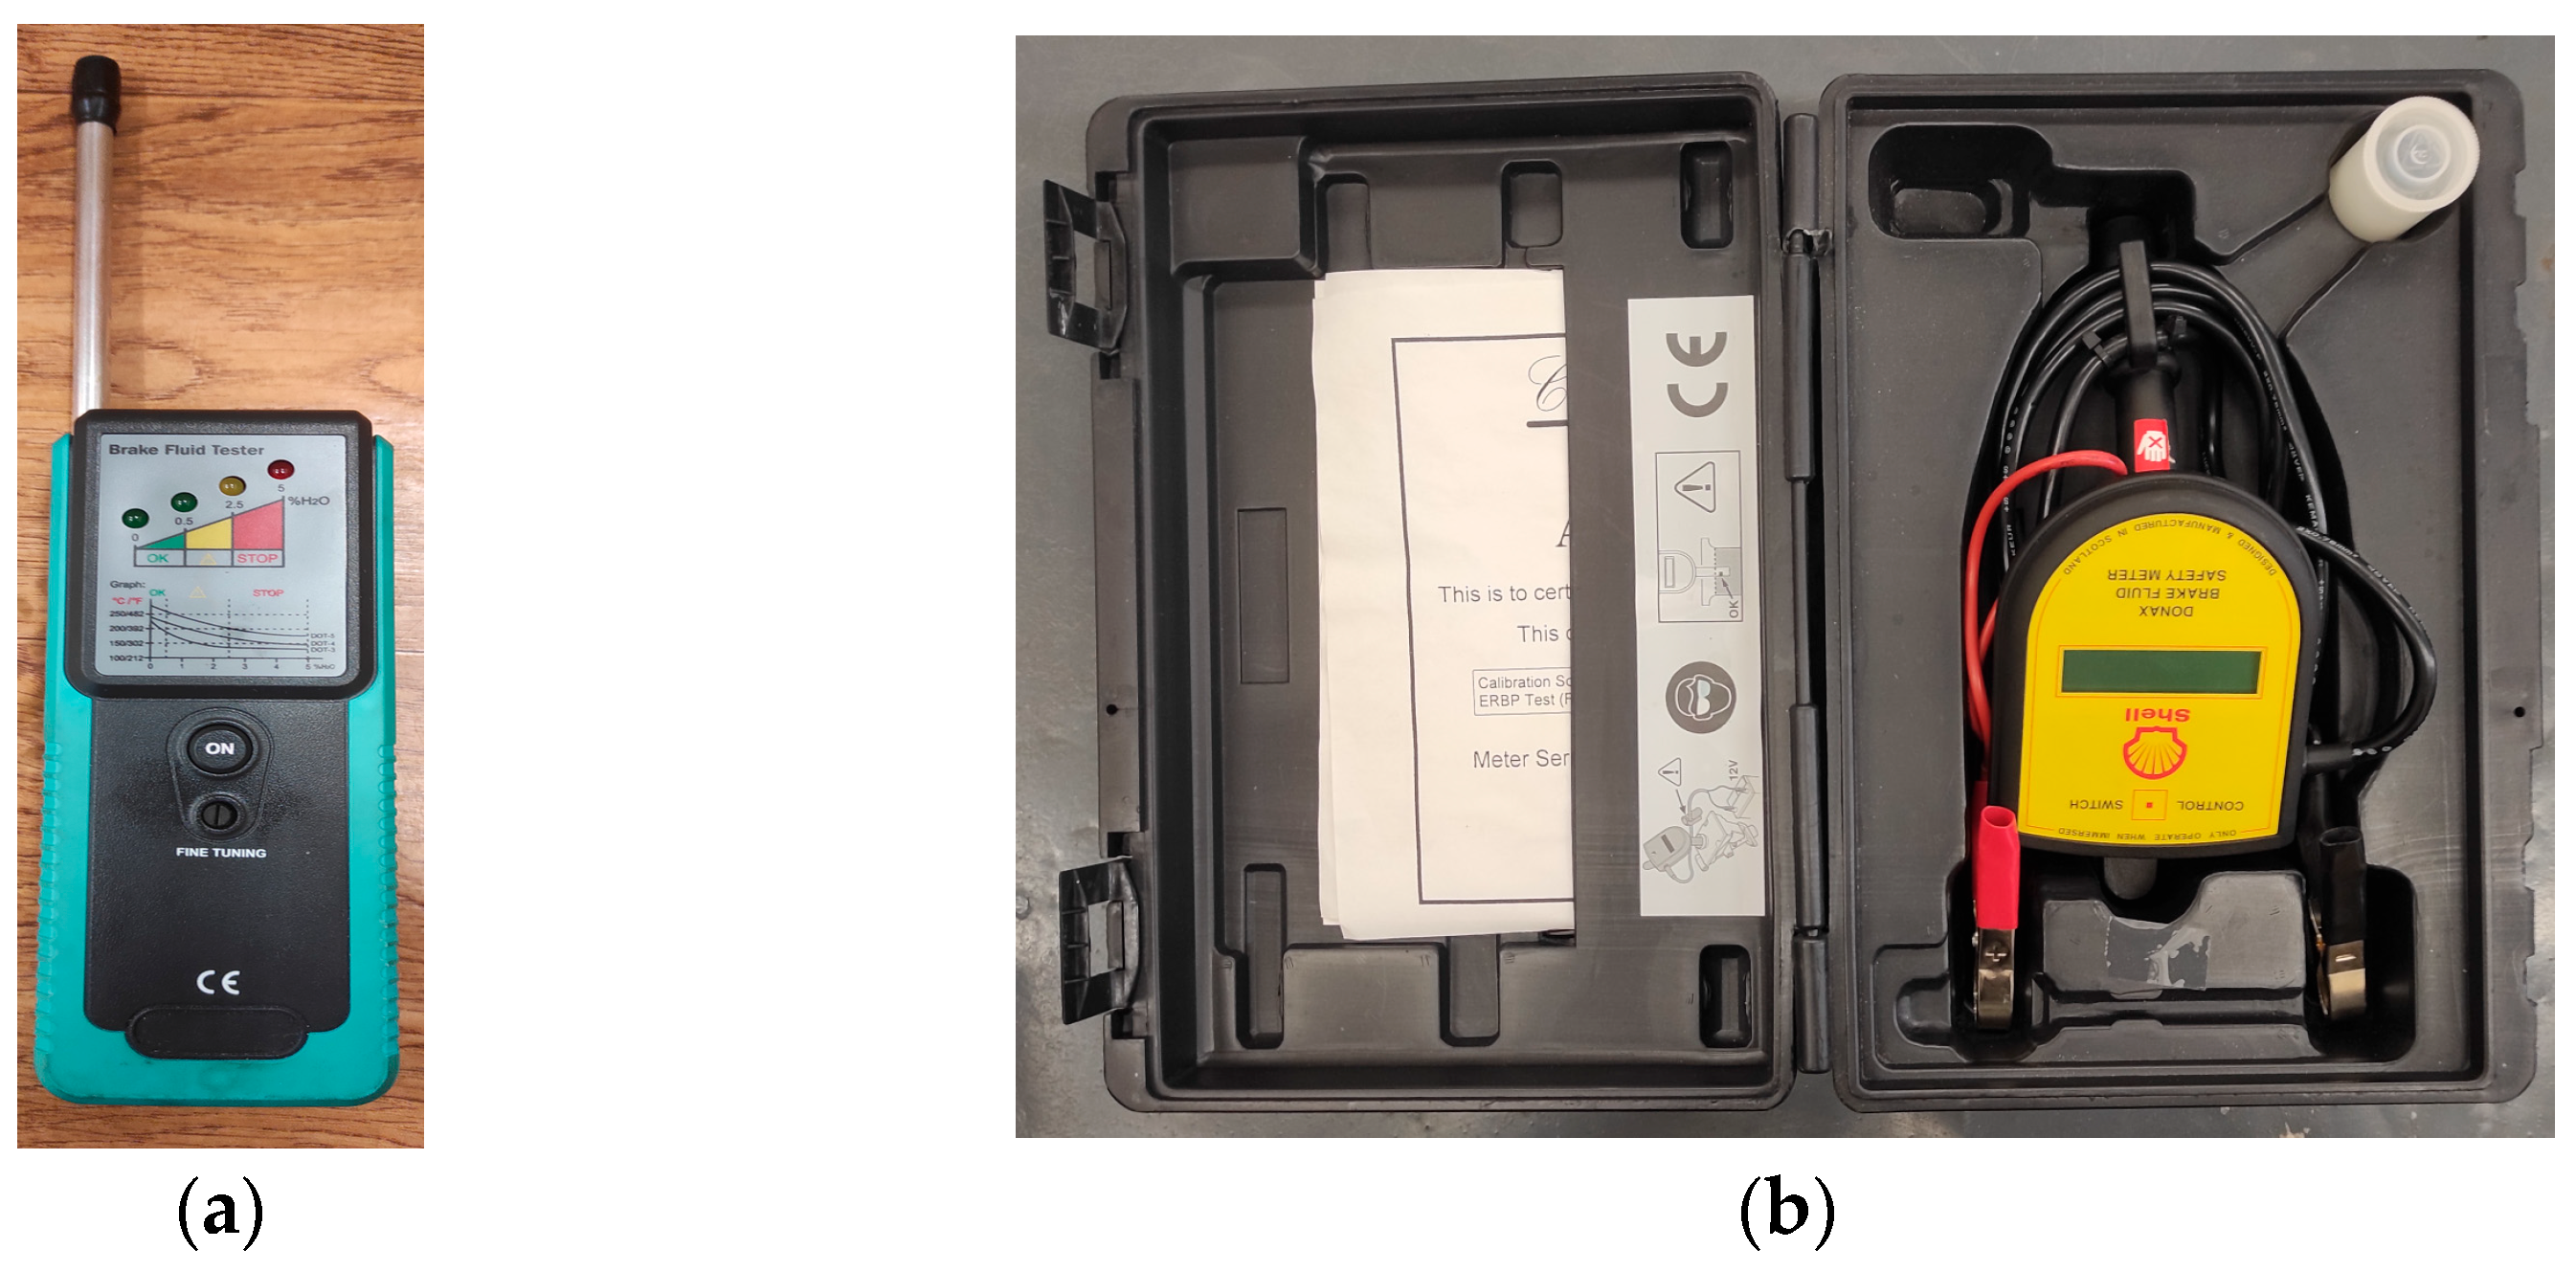
The next method used to determine the quality of brake fluid is through the use of a specialized diagnostic tester to measure the percentage of moisture in the brake fluid being tested. This type of device is also known as a brake fluid moisture tester. The device used is of the BGS brand, which is shown in
Figure 2a. It has LED indicators and a built-in buzzer sounds to determine the safety level of the brake fluid. The testing rod can be folded up to 180° for easy access and adjustment.
The tester for measuring moisture in the brake fluid shown in
Figure 2a is equipped with LED indicators that indicate the condition of the measured brake fluid and the moisture present in it. The first two indicators are green and report the presence of moisture in the range between 0–0.5%, which indicates good quality of the brake fluid. The third LED indicator is yellow and reports the presence of moisture up to 2.5%—corresponding to poor quality of the brake fluid. The last fifth LED is red, indicating 5% moisture content and the need to replace the brake fluid.
The third method used to determine the quality of brake fluid is by directly measuring the boiling point of brake fluid. For this purpose, a specialized diagnostic tester is used to measure the boiling point of brake fluid. The diagnostic device used in this experimental study of the boiling point of brake fluid is ALBA Diagnostics, which is shown in
Figure 2b. This device operates on 12 V, which allows power supply directly from the vehicle’s battery and facilitates its use in the operational conditions of cars during their technical maintenance and repair. The measurement is carried out by immersing the measuring probe in the brake fluid under test for the required time, during which the device heats the fluid, measures the boiling point, and initializes the result on its display.
The two diagnostic testers used in this study are compatible with all brands and types of brake fluids, providing reliable and comparable results. They allow users to quickly assess brake fluid quality by comparing the actual boiling point with international standards, helping determine when brake fluid needs to be replaced.
3. Results and Discussion
A sample with a volume of 60 mL was used from three brake fluids that are the subject of this study, and the parameters were measured using the three described methods. For subsequent measurements, water was gradually added to the individual samples in a ratio of 1% to 6% with a 1% step, and with each change in the percentage of moisture in the brake fluid, measurements were performed using the three methods. In this way, the aim is to establish the influence of the change in moisture in the brake fluid on the measured parameters using the three methods.
3.1. Analysis of the Results of Measuring the Percentage of Moisture in Brake Fluid
The results presented in
Table 1 show the measured moisture content of three types of brake fluids (Febi, TRW, and ATE) after the sequential addition of controlled amounts of water from 1% to 6%. In the initial state, ATE and Febi demonstrate a low moisture content (0.5%). In comparison, TRW starts at 2.5%, which is explained by the fact that this brake fluid was used and operated for a period of two years, after which it was drained from the vehicle’s brake system and stored in the original container of the manufacturer of this brake fluid.
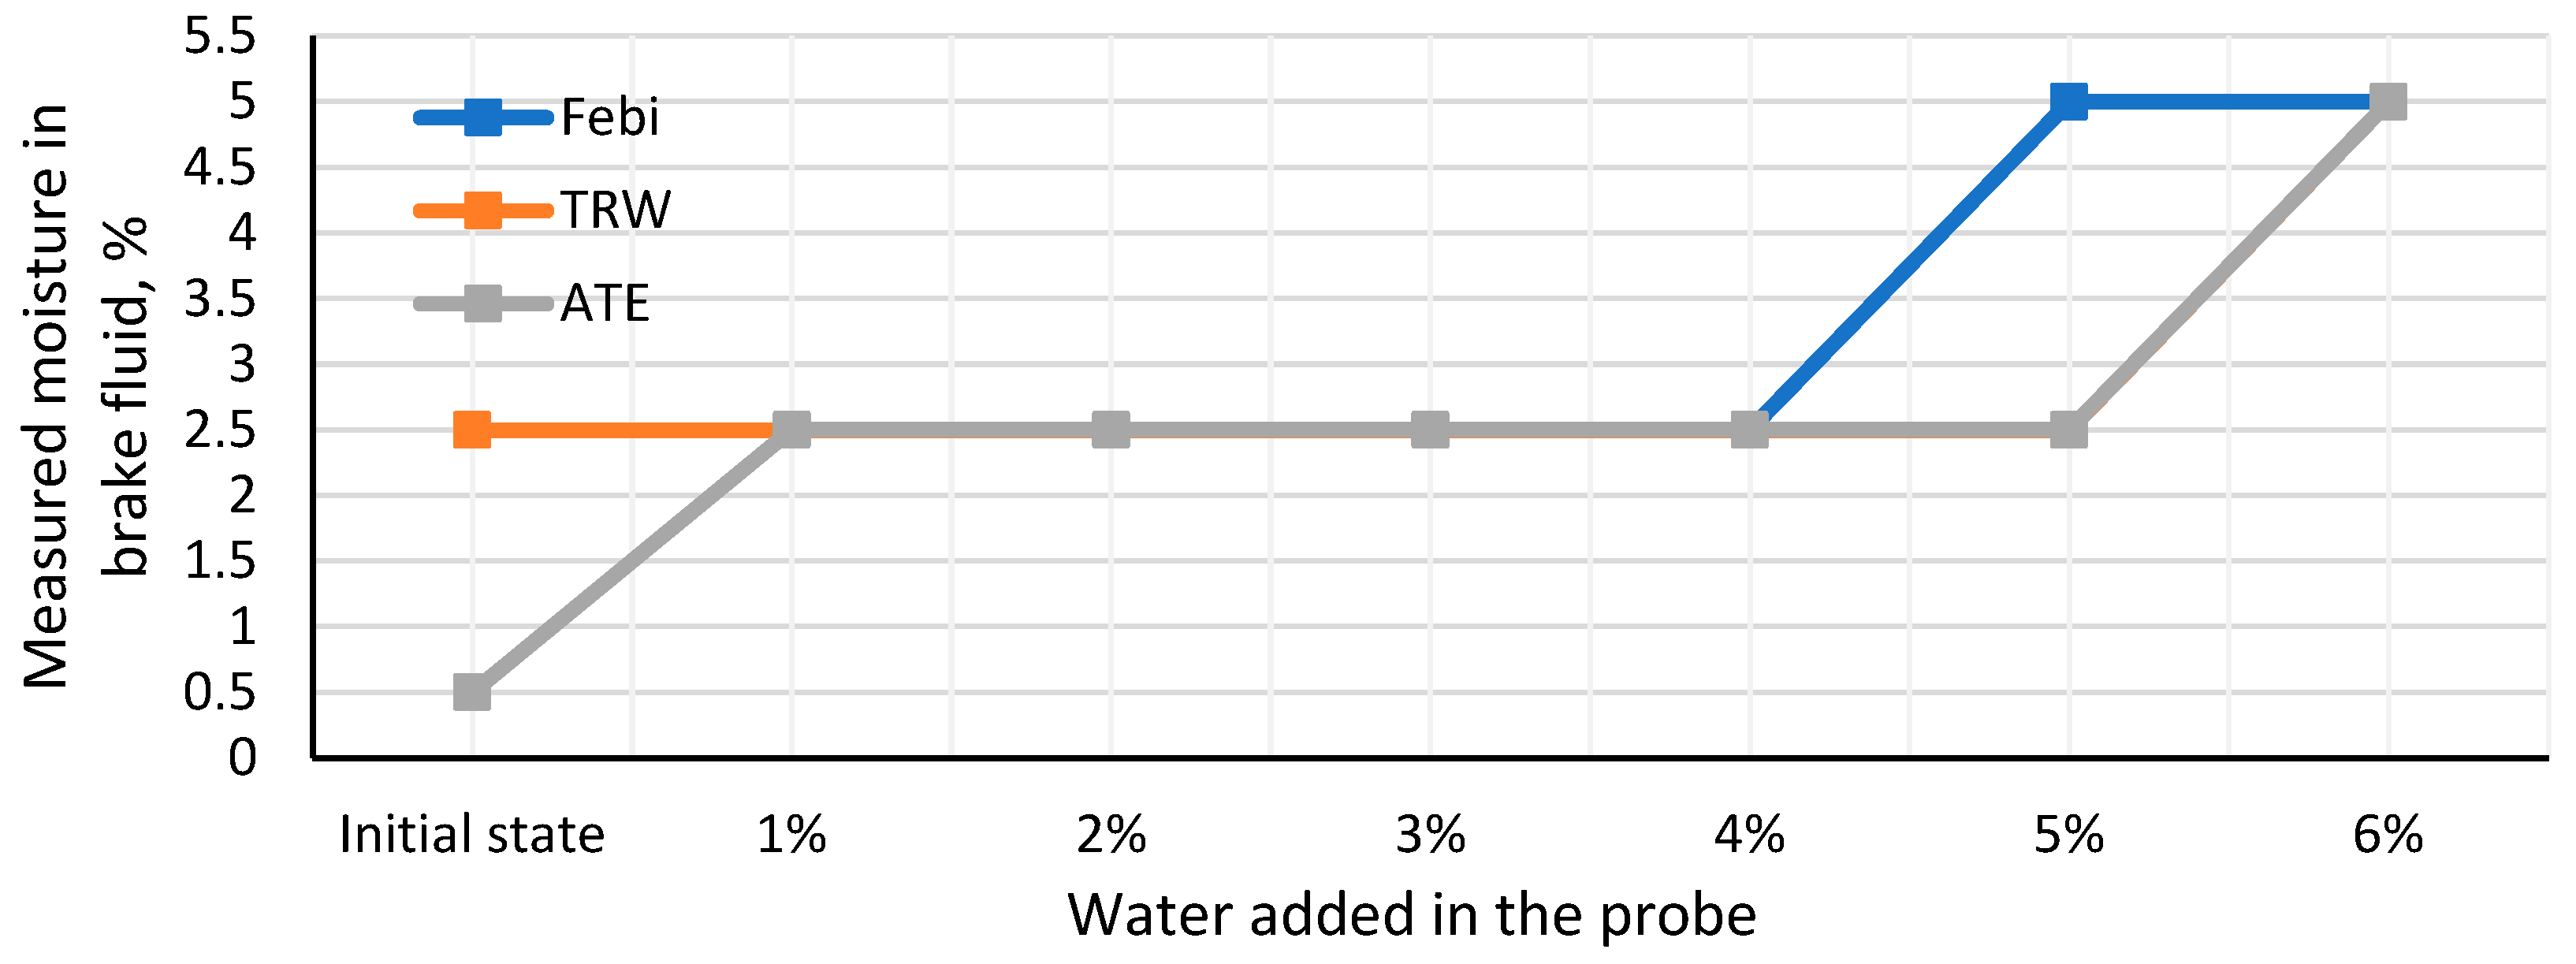
The graphical representation of the results is shown in
Figure 3, which shows that when 1% water is added, all liquids equalize to about 2.5%. This result shows that the moisture meter registers the initial moisture increase similarly and independently of the brand, which means good sensitivity within the initial range.
In the range of 2–4% added water, the measured values remain fixed at 2.5% for all three samples. This clearly indicates a saturation zone of the sensitivity of the moisture measurement method, in which the actual increase in moisture is not proportionally recorded. In this range, the measuring device used cannot reliably differentiate water concentrations above about 2.5%.
At higher concentrations, a distinction between brands occurs. At 5% water added, Febi and ATE show a sharp jump from 2.5% to 5%, while TRW remains fixed at 2.5%. This indicates that the chemical composition, due to the fact that this sample was taken from used TRW brake fluid, probably leads to a smaller change in the electrical or dielectric properties that the moisture meter uses to determine the moisture content. At 6% water added, TRW also reaches 5%, but only at the end of the range, indicating a delayed response of the method with this brand and in this condition.
3.2. Analysis of the Results of Measuring the Current Flowing Through the Brake Fluid
The method for testing the condition of brake fluids, by measuring the electrical characteristics of the brake fluids, gives results for the current flowing through them, and the results are presented in
Table 2. The measured currents show a clear relationship between water content and electrical conductivity, with all samples increasing with increasing moisture, which is an expected result, given the high ionic conductivity of water compared to the basic glycol esters.
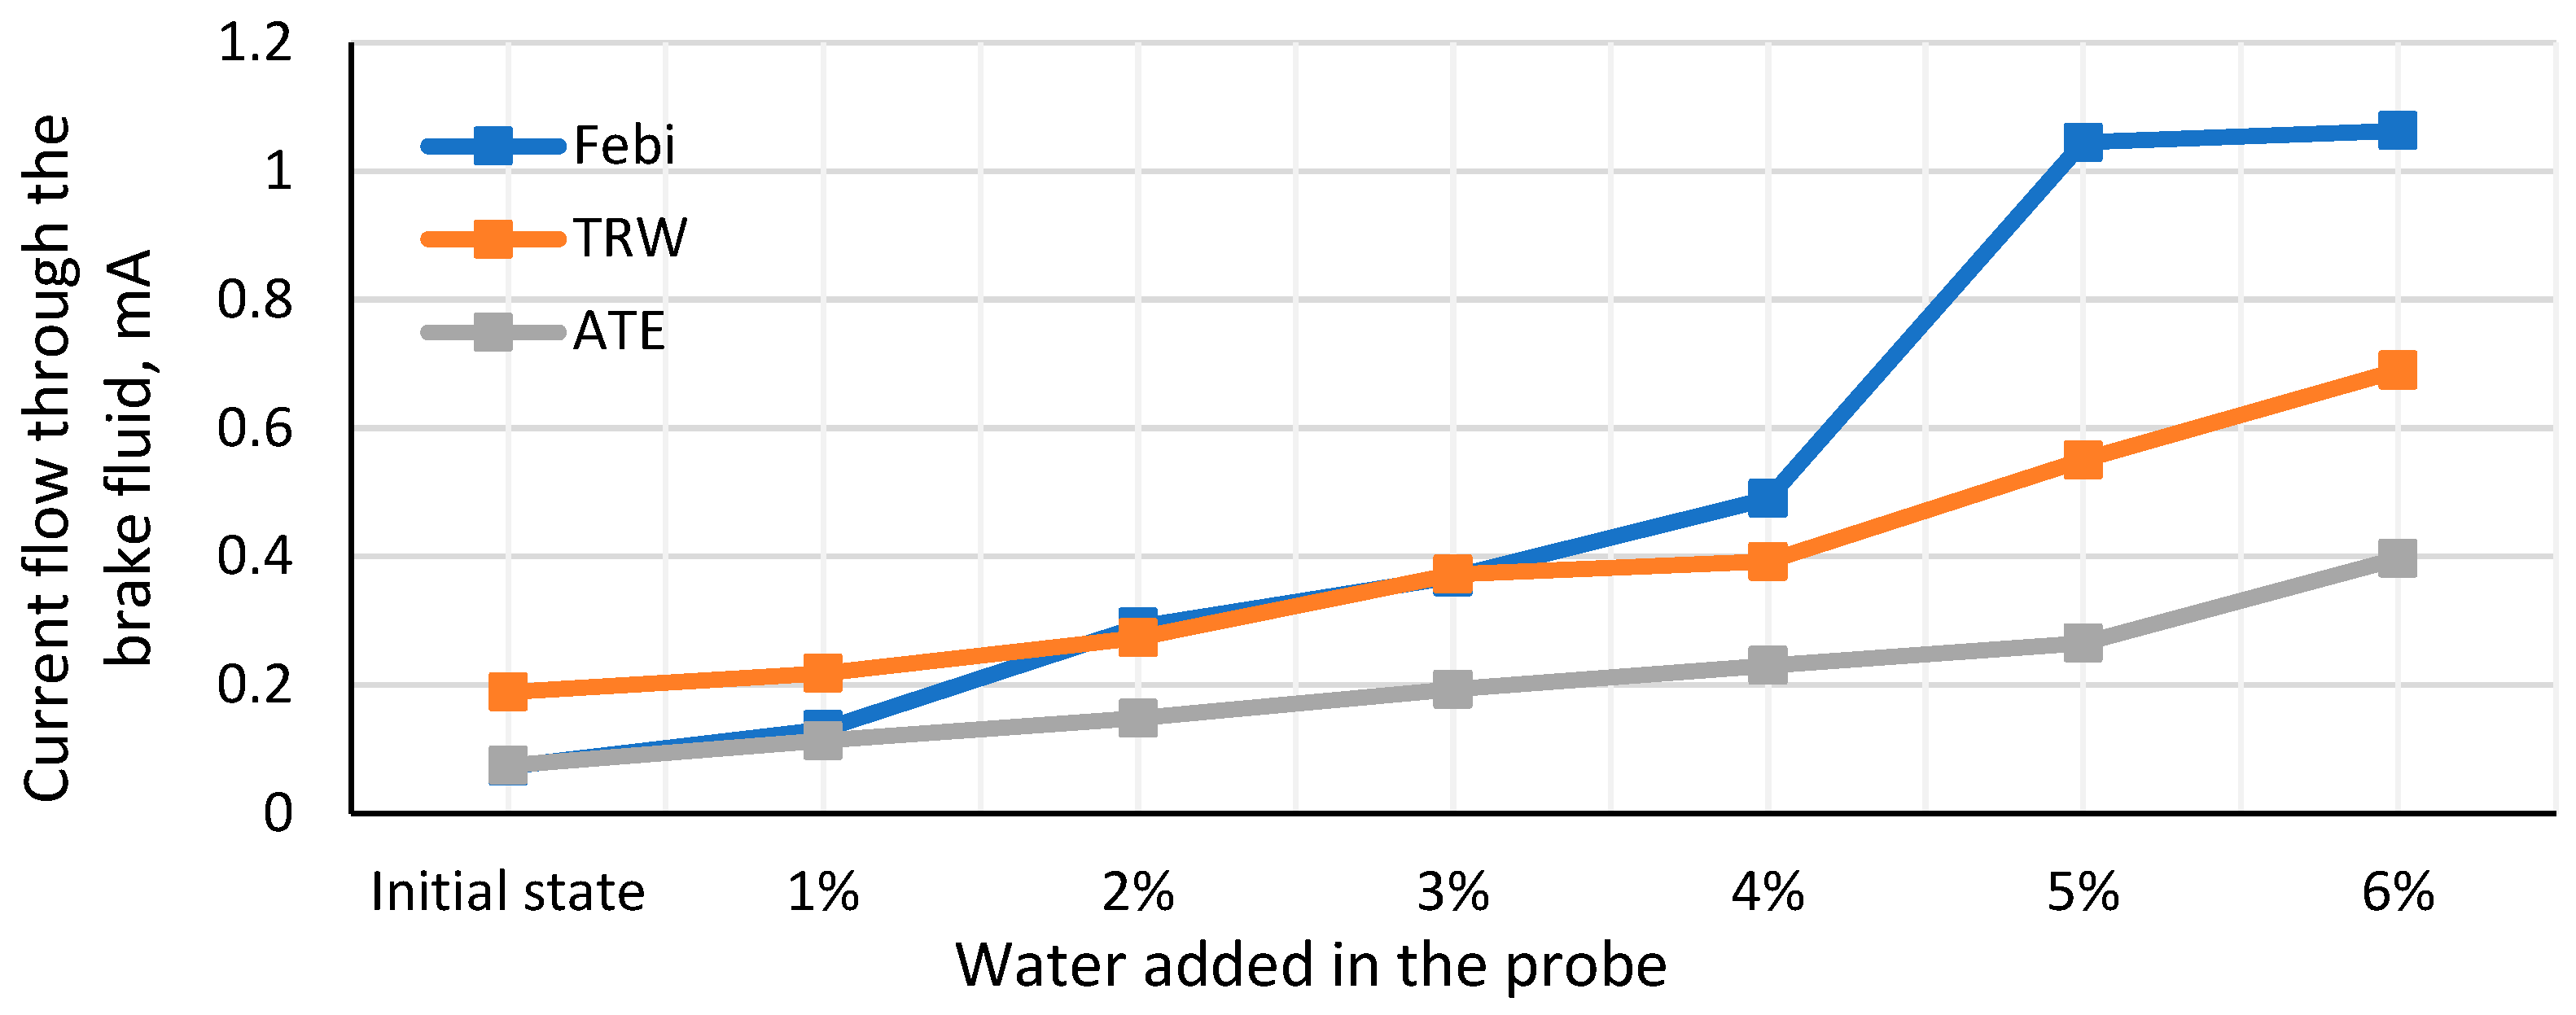
The graphical representation of the obtained results is presented in
Figure 4, from which it is observed that the most recently unpacked and unused Febi brake fluid has the highest sensitivity of the flowing current to the moisture content, especially at the relatively higher percentage of moisture content above 3%. This dependence can be interpreted as a stronger interaction between moisture and the chemical composition of the liquid.
Although the TRW brake fluid is used in the braking system and is assumed to have the highest degree of degradation, it shows a moderate increase in the current flowing through it, with the dependence being smoother and more predictable without characteristic peaks in the values. The Ate brake fluid shows the lowest values of the current measured through it and the lowest rate of change, which suggests the highest resistance to the presence of moisture in it.
3.3. Analysis of the Results of the Measurement of the Boiling Point of Brake Fluid
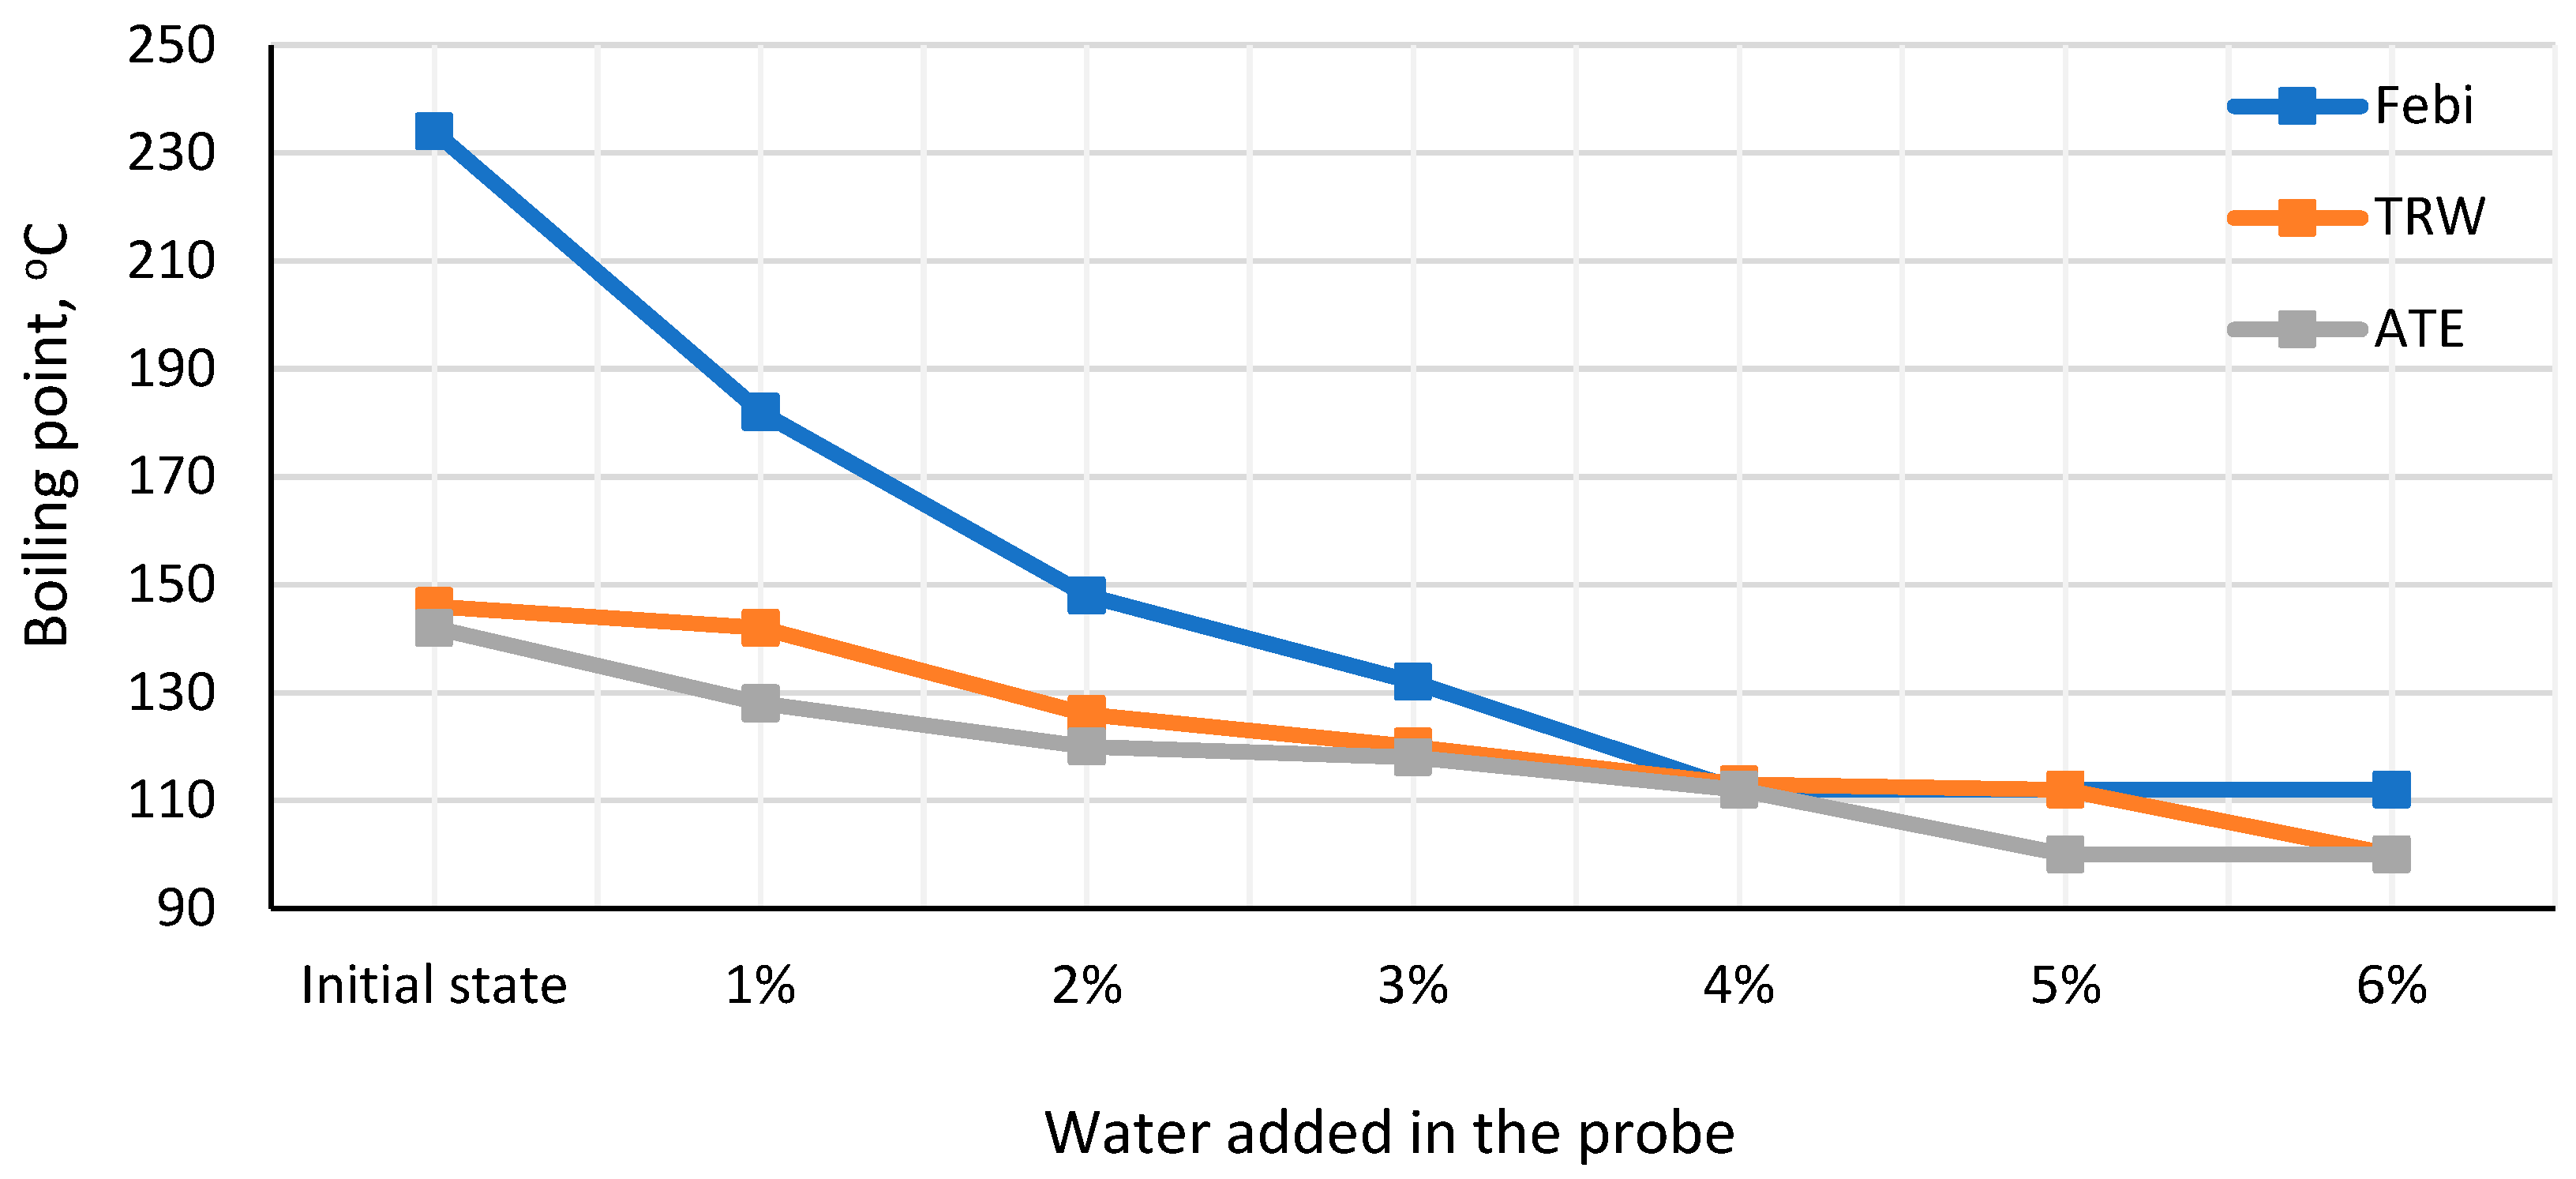
The results for the change in boiling point depending on the water content in the three brake fluids studied are presented in
Table 3.
Figure 5 presents the graphical representation of the results obtained in the examination of brake fluids using the boiling point measurement method.
All samples demonstrate the typical brake fluid tendency to sharply decrease the boiling point with increasing water content, which is an expected consequence of the strong hygroscopicity of glycol formulas. The comparison between the three fluids shows that Febi has the highest initial heat resistance, but also the steepest drop in contamination. TRW and ATE, although starting from lower values, demonstrate a more linear and controlled drop in boiling point. For all three products, the boiling point after 4–6% water levels out at around 100–112 °C, which corresponds to the boiling point of water. This shows that at high humidity, differences between brands are minimized, whereas at low humidity, behavior depends mainly on the chemical formulation and additives.
3.4. Regression Analysis of the Results of the Three Diagnostic Methods
The purpose of the regression analysis is to determine the quantitative relationship between the water content in the brake fluid and the three measured parameters: hygrometer readings, electric current, and boiling point. The analysis allows the assessment of the sensitivity, linearity, and predictability of each method and the formulation of an objective assessment of its diagnostic value.
3.4.1. Regression Analysis of the Results of the Moisture Test
The data in
Table 1 show that the moisture meter operates on the principle of threshold classification, rather than continuous measurement based on preset threshold levels. This means that the device does not measure the actual moisture content of the brake fluid, but rather assigns it to one of several fixed categories defined by the manufacturer. This principle of operation results in a step-like relationship between the actual water content and the reported value, which is fundamentally different from the linear or exponential relationships observed with the other two methods. This behavior indicates that the hygrometer does not detect changes in the dielectric properties of the liquid in a continuous manner, but only checks whether certain thresholds are crossed. This fundamentally limits the possibility of applying classical regression models, since the device does not provide real quantitative values but discrete levels that do not proportionally reflect the actual water content.
Although linear regression is a standard tool for analyzing the relationship between two quantities, applying it to moisture meter data results in low statistical reliability, as the relationship between the actual water content and the reported value is stepwise, not linear.
The linear model of the type:
where
M is the reported moisture, and
W is the actual water content, gives the following results for the three brake fluids measured:
Low values of the coefficient of determination (R2 < 0.80) indicate that the linear model cannot explain the variation in the data. This is a consequence of the fact that the moisture meter generates only three possible values, regardless of the actual change in moisture. The lack of a smooth relationship makes linear regression statistically and physically invalid.
The differences between Febi, ATE, and TRW at high moisture levels (5–6%) are due to: different dielectric properties of the glycol mixtures; different additives and inhibitors; different degrees of aging (TRW is a used liquid); and different ionic mobility upon humidification. These factors affect the way the moisture meter interprets the change in electrical parameters, leading to brand-dependent behavior.
The moisture meter is suitable for a quick service check, provides qualitative rather than quantitative information, cannot distinguish real values between 1% and 4% water, is not suitable for regression modeling, and shows limited accuracy and sensitivity across brands. Therefore, the moisture meter test should only be used as a guide and not as a means of precise diagnosis or scientific analysis.
The data in
Table 1 show that the moisture meter does not continuously measure moisture content, but classifies the samples into three discrete diagnostic levels: 0.5%, 2.5%, and 5%. This behavior is typical of devices based on threshold dielectric changes, in which the measuring electronics compare the received signal with predefined reference values. As a result, the device does not provide quantitative information but rather a qualitative assessment of the degree of humidification.
Linear regression on these data leads to low values of R2 (0.38 for TRW, 0.64 for ATE, and 0.80 mfor Febi), which indicates that the linear model does not adequately describe the relationship. Therefore, two more appropriate approaches were applied.
- -
Piecewise Threshold Step Function Model
This model reflects the actual algorithm of the device. The transitions between levels coincide with the observed experimental jumps, indicating that the hygrometer responds only when the dielectric constant crosses a certain threshold.
- -
Power-Law Regression Model
For practical modeling purposes, a power model was used. It allows smooth approximation of the stepwise dependence and is easy to implement in Excel through linearization. The following relationships with the corresponding coefficients of determination were obtained for the tested brake fluids:
TRW is practically insensitive to moisture, while Febi and ATE show similar sensitivity. The moisture test is suitable for quick service diagnostics, but cannot serve as a quantitative method. The step model best describes real-world behavior, while the power model is a convenient mathematical approximation for visualization and comparison.
3.4.2. Linear Regression Model of Brake Fluid Electrical Conductivity
Unlike the hygrometer, the amperometric method shows a clear linear relationship between water content and electric current. This is expected because water increases the ionic mobility and conductivity of the glycol base. It has also been experimentally demonstrated in [
31] that the hygroscopic nature of glycol brake fluids leads to an almost linear increase in moisture content, accompanied by a measurable decrease in electrical resistance, which confirms the key role of moisture absorption in degradation processes. The linear dependence of the current flowing through the brake fluid as a function of the water added to it is described similarly to Equation (1), which has the form:
where I is the measured current (mA) and
W is the actual water content (%). The following linear models are obtained for the three brake fluids tested:
Febi shows the highest sensitivity to moisture and the highest initial conductivity. TRW has moderate but very stable linearity. ATE demonstrates the lowest conductivity and the smallest change. High R2 values (>0.9) confirm excellent linearity, which shows that the linear model is statistically stable and physically justified. The amperometric method is quantitatively reliable and allows prediction of the degree of wetting.
3.4.3. Exponential Statistical Model of the Relationship Between Moisture Content and Boiling Point
The data in
Table 3 show a clear nonlinear relationship between the water content of the brake fluid and the measured boiling point. At low water concentrations (1–3%), a sharp drop in temperature is observed, while at higher levels (4–6%), the values level off around 100–112 °C, which is close to the boiling point of water. This behavior is typical of hygroscopic glycol fluids and cannot be adequately described by a linear model. The choice of an exponential regression model is based on three key arguments: the physicochemical nature of glycol mixtures, the shape of the experimental dependences, and the thermodynamic laws governing boiling in water–glycol solutions.
Glycol brake fluids are highly hygroscopic, and when water is added, two processes occur: a decrease in the vaporization energy of the mixture and a nonlinear change in the activity of the components due to hydrogen bonding and microstructural changes [
18,
24,
25].
These processes lead to an exponential damping of the boiling point:
where the decline is steepest at low concentrations and slows down at high ones,
Tb is the boiling point at a given moisture content
W,
T0 is the boiling point of the dry liquid, and
k is a coefficient characterizing the sensitivity to moisture.
The graphical analysis of
Table 3 shows a steep initial decline (e.g., Febi: 234 °C → 132 °C at 0–3% water), a gradual leveling off towards 100–112 °C at 4–6% water, and an asymptotic approach to the boiling point of water. When linearized by:
high values of the coefficient of determination are obtained:
R2 = 0.88 for Febi,
R2 = 0.97 for TRW, and
R2 = 0.96 for ATE. This confirms that the exponential model describes the data best. It is well established in the scientific literature on water–glycol solutions that: the vapor pressure of the mixture increases exponentially with increasing water content, the boiling point decreases exponentially upon dilution, as in [
16] it is experimentally proven that the boiling point depression is steepest at low concentrations and levels out at high concentrations—typical exponential behavior, and nonlinear relationships are the result of changes in the activity of the components. Therefore, the exponential model is not only statistically but also physically justified.
Results from the exponential regression for the three brake fluids studied are described by the following mathematical models:
Febi shows the highest initial boiling point and steepest decline, while TRW and ATE demonstrate a smoother decline. At high moisture levels, all liquids level off around 100–112 °C, indicating that water dominates the thermal behavior of the mixture.
The exponential model is the most suitable mathematical tool for describing the relationship between moisture content and the boiling point of brake fluid. It reflects the real physics of the process, corresponds to experimental data, and provides high predictive accuracy over the entire measurement range.
The boiling point measurement method is the most reliable indicator of critical loss of safety.
The data obtained show that when measuring the same parameter repeatedly under unchanged conditions, the results remain close, which indicates the stability of the methodology and the reliability of the measurement scheme used. The small differences between individual repetitions are explained by normal sources of uncertainty such as slight temperature fluctuations, changes in the contact resistance between the electrodes, and minor irregularities in the sample. These factors affect the accuracy but do not change the general trend of the results, which confirms that the method is sufficiently robust for assessing the studied parameters under controlled laboratory conditions.
The uncertainty and repeatability of the experimental results of the three diagnostic methods show clearly distinguished metrological characteristics, which reflect both the physical nature of the measured quantities and the design features of the devices. The moisture test, based on the threshold dielectric principle, demonstrates high internal repeatability within individual step levels, but at the same time significant uncertainty for samples located close to the boundaries between the thresholds, where small variations in composition can lead to different classifications; this limits its quantitative reliability and positions it as a tool for indicative assessment. The amperometric method, on the contrary, shows the lowest uncertainty and the highest repeatability, which is confirmed by the strong linear dependence and the minimal scatter around the regression line; this makes it the most stable and metrologically reliable approach for quantitative determination of moisture content. The boiling point method demonstrates good repeatability and moderate uncertainty, with variation being more pronounced at low water concentrations due to the steep initial temperature drop, but remaining within acceptable limits for reliable safety assessment and prediction of the risk of vapor lock. In summary, the amperometric method is distinguished by the highest metrological stability, the thermal method is the most informative for functional safety, and the hygrometric test is most suitable for rapid but rough classification in service conditions.
The boiling point method is the most acceptable diagnostic approach from a functional safety perspective, as it measures a parameter that is directly related to the risk of vapor lock and loss of braking efficiency. Unlike the moisture test, which only provides a discrete classification, and the amperometric method, which measures an indirect electrical indicator, the thermal method records the actual boiling temperature of the wetted fluid and reflects its immediate behavior under high load. The exponential regression model with high R2 values (0.88–0.97) confirms its repeatability and predictability, making it the most reliable criterion for assessing the residual resource and safety of the brake fluid.
4. Conclusions
The mixed analysis of the three brake fluids shows a consistent relationship between water content, electrical conductivity, and lowering of the boiling point. In all products tested (Febi, TRW, ATE), the addition of water leads to an increase in the electrical current through the fluid, which reflects its increased conductivity due to the hygroscopic nature of the glycol bases. In parallel, a clear lowering of the boiling point is observed, with the drop being most significant in the range of 1–4% added water. Febi demonstrates the highest initial boiling point, but also the steepest drop upon wetting, while ATE shows the smoothest change in conductivity and boiling point. TRW occupies an intermediate position in both parameters. Data from the moisture meter confirm these trends: at low water levels, the readings level off at around 2.5%, and at 5–6%, all fluids reach critical values. The overall result of the three methods shows that at a water content above 3–4%, all tested liquids lose their safe characteristics, which emphasizes the importance of regular control and timely replacement.
Data obtained using the moisture percentage method confirm that moisture measuring devices may be unreliable for accurately determining moisture in various brake fluids. Comparative analysis revealed that Febi responded most strongly to the presence of water, TRW demonstrated a stable and linear relationship, and ATE was least affected by moisture. These differences likely stem from variations in chemical composition, including the ratios of glycols, additives, and inhibitors, which determine the ionic mobility and the ability of the fluid to absorb water.
The amperometric method is reliable, sensitive, and suitable for quantitative analysis. Linear regression describes the relationship perfectly and can be used to predict moisture content in real conditions.
The exponential model is best suited to describe the thermal degradation of brake fluid using the boiling point method. It reflects the real physics of the process, matches experimental data, and allows for reliable prediction of the boiling point at different levels of wetting.
Regression analysis shows that the boiling point depression follows an exponential relationship (R2 = 0.88–0.97), typical of water–glycol mixtures.
The decrease is steepest at low concentrations (1–3%), after which the curve flattens out and asymptotically approaches the boiling point of water.
This model is fully compatible with the thermodynamic laws of vapor pressure and activity of the components.
The boiling point method is most suitable for safety assessment, as it measures a parameter directly related to the risk of vapor lock. The exponential model allows for the prediction of critical wetting levels.
The moisture test is quick, cheap, and convenient, but it only provides qualitative information and cannot be used for quantitative analysis.
The amperometric method is the most accurate and linear, making it the most suitable for quantitative moisture determination.
The boiling point method is the most informative for safety assessment, as it measures a parameter directly related to the risk of brake system failure.
Combining the three methods provides the most complete and reliable diagnosis of the condition of the brake fluid.