Proceeding Paper

Mechanical Properties of DED-Arc Processed ER5356 and ER4046 Aluminum Alloys †
Chair of Welding Engineering, Chemnitz University of Technology, Reichenhainer Straße 70, 09126 Chemnitz, Germany
*
Author to whom correspondence should be addressed.
Presented at the 16th International Aluminium Conference (INALCO 2026), Trondheim, Norway, 10–12 June 2026.
Eng. Proc. 2026, 151(1), 8; https://doi.org/10.3390/engproc2026151008
Published: 17 July 2026

Abstract

Additive manufacturing using wire-arc directed energy deposition (DED-Arc) enables flexible, batch-independent fabrication and modification of aluminum components and is of particular interest for large-scale components and repair applications. Beyond manufacturability, the mechanical properties of the deposited material are decisive for structural applications. While Al-Mg alloys such as ER5356 are established in DED-Arc research, ER4046 (AlSi10Mg) has so far received limited attention, despite its relevance for the modification and repair of cast aluminum components. Accordingly, this study compares the mechanical properties of ER5356 and ER4046 alloys processed by DED-Arc using different deposition strategies, including thin-walled single-bead and volumetric zig-zag deposits. ER4046 specimens were heat treated to the T6 condition after deposition, whereas ER5356 was investigated in the as-built state. Metallographic analyses and tensile and fatigue tests were conducted, with tensile loading applied in three orientations relative to the build direction (0°, 45°, and 90°). The results indicate a dependence of tensile properties on loading direction, particularly for ER5356. Differences related to the deposition strategy generally fall within the scatter typically observed for DED-Arc materials. Overall, the material properties of both alloys are comparable to those of conventionally wrought or cast aluminum products, indicating their suitability for DED-Arc-based manufacturing.

1. Introduction

Complementary to conventional manufacturing processes such as casting and milling, additive manufacturing (AM) has led to an expansion of the manufacturing possibilities for metallic components. Based on the basic principle of layer-wise material deposition, a variety of AM processes have been developed to address different application requirements [1,2]. Among the various AM technologies, wire and arc directed energy deposition (DED-Arc), also referred to as wire and arc additive manufacturing (WAAM), is particularly suited to produce large-scale metallic components due to its comparatively high deposition rates [3]. The simultaneous supply of material and energy further enables hybrid manufacturing approaches, repair applications, and the modification of existing components [4,5]. This approach further facilitates component adaptation and variant-flexible production, for instance by modifying cast components without requiring a dedicated mold for each design variant. However, a prerequisite for such applications is the metallurgical compatibility of the deposited material with the substrate as well as mechanical properties that meet the application requirements.
Given the close relation to gas metal arc welding (GMAW) and the broad availability of wire feedstock, previous studies and applications of DED-Arc additive manufacturing have predominantly focused on alloy systems commonly used in fusion welding. For aluminum alloys, these primarily include the 2000 series (ER2319), 4000 series (ER4043, ER4047), and 5000 series (ER5087, ER5183, ER5356) [6]. In addition, a limited number of studies report the successful DED-Arc processing of high-strength aluminum alloys from the 6000 and 7000 series [7,8,9]. However, the precipitation-hardenable alloy ER4046 (AlSi10Mg), widely used in powder bed fusion (PBF), has so far received limited attention in the context of DED-Arc, despite its relevance for the modification and repair of cast aluminum components [10,11,12].
Regarding mechanical properties, most studies report that the tensile properties specified for the welding filler materials are largely matched or even exceeded in DED-Arc deposits [13,14]. Comparative studies on non-heat-treatable aluminum–silicon alloys further indicate higher tensile properties for DED-Arc material compared to cast material, which is attributed to the finer microstructure resulting from higher local cooling rates during deposition [15,16]. At the same time, a directional dependence of tensile properties with respect to the layer orientation is frequently reported. Specifically, specimens loaded perpendicular (90°) to the deposition direction typically exhibit lower tensile strength and elongation, whereas the yield strength generally shows only minor orientation dependence. For alloys of the 2000 and 5000 series, this behavior is commonly attributed to microporosity and the accumulation of intermetallic phases in the interlayer transition zone [17,18,19]. Moreover, porosity inherent to welding-based processing of aluminum is generally considered a major factor contributing factor to increased scatter of mechanical properties as well as fatigue behavior [20,21]. However, due to the numerous interacting factors arising from the DED-Arc process and alloy-specific processing behavior, the mechanisms linking process strategy and mechanical properties remain an active subject of research.
The present study compares the mechanical properties of the aluminum alloys ER5356 and ER4046 processed by DED-Arc. Emphasis is placed on the influence of different deposition strategies, including thin-walled single-bead deposition and volumetric zig-zag deposition, as well as the orientation of the specimens relative to the deposition direction (0°, 45°, and 90°). The investigation focuses on the resulting tensile and fatigue properties and their relation to alloy-specific characteristics.

2. Materials and Methods

In this study, two aluminum alloys processed by DED-Arc were investigated: the non-heat-treatable alloy ER5356 (AlMg5) and the precipitation-hardenable alloy ER4046 (AlSi10Mg). Both alloys were processed using wire feedstock with a diameter of 1.0 mm. The nominal chemical compositions of the wire feedstock material according to the manufacturer material certificate are listed in Table 1.
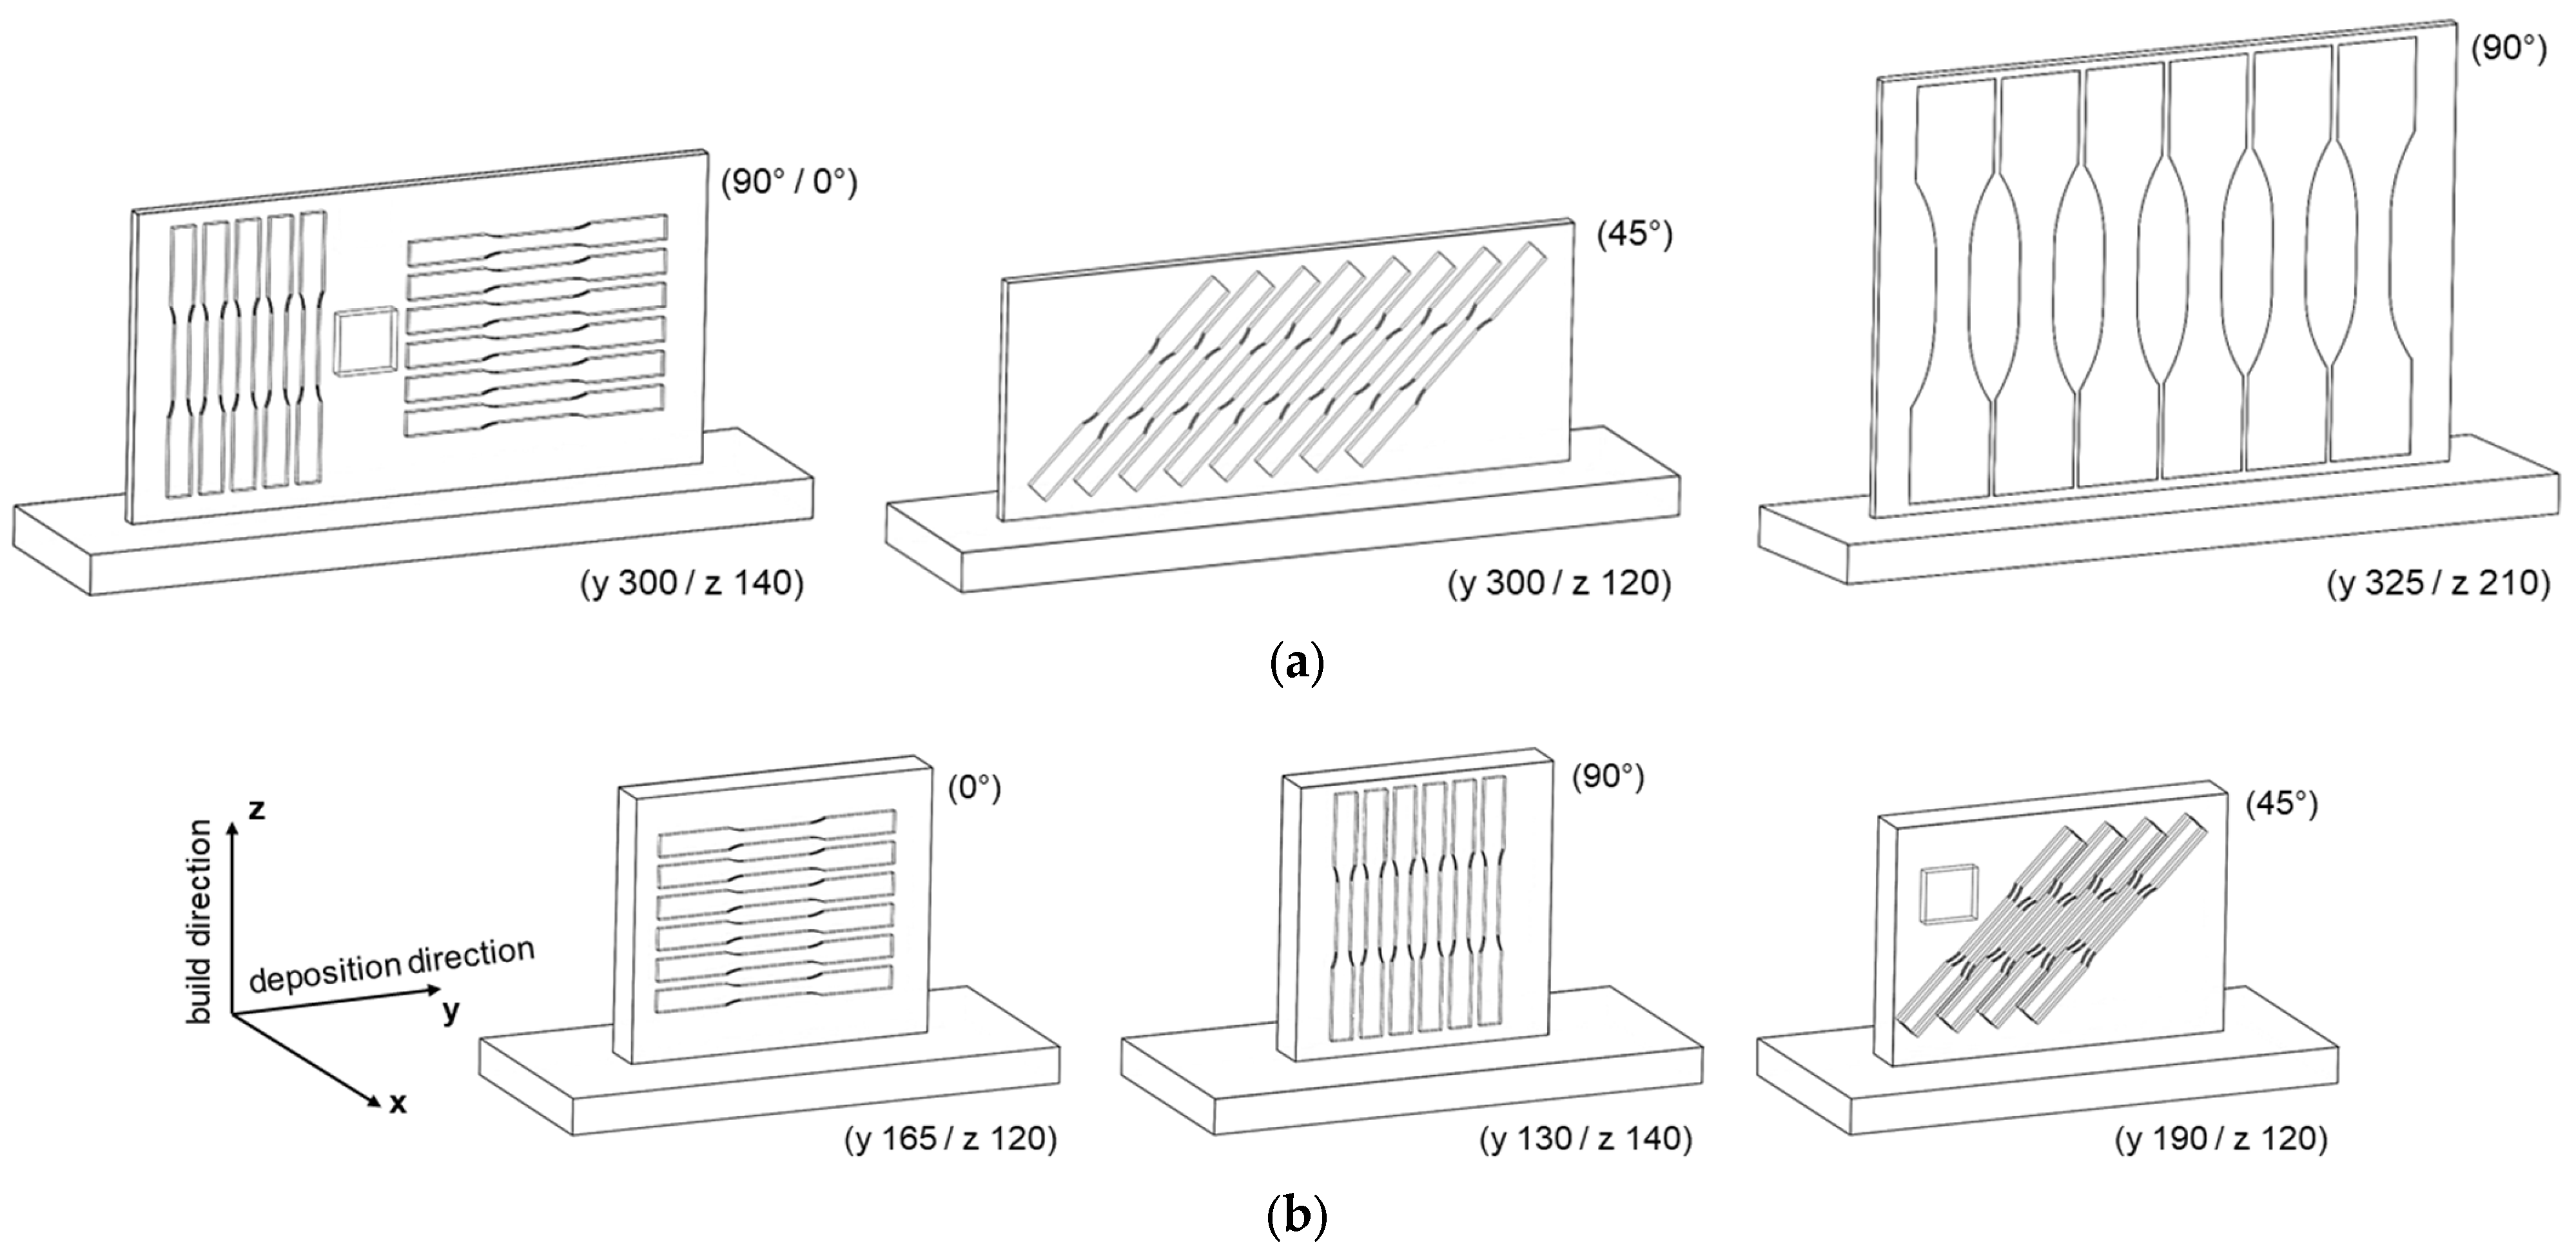
To investigate the influence of different deposition strategies and potential dependencies on the loading direction, plates were additively manufactured for the extraction of tensile specimens using both thin-walled (single-track deposition) and volumetric (zig-zag deposition) deposition strategies. Subsequently, tensile specimens were machined at orientations of 0°, 45°, and 90° relative to the deposition direction as depicted in Figure 1. In addition to tensile specimens, thin-walled plates were manufactured to extract fatigue specimens oriented at 90° to the deposition direction. The dimensions of the deposited plates varied depending on the specimen extraction positions as indicated in Figure 1. The resulting plate thickness depended on the process parameters applied for thin-walled deposition and was approx. t = 7.5 mm for ER5356 and t = 6.7 mm for ER4046. For volumetric deposition, both alloys were manufactured with a nominal plate thickness of t = 25 mm.
DED-Arc processing was performed using a setup consisting of a six-axis robotic system (KUKA KR-22, Augsburg, Germany) with a tilt-turn table (KUKA DKP400, Augsburg, Germany) and a welding power source (Fronius TPS500i, Fronius International GmbH, Pettenbach, Austria). For slicing and tool path generation DCAM CAD/CAM software by SKM Informatik was used. The applied processing parameters are summarized in Table 2, with a combination of waveform controlled short arc and pulsed arc (CMT+Pulse) characteristics being used. During the deposition sequence of each layer, Argon (Ar > 99.996%) was used as shielding gas with a flow rate of 14 L/min. The interpass temperature was measured at the center of the respective top layer using infrared temperature measurement between each layer for both deposition strategies.
For the heat-treatable ER4046 alloy, different heat treatment cycles were applied after sample manufacturing according to the specifications given in Table 3. The temperatures and holding times were selected based on established practice for aluminum cast alloys [22]. Both solution annealing and artificial aging were performed in a muffle furnace L 24/11 by Nabertherm, Lilienthal, Germany. The temperatures and heating rates in the specimen center were determined using a calibration sample with a type-K thermocouple. Cooling after artificial aging was performed by free convection in ambient air. To avoid temperature related distortion of the specimen, the heat treatment was performed prior to final machining of the tensile or fatigue specimen.
For metallographic investigations, specimens were extracted as illustrated in Figure 1, and then ground, polished, and etched using Kroll’s reagent (6% HNO3, 2% HF) for ER5356 and 2% HF for ER4046.
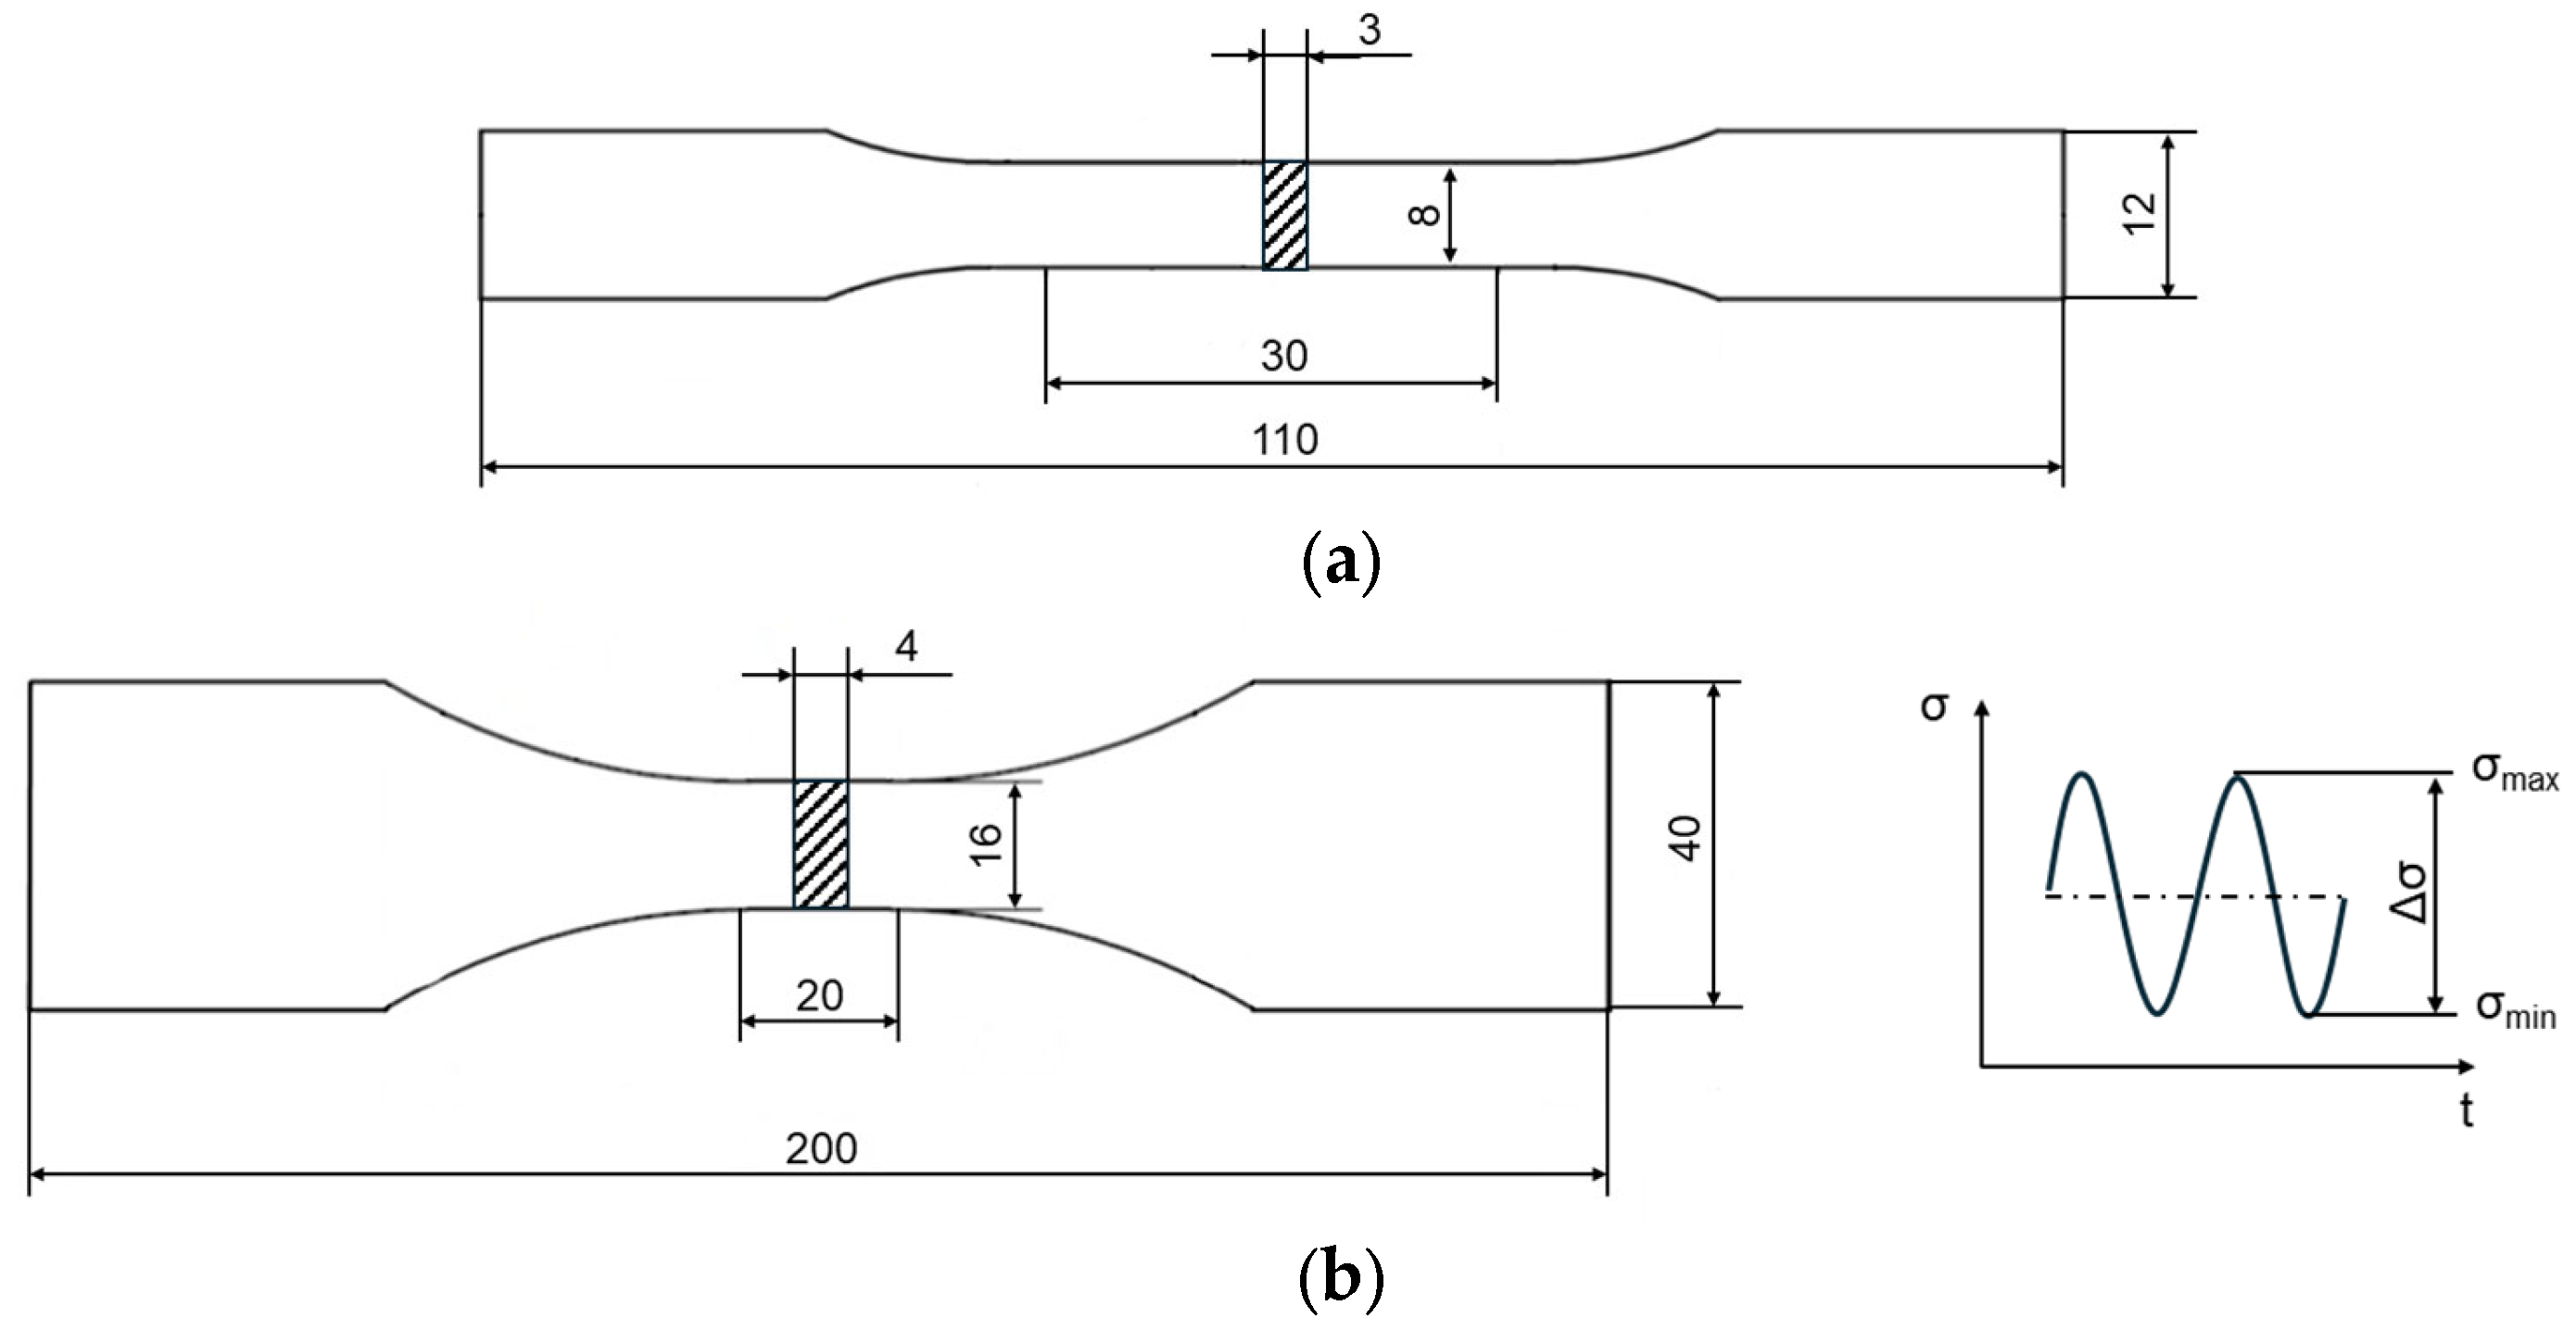
Tensile tests were performed according to DIN EN ISO 6892-1 [23] using an Instron 5567 (Norwood, MA, USA) universal testing machine at a displacement rate of 1.0 mm/min. An extensometer was used to determine the elongation. A total of five samples were tested per test series using flat tensile test specimens (E 3×12×30 according to DIN 50125 [24]) as shown in Figure 2a. Since neither material exhibits a pronounced yield point (Lüders phenomenon), the 0.2% offset yield strength (fy) was determined in addition to the ultimate tensile strength (fu) and elongation at break (ε).
High-cycle fatigue (HCF) tests were conducted under axial constant-amplitude loading at a stress ratio of R = σmaxmin = 0.1 on a servo-hydraulic testing machine (Zwick Amsler HC 25, ZwickRoell, Ulm, Germany) at a loading frequency of 20 Hz. The applied stress ranges (Δσ) were selected within a range of Δσ = 87–135 MPa for ER5356 and Δσ = 84–206 MPa for ER4046. The tests were performed under load control. Specimens (Figure 2b) were tested either until complete fracture or until reaching the run-out limit of 5·106 cycles. The evaluation of S-N curves was performed according to the nominal stress concept in accordance with DIN 50100 using the pearl string evaluation method [25].

3. Results and Discussion

3.1. Metallographic Characterization and Heat-Treatment Response

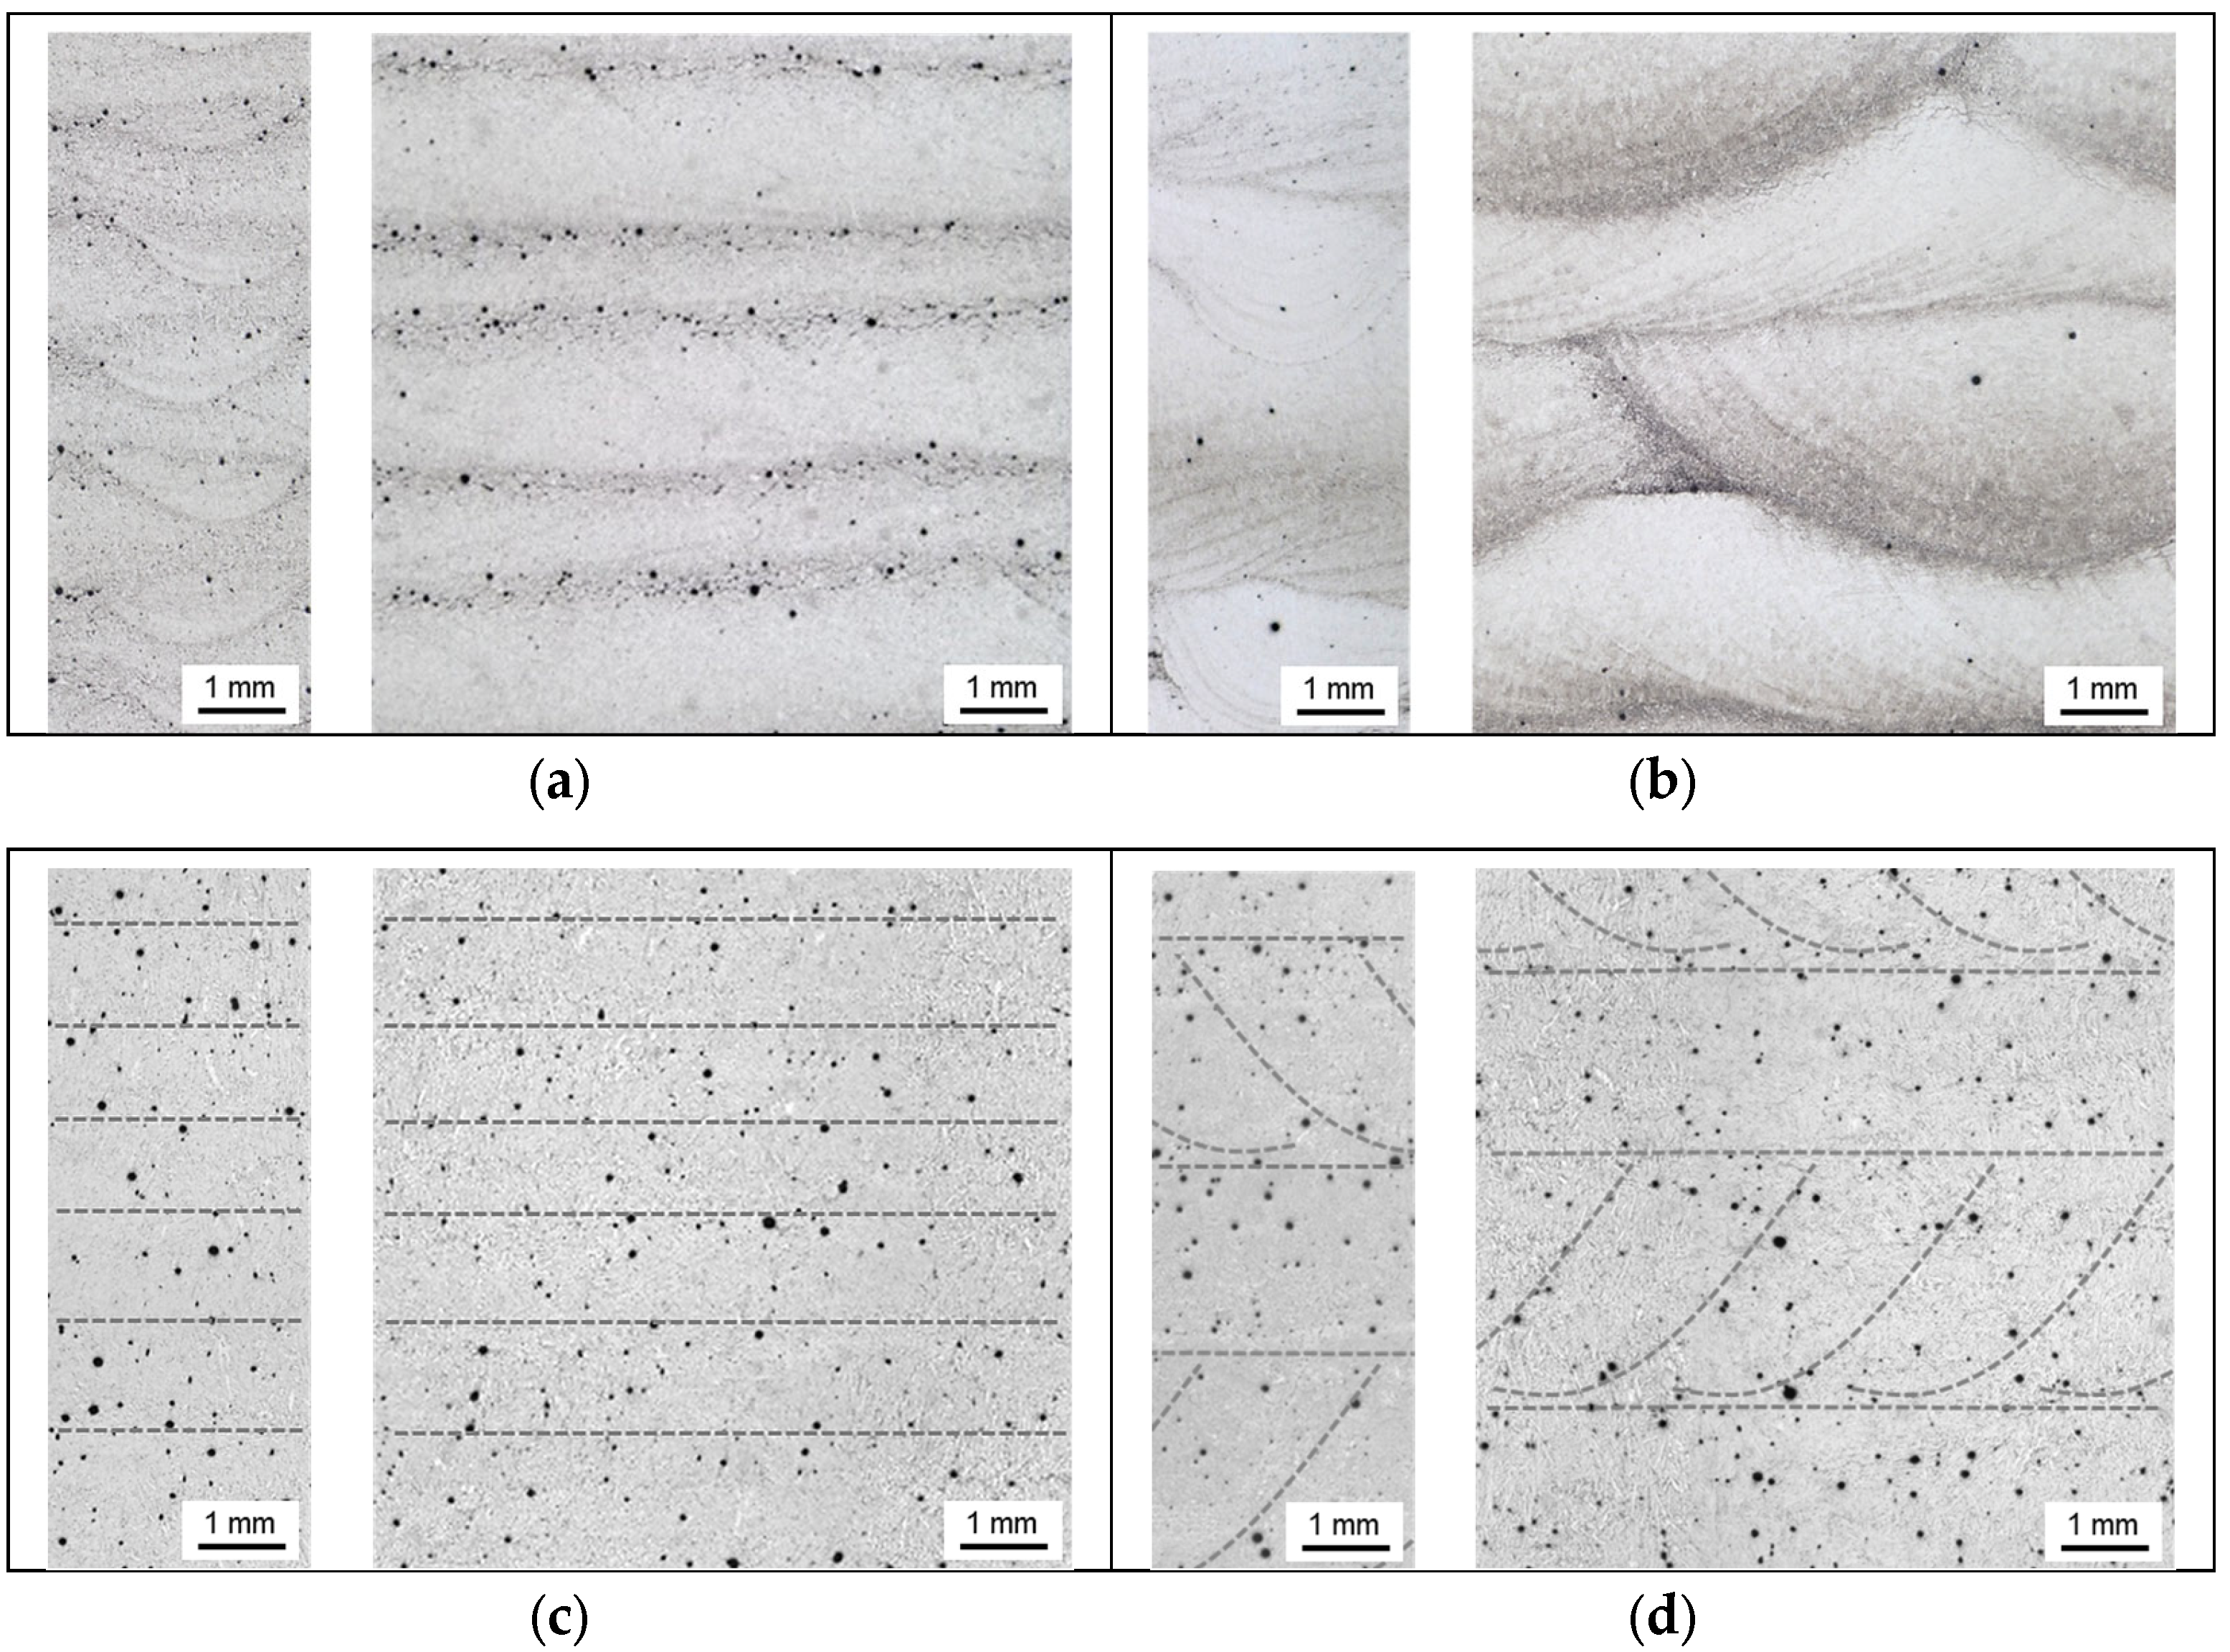
The cross- and longitudinal sections shown in Figure 3 illustrate representative regions of the macroscopic layer structure within the gauge section of the tensile specimens, depending on the investigated materials and deposition strategies. In Figure 3a–d, the left subfigures correspond to the specimen thickness (cross-sectional view), whereas the right subfigures represent the specimen width (longitudinal section). For ER5356, the individual layer and track boundaries can be clearly distinguished in the micrographs. In contrast, for ER4046, no distinct layer structure is observable due to the post-deposition T6 heat treatment. Therefore, the approximate layer structure has been indicated for clarity.
Based on the macrosections, the thin-walled deposition of ER5356 exhibits, as expected, increased porosity in the layer transition zone (Figure 3a). The cross-section shows that porosity is predominantly located in the lateral regions of the deposited layers, whereas the longitudinal section reveals an accumulation of pores within the layer transition zone along the deposition direction. An exemplary pore analysis based on the cross-section of the thin-walled deposition strategy was performed using ImageJ 1.54r. Applying a minimum detected pore size corresponding to an equivalent diameter of 18 µm (3 × 3 px.) and a minimum circularity of 0.1 resulted in a porosity area fraction of 0.54%, with equivalent pore diameters ranging from 18 to 87 µm. Qualitatively, a higher porosity level is observed compared to previously published studies using the same material and comparable processing parameters, potentially due to differences in wire batch or stochastic environmental effects. In this context, Ryan et al. reported significant variations in porosity in DED-Arc deposits when comparing different wire batches [26]. In contrast, volumetric deposition exhibits both increased layer height resulting from overlapping adjacent tracks and a lower level of macroporosity (Figure 3b). This may result from remelting lateral bead regions by adjacent tracks, promoting pore degassing. Statistical effects related to sectioning position and pore distribution may further contribute to the observed differences.
For ER4046 in the T6 condition, the macrographs show a statistically distributed porosity independent of deposition strategy and sectioning direction (Figure 3c,d). Due to the narrow solidification range of near-eutectic Al–Si alloys and the associated limited degassing capability, these alloys exhibit a higher susceptibility to residual porosity. Consequently, a qualitatively higher porosity level is observed compared to ER5356, which is supported by the pore analysis of the thin-walled deposition cross-section revealing a porosity area fraction of 2.47% and equivalent pore diameters ranging from 18 to 160 µm.
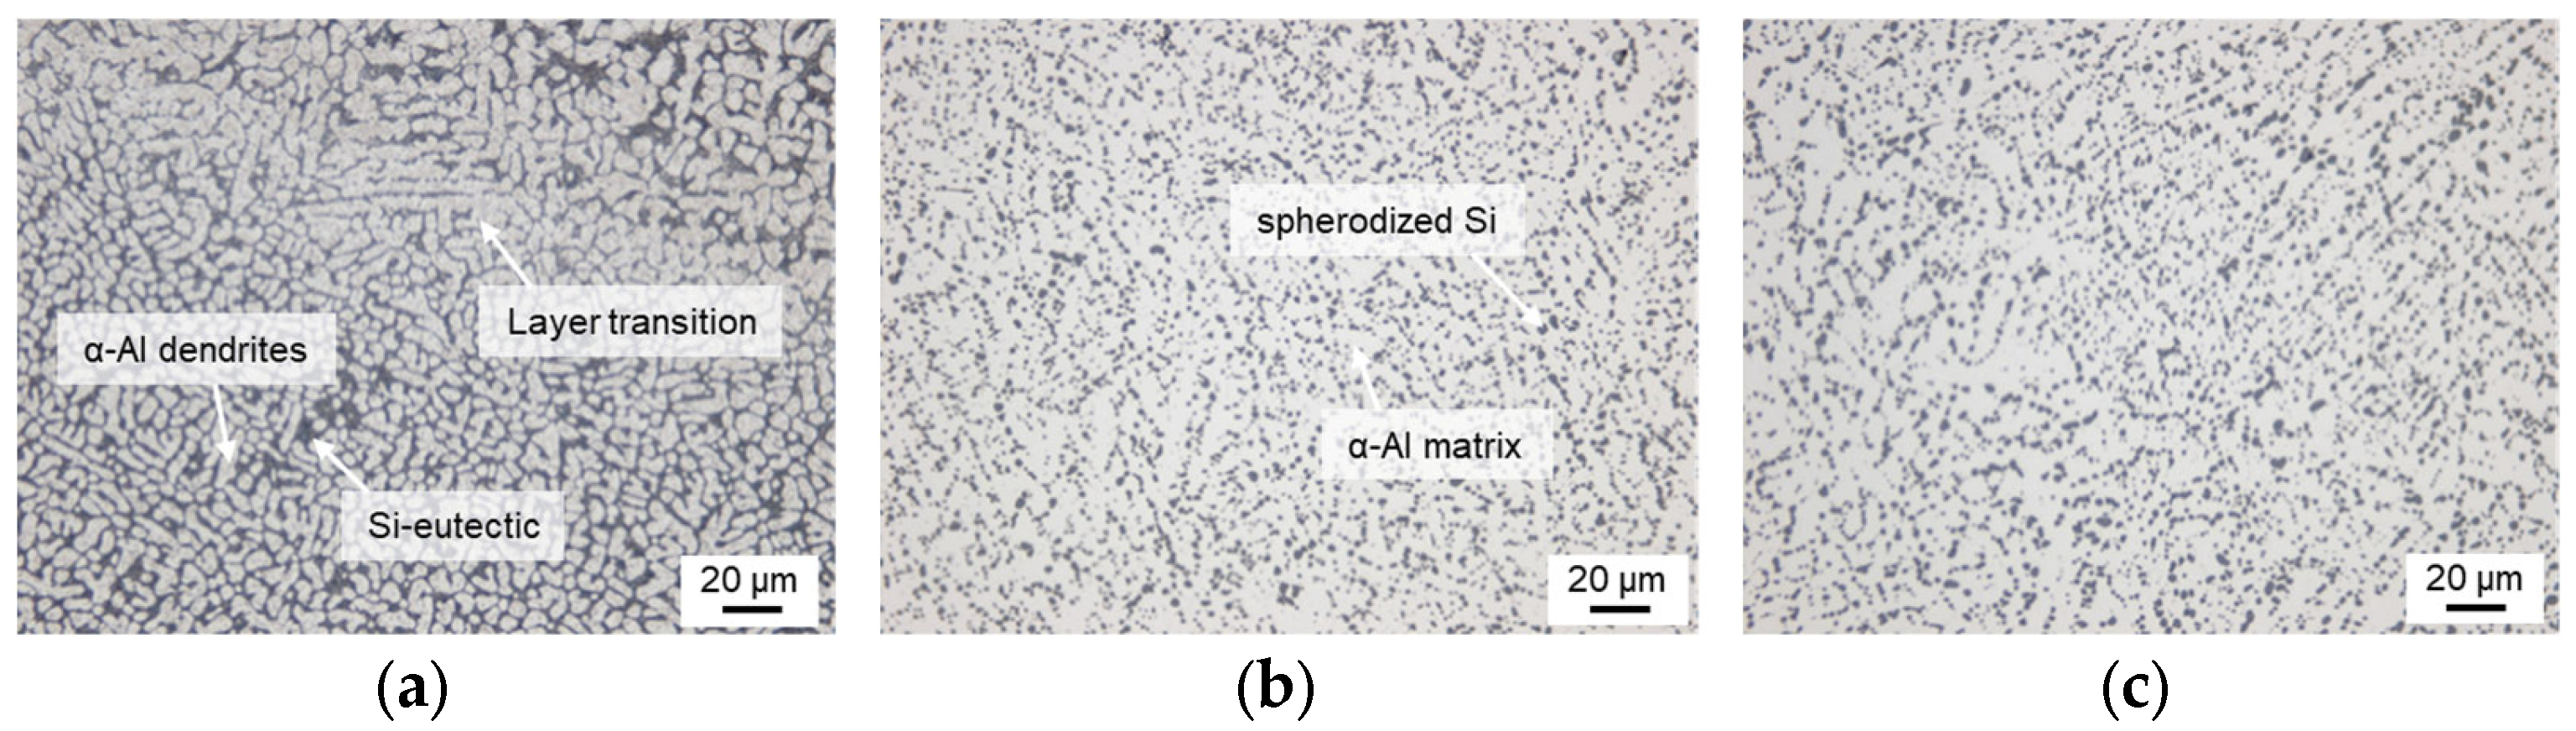
In addition to the macrosections in the T6 condition, Figure 4 presents microstructural images of ER4046 for different heat treatment conditions, exemplified by the volumetric zig-zag deposition strategy. The as-built condition shows a fine dendritic structure of α-Al and Si-eutectic (Figure 4a). In contrast, for the thin-walled deposition strategy, a directional dendritic growth along the build direction was observed due to the quasi-two-dimensional heat flow. The layer structure is clearly visible as bright bands below the fusion boundary of subsequent layers with partially dissolved Si-eutectic and incipient formation of spheroidized Si particles in the alpha aluminum dendrites, corresponding to the heat-affected zones. In addition, a coarser dendritic structure was observed in the layer transition region.
After solution annealing and quenching (T4), the Si eutectic and the visible layer boundaries dissolve, resulting in a microstructure consisting of α-Al and finely dispersed spheroidized Si particles (Figure 4b). A higher Si particle density is observed in regions corresponding to the former interdendritic Si eutectic of the as-built condition. Based on the optical micrographs, the T6 condition shows a similar appearance to T4 with comparable particle sizes (Figure 4c). However, the expected formation of nano-scale precipitates during artificial aging was not investigated in this study, since their characterization requires higher-resolution techniques beyond optical or scanning electron microscopy.
The effect of a post-process heat treatment on the ER4046 alloy was further examined using the example of specimens produced by thin-walled and volumetric deposition extracted in 0° relative to the deposition direction in the as-built condition, after solution annealing (T4), and after solution annealing followed by artificial aging (T6), according to the parameters listed in Table 3.
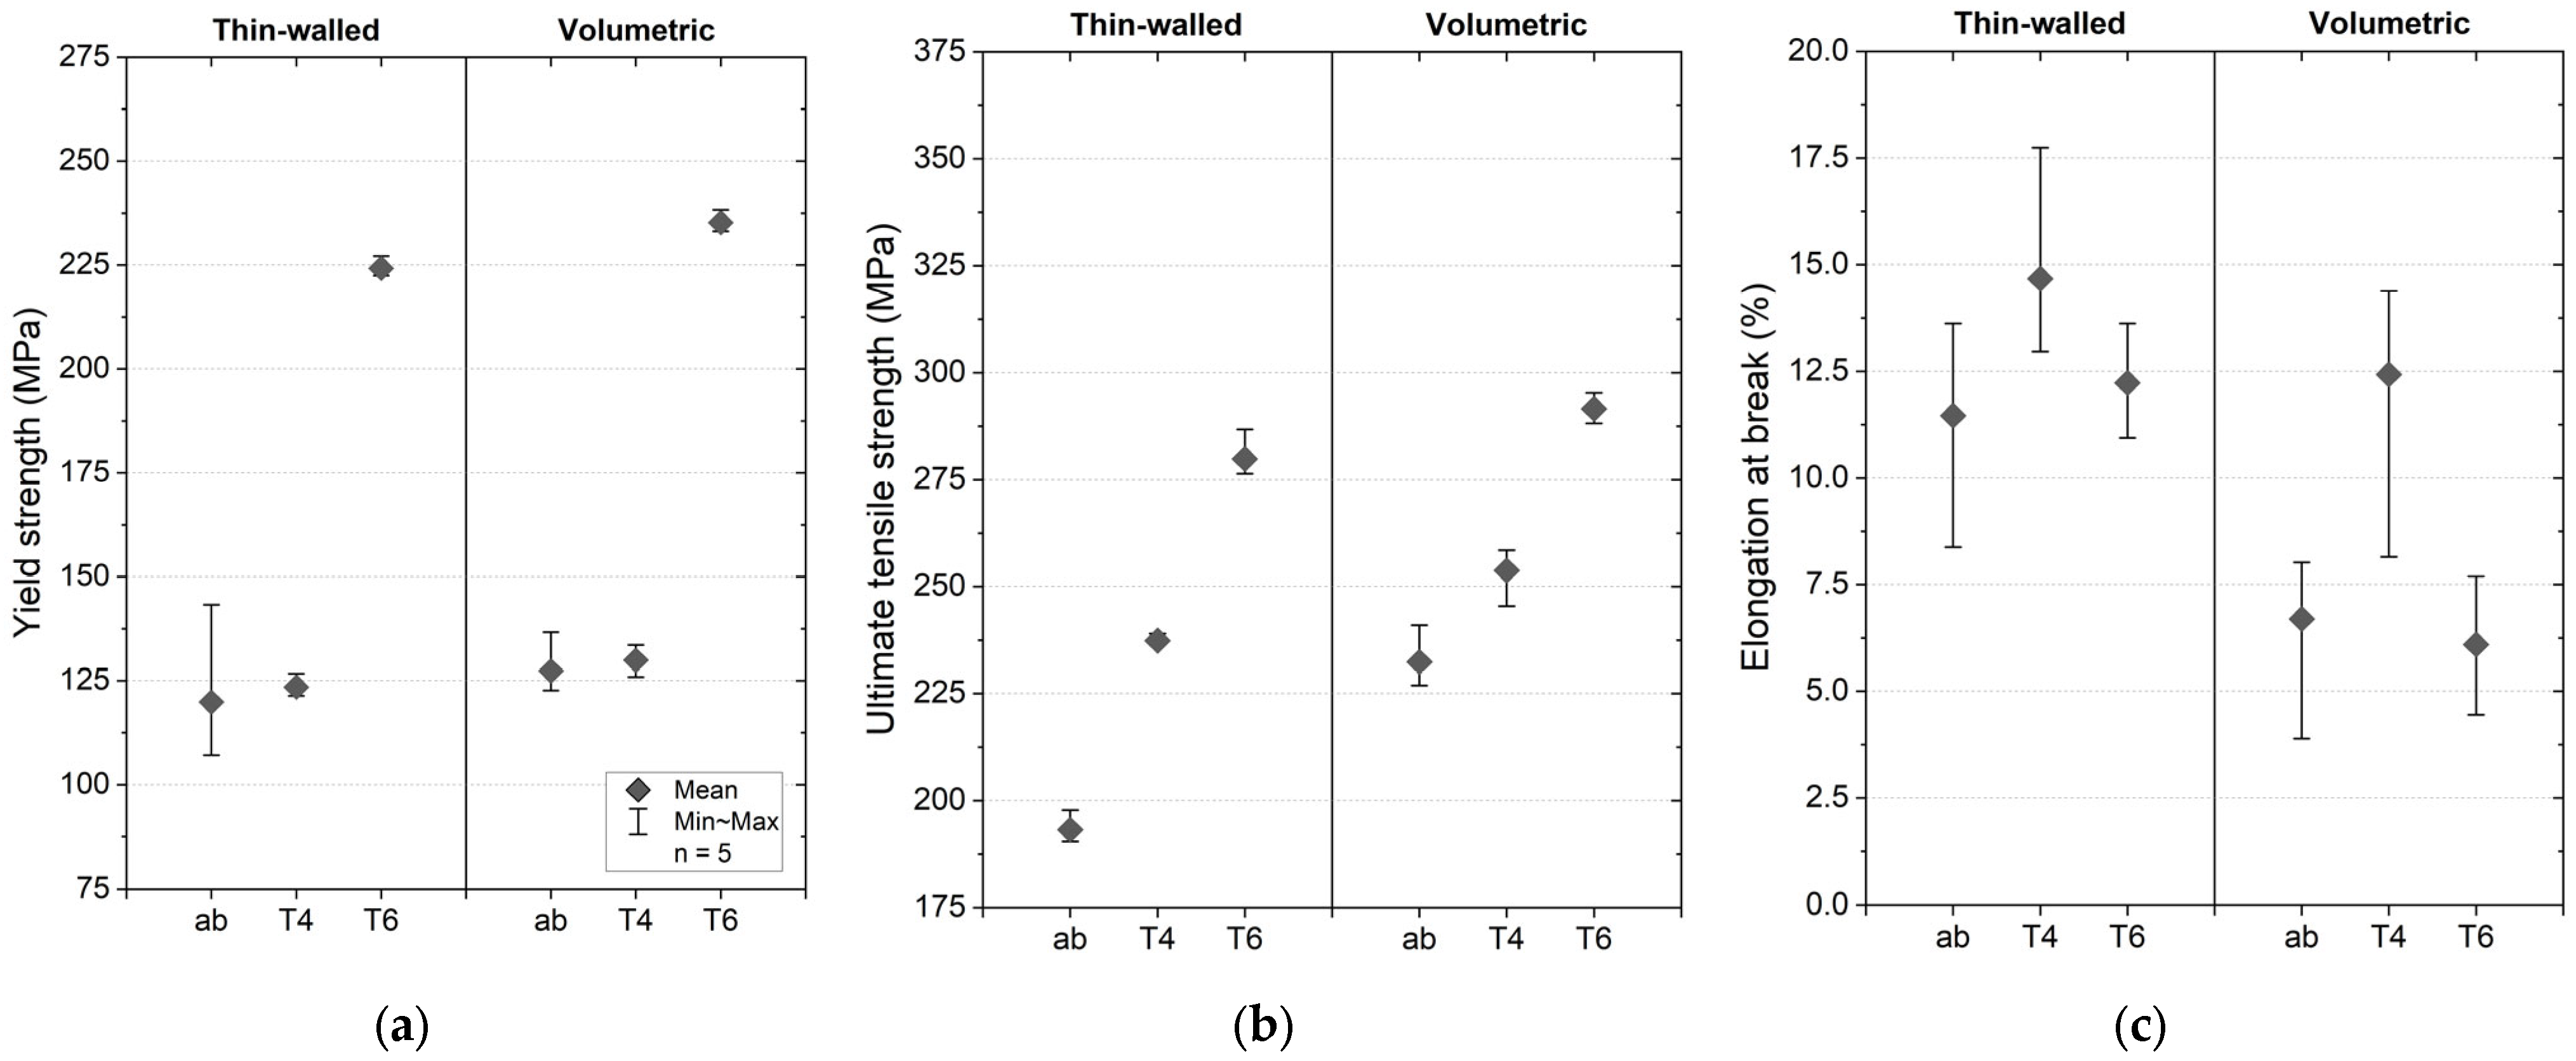
Figure 5 shows the tensile properties for the heat treatment conditions investigated. The corresponding numerical values, including mean values and standard deviations, are additionally provided in Appendix A, Table A1. From the results it is evident that the as-built condition exhibits the lowest tensile strength ( f y ¯ = 120 127   M P a ,   f u ¯ = 193 232   M P a ) for both deposition strategies. After solution annealing (T4), an increase in ultimate tensile strength and elongation at break is observed, while the yield strength remains at a comparable level to the as-built condition. Solution annealing followed by artificial aging (T6) results in a significant increase in yield strength of approximately 100 MPa, accompanied by a further increase in ultimate tensile strength of approximately 50 MPa. The elongation at break in T6 condition decreases to ε ¯ = 6.1 12.2 % compared to the T4 condition with ε ¯ = 12.4 14.7 % but remains at a level comparable to the as-built condition.
Overall, the tensile properties of the DED-Arc material exceed the reference values for AlSi10Mg processed by casting reported in VDI 3405-2.1 [27], both in the as-cast condition (fy > 90 MPa, fu > 180 MPa, ε > 2.5%) and in the T6 condition (fy > 220 MPa, fu > 260 MPa, ε > 1.0%). The results indicate that DED-Arc processed material exhibits a heat treatment response comparable to conventionally cast material. The slightly higher tensile properties observed in both the as-built and T6 conditions are likely attributed to the finer microstructure resulting from higher cooling rates compared to cast materials as reported in [15,16].

3.2. Tensile Properties

3.2.1. ER5356–AlMg5

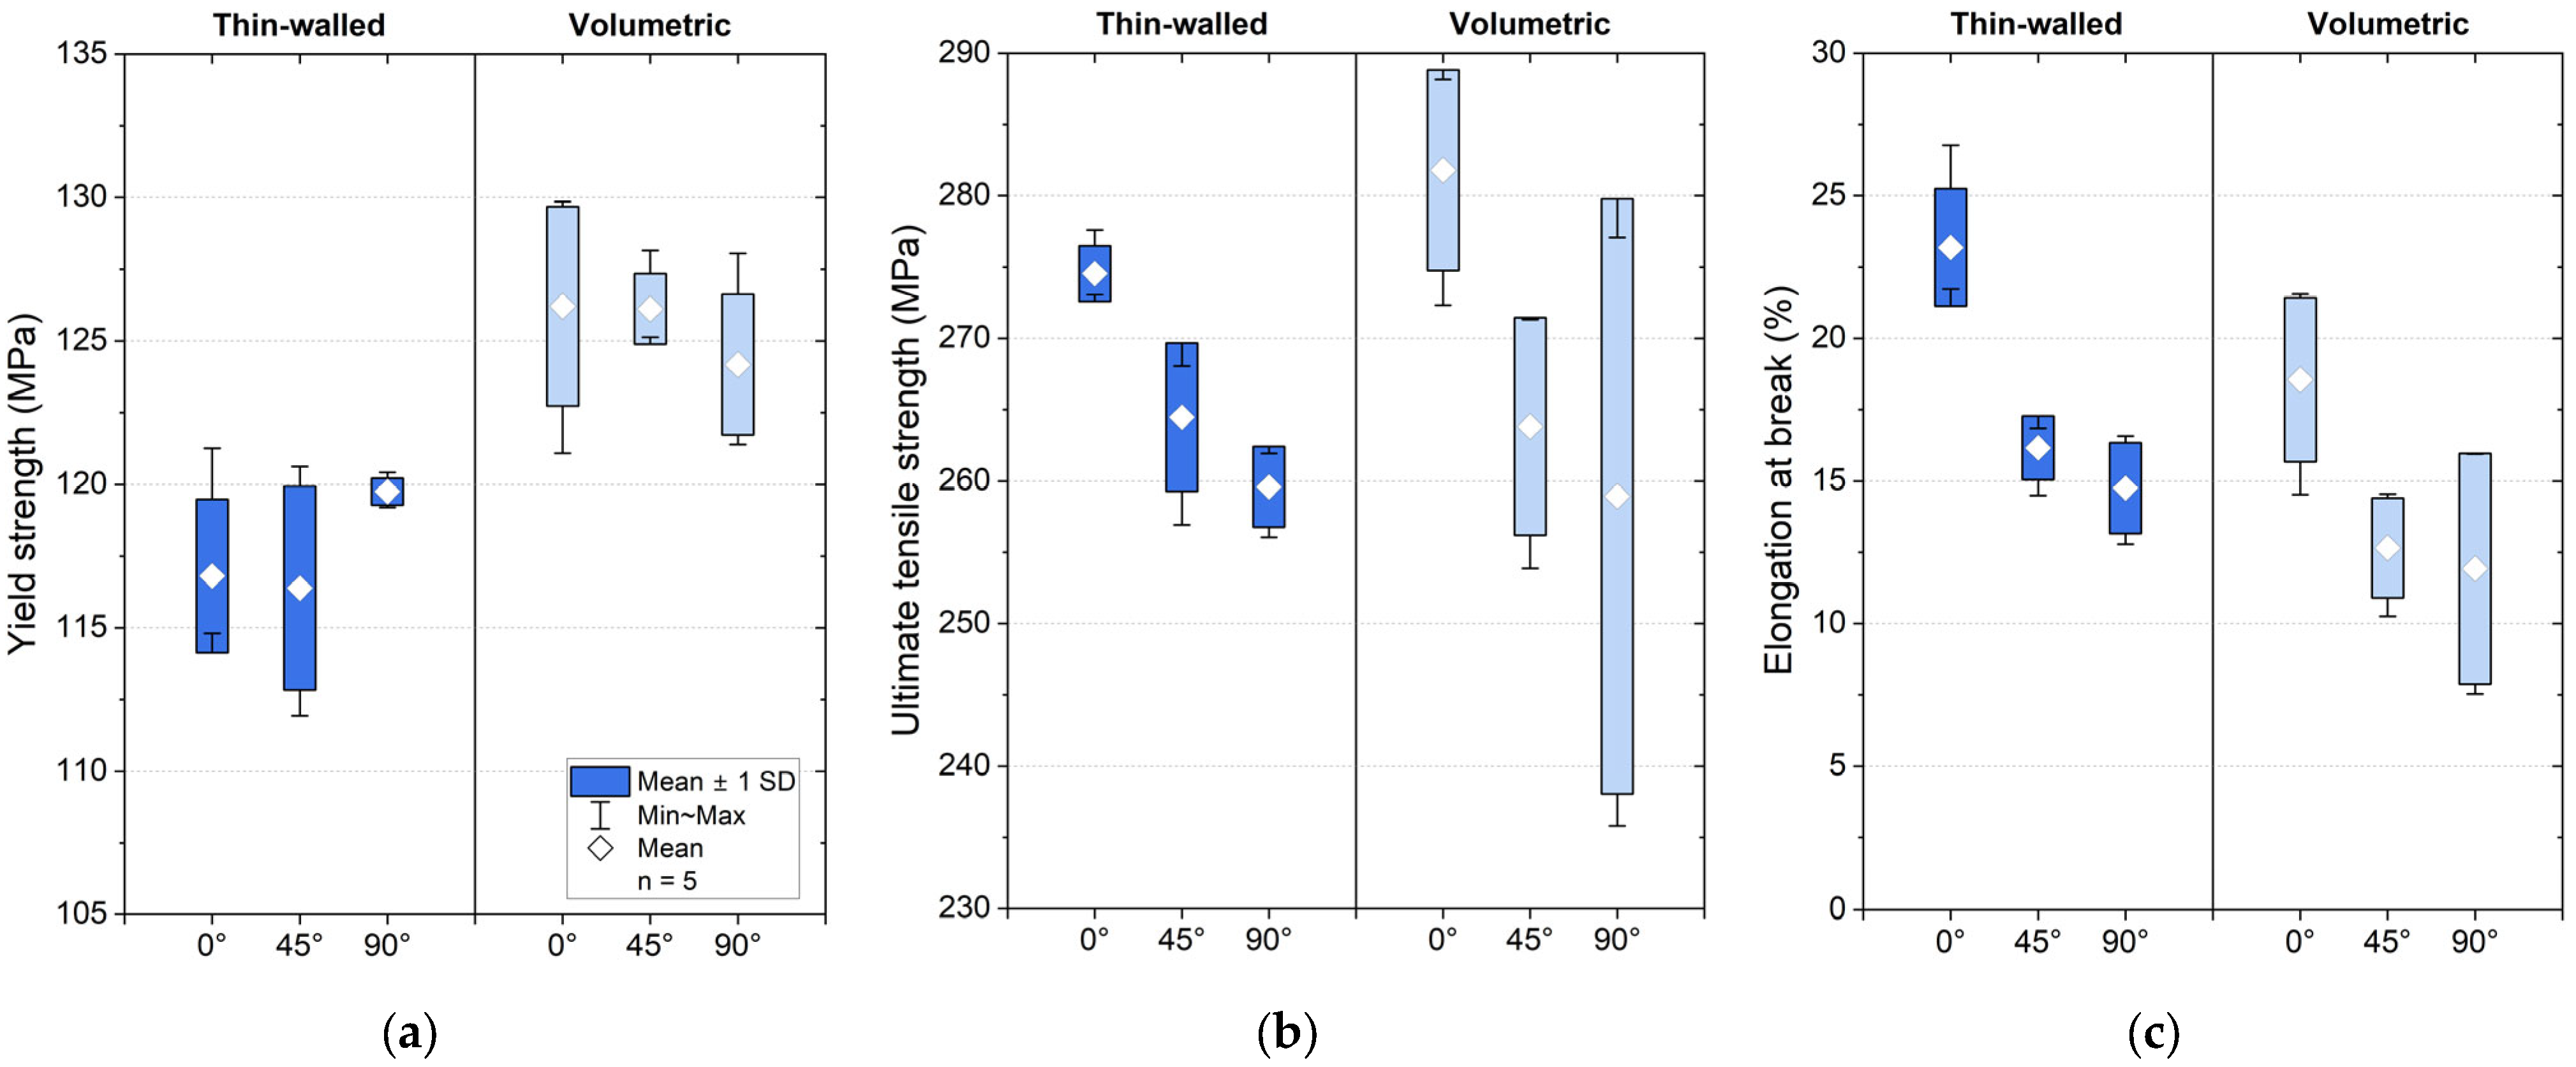
The tensile test results for DED-Arc manufactured ER5356 under variation in deposition strategy and loading direction are summarized in Figure 6 and Appendix A, Table A2. The results are presented in terms of yield strength, ultimate tensile strength, and elongation at break separately.
Regarding yield strength, no notable influence of build direction was observed within the range of standard deviation. However, specimens produced by volumetric deposition exhibit, on average, 4–10 MPa higher yield strength compared to thin-walled deposition. This is likely attributable, via the Hall–Petch relationship, to a finer grain structure in volumetric deposition, resulting from faster cooling due to three-dimensional heat conduction into the surrounding material [28]. This hypothesis should be verified by further analysis of grain size distribution. In contrast, the results indicate a dependence of ultimate tensile strength and elongation at break on the testing direction relative to the layer structure, with higher values of f u ¯ = 275   M P a for thin-walled deposition and of f u ¯ = 282   M P a for volumetric deposition observed for specimens extracted at 0°. Reduced values are already observed at 45°, with a further decrease to f u ¯ = 260   M P a and f u ¯ = 259   M P a for thin-walled and volumetric deposition at 90°. This behavior can be presumably attributed to the unfavorable porosity distribution, with locally increased porosity in the layer transition zone. Based on the results, it is assumed that for specimens extracted at 45° and 90° relative to the deposition direction, these regions act as preferential failure sites once necking is reached, due to the local reduction in effective cross-sectional area.
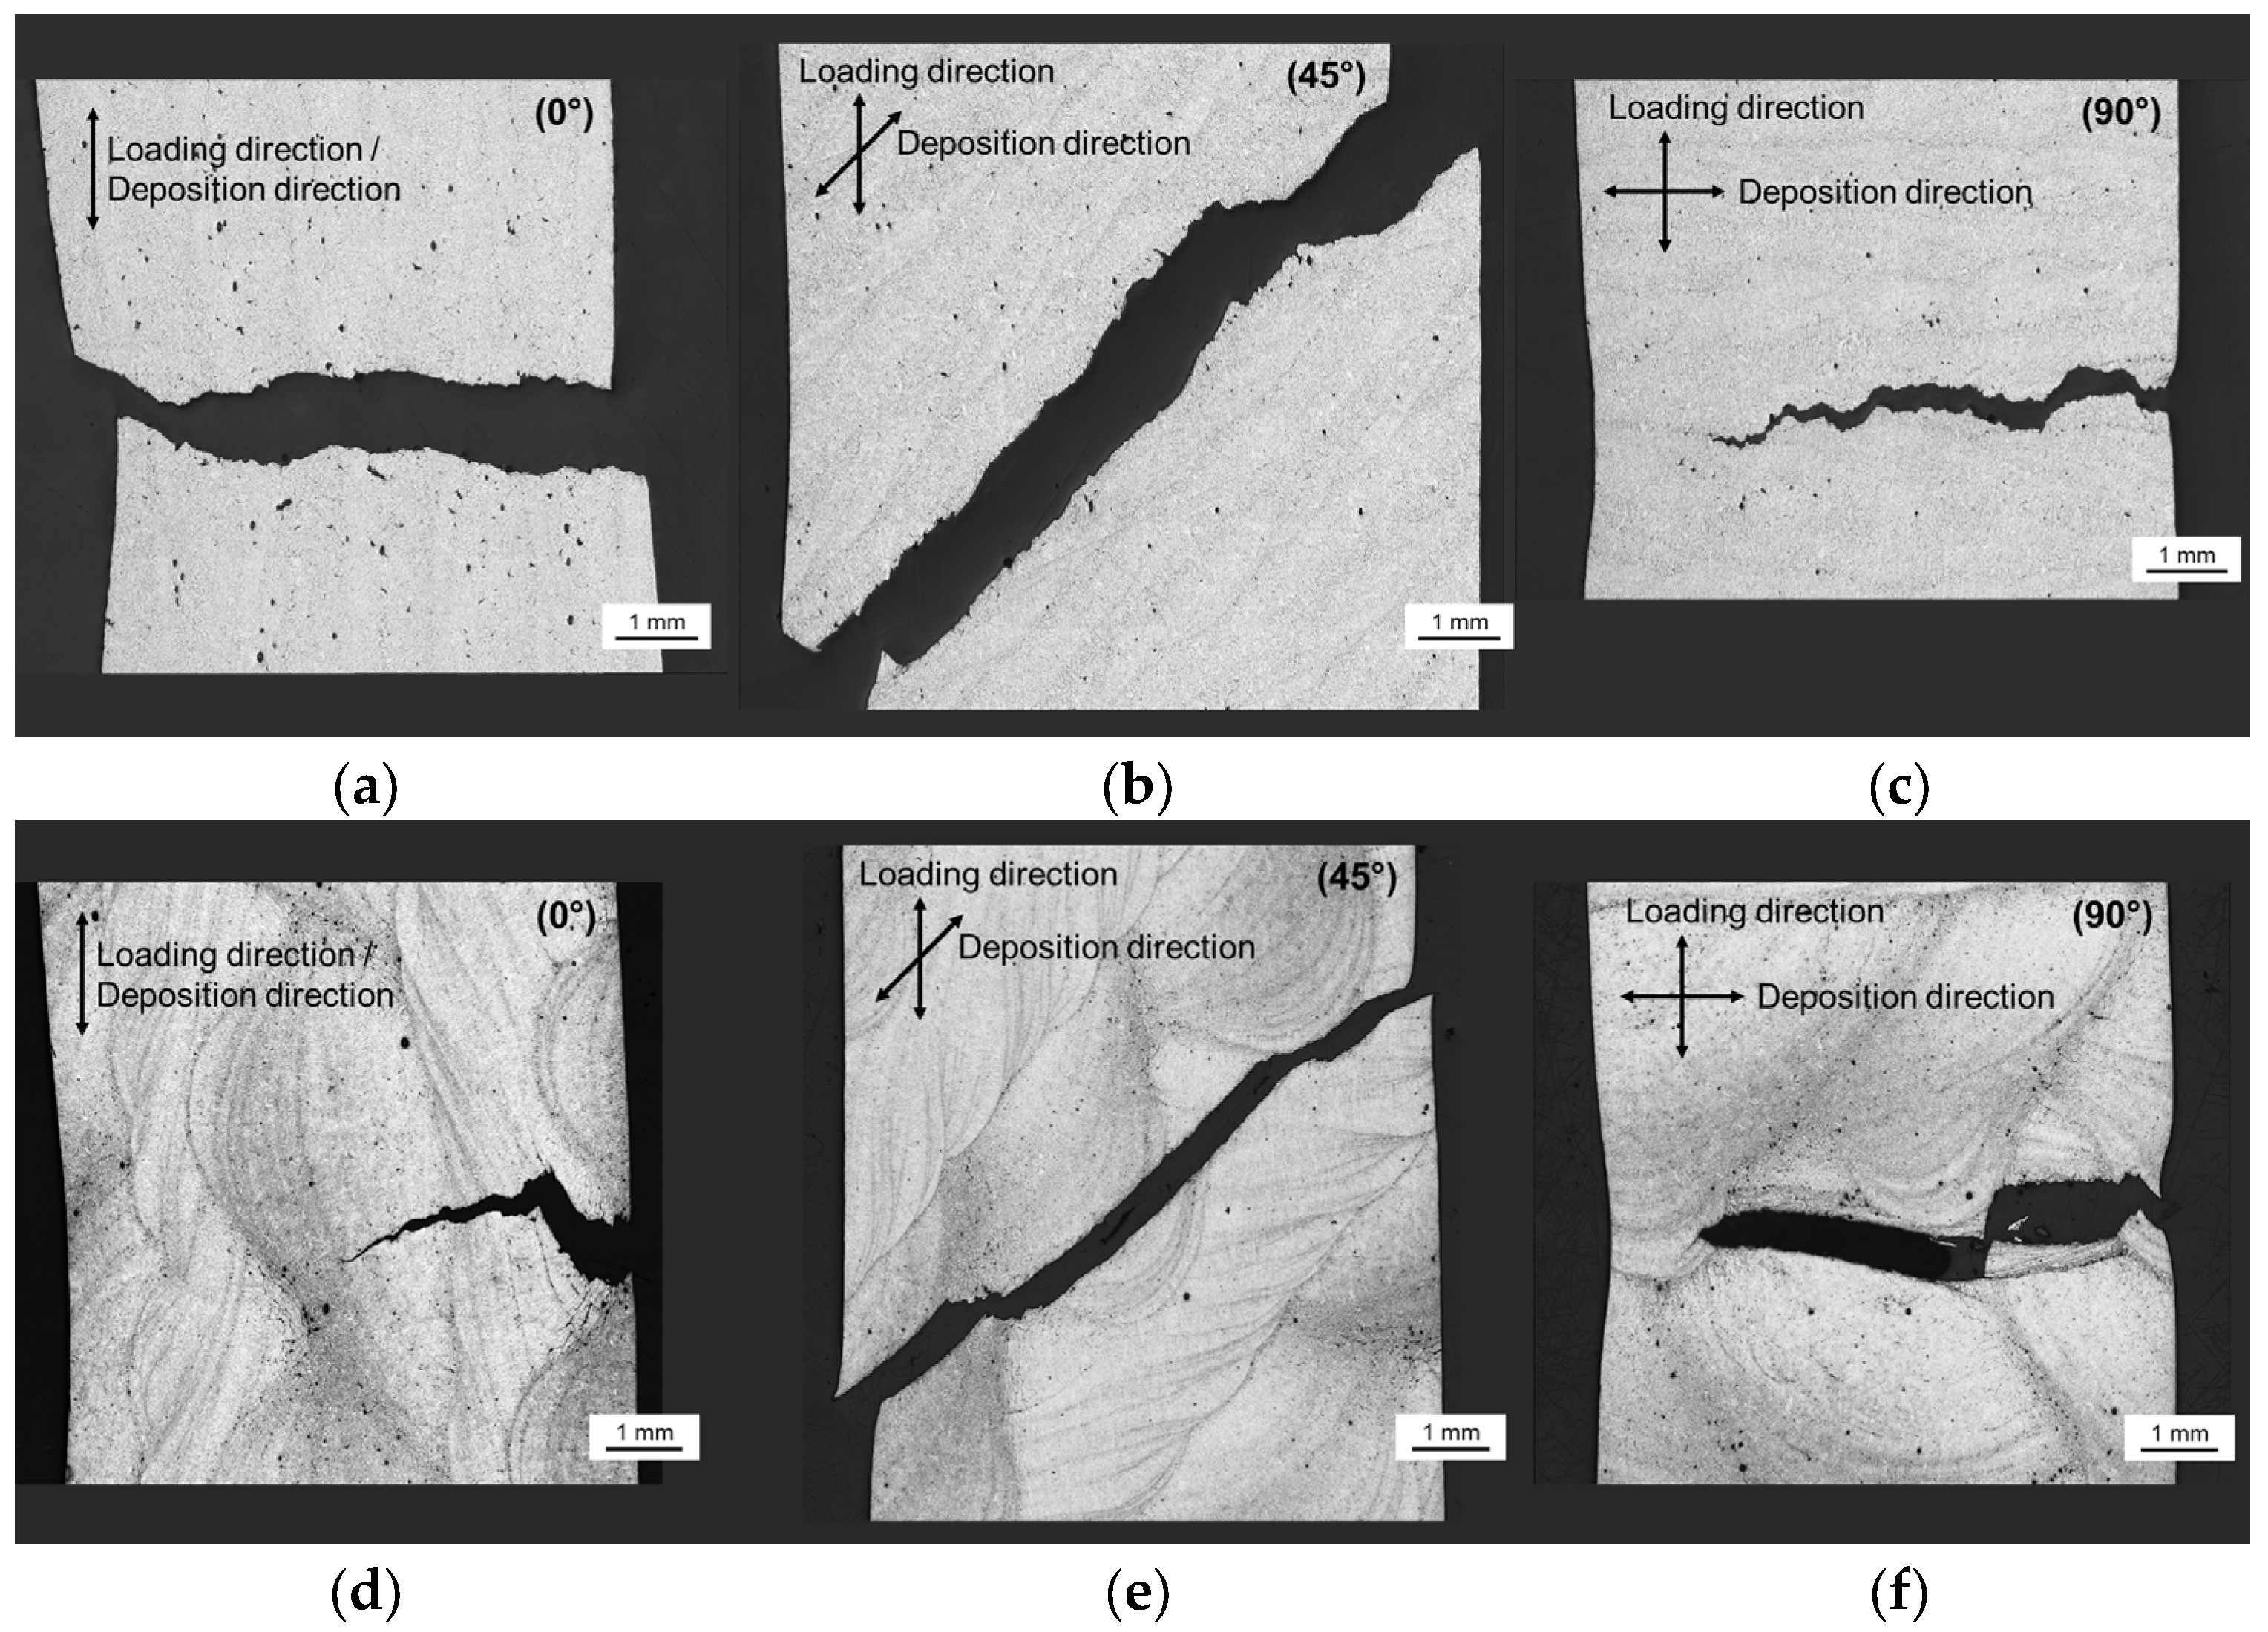
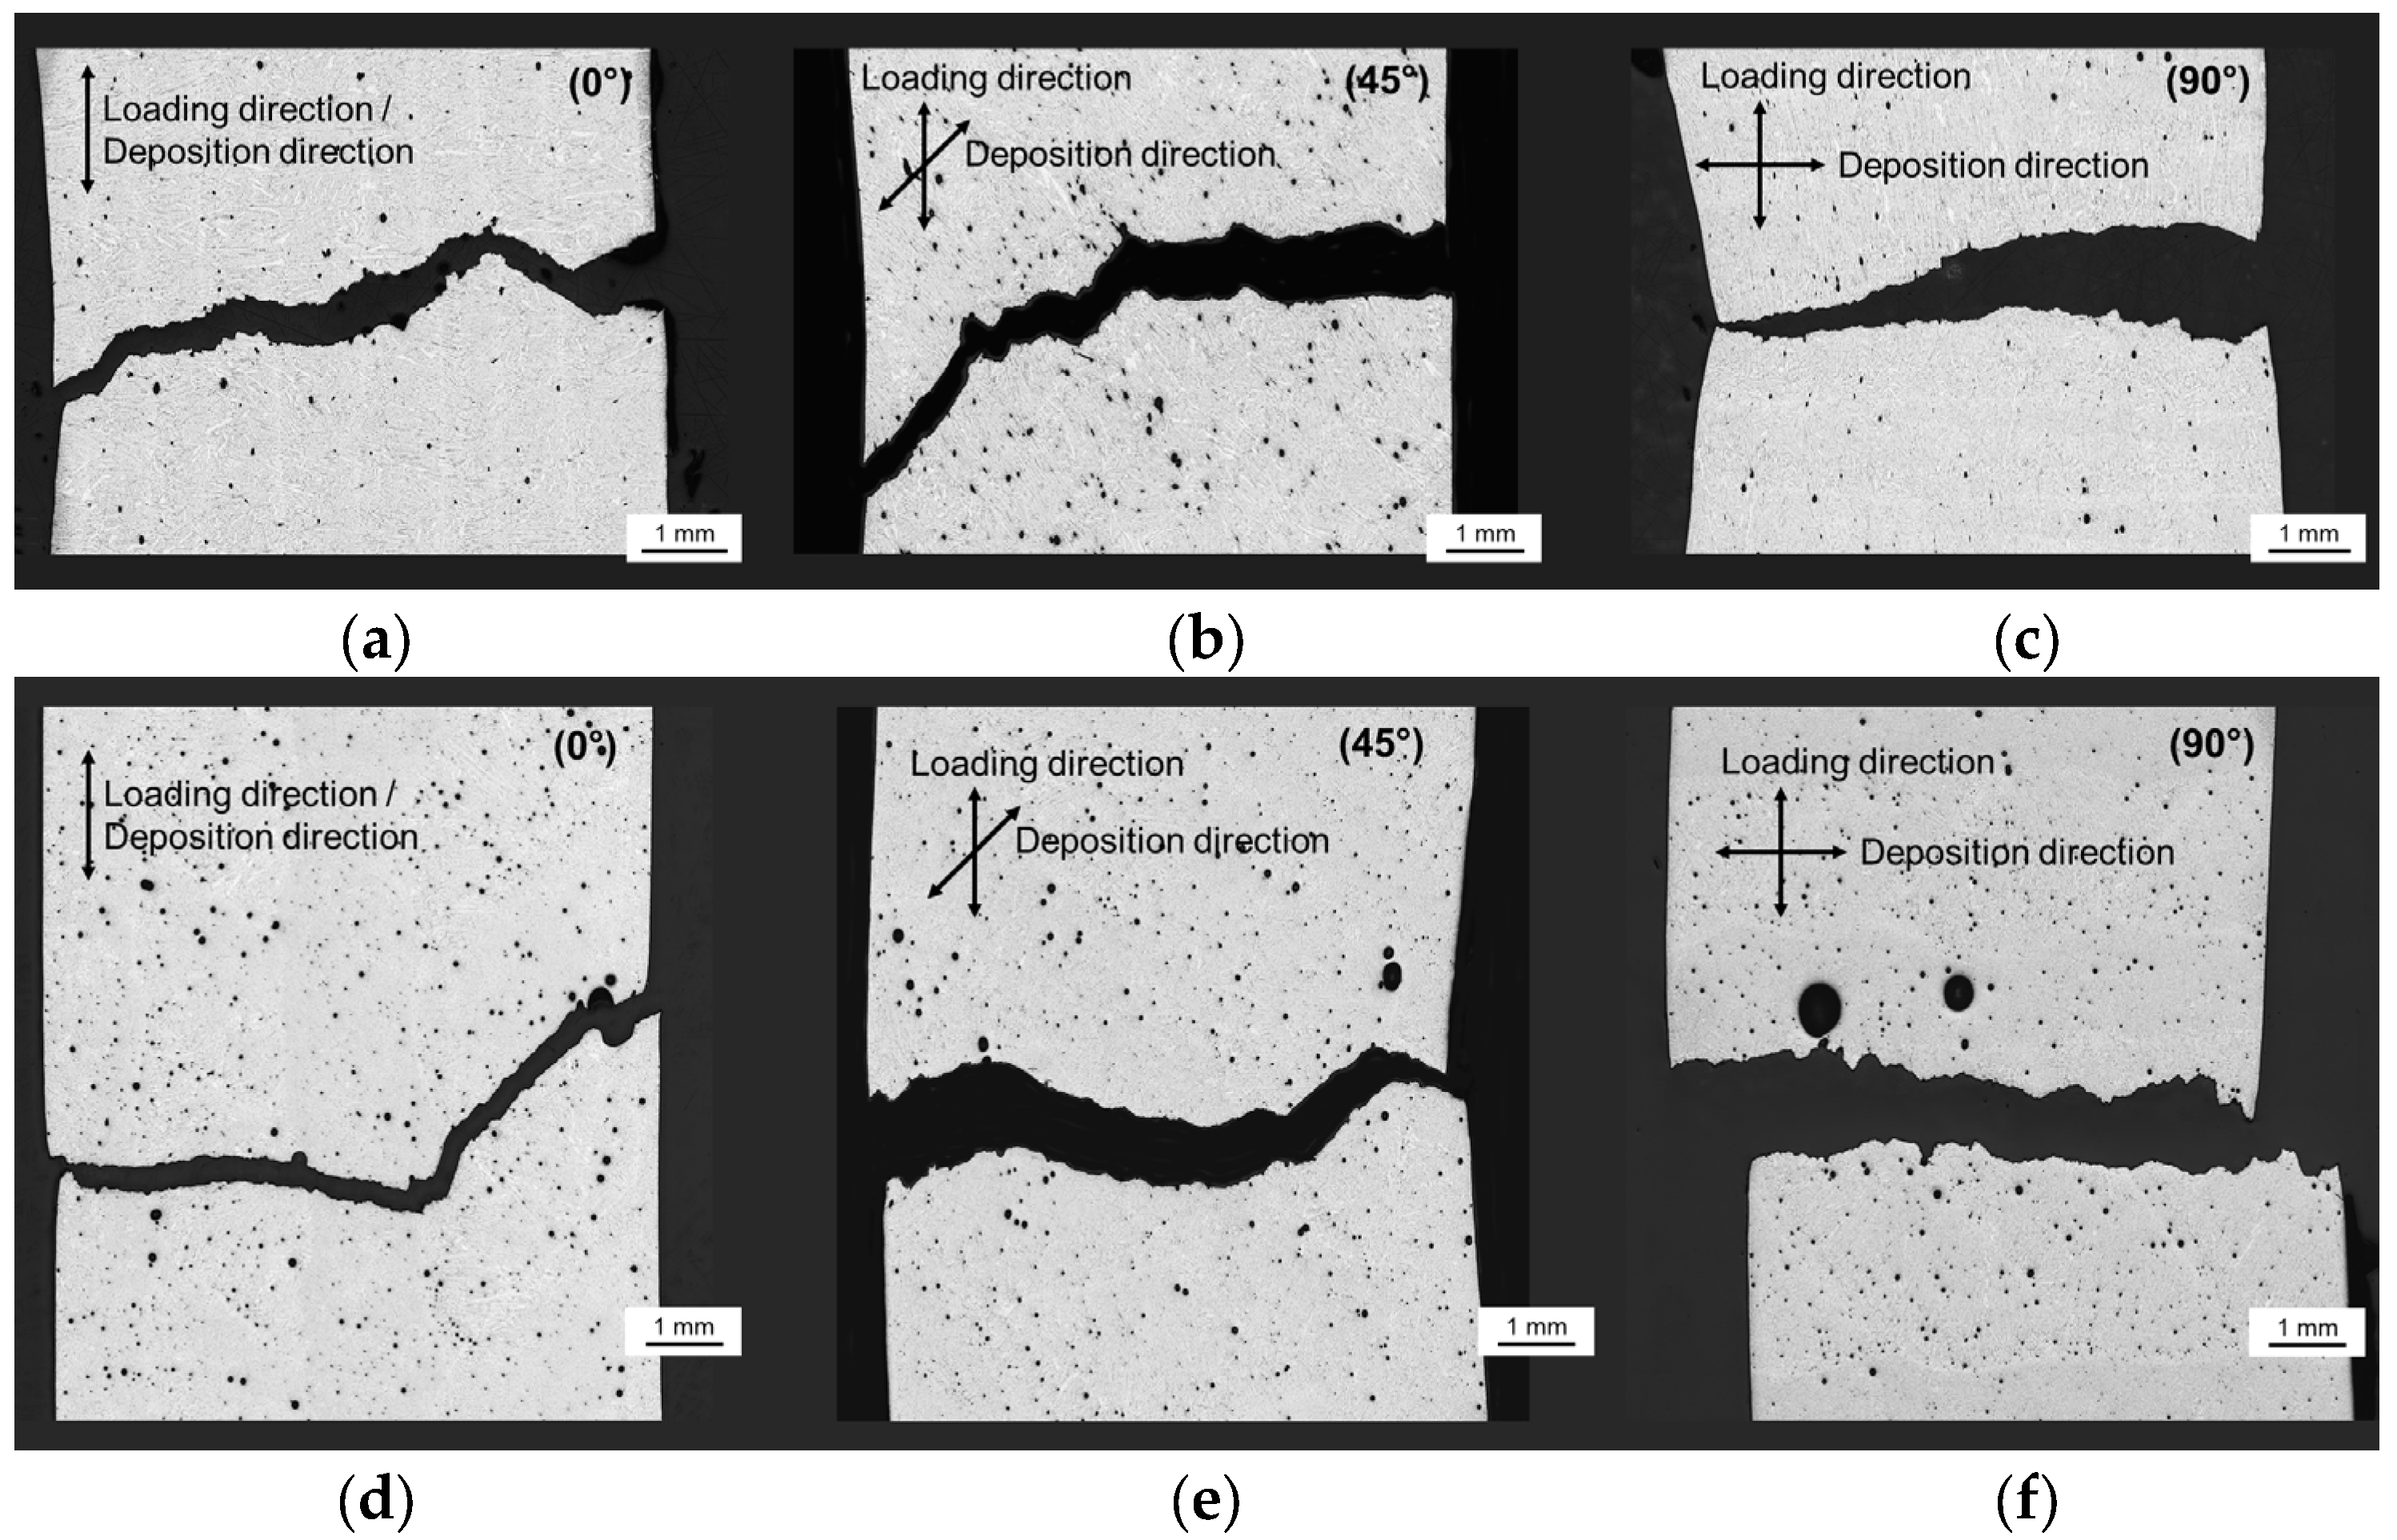
Despite the presence of porosity in the DED-Arc deposits, the mechanical property ranges specified for the feedstock material (fy > 110 MPa, fu > 250 MPa, ε > 25%) are largely achieved in terms of yield strength and ultimate tensile strength. In contrast, the elongation at break, particularly for loading directions of 45° and 90° relative to the deposition direction, falls below these reference values. This is attributed to potential failure sites associated with the layer transition zones. To further examine these relationships, Figure 7 presents micrographs of the crack propagation paths for selected specimens. Despite possible differences in sectioning planes, a preferential crack path along the layer transition zones is observed for specimens extracted in 45° and 90°, which is likely related to the locally increased porosity observed within these regions. For specimens extracted at 0°, the layer transition zones are oriented parallel to the loading direction and therefore exhibit a reduced detrimental effect on crack propagation, resulting in improved ductility and crack propagation perpendicular to the layer transition zones. Interestingly, for the volumetric deposition strategy (zig-zag), the more complex layer arrangement leads to crack deflection along the layer transition zones, resulting in a more complex crack path. These observations support the conclusion that layer transition zones represent critical regions under tensile loading in DED-Arc ER5356 deposits and, due to their directional arrangement, contribute to anisotropy, particularly in terms of elongation at break.

3.2.2. ER4046–AlSi10Mg (T6)

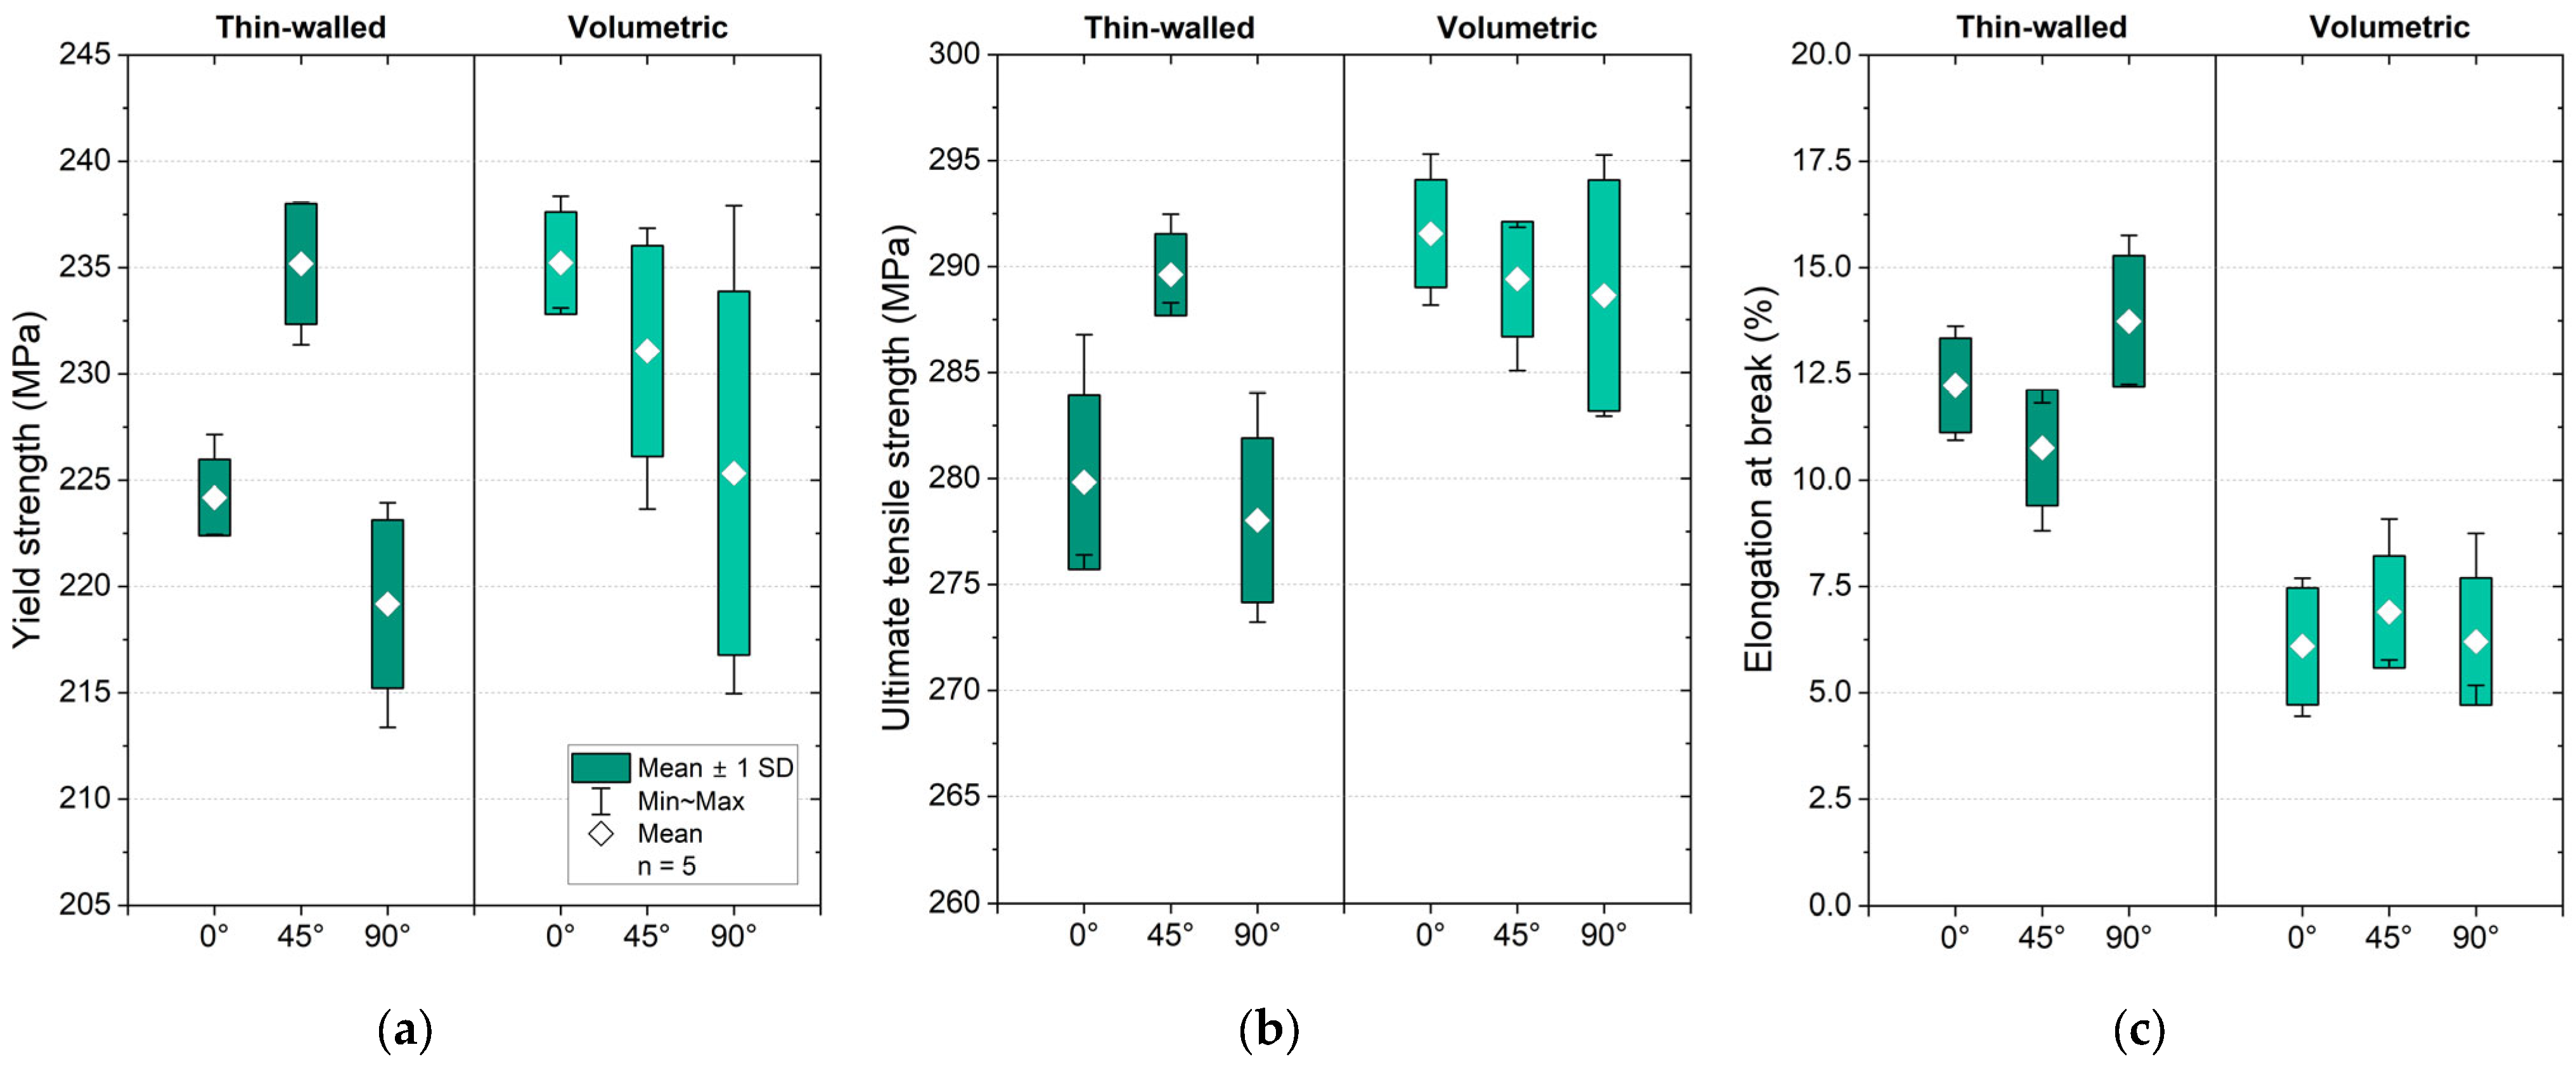
The tensile testing depending on the variation in deposition strategy and loading direction for ER4046 was conducted exclusively in the T6 condition, as this state represents the application-relevant condition. Figure 8 presents the tensile test results in terms of yield strength, ultimate tensile strength and elongation at break. Values for mean and standard deviation are given in Appendix A, Table A3.
The results for yield strength and ultimate tensile strength show only minor differences with respect to extraction direction within the range of standard deviation. The mean values across all test series ranged from f y ¯ = 219 235   M P a and f u ¯ = 259 282   M P a for yield strength and ultimate tensile strength, respectively. The largest variation in mean yield strength of Δ f y ¯ = 16   M P a is observed between specimens extracted at 45° and 90° for the thin-walled deposition strategy. In general, a slight decrease in mechanical properties with increasing angle between extraction and deposition direction can be identified. This behavior may be related to the formation of columnar primary dendrites along the thermal gradient during solidification, leading to possible crystallographic texture and locally coarser dendritic structures within the layer transition regions. In addition, specimens produced using the volumetric deposition strategy exhibit higher yield strength and ultimate tensile strength than those produced by thin-walled deposition. These differences are likely caused by slight variations in the applied heat treatment cycles. In particular, the greater plate thickness of 25 mm in volumetric deposition compared to 6.7 mm for thin-walled deposition, combined with air cooling after artificial aging, may have resulted in slower cooling rates and comparatively prolonged precipitation processes. This assumption is supported by the generally lower elongation at break observed for volumetric deposition specimens compared to thin-walled deposition.
Overall, the determined tensile properties for DED-Arc processing fall within the typical range reported for cast material of the respective alloy (cf. Section 3.2). Only the yield strength for specimens extracted at 90° to the deposition direction is slightly lower within the range of standard deviation. Figure 9 illustrates the crack locations based on exemplary metallographic sections. Due to the statistical distribution of porosity, the influence on crack location and the resulting tensile properties appears to be less pronounced compared to ER5356. In particular, Figure 9b reveals a comparatively higher number of pores for the 45° specimens based on qualitative assessment, which contrasts with the observed higher tensile strength values. A more detailed analysis of the crack paths indicates that, for the 90° loading direction, crack propagation preferentially occurs in the layer transition regions with coarser dendritic structures.

3.3. Fatigue Properties—ER5356, ER4046 (T6)

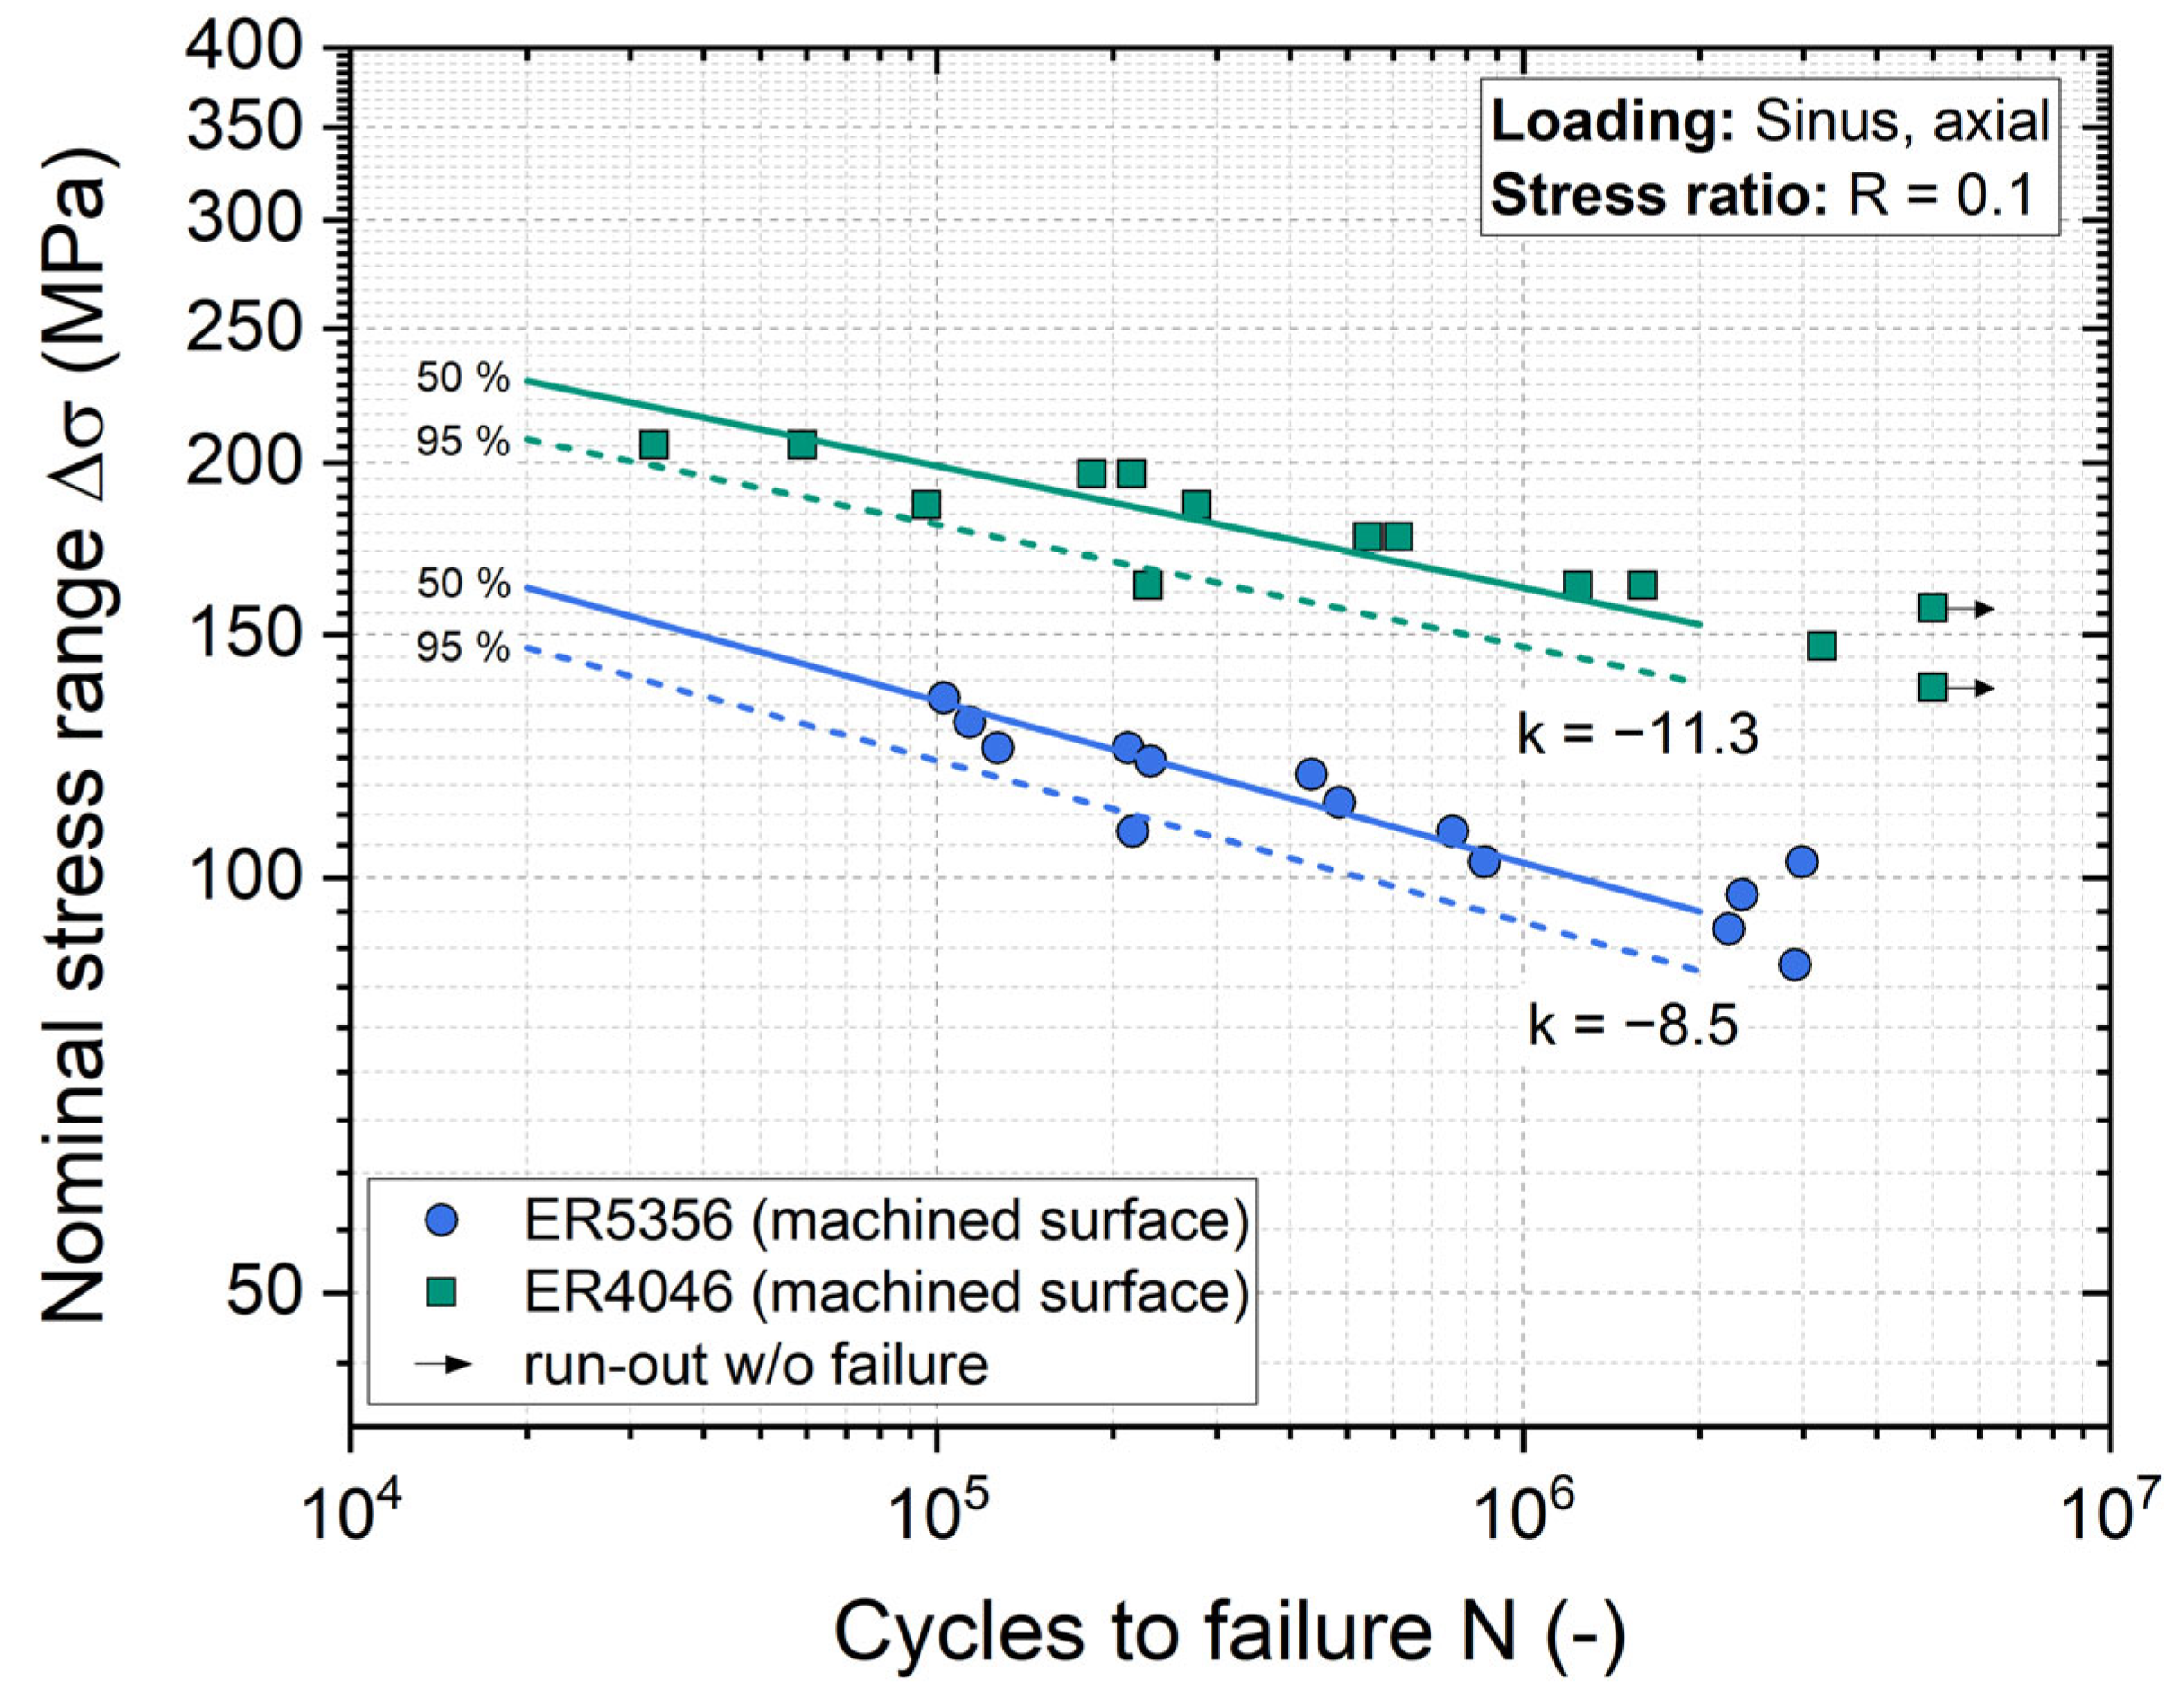
In addition to the tensile tests, fatigue properties were investigated for the thin-walled deposition in 90° specimen extraction direction. The resulting S-N curves evaluated with a free slope parameter (k) are provided in Figure 10. Both S-N curves show relatively shallow slopes characteristic of unnotched material conditions, with k = −8.5 for ER5356 and k = −11.3 for ER4046. For ER4046, the fatigue strength at 2·106 cycles amounts to Δσ50% = 153 MPa and Δσ95% = 138 MPa, assuming survival probabilities of 50% and 95%, respectively. In accordance with its lower tensile strength, ER5356 exhibits lower fatigue strength of Δσ50% = 95 MPa and Δσ95% = 86 MPa.
Considering mean stress effects according to the IIW Recommendations [29], the S-N curve for ER4046 lies clearly above FAT 71 (rolled or extruded products) over the entire range. Due to the shallower slope compared to the FAT classification (k = −5), the data points for ER5356 fall below FAT 71 in the regime of lower load cycles (approx. N < 4·105) and are therefore conservatively assessed by FAT 50 (e.g., transverse load butt weld with weld ground flush), although the fatigue strength at 2·106 cycles exceeds FAT 71.

4. Conclusions and Outlook

The present study aimed to determine the influence of deposition strategy, distinguishing between thin-walled single-track and volumetric zig-zag deposition, and extraction direction on the tensile properties of DED-Arc processed ER5356 and ER4046 aluminum alloys. In addition, fatigue properties in the high-cycle fatigue regime were determined for thin-walled deposition for a 90° extraction direction.
The results indicate that the investigated materials exhibit alloy-specific characteristics in the DED-Arc process, particularly regarding the distribution of process-inherent porosity. While metallographic analysis reveals a statistically distributed porosity for ER4046, ER5356 shows a localized accumulation of predominantly small pores in the layer transition zones. These microstructural inhomogeneities lead to directional dependencies of the tensile properties. For ER5356, the localized accumulation of imperfections primarily results in reduced elongation at break under loading transverse to the deposition direction. In contrast, ER4046 exhibits only minor directional dependence within the range of standard deviation, which is presumably related to coarser dendritic structures in the layer transition zones. In summary, the mechanical properties of DED-Arc manufactured ER5356 and ER4046 demonstrate that, despite process-related characteristics, exhibit strength levels comparable to those of conventionally wrought or cast aluminum products, indicating their suitability for DED-Arc-based manufacturing.
To validate the findings and to gain a deeper understanding of the underlying process–property relations, further investigations should focus on the governing mechanisms, including a quantitative assessment of the size, number, and distribution of porosity inherent to DED-Arc processing of aluminum alloys. In this context, a more pronounced influence of porosity on fatigue performance is to be expected. Qualitative evaluation of the metallographic cross-sections already indicates variations in porosity between individual specimens. Accordingly, the fatigue results presented in this study represent initial values, which require further statistical validation by extended investigations considering process-related influences and anisotropic material behavior. Furthermore, all investigations in this study were conducted on machined specimens. Regarding the potential application of components in the as-built condition, the resulting surface state represents an additional influencing factor on mechanical properties that should be addressed in future work.

Author Contributions

Conceptualization, M.K. and J.H.; methodology, M.K. and J.H.; validation, K.H. and J.H.; formal analysis, M.K.; investigation, M.K.; resources, K.H. and J.H.; data curation, M.K.; writing—original draft preparation, M.K.; writing—review and editing, K.H. and J.H.; visualization, M.K.; supervision, K.H. and J.H.; project administration, J.H. All authors have read and agreed to the published version of the manuscript.

Funding

This research received no external funding.

Data Availability Statement

The data obtained in this study is available from the corresponding author upon reasonable request.

Acknowledgments

This work is partly based on experimental investigations which were conducted for the student research projects of Patricia Heinrichs and Jasmin Beverförden. Their contributions are gratefully acknowledged. Further, the authors acknowledge the technical infrastructure and support of the Institute of Joining and Welding, TU Braunschweig. During the preparation of this manuscript, the authors used OpenAI ChatGPT 5.2 for the purposes of translation and language editing. The authors have reviewed and edited the output and take full responsibility for the content of this publication.

Conflicts of Interest

The authors declare no conflicts of interest.

Abbreviations

The following abbreviations are used in this manuscript:
AMAdditive manufacturing
CADComputer-Aided Design
CAMComputer-Aided Manufacturing
CMTCold metal transfer
DED-ArcWire-arc directed energy deposition
ERElectrode rod
GMAWGas metal arc welding
IIWInternational Institute of Welding
PBFPowder bed fusion
WAAMWire and arc additive manufacturing

Appendix A. Tensile Properties

Table A1. Mean and standard deviation of determined tensile properties for DED-Arc manufactured ER4046 depending on heat treatment condition for 0° orientation relative to the deposition direction.
Variantfy (MPa)fu (MPa)ε (%)
thin-walled (as-built)120 ± 15193 ± 311.5 ± 1.9
thin-walled (T4)123 ± 3237 ± 114.7 ± 1.8
thin-walled (T6)224 ± 2280 ± 412.2 ± 1.1
volumetric (as-built)127 ± 6232 ± 66.7 ± 1.6
volumetric (T4)130 ± 3254 ± 512.4 ± 2.5
volumetric (T6)235 ± 3292 ± 36.1 ± 1.4
Table A2. Mean and standard deviation of determined tensile properties for DED-Arc manufactured ER5356 depending on deposition strategy and test direction.
Variantfy (MPa)fu (MPa)ε (%)
thin-walled (0°)117 ± 2275 ± 223.2 ± 2.1
thin-walled (45°)116 ± 4264 ± 616.2 ± 1.2
thin-walled (90°)120 ± 1260 ± 314.8 ± 1.6
volumetric (0°)126 ± 4282 ± 718.6 ± 2.9
volumetric (45°)126 ± 1264 ± 812.7 ± 1.8
volumetric (90°)124 ± 3259 ± 2111.9 ± 4.1
Table A3. Mean and standard deviation of determined tensile properties for DED-Arc manufactured ER4046 (T6) depending on deposition strategy and test direction.
Variantfy (MPa)fu (MPa)ε (%)
thin-walled (0°)224 ± 2280 ± 412.2 ± 1.1
thin-walled (45°)235 ± 3290 ± 210.8 ± 1.4
thin-walled (90°)219 ± 4278 ± 413.7 ± 1.6
volumetric (0°)235 ± 3292 ± 36.1 ± 1.4
volumetric (45°)231 ± 5289 ± 36.9 ± 1.3
volumetric (90°)225 ± 9289 ± 66.2 ± 1.5

References

  1. Vafadar, A.; Guzzomi, F.; Rassau, A.; Hayward, K. Advances in Metal Additive Manufacturing: A Review of Common Processes, Industrial Applications, and Current Challenges. Appl. Sci. 2021, 11, 1213. [Google Scholar] [CrossRef]
  2. Frazier, W.E. Metal Additive Manufacturing: A Review. J. Mater. Eng. Perform. 2014, 23, 1917–1928. [Google Scholar] [CrossRef]
  3. Ding, D.; Pan, Z.; Cuiuri, D.; Li, H. Wire-feed additive manufacturing of metal components: Technologies, developments and future interests. Int. J. Adv. Manuf. Technol. 2015, 81, 465–481. [Google Scholar] [CrossRef]
  4. Treutler, K.; Wesling, V. The Current State of Research of Wire Arc Additive Manufacturing (WAAM): A Review. Appl. Sci. 2021, 11, 8619. [Google Scholar] [CrossRef]
  5. Reichler, A.-K.; Gerbers, R.; Falkenberg, P.; Türk, E.; Dietrich, F.; Vietor, T.; Dröder, K. Incremental Manufacturing: Model-based part design and process planning for Hybrid Manufacturing of multi-material parts. Procedia CIRP 2019, 79, 107–112. [Google Scholar] [CrossRef]
  6. Langelandsvik, G.; Akselsen, O.M.; Furu, T.; Roven, H.J. Review of Aluminum Alloy Development for Wire Arc Additive Manufacturing. Materials 2021, 14, 5370. [Google Scholar] [CrossRef] [PubMed]
  7. Winterkorn, R.; Pittner, A.; Rethmeier, M. Wire Arc Additive Manufacturing with Novel Al-Mg-Si Filler Wire—Assessment of Weld Quality and Mechanical Properties. Metals 2021, 11, 1243. [Google Scholar] [CrossRef]
  8. Klein, T.; Reiter, L.; Schnall, M. Wire-arc additive manufacturing of Al-Zn5.5-Mg-Cu (ML7075): Shifting paradigms of additive manufacture-ability. Mater. Lett. 2022, 313, 131841. [Google Scholar] [CrossRef]
  9. Wang, Y.; Chen, J.; Chen, M.; Su, H.; Zong, R.; Wu, D.; Komen, H.; Tanaka, M.; Wu, C. A comparative study on microstructure and mechanical properties of wire-arc directed energy deposited Al–Zn–Mg–Cu alloy based on the cold metal transfer technology. J. Mater. Res. Technol. 2024, 30, 397–415. [Google Scholar] [CrossRef]
  10. Hyer, H.; Zhou, L.; Park, S.; Gottsfritz, G.; Benson, G.; Tolentino, B.; McWilliams, B.; Cho, K.; Sohn, Y. Understanding the Laser Powder Bed Fusion of AlSi10Mg Alloy. Metallogr. Microstruct. Anal. 2020, 9, 484–502. [Google Scholar] [CrossRef]
  11. Denkena, B.; Wichmann, M.; Pillkahn, P. Effect of mechanical finishing on residual stresses and application behavior of wire arc additive manufactured aluminum components. Procedia CIRP 2022, 108, 135–140. [Google Scholar] [CrossRef]
  12. Köhler, M.; Sun, L.; Hensel, J.; Pallaspuro, S.; Kömi, J.; Dilger, K.; Zhang, Z. Comparative study of deposition patterns for DED-Arc additive manufacturing of Al-4046. Mater. Des. 2021, 210, 110122. [Google Scholar] [CrossRef]
  13. Omiyale, B.O.; Olugbade, T.O.; Abioye, T.E.; Farayibi, P.K. Wire arc additive manufacturing of aluminium alloys for aerospace and automotive applications: A review. Mater. Sci. Technol. 2022, 38, 391–408. [Google Scholar] [CrossRef]
  14. Fan, S.; Guo, X.; Li, Z.; Ma, J.; Li, F.; Jiang, Q. A Review of High-Strength Aluminum-Copper Alloys Fabri-cated by Wire Arc Additive Manufacturing: Microstructure, Properties, Defects, and Post-processing. J. Mater. Eng. Perform. 2023, 843, 143135. [Google Scholar] [CrossRef]
  15. Langelandsvik, G.; Horgar, A.; Furu, T.; Roven, H.J.; Akselsen, O.M. Comparative study of eutectic Al-Si alloys manufactured by WAAM and casting. Int. J. Adv. Manuf. Technol. 2020, 110, 935–947. [Google Scholar] [CrossRef]
  16. Guo, Y.; Han, Q.; Hu, J.; Yang, X.; Mao, P.; Wang, J.; Sun, S.; He, Z.; Lu, J.; Liu, C. Comparative Study on Wire-Arc Additive Manufacturing and Conventional Casting of Al–Si Alloys: Porosity, Microstructure and Mechanical Property. Acta Metall. Sin. (Engl. Lett.) 2021, 9, 608. [Google Scholar] [CrossRef]
  17. Fang, X.; Zhang, L.; Chen, G.; Dang, X.; Huang, K.; Wang, L.; Lu, B. Correlations between Microstructure Characteristics and Mechanical Properties in 5183 Aluminium Alloy Fabricated by Wire-Arc Additive Manufacturing with Different Arc Modes. Materials 2018, 11, 2075. [Google Scholar] [CrossRef] [PubMed]
  18. Gu, J.; Gao, J.; Yang, M.; Bai, S.; Zhai, J.; Ding, Y. Microstructure, defects, and mechanical properties of wire + arc additively manufactured Al Cu4.3-Mg1.5 alloy. Mater. Des. 2020, 186, 108357. [Google Scholar] [CrossRef]
  19. Zhang, C.; Li, Y.; Gao, M.; Zeng, X. Wire arc additive manufacturing of Al-6Mg alloy using variable polarity cold metal transfer arc as power source. Mater. Sci. Eng. A 2018, 711, 415–423. [Google Scholar] [CrossRef]
  20. Derekar, K.S.; Addison, A.; Joshi, S.S.; Zhang, X.; Lawrence, J.; Xu, L.; Melton, G.; Griffiths, D. Effect of pulsed metal inert gas (pulsed-MIG) and cold metal transfer (CMT) techniques on hydrogen dissolution in wire arc additive manufacturing (WAAM) of aluminium. Int. J. Adv. Manuf. Technol. 2020, 107, 311–331. [Google Scholar] [CrossRef]
  21. Xie, C.; Wu, S.; Yu, Y.; Zhang, H.; Hu, Y.; Zhang, M.; Wang, G. Defect-correlated fatigue resistance of additively manufactured Al-Mg4.5Mn alloy with in situ micro-rolling. J. Mech. Work. Technol. 2021, 291, 117039. [Google Scholar] [CrossRef]
  22. Whitepaper-W7-Wärmebehandlung Von Aluminiumlegierungen (in German); Aluminium-Zentrale: Düsseldorf, Germany, 2007.
  23. DIN EN ISO 6892-1; Metallic Materials–Tensile Testing–Part 1: Method of Test at Room Temperature. Deutsches Institut für Normung: Berlin, Germany, 2020.
  24. DIN 50125:2022-08; Prüfung Metallischer Werkstoffe-Zugproben. Deutsches Institut für Normung: Berlin, Germany, 2016.
  25. DIN 50100:2016; Load Controlled Fatigue Testing—Execution and Evaluation of Cyclic Tests at Constant Load Amplitudes on Metallic Specimens and Components. Deutsches Institut für Normung: Berlin, Germany, 2016.
  26. Ryan, E.M.; Sabin, T.J.; Watts, J.F.; Whiting, M.J. The influence of build parameters and wire batch on porosity of wire and arc additive manufactured aluminium alloy 2319. J. Mater. Process. Technol. 2018, 262, 577–584. [Google Scholar] [CrossRef]
  27. VDI 3405 Blatt 2.1 Berichtigung:2017-01; Additive manufacturing processes, rapid manufacturing—Laser beam melting of metallic parts—Material data sheet aluminium alloy AlSi10Mg. VDI Verein Deutscher Ingenieure e.V.: Düsseldorf, Germany, 2017.
  28. Klein, T.; Schnall, M. Control of macro-/microstructure and mechanical properties of a wire-arc additive manufactured aluminum alloy. Int. J. Adv. Manuf. Technol. 2020, 117, 371. [Google Scholar] [CrossRef]
  29. Hobbacher, A.F.; Baumgartner, J. Recommendations for Fatigue Design of Welded Joints and Components; Springer Nature: Cham, Switzerland, 2024. [Google Scholar]
Figure 1. DED-Arc manufactured material samples for (a) thin-walled and (b) volumetric deposition illustrating the position of metallographic cross-sections (indicated by squares) and tensile and fatigue specimen extraction.
Engproc 151 00008 g001
Figure 2. Specimen geometries for the two test methods in this study: (a) tensile testing, and (b) fatigue testing including schematic of the applied fatigue loading. Dimensions are given in mm.
Engproc 151 00008 g002
Figure 3. Macroscopic layer structure within the gauge section of the tensile specimens, corresponding to the specimen thickness (left subfigures) and specimen width (right subfigures) for (a) ER5356 thin-walled, (b) ER5356 volumetric, (c) ER4046 (T6) thin-walled, and (d) ER4046 (T6) volumetric deposition strategy.
Engproc 151 00008 g003
Figure 4. Optical micrographs of ER4046 alloy depending on heat treatment condition: (a) as-built, (b) T4, and (c) T6, exemplified by the volumetric zig-zag deposition strategy.
Engproc 151 00008 g004
Figure 5. Tensile test results for DED-Arc manufactured ER4046 depending on heat treatment condition subdivided into: (a) yield strength; (b) ultimate tensile strength, (c) elongation at break.
Engproc 151 00008 g005
Figure 6. Tensile test results for DED-Arc manufactured ER5356 subdivided into: (a) yield strength; (b) ultimate tensile strength, and (c) elongation at break.
Engproc 151 00008 g006
Figure 7. Optical micrographs of crack propagation paths depending on loading directions relative to the layer structure for ER 5356 thin-walled deposition (ac) and volumetric deposition (df).
Engproc 151 00008 g007
Figure 8. Tensile test results for DED-Arc manufactured ER4046 (T6) subdivided into: (a) yield strength; (b) ultimate tensile strength, (c) elongation at break.
Engproc 151 00008 g008
Figure 9. Optical micrographs of crack propagation paths depending on loading directions relative to the layer structure for ER 4046 (T6) thin-walled deposition (ac) and volumetric deposition (df).
Engproc 151 00008 g009
Figure 10. Fatigue test results presented in double-logarithmic scale.
Engproc 151 00008 g010
Table 1. Chemical composition of welding wire according to manufacturer certificate.
Feedstock MaterialMain Alloying Additions in Filler Wire (wt.%)
AlMnMgSiFeCu
ER5356bal.0.155.00.050.15-
ER4046bal.<0.0010.269.30.16<0.001
Table 2. DED-Arc parameters for sample processing.
ParameterER5356ER4046
Thin-WalledVolumetricThin-WalledVolumetric
Wire feed rate (m/min)8.08.06.04.6
Deposition speed (cm/min)60608060
Current (I)93.7 ± 0.292.1 ± 0.190.2 ± 0.363.1 ± 0.2
Voltage (U)19.6 ± 0.119.8 ± 0.121.2 ± 0.419.8 ± 0.2
Interpass temperature (°C)105 ± 5105 ± 5105 ± 5160 ± 5
Hatch patternsingle trackzig-zagsingle trackzig-zag
Track distance (mm)-4.0-2.45
Hatch angle betw. Layers (°)1809018090
Layer height (mm)1.422.250.952.45
Table 3. Heat treatment applied to ER4046.
as-BuiltT4T6
-Solution annealing
525 °C/2 h
Solution annealing
525 °C/2 h
-Water quenchingWater quenching
(Natural aging:
23 °C/30 d)
(Natural aging:
23 °C/30 d)
Artificial aging:
160 °C/8 h
Disclaimer/Publisher’s Note: The statements, opinions and data contained in all publications are solely those of the individual author(s) and contributor(s) and not of MDPI and/or the editor(s). MDPI and/or the editor(s) disclaim responsibility for any injury to people or property resulting from any ideas, methods, instructions or products referred to in the content.