


Abstract
This study investigates the effect of sinusoidal arc oscillation frequency on bead geometry accuracy in Cold Metal Transfer-based Wire Arc Additive Manufacturing (CMT-WAAM) of the Al-4043 alloy. Single-pass depositions were performed at frequencies of 0–4 Hz (1.0 mm amplitude) and 0–5 Hz (1.5 mm amplitude), followed by multi-pass, multi-layer builds using optimal parameters. Cross-sectional analysis revealed that a 3–4 Hz frequency window minimizes wetting angle asymmetry and maximizes bead width-to-height ratio. At 4 Hz with 1.5 mm amplitude, the arc oscillation yielded a symmetric wetting angle deviation of only 1.22°. Multi-layer builds indicated that oscillation improved the effective cross-sectional area ratio from 75% (non-oscillating) to 82%, suggesting superior geometric efficiency and reduced material waste in post-machining.
1. Introduction
Additive manufacturing (AM) continues to transform modern industry by enabling the production of complex, high-value components with reduced material waste and shortened lead times. Among the various AM techniques, wire arc additive manufacturing (WAAM) stands out for its ability to fabricate large-scale metallic structures at high deposition rates and relatively low operational costs, making it especially attractive for aerospace, automotive, and marine applications. The adoption of WAAM for structural aluminum alloys is particularly promising, as it aligns with the sector’s demand for lightweight, cost-effective solutions. Within the WAAM process spectrum, the Cold Metal Transfer (CMT) technique offers improved process stability and lower heat input compared to conventional arc welding approaches [1,2,3]. This is crucial for aluminum alloys, which are known for their high thermal conductivity, low melting points, and sensitivity to hydrogen-induced porosity [4]. Despite these advantages, WAAM of aluminum alloys is still constrained by persistent challenges, mainly arising from porosity formation and difficulties in bead geometry control. Dimensional consistency and repeatability of the deposited beads, which are governed by process parameters such as current, travel speed, and shielding gas flow, remain difficult to achieve, particularly given the complex thermal histories and microstructural evolution associated with multi-layer builds [5].
Arc oscillation, also known as torch weaving, has emerged as a promising strategy to mitigate geometrical inaccuracies and surface irregularities in WAAM. By imparting a periodic lateral motion to the welding torch, arc oscillation modifies the spatial distribution of heat and enhances convective stirring within the melt pool [6]. This alteration of the thermal field extends the melt pool solidification time and optimizes the wetting behavior and contact angles at the bead–substrate interface, ultimately facilitating superior bead uniformity across successive layers. While previous investigations have highlighted the benefits of oscillation for titanium alloys [7] and simplified aluminum setups [8], systematic research into the frequency-dependent effects of torch weaving on the wetting dynamics and geometric stability of realistic, multi-pass, multi-layer aluminum WAAM remains relatively sparse.
This study systematically examines how the frequency of sinusoidal arc oscillation influences weld bead morphology, specifically width, height, and wetting angle development in Al-4043 components produced via CMT-WAAM. The investigation is partitioned into two distinct stages to bridge the gap between fundamental bead-on-plate physics and industrial-scale production. Initially, single-pass deposits were fabricated at oscillation frequencies ranging from 0 to 4 Hz and 0 to 5 Hz with lateral amplitudes of 1.0 mm and 1.5 mm, respectively. Detailed cross-sectional characterization of bead width, height, and wetting angle symmetry provided the baseline for understanding the fluid dynamic response of the melt pool. In the second stage, optimal oscillation parameters were extended to a multi-pass, multi-layer experimental design consisting of a three-pass-per-layer strategy repeated over five layers. The primary objective of this multi-layer study is to evaluate the cumulative effects of arc oscillation on bead geometry stability, layer stacking efficiency, and the accuracy of the overall structural geometry under repeated thermal cycling. By establishing these relationships, this work aims to contribute to the understanding of frequency-dependent parameter selection for arc oscillation in aluminum CMT-WAAM in the production of high-quality, high-complexity, large-scale aluminum structural parts.
2. Materials and Methods
2.1. Materials and WAAM System
All depositions were conducted using a WAAM setup based on a Fronius Cold Metal Transfer (CMT) power source integrated with a YASKAWA robotic system. An aluminum alloy Al-4043 welding wire of 1.2 mm diameter was used as the feedstock material due to its favorable weldability, high silicon content, and widespread use in aluminum WAAM applications [9]. A flat heat-treated Al-6082 alloy substrate plate (200 × 100 mm × 25.4 mm) was employed for all depositions to ensure consistent thermal boundary conditions. High-purity argon shielding gas was supplied at a constant flow rate of 15 L/min to minimize atmospheric contamination during deposition.
2.2. Single-Pass Deposition Procedure
Single-pass bead depositions were performed to systematically investigate the influence of arc oscillation frequency and amplitude on bead geometry. All single-pass experiments were conducted using identical baseline process parameters to isolate the effects of oscillation. The welding current was maintained at 120 A and the travel speed at 810 mm/min. The substrate temperature was controlled at approximately 180 °C prior to deposition to ensure thermal consistency across all trials.
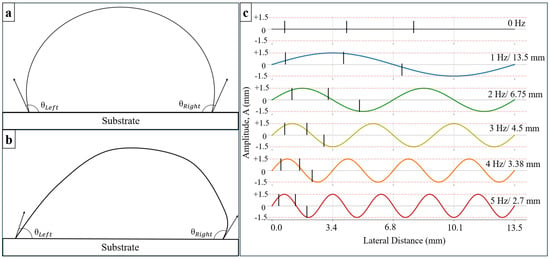
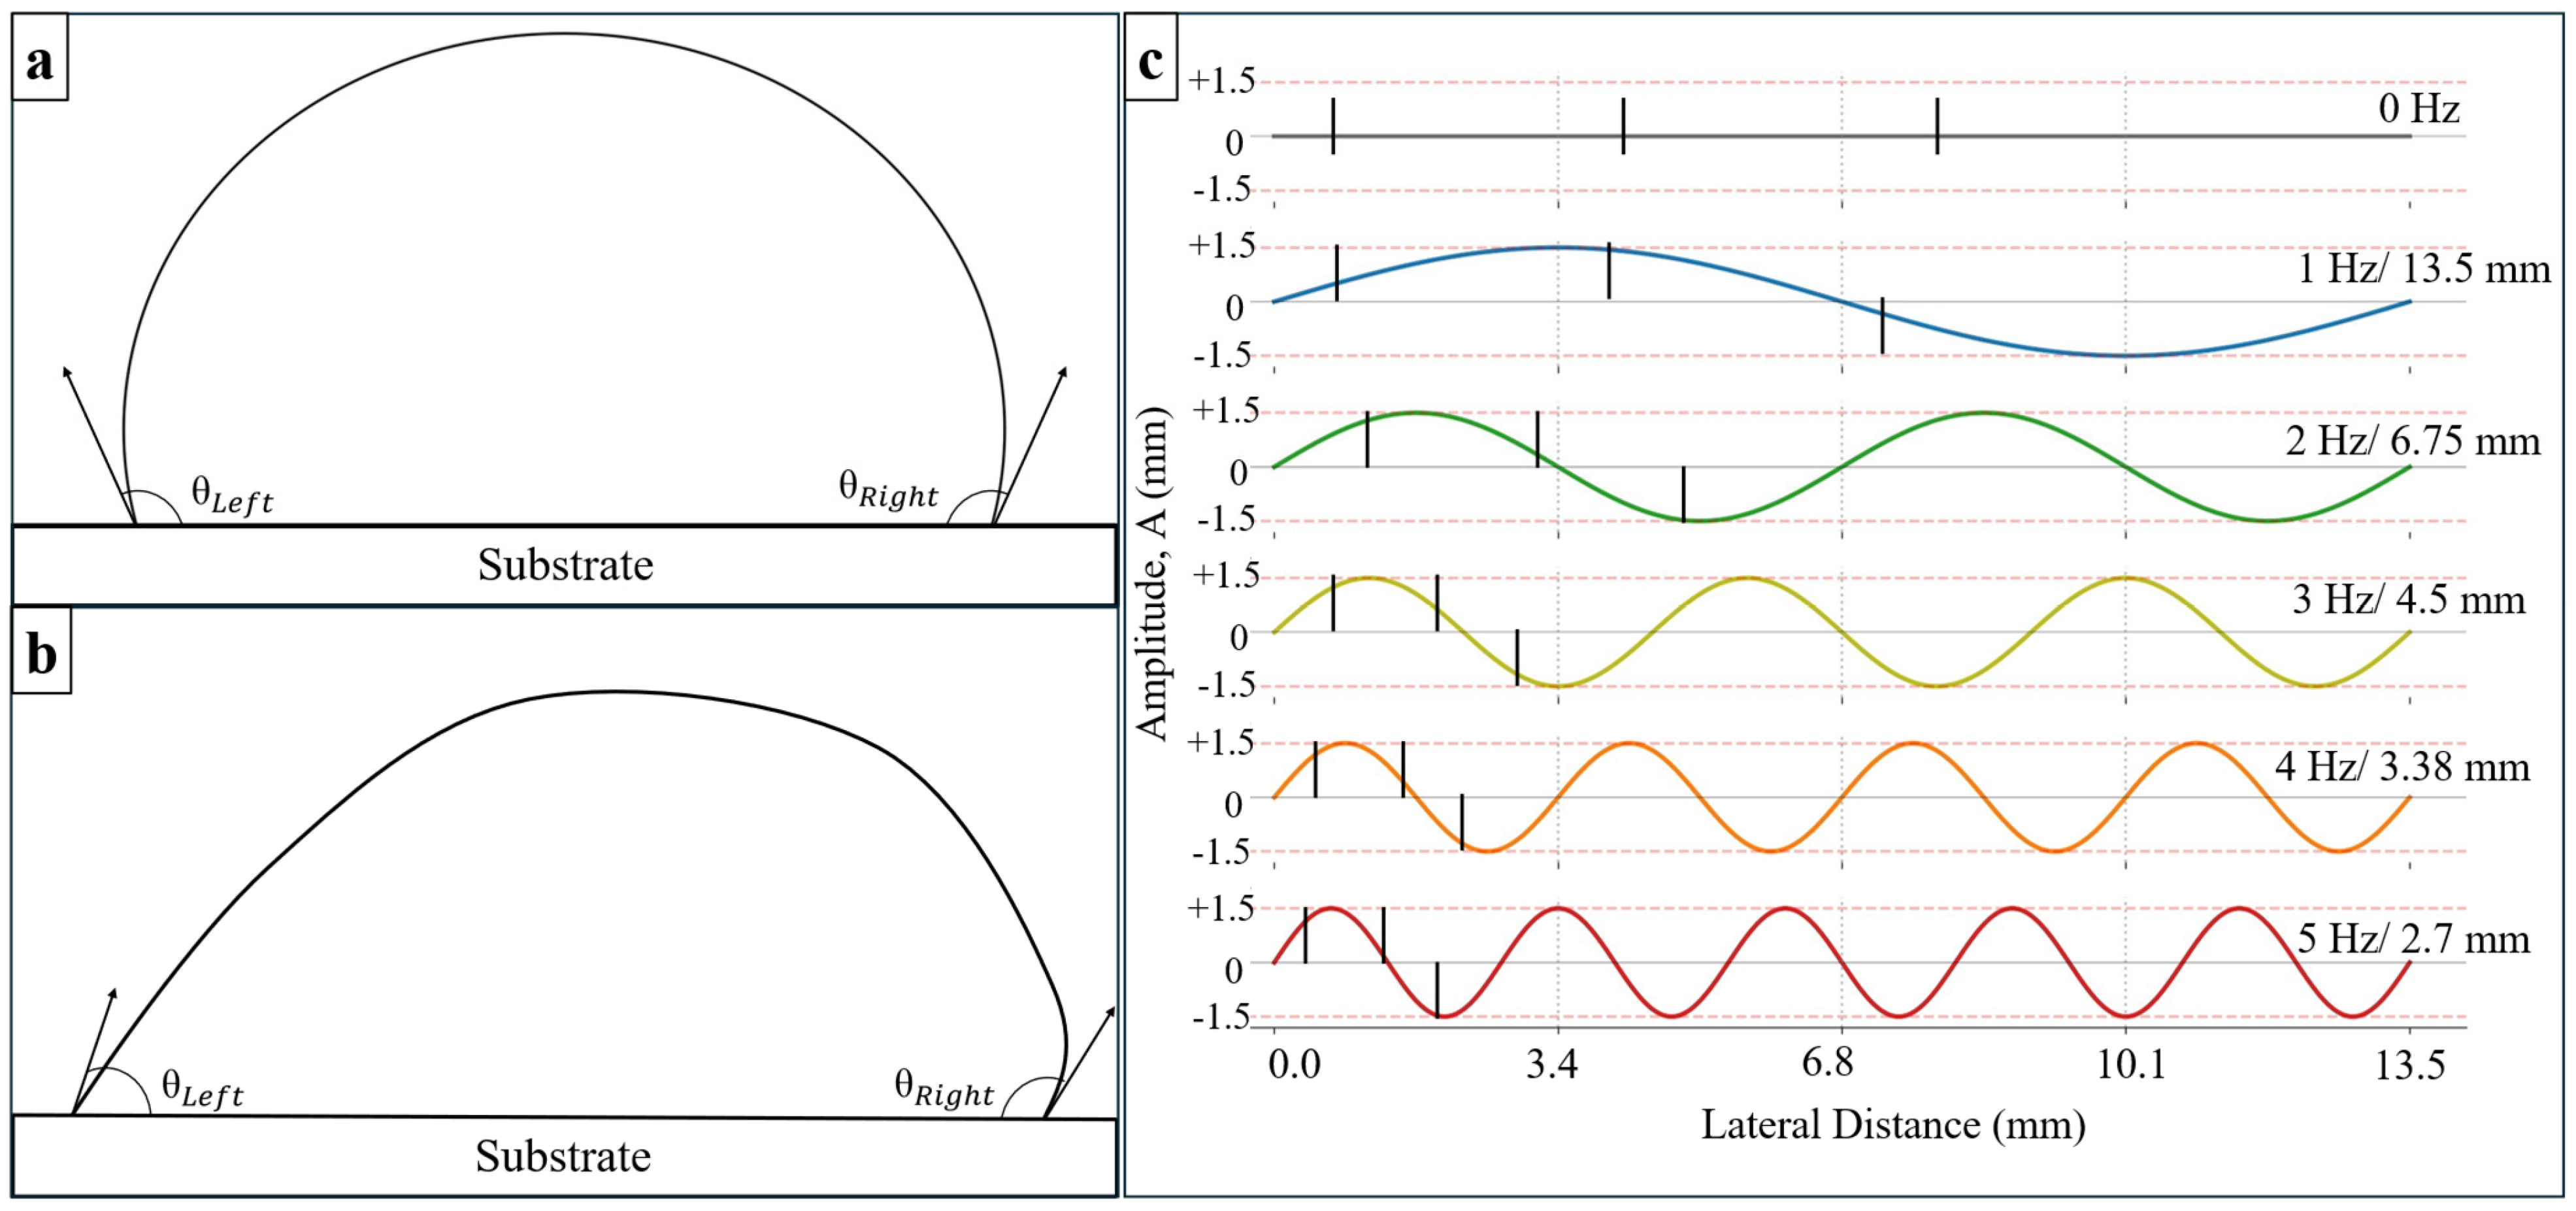
Left–right sinusoidal arc oscillation was applied perpendicular to the welding direction. Two oscillation amplitudes were investigated, 1.0 mm and 1.5 mm, corresponding to the lateral displacement on each side of the weld centerline. For the 1.0 mm amplitude, oscillation frequencies varied from 0 to 4 Hz, while for the 1.5 mm amplitude, frequencies ranged from 0 to 5 Hz. A frequency of 0 Hz corresponds to conventional non-oscillating deposition and serves as the baseline condition. Each single-pass bead was deposited with an approximate length of 135 mm and allowed to cool to ambient conditions prior to characterization. Bead geometry was quantified by measuring bead width and height at five locations along the deposit length, with measurement points spaced approximately 25 mm apart. A calibrated digital caliper was used for geometric measurements to ensure repeatability. In addition, to assess changes in bead spreading behavior associated with arc oscillation, the wetting angle was evaluated across successive transverse cross-sectional planes obtained via a progressive serial-sectioning and polishing approach along the longitudinal axis of the weld track. The baseline wetting angle measurement for non-oscillating beads and the modified measurement for oscillating beads are illustrated in Figure 1a and Figure 1b, respectively. Wetting profiles were measured at target intervals of 0%, 25%, and 50% of the frequency-dependent spatial wavelength (λ), which correspond from left to right to the consecutive vertical dashed lines illustrated for each frequency in Figure 1c. Here, 0% represents the baseline reference cross-section, while 25% and 50% correspond to parallel planes obtained by progressively polishing further into the weld bead at precise distance increments of 0.25 λ and 0.5 λ, respectively. It is important to note that only the relative distance between the positions of the cross sections investigated is controlled, as finding the absolute position was difficult.
Figure 1.
Illustrative sketch of cross-sectional (C.S.) area for wetting angle analysis: (a) non-arc oscillation wetting angle measurement; (b) arc oscillation wetting angle measurement; (c) C.S. analysis regions obtained via progressive longitudinal serial sectioning, where the three vertical lines for each frequency represent the 0%, 25%, and 50% planes of the spatial wavelength (λ), respectively, read from left to right.
2.3. Multi-Pass, Multi-Layer Experimental Design
Based on trends observed in single-pass deposition, the optimal arc oscillation condition was identified for extension to a multi-pass, multi-layer build. The multi-layer experimental design consisted of a three-pass-per-layer strategy repeated over five layers, representing a simplified yet structurally relevant WAAM configuration. A gap-filling deposition strategy was employed: the first and last passes were deposited first, followed by the third pass deposited in the center between them, with a cooling period of 13 s after each pass and 60 s after each layer. Two deposition cases were defined: (i) non-oscillating deposition (0 Hz) and (ii) oscillating deposition at 4 Hz with 1.5 mm amplitude. All multi-layer depositions were performed using the same baseline welding parameters as the single-pass experiments to maintain consistency.
2.4. Macrograph Characterization
Geometric consistency and wetting angle distributions were quantified through the analysis of high-resolution Infinite Focus Microscopy (IFM, Alicona, Raaba, Austria) scans, a focus-variation optical profilometry technique, performed on the bead cross-sections. For each sample, a transverse cross-section was extracted approximately 75 mm from the start of the deposited bead. The specimens were mechanically ground and polished to a mirror finish, followed by chemical etching using a 10 wt.% sodium hydroxide (NaOH) solution for 5 min to reveal the bead profile. Macrographs of the etched cross-sections were captured, and wetting angles were quantified using ImageJ 1.54g.
3. Results and Discussion
3.1. Effect of Arc Oscillation on Single-Pass Weld Bead Geometry
3.1.1. Width and Height
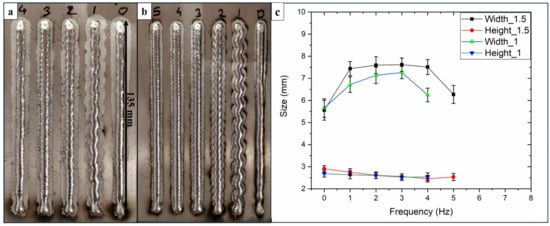
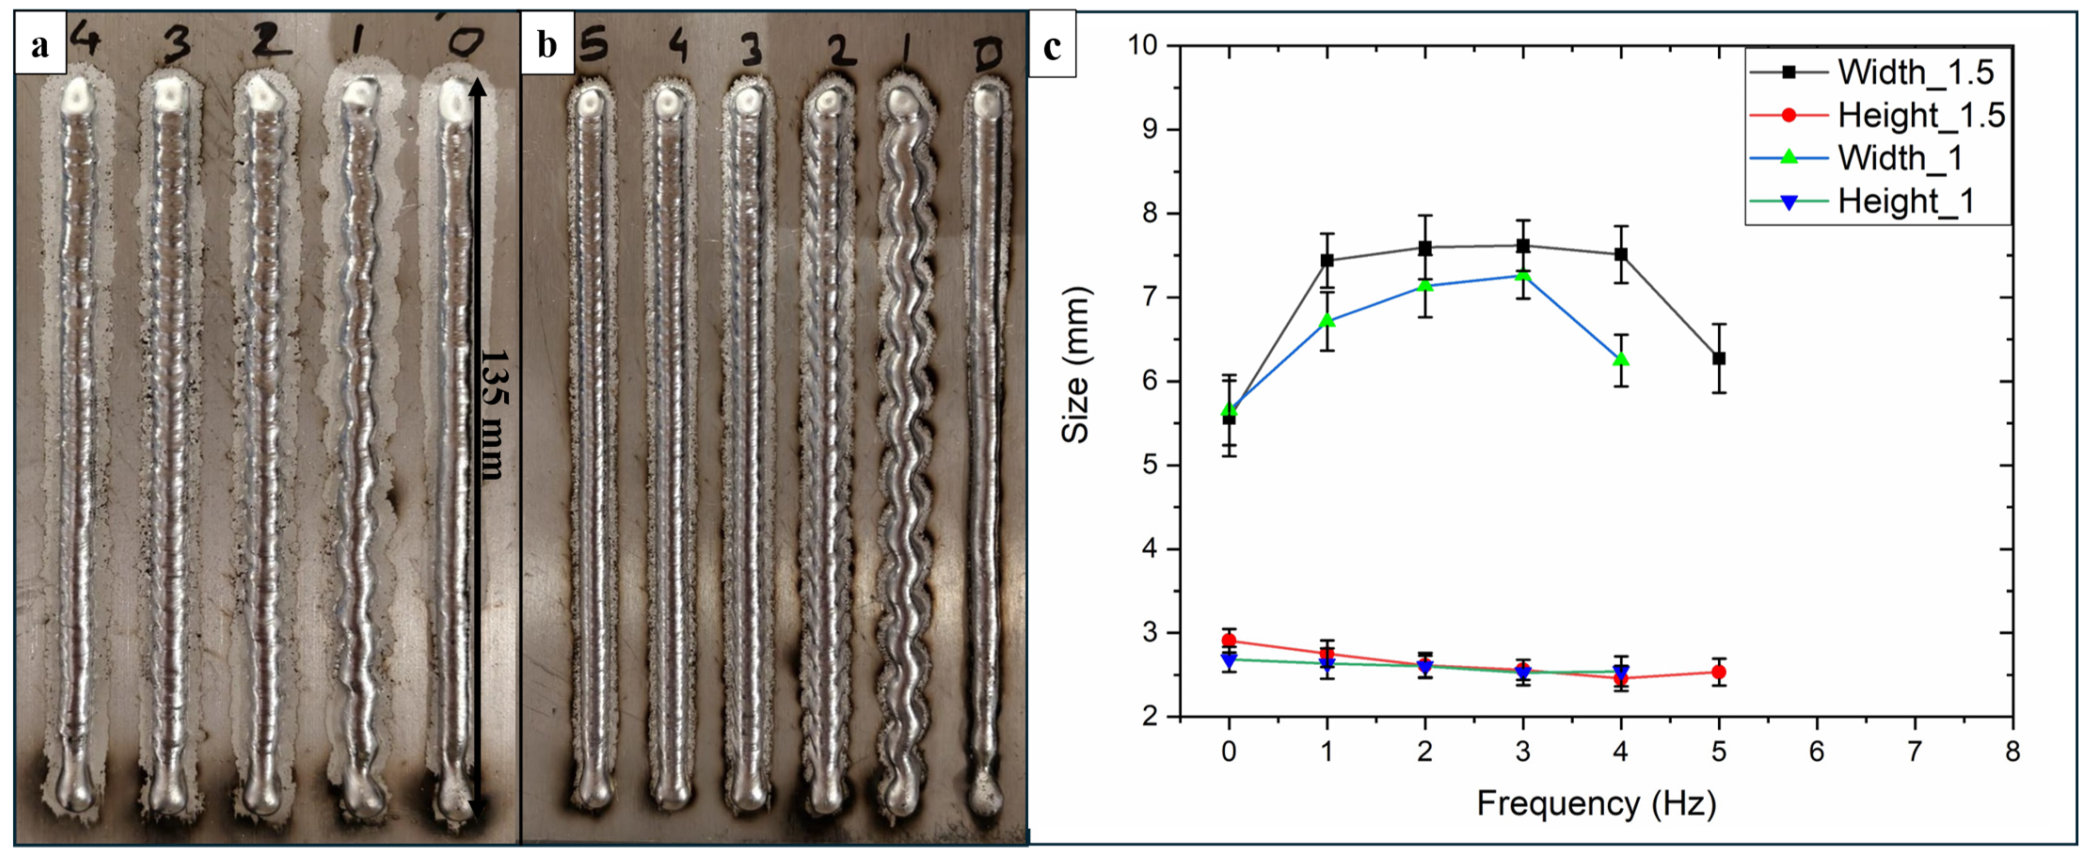
The effect of arc oscillation frequency on single-pass weld bead geometry is illustrated by the representative deposits shown in Figure 2a,b, with corresponding quantitative measurements of bead width and height summarized in Figure 2c. In the absence of arc oscillation (0 Hz), the deposited beads exhibit noticeable variations in geometry along the deposition length, indicating limited melt pool stabilization under static arc conditions. The application of arc oscillation modifies the spatial distribution of arc energy, resulting in systematic changes in bead morphology as a function of oscillation frequency and amplitude.
Figure 2.
Single-pass depositions at (a) 0–4 Hz and 1.0 mm amplitude; (b) 0–5 Hz and 1.5 mm amplitude; (c) bead width and height as a function of oscillation frequency.
For both oscillation amplitudes investigated (1.0 mm and 1.5 mm each side), increasing oscillation frequency leads to a pronounced increase in bead width accompanied by a reduction in bead height, demonstrating an inverse width–height relationship (as shown in Figure 2c). At low oscillation frequencies (1–2 Hz), although lateral weaving of the arc is evident (Figure 2a,b), the spacing between successive oscillation cycles remains relatively large, resulting in non-uniform material distribution along the weld path. This behavior is reflected in moderate width enhancement and comparatively higher bead heights, indicating incomplete lateral spreading of the molten pool.
At intermediate oscillation frequencies, particularly around 3–4 Hz, the deposited beads exhibit the highest degree of geometric consistency along their length for both oscillation widths, based on visual estimation. As shown in Figure 2c, bead width reaches a maximum (approximately 7.2 mm for 1.0 mm oscillation amplitude and 7.5–7.6 mm for 1.5 mm oscillation amplitude), while bead height reaches a minimum (approximately 2.4–2.5 mm), resulting in the highest width-to-height ratios among all conditions studied. This regime corresponds to closely spaced oscillation traces (as seen in Figure 2a,b), indicating effective lateral redistribution of molten material and a stabilized melt pool response.
Further increases in oscillation frequency beyond this range result in a reduction in bead width and a loss of geometric consistency. At higher frequencies, the bead remains continuous; however, quantitative data in Figure 2c show a decline in bead width accompanied by increased variability in height, suggesting that excessively rapid oscillation limits the effective interaction time between the arc and the molten pool, thereby reducing lateral spreading efficiency.
3.1.2. Wetting Angle
The wetting angle is a critical metric for evaluating interfacial quality in WAAM, as it determines the potential for inter-pass lack-of-fusion defects. Lower wetting angles (typically θ < 90°) signify improved spreading and metallurgical bonding with the pre-layer and substrate.
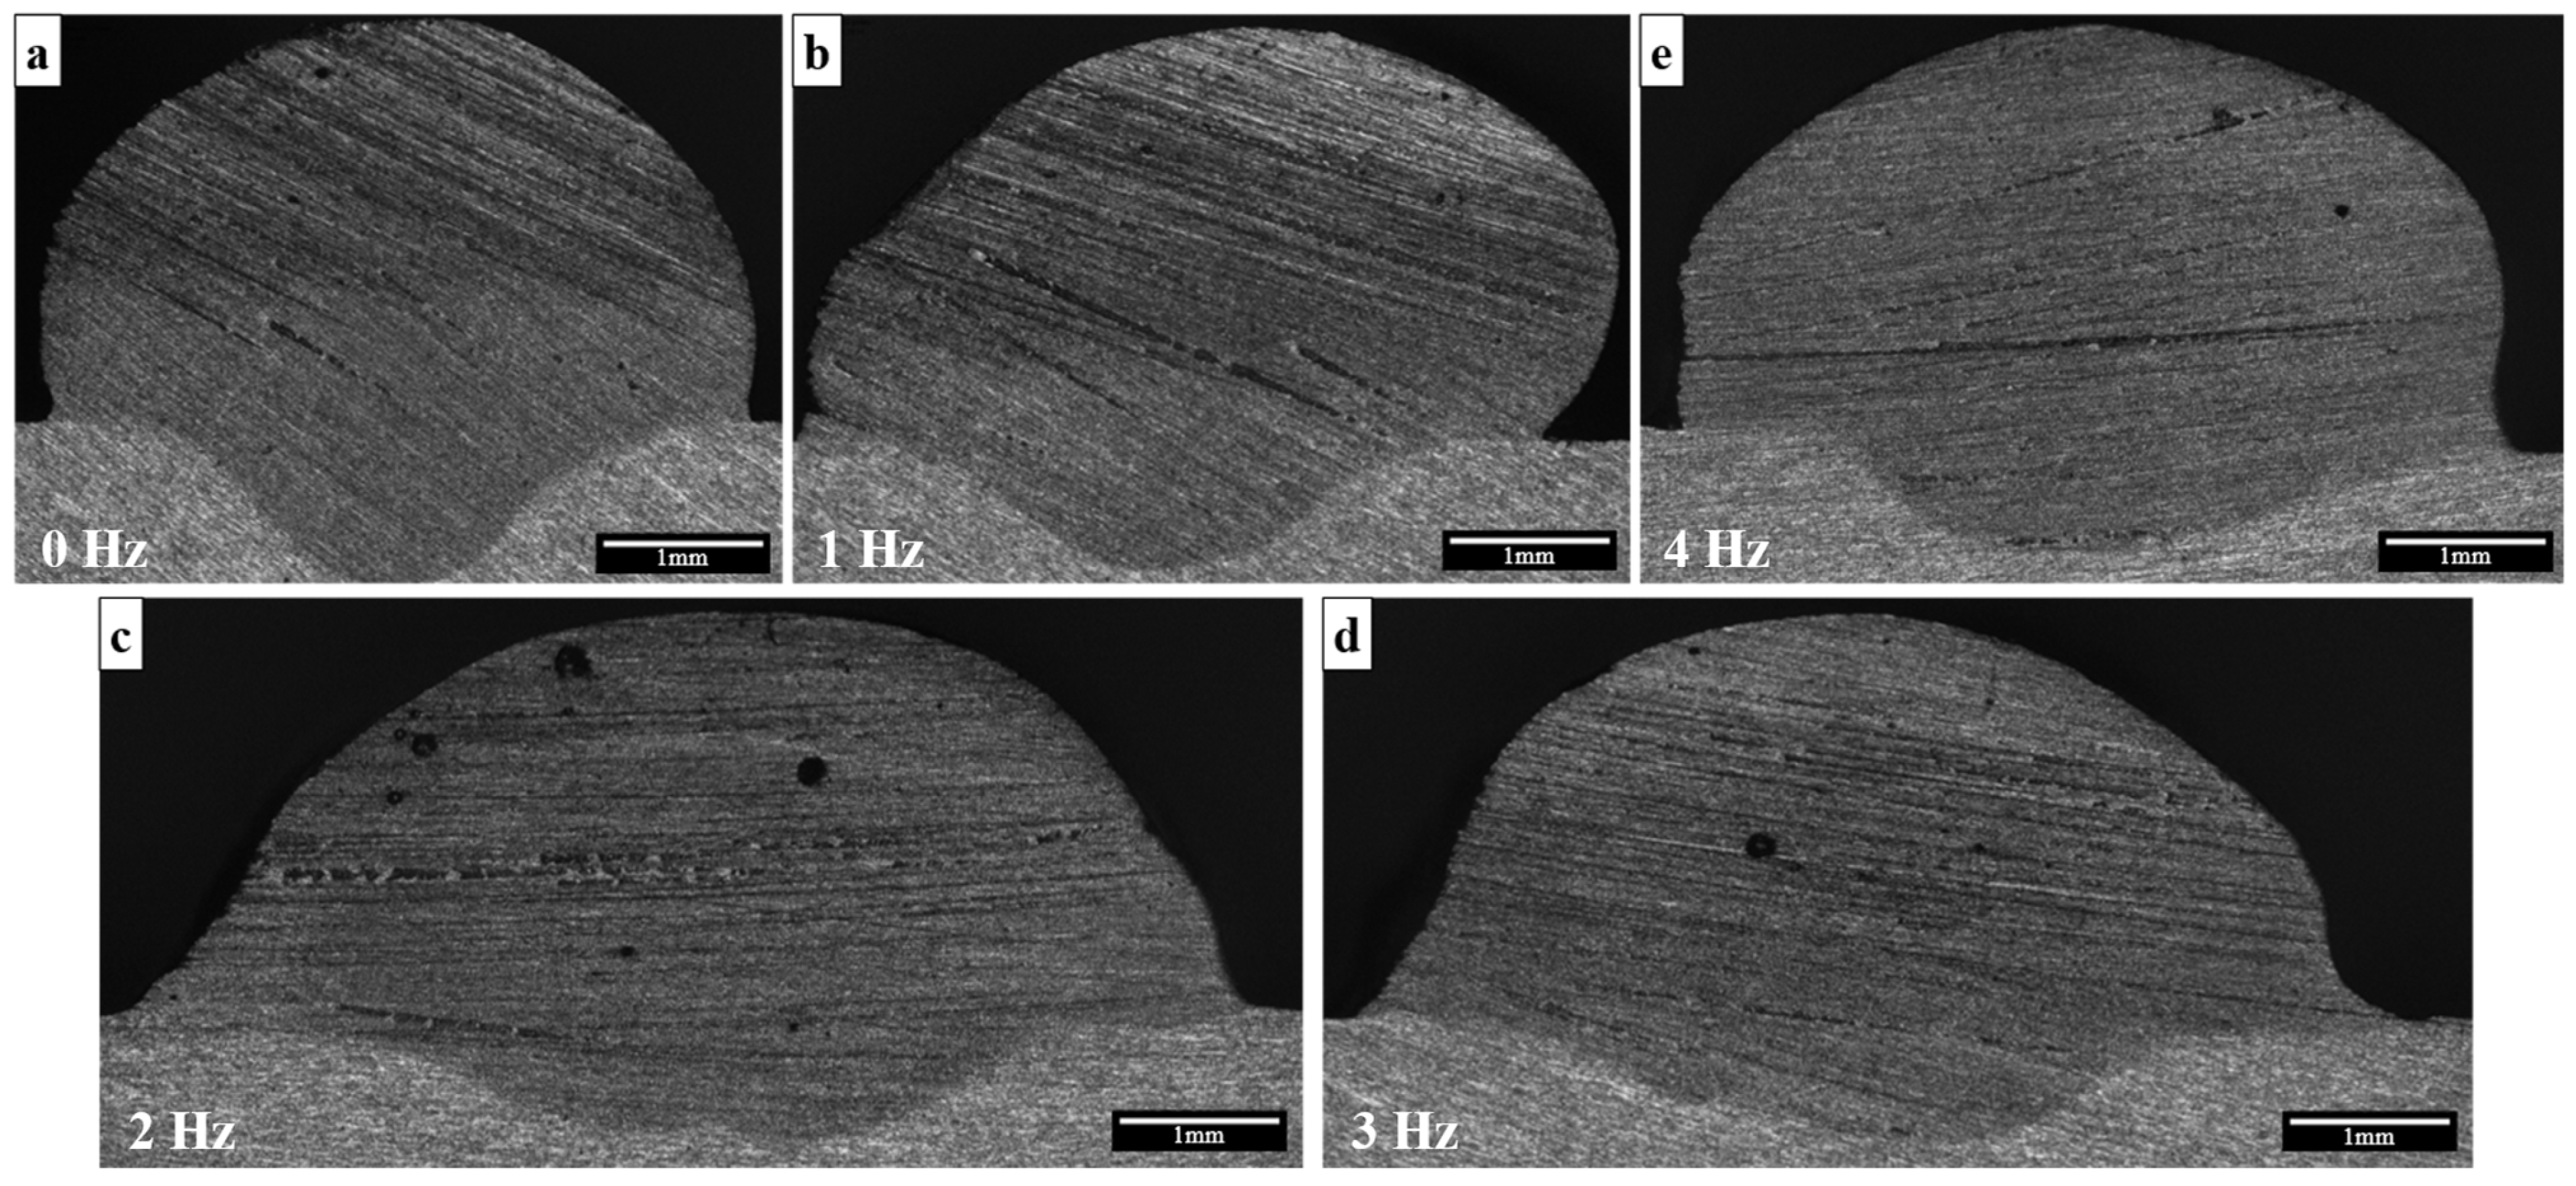
Figure 3 shows the variation of wetting angles at a constant 1.0 mm oscillation amplitude. At low frequencies (f = 1 Hz), anisotropic wetting angles are observed (visible in Figure 3b), with Δθ (difference between right and left wetting angles) = 46.82°, indicating that at slow oscillation frequency the arc dwell time relative to the travel speed allows for localized heat accumulation on one side of the track, preventing uniform fluid spreading, consistent with behavior reported for other alloy systems [10]. As the frequency increases to the 2–3 Hz range, the wetting angles reach a minimum (approximately 57.3°) and exhibit higher symmetry, indicating the attainment of melt pool stability [10].
Figure 3.
Cross-section view of single pass at 75 mm with (a) non-oscillating; (b) 1 Hz; (c) 2 Hz; (d) 3 Hz; and (e) 4 Hz frequencies at 1.0 mm amplitude.
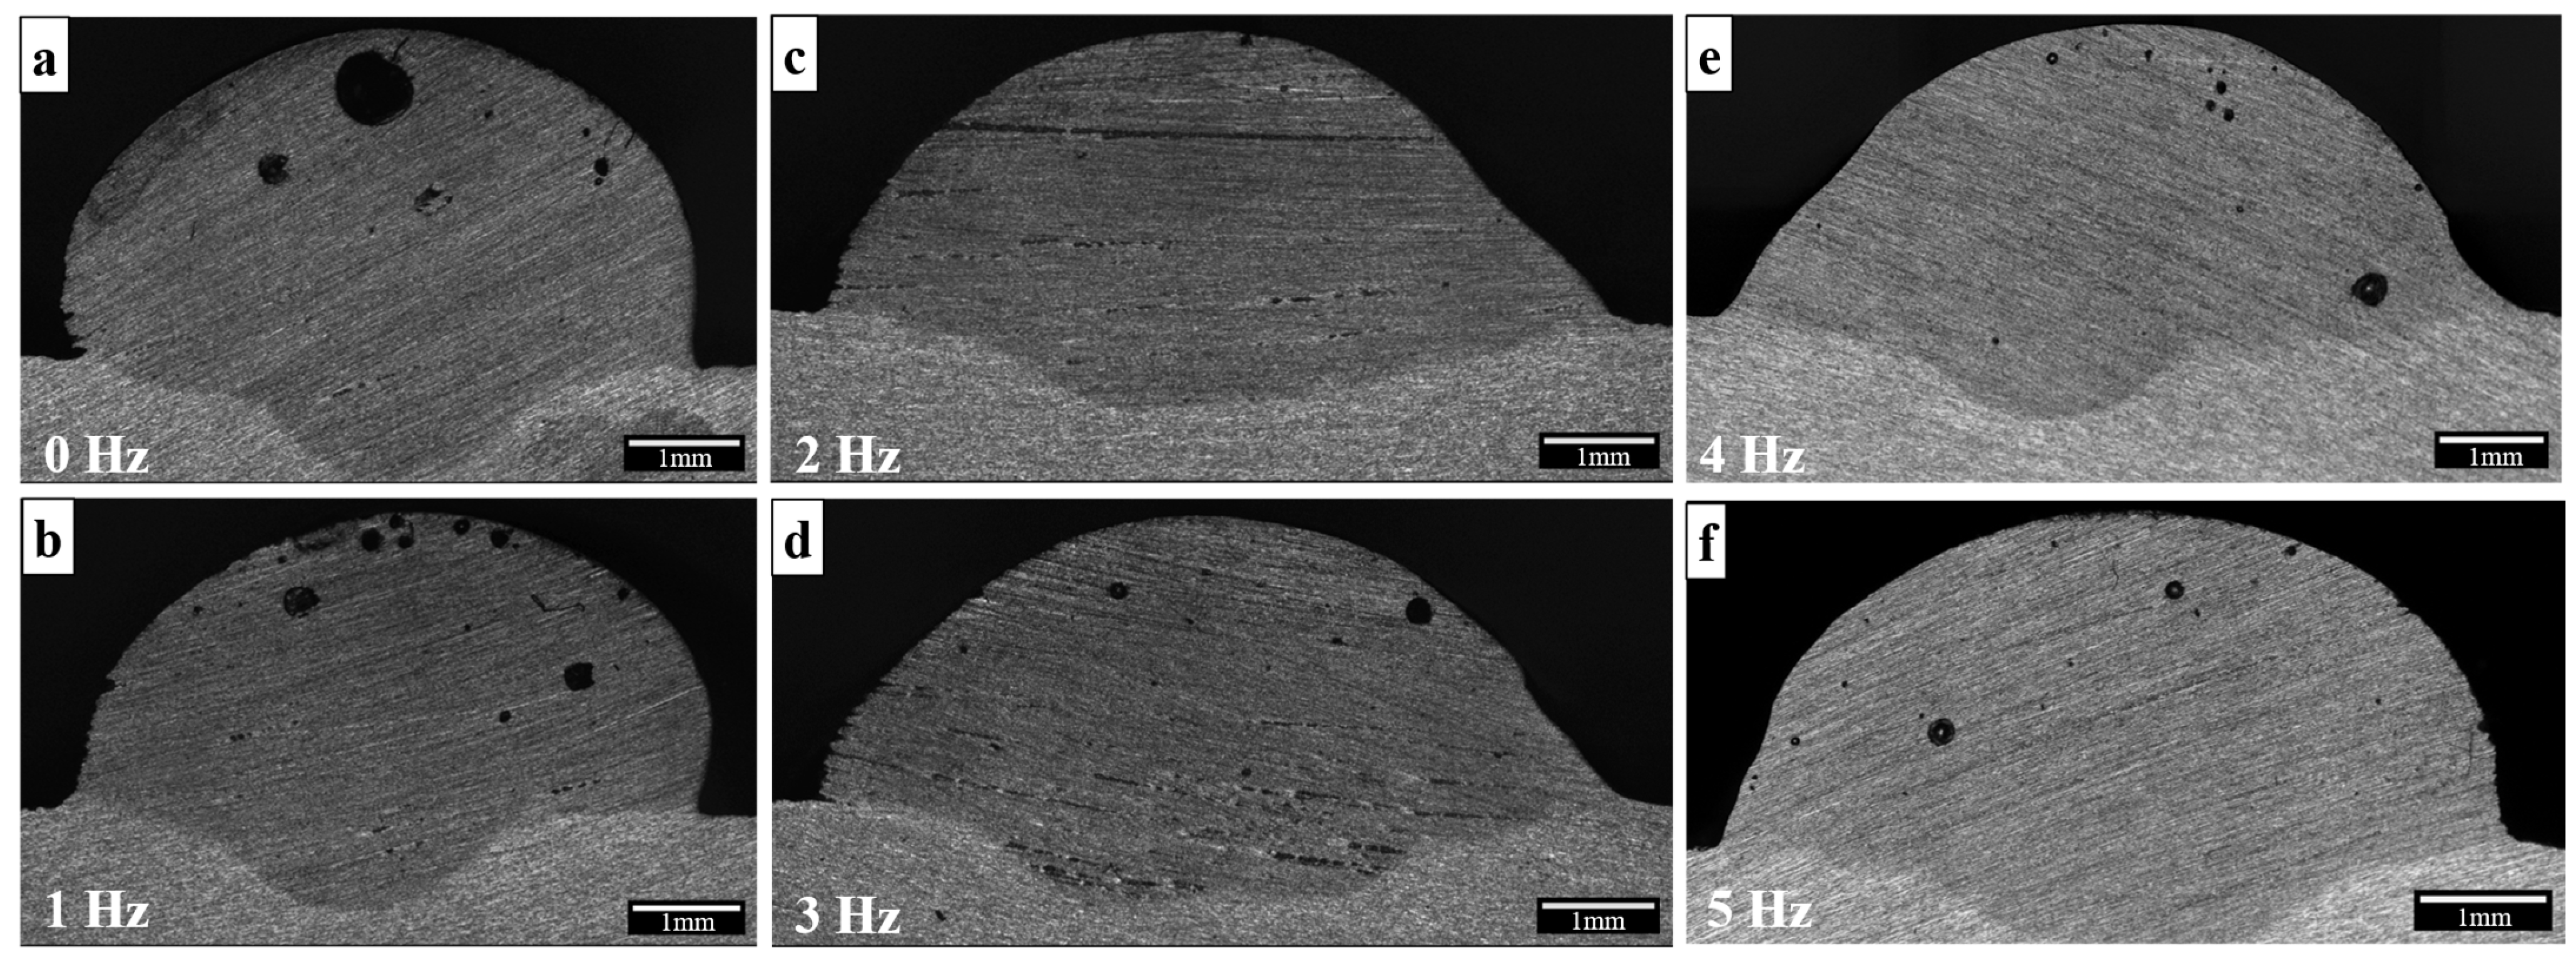
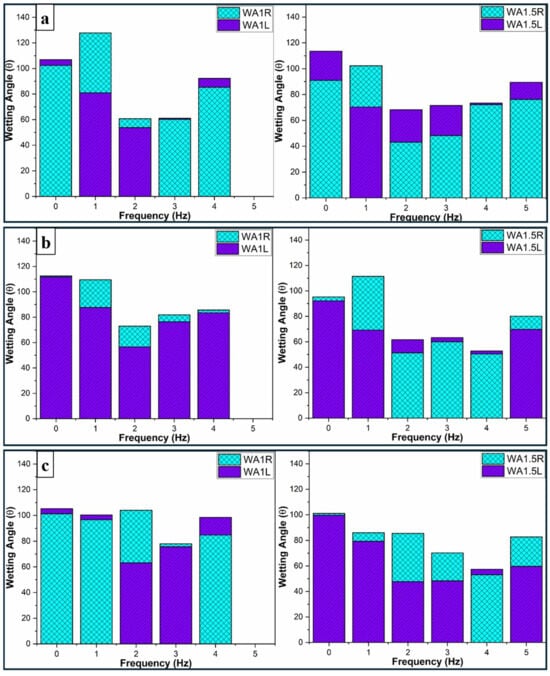
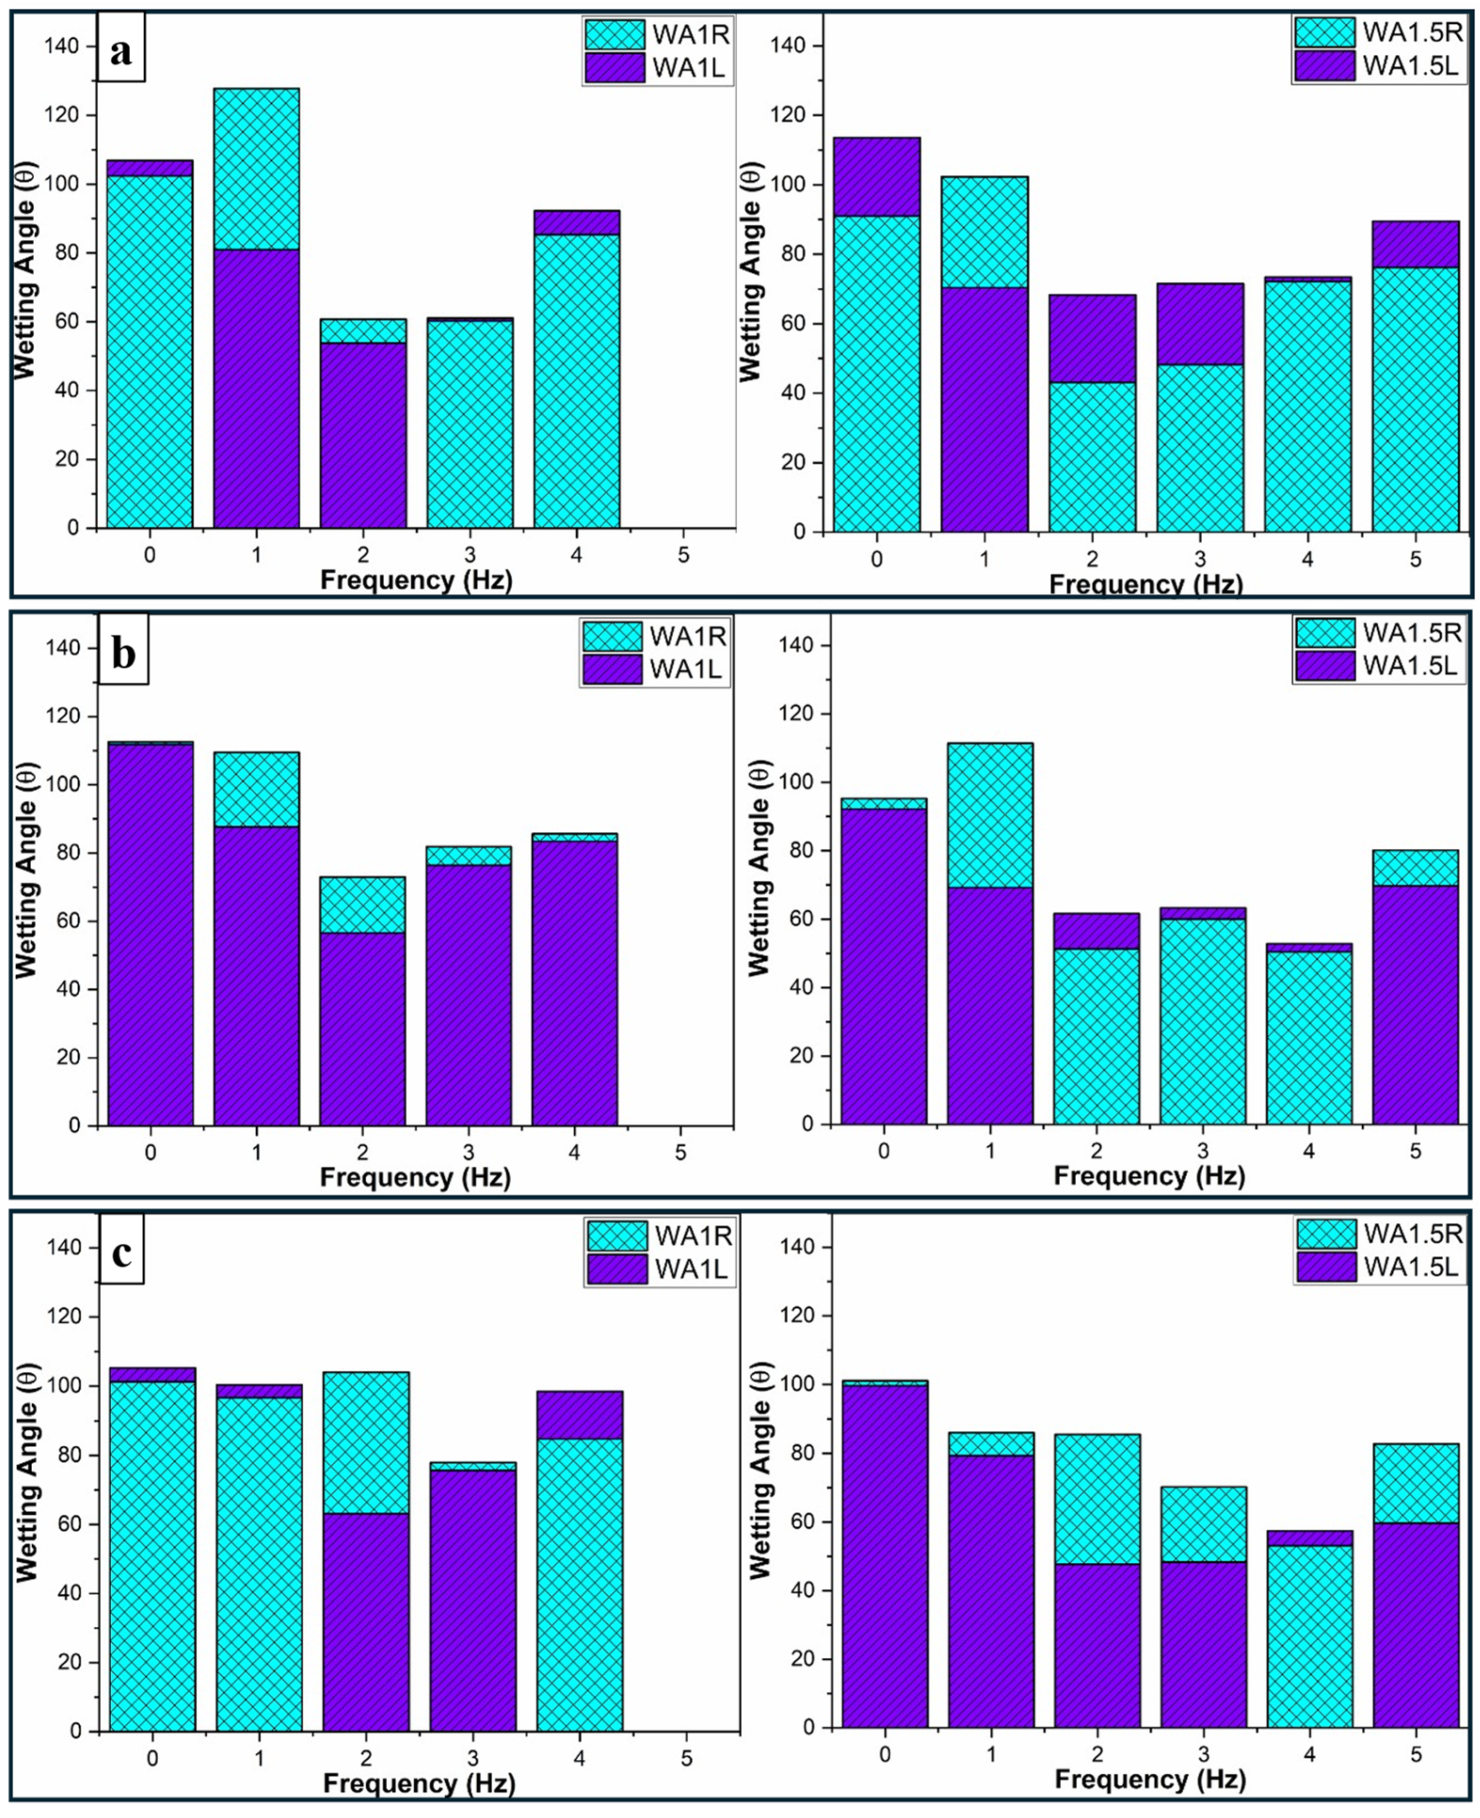
For the 1.5 mm oscillation amplitude, as shown in Figure 4, the experimental data reveal a recurrence of anisotropic wetting behavior at low frequencies (f = 1–2 Hz). At 1 Hz, a significant divergence is noted between θleft (70.36°) and θright (102.34°), reflecting the inherent instability of the deposition at lower frequencies. While a transition toward improved stability is observed at 3 Hz (Δθ = 59.89°), for the 1.5 mm amplitude conditions studied, the most symmetrical wetting profile was observed at 4 Hz, characterized by the most symmetrical interfacial profile with a marginal deviation Δθ of only 1.22° between the left (θleft = 73.40°) and right (θright = 72.18°) angles. This interfacial symmetry was further corroborated by the cross-sectional analysis in Figure 5, which confirms that the balanced wetting profile is maintained consistently across different phases of the oscillation cycle. Similar to the 1.0 mm frequency response, the system encounters a rebound effect once the stable optimal window is surpassed; at 5 Hz, the wetting angles rise to an average of 82.88°, indicating a deterioration in spreading efficiency as the oscillation speed exceeds the stable threshold.
Figure 4.
Cross-section view of single pass at 75 mm with (a) non-oscillating; (b) 1 Hz; (c) 2 Hz; (d) 3 Hz; (e) 4 Hz; and (f) 5 Hz frequencies at 1.5 mm amplitude.
Figure 5.
Wetting angle measurements at 1.0 mm and 1.5 mm amplitude for left wetting angle (WA1L, WA1.5L) and right wetting angle (WA1R, WA1.5R) at (a) 0% sinusoidal arc oscillation; (b) 25% sinusoidal arc oscillation; and (c) 50% sinusoidal arc oscillation cycle.
For the process parameters investigated in this study, the 3–4 Hz frequency range appears to represent the optimal window for deposition stability, which may be attributed to a balance between time-averaged heat distribution and the energy required to overcome surface tension forces at the molten pool boundaries. To quantitatively verify the suppression of anisotropic wetting at moderate frequencies and the recurrence of high wetting angles at elevated oscillation speeds, cross-sections extracted at positions corresponding to 25% and 50% of the sinusoidal oscillation cycle were prepared and analyzed. Consistent with the transverse observations in Figure 4, the measurements in Figure 5 demonstrate that the 3–4 Hz window promotes stable, laterally spread wetting profiles with minimal asymmetry throughout the deposition path, whereas low frequencies (f ≤ 2 Hz) induce significant anisotropic variance and frequencies exceeding 4 Hz trigger a “rebound effect” characterized by a sharp increase in the average contact angle.
3.2. Effect of Arc Oscillation on Multi-Pass Multi-Layer Weld Bead Geometry
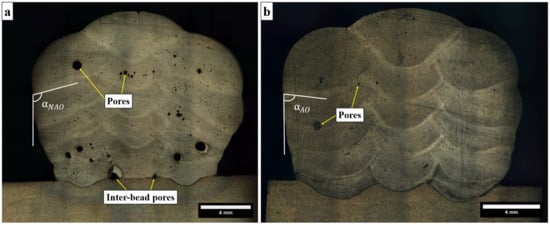
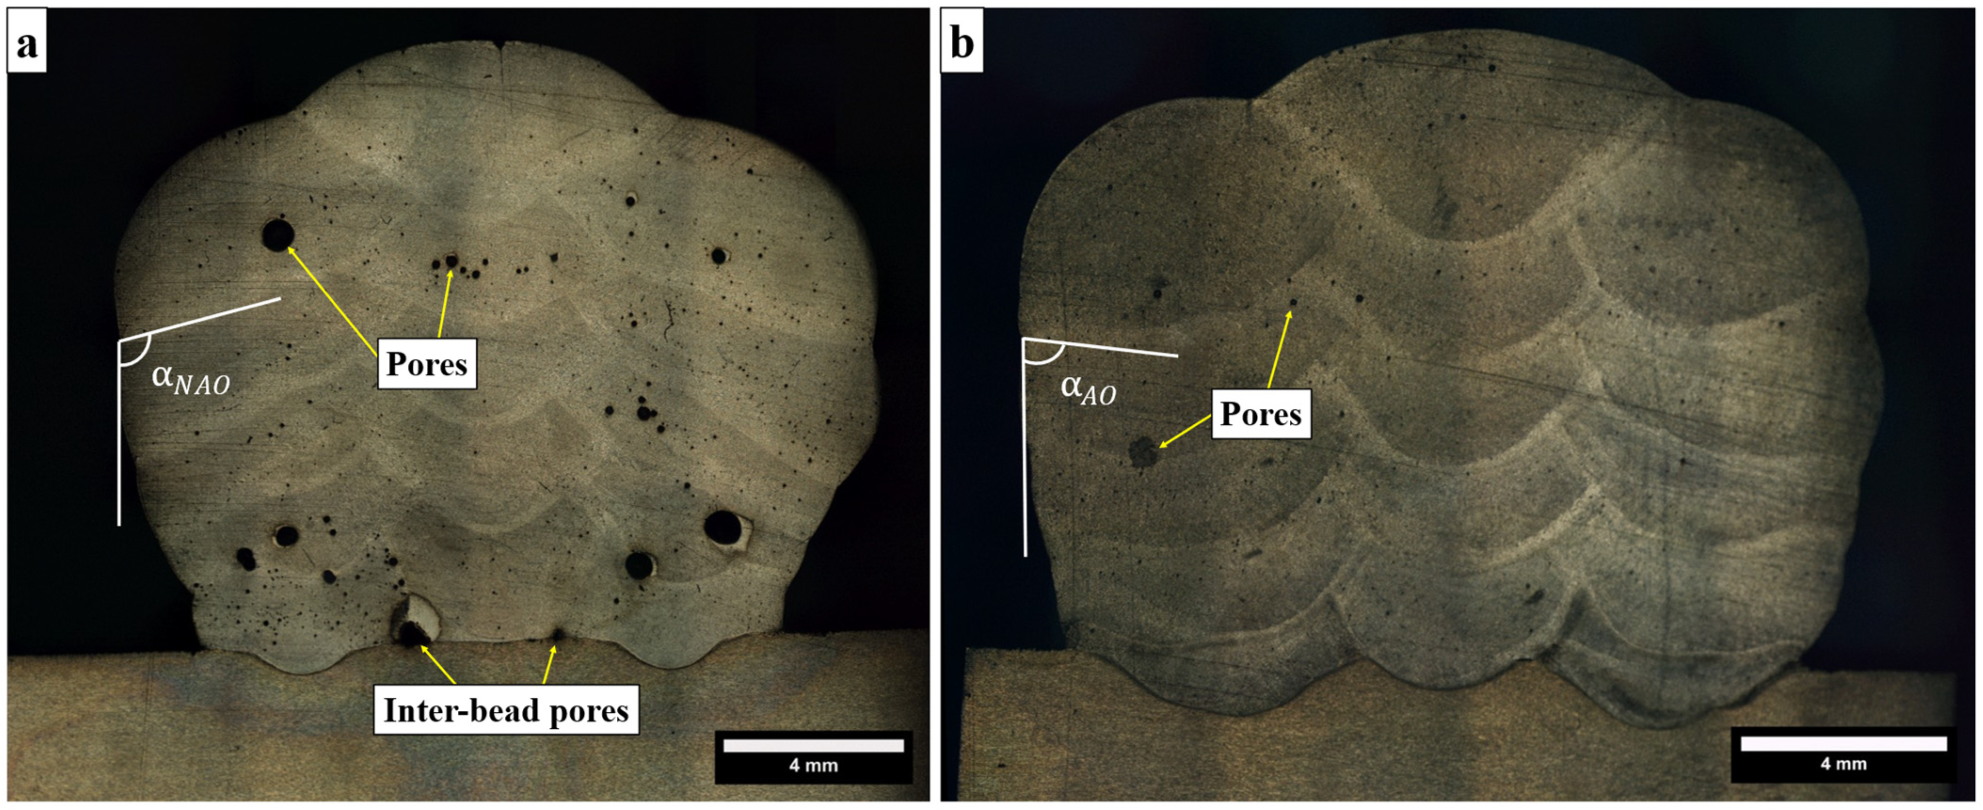
The cross-sectional macrographs of the five-layer, three-pass-per-layer builds for the non-oscillating (NAO) and oscillating (AO, 4 Hz, 1.5 mm amplitude) conditions are presented in Figure 6. Visual inspection reveals a pronounced difference in the lateral build profiles. The NAO build exhibits an irregular outer contour, with steeply inclined edge angles of approximately 110°, reflecting limited lateral spreading and asymmetric accumulation of deposited material across successive layers. By contrast, the AO build displays a markedly more regular and compact profile, with edge angles reduced to approximately 79°, indicative of adequate bead wetting and inter-pass fusion quality.
Figure 6.
Macrographs of WAAM multi-pass multi-layer wall: (a) non-arc oscillation (NAO); and (b) 4 Hz frequency, 1.5 mm amplitude arc oscillation (AO).
Quantitative cross-sectional analysis further substantiates these observations. The NAO build yielded a total deposited area of 188 mm2, of which only 140 mm2 constitutes the effective rectangular envelope—the usable cross-section remains after removal of the irregular outer surface, corresponding to an effective area ratio of approximately 75%. The AO build, despite a slightly lower total deposited area of 175 mm2, achieved an effective area of 145 mm2, giving a notably higher effective area ratio of approximately 82%. These measurements confirm the superior geometric efficiency of the 4 Hz, 1.5 mm arc oscillation strategy in a multi-pass, multi-layer configuration.
The improvement in effective area ratio under arc oscillation can be attributed to the lateral heat redistribution and enhanced melt pool convection established at the optimal oscillation window identified in the single-pass analysis. At 4 Hz, the periodic lateral weaving promotes uniform energy distribution across the full width of each deposited pass, facilitating consistent wetting at the bead edges and suppressing the steep, irregular flanks characteristic of NAO builds. As layers accumulate, this stabilizing effect compounds: the broader, better-wetted bead profiles stack more consistently, preserving a near-rectangular cross-section throughout the build height. The edge angles directly reflect this behavior: a reduction from ~110° (NAO) to ~79° (AO) suggests that oscillation-induced melt pool redistribution alters the inter-layer wetting geometry.
Conversely, the pronounced edge angle in the NAO build (~110°) reflects the inherent tendency of non-oscillated deposits to form high-contact-angle, centrally peaked beads in which material accumulates preferentially along the weld axis rather than spreading uniformly to the flanks.
Over multiple layers, this produces a characteristic “crowning” of the build profile and increases the volume of material requiring post-process machining. The approximately 7 percentage-point improvement in effective area ratio achieved through arc oscillation (82% vs. 75%) therefore represents a tangible gain in both material utilization and build geometric regularity, suggesting potential benefits for machining allowance and geometric efficiency in configurations similar to those studied here. Taken together, these results suggest that the 4 Hz, 1.5 mm arc oscillation strategy may sustain its geometric benefits under the thermal cycling conditions of multi-pass, multi-layer builds for the Al-4043 system studied.
4. Conclusions
This study investigated the influence of sinusoidal arc oscillation frequency on bead geometry accuracy in the CMT-WAAM of Al-4043 alloy across both single-pass and multi-pass, multi-layer configurations. The following conclusions are drawn:
- An inverse relationship between oscillation frequency and the bead height–width ratio was consistently observed across the conditions studied. Increasing the frequency from 0 to 3–4 Hz progressively widened the bead and reduced its height, maximizing the width-to-height ratio and geometric uniformity.
- The 3–4 Hz frequency range was identified as the optimal operational window for both oscillation amplitudes (1.0 mm and 1.5 mm), promoting symmetric wetting profiles and minimal anisotropy. At 4 Hz with a 1.5 mm amplitude, the wetting angle deviation was reduced to Δθ = 1.22°, compared to Δθ = 46.82° at 1 Hz.
- Frequencies below 2 Hz induced significant anisotropic wetting due to localized heat accumulation, while frequencies exceeding 4 Hz triggered a rebound effect characterized by increased average contact angles, indicating a loss of melt pool stability.
- In multi-pass, multi-layer builds, the 4 Hz, 1.5 mm arc oscillation strategy improved the effective cross-sectional area ratio from 75% (NAO) to 82% (AO) and reduced edge angles from ~110° to ~79°, confirming superior geometric efficiency and reduced post-process machining requirements.
Author Contributions
Conceptualization, M.M.M.S. and S.A.T.; methodology, M.M.M.S.; formal analysis, M.M.M.S.; investigation, M.M.M.S.; writing—original draft preparation, M.M.M.S.; writing—review and editing, M.M.M.S. and S.A.T.; supervision, S.A.T. All authors have read and agreed to the published version of the manuscript.
Funding
This research received no external funding.
Institutional Review Board Statement
Not applicable.
Informed Consent Statement
Not applicable.
Data Availability Statement
The data presented in this study are available on request from the corresponding author.
Acknowledgments
This research was conducted using the MANULAB Norwegian national research infrastructure for state-of-the-art manufacturing research.
Conflicts of Interest
The authors declare no conflicts of interest.
Abbreviations
| AM | Additive Manufacturing |
| AO | Arc Oscillation |
| CMT | Cold Metal Transfer |
| C.S. | Cross-Section |
| IFM | Infinite Focus Microscopy |
| NAO | Non-Arc Oscillation |
| WAAM | Wire Arc Additive Manufacturing |
References
- Sarıkaya, M.; Başcıl Önler, D.; Dağlı, S.; Hartomacıoğlu, S.; Günay, M.; Królczyk, G.M. A Review on Aluminum Alloys Produced by Wire Arc Additive Manufacturing (WAAM): Applications, Benefits, Challenges and Future Trends. J. Mater. Res. Technol. 2024, 33, 5643–5670. [Google Scholar] [CrossRef] [Scilit]
- Chen, Z.; Yuan, L.; Pan, Z.; Zhu, H.; Ma, N.; Ding, D.; Li, H. A Comprehensive Review and Future Perspectives of Simulation Approaches in Wire Arc Additive Manufacturing (WAAM). Int. J. Extrem. Manuf. 2025, 7, 022016. [Google Scholar] [CrossRef] [Scilit]
- Kesarwani, S.; Yuvaraj, N.; Niranjan, M.S. CMT-Based WAAM: A Comprehensive Review of Process Parameters, Their Effects, Challenges, and Future Scope. J. Braz. Soc. Mech. Sci. Eng. 2024, 46, 699. [Google Scholar] [CrossRef] [Scilit]
- Samuel, A.M.; Samuel, E.; Songmene, V.; Samuel, F.H. A Review on Porosity Formation in Aluminum-Based Alloys. Materials 2023, 16, 2047. [Google Scholar] [CrossRef] [Scilit]
- Lettori, J.; Esposto, C.; Peruzzini, M.; Pellicciari, M.; Raffaeli, R. Geometrical Characterization of Circular Multi-Layered CMT WAAM Specimens by 3D Structured Light Scanning. Int. J. Adv. Manuf. Technol. 2025, 136, 5305–5334. [Google Scholar] [CrossRef] [Scilit]
- Bultman, J.; Saldaña, C. Effects of Weave Path Parameters on the Geometry of Wire Arc Additive Manufactured Features. Int. J. Adv. Manuf. Technol. 2023, 124, 2563–2577. [Google Scholar] [CrossRef] [Scilit]
- Zykova, A.; Savchenko, N.; Nikolaeva, A.; Panfilov, A.; Vorontsov, A.; Semenchuk, V.; Gurianov, D.; Kolubaev, E.; Tarasov, S. Effect of “ColdArc” WAAM Regime and Arc Torch Weaving on Microstructure and Properties of As-Built and Subtransus Quenched Ti-6Al-4V. Materials 2024, 17, 2325. [Google Scholar] [CrossRef] [Scilit]
- Meng, Y.; Yu, Q.; Wu, X.; Ye, Y.; Liao, J.; Guo, X.; Deng, A.; Chen, H. Deposition Stability and Forming Characteristics in Laser-Arc Hybrid Additive Manufacturing of Aluminum Alloy Through Beam Oscillation. Int. J. Precis. Eng. Manuf.-Green Technol. 2025, 12, 521–539. [Google Scholar] [CrossRef] [Scilit]
- Hussein, N.I.S.; Ket, G.C.; Rahim, T.A.; Ayof, M.N.; Abidin, M.Z.Z.; Abidin, M.Z.Z. Process and Heat Resources for Wire Arc Additive Manufacturing of Aluminium Alloy ER4043: A Review. J. Mech. Eng. 2023, 20, 21–41. [Google Scholar] [CrossRef] [Scilit]
- Sun, J.; Liu, L.; Zhang, L.; Liu, F.; Wang, D.; Yang, Y. Influence of Wire Arc Additive Manufacturing Parameters on the Morphology, Microstructure, and Hardness of DSS2209 Single-Bead Deposited Layers. Materials 2026, 19, 353. [Google Scholar] [CrossRef] [Scilit]
Disclaimer/Publisher’s Note: The statements, opinions and data contained in all publications are solely those of the individual author(s) and contributor(s) and not of MDPI and/or the editor(s). MDPI and/or the editor(s) disclaim responsibility for any injury to people or property resulting from any ideas, methods, instructions or products referred to in the content. |
© 2026 by the authors. Licensee MDPI, Basel, Switzerland. This article is an open access article distributed under the terms and conditions of the Creative Commons Attribution (CC BY) license.