


Abstract
The paper presents an experimental evaluation of the influence of infill direction (raster angle) on the tensile strength of 3D-printed ABS (Acrylonitrile Butadiene Styrene) samples produced at high speed (200 mm/s infill), flat orientation, and 100% infill density via FDM (Fused Deposition Modeling). The printing material was dried before printing and then stored in a low-humidity environment with desiccant in order to minimize moisture absorption during the experiments. The testing and conditioning of the samples were performed in accordance with the EN ISO 527 standard. The results revealed that the highest mean tensile strength of 39.28 MPa is obtained with the aligned rectilinear pattern at 0° infill direction, while the lowest, 34.56 MPa, is obtained with the same pattern at 90° infill direction relative to the load direction. The tested material demonstrated moderate tensile strength anisotropy in the direction of the load based on the change in infill direction. Moreover, productivity when printing ABS can be significantly increased when the correct conditions are available, as the resulting mean tensile strength is comparable to or higher than that reported by the filament’s producer, which recommends printing at low to moderate speeds for optimal layer adhesion and structural integrity.
Keywords:
FDM; 3D-printed; ABS; tensile strength; infill direction; orientation; high print speeds; influence 1. Introduction
As 3D printing (also known as additive manufacturing) has gained application in many industry fields such as automotive [1], space [2], medicine [3], building [4], and food [5], it has become increasingly important to evaluate the mechanical properties of printed polymeric materials under various printing conditions and with different printing parameters. Most often, the printing parameters varied in scientific studies are printing temperatures, infill patterns and density, model orientation and print angle relative to the print plate, layer height and thickness, as well as print speeds [6]. Other research fields regarding the mechanical properties of 3D-printed plastics that receive less attention yet are significant include testing of composite or multi-material and multi-color structures [7,8]; testing and treatment at elevated or cryogenic temperatures [9], and degradation and long-term aging in non-standard environments [10].
The infill direction (raster angle) is a particularly interesting printing parameter to vary, as it determines the inner structure of the printed part and directly influences its mechanical properties. Dziewit et al. in [11], for example, examined the tensile strength of FDM-printed specimens with infill directions in four variants—15°/−75°, 30°/−60°, 45°/−45°, and 0°/90°—for three filament types, namely PLA, ABS, and flexible. Analysis of the obtained stress–strain curves for PLA and ABS indicated consistent curve reproducibility with low standard deviation relative to the mean values. Higher mechanical strength was observed in the 15- and 30-degree samples, while the 45- and 90-degree samples exhibited greater plastic deformations. As for the flexible filament, the curves and plastic deformations varied significantly from case to case. Another study by Soni et al. [12] focused on effectively applying seed powder as a reinforcement for PLA to print a biocomposite whose mechanical properties were tested depending on the raster angle. The results revealed optimal tensile strength at 60° and optimal flexural strength at 45°. Analysis of the stress–strain curves revealed ductile behavior in all tested specimens.
In the aforementioned studies, the print speeds used were low (<50 mm/s). This low productivity, along with the anisotropic nature of additively manufactured polymers, is claimed to be among its main disadvantages in comparison to polymer injection molding. Nonetheless, as the machinery used for 3D printing improves, so does the efficiency of the process. 3D-printing speeds could be classified in the following categories:
- Low speeds: 30–50 mm/s;
- Moderate speeds: 50–150 mm/s;
- High speeds: 150–300 mm/s;
- Very high (hyper) speeds: >300 mm/s.
The maximum print speed is primarily limited by the maximum volumetric flow rate of the hotend. The higher the speed, the worse the interlayer bonding and therefore the higher the porosity of the printed part. And indeed, there is a growing body of research on the effect of print speed on the tensile strength of FDM printed materials, but it is not yet sufficient with regard to modern high-speed printing, as the technology that enables such speeds has become accessible just in the last few years—hence the reason for creating the current study. The article focuses on experimentally examining the influence of infill direction (raster angle) on the tensile strength of 3D-printed ABS (Acrylonitrile Butadiene Styrene), produced at a high infill speed (200 mm/s). The tensile strength values obtained are compared to those given by the filament’s producer. The study also aims to complement the available experimental data and to validate some existing results.
2. Materials and Methods
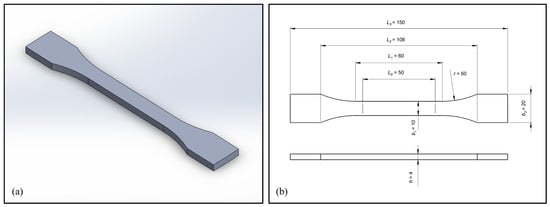
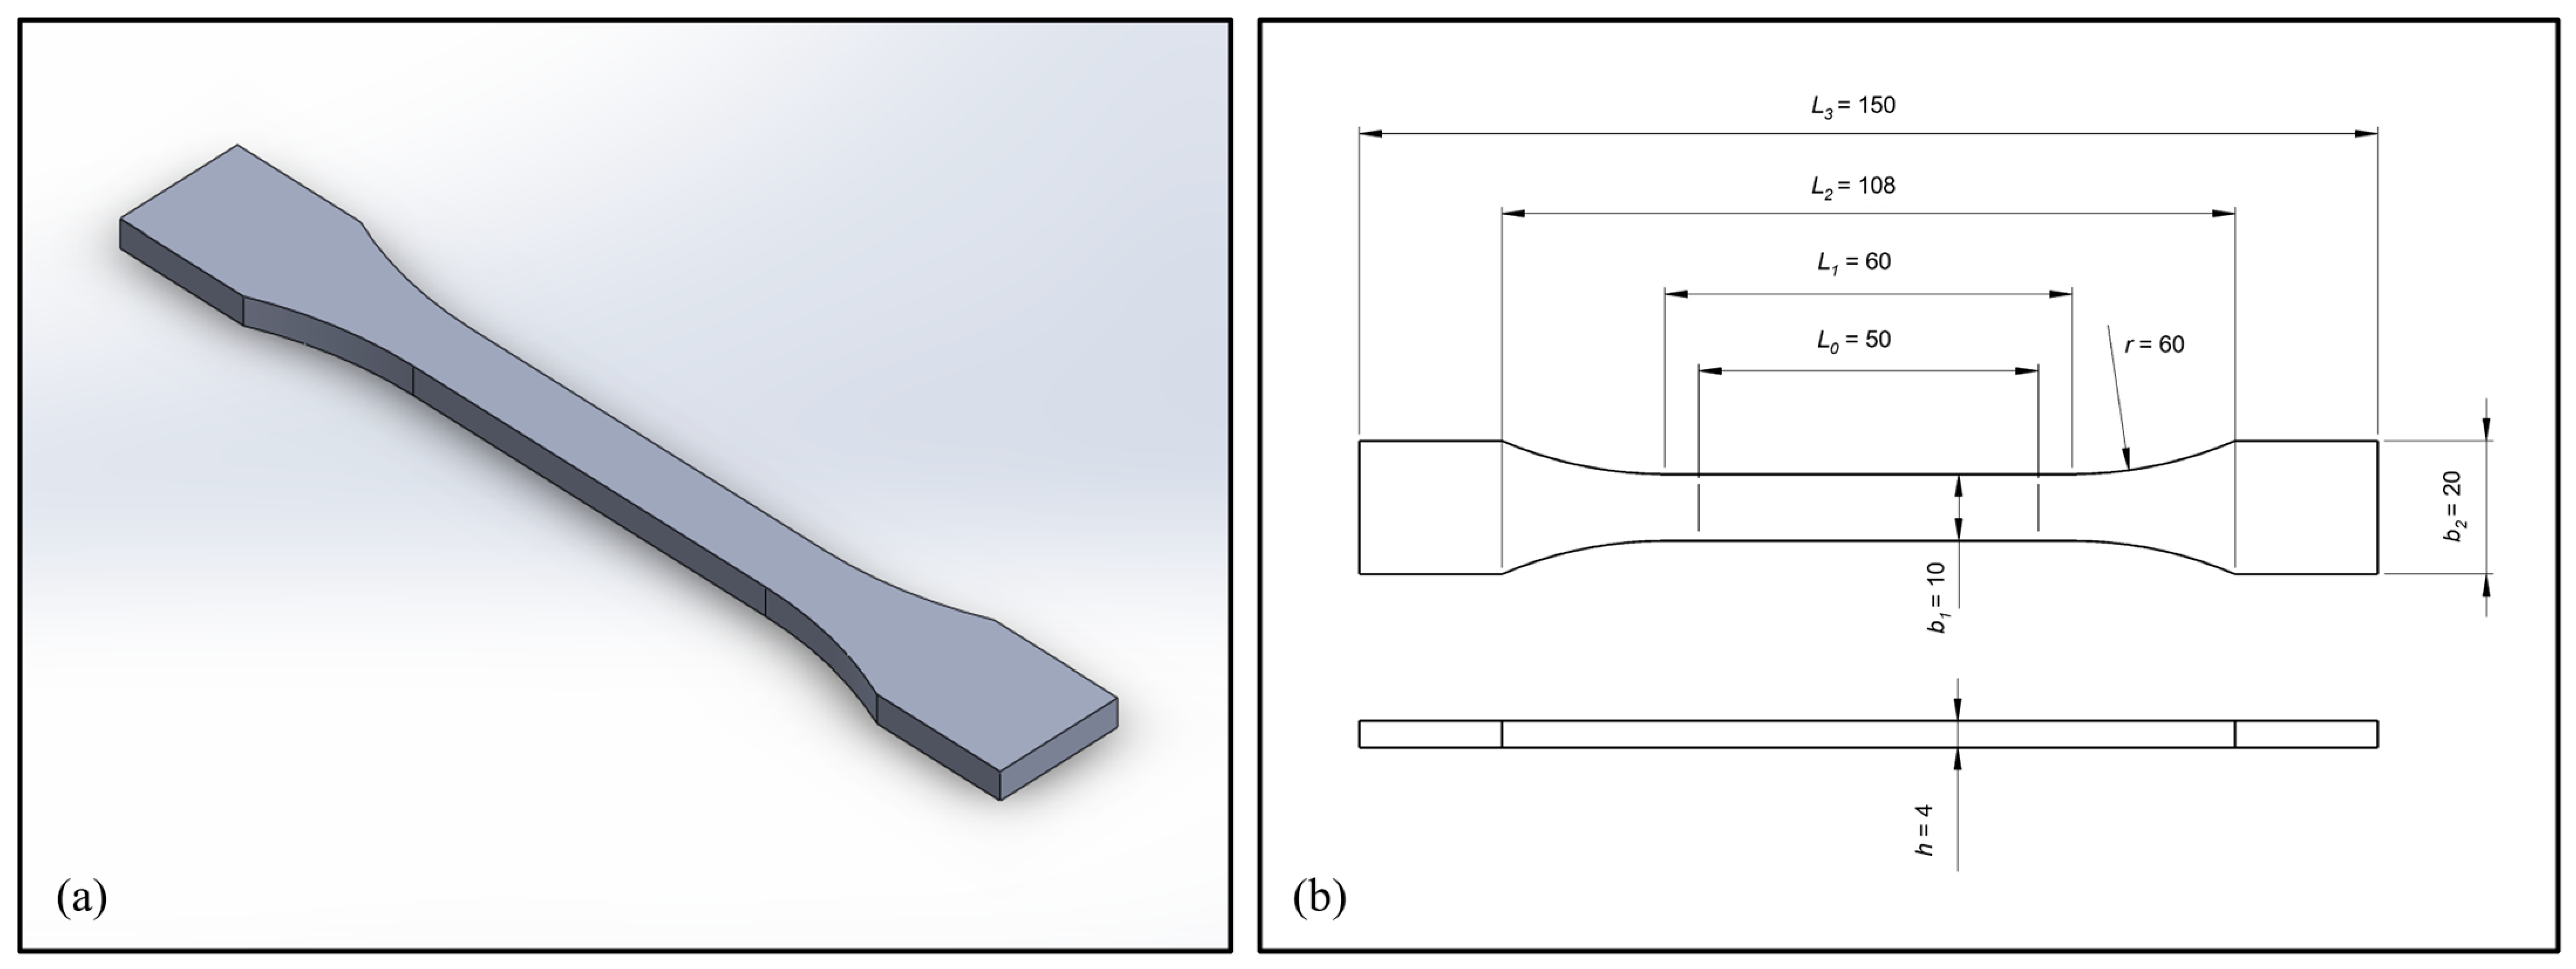
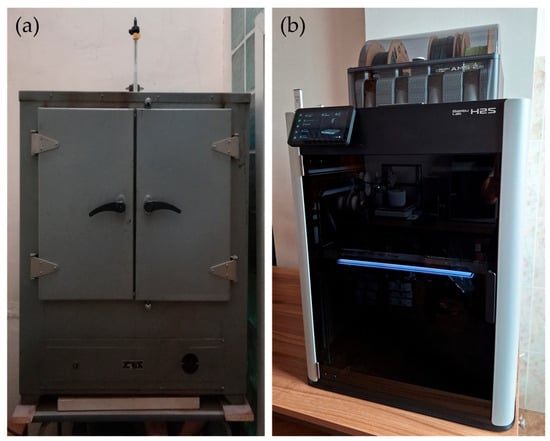
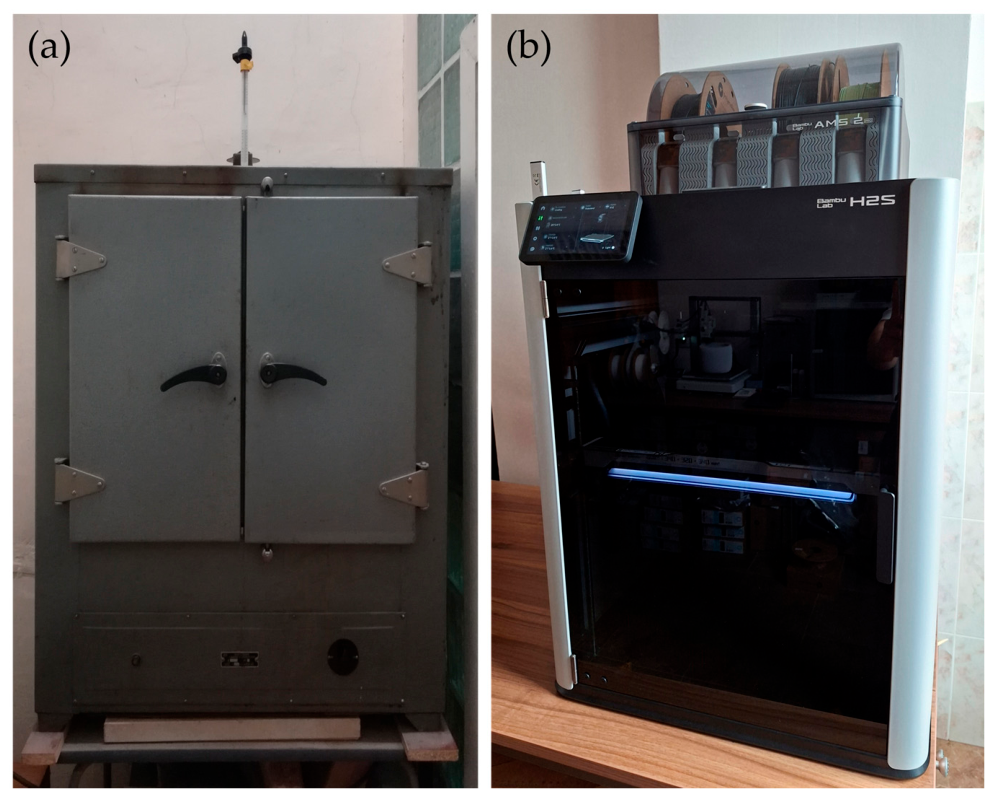
For the needs of the study, a tensile strength test specimen according to standard EN ISO 527 [13,14] was used (Figure 1). ABS was chosen as a test material due to its popularity as a lightweight thermoplastic with good mechanical properties and low cost, as well as its widespread use across many applications. Before printing, the filament roll was dried according to the manufacturer’s instructions for 6 h at 70 °C. A standard, non-high-speed type of ABS was used. An industrial dryer with a mercury thermometer was used for the procedure (Figure 2a). During the printing process, the filament roll was kept in a low-humidity environment (<10%). The samples were conditioned for 24 h at room temperature and humidity before being tested. The 3D printer used was a Bambu Lab H2S Combo (Manufacturer: Bambu Lab, Shenzhen, China), shown in Figure 2b. Self-calibration, consisting of bed leveling and flow testing, was initiated each time before printing the specimens.
Figure 1.
A 3D model (a) and a drawing (b) of the tensile strength test sample used.
Figure 2.
Industrial dryer (manufacturer: OM3-COΦИЯ, Sofia, Bulgaria) for filament spool drying (a) and 3D printer (manufacturer: Bambu Lab, Shenzhen, China) used for production of specimens (b).
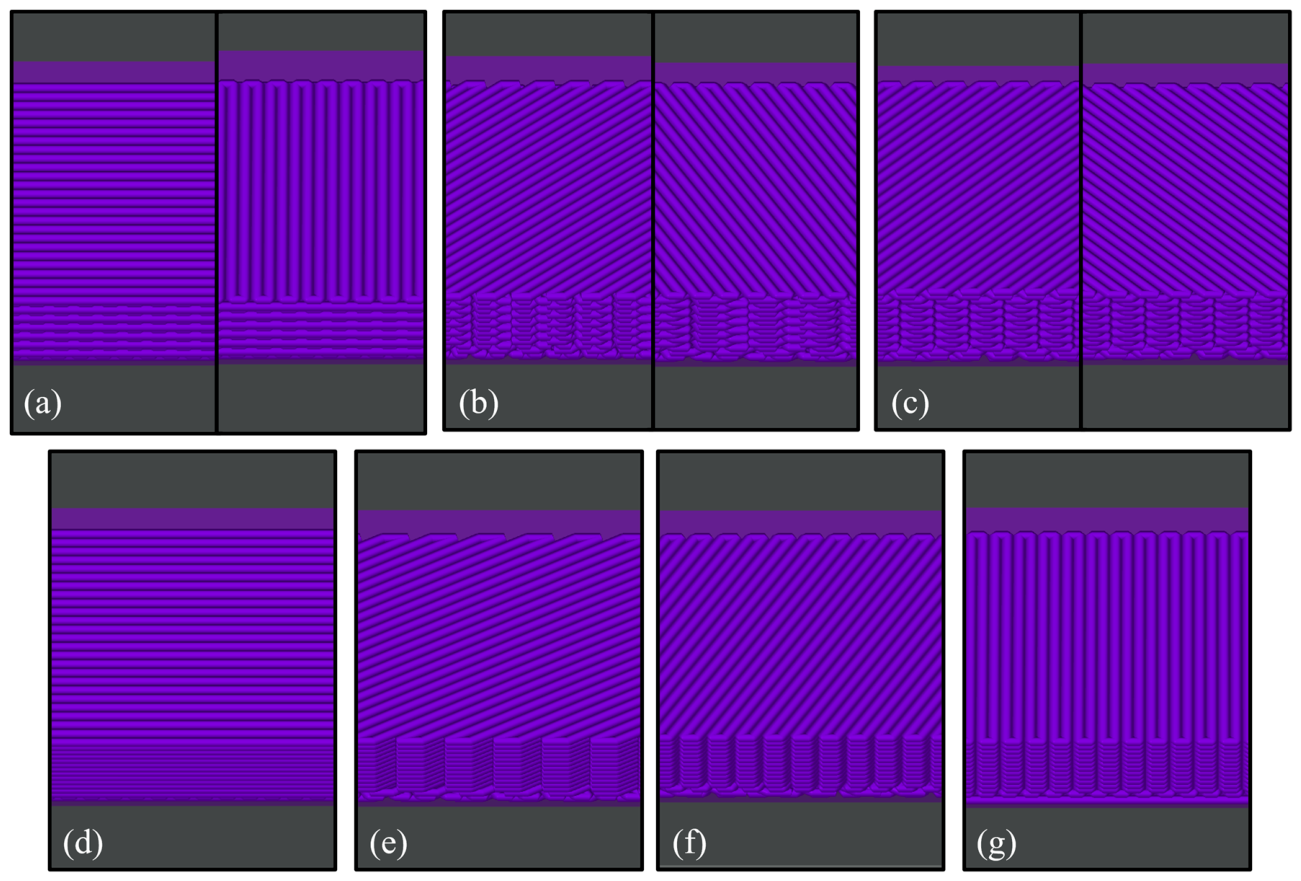
The tested samples were printed flat at 100% infill and 50% infill/wall overlap in order to mitigate void formation. The slicer software allowed only a rectilinear infill pattern at 100% infill density. Therefore, 7 different variants regarding the infill direction and 35 specimens in total were tested. The tests were performed at room temperature (20 °C). The first 3 variants used every 2 layers, with infill directions crisscrossing at varying angles, as recommended by the slicer software to increase strength in both X and Y directions. The other 4 cases examine aligned rectilinear infill directions with all infill layers being the same. The studied infill directions with respect to the load direction were the following:
- Standard rectilinear (crisscross) 0/90°—(a);
- Standard rectilinear (crisscross) 30/60°—(b);
- Standard rectilinear (crisscross) 45/45°—(c);
- Aligned rectilinear 0°—(d);
- Aligned rectilinear 30°—(e);
- Aligned rectilinear 60°—(f);
- Aligned rectilinear 90°—(g).
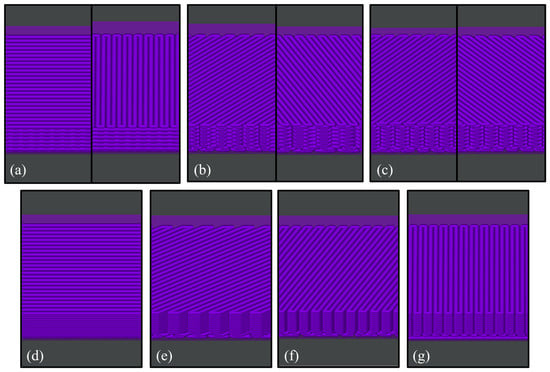
A photo of the infill direction variants from the slicer software is presented in Figure 3.
Figure 3.
Infill directions with respect to the load direction from the slicer software. (a) Rectilinear 0/90°; (b) rectilinear 30/60°; (c) rectilinear 45/45°; (d) aligned rectilinear 0°; (e); aligned rectilinear 30°; (f) aligned rectilinear 60°; (g) aligned rectilinear 90°.
The printhead fans were turned off during printing, while the printer chamber was heated and kept constantly at 60 °C to prevent the ABS polymer from cooling too quickly. The nozzle temperature for all layers was 255 °C, and the plate temperature for all layers was 90 °C. Even though the sparse infill setting was set to 350 mm/s, the actual printing speed was 200 mm/s, as confirmed by the slicing results, due to limitations such as layer height and maximum volumetric flow rate. As of May 2026, the filament manufacturer recommends 30–50 mm/s print speeds for optimal structural integrity and layer adhesion, as indicated on the filament’s box and producer’s webpage [15], while in the technical data sheets, the 50–200 mm/s range is written. The remaining printing parameters are listed in Table 1.
Table 1.
Print parameters of the specimens except for the infill direction.
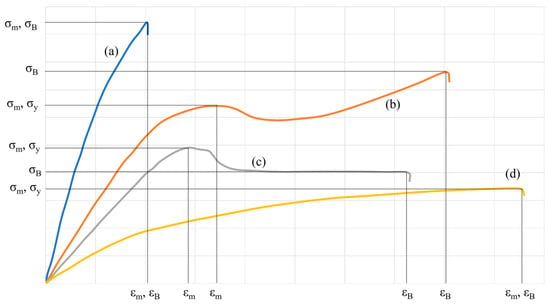
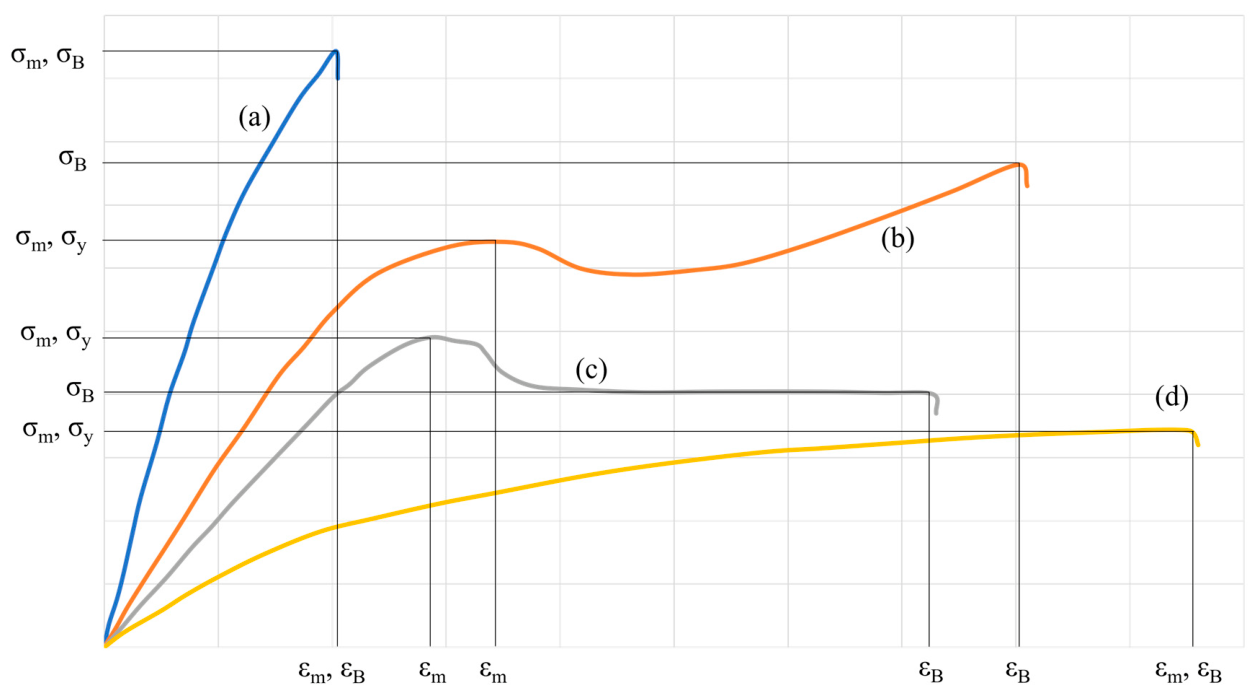
The stress–strain curve of the material is generated by testing it in accordance with the EN ISO 527 standard. Figure 4 gives a typical stress–strain curve for plastics, where (a) corresponds to brittle plastics; (b) is for rough plastics with strain hardening; (c) is for rough plastics with yield strength; and (d) is for elastomers. From the curve, the following mechanical characteristics are determined:
Figure 4.
Typical stress–strain curves for different types of plastics.
- Yield strength σy in MPa;
- Tensile strength σm in MPa;
- Tensile stress at failure σB in MPa;
- Tensile strain at tensile strength εm in %;
- Tensile strain at failure εB in %;
- Elasticity modulus E in GPa.
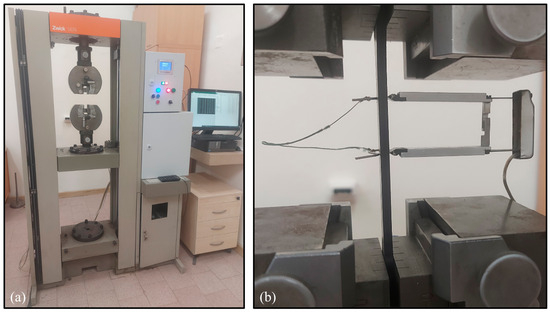
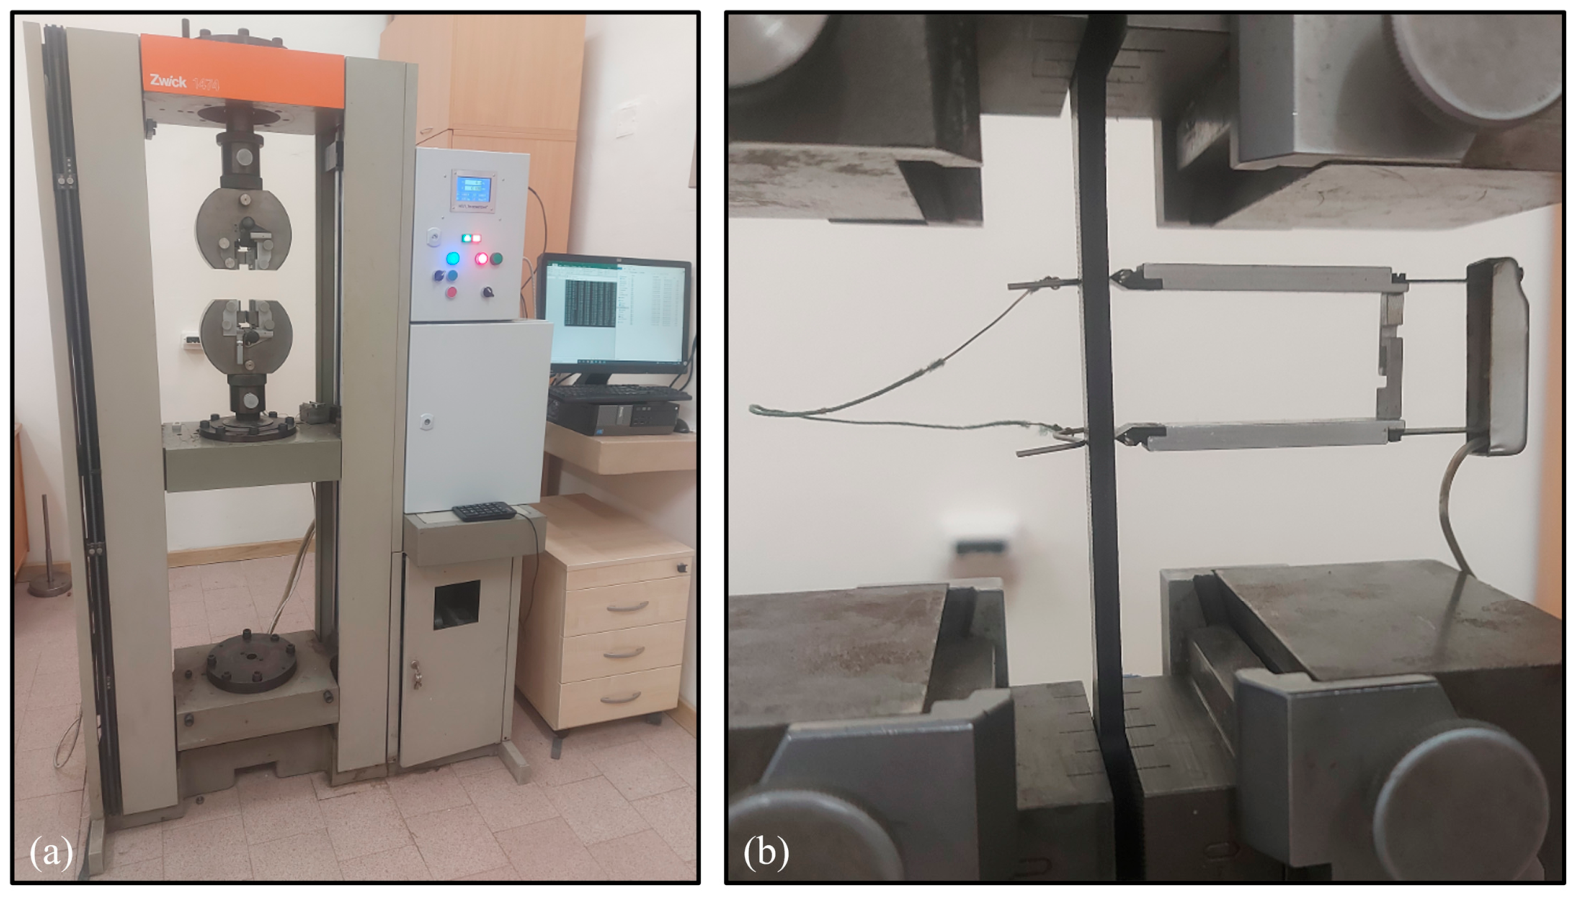
A standard universal testing machine, Zwick 1474-modernized (Manufacturer: ZwickRoell GmbH & Co. KG, Ulm, Germany), was used for the study, comparable to machines from other studies [16]. It is equipped with a servo-controlled loading mechanism, enabling precise digital control of the loading (Figure 5a). An extensometer with a 25 mm measuring length was mounted on the test specimens to evaluate longitudinal deformations (Figure 5b). According to the standard, at least 5 specimens should be tested. The modulus is calculated from the slope of the initial linear section of the stress–strain curve in the interval ε1 = 0.05% and ε2 = 0.25%, in accordance with the ISO 527 standard.
Figure 5.
Machine for tensile strength testing (a) and an extensometer mounted on a specimen (b) used in the study.
3. Results
During tensile strength testing, the force and elongation readings from the extensometer were recorded. The obtained results, shown in Table 2, were used for constructing the stress–strain curves.
Table 2.
Results of the study for each specimen tested.
Mechanical testing results exhibit natural variability; therefore, statistical methods were used to ensure objective interpretation. For all experimental groups, the mean values, standard deviations (SDs), and coefficients of variation (CVs) were calculated and presented in Table 3.
Table 3.
Statistical analysis of all tested infill direction cases in the study.
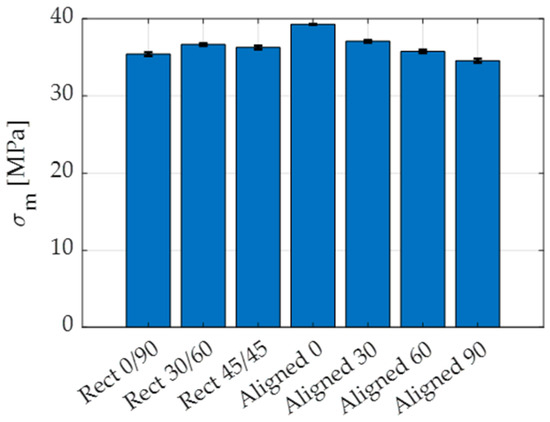
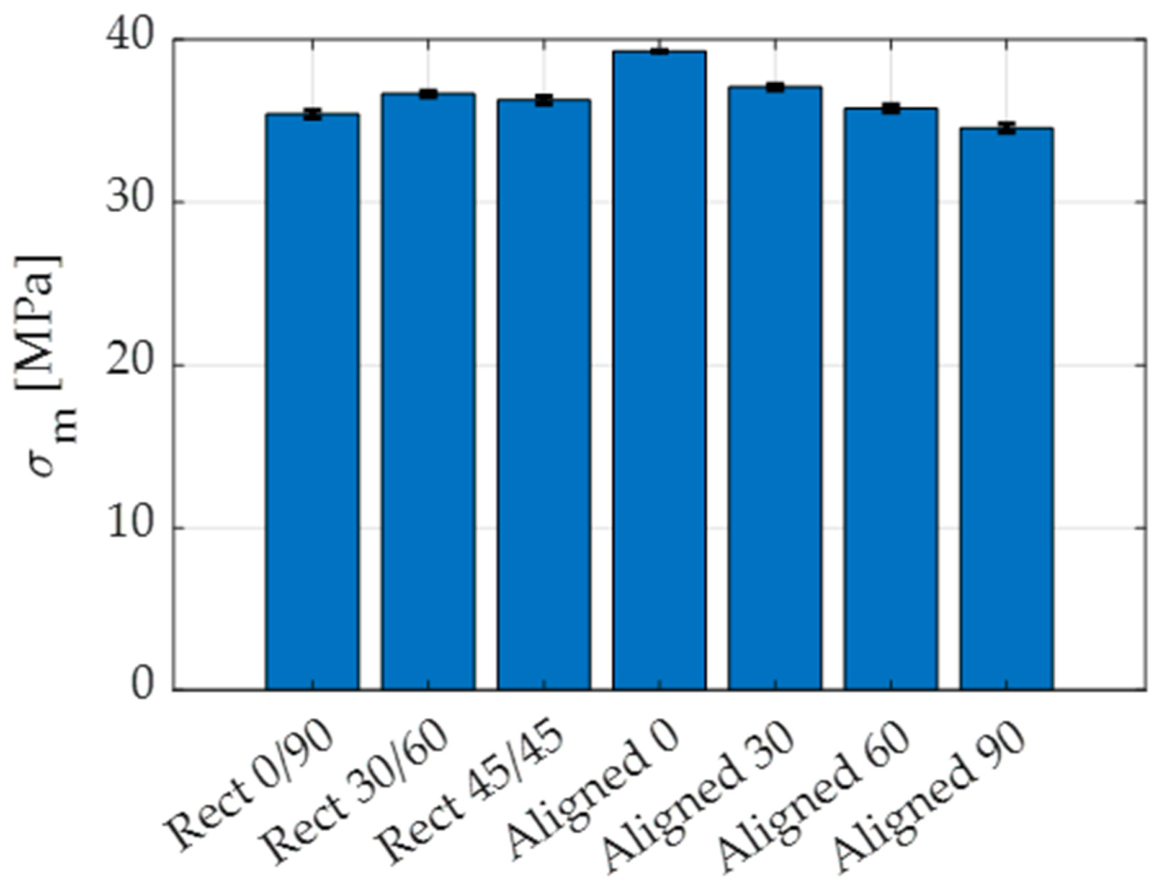
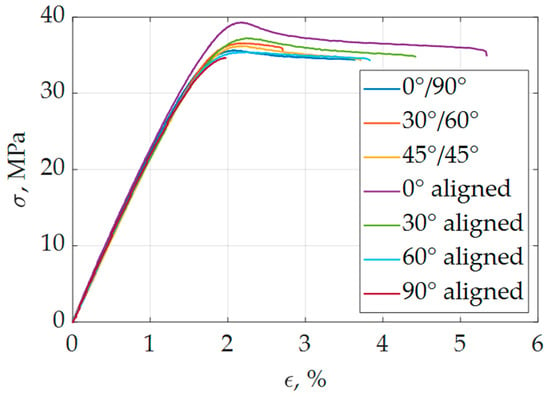
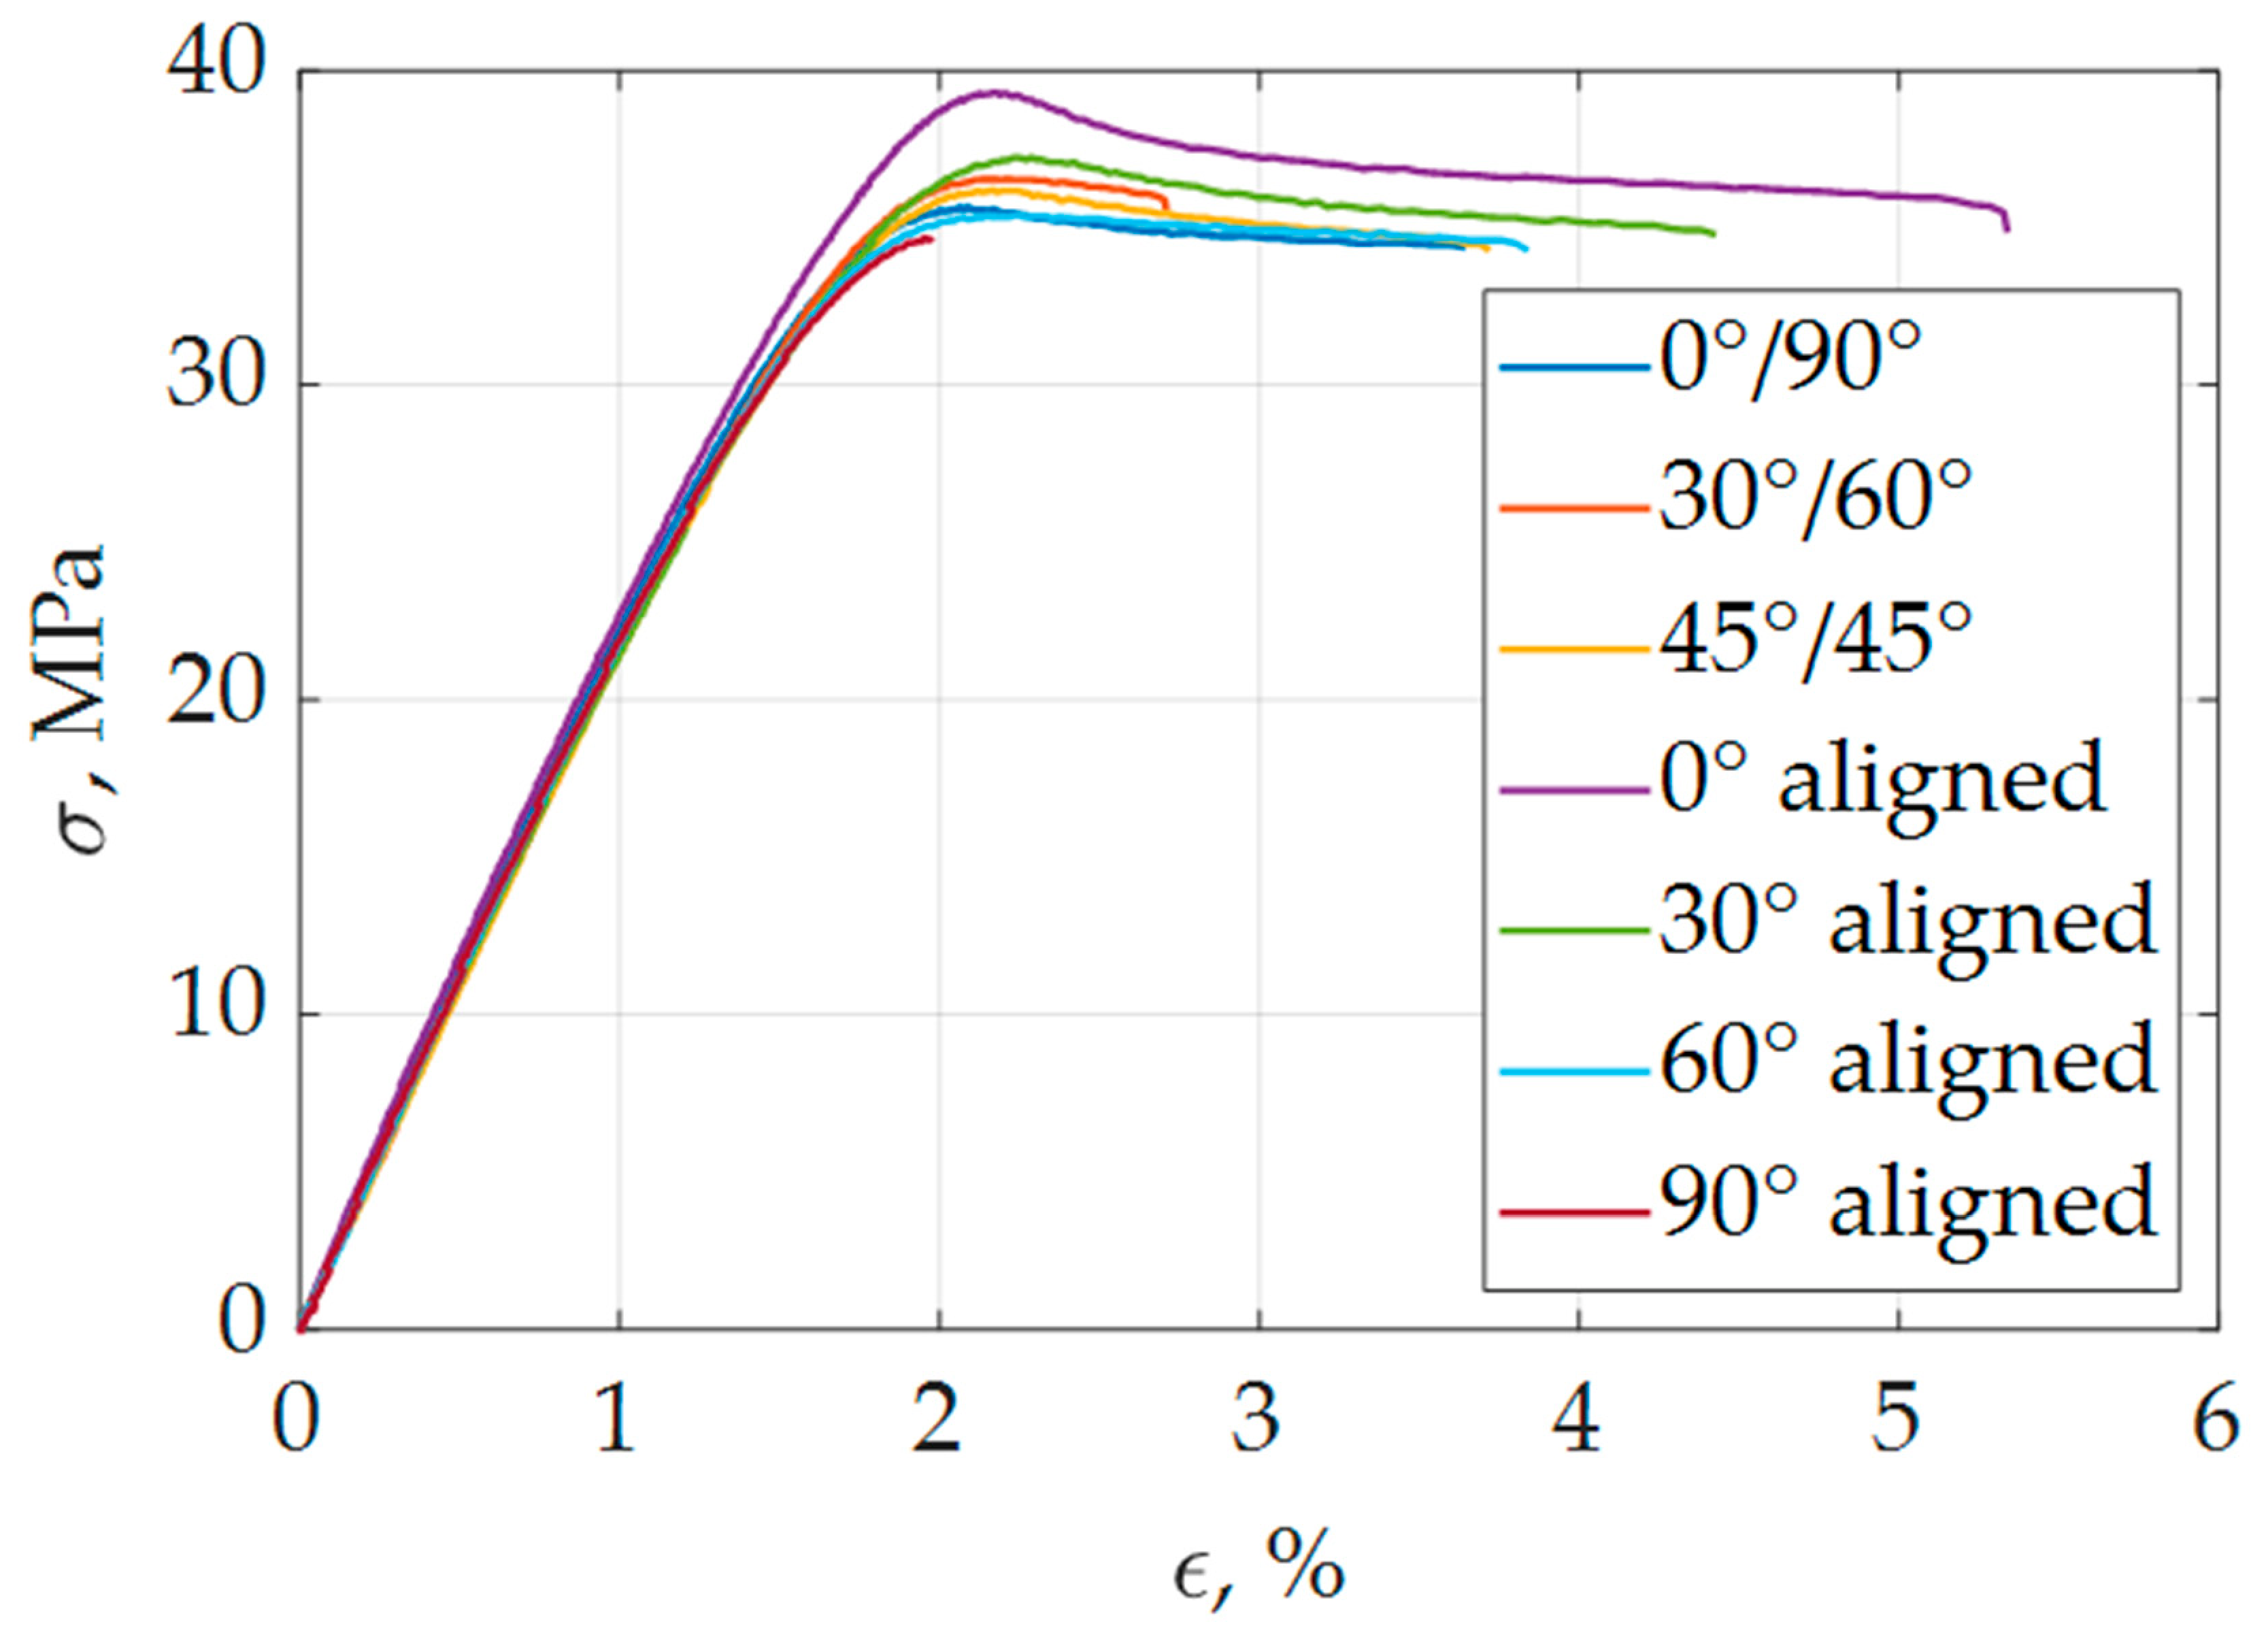
To provide a clearer comparison of the obtained tensile strength values, the average results with the standard deviation bars are presented in Figure 6. In order to determine whether the printed material is brittle or ductile, stress–strain curves for each case were plotted (Figure 7). For the curves, the sample destruction occurred outside the extensometer’s measuring length. From the curves, the tensile strength σm, tensile strain at tensile strength εm, and elasticity modulus E were determined.
Figure 6.
Mean values of the tensile strength and standard deviations for all examined cases.
Figure 7.
Stress–strain curves for all given variants of the infill direction. For the given curves, the sample destruction occurred outside the extensometer’s measuring length.
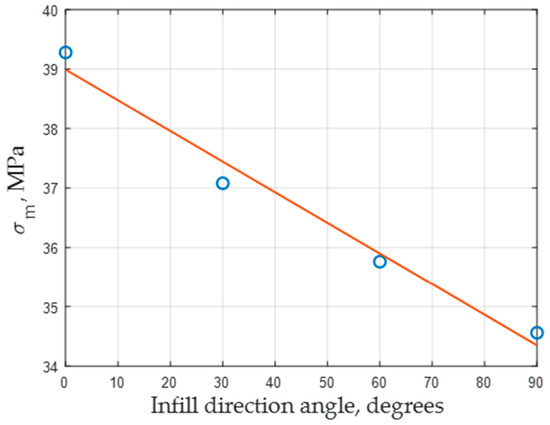
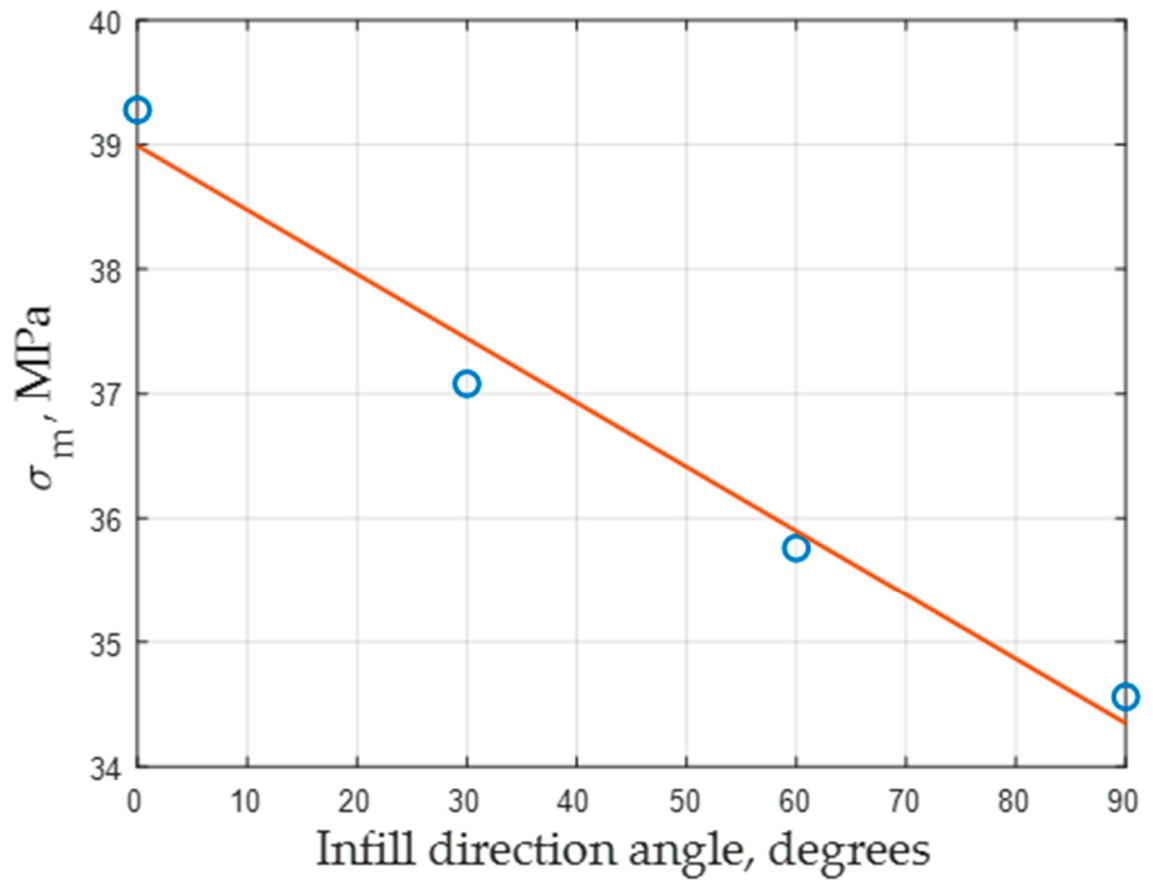
Additionally, linear regression analysis was performed for the aligned rectilinear cases (Figure 8).
Figure 8.
Linear regression analysis for the aligned rectilinear cases.
4. Discussion and Conclusions
The results indicate the highest tensile strength at 0° aligned rectilinear infill direction relative to the load direction, with an average value of 39.28 MPa—case (d). Accordingly, the lowest values are observed at the 90° aligned rectilinear infill direction—case (g)—with an average of 34.56 MPa. The second value is about 12% lower than the first, which is not significant, even though in case (g) the infill is printed widthwise to the load direction. Therefore, it could be concluded that the ABS material tested retains moderate isotropy in the studied instance. Moreover, the 30° aligned rectilinear infill direction shows higher possible tensile strength values than the 60° one. These results for the aligned rectilinear infill direction reveal a decreasing linear trend in tensile strength with increasing raster angle, as shown in Figure 8. For the crisscross infill directions, the average strength values are almost identical, with the 30/60° displaying the highest tensile strength. The lowest value for the crisscross variants occurs at a 0/90° raster angle because half of the infill layers are being printed at 90° relative to the load direction. The comparatively low SD and CV values confirm good repeatability of the experimental procedure and low scattering of the measured results.
The tensile strain at tensile strength εm decreases for the aligned rectilinear patterns as the infill direction angle increases (case (e) to case (g)), with the only exception being the 0° one, which has a lower value than the 30° one (2.19% compared to 2.24%). The elasticity modulus decreases likewise to the tensile strength, indicating that the sample is the stiffest at 0° aligned rectilinear infill direction. For the crisscross variations, the values are close to identical (2.24 GPa and 2.27 GPa), but the tendency is not the same as with the aligned rectilinear pattern.
All cases exhibit a stress–strain curve that classifies them as rough plastics with yield strength, except for case (g), where the material acts as a brittle plastic, according to Figure 7. This phenomenon is due to all infill layers being widthwise to the load direction, which implies instant breakage at σm instead of stretching of the print fibers and thus elongation of the sample. Overall, the strong influence of infill direction on tensile strength is confirmed.
The filament producer states 33.4 ± 0.6 MPa tensile strength and 2.25 ± 0.06 GPa elasticity modulus in the X-Y orientation. In the current study, the obtained results for strength are higher, while for modulus, the same holds based on the overall mean value calculated across all cases. The higher strength values may be due to better material drying or greater infill overlap in the tested specimens, although this parameter is not discussed in the producer’s technical sheets. However, in the current study, the adopted print speeds are higher than the recommended ones. Therefore, it is correct to conclude that the tensile strength remains the same even at print speeds of 200 mm/s, which is a prerequisite for increasing the productivity of the process.
For future studies, the research team would focus on tensile-strength testing of specimens printed at hyper speeds (>300 mm/s) and on evaluating them depending on the print orientation (flat, on-edge, upright) and the orientation angle relative to the build plate.
Author Contributions
T.G.: conceptualization, investigation, resources, writing—original draft preparation; V.T.: conceptualization, writing—review and editing, data curation and supervision; N.K.: investigation, writing—review and editing, and validation; V.R.: writing—review and editing, visualization, formal analysis; K.N.: supervision, resources, funding acquisition. All authors have read and agreed to the published version of the manuscript.
Funding
This research was funded by the scientific research project No. 253CH0001-04 “Development of infrastructure and environment for aerospace education and research at TU-Sofia/INSATUS/” by the contract with “Research and development sector at TU-Sofia”.
Institutional Review Board Statement
Not applicable.
Informed Consent Statement
Not applicable.
Data Availability Statement
The raw data supporting the conclusions of this article will be made available by the authors on request.
Acknowledgments
The author K. Nedelchev is thankful to the National Center of Excellence “Mechatronics and Clean Technologies” (BG05M2OP001-1.001-0008), supported by the European Regional Development Fund, for providing the materials used for the experiments in thise study. The authors would like to thank to Tenyo Tenev from the Faculty of Transport at TU-Sofia for the assistance in the drying of the filament rolls.
Conflicts of Interest
The authors declare no conflicts of interest. The funders had no role in the design of the study; in the collection, analyses, or interpretation of data; in the writing of the manuscript; or in the decision to publish the results.
References
- Yang, J.; Li, B.; Liu, J.; Tu, Z.; Wu, X. Application of Additive Manufacturing in the Automobile Industry: A Mini Review. Processes 2024, 12, 1101. [Google Scholar] [CrossRef] [Scilit]
- Mao, M.; Meng, Z.; Huang, X.; Zhu, H.; Wang, L.; Tian, X.; He, J.; Li, D.; Lu, B. 3D Printing in Space: From Mechanical Structures to Living Tissues. Int. J. Extrem. Manuf. 2024, 6, 023001. [Google Scholar] [CrossRef] [Scilit]
- Brancewicz-Steinmetz, E.; Słabęcka, N.; Śniarowski, P.; Wybrzak, K.; Sawicki, J. Surface Structure Modification in Fused Filament Fabrication (FFF) Multi-Material Printing for Medical Applications: Printing of a Hand Prosthesis. 3D Print. Addit. Manuf. 2024, 11, 1972–1980. [Google Scholar] [CrossRef] [Scilit] [PubMed]
- Pan, Y.; Zhang, Y.; Zhang, D.; Song, Y. 3D Printing in Construction: State of the Art and Applications. Int. J. Adv. Manuf. Technol. 2021, 115, 1329–1348. [Google Scholar] [CrossRef] [Scilit]
- Xiao, S.; Yang, J.; Bi, Y.; Li, Y.; Cao, Y.; Zhou, M.; Pang, G.; Dong, X.; Tong, Q. Food 3D Printing Equipment and Innovation: Precision Meets Edibility. Foods 2025, 14, 2066. [Google Scholar] [CrossRef] [Scilit] [PubMed]
- Algarni, M.; Ghazali, S. Comparative Study of the Sensitivity of PLA, ABS, PEEK, and PETG’s Mechanical Properties to FDM Printing Process Parameters. Crystals 2021, 11, 995. [Google Scholar] [CrossRef] [Scilit]
- Baca Lopez, D.M.; Ahmad, R. Tensile Mechanical Behaviour of Multi-Polymer Sandwich Structures via Fused Deposition Modelling. Polymers 2020, 12, 651. [Google Scholar] [CrossRef] [Scilit] [PubMed]
- Zagorski, M.; Miltchev, R.; Dochev, B.; Stoimenov, N. Approaches to Creating Colorful 3D-Printed Parts and Reliefs. Eng. Proc. 2025, 100, 9. [Google Scholar] [CrossRef] [Scilit]
- Fekiač, J.J.; Kakošová, L.; Krbata, M.; Kohutiar, M.; Studeny, Z.; Mikuš, P.; Viliš, J.; Breznická, A. Effects of Printing Angle, Infill Density and Cryogenic Pre-Treatment on the Tensile and Flexural Properties of FFF-Printed PLA. J. Manuf. Mater. Process. 2025, 9, 365. [Google Scholar] [CrossRef] [Scilit]
- Ghabezi, P.; Flanagan, T.; Walls, M.; Harrison, N.M. Degradation Characteristics of 3D Printed Continuous Fibre-Reinforced PA6/Chopped Fibre Composites in Simulated Saltwater. Prog. Addit. Manuf. 2025, 10, 725–738. [Google Scholar] [CrossRef] [Scilit] [PubMed]
- Dziewit, P.; Rajkowski, K.; Płatek, P. Effects of Building Orientation and Raster Angle on the Mechanical Properties of Selected Materials Used in FFF Techniques. Materials 2024, 17, 6076. [Google Scholar] [CrossRef] [Scilit] [PubMed]
- Soni, A.; Veeman, D.; Katiyar, J.K. Effect of Raster Angles on Mechanical Properties and Failure Analysis of 3D Printed Tamarindus Indica Seed Powder/ Polylactic Acid (PLA) Biocomposites. Mater. Today Commun. 2026, 51, 114809. [Google Scholar] [CrossRef] [Scilit]
- BDS EN ISO 527-1:2020; Plastics—Determination of Tensile Properties—Part 1: General Principles. Bulgarian Institute for Standardization (BDS): Sofia, Bulgaria, 2020.
- BDS EN ISO 527-2:2012; Plastics—Determination of Tensile Properties—Part 2: Test Conditions for Moulding and Extrusion Plastics. Bulgarian Institute for Standardization (BDS): Sofia, Bulgaria, 2020.
- PolyLiteTM ABS. Available online: https://polymaker.com/product/polylite-abs/ (accessed on 1 May 2026).
- Dochev, B.; Dimova, D.; Panov, I.; Boichev, Y. Investigation of the Structure and Mechanical Properties of Alloys AlSi25Cu4Cr and AlSi25Cu5Cr Alloyed with Refractory Metals. AIP Conf. Proc. 2024, 3129, 040001. [Google Scholar] [CrossRef] [Scilit]

Disclaimer/Publisher’s Note: The statements, opinions and data contained in all publications are solely those of the individual author(s) and contributor(s) and not of MDPI and/or the editor(s). MDPI and/or the editor(s) disclaim responsibility for any injury to people or property resulting from any ideas, methods, instructions or products referred to in the content. |
© 2026 by the authors. Licensee MDPI, Basel, Switzerland. This article is an open access article distributed under the terms and conditions of the Creative Commons Attribution (CC BY) license.