


Abstract
This article presents an experimental study aimed at determining the optimal printing temperatures for the nozzle and the build plate when printing ABS by evaluating the geometric accuracy of the parts. The recommended printing temperatures were analyzed, and various operating temperature regimes were selected for the nozzle and the build plate. The experimental part is based on single-factor and two-factor experiments. An analysis of the manufacturing process was also performed. Despite the experimental determination of the optimal temperatures, the manufactured parts do not meet the specified tolerances. Further research is needed to determine the shrinkage coefficient and to make corrections to the initial model.
1. Introduction
Additive manufacturing by fused deposition modeling (FDM) has become a widely adopted route for producing functional polymer components with complex geometries, including rotating and sliding elements such as bushings and shafts. Acrylonitrile–butadiene–styrene (ABS) remains a common FDM material owing to its favorable balance of toughness, thermal resistance and processability; however, its relatively high shrinkage during cooling, coupled with complex thermal histories during deposition, makes it difficult to achieve tight dimensional tolerances, particularly on cylindrical inner and outer diameters (ID/OD).
A substantial body of work has shown that FDM dimensional accuracy is strongly governed by process parameters, especially layer height, print speed, infill, and thermal setpoints such as nozzle (extrusion) and build-plate (bed) temperatures. Several experimental and optimization studies on ABS have demonstrated that these parameters jointly affect both mechanical performance and geometric fidelity of printed parts, often in conflicting ways [1,2,3,4]. For example, Nathaphan and Trutassanawin analyzed six process parameters for standard cylindrical ABS compression specimens—nozzle temperature, bed temperature, number of shells, layer height, printing speed, and build orientation—and reported that high bed temperatures combined with low layer height, low speed and few shells maximized both compressive yield stress and dimensional accuracy [1]. Similarly, Tanoto et al. used a Taguchi L9 design with nozzle temperature, bed temperature and build orientation as factors, and multiresponse optimization (PCR–TOPSIS) including dimensional accuracy as one of the quality metrics; they found that bed temperature had a larger influence than nozzle temperature, and that a combination of relatively low nozzle temperature (230 °C) with high bed temperature (110 °C) and 90° orientation provided the best overall compromise between flexural strength, dimensional accuracy and processing time [2].
More focused investigations have examined the specific roles of nozzle and bed temperatures. Vaid et al. studied ABS cylindrical shafts printed by FDM and explicitly varied extrusion temperature and build-plate temperature, building an artificial-intelligence prediction model to identify temperature combinations that minimized dimensional variation of the shaft [5]. Although their work did not consider internal bores, it provides a direct demonstration that temperature alone—especially the combination of nozzle and bed setpoints—can be used as a primary control knob to reduce dimensional fluctuation in cylindrical ABS parts [5]. Ulkir et al., in a broader nozzle-temperature sweep (220–270 °C) on ABS tensile specimens, used ANOVA to show that nozzle temperature significantly affects both dimensional properties (length, width, thickness, mass) and mechanical strength, reinforcing the idea that melt temperature and viscosity changes translate into measurable dimensional shifts even when the bed temperature is held fixed [3].
At a more mechanistic level, Mosleh et al. combined COMSOL-based thermo-fluid simulations with experiments on single ABS strands to show that, while increasing nozzle temperature and layer thickness raise local temperatures near the nozzle, the build-platform temperature is the dominant determinant of the overall layer temperature for low layer thicknesses [6]. This finding supports the empirical observation from multiple studies that bed temperature exerts a strong influence on warpage, dimensional stability and circularity in thermoplastic FDM [1,2,4,7]. In composite systems, Hao et al. reported that increasing platform temperature improved interlayer adhesion, but excessive bed temperatures and printing temperatures could induce deformation; for ABS/carbon-fiber composites, they identified an optimum around 240 °C nozzle and 110 °C bed, with dimensional deviations on the order of 0.02–0.39 mm relative to nominal geometry [7]. Collectively, these works suggest that high bed temperatures near the upper end of the ABS processing window, combined with moderate nozzle temperatures, are often beneficial for dimensional control, provided that gross warpage is avoided.
Beyond ABS, related studies on PLA parts provide useful methodological guidance for quantifying cylindrical and circular features. Baraheni et al. investigated the effects of nozzle temperature, print speed and infill percentage on dimensional accuracy and surface quality of PLA components, explicitly quantifying inner and outer ovality as measures of deviation from perfect circularity; they found that increased nozzle temperature and infill, and reduced print speed, substantially improved both inner and outer ovality [8]. Alatefi et al. applied response surface methodology (RSM) and multivariate process capability indices to optimize extruder temperature, plate temperature, layer thickness and printing speed for cylindrical PLA compression specimens, jointly considering dimensional characteristics (length and diameter) and compressive properties [9]. Although these PLA studies are not directly transferable in terms of material behavior, they illustrate robust statistical frameworks and geometric metrics—ovalisation, circularity, and capability-based tolerance assessment—that are well suited to the analysis of bushing-like ABS parts.
Recent reviews of FDM process-parameter optimization further emphasize that, across a variety of materials and geometries, nozzle and bed temperatures consistently emerge as key determinants of dimensional accuracy, circularity and warpage, even when embedded in larger multi-parameter Taguchi or RSM designs [4]. Nevertheless, the existing ABS literature remains fragmented with respect to the specific problem of achieving tight ID/OD tolerances in bushing-like geometries: most studies either focus on solid cylinders [1,5], non-cylindrical specimens [3,10], composite materials [7], or multi-factor optimizations where nozzle and bed temperature effects are not isolated [1,2,4]. Moreover, explicit modeling of inner-diameter deviation, ovality and taper as functions of nozzle and bed temperatures is largely absent in ABS, with available circularity metrics developed primarily in PLA contexts [8,9]. This gap motivates a more targeted investigation of nozzle–bed temperature combinations for ABS bushings, under tightly controlled non-thermal parameters, using statistically rigorous design-of-experiments and response surface modeling to map and optimize ID/OD dimensional accuracy and tolerance achievement.
The present article details a study that is conducted with the objective of ascertaining the optimal printing temperatures for ABS in relation to geometric accuracy. The component selected for fabrication is of the bushing variety, and its manufacture is undertaken through the utilization of FDM additive printing technology. The experimental study is conducted in accordance with the methodology for a planned experiment. An investigation is conducted with the objective of an analysis of the technological process with regard to stability, capability and tunability.
2. Materials and Methods
- Used material
Acrylonitrile–butadiene–styrene (ABS) is a widely used engineering thermoplastic in fused filament fabrication because it offers a practical balance of stiffness and toughness, but printed parts are often anisotropic (weaker across layers than along rasters) due to interlayer interfaces and internal voids [11,12]. ABS is amorphous (no true melting point), and its printing behavior is strongly influenced by its glass transition temperature TgTg, which for common commercial filaments is typically around 110–115 °C; maintaining deposited material warm enough (near/above TgTg) helps interlayer bonding [13,14]. During printing, ABS melts are shear-thinning and viscoelastic, meaning flow depends strongly on temperature and shear rate and can vary by grade/formulation—this affects extrusion stability and bead geometry [15]. More generally, published work emphasizes that “ABS filament” is not a single material: differences in formulation (molecular weight, additives, pigment packages) can shift the processing window and help explain why “optimal” print parameters differ between studies and products [16]. The technical properties of ABS are shown in Table 1. Recommended printing setting—Table 2.
Table 1.
ASB properties [17].
Table 2.
Recommended printing settings [17].
- Printed detail
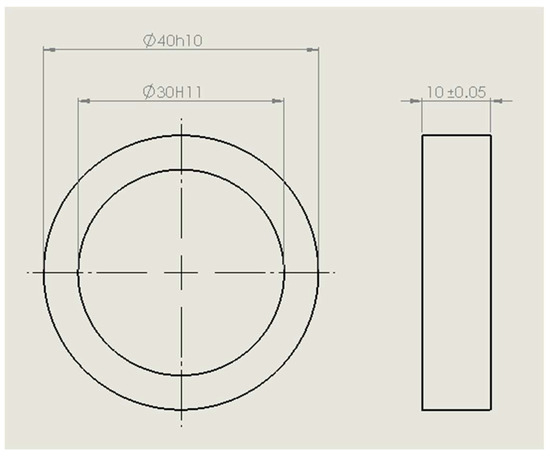
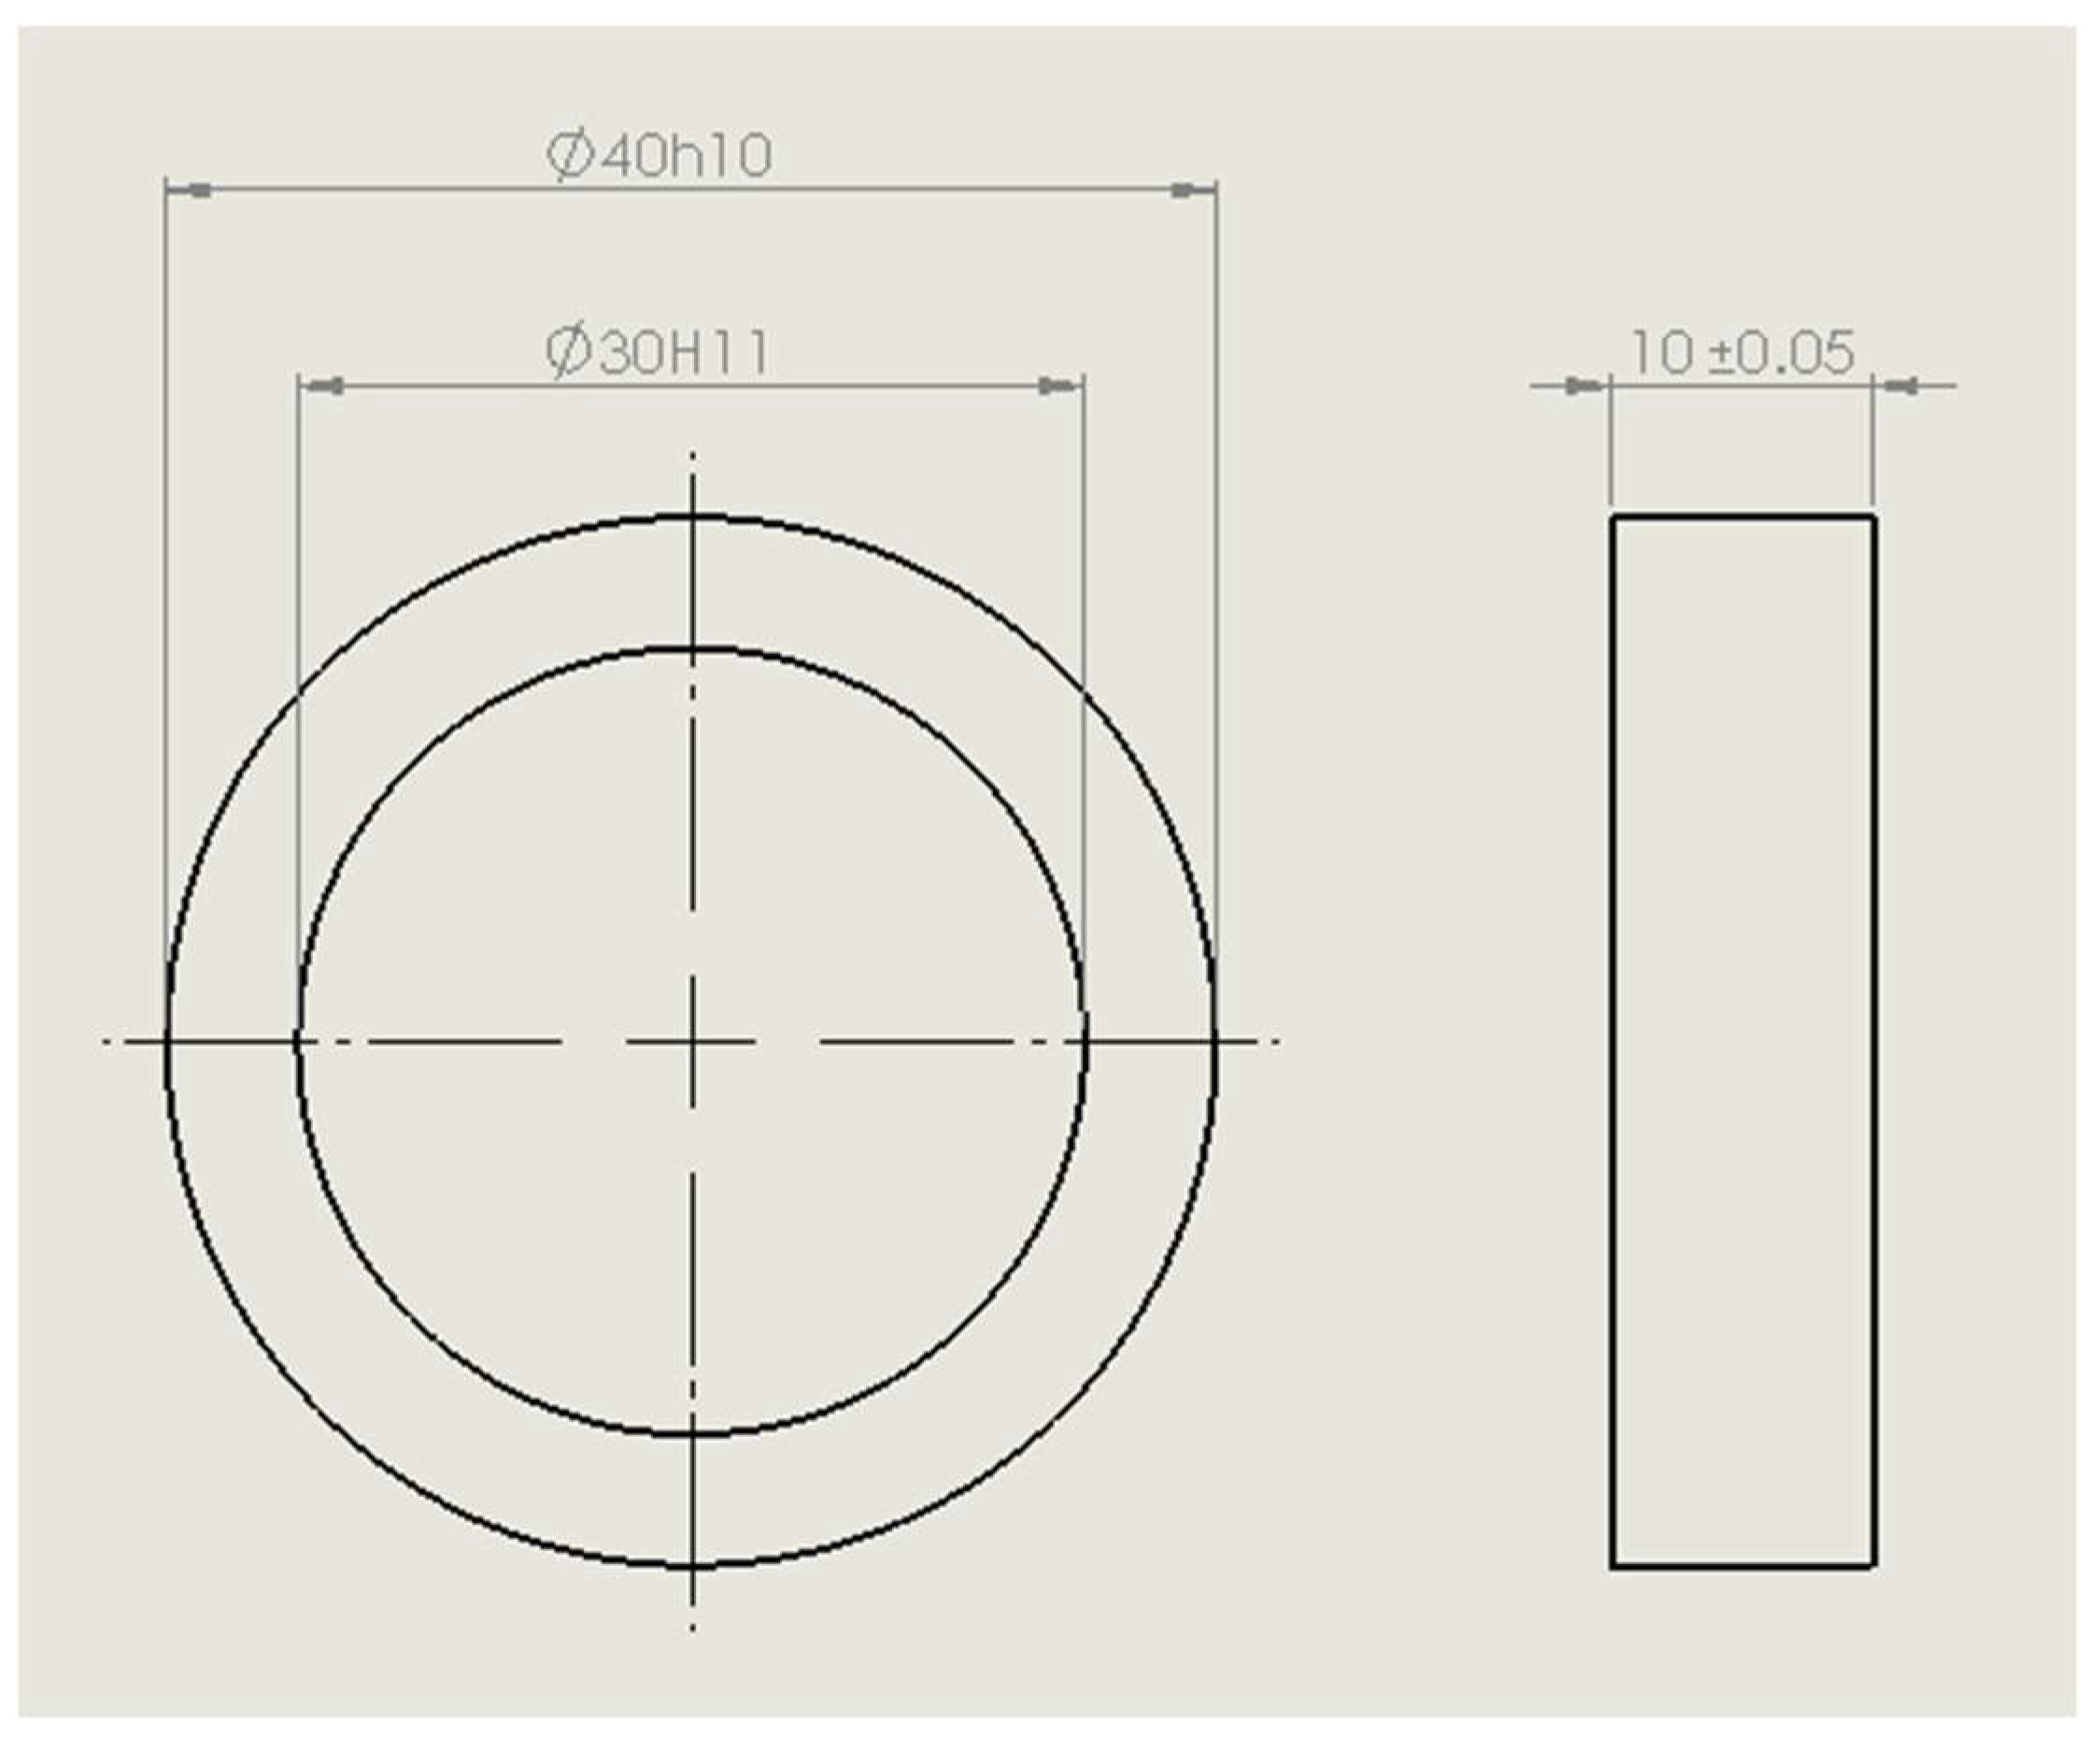
The component under consideration is of the bushing variety; its technical specifications permit the measurement of various parameters, including but not limited to height, bore, and shaft diameter. The component in question is straightforward to print—Figure 1, can be produced expeditiously, and requires only a modest amount of material.
Figure 1.
Printed detail.
- Additive manufacturing technology
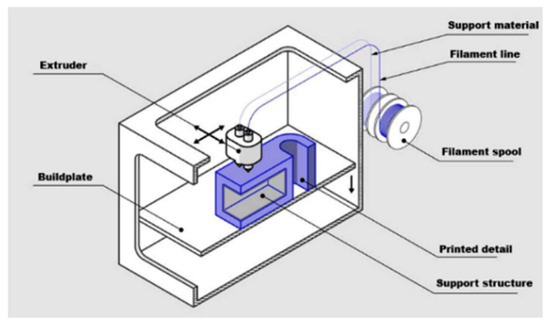
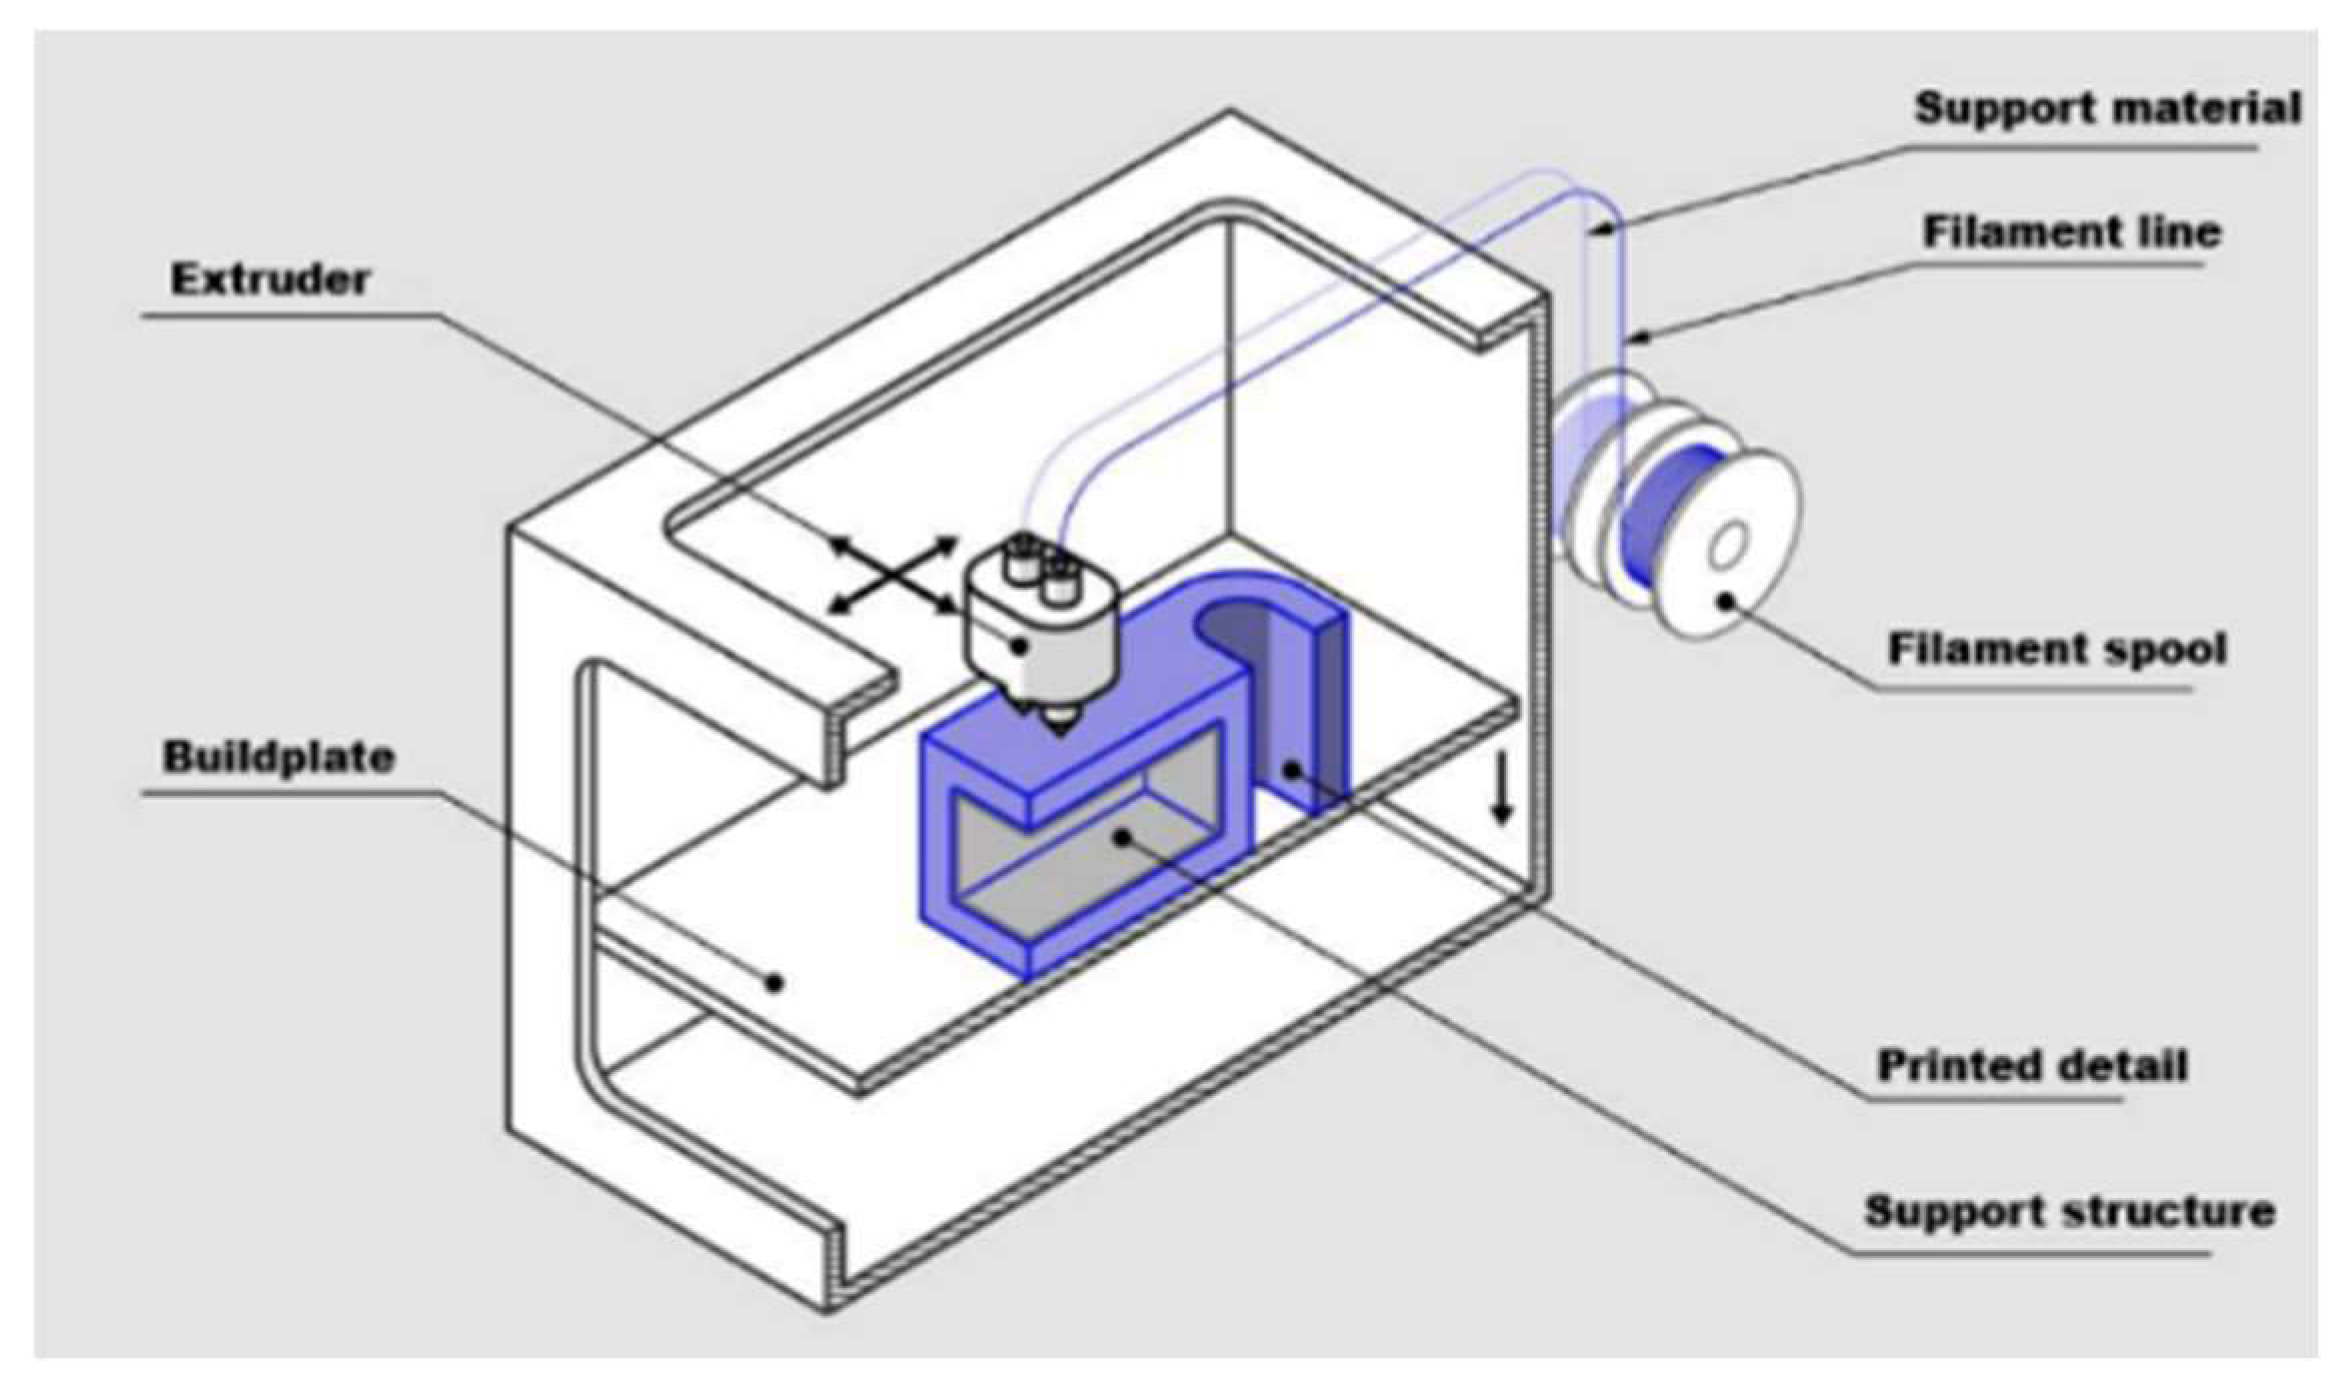
The ISO/ASTM 52900 standard is a comprehensive categorization of the diverse range of 3D printing technologies [18]. The 3D printing technology that has been selected is FDM, as illustrated in Figure 2. This is an additive manufacturing method whereby layers of materials are fused together in a certain pattern to create a 3D object. FDM (Fused Deposition Modelling) is proven to be the most cost-effective method of producing custom parts and prototypes.
Figure 2.
Schematic diagram of FDM technology [19].
A wide variety of thermoplastic materials is available for the presented 3D printing technology, making them suitable for prototyping and functional applications [20]. A significant constraint of FDM is its comparatively poor resolution and dimensional accuracy in comparison with the other 3D printing technologies. The presence of visible lines on the produced parts requires subsequent treatment to achieve surfaces with lower roughness. Additionally, the adhesion between the layers renders the particles inherently anisotropic. This state of anisotropy weakens the particles in one direction, and makes them unsuitable for some applications.
- Used 3D printer
The components are fabricated using a Prusa MK4S 3D printer (Prusa Research, Prague, Czech Republic), which functions via the FDM technology delineated above. This is an open-source 3D printer that offers a high level of print speed, a high level of layer quality, and good geometric accuracy. Further information regarding the machine can be found on the website of the manufacturer.
- Design of experiment
The experimental design constitutes a fundamental element of empirical research, offering structured methodologies for investigating causal relationships while minimizing confounding and maximizing efficiency. In this domain, single-factor, two-factor, and factorial experimental designs are of particular importance. These designs offer progressively richer frameworks for evaluating main effects and interactions. The corpus of literature identified in this review emphasizes the theoretical underpinnings and methodological strategies associated with these designs, ranging from fundamental principles to advanced statistical innovations.
A significant proportion of the extant literature focuses on establishing the core principles that are essential to any experimental framework, namely randomization, replication, and blocking. It is evident that foundational texts, including Ireland’s fundamental concepts in the design of experiments [21] and Wu and Hamada’s experiments [22], provide comprehensive treatments of these concepts. In addition, they detail their implementation in single-factor and multi-factor settings. These works are complemented by broader resources such as Bowerman’s statistical design and analysis of experiments [23], which integrates inferential tools like ANOVA with design considerations for both fixed and random effects.
A number of references explore factorial designs in depth, offering theoretical and practical guidance on the structuring of experiments with multiple independent variables and the interpretation of interaction effects. Collins et al. [24] address the trade-offs between complete and fractional factorial designs, discussing power considerations, aliasing, and resource constraints. The scope of their work is expanded upon by Dziak et al. [25], who provide comprehensive guidance on factorial design strategies for behavioral science applications, encompassing multilevel and clustered factorial structures.
Fractional factorial designs, which are utilized to minimize the number of conditions in multi-factor experiments, have been the subject of extensive scrutiny in numerous sources. As Gunst and Mason [26] summarize, key statistical properties and design strategies are identified, while Hoshmand [27] and Voelkel [28] provide practical examples and techniques for constructing and analyzing such designs, including the implications of resolution and confounding. Bayesian approaches to fractional factorial design are explored by Toman [29], who derives Bayes-optimal designs in two- and three-level settings, highlighting the method’s utility in sparse-data conditions.
It is evident that advanced methodologies, including response surface methodology (RSM) and split-plot designs, are also represented. Chandra et al. [30] and Ryan [31] include RSM applications for continuous factor levels and process optimization, while Zhao [32] discusses clear-effect criteria in fractional factorial split-plot (FFSP) designs where randomization constraints exist between whole-plot and subplot factors.
Finally, domain-specific adaptations illustrate how these principles are applied and extended. Hoshmand [27] provides a detailed account of the utilization of single- and multi-factor designs in the context of agricultural research, while Singh and Chauhan [33] direct their attention to the subject of factorial optimization frameworks within the domain of pharmaceuticals. Across these applications, the link between statistical methodology and experimental structure remains a central concern.
Collectively, these references offer a comprehensive and methodologically sophisticated framework of theoretical and practical contributions to the design and analysis of single-factor, two-factor, and factorial experiments. It is evident from this body of literature that fundamental elements such as interaction analysis, efficient resource allocation, and statistical rigor are intricately interwoven within both the foundational theory and the evolving experimental practice.
Regression analysis constitutes a compulsory component of the DoE(Design of Experiment) application, as it facilitates the modeling and investigation of the relationship between linear dimensions and bed/nozzle temperatures in FDM. The primary function of the generated mathematical model is to provide a framework for analyzing the relationship between the variables under investigation, thereby facilitating a comprehensive examination of the resultant data. A significant application of this methodology is linear approximation, most often through the least squares approach (OLS). This provides further insight into the proximity of the obtained mathematical model to the experimental results under consideration. The linear regression equation constitutes the primary instrument employed in regression analysis [34]:
- Statistical Process Control
Statistical Process Control (SPC) is a statistical framework for monitoring a process over time to distinguish in control (IC) behavior—variation due to common causes under a stable process distribution—from out of control (OOC) behavior, where special causes induce changes in the distribution (e.g., shifts in mean or increases in variability) [35]. The main tool is the control chart, which plots a process statistic against a center line representing the IC level and control limits that define the expected range of IC variation [35]. For a Shewhart X chart (subgroup size n), the classical limits are: UCL—Upper Control Limit and LCL—Lower Control Limit. When building a control chart, a central line must be calculated:
After that UCL and LCL must be calculated:
where
- —standard deviation, calculated by Formula (8);
- —sample average value;
z is the standard normal variable and it is equal to 2 for a 95.44% confidence level and to 3 for a 99.73% confidence level. In the current situation, a 3 is chosen, so our UCL and LCL will be calculated by Formulas (5) and (6).
- σ—standard deviation of the process;
- n—number of tests in the samples.
The process capability ratio (Cp) is a metric employed to express the capability of a process. A plethora of options exist for the expression of capability. One such option is the utilization of the process capability ratio (PCR) Cp, which employs the upper specification limit (USL) and the lower specification limit (LSL) as quality characteristics.
The 6σ spread constitutes the fundamental definition of process capability. As previously stated, the value of σ is frequently unknown; consequently, it must be substituted with an estimate. The most common application of the symbol σ is as an estimated . As demonstrated in the equation, the estimate of is denoted by s. As previously stated, the value of σ is frequently unknown; consequently, it must be substituted with an estimate. The most common application of the symbol σ is as an estimated . The estimate of is denoted by s, as demonstrated in equation [36].
According to the written above, we can calculate the precision factor by the formula:
The process setup analysis is represented by the coefficient :
The value of σ can be replaced with (s), µ or c , because σ is unknown in most of the times. According to the methodology presented by Douglas Montgomery, when calculating the Cpk coefficient, one-sided capability coefficients are used, which utilize half of the range of the normal distribution law—3 σ. In our case 3σ is replaced by 3 s, so Cpk will be calculated by formulas (15) and (16).
The term ‘Statistical Process Control’ is employed to denote a fundamental statistical technique that is utilized for the assessment of the conformity of a product’s technical specifications. Even in the context of reliable technological processes, there exists the possibility of associating quality indicators with randomness, a phenomenon attributable to uncontrollable variables [37,38].
3. Results and Discussion
This section of the article presents the results obtained, which demonstrate the effect of nozzle temperature and bed temperature on the geometric accuracy of the parts. Following the methodology for a planned experiment, single-factor experiments were conducted to determine the optimal temperatures for the nozzle and the printer bed. A two-factor analysis is then performed to determine the optimal combination of bed and nozzle temperatures. Single-factor experiments are conducted to ascertain the optimal values for nozzle temperature and filament weight. In determining the optimal nozzle temperature, the recommended printing temperature specified by the selected filament manufacturer is chosen as the baseline, and the bed temperature is maintained at a constant level for all tests conducted. Subsequently, an incremental change in temperature is determined relative to the selected baseline.
The single-factor experiment for determining the bed temperature is designed using the same principle. In this manner, the impact of the two parameters on the geometric precision of the components is ascertained.
In the two-factor experiment, the optimal values for the nozzle and table temperatures are identified and adopted as the baseline. The temperature change increment is maintained at the level employed in the single-factor experiments. In this two-factor experiment, a variation of +/- 1 from the baseline levels is selected. This resulted in a combination of nine values for the selected parameters being produced and analyzed.
Subsequent to the production of the parts, they are measured, and the optimal printing temperature for the specific material and printing device is determined based on the results obtained. The measurement of external and internal dimensions is performed using micrometers, with the requisite range and a graduation value of i = 0.01 mm. Three dimensions were controlled: outer diameter (Dout), inner diameter (Din), and part height (H) (Figure 1). The measurement results are presented as the average value of each measurement. The data are presented in tabular and graphical form.
where:
- Din—inner diameter of the controlled samples, tb—printer bed temperature, tn—nozzle temperature.
- ΔDin—relative change in internal diameter of the controlled samples, Din(n)—nominal value of inner diameter, Din(avg)—average inner diameter value.
- Dout—outer diameter of the controlled samples.
- ΔDout—relative change in the outer diameter of the controlled samples, Dout(n)—nominal value of outer diameter, Dout(avg)—average value of outer diameter.
Series 1—Single-factor experiments are conducted to determine the optimal nozzle temperature. An analysis of various ABS manufacturers is performed to establish the temperature range for the experiment. For this series, nozzle temperatures ranging from 215 to 290 °C are selected, with a 5 °C increment; the bed temperature is set to 110 °C, the results are presented in Table 3.
where:
Table 3.
Series 1 results.
- Δtn—change in nozzle temperature, k—serial number of the test at a step of 5 °C.
- Δtb—change in bed temperature, j—sequential number of the experiment in step 5 °C.
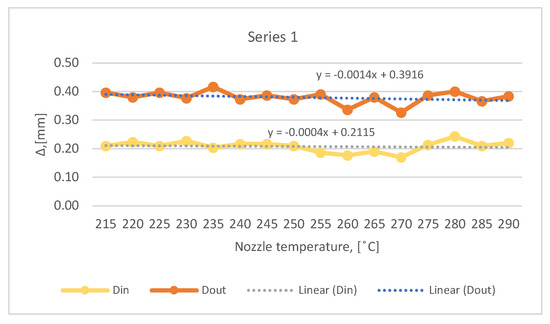
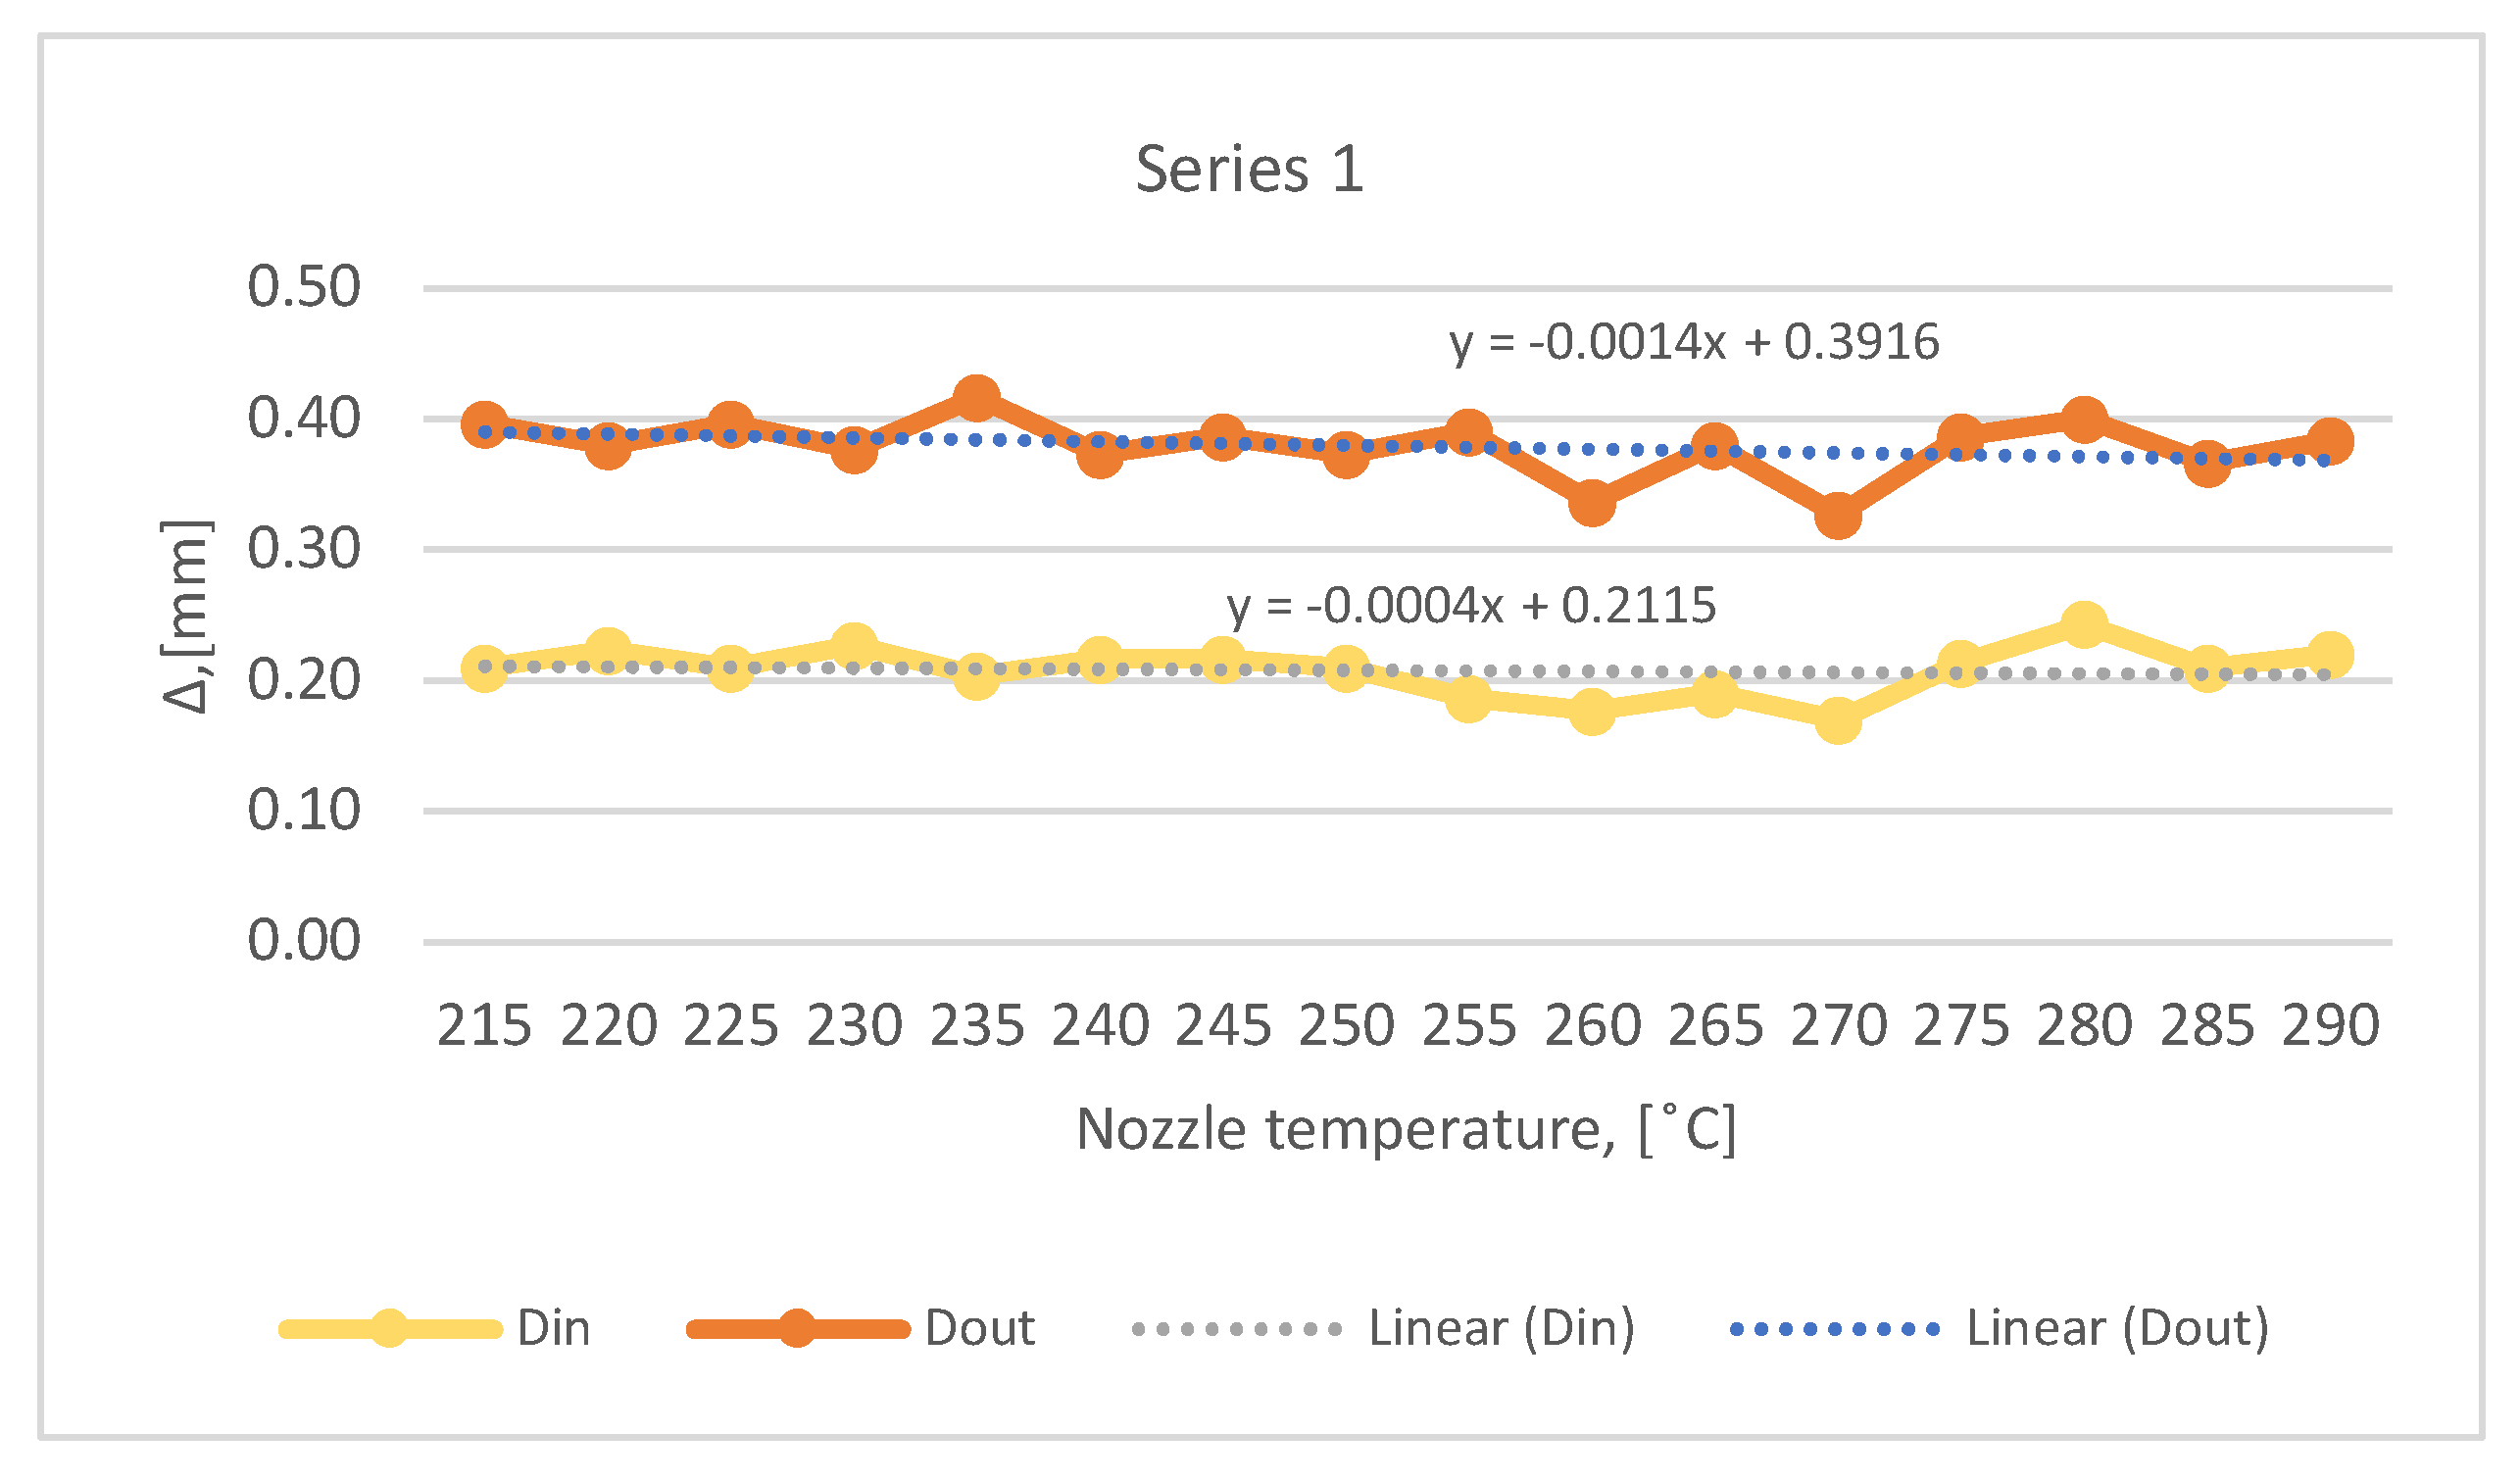
The results presented show the smallest deviations from the nominal dimensions at a nozzle temperature of 270 °C. The dimensional deviations at the height of the bushings are similar, and no graphical representation of the results is provided. Based on the data presented in Table 3 and Figure 3, regression equations for Din and Dout have been derived. According to the results obtained, a nozzle temperature of 270 °C is selected for the prints of series 2.
Figure 3.
Series 1 graphics.
y (S1 Dout) = −0.0014x + 0.3916
y (S1 Din) = −0.0004x + 0.2115
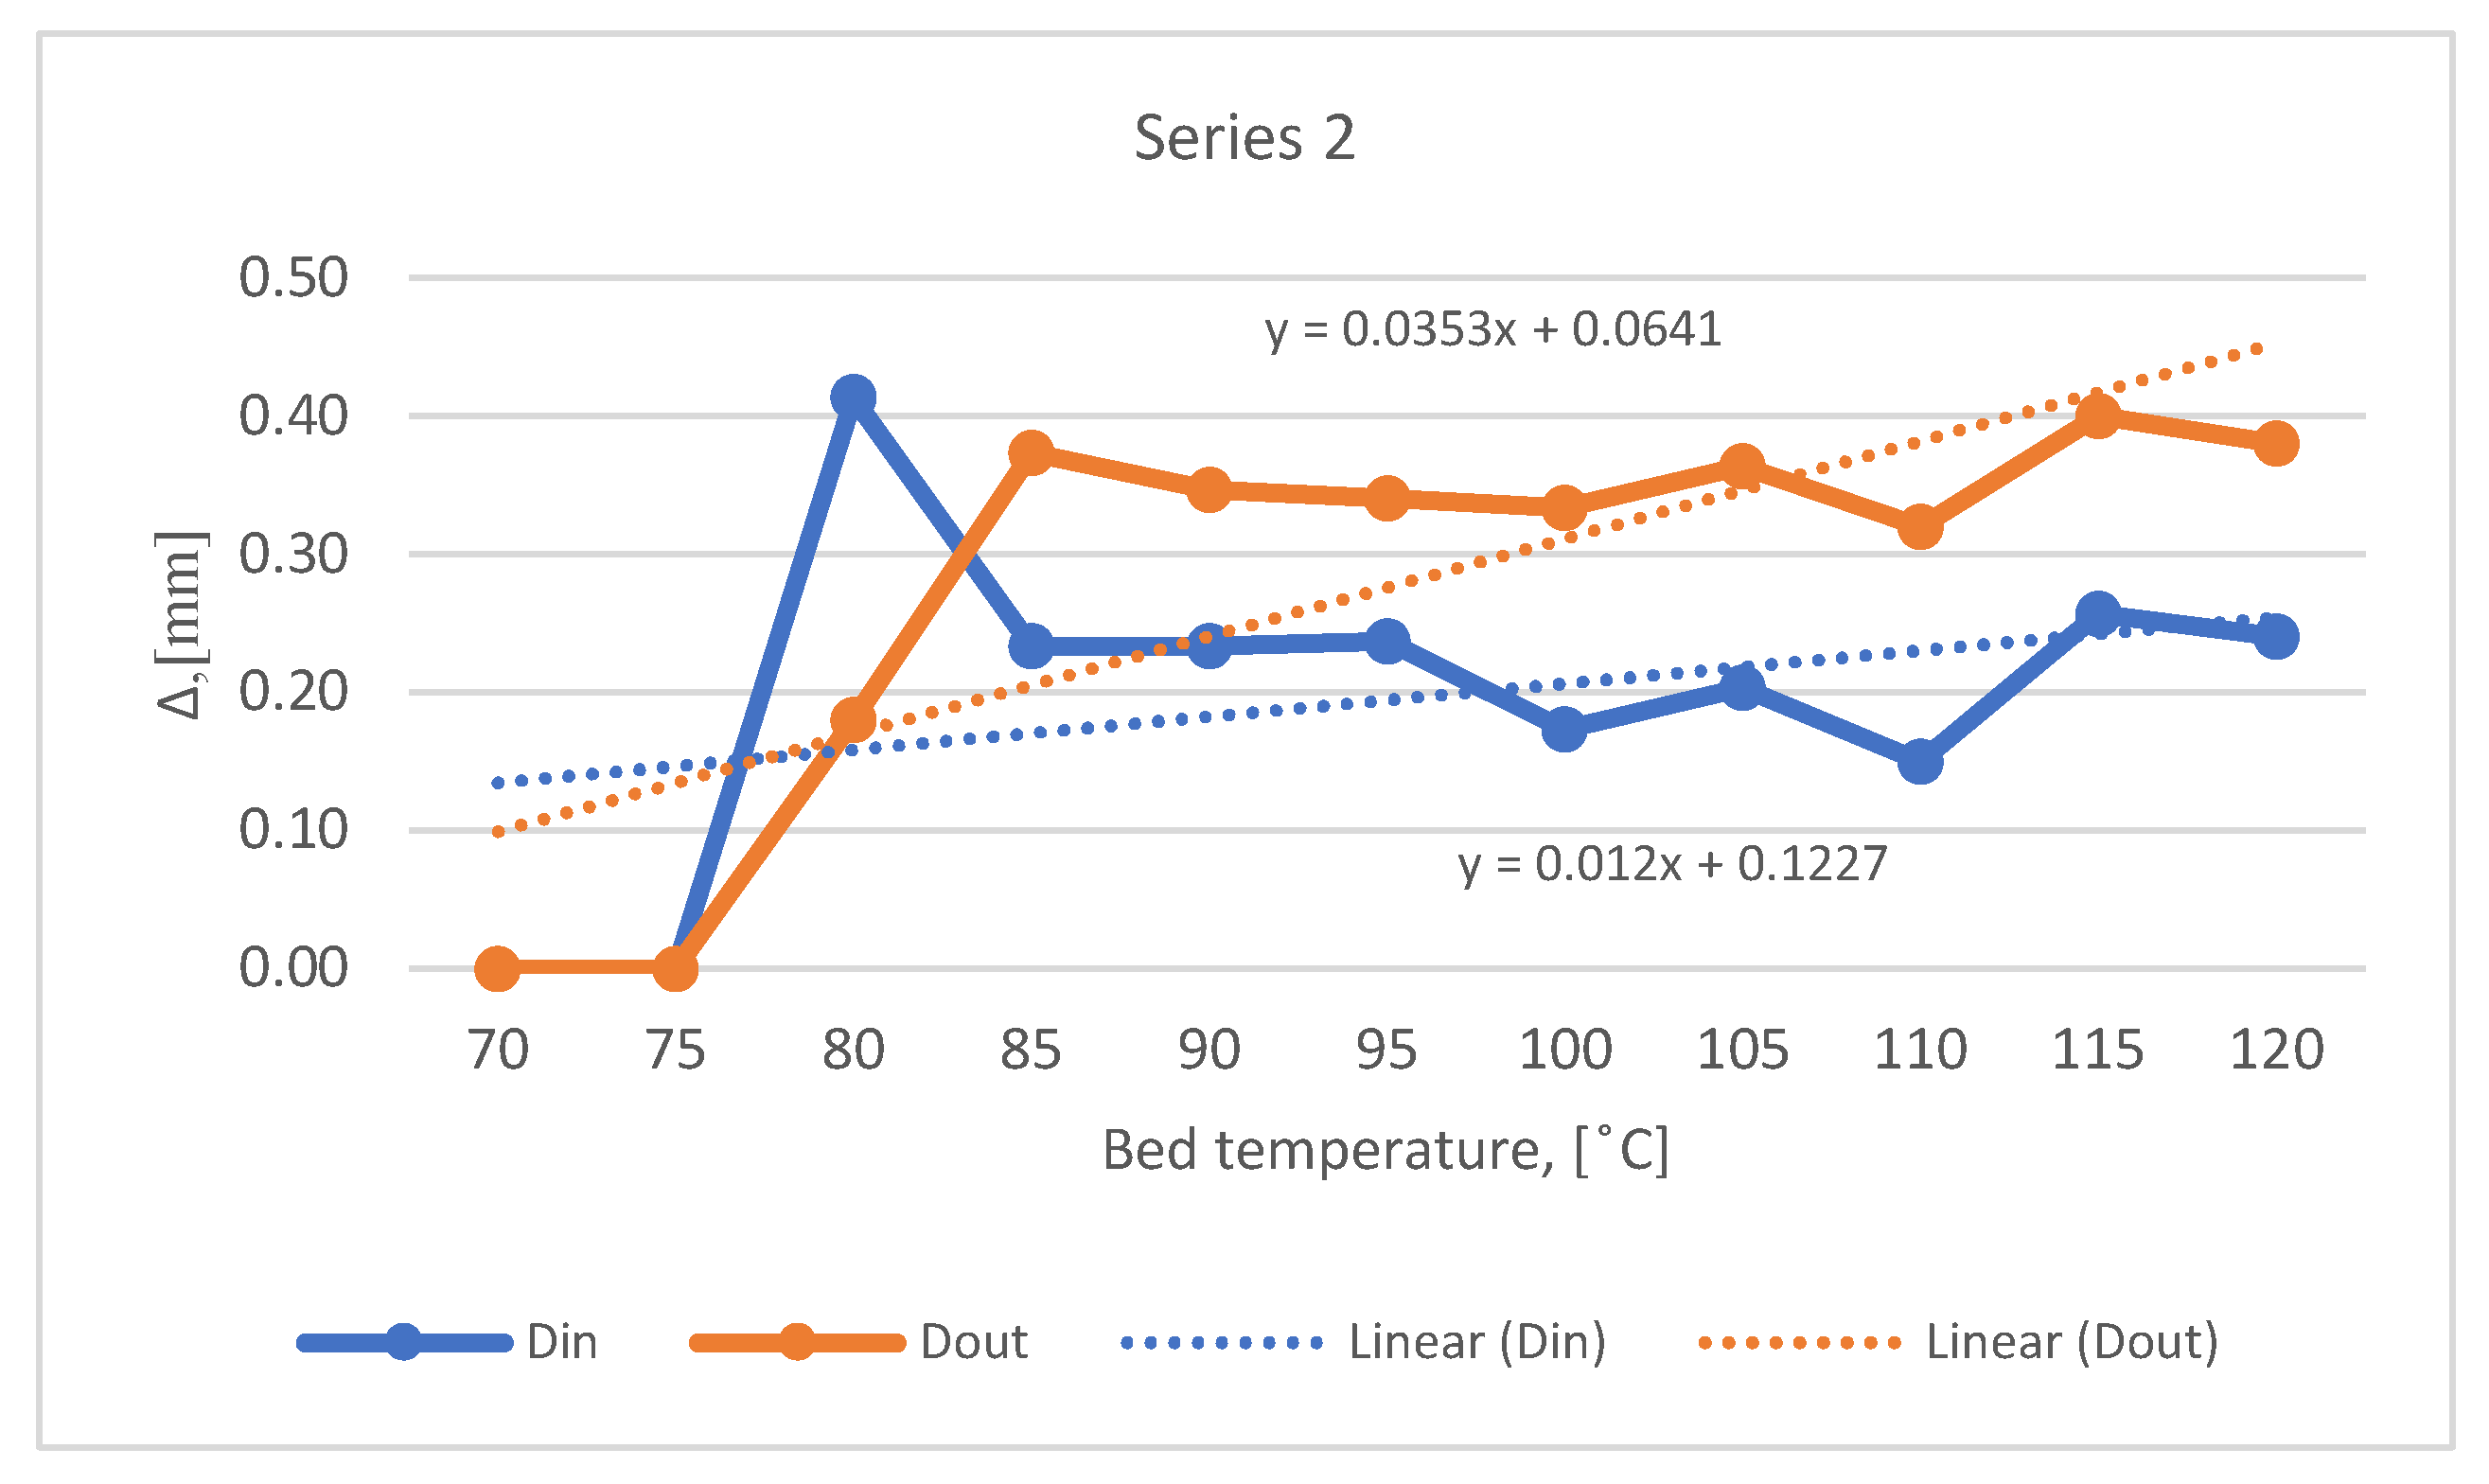
Series 2—investigation of the optimal bed temperature. Once again, the marked is analyzed, and it is determined a bed temperature range of 70 to 120 °C with a 5 °C increment. The maximum bed temperature of the printer is 120 °C, so there is no option to conduct experiments with temperatures higher than 120 °C. The results of the experiment are shown in Table 4 and Figure 4.
Table 4.
Series 2 results.
Figure 4.
Series 2 graphics.
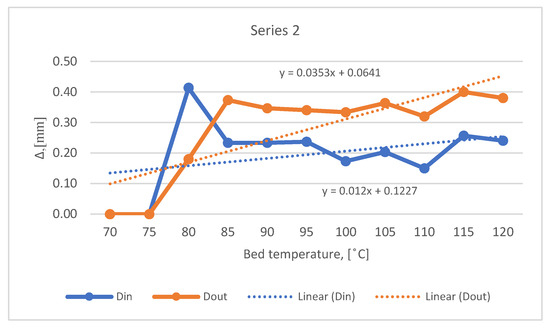
The results presented show the smallest deviations from the nominal dimensions at a bed temperature of 110 °C. The dimensional deviations at the height of the bushings are similar, and no graphical representation of the results is provided. At lower temperature of the printer bed, there are some prints that failed to complete due to bad adhesion. Based on the data presented in Table 4 and Figure 4, regression equations for Din and Dout have been derived. According to the results obtained, a bed temperature of 110 °C and nozzle temperature of 270 °C are selected as a base for the prints of series 3.
y (S2 Dout) = 0.0353x + 0.0641
y (S2 Din) = 0.012x + 0.1227
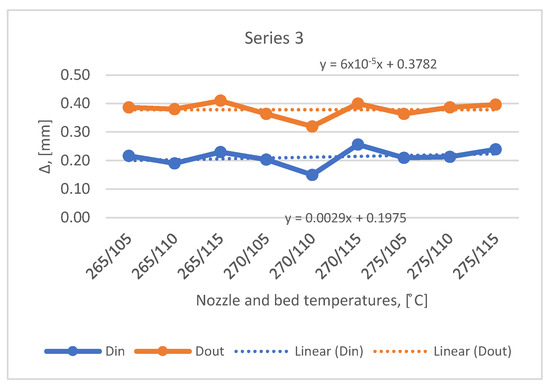
Series 3—Two-factor experiment. The analysis of the single-factor experiments shows that the optimal values of the nozzle and bed are determined to be 270/110 °C. The values of the other temperatures are determined relative to the selected zero level. A single-factor experiment with levels ±1 from zero is selected, using a step of 5 °C for both factors. The results are presented in Table 5 and Figure 5.
Table 5.
Series 3 results.
Figure 5.
Series 3 graphics.
The results presented show the smallest deviations in the average dimensions for the temperature combination of 270/110 °C. The regression equations for series 3 are:
y (S3 Dout) = 6 × 10⁻⁵x + 0.3782
y (S3 Din) = 0.0029x + 0.1975
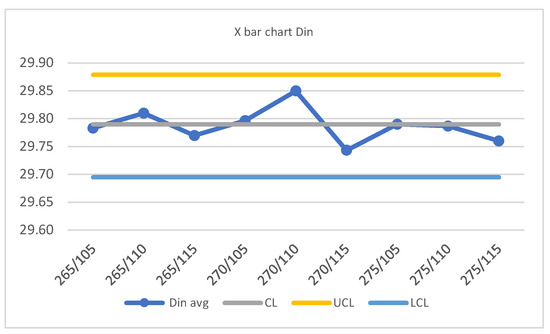
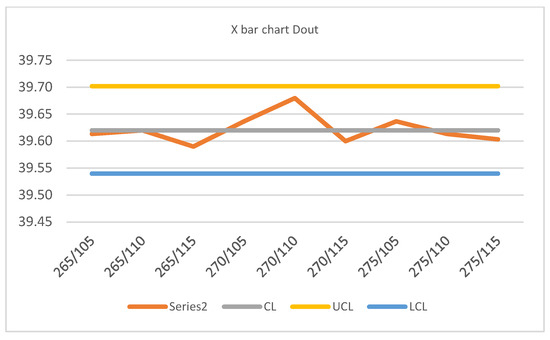
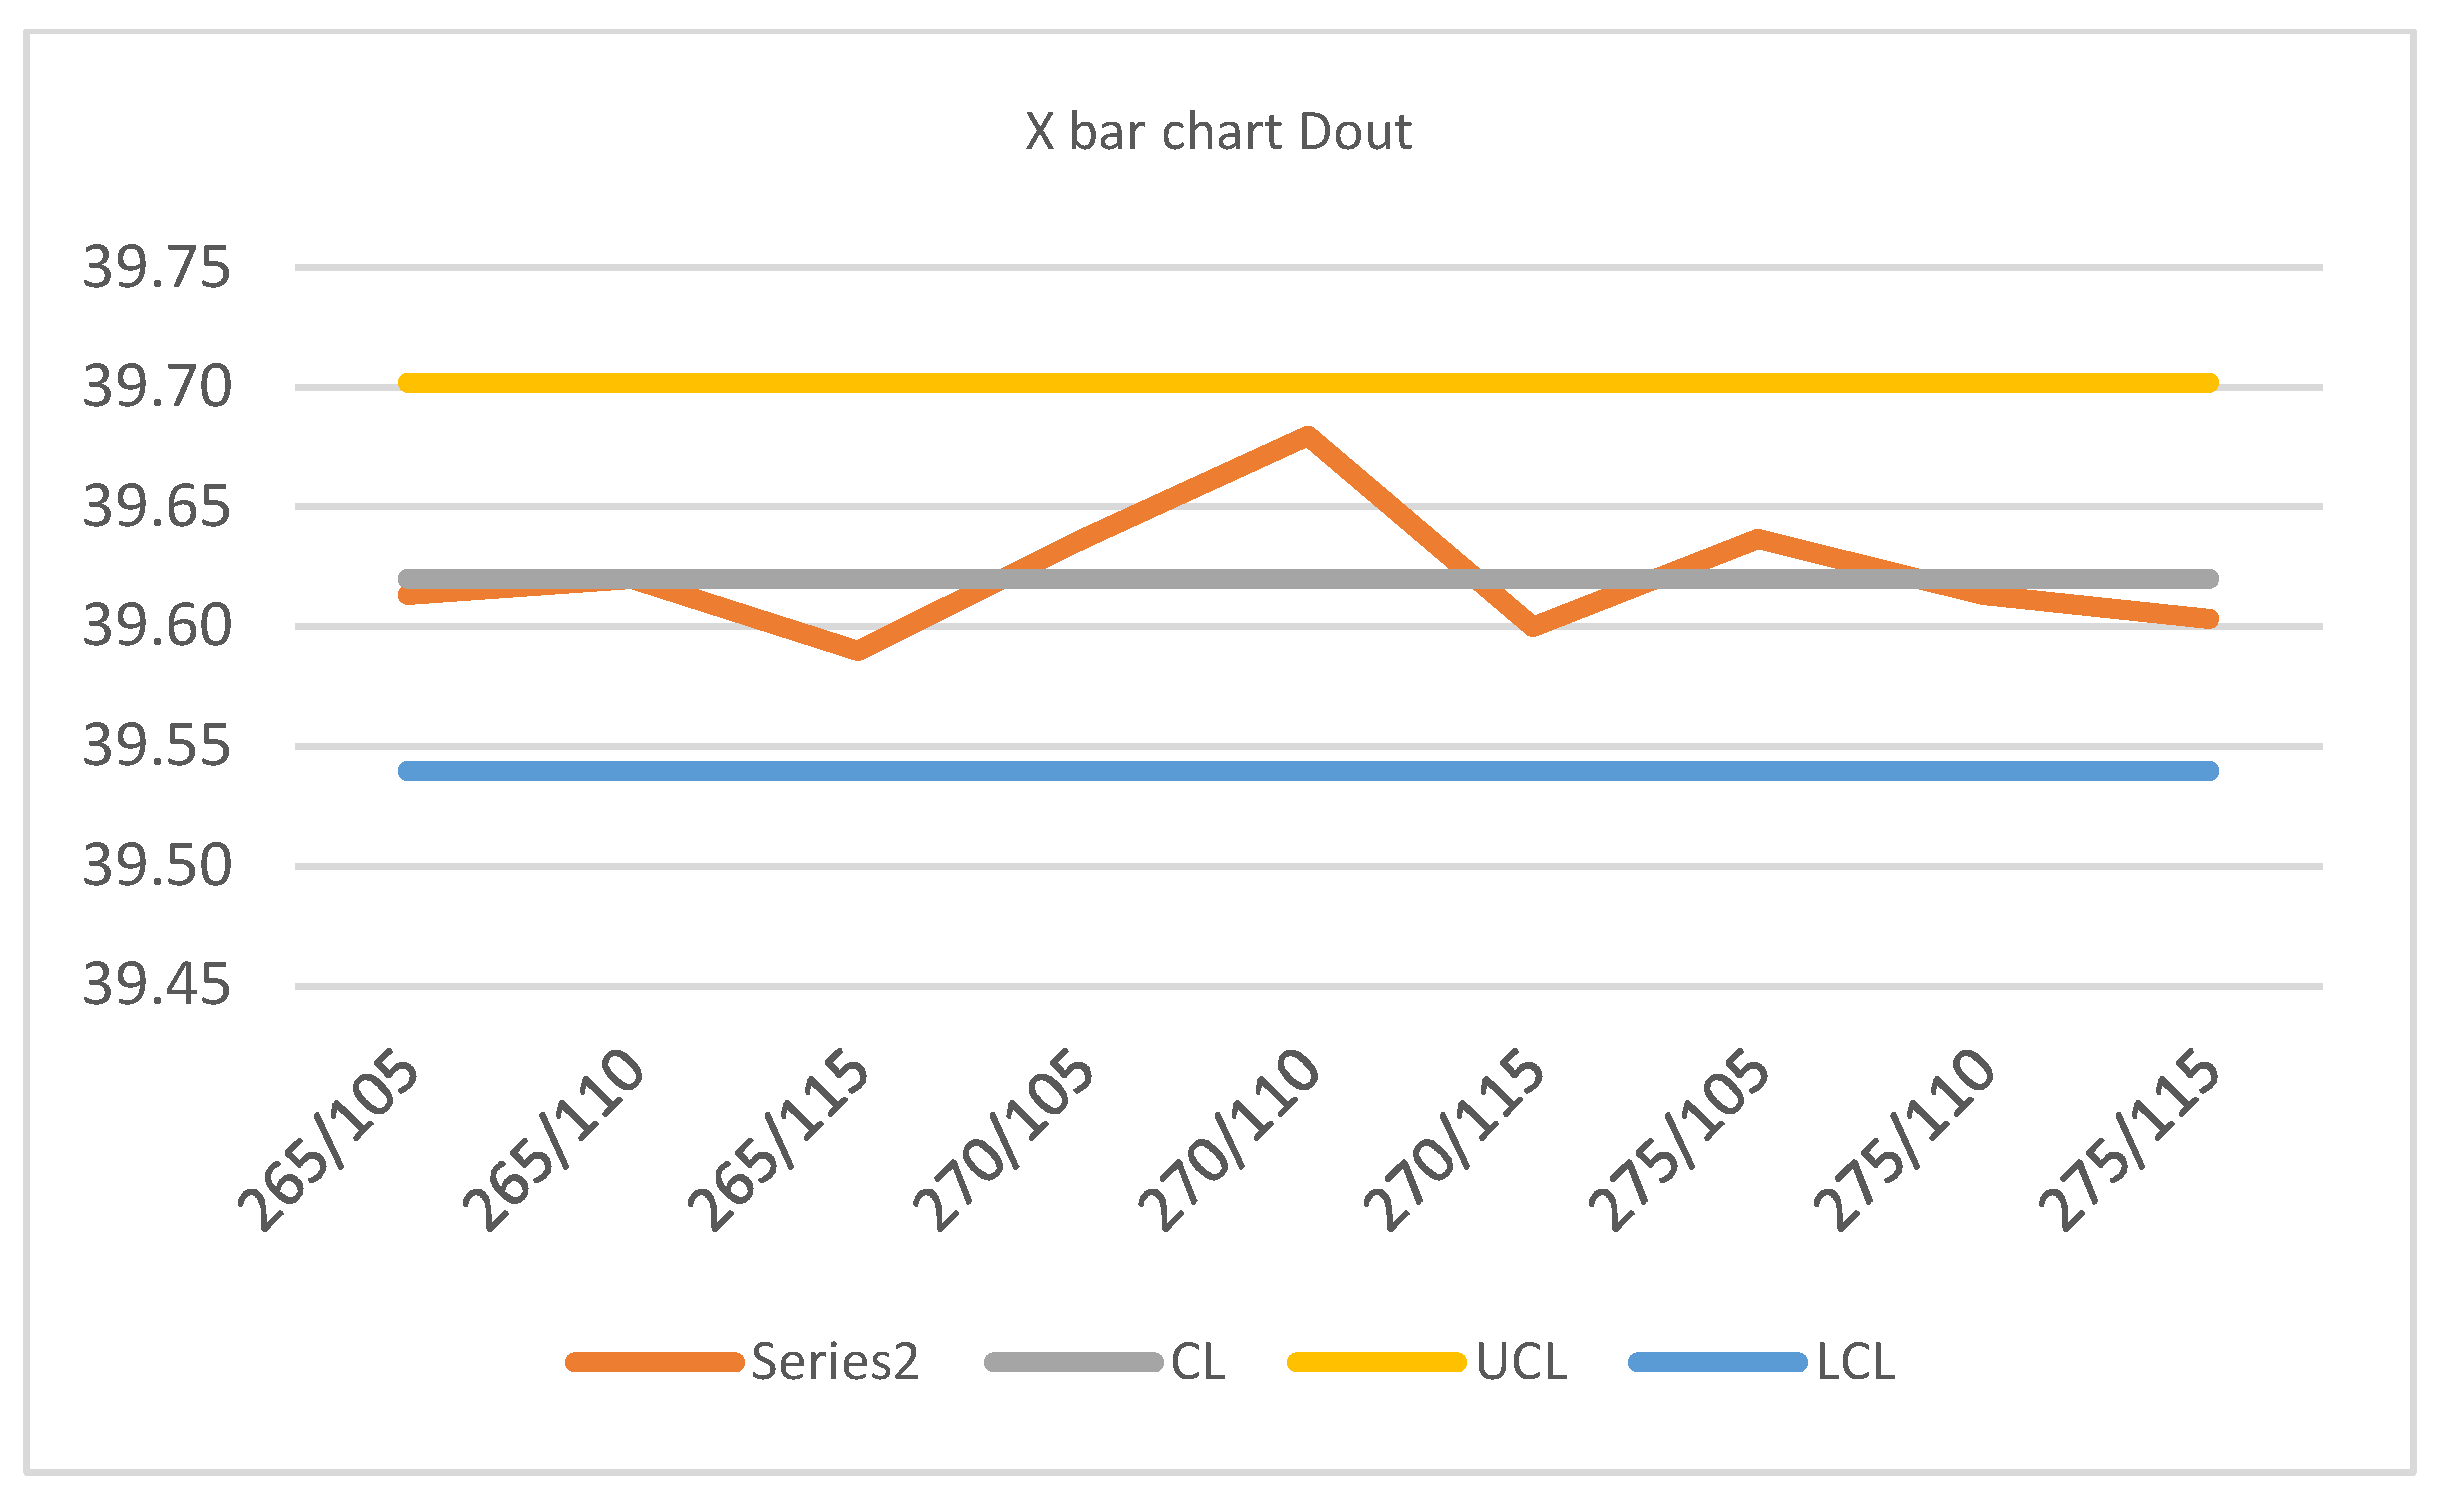
Following the methodology described above, an analysis of the technological process is presented. The results are shown in Table 6 and Figure 6 and Figure 7.
Table 6.
Analysis of technological process data.
Figure 6.
X bar chart Din.
Figure 7.
X bar chart Dout.
The results of the SPC analysis show that the Cp coefficients for the outer and inner diameters are less than 1.33. Cp values between 0.6 and 0.7 indicate that the manufacturing process does not meet the specified tolerances and requires intervention. According to the Cpk methodology, we select the minimum value of the coefficient. In the current situation, the Cpk(min) coefficients are negative for both diameters, which means that the process is off-center and does not meet the specified tolerances.
The results from Series 1 illustrate the deviation from the nominal dimensions of the manufactured parts. As demonstrated in Figure 3, the inner and outer diameters of the bushing demonstrate deviation from the nominal dimension, yet this deviation is not uniform between the two diameters. It is determined that a temperature of 270 °C is optimal for the series. At this temperature, the deviation for Din is 0.17 mm, and for Dout it is 0.33 mm. This represents a nearly twofold difference. A similar trend is observed at the other temperatures in the series. Further research is required to elucidate this trend.
The findings from series two demonstrate analogous behavior in the dimensional changes. In this series of tests, several failed prints are also observed at temperatures of 70 and 75 °C. This is attributable to inadequate adhesion between the print and the printer bed. The optimal temperature for this series is 110 °C.
A similar trend is also exhibited by two-factor experiments across the different temperature combinations. The optimal results for this experiment are achieved with a combination of 270 °C nozzle and 110 °C bed temperatures.
In all three series of experiments conducted, the behavior of the measured part heights is similar, and no significant deviations are observed.
Regression equations are derived for each planned experiment; these can be used to predict a correction factor in order to achieve the specified nominal dimensions. A study of this kind is planned for future work with this material.
A further study is conducted in order to facilitate a comparison between the results obtained and those from other studies on this topic. The retrieved literature provides substantial support for the view that nozzle and bed temperature are significant interacting drivers of dimensional outcomes in ABS FDM/FFF. However, the study also highlights a methodological gap: no study in this set effectively isolates nozzle/bed temperature (single- or two-factor) while reporting inner diameter (ID), outer diameter (OD), and height errors on the same cylindrical/ring artifact under otherwise fixed conditions [1,3,5,39,40].
4. Conclusions
This article presents a comprehensive experimental study to determine the nozzle and bed temperatures for ABS printing. Through single-factor experiments, the optimal values for the nozzle and bed temperatures were determined to be 270 °C and 110 °C, respectively. The two-factor experiment confirms that the optimal operating temperature is 270/110 °C. According to the presented results, none of the manufactured parts meet the specified tolerances. The analysis of the manufacturing process also shows that the manufactured parts do not meet the specified tolerances, and the manufacturing process is off-center. Further research is needed on the shrinkage coefficient of ABS. Future studies are planned to determine the shrinkage coefficient and introduce corrections to the initial model until the specified tolerances are achieved. The presented results can be used as a database for determining optimal printing parameters for various 3D printers and materials from different manufacturers by applying only the two-factor experiment. This can lead to a reduction in the time required to familiarize oneself with the system, lower material consumption, and the production of parts with higher geometric accuracy.
Author Contributions
K.G., I.N. were involved in the full process of producing this paper, including conceptualization, methodology, modeling, investigation, validation, visualization and preparing the manuscript. All authors have read and agreed to the published version of the manuscript.
Funding
This research was funded by Research and Development Sector at the Technical University of Sofia by contract No. ИУНФ 26000.
Institutional Review Board Statement
Not applicable.
Informed Consent Statement
Not applicable.
Data Availability Statement
Data are available in this manuscript.
Acknowledgments
The authors would like to thank the Research and Development Sector at the Technical University of Sofia for the financial support.
Conflicts of Interest
The authors declare no conflicts of interest.
References
- Nathaphan, S.; Trutassanawin, W. Effects of Process Parameters on Compressive Property of FDM with ABS. Rapid Prototyp. J. 2021, 27, 905–917. [Google Scholar] [CrossRef] [Scilit]
- Tanoto, Y.Y.; Filbert, V.; Febrian, R.; Adriel, N. Optimasi Multirespon Pada Proses 3D Printing Material ABS Dengan Metode Taguchi-PCR Topsis. Teknik 2022, 43, 147–157. [Google Scholar] [CrossRef] [Scilit]
- Ulkir, O.; Ertugrul, I.; Ersoy, S.; Yağımlı, B. The Effects of Printing Temperature on the Mechanical Properties of 3D-Printed Acrylonitrile Butadiene Styrene. Appl. Sci. 2024, 14, 3376. [Google Scholar] [CrossRef] [Scilit]
- Suniya, N.K.; Verma, A.K. A Review on Optimization of Process Parameters of Fused Deposition Modeling. Res. Eng. Struct. Mater. 2023, 9, 631–659. [Google Scholar] [CrossRef] [Scilit]
- Vaid, H.; Shubham, P.; Sharma, P.; Vajpeyi, R. Prediction of Printing Parameters for Minimal Dimensional Variation in 3D Printed Parts by Using Artificial Intelligence. In 2021 8th International Conference on Signal Processing and Integrated Networks (SPIN); IEEE: Piscataway, NJ, USA, 2021; Volume 25, pp. 350–354. [Google Scholar] [CrossRef] [Scilit]
- Mosleh, N.; Esfandeh, M.; Dariushi, S. Simulation of Temperature Profile in Fused Filament Fabrication 3D Printing Method. Rapid Prototyp. J. 2023, 30, 134–144. [Google Scholar] [CrossRef] [Scilit]
- Hao, Y.; Wang, G.; Che, S.; Pang, Z.; Qu, G.; Li, D.; Ding, J. Fabrication and Characterization of High-Performance Heat-Resistant Acrylonitrile–Butadiene–Styrene (ABS) Composites Reinforced with Carbon Fibers. J. Polym. Eng. 2026, 46, 226–237. [Google Scholar] [CrossRef] [Scilit]
- Baraheni, M.; Shabgard, M.R.; Tabatabaee, A.M. Effects of FDM 3D Printing Parameters on PLA Biomaterial Components Dimensional Accuracy and Surface Quality. Proc. Inst. Mech. Eng. Part C J. Mech. Eng. Sci. 2023, 238, 3864–3873. [Google Scholar] [CrossRef] [Scilit]
- Alatefi, M.; Al-Ahmari, A.M.; Saleh, M.; Elgawad, A.E.E.A.; AlFaify, A.Y. Integrated FDM Optimization with Multivariate Capability Analysis for Dimensional and Compressive Mechanical Properties. Sci. Rep. 2025, 15, 45519. [Google Scholar] [CrossRef] [Scilit] [PubMed]
- Agarwal, K.M.; Shubham, P.; Bhatia, D.; Sharma, P.; Vaid, H.; Vajpeyi, R. Analyzing the Impact of Print Parameters on Dimensional Variation of ABS Specimens Printed Using Fused Deposition Modelling (FDM). Sens. Int. 2021, 3, 100149. [Google Scholar] [CrossRef] [Scilit]
- Ahn, S.; Montero, M.; Odell, D.; Roundy, S.; Wright, P.K. Anisotropic Material Properties of Fused Deposition Modeling ABS. Rapid Prototyp. J. 2002, 8, 248–257. [Google Scholar] [CrossRef] [Scilit]
- Dawoud, M.; Taha, I.; Ebeid, S.J. Mechanical Behaviour of ABS: An Experimental Study Using FDM and Injection Moulding Techniques. J. Manuf. Process. 2015, 21, 39–45. [Google Scholar] [CrossRef] [Scilit]
- Verbeeten, W.M.H.; Arnold-Bik, R.J.; Lorenzo-Bañuelos, M. Print Velocity Effects on Strain-Rate Sensitivity of Acrylonitrile-Butadiene-Styrene Using Material Extrusion Additive Manufacturing. Polymers 2021, 13, 149. [Google Scholar] [CrossRef] [Scilit] [PubMed]
- Zarybnicka, L.; Dvorak, K.; Dostalova, Z.; Vojackova, H. Study of Different Printing Design Type Polymer Samples Prepared by Additive Manufacturing. Period. Polytech. Chem. Eng. 2019, 64, 255–264. [Google Scholar] [CrossRef] [Scilit]
- Abramushkina, O.I.; Uzorina, M.I.; Surikov, P.V.; Ushakova, O.B. Investigation of the rheological behavior of ABS plastic grades for the production of filaments for 3D printing by layer-by-layer deposition. Plast. Massy 2021, 29–35. [Google Scholar] [CrossRef] [Scilit]
- Peterson, A.M. Review of Acrylonitrile Butadiene Styrene in Fused Filament Fabrication: A Plastics Engineering-Focused Perspective. Addit. Manuf. 2019, 27, 363–371. [Google Scholar] [CrossRef] [Scilit]
- eSun, ABS, Technical Data Sheet. Available online: https://www.esun3d.com/abs-product/ (accessed on 12 March 2026).
- ISO/ASTM 52900; Additive Manufacturing—General Principles—Terminology. ASTM International: West Conshohocken, PA, USA, 2015.
- What is FDM (Fused Deposition Modeling) 3D Printing? Available online: https://www.hubs.com/knowledge-base/what-is-fdm-3d-printing/ (accessed on 12 March 2026).
- Dudek, P. FDM 3D Printing Technology in Manufacturing Composite Elements. Arch. Metall. Mater. 2013, 58, 1415–1418. [Google Scholar] [CrossRef] [Scilit]
- Ireland, C. Fundamental Concepts in the Design of Experiments. Technometrics 1965, 7, 652–653. [Google Scholar] [CrossRef]
- Wu, C.J.; Hamada, M.S. Experiments: Planning, Analysis, and Optimization; John Wiley & Sons: Hoboken, NJ, USA, 2011. [Google Scholar]
- Bowerman, B.L. Statistical Design and Analysis of Experiments with Applications to Engineering and Science. Technometrics 1991, 33, 105–106. [Google Scholar] [CrossRef] [Scilit]
- Collins, L.M.; Dziak, J.J.; Li, R. Design of Experiments with Multiple Independent Variables: A Resource Management Perspective on Complete and Reduced Factorial Designs. Psychol. Methods 2009, 14, 202–224. [Google Scholar] [CrossRef] [Scilit] [PubMed]
- Dziak, J.J.; Nahum-Shani, I.; Collins, L.M. Multilevel Factorial Experiments for Developing Behavioral Interventions: Power, Sample Size, and Resource Considerations. Psychol. Methods 2012, 17, 153–175. [Google Scholar] [CrossRef] [Scilit] [PubMed]
- Gunst, R.F.; Mason, R.L. Fractional Factorial Design. Wiley Interdiscip. Rev. Comput. Stat. 2009, 1, 234–244. [Google Scholar] [CrossRef] [Scilit]
- Hoshmand, R. Design of Experiments for Agriculture and the Natural Sciences; Chapman and Hall/CRC: Boca Raton, FL, USA, 2018. [Google Scholar]
- Voelkel, J.G. Fractional Factorial Designs. Encycl. Stat. Qual. Reliab. 2007, 1, 234–244. [Google Scholar] [CrossRef] [Scilit]
- Toman, B. Bayes Optimal Designs for Two- and Three-Level Factorial Experiments. J. Am. Stat. Assoc. 1994, 89, 937–946. [Google Scholar] [CrossRef]
- Chandra, S.; Anderson, V.L.; McLean, R.A. Design of Experiments: A Realistic Approach. J. Am. Stat. Assoc. 1975, 70, 961. [Google Scholar] [CrossRef] [Scilit]
- Ryan, T.P. Planning, Construction, and Statistical Analysis of Comparative Experiments. J. Qual. Technol. 2004, 36, 454–457. [Google Scholar] [CrossRef] [Scilit]
- Zhao, Y. Split-Plot Designs with Few Whole Plot Factors Containing Clear Effects. Fractal Fract. 2022, 6, 453. [Google Scholar] [CrossRef] [Scilit]
- Singh, A.; Chauhan, C.S. Factorial Designing—An Essential Tool in Pharmaceutical Optimization. YMER Digit. 2022, 21, 519–525. [Google Scholar] [CrossRef] [Scilit]
- Montgomery, D.C.; Runger, G.C. Applied Statistics and Probability for Engineers; John Wiley & Sons: Hoboken, NJ, USA, 2010. [Google Scholar]
- Raji, I.A.; Lee, M.H.; Riaz, M.; Abujiya, M.R.; Abbas, N. Outliers Detection Models in Shewhart Control Charts; an Application in Photolithography: A Semiconductor Manufacturing Industry. Mathematics 2020, 8, 857. [Google Scholar] [CrossRef] [Scilit]
- Montgomery, D.C. Introduction to Statistical Quality Control; Wiley: Hoboken, NJ, USA, 2008. [Google Scholar]
- Hristov, M.H. SPC as an Instrument for Implementation and MSA as an Instrument for Evaluation of Non-Linear Object Based Temperature Compensation into Shop Floor CMM. In Proceedings of the 2023 15th Electrical Engineering Faculty Conference (BulEF); IEEE: Piscataway, NJ, USA, 2023; pp. 1–9. [Google Scholar] [CrossRef] [Scilit]
- Hristov, M. Task-oriented temperature compensation as an instrument for reduction of uncertainty in shop floor CMM. Environ. Technol. Resour. Proc. Int. Sci. Pract. Conf. 2024, 3, 84–89. [Google Scholar] [CrossRef] [Scilit]
- Choi, Y.-H.; Kim, C.-M.; Jeong, H.-S.; Youn, J.-H. Influence of Bed Temperature on Heat Shrinkage Shape Error in FDM Additive Manufacturing of the ABS-Engineering Plastic. World J. Eng. Technol. 2016, 4, 186–192. [Google Scholar] [CrossRef]
- Zeng, L.; Wu, W. Research on the Significance of Coupling Effects of Multiple Process Parameters in 3D Printing Based on Orthogonal Experimental Method. J. Phys. Conf. Ser. 2024, 2785, 012019. [Google Scholar] [CrossRef] [Scilit]

Disclaimer/Publisher’s Note: The statements, opinions and data contained in all publications are solely those of the individual author(s) and contributor(s) and not of MDPI and/or the editor(s). MDPI and/or the editor(s) disclaim responsibility for any injury to people or property resulting from any ideas, methods, instructions or products referred to in the content. |
© 2026 by the authors. Licensee MDPI, Basel, Switzerland. This article is an open access article distributed under the terms and conditions of the Creative Commons Attribution (CC BY) license.