


Abstract
Dry reforming of methane (DRM) is a promising route for producing syngas while valorizing and eliminating two important greenhouse gases, CO2 and CH4. However, its high endothermicity demands efficient heat transfer at temperatures above 1073 K, and catalyst deactivation by coking remains a major challenge. This particular work presents a reproducible methodological framework for implementing a liquid metal reactor using liquid tin as a proposed medium to avoid coke accumulation. Developing reliable process models for such reactor concepts requires the integration of detailed reaction kinetics with robust process simulation tools. A methodological framework for implementing complex, multi-step Langmuir–Hinshelwood (L–H) kinetic models is developed for DRM coupled with the reverse water–gas shift (RWGS) reaction, with a detailed 23-step surface mechanism and identification of the rate-determining steps (RDSs), incorporating the unique properties of liquid metals (surface renewal dynamics, gas–liquid mass transfer, weak adsorption and carbon dissolution into the bulk). The kinetic parameters are transferred from a Ni/Al2O3 reference through Brønsted–Evans–Polanyi (BEP) scaling. After that, the rate equations are derived for its implementation in custom Python scripts in DWSIM version 9.0.2. However, the calculation runs into a lack of experimental data that allow its validation, which becomes a critical aspect to being able to validate this model. As a result, a series of experiments are proposed to validate these design tools for DRM in liquid metal. The results highlight the framework’s capability for preliminary performance assessment and sensitivity analysis. This work presents a reproducible methodological framework for an L–H kinetic model in an open-access process simulation, serving as a template for evaluating novel reactor designs when no experimental kinetic data exist and commercial simulator options are limited or cost-prohibitive.
1. Introduction
Dry reforming of methane (DRM) converts two greenhouse gases (CH4 and CO2) directly into syngas (mixture of H2 and CO), making it an attractive route within carbon utilization and hydrogen production strategies. Its industrial scalability, however, is constrained by two main problems: the reaction’s strong endothermicity, which requires sustained heat input at temperatures typically above 1073 K, and the propensity of conventional supported metal catalysts to deactivate through carbon deposition, principally via the methane cracking reaction [1].
CH4 + CO2 ⇋ 2CO + 2H2 ΔH298 °C = +247.3 kJ/mol
Using a liquid metal heat transfer fluid has been proposed as a structurally different approach to the coking problem. Rather than suppressing carbon formation at the catalytic surface, a liquid metal bath can dissolve atomic carbon as it forms and transport it convectively away from the gas–liquid interface, in principle decoupling carbon management from catalyst lifetime in a way solid catalysts cannot achieve. Bubble-column reactors using molten metals have been investigated for related high-temperature cracking and pyrolysis processes, where solid carbon byproducts are recovered by flotation at the free liquid surface instead of by catalyst regeneration [2,3,4].
A main obstacle when evaluating this reactor concept is the absence of a validated kinetic description for DRM on liquid metal and the lack of experimental data. A detailed Langmuir–Hinshelwood (L–H) kinetic model exists for DRM over a supported solid catalyst (Ni/Al2O3) [5,6], but no equivalent mechanistic kinetics have been reported for liquid metal surfaces, and the electronic and structural differences between a crystalline transition metal surface like Ni and a disordered liquid metal invalidate direct transfer of rate parameters.
Kinetic descriptions of DRM on solid catalysts have been widely studied [7,8,9]. For liquid metals, experimental work is very recent; for molten tin, kinetic and bubble-scale modeling has so far addressed methane pyrolysis [4,10,11,12]. To our knowledge, no experimental kinetic data for DRM on pure liquid tin have been reported. Other strategies against coking (promoters, supports, core–shell structures, alternative heating routes) [13,14,15,16] act on solid catalyst surfaces; the liquid metal concept instead moves carbon management from the catalyst to the reactor surface, being a new alternative for the coking problem.
This paper does not propose a validated kinetic model for DRM on liquid tin, which is not possible due to the absence of experimental data. What it provides is (i) a reproducible workflow that goes from a detailed surface mechanism to rate laws implemented in an open-source simulator; (ii) a fully traceable parameter set in which each Sn-specific value is labeled as scaled, by analogy or taken from the literature; (iii) an illustrative simulation whose results are bounded by thermodynamics and by explicit uncertainty ranges; and (iv) a prioritized list of measurements needed to turn the framework into a validated tool. The results must therefore be read as illustrative upper-bound estimates, not as performance predictions or design specifications.
2. Methodology
The workflow is divided into several steps. First, a reference surface mechanism and its kinetic data are selected (Ni/Al2O3 [5,6]). Then the RDS of each overall reaction (DRM and RWGS) is identified by a degree-of-rate-control analysis [17] to derive the L–H rate expression. The adsorption enthalpies and activation energies are subsequently transferred to liquid Sn by Brønsted–Evans–Polanyi (BEP) scaling, verifying that the resulting parameter set fulfills thermodynamic consistency in the absence of kinetic data to check. The final stage consists of implementing the rate expressions in DWSIM, verifying the simulator against published solid catalyst data and performing a sensitivity analysis.
2.1. Reference Surface Mechanism and Identification of Rate-Determining Steps (RDSs)
The starting point is a 23-step elementary surface mechanism (Table 1) for DRM on Ni/Al2O3, comprising molecular and dissociative adsorption of CH4, CO2, and H2; sequential dehydrogenation of CHx* fragments; CO2 activation; and the associative (formate) and dissociative routes for the reverse water–gas shift (RWGS) reaction. The adsorbed species are written with ∗ and a vacant site is an independent ∗. To obtain closed-form rate expressions, a single rate-determining step (RDS) is identified for each overall reaction (DRM and RWGS), with all remaining steps treated as quasi-equilibrated.
Table 1.
Detailed kinetic model mechanism for DRM, RWGS and gasification reactions.
For DRM, the first C–H bond cleavage of adsorbed methane (step 4: CH4 ∗ + ∗ ⇌ CH3 ∗ + H ∗) is assigned as the RDS. This assignment is supported by three independent lines of evidence: the degree-of-rate-control (DRC) formalism of Campbell [17], which confirms algebraic consistency between the assumed RDS and the derived rate law (XRC = 1 for this step by construction); kinetic isotope studies with CD4 implicating C–H bond cleavage in the rate-limiting event [18]; and density-functional studies showing that the first C–H scission carries the highest activation barrier in the dehydrogenation sequence on Ni(111) [19].
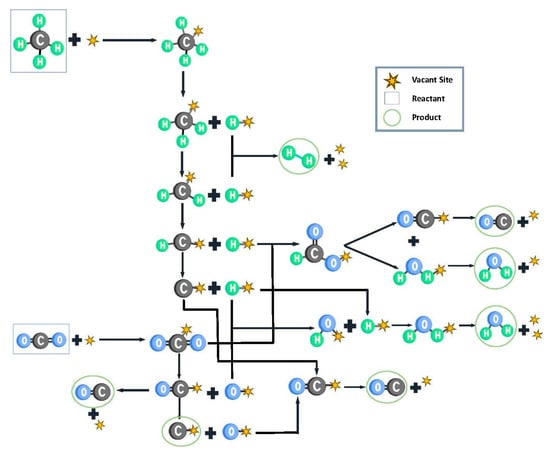
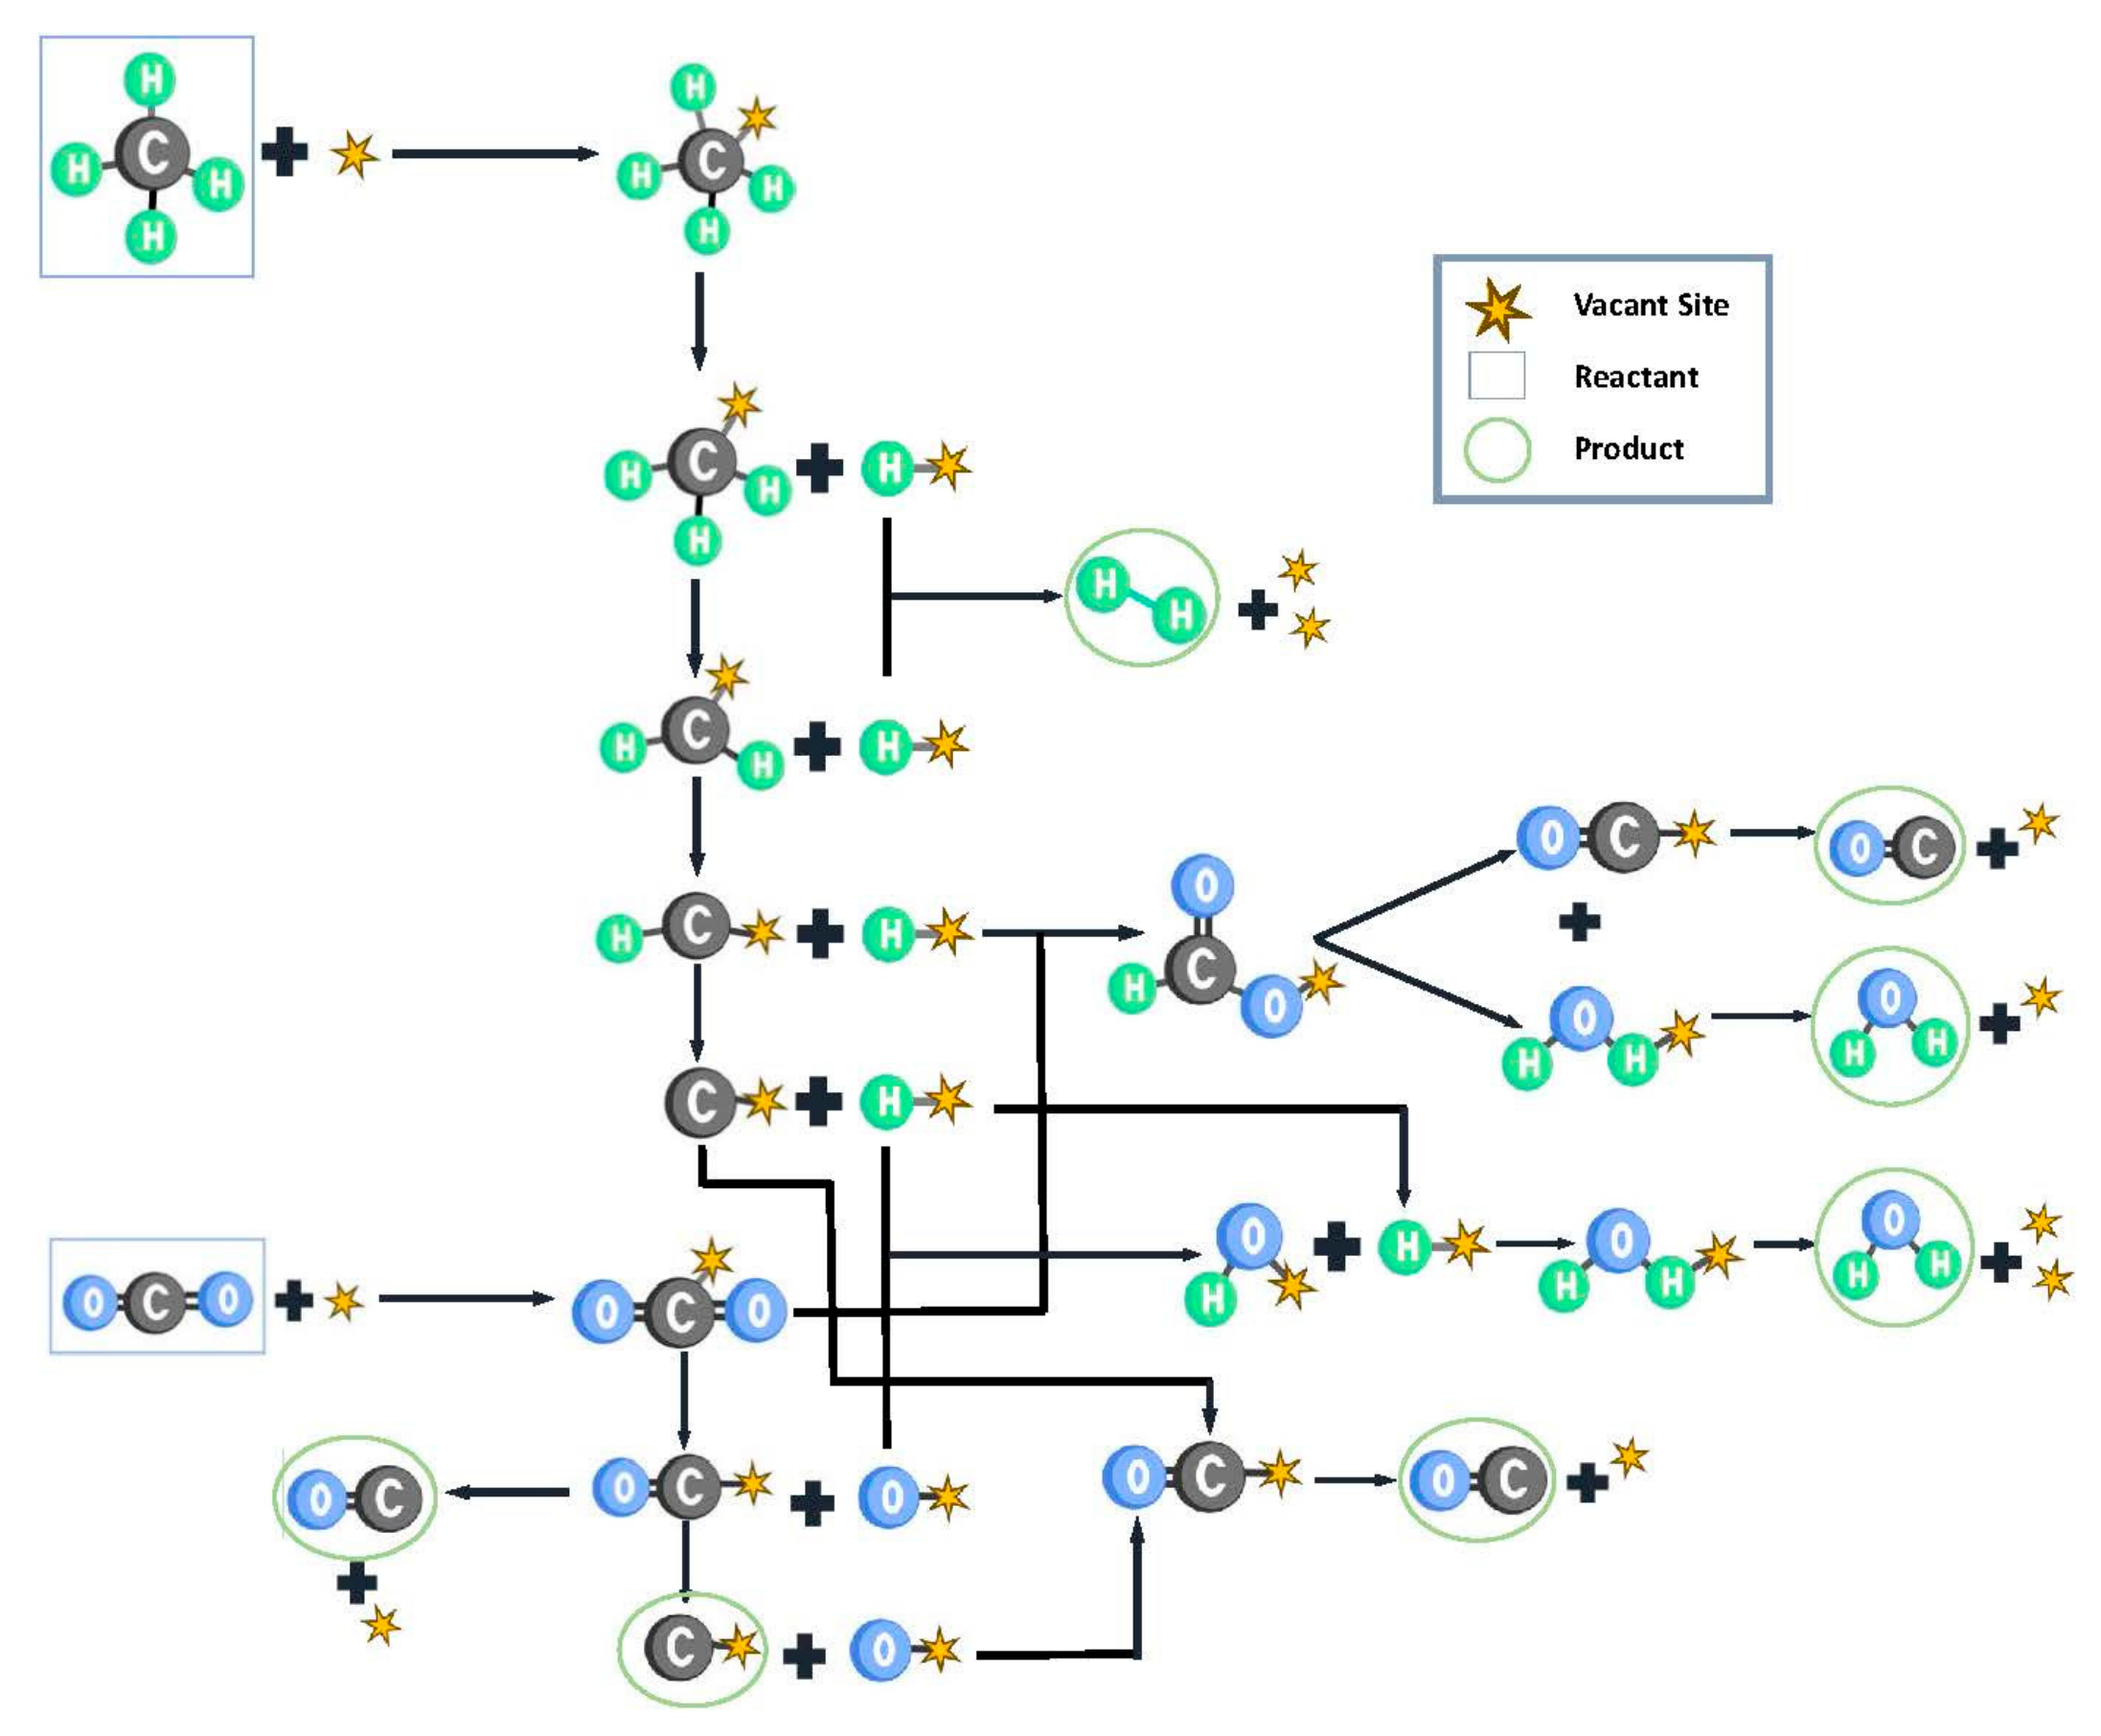
For RWGS, the surface hydrogenation of adsorbed CO2 (step 11: CO2 ∗ + H ∗ ⇌ CHOO ∗ + ∗) is assigned as the RDS rather than direct CO2 dissociation. This choice relies on the oxygen affinity descriptor for the RWGS mechanism [20]: metals with strong oxygen binding (Ni, Rh, Pt) favor the dissociative pathway, while metals with weak oxygen affinity favor the associative, hydrogen-assisted formate route [21,22]. Tin exhibits weak atomic oxygen affinity and it does not form a stable oxide in the strongly reducing DRM atmosphere, which favors the formate route. Each reaction possesses its own RDS, but they share the same active catalytic surface, and thus, the adsorption isotherms align accordingly (see Figure 1).
Figure 1.
A scheme of the employed elementary reactions. When the species is attached to a vacant site, it is an adsorbed species.
Both assignments are borrowed from solid metal studies and are used here as working hypotheses. They have not been established for liquid tin, whose delocalized electronic structure differs from that of a crystalline transition metal. Their consequences differ with the operating regime. When the reactor is under thermodynamic control, the outlet composition is fixed by equilibrium and does not depend on the RDS. Under kinetic control, the RDS determines the reaction orders and the apparent activation energy, which are measurable, so the assumption is testable [14,16]. This is a structural uncertainty that the present framework does not cover. A systema.tic comparison of alternative RDS candidates would require re-deriving and re-parameterizing each rate law and is left for the full kinetic study.
2.2. Liquid-Metal-Specific Modifications
Four physical features distinguish a liquid metal interface from a solid catalytic surface and were incorporated explicitly into the model.
2.2.1. Surface Renewal Dynamics
In a bubble column, the gas–liquid interface is renewed by the passage of bubbles at frequency [23] s = ub/db. For millimeter-sized bubbles (db ≈ 2–3 mm) rising at ub ≈ 0.1–0.2 m/s, s ≈ 30–80 s−1 (using 50 s−1 as a reference value [23]), and it was also consider s = 0.1 s−1, a weak convection limit. The desorption rate constant of each species follows the Polanyi–Wigner equation:
where ν = 1013 s−1 and Edes ≈ |∆Hads|, taken from the BEP-scaled values in Table 2 [24,25].
Table 2.
Kinetic parameters (reaction rate, absorption, and equilibrium constants) assumed for Sn liquid metal catalyst in mol/kg·s (adapted using BEP from [5]).
This gives kdes between 6×10⁸ s (H2O at 723 K) and 5×10¹² s−1 (CO at 1273 K). The surface Damköhler number, Das = s/kdes, is then within 10−14–10−9 for all species over 723–1273 K (Das ≪ 1). Desorption is intrinsically much faster than interfacial renewal. Surface coverage therefore remains governed by adsorption thermodynamics (the equilibrium constants Ki) rather than by interfacial hydrodynamics, which justifies retaining the standard Langmuir isotherm formalism for coverage.
2.2.2. Gas–Liquid Mass Transfer
Reactant transport from the bulk gas to the reactive interface was assessed through the Hatta number, , using the Danckwerts surface-renewal estimate for the liquid-side mass-transfer coefficient, , where DLM is the diffusivity of the gas into the liquid (DLM ≈ 10−9–10−8 m/s2) [14]. For the bubble-column hydrodynamics considered (kL ϵ [2 × 10⁻⁴–9 × 10⁻⁴] m/s; krxn ϵ [10–104] s−1), Ha spans approximately 0.11 to 50 across the plausible kinetic rate range, corresponding to a gas–liquid effectiveness factor of
This indicates that interfacial mass transfer can plausibly limit the observed rate by up to an order of magnitude relative to that in a purely kinetically controlled system, identifying ηGL as the single largest unresolved source of uncertainty in the framework and marking it as a priority in experimental calculations.
2.2.3. Carbon Dissolution into the Bulk Metal Phase
Carbon formed at the interface can dissolve into the liquid metal bulk rather than accumulating on the surface, a pathway unavailable on a solid catalyst. The dissolution rate is modeled as
where θC is the surface carbon coverage and the factor (1 − Cbulk/Csat) represents the thermodynamic driving force for dissolution, which vanishes as the bulk approaches saturation. The dissolution rate constant is expressed as , where DC ϵ [5 × 10⁻¹⁰–5 × 10⁻⁸] m2/s [26,27] is carbon’s diffusivity in liquid Sn, δ ϵ [2 × 10⁻⁶–7 × 10⁻⁴] m the diffusion boundary-layer thickness, Csat ϵ [5–50] mol/m3 the carbon solubility limit and as ≈ 200 m2m−3 the specific gas–liquid interfacial area, estimated for the hydrodynamic conditions of the reactor. Using literature ranges [27], kdiss is estimated in the range 10−7–3 × 10⁻² mol/kg s. This wide interval reflects the combined uncertainty of all contributing parameters and should be considered when interpreting the model predictions.
At quasi-steady state, the rate of carbon formation at the interface equals the rate of dissolution, rform = rdiss, which gives the surface carbon coverage:
The corresponding bulk saturation time, defined as the time required to saturate the metal volume with dissolved carbon, is
where ρSn ≈ 6400 kg/m3 is the density of liquid tin. This value of tsat is a theoretical value assuming all the formatted solid carbon is firstly dissolved in the bulk.
However, as Cbulk approaches Csat, the driving force for dissolution vanishes, and carbon formed at the interface can no longer be transferred into the metal bulk. Under these conditions, solid carbon precipitates directly at the gas–liquid interface. Given that the density of solid carbon (ρC ≈ 2200 kg/m3) is significantly lower than that of liquid tin, the precipitated particles experience positive buoyancy and migrate toward the upper surface of the bath. This gravitational segregation concentrates carbon accumulation at the top gas–liquid interface, from which it can be removed mechanically or by continuous skimming without interrupting reactor operation.
Furthermore, even before saturation is reached, a continuous and independent mechanism is present for the removal of solid carbon: bubble flotation, where solid carbon particles, formed at the interface or precipitated locally in regions where the concentration exceeds the solubility limit, can be captured by the gas bubbles ascending through the liquid metal column. This phenomenon, documented in methane pyrolysis reactors using liquid metal [3,4,16], is independent of the bulk saturation degree and provides a continuous extraction pathway that can operate from the very beginning of the process.
2.2.4. Adsorption Equilibria
The weaker adsorption of reactants and products on the liquid metal surface, which underlies the low-coverage behavior, currently lacks direct experimental validation. Consequently, systematic parameter transfer from the well-established kinetics of Ni/Al2O3 [5], used here as the reference catalyst, was performed as described in Section 2.3.
The adsorption enthalpies for all species were scaled from the reference Ni values using a linear scaling factor, S = 0.60 ± 0.10. This scaling reflects the intrinsically weaker interaction between adsorbates and the delocalized electronic states of the liquid metal, compared with the localized d-orbitals of solid transition metals. As a result, the equilibrium constants Ki are orders of magnitude smaller than those on Ni.
The weak adsorption characteristic of liquid metals leads directly to a surface that is essentially free of adsorbates . This provides the mechanistic justification for the weak-adsorption approximation (Ω ≈ 1) employed in the kinetic model, pending experimental validation.
2.3. Parameter Transfer via Brønsted–Evans–Polanyi (BEP) Scaling
In the absence of experimental adsorption and kinetic data for DRM species on liquid Sn, all parameters were transferred from the Ni/Al2O3 reference model [5] using the BEP linear scaling model. Adsorption enthalpies were scaled uniformly as
with S = 0.60 ± 0.10 derived from DFT studies of supported catalytically active liquid metal solutions (SCALMSs), which report 35–50% reductions in adsorption energies on Ni-Ga and Ni-In surfaces relative to Ni(111) [28,29]. The factor S = 0.60 ± 0.10 is a bounded estimate pending DFT validation for pure Sn. Its transfer from Ni-containing SCALMSs to a p-block metal is an extrapolation between chemically distinct domains. S enters the model twice: through the adsorption enthalpies, where S ϵ [0.50–0.70] changes the inlet DRM rate by −23% to +23% (≈−15 K to +12 K in the position of the regime boundary at 1173 K) and the local sensitivity of the rate to Ki is 0.75–0.99, and, much more strongly, through the activation energy, where it shifts Ea,4 by ±23.7 kJ/mol (220.7 to 173.3 kJ/mol), equivalent to a factor of about 11 in k4 at 1173 K.
One adsorption parameter was set by direct literature evidence rather than by scaling: For CO, linear scaling still overestimates the adsorption strength and is incompatible with the weak, physisorption-like behavior expected on a p-block metal. The CO adsorption enthalpy on Sn was taken from intermetallic Au-Sn systems [30] and adopted in place of the BEP-predicted value; it is a single literature value and not a measurement on liquid Sn.
For the activation energies of bond-breaking elementary steps, the appropriate scaling decomposes the elementary-step reaction enthalpy into a gas-phase bond contribution and a surface-stabilization contribution:
with α = 0.5. This expression reduces correctly to the simple adsorption-scaling rule when ∆ = 0, and it is the form used for every elementary step that involves genuine bond cleavage (methane C–H activation, CO dissociation in the carbon formation sub-model). Applying Equation (8) to methane C–H activation (∆ = 439.6 kJ/mol, the gas-phase C–H bond dissociation energy; from DFT [19]; [5]) gives
This BEP-derived value was adopted without further adjustment (Table 2). The 70–120 kJ/mol range reported for methane C–H activation on solid metal surfaces [18] is not directly transferable to a p-block metal and was therefore not used to modify the BEP result. Instead, its uncertainty is explored through a multiplicative factor, fk4 ϵ [0.1–10], on k4, which at 1173 K is equivalent to ±22.5 kJ/mol in Ea, comparable to the ±23.7 kJ/mol induced by S = 0.60 ± 0.10. The activation energy of the RWGS RDS is , reported in Table 2.
Pre-exponential factors were carried over unscaled (ASn = ANi), since a transition-state-theory estimate of the active-site density correction (approximately 0.58, from Sn liquid interatomic spacing) is smaller than the uncertainty in the activation entropy term itself [31], making the equal-prefactor assumption no less defensible than any alternative correction (Table 2).
2.4. Derived Rate Expressions
Applying the quasi-equilibrium approximation to all non-RDS steps and solving the active-site balance yields closed-form L–H rate expressions for DRM and RWGS sharing a common denominator Ω that describes site competition among all adsorbed species [32]:
where .
The bracketed terms in Equations (9) and (10) are thermodynamic driving forces that vanish identically as each reaction approaches its own equilibrium, ensuring that the rate expressions self-regulate without artificial cutoffs as the reactor approaches thermodynamic limits.
2.5. Carbon Formation Pathway
Two carbon-forming reactions were evaluated within the same L–H formalism and active-site denominator: methane cracking, CH4 → C(s) + 2H2, sharing its RDS with DRM, and the Boudouard reaction, 2CO → C(s) + CO2, for which CO dissociative adsorption was assigned as the RDS by analogy with the high barrier reported for C≡O activation on metals lacking accessible d-states for back-donation. Applying Equation (5) to CO dissociation (Δ = 1072 kJ/mol; [9]) predicts rendering this pathway kinetically frozen on Sn irrespective of its local thermodynamic favorability. The same scaling applied to methane cracking gives
2.6. Reaction Model and Base Case
The reactor is described as a two-phase bubble column in the homogeneous (bubbly) regime. The liquid tin is treated as a well-mixed, isothermal medium that holds the active surface, while the gas phase, whose composition evolves, rises as a stream of bubbles and is modeled as plug flow, as adopted by Plevan et al. [4] for the liquid section of their reactor. The well-mixed character of the liquid is represented by a uniform temperature and by a single bulk carbon concentration (Equation (5)). Axial dispersion of the gas is neglected. To bound its effect, the first-order approach to equilibrium used in the sensitivity analysis (X/Xeq = 1 − e−Da for plug flow, Da/(1 + Da) for a fully mixed gas; Da ≈ 22 at 1173 K) indicates that a fully mixed gas would lower X/Xeq by about 4% at 1173 K, by at most 10% at 1123 K and by about 23% near the regime boundary (1073 K). The qualitative results (regime transition, equilibrium-limited conversion at high temperature) do not change; the boundary would move to somewhat higher temperature. The base case is summarized in Table 3.
Table 3.
The base case of the illustrative simulation.
Isothermal operation is a simplifying assumption. For equilibrium conversion at 1173 K the reactions absorb 8.9 W while the gas stream carries only 5 × 10⁻³ W/K, so an adiabatic reactor would require a temperature drop of ≈1.8 × 10³ K: the gas cannot sustain the reaction and the heat must come from the bath. The heat capacity of the tin bath (≈9 × 10² J/K) exceeds that of the gas held up in the reactor (≈10−2 J/K) by a factor of ≈9 × 10⁴, so the bath is expected to behave as a thermostat. No energy balance with finite heat-transfer rates has been solved, however; non-isothermal modeling, which is essential given the strongly endothermic character of DRM, remains a future step (the adiabatic mode could not be solved with the DWSIM settings used here).
3. Framework Demonstration and Sensitivity Analysis
The derived rate expressions were implemented as a custom Python kinetic script in DWSIM version 9.0.2, an open-source chemical process simulator, to demonstrate the framework on an isothermal reactor (Table 3). The use of an open-source environment was a deliberate choice, intended to show that detailed, non-standard heterogeneous kinetics can be incorporated into process-scale simulation without commercial licenses. The outputs are illustrative: they show how the framework behaves and which uncertainties dominate, not what a liquid tin reactor will deliver. The base-case Excel workbook, the corresponding Python scripts, and the complete DWSIM simulation file (.dwxmz) are available in the public repository: https://github.com/brunoagun/Modelo-Cinetico-DRM-DWSIM (accessed on 20 October 2026).
3.1. Reactor Case Study and Temperature Dependence
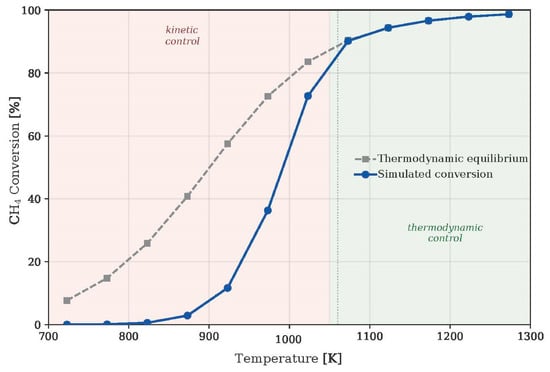
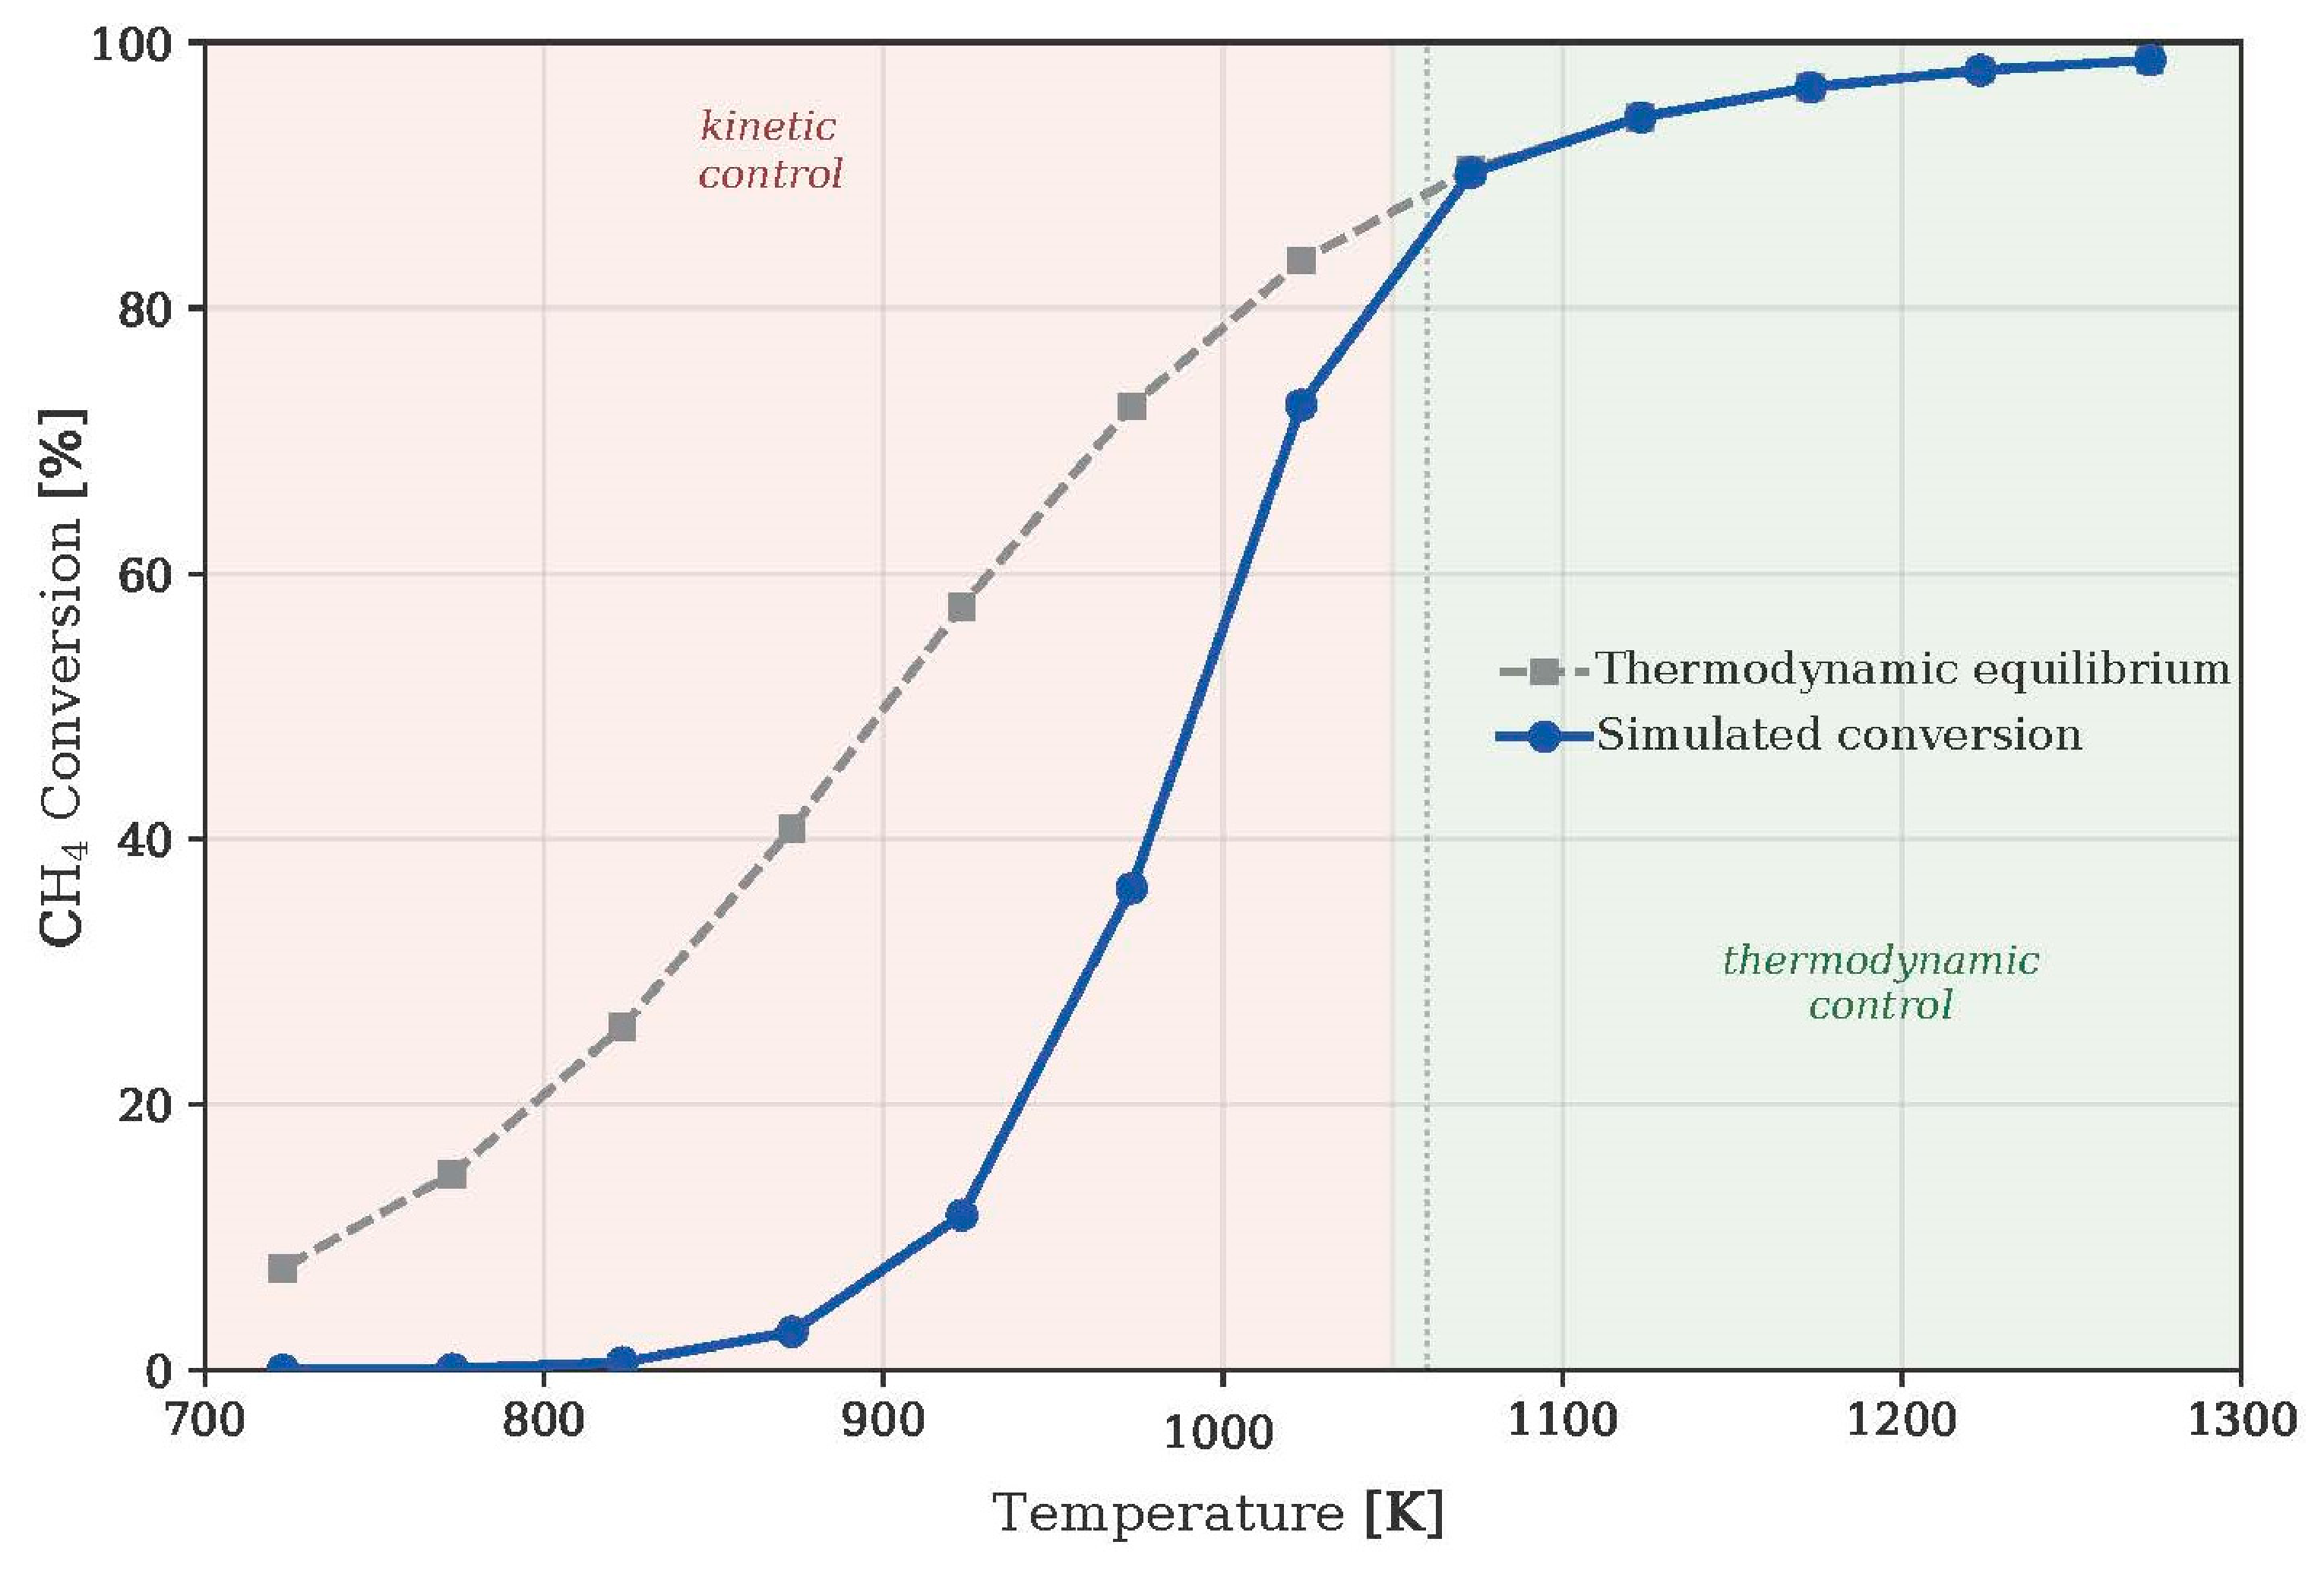
Figure 2 compares the simulated CH4 conversion with the thermodynamic equilibrium conversion, computed independently by Gibbs energy minimization over CH4, CO2, CO, H2 and H2O. At 723 K the simulated conversion is 0.01% against an equilibrium value of 7.7%, and at 923 K it is 11.7% against 57.5%; the reactor is under kinetic control. From 1073 K the simulated and equilibrium conversions coincide within 0.01 percentage points, i.e., the reactor is under thermodynamic control. That a reactor with Arrhenius kinetics and an endothermic reaction moves from kinetic to thermodynamic control as temperature rises is expected; what is specific to this framework is the location of the boundary, 1050–1073 K, which follows from the BEP-scaled activation energies and the residence time, and which is a testable prediction.
Figure 2.
Simulated CH4 conversion (blue) and thermodynamic equilibrium conversion (grey) as a function of temperature, for the equimolar feed of the base case. The reactor operates under kinetic control at low temperature (the simulated conversion remains below equilibrium) and under thermodynamic control at high temperature (both coincide), with the boundary between regimes located around 1050–1073 K. The vertical dashed line indicates the operating temperature of the base case, located within the transition range.
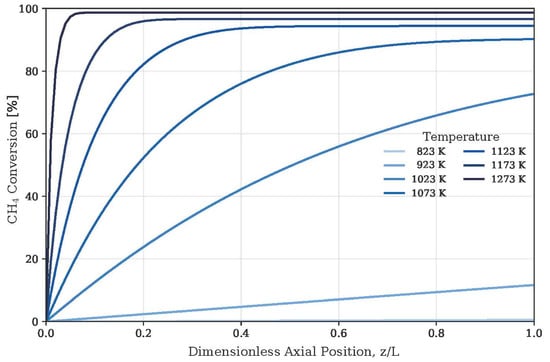
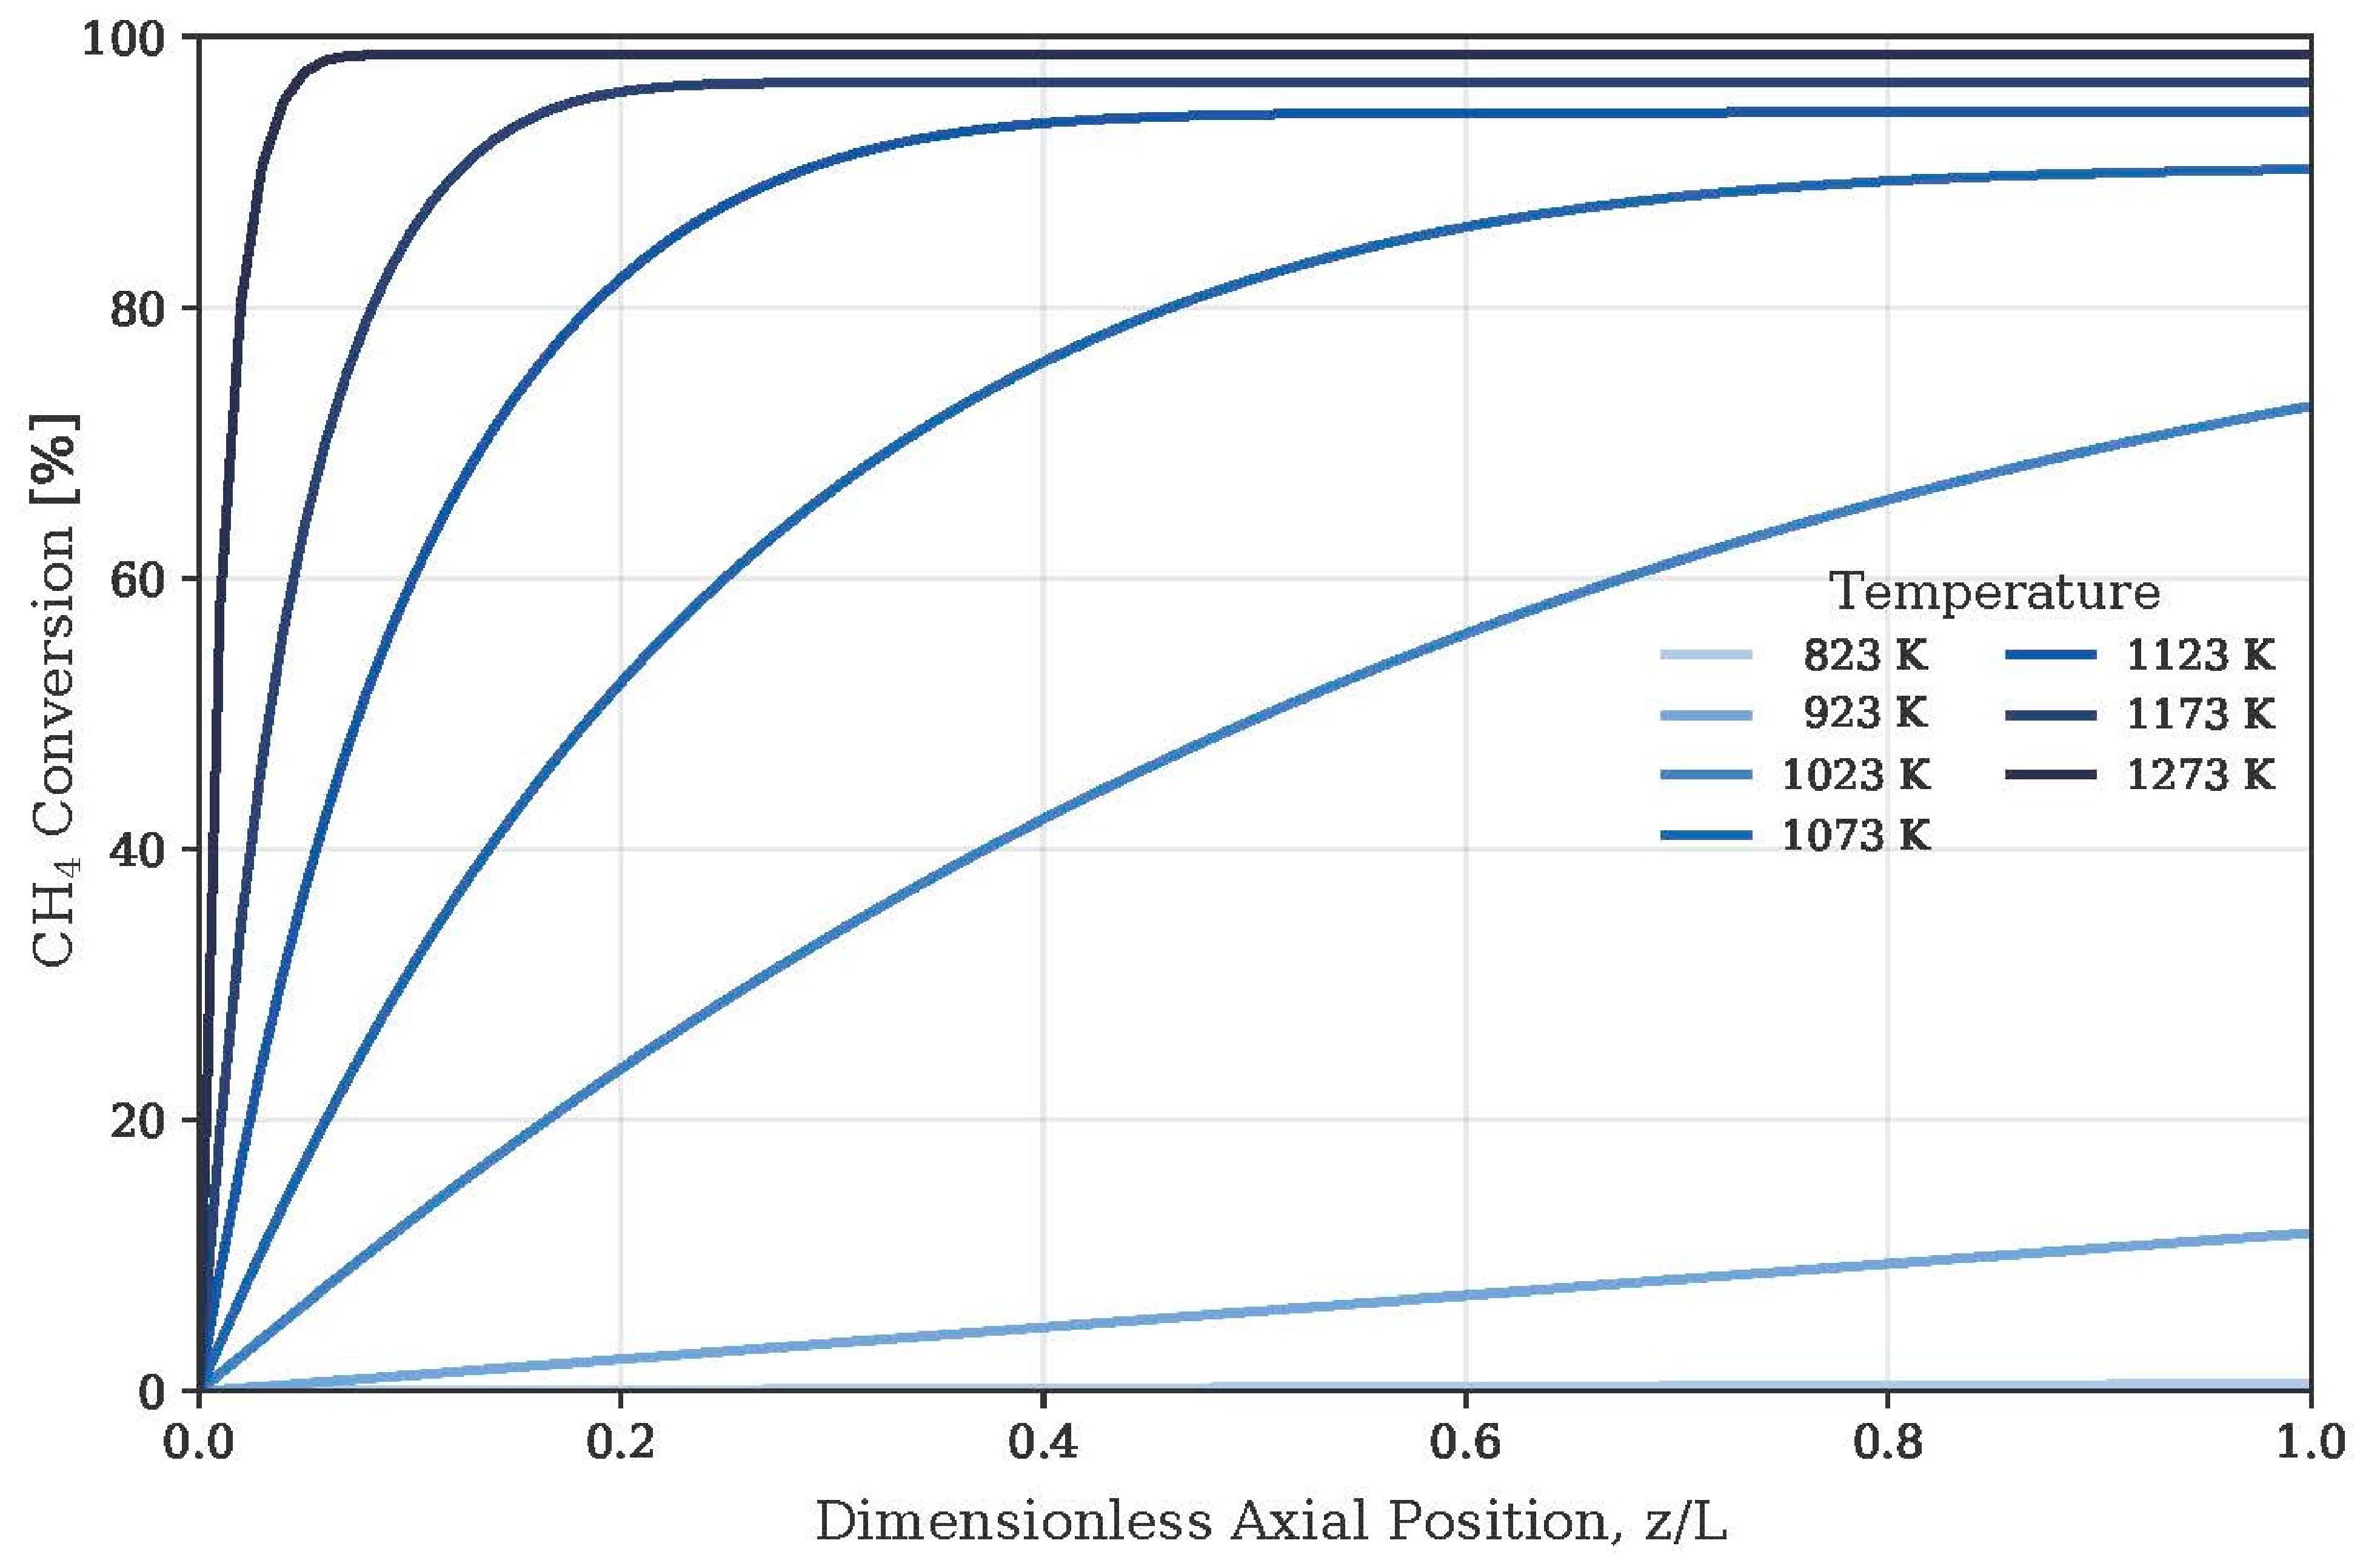
The axial profiles (Figure 3) show the same transition. At 823 K, conversion grows almost linearly along the whole 0.6 m, whereas 99% of the exit conversion is reached within 588 mm at 1023 K, 234 mm at 1123 K and 36 mm (6% of the length) at 1273 K. Above the boundary, the reactor is therefore strongly oversized, and neither more volume nor a more active surface would change the conversion; only a shift of the equilibrium (temperature, pressure, feed) would. The H2/CO ratio stays below unity (0.97–0.98 at high temperature) because of the RWGS reaction.
Figure 3.
Axial CH4 conversion profiles versus dimensionless position z/L for a selection of temperatures. The shape of the profile evolves from gradual and increasing (kinetic control, at low temperature) to step-like (thermodynamic control, at high temperature), reflecting the compression of the reaction zone toward the reactor inlet as the temperature increases.
To assess the consistency of the simulated methane conversion with the carbon mass balance, Table 4 summarizes the DRM conversion, the methane demand associated with carbon formation, and the corresponding upper-bound correction for the coupled model at different temperatures.
Table 4.
Simulated CH4 conversion and carbon mass balance check (equimolar feed, 1 atm; % of the CH4 fed).
Above ≈1023 K the sum of the reforming conversion and the methane demanded by carbon formation exceeds 100% of the feed; the decoupled carbon sub-model counts the same methane twice. An approximate closure of the balance (proportional split of the available methane) lowers the conversion at 1173 K from 96.6% to 62.8%. Both figures are therefore upper-bound illustrative estimates, and the decoupled results are quantitatively consistent only below ≈1023 K.
3.2. Verification of the Simulation Tool
To check that DWSIM integrates the reactor balance correctly, the rate expressions and original constants from Benguerba et al. [5] (DRM and RWGS only) were run in the same environment under their experimental conditions (1 atm, CH4:CO2:N2 = 10:10:80, W/F = 14.3 g h/mol, 723–923 K). The simulated CH4 conversions (15.9, 29.3, 47.0, 66.1 and 81.9% from 723 to 923 K) follow the experimental trend (22.4, 45.2, 71.9, 84.1 and 91.4%) and lie below the five-reaction model from [5] (21.0, 38.8, 61.9, 82.5 and 90.8%), as expected because the carbon reactions that also consume CH4 are not included. This is a verification of the simulator, not a validation of the liquid tin model: constants fitted for one rate-law form cannot be inserted in a different one, so no experimental data exist against which the present model can be validated.
3.3. Carbon Formation Assessment
The steady-state surface carbon coverage depends strongly on the dissolution constant: <1 required kdiss above roughly 10−7 mol/kg s at low temperature, and the slowest-dissolution scenario becomes physically infeasible (>1) above 823 K. Table 5 gives the saturation time for three scenarios of slow, central and fast dissolution.
Table 5.
Saturation time tsat [h], Equation (6), and the decoupled carbon sub-model. Csat corresponds to 5, 20 or 50 mol/m3 for the different scenarios.
The saturation time depends on temperature: it is 30–300 h at 723 K but only 2–24 min at 1073–1173 K (central scenario 8–10 min). Because the decoupled model overestimates carbon formation above 1023 K, the high-temperature values are conservative lower bounds. Moreover, tsat assumes that all carbon dissolves before leaving the bath; buoyant segregation and bubble flotation, which are independent of saturation, are not included. Conclusions on extraction frequency therefore cannot be drawn from tsat alone and depend on the operating temperature.
3.4. Sensitivity Analysis and Parameter Ranking
Local sensitivity coefficients Si = (θi/r)(∂r/∂θi) were derived analytically from Equations (9) and (10) of the rate expressions. The rate constants k4 and k11 and the factor ηGL have S = 1 exactly; the adsorption constants are secondary, with SK1 = 0.75 at the inlet and 0.99 at the outlet and |S| < 0.21 for the others at 1173 K. These coefficients refer to the rate; they only reach conversion under kinetic control, where the sensitivity of the conversion to ηGL falls from ≈1 at 975 K to 0.47 at 1023 K, 0.05 at 1073 K and zero above 1123 K. Table 6 ranks them by the measurement priority they imply.
Table 6.
Ranking of uncertain parameters.
The ranking depends on the output considered, and the uncertainties are almost decoupled: conversion responds to fk4 and ηGL but not to kdiss or Csat, whereas carbon feasibility and saturation time respond to kdiss and Csat. The H2/CO ratio does not respond to any of the four. In the explored ranges, 66% of the samples give conversions above 95%, because most parameter combinations place the reactor under thermodynamic control.
4. Discussion and Future Work
The framework reproduces the internal structure expected of a thermodynamically consistent kinetic model: rate expressions self-regulate near equilibrium without empirical cutoffs; simulated conversions are bounded above, and those above ≈1073 K coincide with the independently computed equilibrium; and the Boudouard route is suppressed both kinetically and thermodynamically. These results demonstrate methodological soundness, not quantitative accuracy; every Sn-specific input originates from scaling relationships, analogy or single literature values, and the main limitations are the borrowed RDS assignment (Section 2.1), the plug-flow description of the gas (Section 2.6), the isothermal assumption, and the decoupled carbon sub-model, which is inconsistent in mass above ≈1023 K (Table 4).
The H2/CO ratio stays at or below unity because of the RWGS reaction. This is a limitation for routes that need a ratio close to 2, such as methanol synthesis and Fischer–Tropsch synthesis over Co catalysts, which have low water–gas shift activity. Fe catalysts, which are active for the water–gas shift, tolerate ratios near or below unity because the CO excess is adjusted inside the synthesis with the water formed. Otherwise, the ratio can be raised with a downstream water–gas shift stage or H2 addition. As a future perspective, H2-selective membranes (Pd-based or proton-conducting ceramic) integrated in the gas outlet of the reactor could shift the equilibrium of DRM, lower the H2 available for the RWGS reaction and allow the syngas composition to be tailored within the same open-source framework. Their compatibility with temperatures above 1073 K, with carbon and with liquid tin is an open question.
The sensitivity analysis defined the measurements that would turn this framework into a validated tool:
- Gas–liquid transport: The diffusivity of CH4 and CO2 in liquid Sn and volumetric kL a under bubble-column hydrodynamics, to constrain ηGL.
- Adsorption energetics: The single-point adsorption calorimetry or temperature-programmed desorption of CH4, CO2, H2, CO and H2O on liquid Sn, together with DFT calculations of Sn surface energies and adsorption enthalpies, to replace the BEP-scaled values and bound S.
- Intrinsic kinetics: The conversion of CH4 and CO2 versus temperature (≈723–1050 K) and partial pressures under kinetic control, to regress k4 and k11, to measure reaction orders and apparent activation energies (which discriminate between RDS candidates, including a redox mechanism [14,22]) and to locate the regime boundary predicted at 1050–1073 K.
- Carbon handling: Controlled saturation experiments tracking dissolved carbon versus time and temperature, to determine DC, Csat and kdiss, together with quantifications of buoyant segregation and flotation.
The authors are currently designing a first experimental campaign on pure liquid tin, aimed at the kinetic regime, in order to extract the kinetic parameters of the model and to test the predicted position of the boundary.
5. Conclusions
This work presents a reproducible simulation methodology for transferring a detailed multi-step L–H kinetic model from a solid reference catalyst to a liquid tin reaction medium for which no kinetic data exist, using RDS identification, BEP parameter scaling, and thermodynamic consistency verification as sequential, falsifiable steps, and implementing the result in an open-source simulator. It does not provide a validated liquid tin kinetic model. In the illustrative case study, the reactor passes from kinetic to thermodynamic control near 1050–1073 K, which is a testable prediction of the scaled kinetics. The simulated conversions (≈97% of CH4 at 1173 K, ≈63% after approximate closure of the carbon mass balance) are upper-bound illustrative estimates, and the decoupled carbon sub-model is quantitatively consistent only below ≈1023 K. The Boudouard route is kinetically frozen and thermodynamically unfavourable above ≈984 K The time to carbon saturation depends strongly on temperature, from 30–300 h at 723 K to 2–24 min at 1073–1173 K, and does not by itself define an extraction frequency because flotation is not included. The sensitivity analysis shows that the BEP-scaled activation energy, the carbon dissolution constant and the gas–liquid effectiveness factor are the quantities to be measured first, and that conversion measurements under kinetic control are the most informative experiment, since they alone make the kinetics observable. Isothermal operation, plug-flow gas, the borrowed RDS and the decoupled carbon balance are the main limitations to be lifted in future work.
Supplementary Materials
The following supporting information can be downloaded at: https://www.mdpi.com/article/10.3390/engproc2026147025/s1, GitHub-brunoagun/Modelo-Cinetico-DRM-DWSIM · GitHub, It includes the DWSIM base-case simulation file (DRM_CasoBase_Tesis_BAG.dwxmz), which contains an isothermal plug-flow reactor (PFR) with heterogeneous catalytic reaction models for DRM and RWGS. The repository also includes the embedded Python scripts implementing the L–H kinetic expressions for DRM (DRM_Script) and RWGS (RWGS_Script), as well as two Python scripts for the decoupled modeling of carbon formation (Analsis_Carbon_BAG.py and Analsis_Carbon_CasoBase_BAG.py). Finally, the Excel workbook Calculos_DRM_BAG.xlsx contains numerical calculations and verification analyses.
Author Contributions
B.A.: Formal analysis, Investigation, Methodology, Software, Validation, Visualization, Writing—original draft. A.A.: Conceptualization, Supervision, Writing—review and editing. All authors have read and agreed to the published version of the manuscript.
Funding
This research received no external funding.
Data Availability Statement
The data supporting the findings of this study are available in the article and its Supplementary Materials. Further information can be obtained from the corresponding author upon reasonable request.
Conflicts of Interest
The authors declare no conflicts of interest.
Abbreviations
The following abbreviations are used in this manuscript:
| BEP | Brønsted–Evans–Polanyi |
| DRC | Degree of rate control |
| DRM | Dry reforming of methane |
| L–H | Langmuir–Hinshelwood |
| RDS | Rate-determining step |
| RWGS | Reverse water–gas shift |
| SCALMS | Supported catalytically active liquid metal solution |
References
- Agún, B.; Abánades, A. Comprehensive review on dry reforming of methane: Challenges and potential for greenhouse gas mitigation. Int. J. Hydrogen Energy 2025, 103, 395. [Google Scholar] [CrossRef] [Scilit]
- Abánades, A.; Ruiz, E.; Ferruelo, E.M. Experimental analysis of direct thermal methane cracking. Int. J. Hydrogen Energy 2011, 36, 12877. [Google Scholar] [CrossRef] [Scilit]
- Geißler, T.; Abánades, A.; Heinzel, A. Hydrogen production via methane pyrolysis in a liquid metal bubble column reactor with a packed bed. Chem. Eng. J. 2016, 299, 192. [Google Scholar] [CrossRef] [Scilit]
- Plevan, M.; Geißler, T.; Abánades, A. Thermal cracking of methane in a liquid metal bubble column reactor: Experiments and kinetic analysis. Int. J. Hydrogen Energy 2015, 40, 8020. [Google Scholar] [CrossRef] [Scilit]
- Benguerba, Y.; Dehimi, L.; Virginie, M. Numerical investigation of the optimal operative conditions for the dry reforming reaction in a fixed-bed reactor: Role of the carbon deposition and gasification reactions. React. Kinet. Mech. Catal. 2015, 115, 483–497. [Google Scholar] [CrossRef] [Scilit]
- Benguerba, Y.; Dehimi, L.; Virginie, M. Modelling of methane dry reforming over Ni/Al2O3 catalyst in a fixed-bed catalytic reactor. React. Kinet. Mech. Catal. 2014, 114, 109–119. [Google Scholar] [CrossRef] [Scilit]
- Abanades Velasco, A.; Martinez Rodriguez, A. Challenges for the development of numerical models for methane pyrolysis with liquid metal reactors. DYNA 2023, 98, 1. [Google Scholar] [CrossRef] [Scilit] [PubMed]
- Wittich, K.; Krämer, M.; Bottke, N.; Schunk, S.A. Catalytic Dry Reforming of Methane: Insights from Model Systems. ChemCatChem 2020, 12, 2130–2147. [Google Scholar] [CrossRef] [Scilit]
- Yusuf, M.; Beg, M.; Ubaidullah, M.; Shaikh, S.F.; Keong, L.K.; Hellgardt, K.; Abdullah, B. Kinetic studies for DRM over high-performance Ni–W/Al2O3–MgO catalyst. Int. J. Hydrogen Energy 2022, 47, 42150–42159. [Google Scholar] [CrossRef] [Scilit]
- Zaghloul, N.; Kodama, S.; Sekiguchi, H. Kinetic Study of Catalytic Surface Reaction in Methane Pyrolysis in Molten Metal Bubble Column Reactors. J. Chem. Eng. Jpn. 2023, 56, 2240859. [Google Scholar] [CrossRef] [Scilit]
- Le, D.K.; Lee, M.J.; Kwon, H. Bubble dynamics modeling with a chemical reaction for methane pyrolysis in molten tin via computational fluid dynamics. Int. J. Hydrogen Energy 2025, 139, 454–466. [Google Scholar] [CrossRef] [Scilit]
- Tavakoli, H.; Azadmehr, B.; Amirkhani, R. Kinetic sensitivity analysis of methane pyrolysis in molten tin bubble column reactors: A simplified fast computational framework. Int. J. Hydrogen Energy 2026, 227, 154573. [Google Scholar] [CrossRef] [Scilit]
- Cai, G.; Zong, Z.; Smith, K.J.; Upham, D.C. New molten metal catalysts for CO2 and CH4 conversion to 2:1 H2:CO syngas. Chem. Commun. 2023, 59, 8143. [Google Scholar]
- Cai, G.; RajaPrabu, N.S.; Srivastava, J.; Lechner, K.; Körber, J.; Zong, Z.; Smith, K.J.; Agarwal, V.; Upham, D.C. A melt-based reaction pathway for CO2 and CH4 conversion to syngas and carbon using liquid In–Sn. J. Catal. 2026, 453, 116465. [Google Scholar] [CrossRef] [Scilit]
- Wolf, M.; De Oliveira, A.L.; Taccardi, N. Dry reforming of methane over gallium-based supported catalytically active liquid metal solutions. Commun. Chem. 2023, 6, 224. [Google Scholar] [CrossRef] [Scilit] [PubMed]
- Palmer, C.; Upham, D.C.; Smart, S. Dry reforming of methane catalysed by molten metal alloys. Nat. Catal. 2020, 3, 83–89. [Google Scholar] [CrossRef] [Scilit]
- Campbell, C.T. Finding the Rate-Determining Step in a Mechanism. J. Catal. 2001, 204, 520. [Google Scholar] [CrossRef] [Scilit]
- Wei, J.; Iglesia, E. Isotopic and kinetic assessment of the mechanism of reactions of CH4 with CO2 or H2O to form synthesis gas and carbon on nickel catalysts. J. Catal. 2004, 224, 370–383. [Google Scholar] [CrossRef] [Scilit]
- Blaylock, D.W.; Ogura, T.; Green, W.H. Computational Investigation of Thermochemistry and Kinetics of Steam Methane Reforming on Ni(111) under Realistic Conditions. J. Phys. Chem. C 2009, 113, 4898–4908. [Google Scholar] [CrossRef] [Scilit]
- Dietz, L.; Piccinin, S.; Maestri, M. Mechanistic Insights into CO2 Activation via Reverse Water–Gas Shift on Metal Surfaces. J. Phys. Chem. C 2015, 119, 4959–4966. [Google Scholar] [CrossRef] [Scilit]
- Gokhale, A.A.; Dumesic, J.A.; Mavrikakis, M. On the Mechanism of Low-Temperature Water Gas Shift Reaction on Copper. J. Am. Chem. Soc. 2008, 130, 1402–1414. [Google Scholar] [CrossRef] [Scilit] [PubMed]
- Grabow, L.C.; Mavrikakis, M. Mechanism of Methanol Synthesis on Cu through CO2 and CO Hydrogenation. ACS Catal. 2011, 1, 365–384. [Google Scholar] [CrossRef] [Scilit]
- Higbie, R. The Rate of Absorption of a Pure Gas into a Still Liquid during Short periods of Exposure. Trans. Am. Inst. Chem. Eng. 1935, 31, 365–389. [Google Scholar]
- Redhead, P.A. Thermal desorption of gases. Vacuum 1962, 12, 203–211. [Google Scholar] [CrossRef] [Scilit]
- Chorkendorff, I.; Niemantsverdriet, J.W. Concepts of Modern Catalysis and Kinetics, 3rd ed.; Wiley-VCH: Weinheim, Germany, 2017. [Google Scholar]
- Iida, T.; Guthrie, R.I.L. The Physical Properties of Liquid Metals/Takamichi Iida and Roderick I.L. Guthrie; Clarendon Press: Oxford, UK, 1988. [Google Scholar]
- Tazhibayeva, I.; Ponkratov, Y.; Lyublinsky, I. Study of liquid tin-lithium alloy interaction with structural materials of fusion reactor at high temperatures. Nucl. Mater. Energy 2022, 30, 101152. [Google Scholar] [CrossRef] [Scilit]
- Raman, N.; Maisel, S.; Grabau, M. Highly Effective Propane Dehydrogenation Using Ga–Rh Supported Catalytically Active Liquid Metal Solutions. ACS Catal. 2019, 9, 9499. [Google Scholar] [CrossRef] [Scilit] [PubMed]
- Taccardi, N.; Grabau, M.; Debuschewitz, J. Gallium-rich Pd–Ga phases as supported liquid metal catalysts. Nat. Chem. 2017, 9, 862–867. [Google Scholar] [CrossRef] [Scilit] [PubMed]
- Boukhvalov, D.W.; D’olimpio, G.; Mazzola, F. Unveiling the Catalytic Potential of Topological Nodal-Line Semimetal AuSn4 for Hydrogen Evolution and CO2 Reduction. J. Phys. Chem. Lett. 2023, 14, 3069. [Google Scholar] [CrossRef] [Scilit] [PubMed]
- Campbell, C.T.; Sellers, J.R.V. The Entropies of Adsorbed Molecules. J. Am. Chem. Soc. 2012, 134, 18109–18115. [Google Scholar] [CrossRef] [Scilit] [PubMed]
- Agún, B.; Abánades, A. A methodological simulation framework for implementing a detailed kinetic model using DWSIM for dry reforming of methane in a liquid metal reactor. Int. J. Hydrogen Energy 2026, 255, 15383. [Google Scholar] [CrossRef] [Scilit]

Disclaimer/Publisher’s Note: The statements, opinions and data contained in all publications are solely those of the individual author(s) and contributor(s) and not of MDPI and/or the editor(s). MDPI and/or the editor(s) disclaim responsibility for any injury to people or property resulting from any ideas, methods, instructions or products referred to in the content. |
© 2026 by the authors. Licensee MDPI, Basel, Switzerland. This article is an open access article distributed under the terms and conditions of the Creative Commons Attribution (CC BY) license.