


Abstract
With the continuous emergence of high-rise building structures, the efficient and accurate realization of elastic-plastic time–history response analysis of complex structures under rare seismic actions has gradually become a hot issue in structural design. This project combines the software ABAQUS with professional design software ETABS and SAP2000, using refined concrete and steel constitutive models to establish a valuable method to replace expensive full-scale experimental tests. The main research work includes developing interface programs for model conversion, verifying constitutive models through experimental comparisons, and analyzing the seismic performance of reinforced concrete frame-shear wall structures and large-span steel truss structures under rare earthquakes. The results demonstrate that the proposed techniques can effectively predict damage states and weak links, providing an economical and reliable approach for seismic evaluation.
1. Introduction
1.1. Research Background
Earthquakes pose a significant threat to human society, causing loss of life, property damage, and economic disruption [1]. The Wenchuan earthquake in China (2008) highlighted serious loopholes in building quality and seismic design, emphasizing the need to enhance seismic standards and improve construction practices. Traditionally, seismic performance studies rely on physical tests, which are expensive and time-consuming [2]. In recent decades, computer simulation methods have emerged as practical alternatives, but their credibility depends on verification with real-world data.
1.2. Research Significance
This study aims to demonstrate that computer modeling, through appropriate verification, can serve as a reliable method to assess structural failure mechanisms under seismic action, identify plastic components, verify anti-collapse capacity, and adjust structural schemes in the design stage. This contributes to establishing a safer urban environment in earthquake-prone areas.
1.3. Research Problem Statement
Due to the complexity of elastoplastic calculations and the limitations of related tools, the analysis of rare seismic responses for complex structural engineering has not been widely adopted. This paper uses the ABAQUS 2025GA software to conduct a systematic analysis of the elastic-plastic characteristics of buildings under seismic action.
1.4. Research Objectives
The main objectives are:
- Achieve efficient model conversion from ETABS/SAP2000 to ABAQUS, improving analysis efficiency.
- Verify subroutine validity by comparing with experimental results and improve material models.
- Obtain damage conditions of key components (e.g., shear walls, frames) and evaluate seismic performance.
- Clarify failure modes and weak parts of large-span steel truss structures to assess anti-collapse capacity.
1.5. Research Methodology
A step-by-step approach is adopted:
- 1.
- Use interface programs to convert models from ETABS/SAP2000 to ABAQUS.
- 2.
- Select and compile concrete constitutive models based on ABAQUS secondary development.
- 3.
- Analyze an 8-story concrete frame-shear wall structure under rare seismic action.
- 4.
- Conduct nonlinear time–history analysis on Gymnasium to evaluate seismic response.
1.6. Scope of Work
The focus is on assessing seismic strength through computer simulation verified with real data, studying displacement, stress distribution, and potential failure zones.
2. Methodology
2.1. Program Development Technology
The interface program acts as a “translation bridge,” converting structural models from ETABS or SAP2000 into ABAQUS-readable formats [3]. The process begins with modeling in SAP2000, exporting as an ACCESS database, and using MATLAB R2025a to generate Python 3.13.0 scripts for ABAQUS. Key steps include data conversion and identification, and the process is illustrated in Figure 1 below to ensure accurate mapping of geometric and material properties [4].
Figure 1.
The flowchart of the program.
2.2. Enhanced Constitutive Models with Strain-Rate Effects
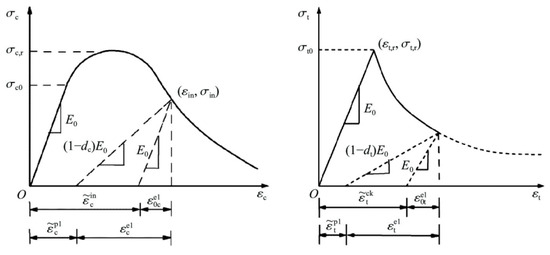
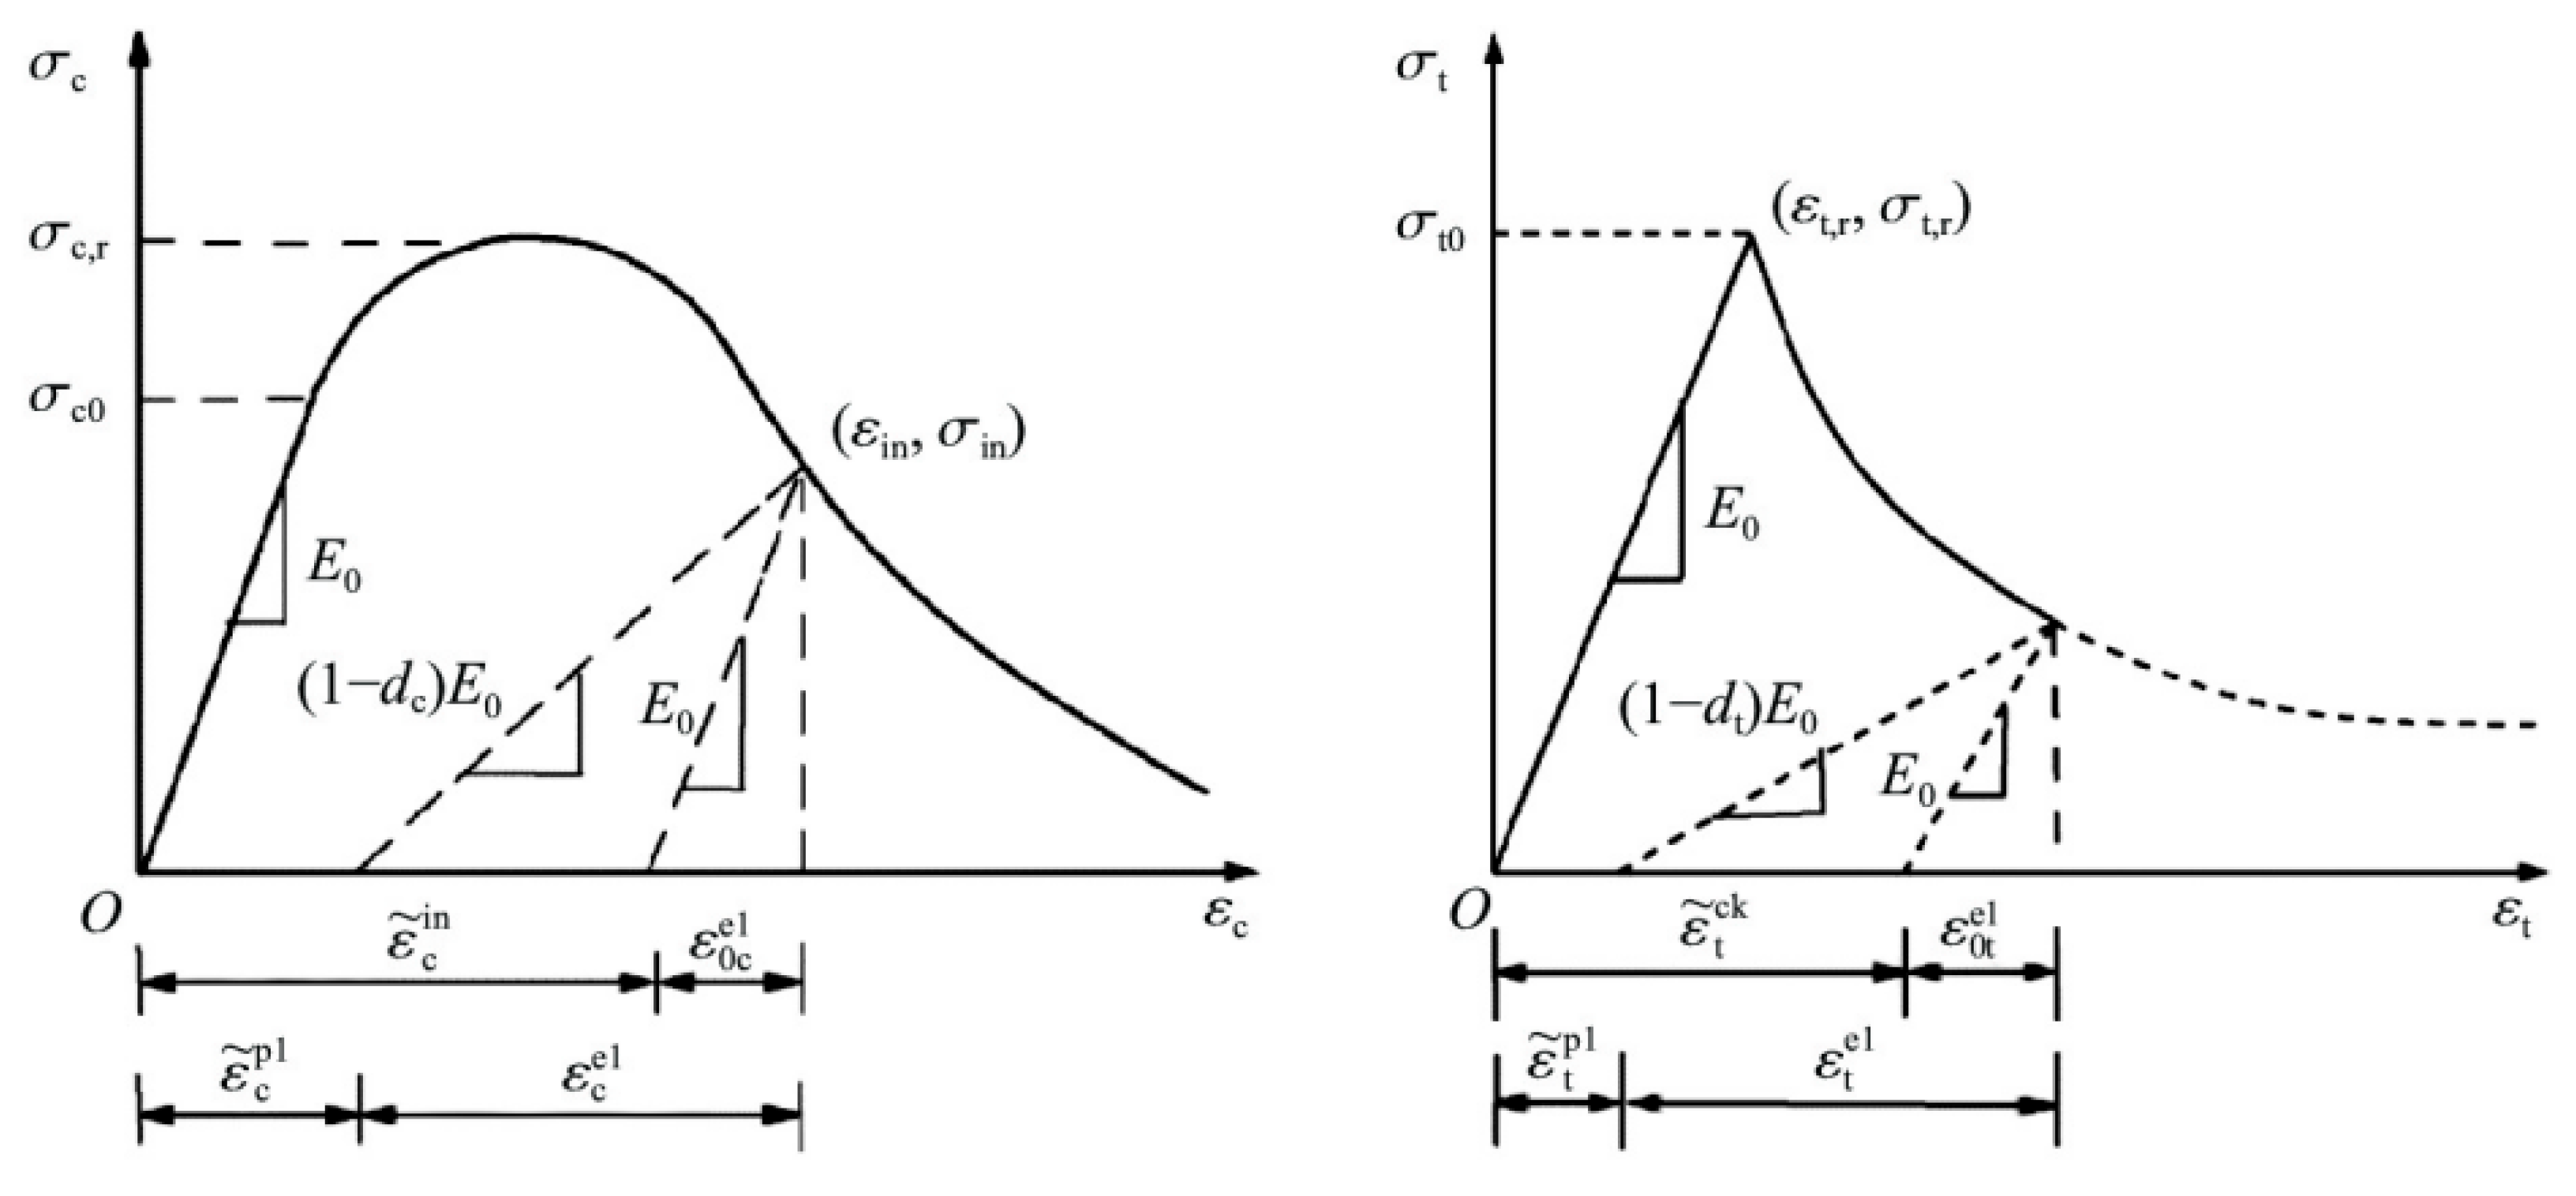
The concrete constitutive model is based on the Concrete02 model from OpenSEES, featuring a compressive backbone curve with parabolic ascending and linear descending segments, and a bilinear tensile model. The model accounts for stiffness degradation and damage accumulation under cyclic loading. To simulate the nonlinear behavior under seismic motion more accurately, a viscoelastic–viscoplastic constitutive model (similar to the CDP model in ABAQUS) was incorporated, with strain-rate related parameters [5]. Figure 2 shows the stress–strain curve of concrete under dynamic loading, which demonstrates the increase in peak stress and the changed softening behavior compared to static loading, indicating the effect of strain rate.
Figure 2.
Concrete tensile σ-ε curve and concrete compression σ-ε curve.
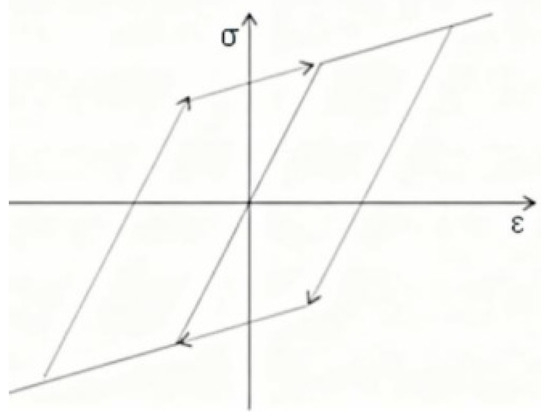
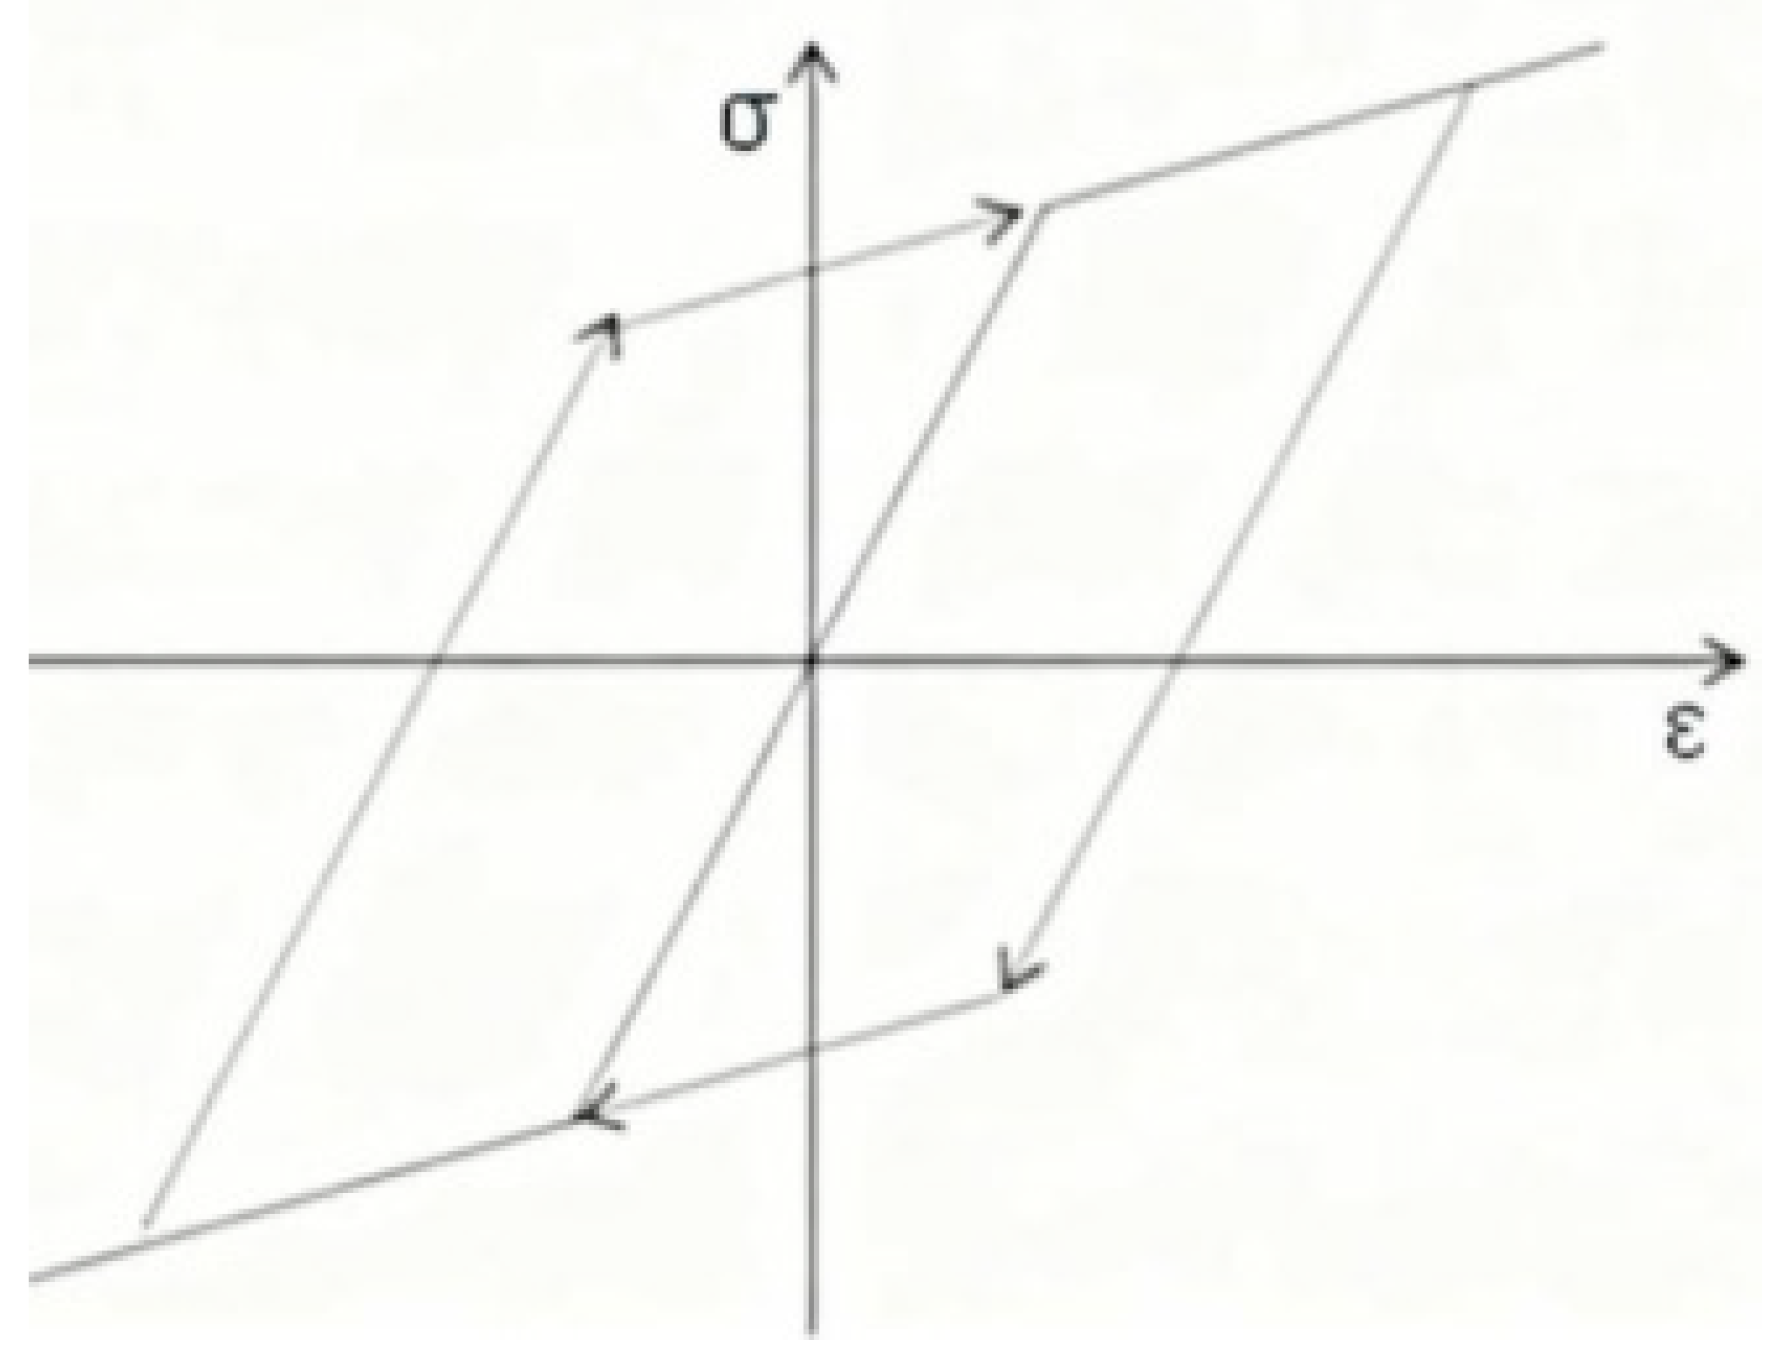
Steel is modeled using a bilinear kinematic hardening model, considering the Bauschinger effect. Under different loading rates, the hysteresis curve exhibits variations in the Bauschinger effect, validating the superiority of the rate-dependent model for seismic simulations. The hysteresis relationship curve is shown in Figure 3.
Figure 3.
The Hysteresis Curve of Tension and Compression of Steel.
2.3. Seismic Input Analysis with Multi-Directional Evaluation
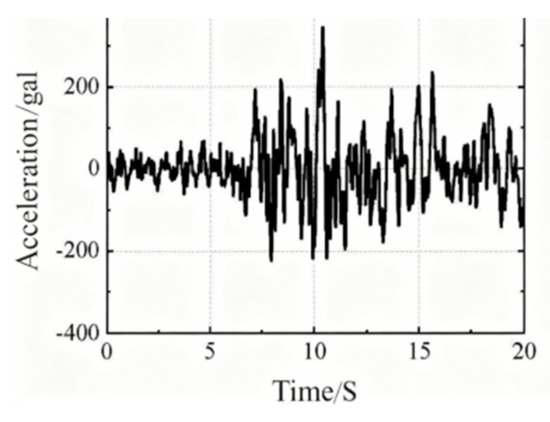
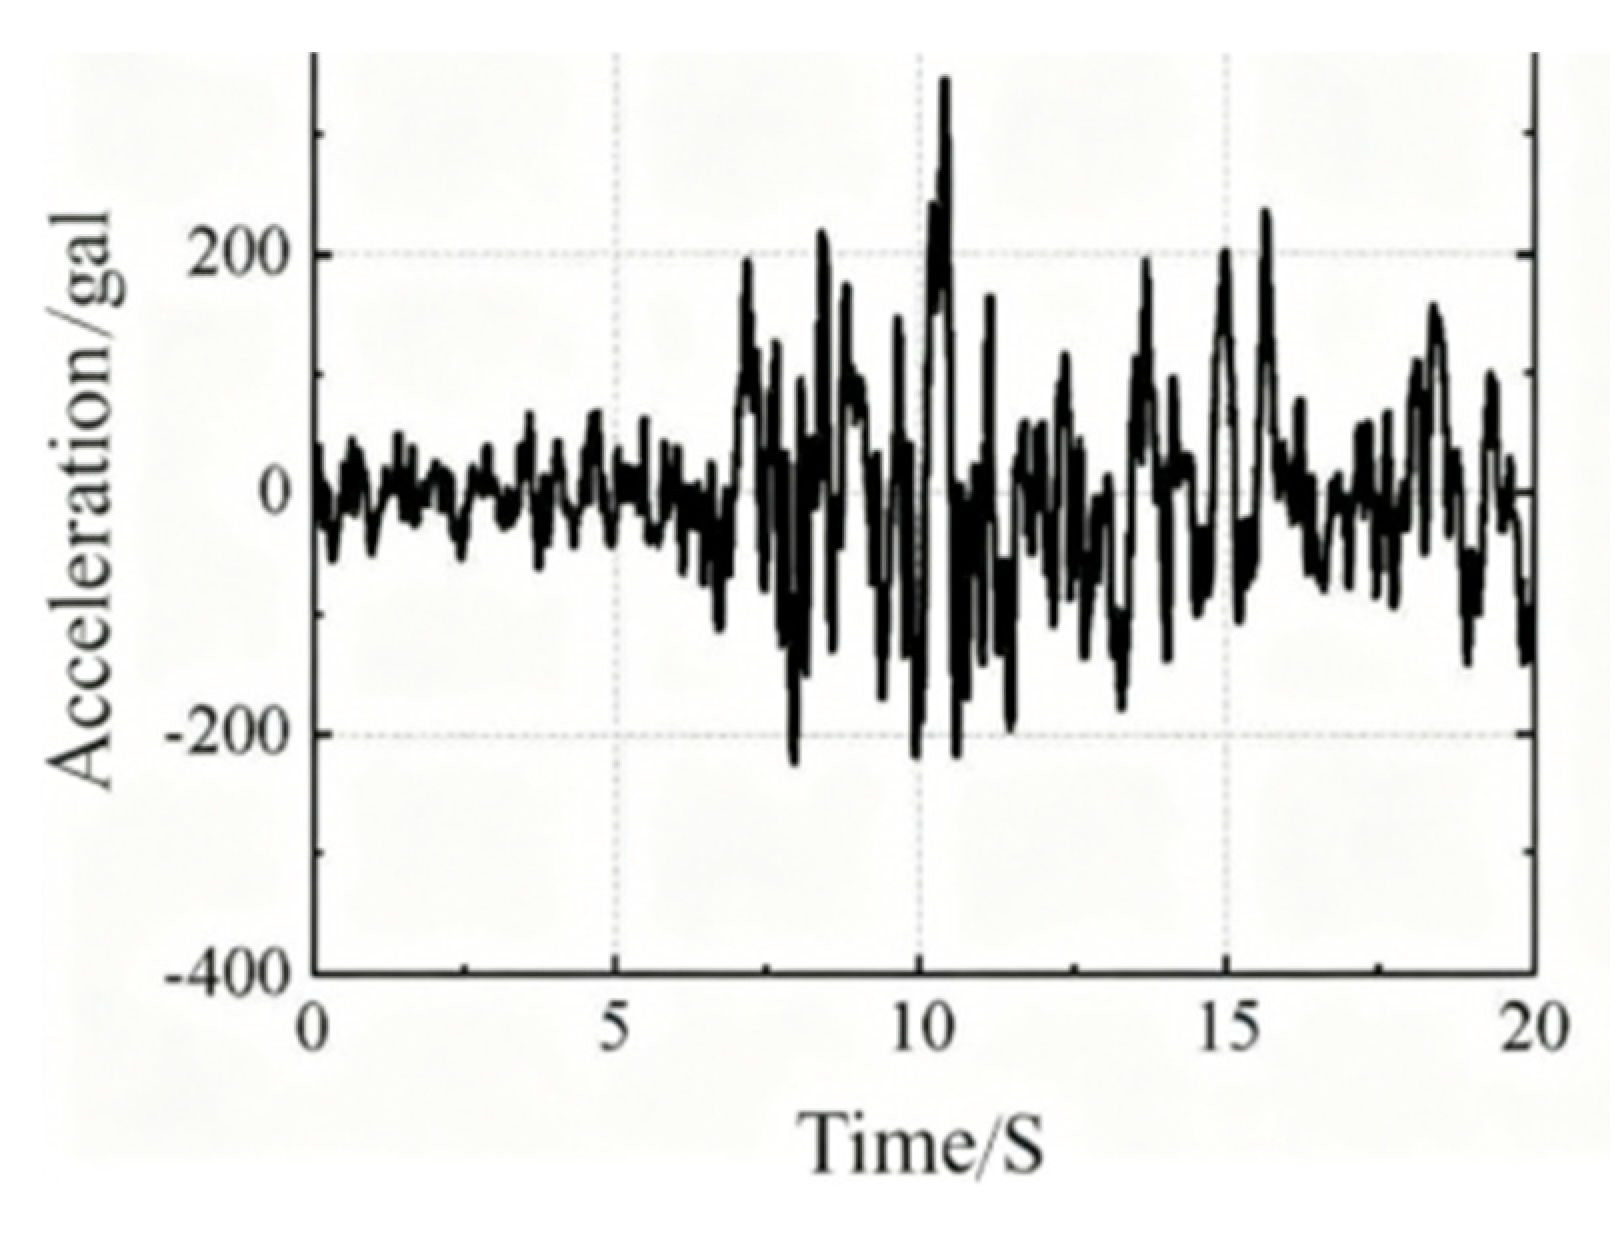
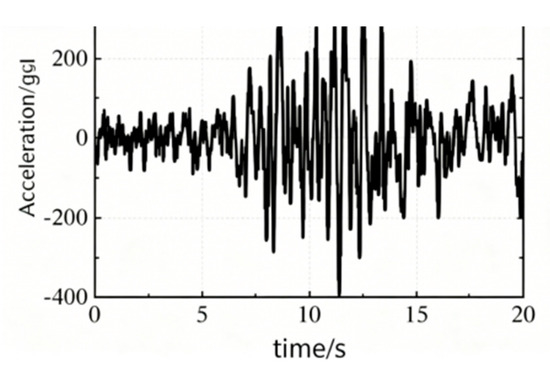
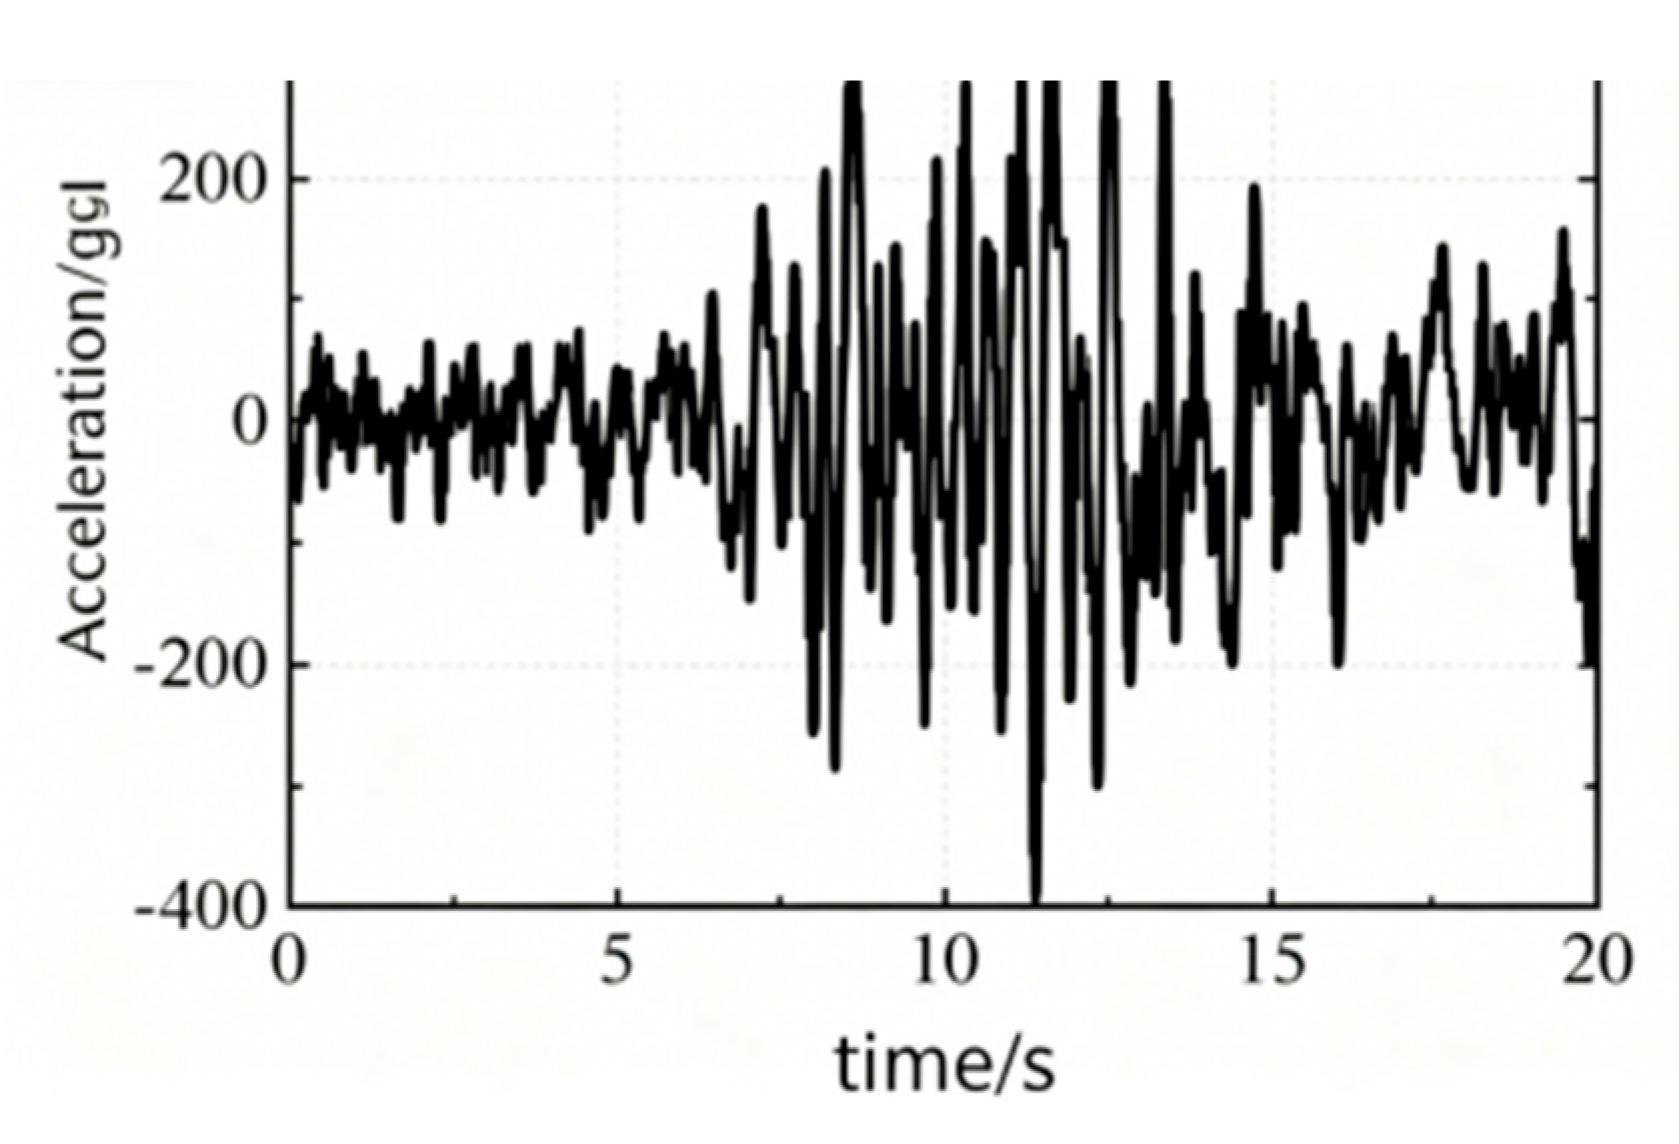
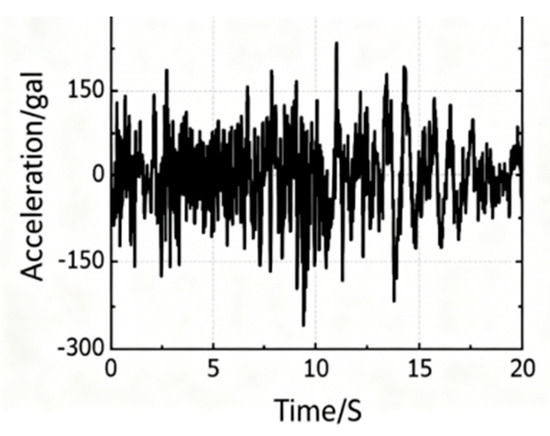
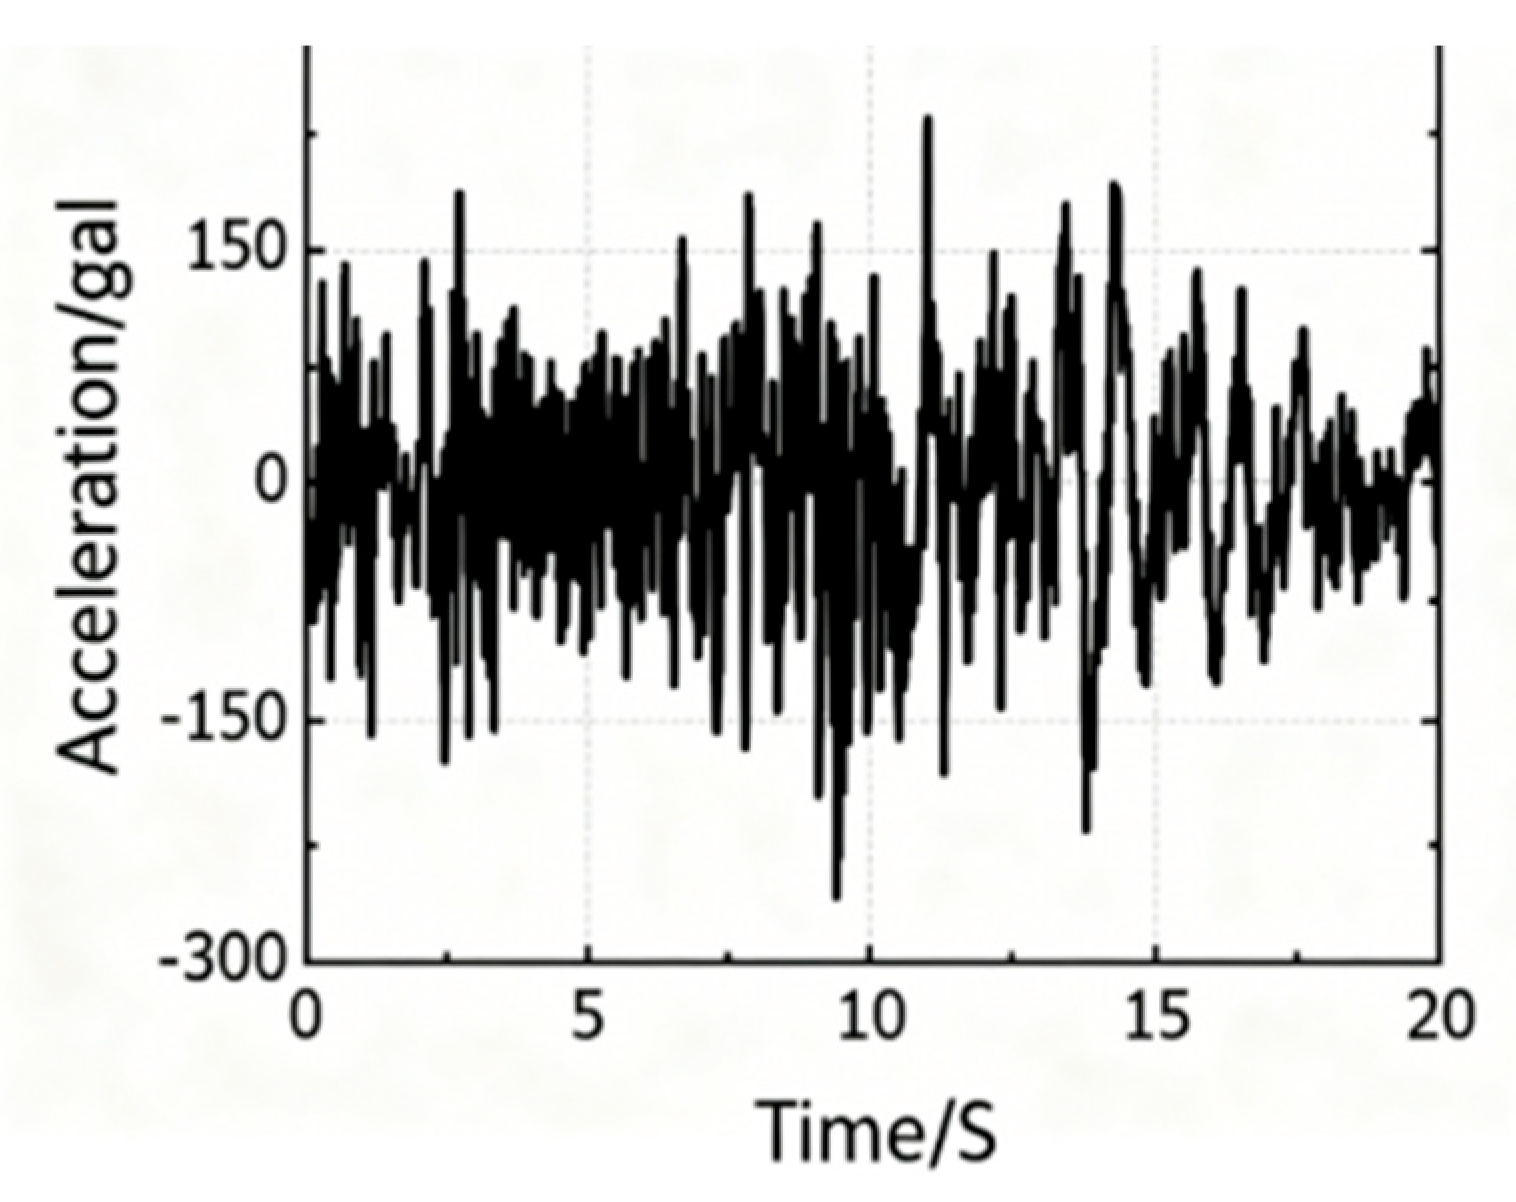
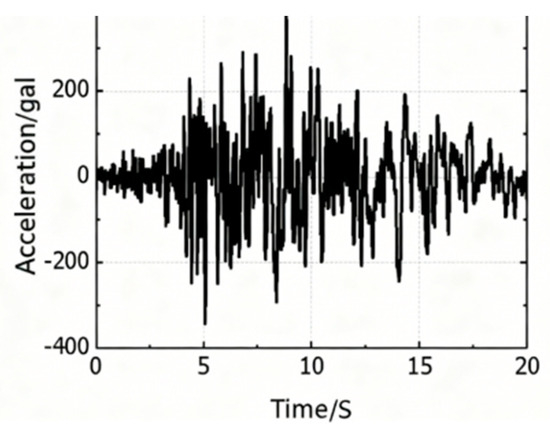
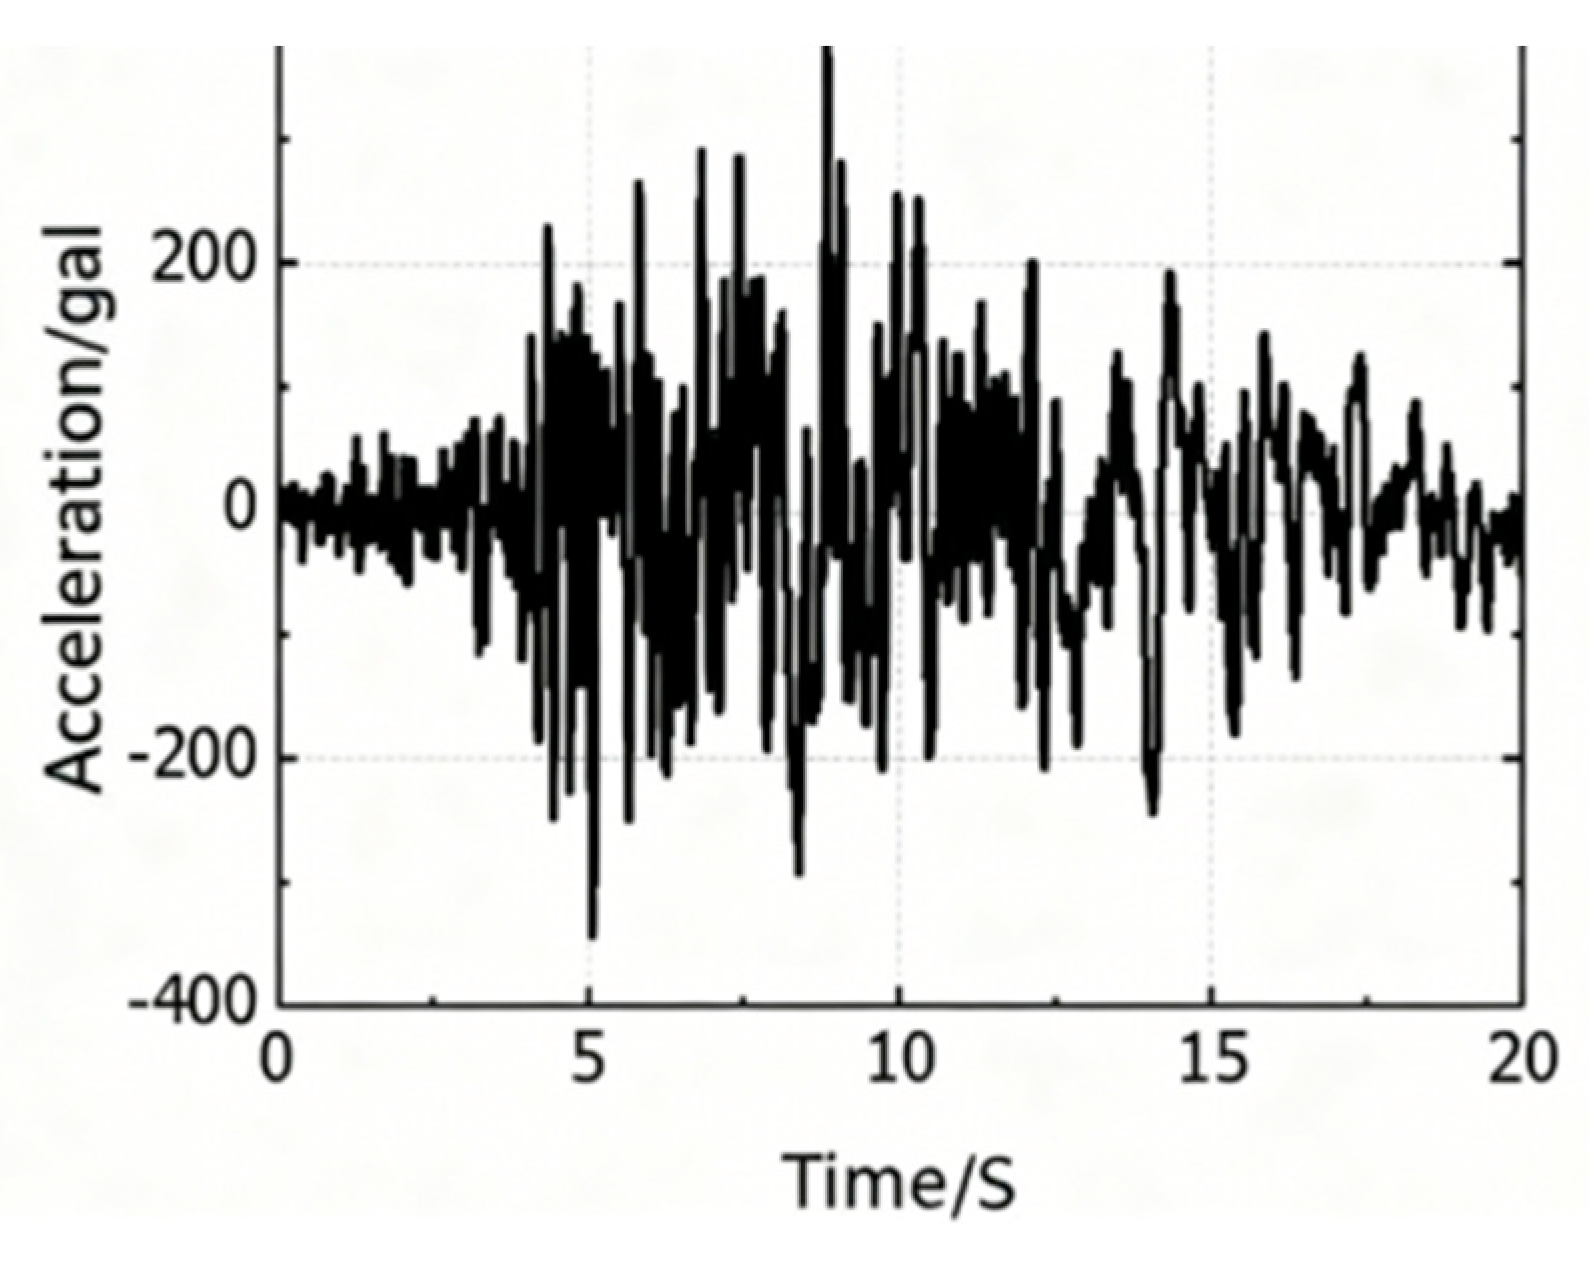
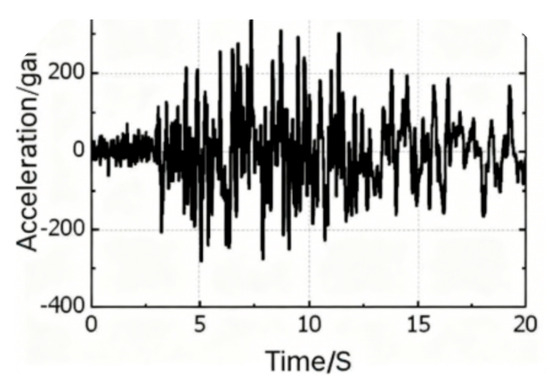
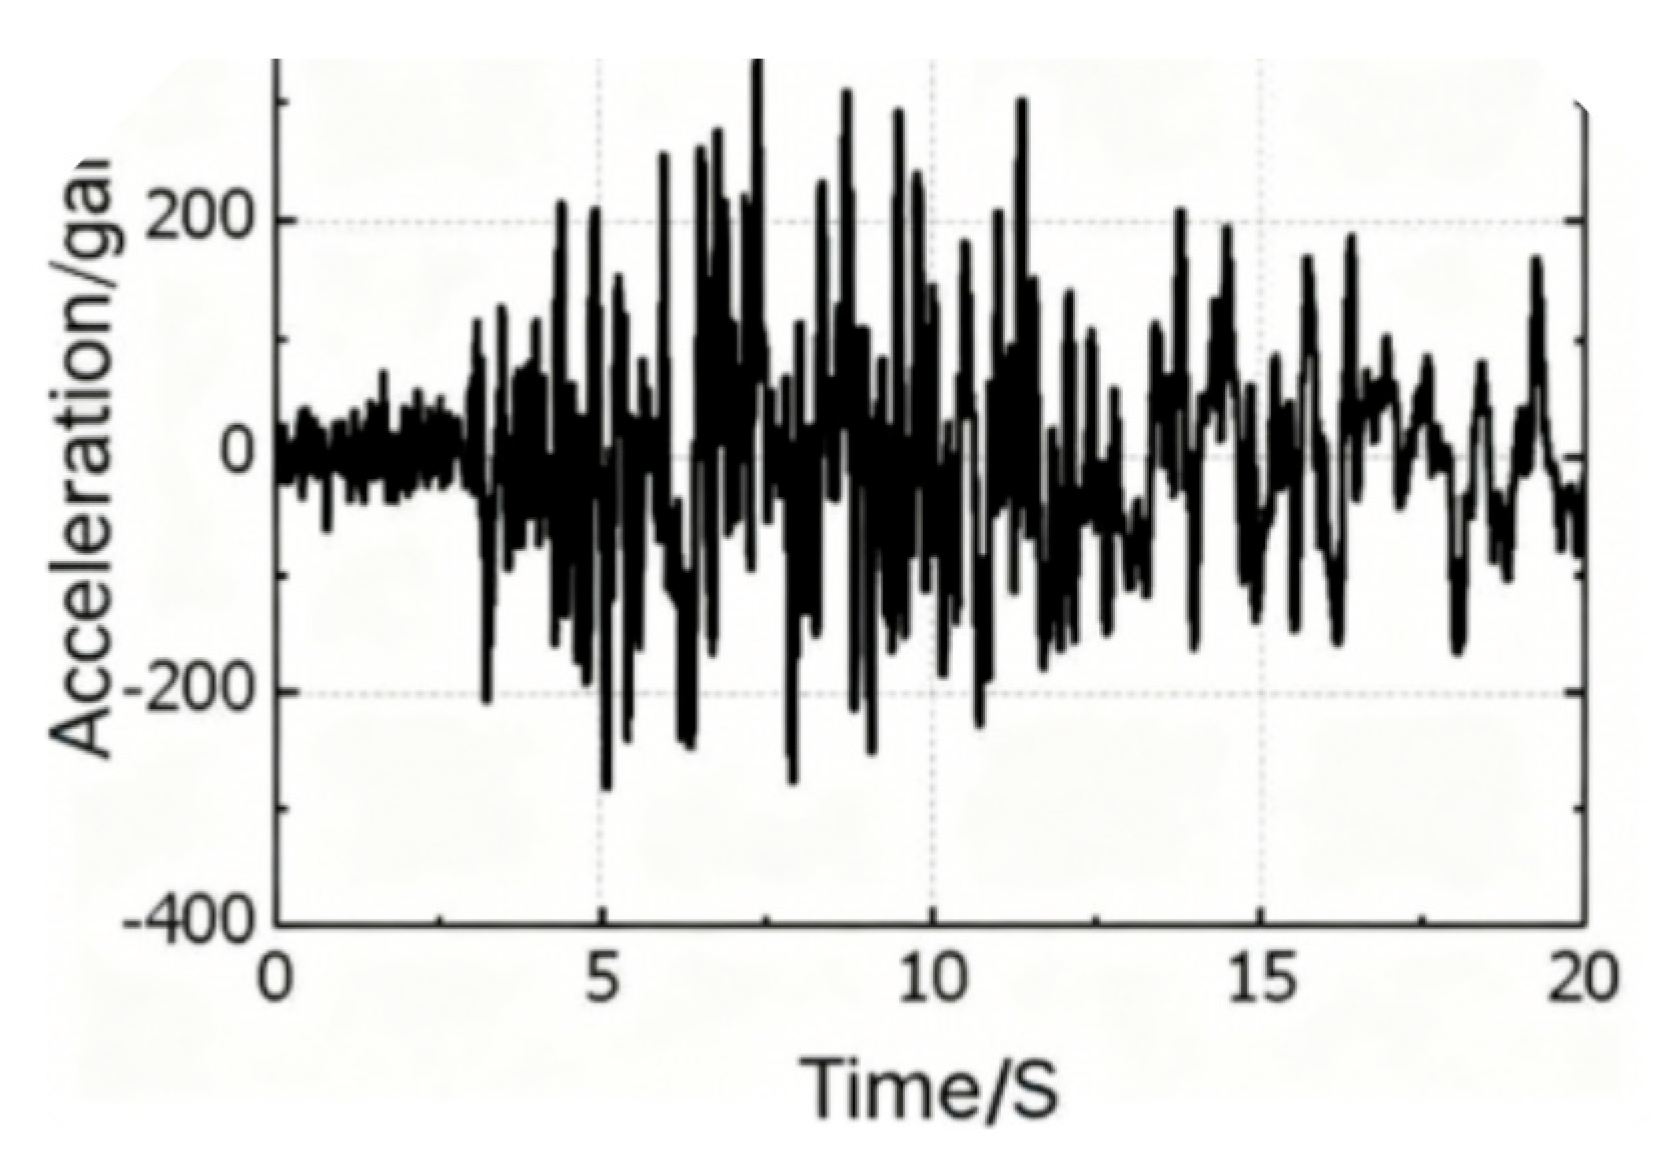
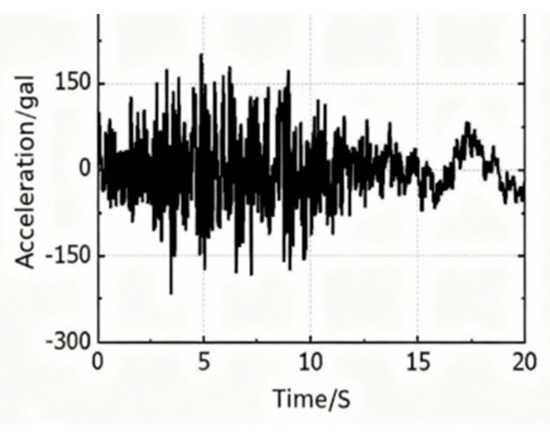
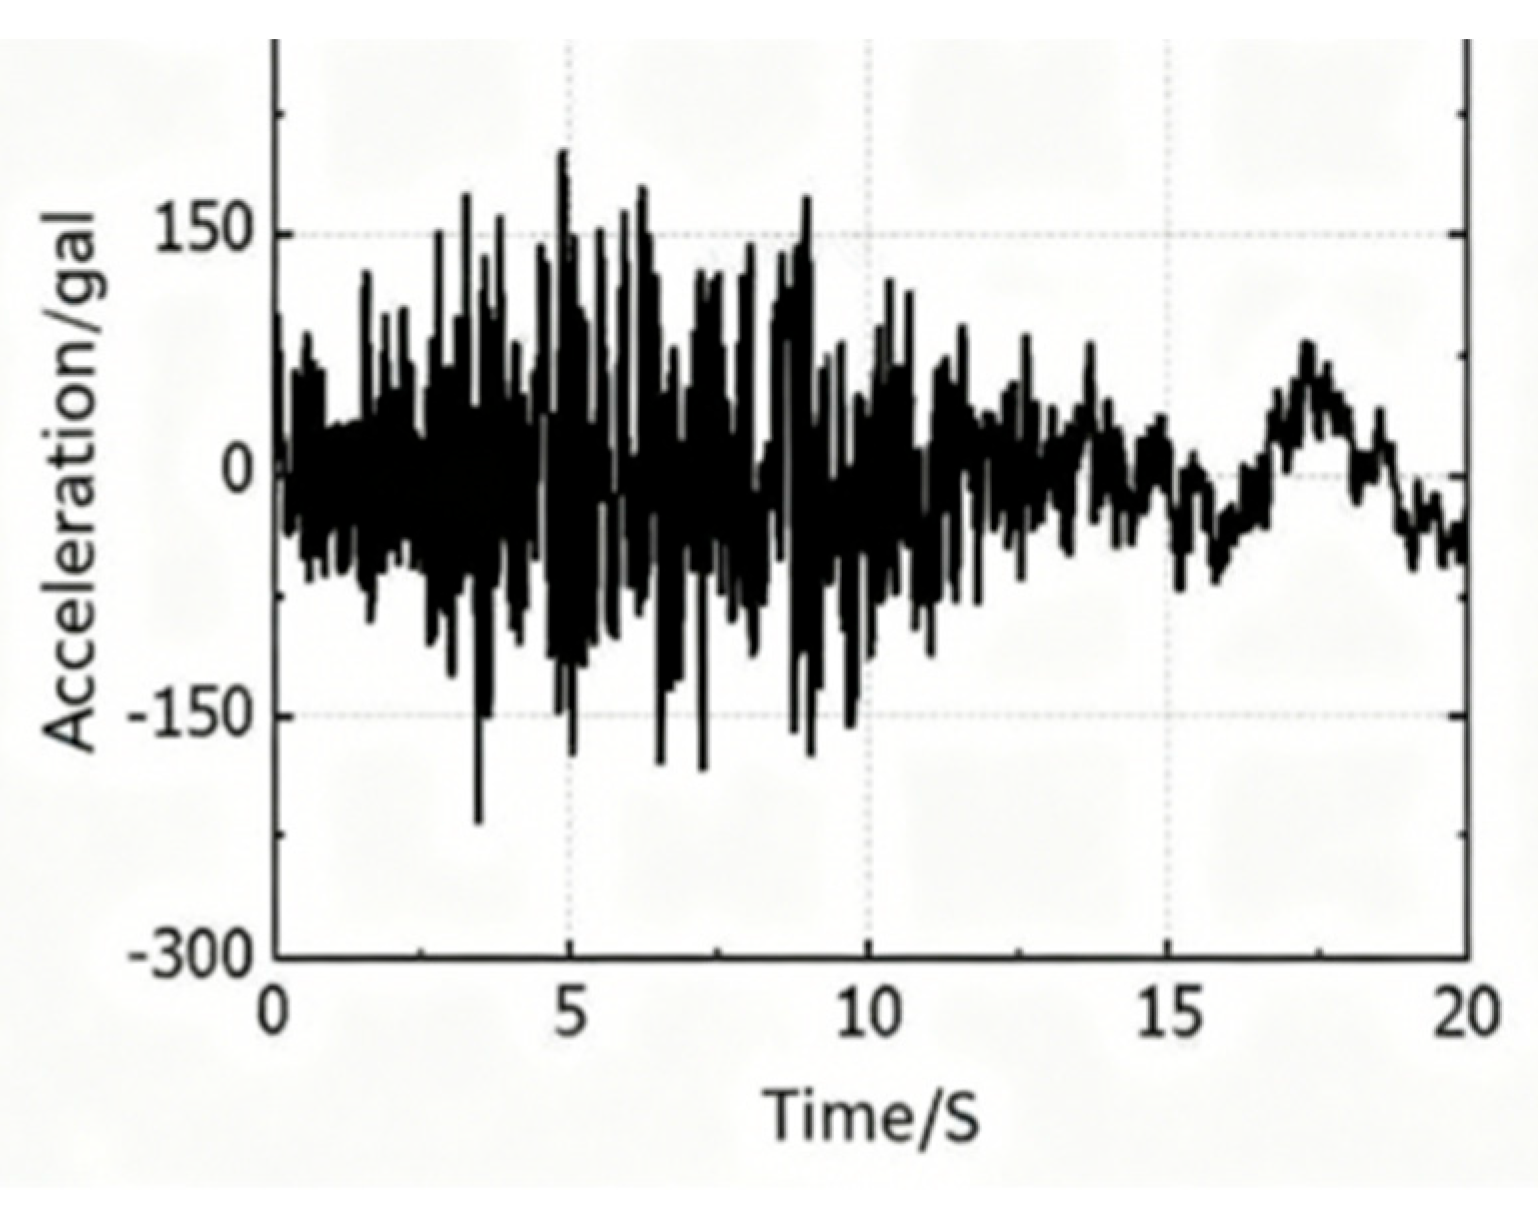
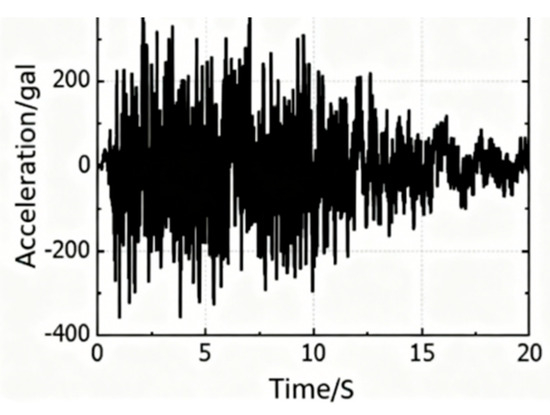
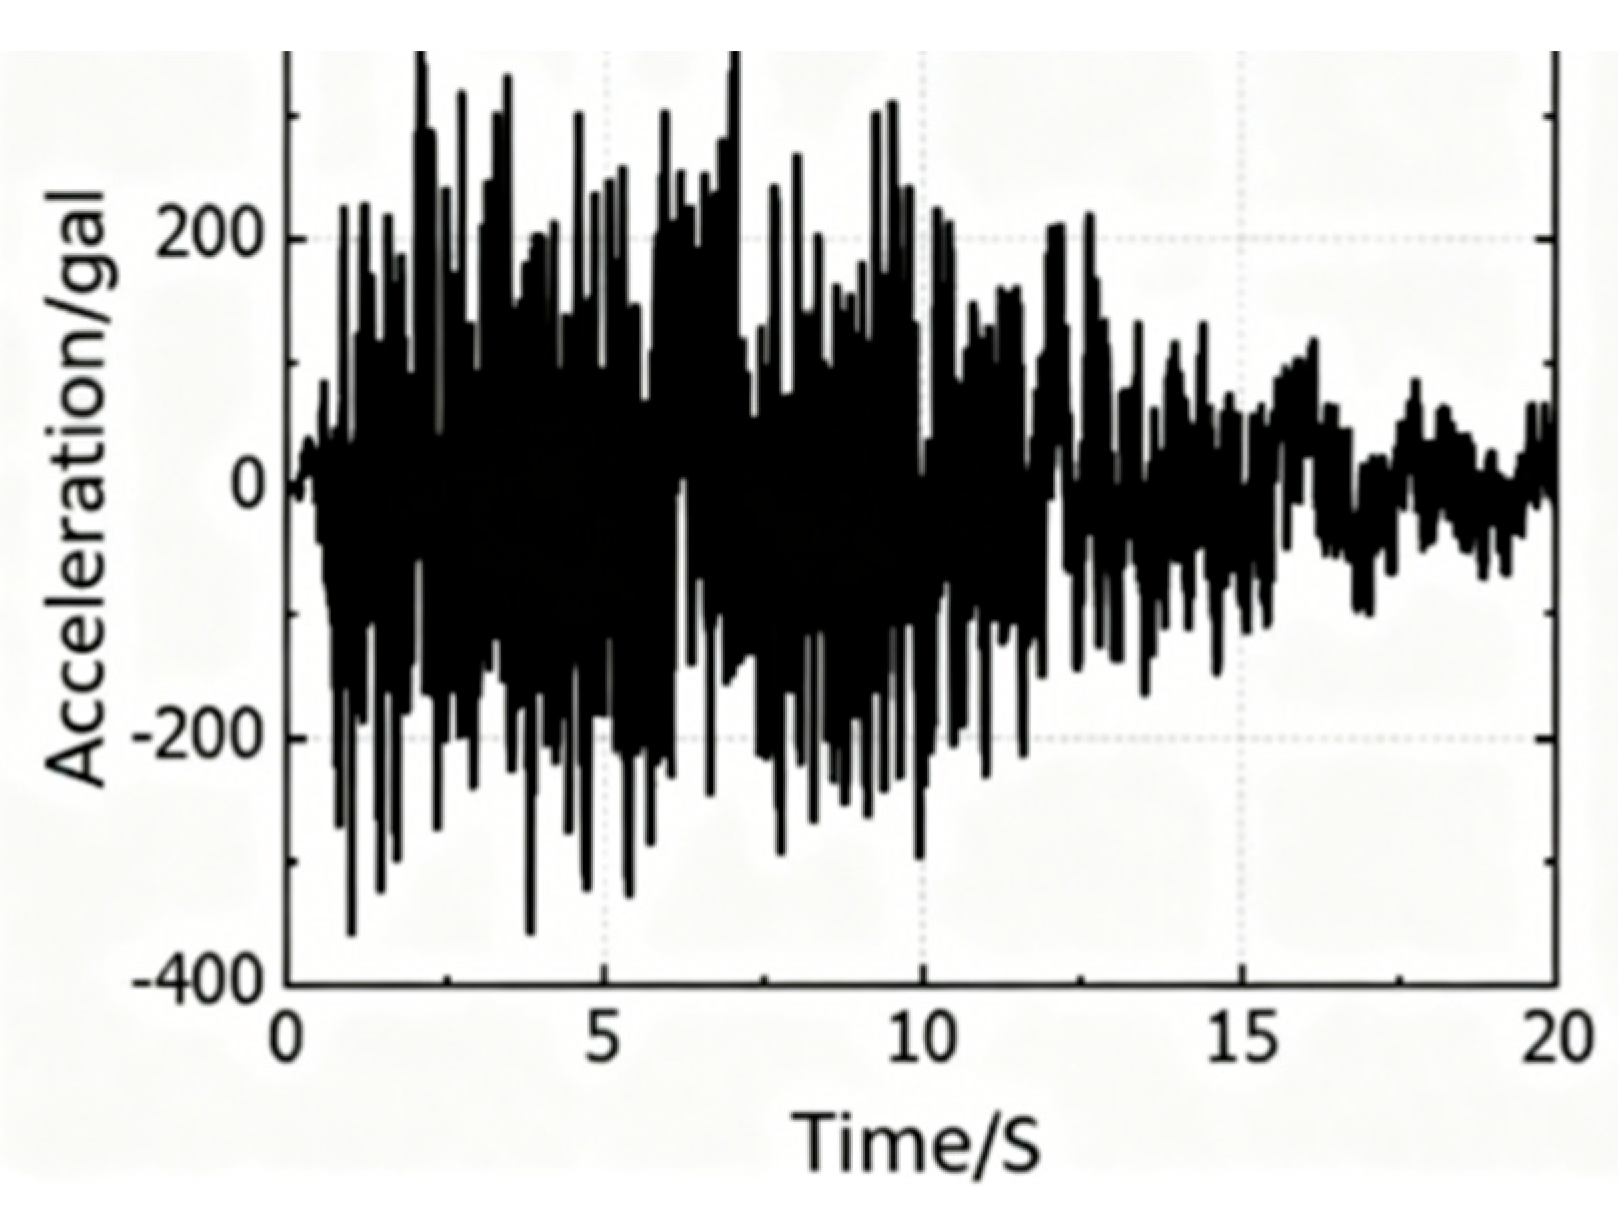
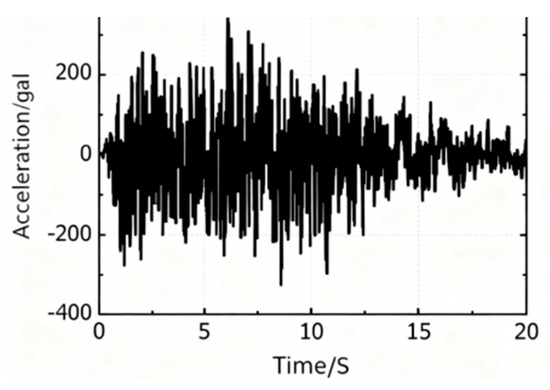
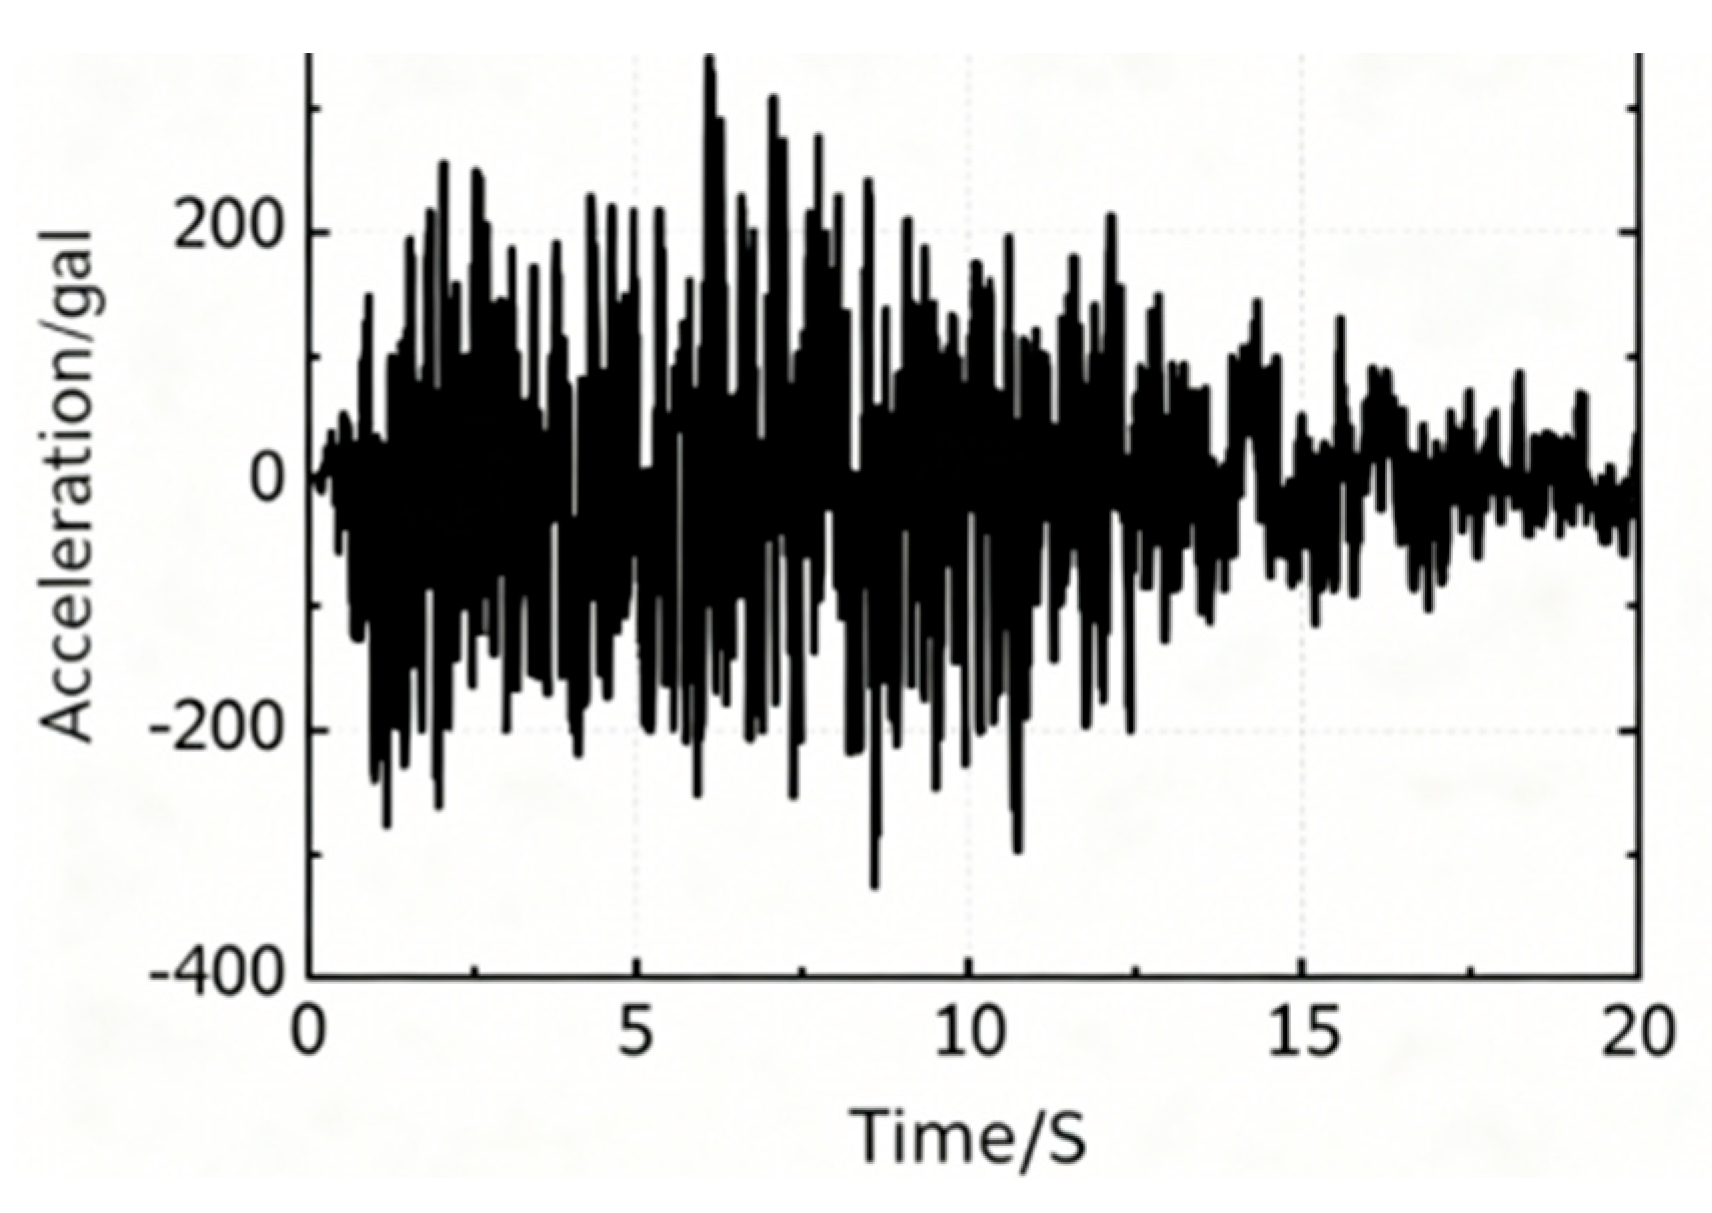
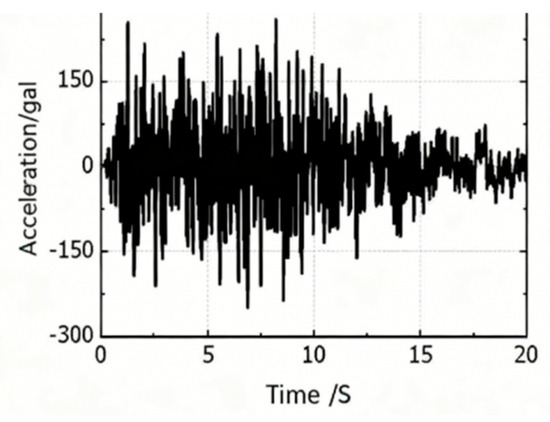
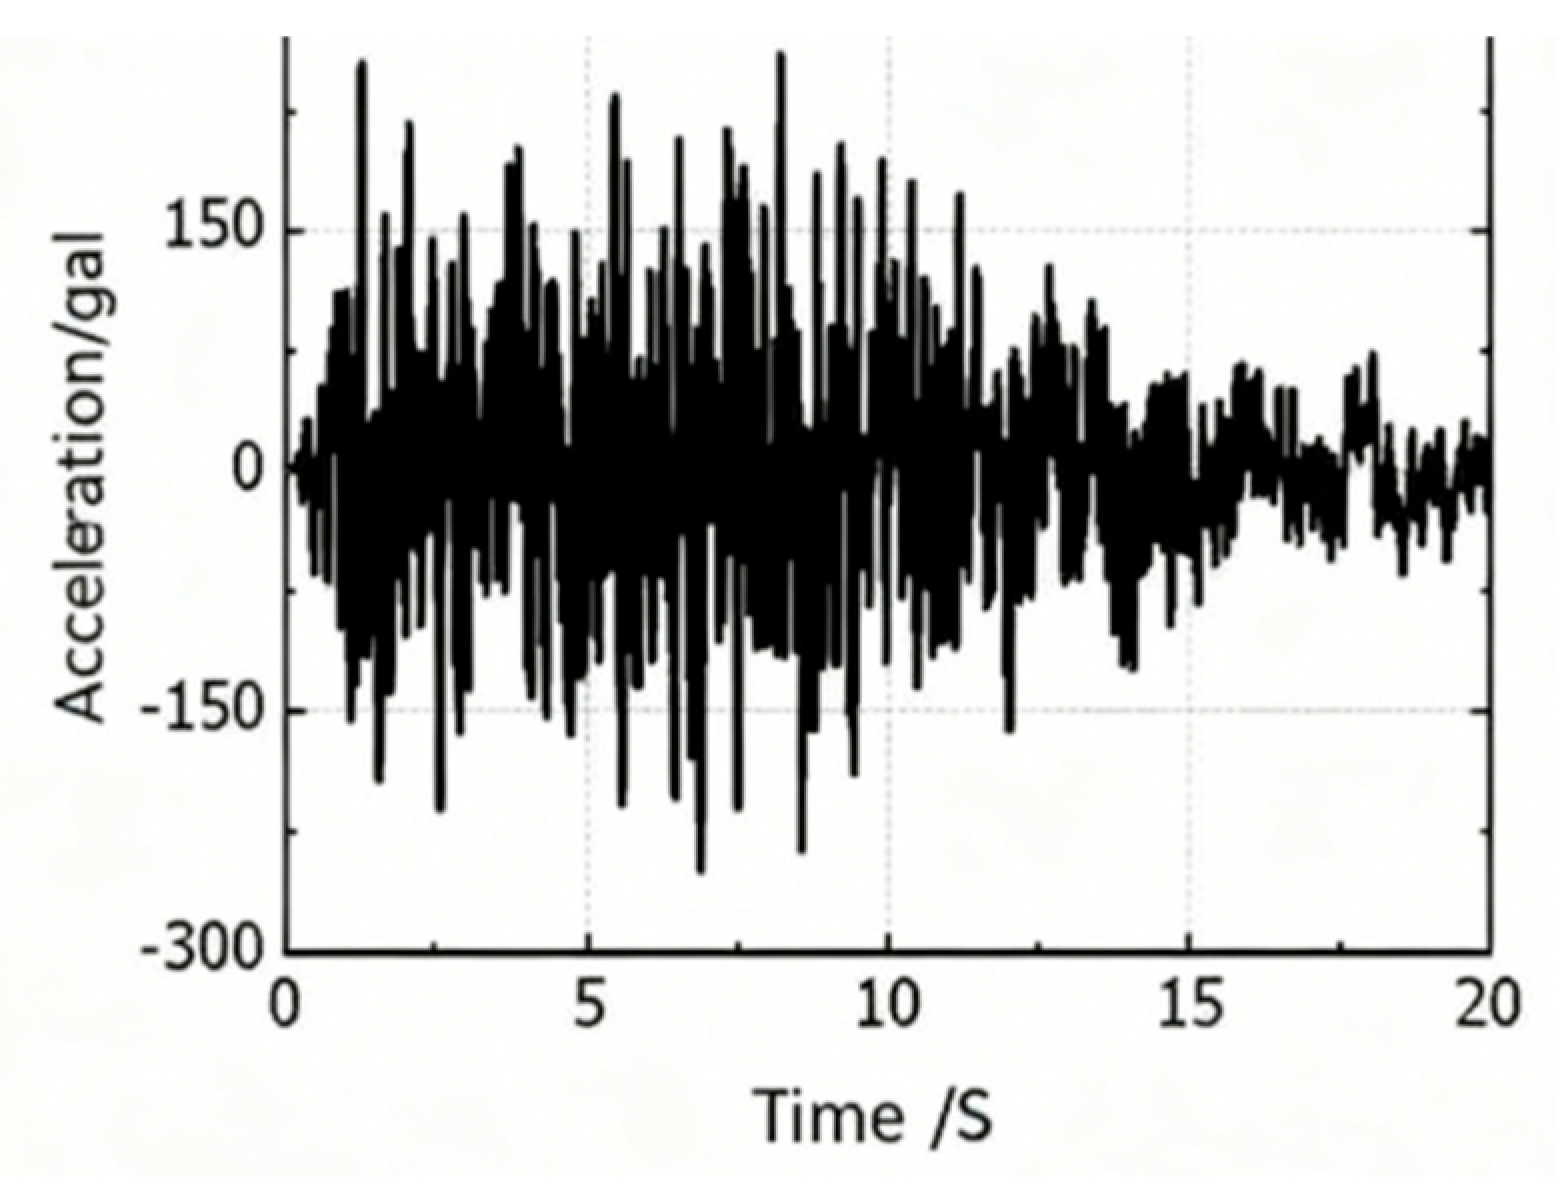
Multiple sets of artificial seismic waves were generated based on target response spectra (e.g., adjusted from code specifications), and analysis was conducted under bidirectional (X and Y) and triaxial (X, Y, Z) seismic inputs. Figure 4, Figure 5, Figure 6, Figure 7, Figure 8, Figure 9, Figure 10, Figure 11 and Figure 12 compare the acceleration response spectra and Fourier amplitude spectra of different waveforms (Tafte, Elsentoro, and artificial) to evaluate the differences in seismic characteristics.
Figure 4.
TAFT (Y−direction).
Figure 5.
TAFT (x−direction).
Figure 6.
TAFT (Z−direction).
Figure 7.
EL-CENTRO (X−direction).
Figure 8.
EL-CENTRO (Y−direction).
Figure 9.
EL-CENTRO (Z−direction).
Figure 10.
Artificial wave (X−direction).
Figure 11.
Artificial wave (Y−direction).
Figure 12.
Artificial wave (Z−direction).
The structural response under multi-directional inputs was analyzed, including inter-story displacement angle and base shear time–history curves, to quantify the impact of directional effects on structural damage.
3. Analysis and Results
3.1. Multi-Scale Coupling for Fine Modeling
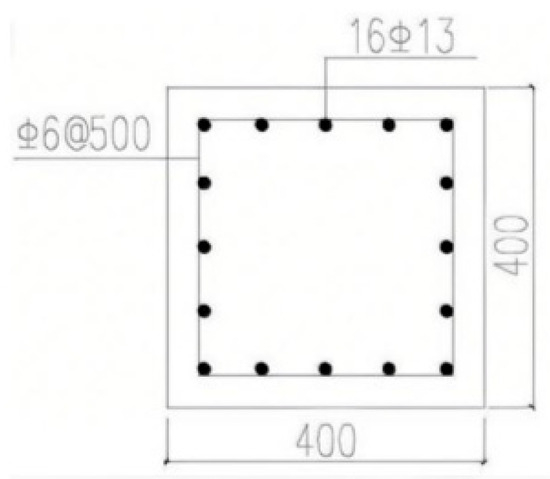
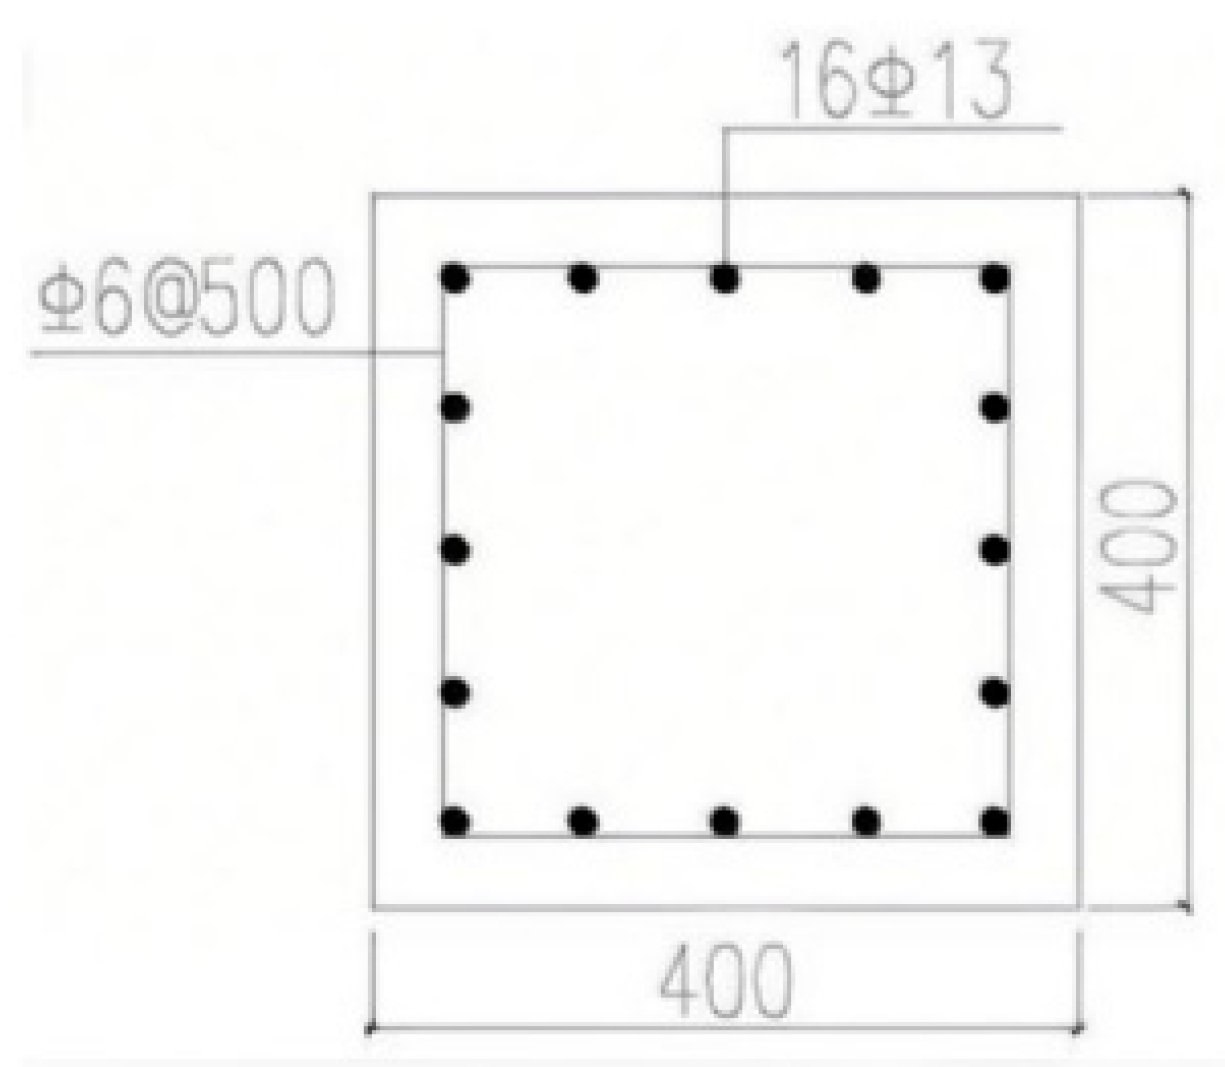
This numerical model was verified through experiments conducted by Professor Kawashima and Yashima [6]. The concrete specimen was 1750 mm in height, with a base height of 400 mm, and the concrete cross-section was 400 mm. A load was applied 400 mm from the top of the column. The reinforcement of the specimen is shown in Figure 13. The simulation results were highly consistent with the load–displacement responses in the experiments, thereby verifying the effectiveness of this model in nonlinear dynamic analysis.
Figure 13.
Concrete column test piece.
Material parameter mapping was verified through comparative tables of concrete compressive strength and steel yield strength, with deviations below 3%, ensuring model reliability.
3.2. Case Study: Eight-Story Frame-Shear Wall Structure
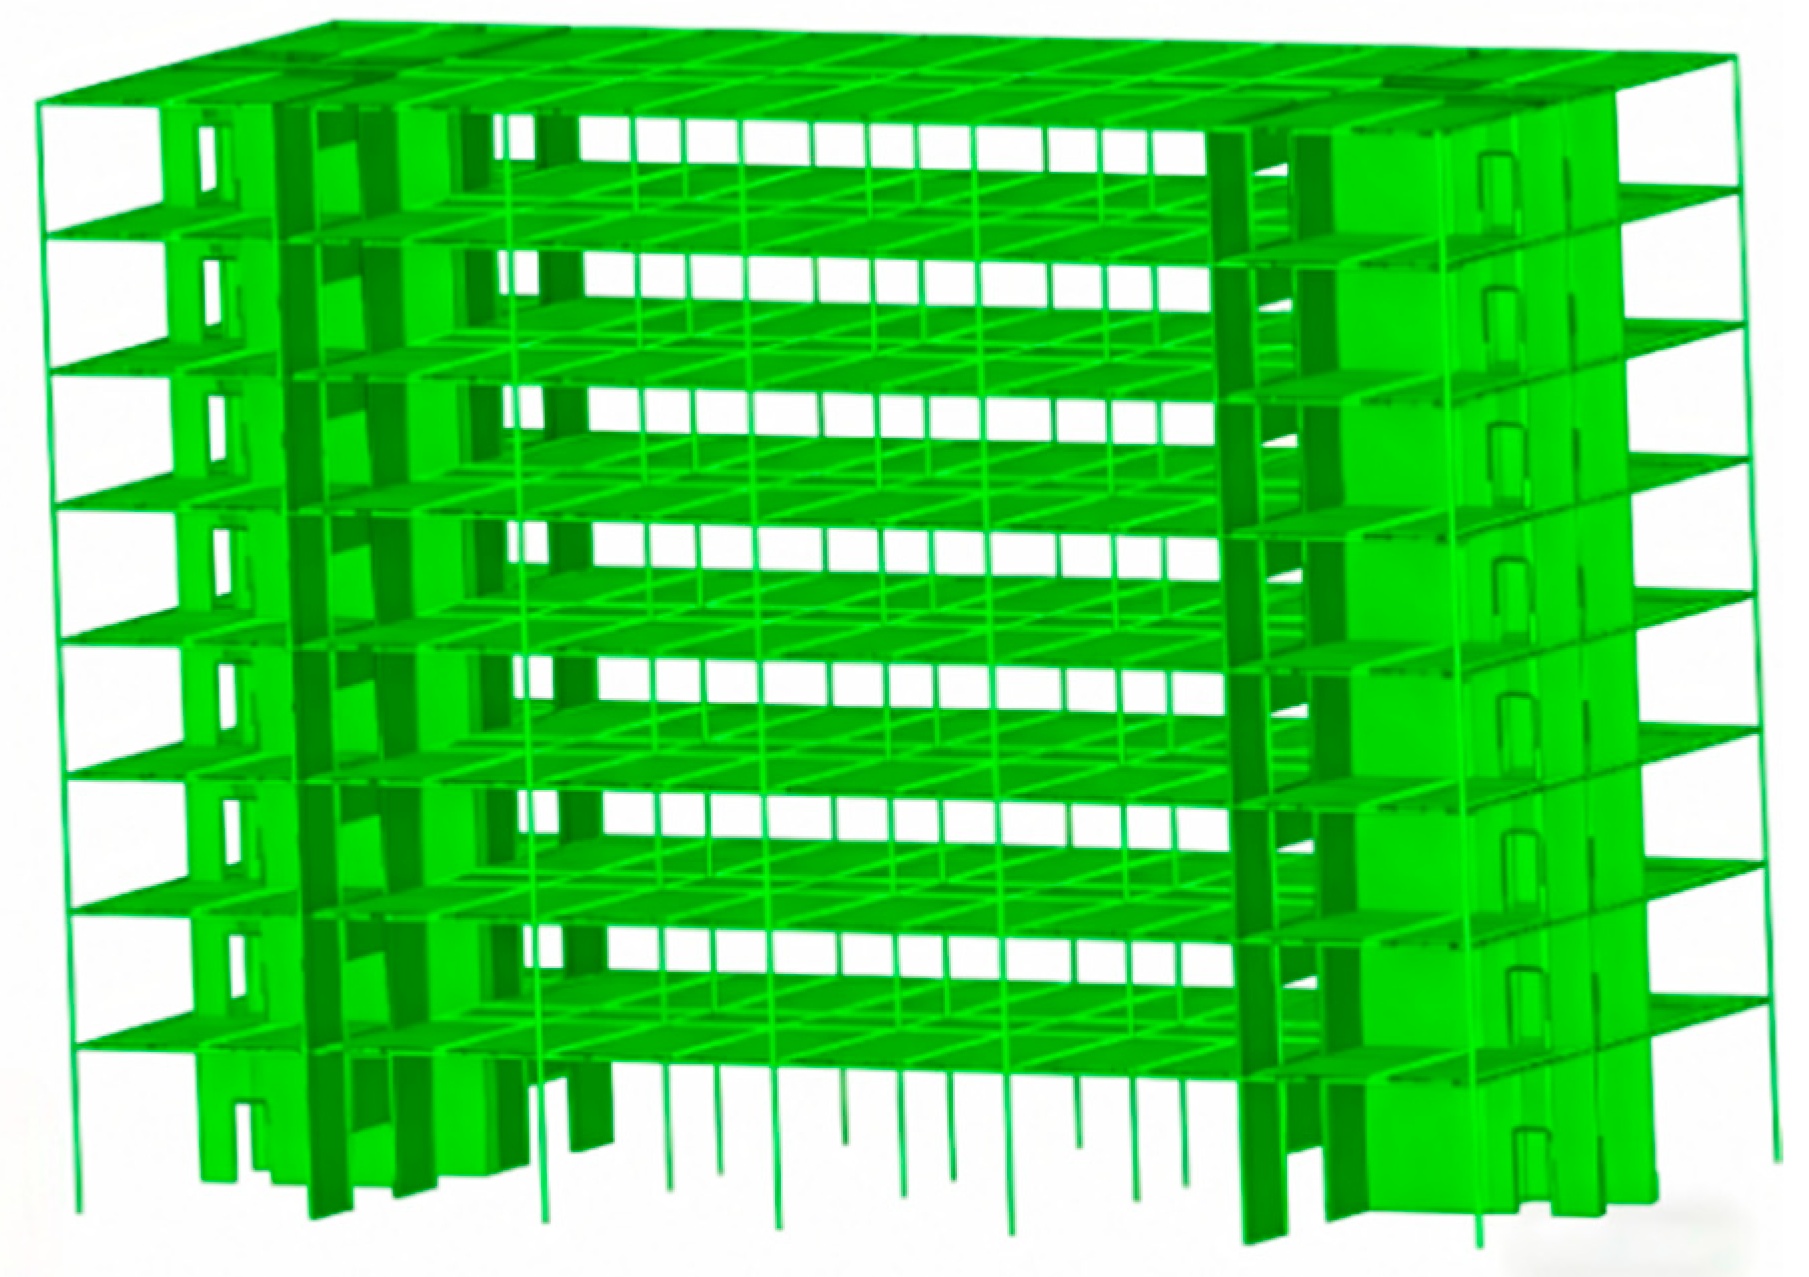
The situation of an eight-story reinforced concrete frame-shear wall structure under a rare earthquake was analyzed [7]. The three-view diagram of the model in ABAQUS is shown in Figure 14. The seismic simulation data used included the Taft earthquake, the Elsenhorst earthquake, and artificial waves. The model was transferred from the ETABS v22.5.0 software to the ABAQUS software, and its dynamic characteristics were verified.
Figure 14.
Three views of the model in ABAQUS.
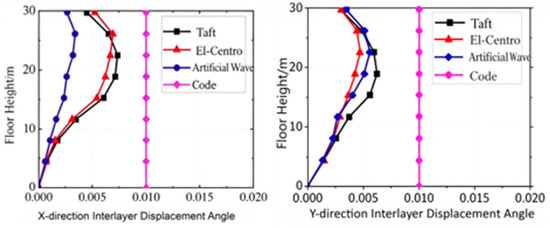
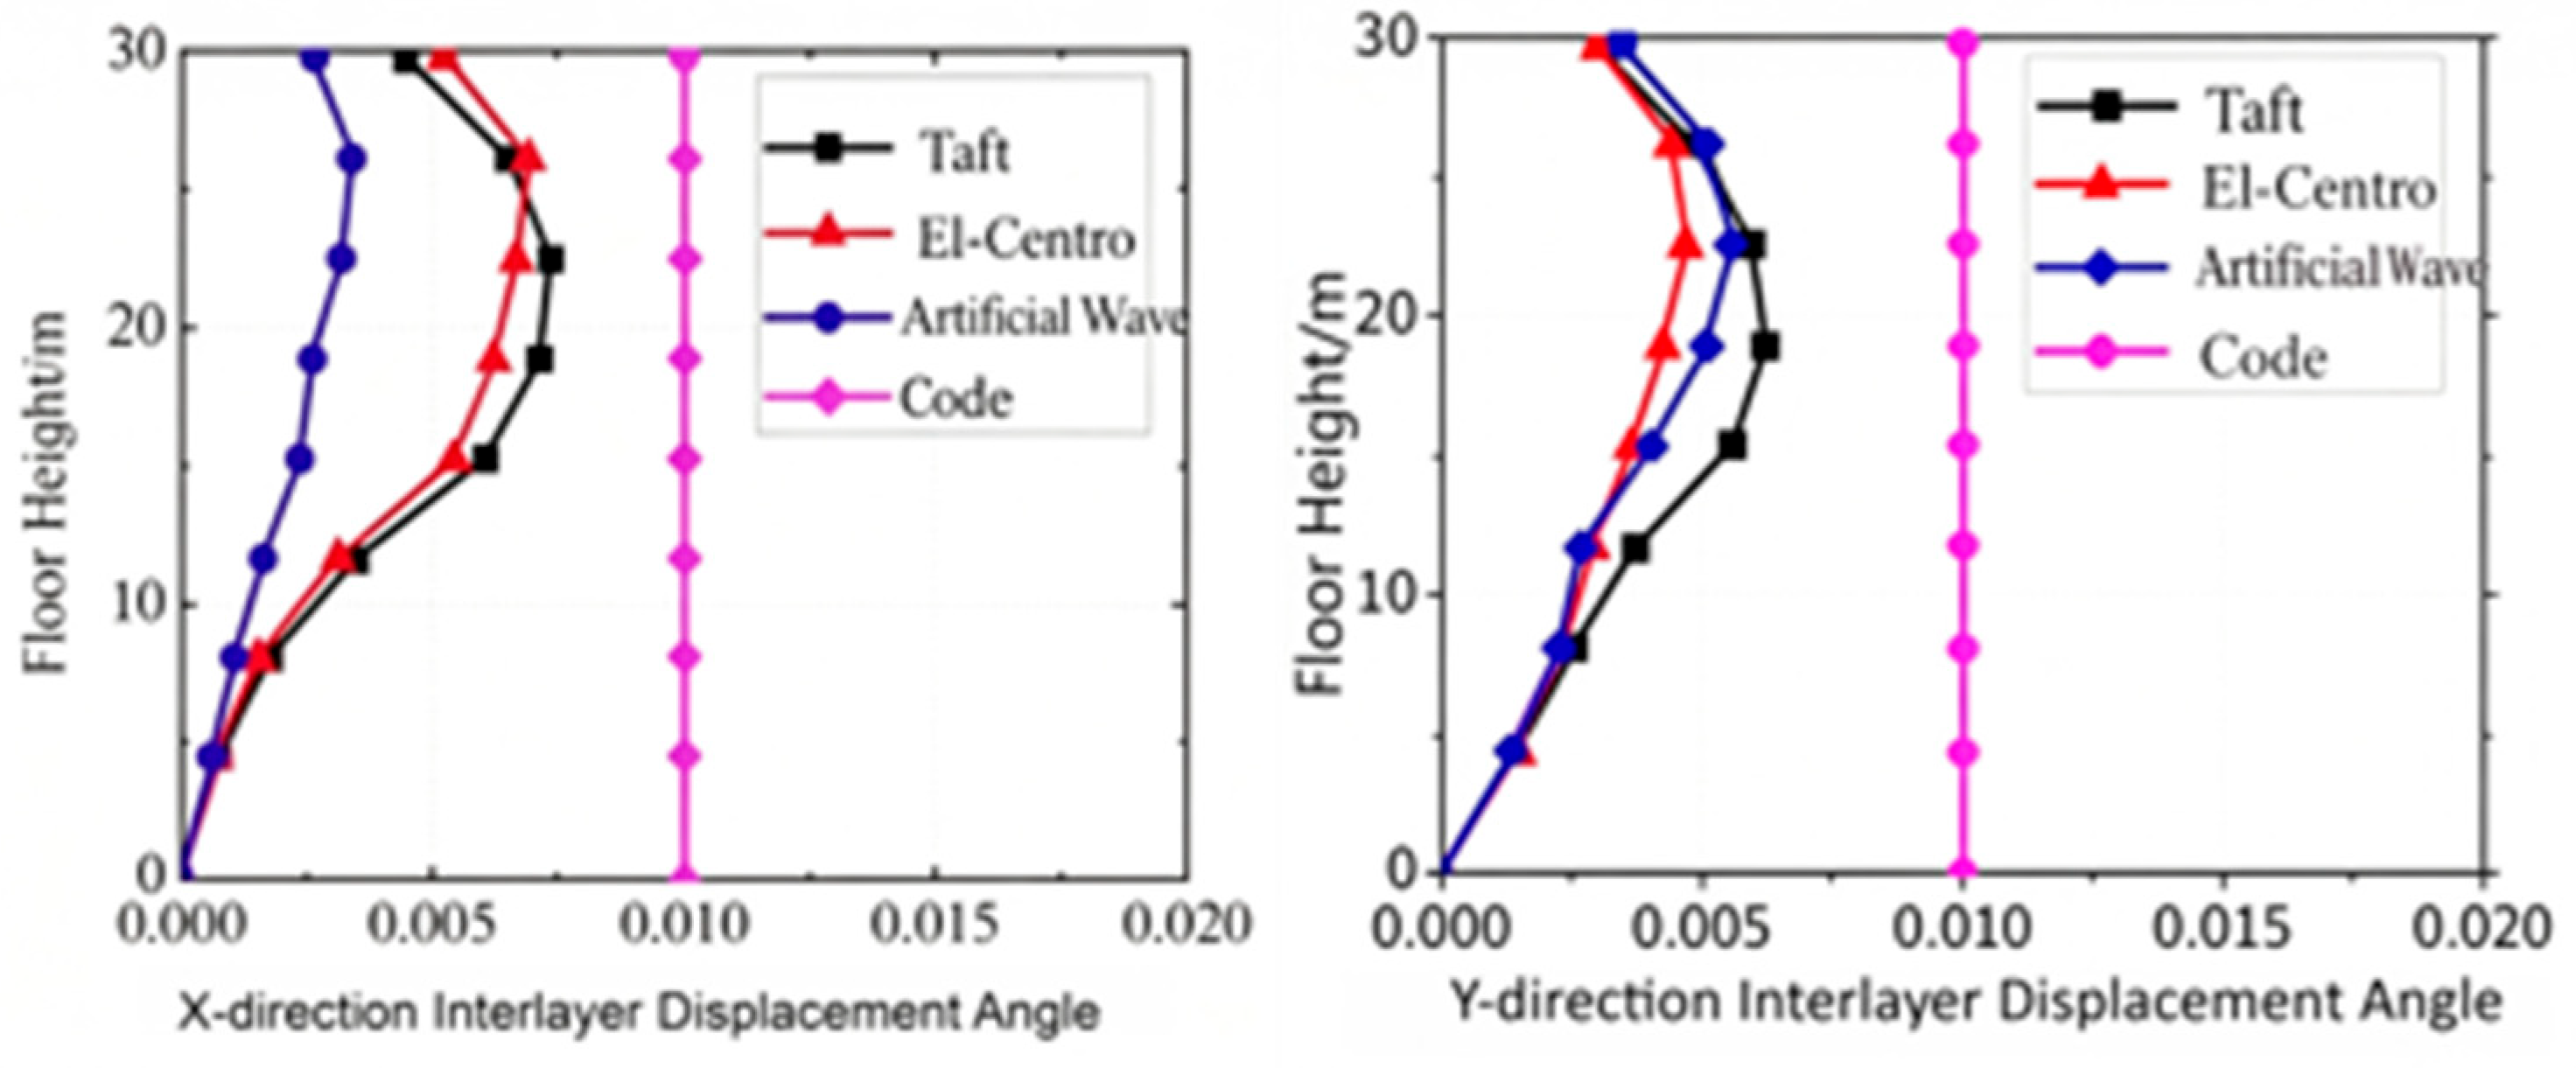
Figure 15 shows the distribution curve of the maximum inter-story displacement angle of the structure floors under rare earthquakes. This curve reflects the lateral stiffness distribution of the structure along the height direction of the floors. In the X direction, the maximum inter-story displacement angle is 1/136, and in the Y direction, it is 1/161, both of which meet the specification requirements. In the X direction, the base shear force reaches 4541 k, and in the Y direction, it reaches 3083 k.
Figure 15.
The distribution curve of the maximum inter-floor displacement angle of each floor.
3.3. Damage Analysis
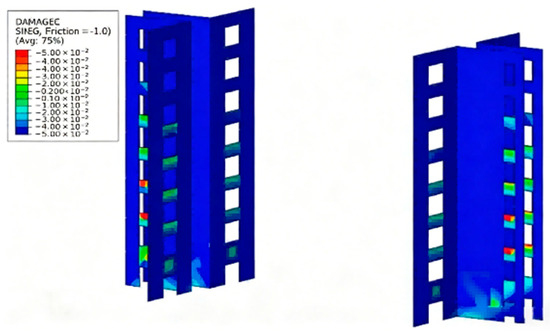
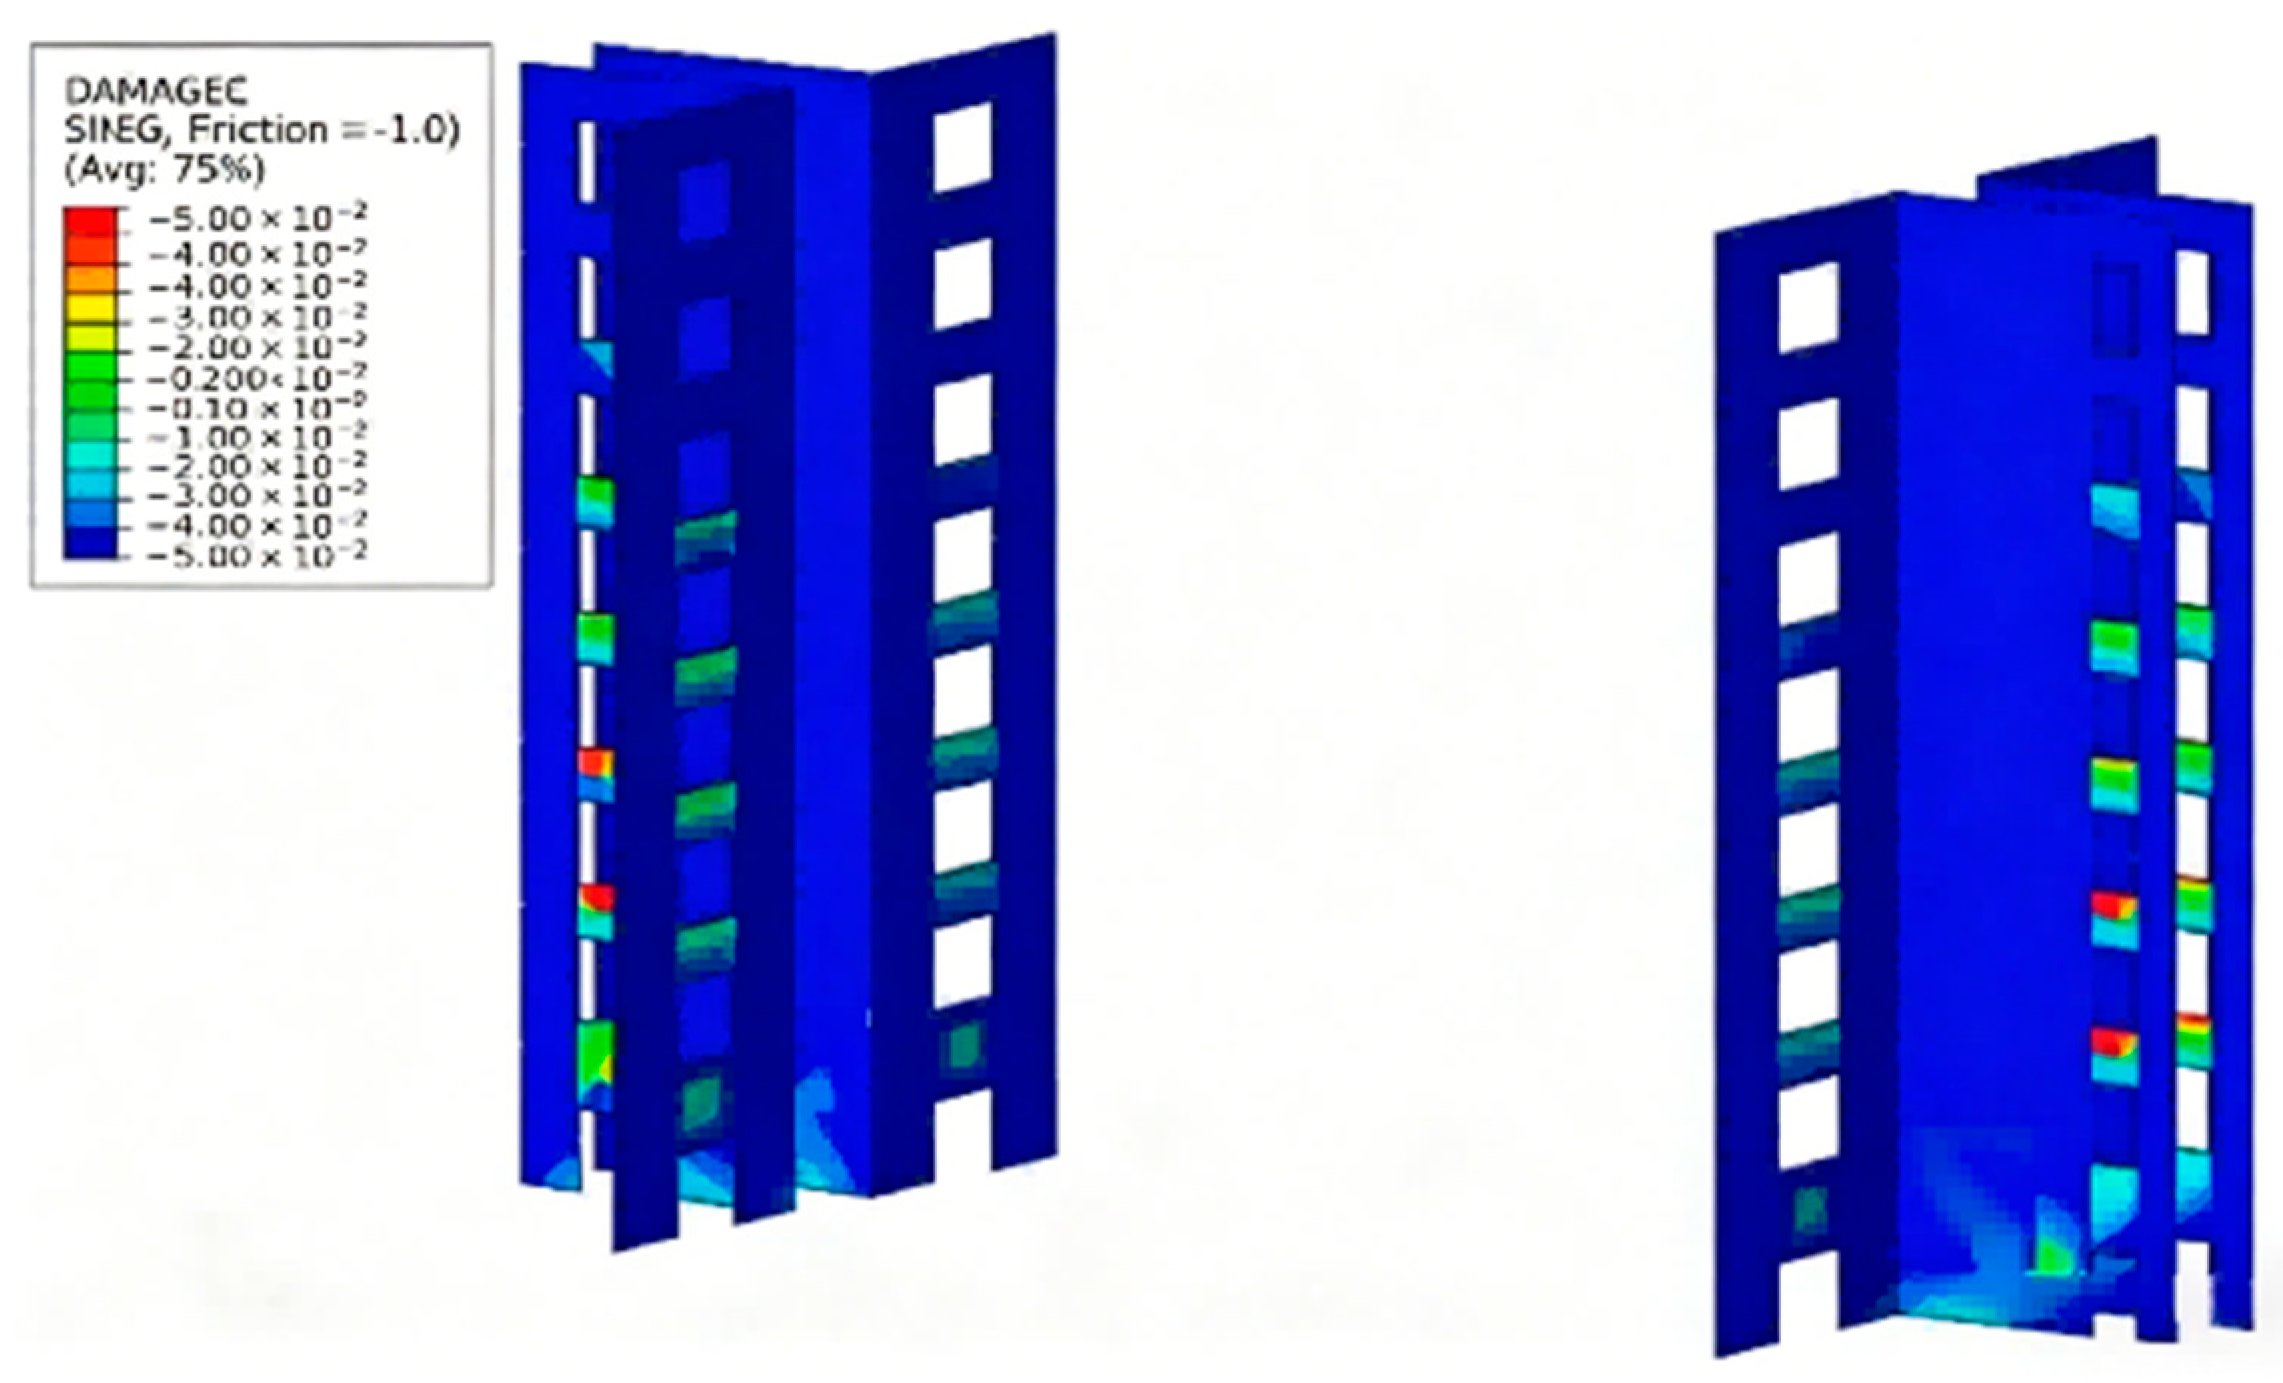
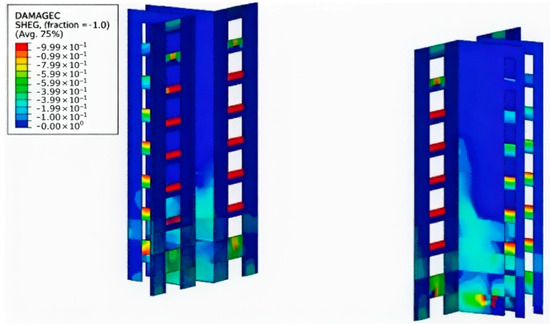
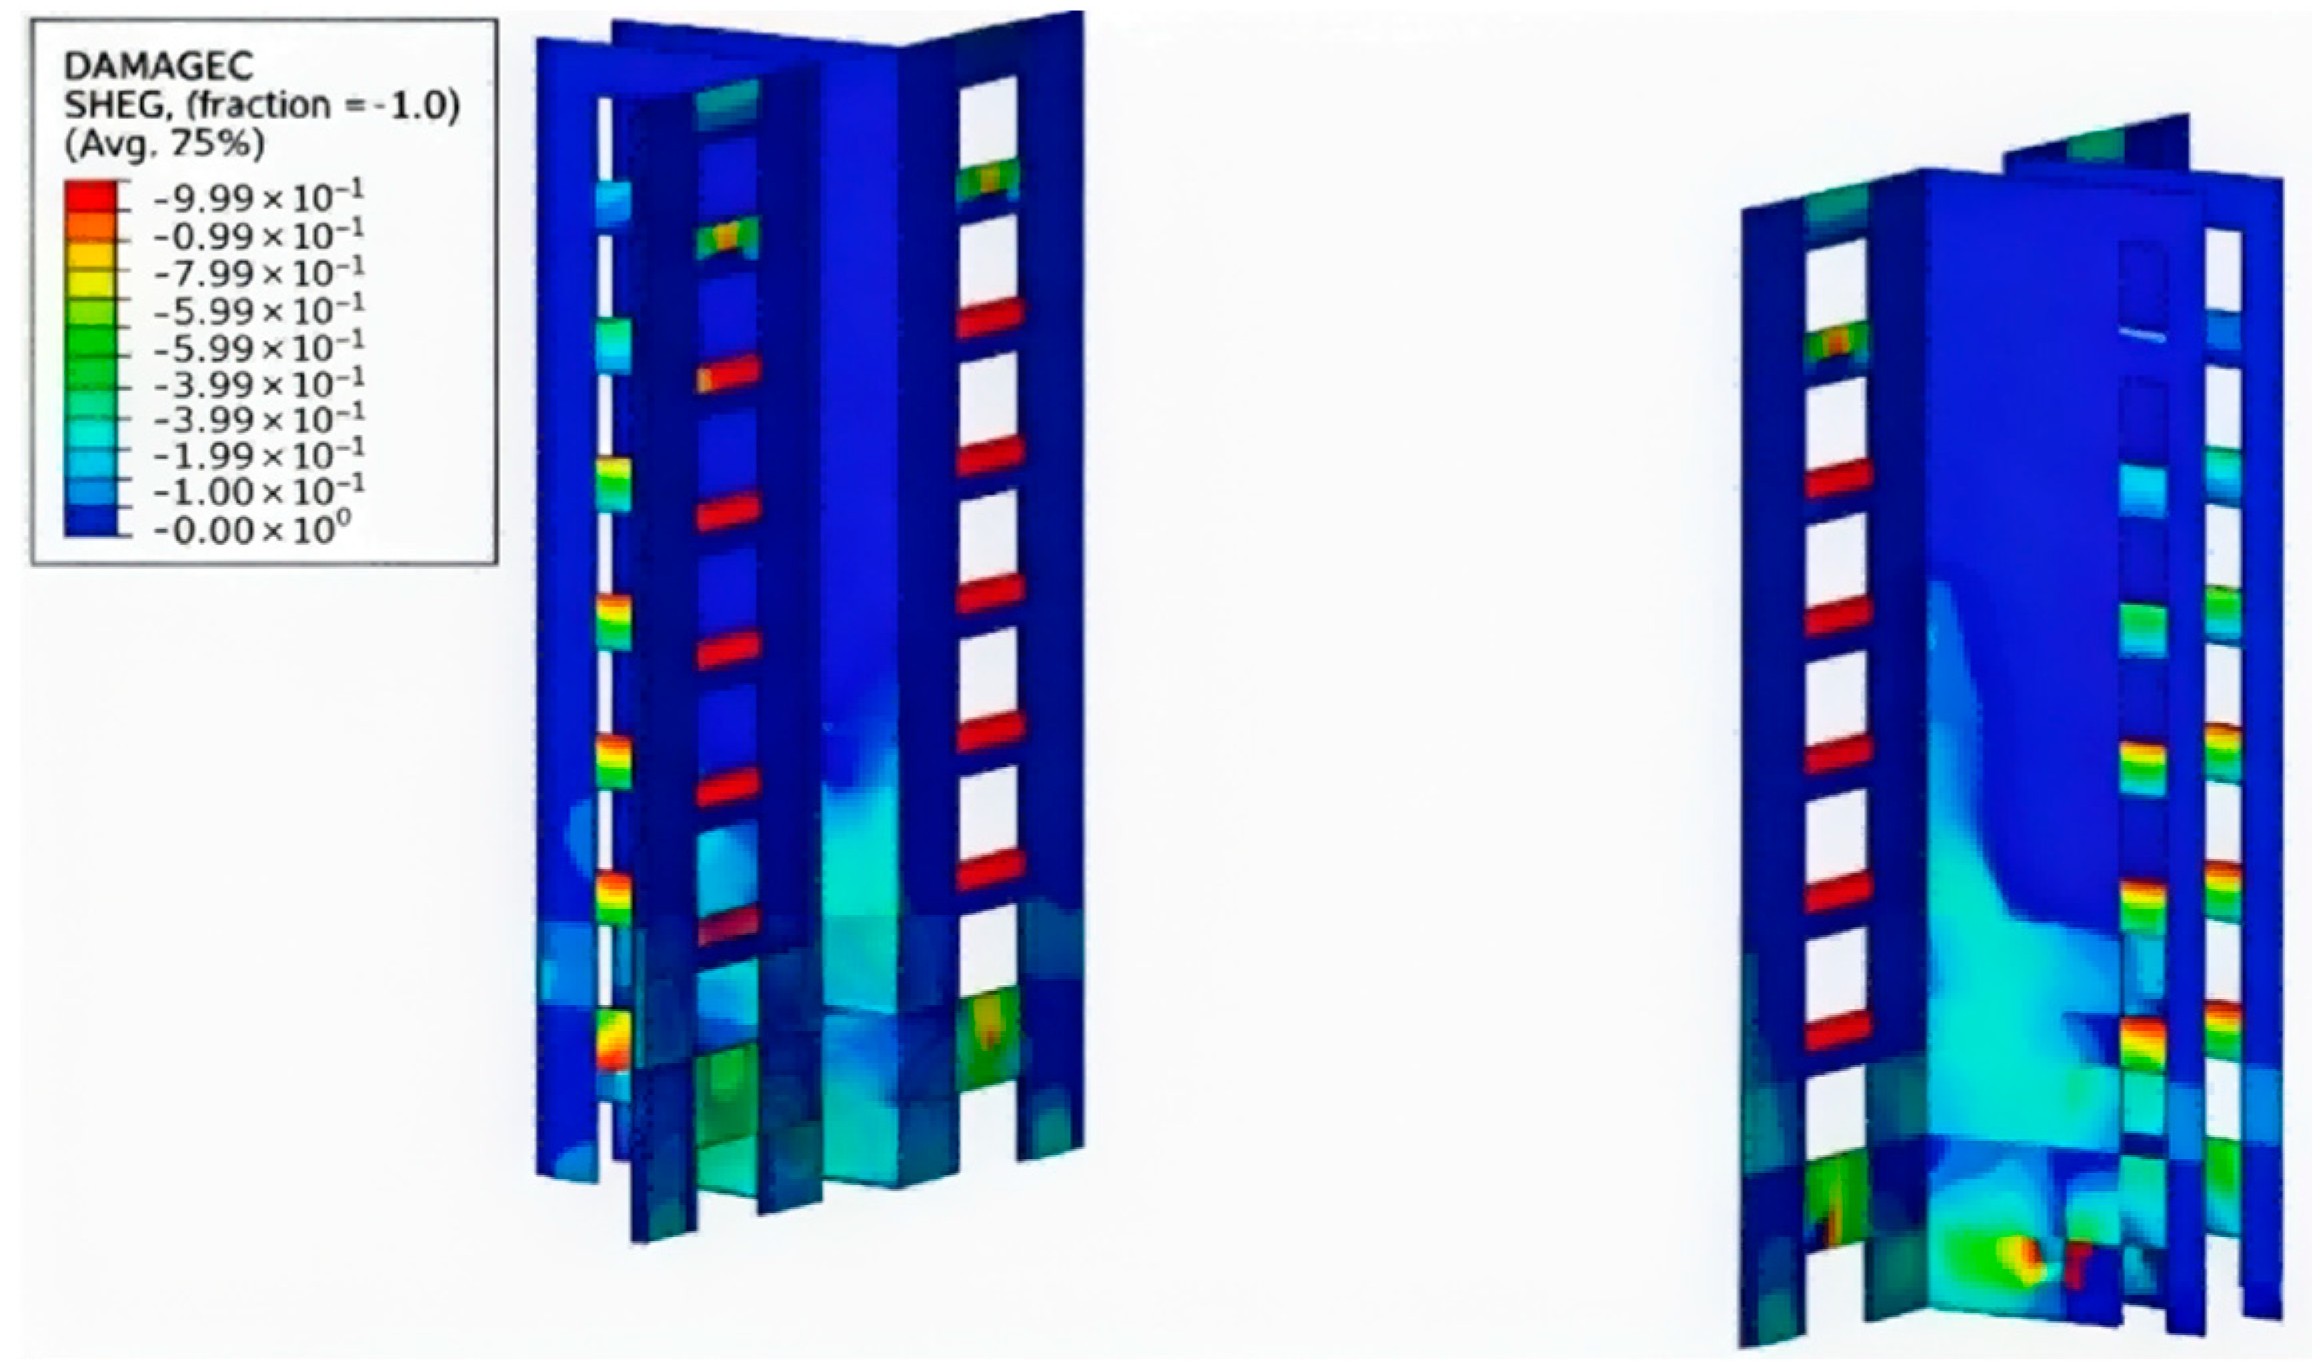
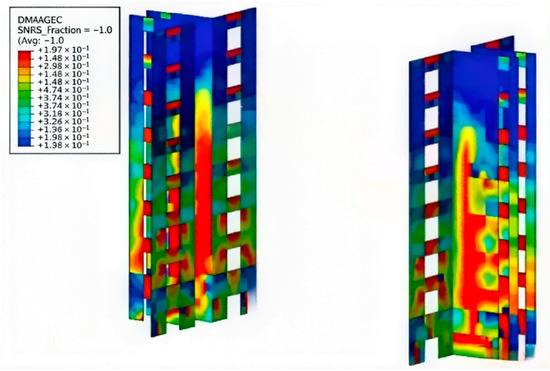
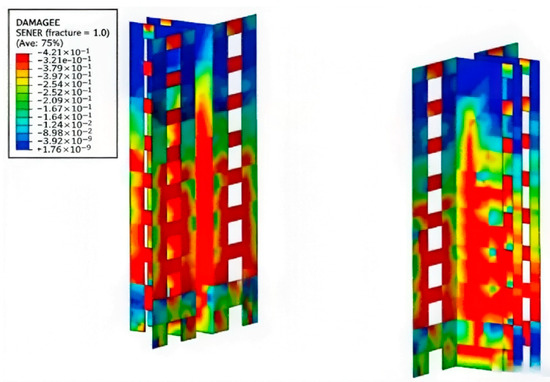
As illustrated in Figure 16, progressive damage initiated at the base of the wall segments and the coupling beams under sustained seismic excitation. Among these components, the coupling beams exhibited more pronounced deterioration. By the seventh second of ground motion, the maximum damage factor reached 0.95, indicating near-total loss of load-carrying capacity. Concurrently, compressive damage became increasingly evident at the wall base and propagated upward, with a peak damage factor of approximately 0.5, as shown in Figure 17.
Figure 16.
Pressure diagram at 5 s.
Figure 17.
Pressure diagram at 10 s.
At 13 s, nearly all coupling beams were severely compromised, while damage in the wall segments intensified and extended further—particularly in the X-direction wall segment, where the maximum damage factor attained 0.95; however, most wall regions registered damage factors ranging between 0.2 and 0.6 (Figure 18). Following 20 s of seismic excitation, damage in the wall segments continued to propagate, and damage factors in several localized regions increased further, with the global maximum again reaching 0.95 (Figure 19).
Figure 18.
Pressure diagram at 15 s.
Figure 19.
Pressure diagram at 20 s.
3.4. Damage in Beams and Columns: Stress Distribution Analysis
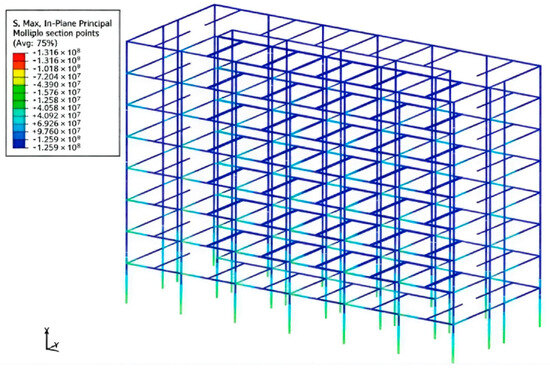
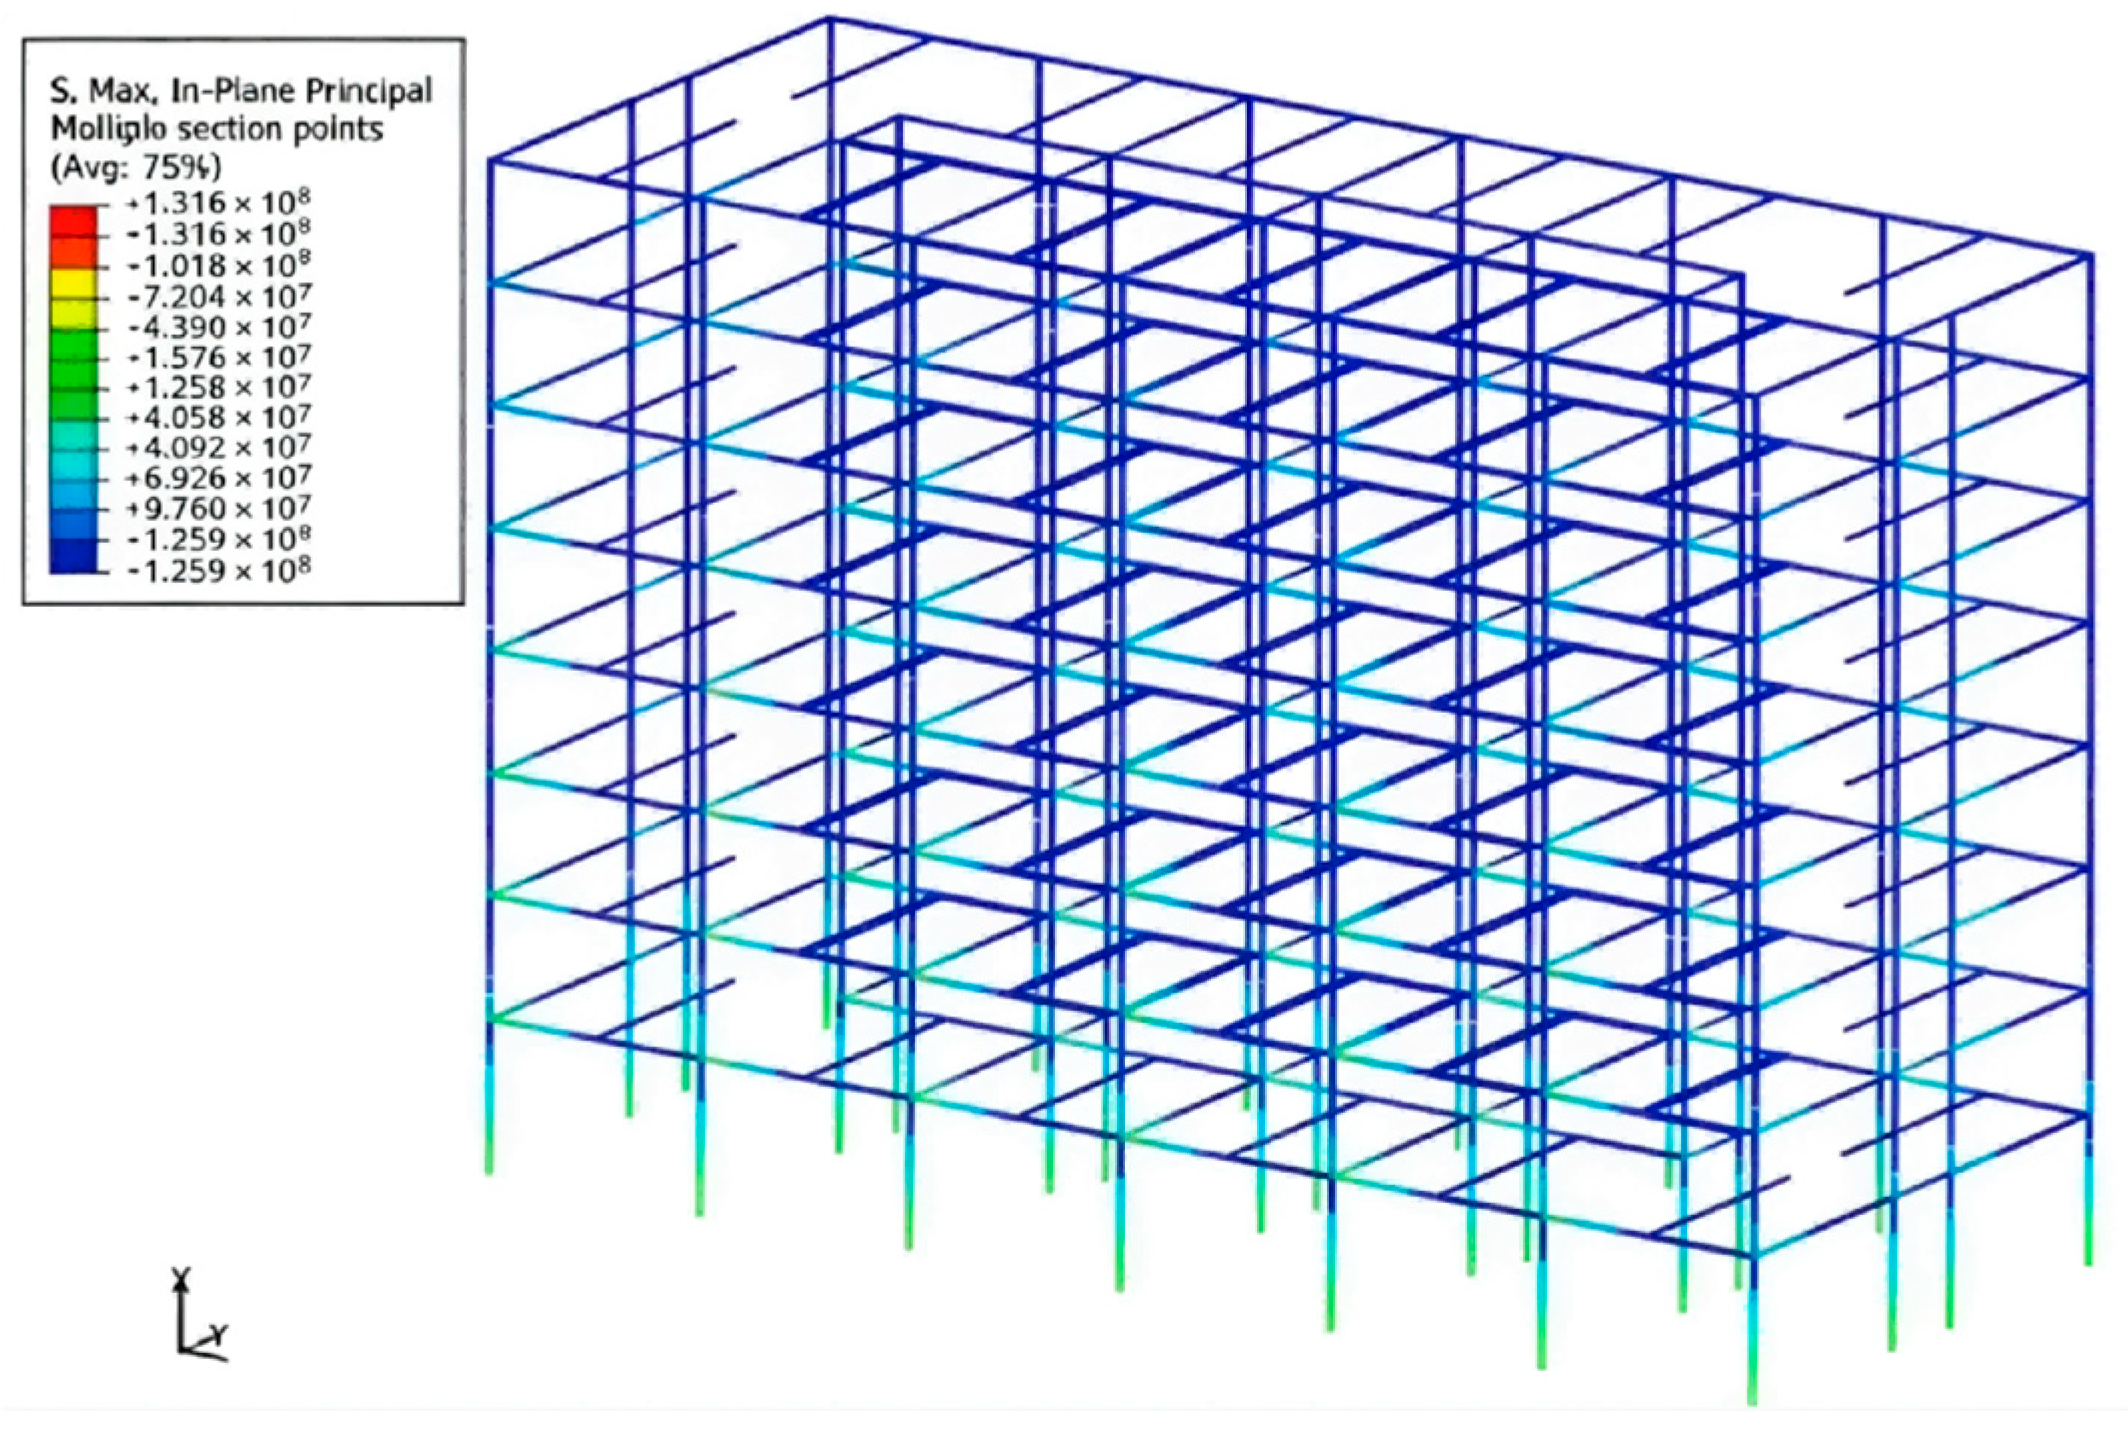
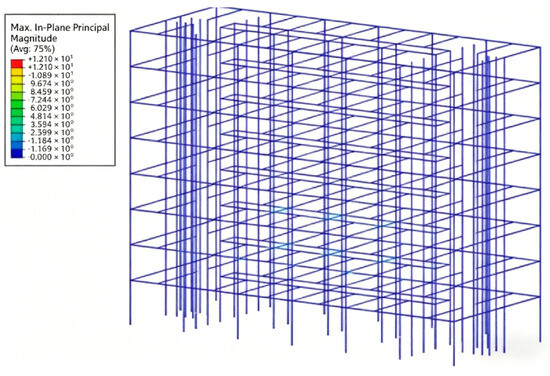
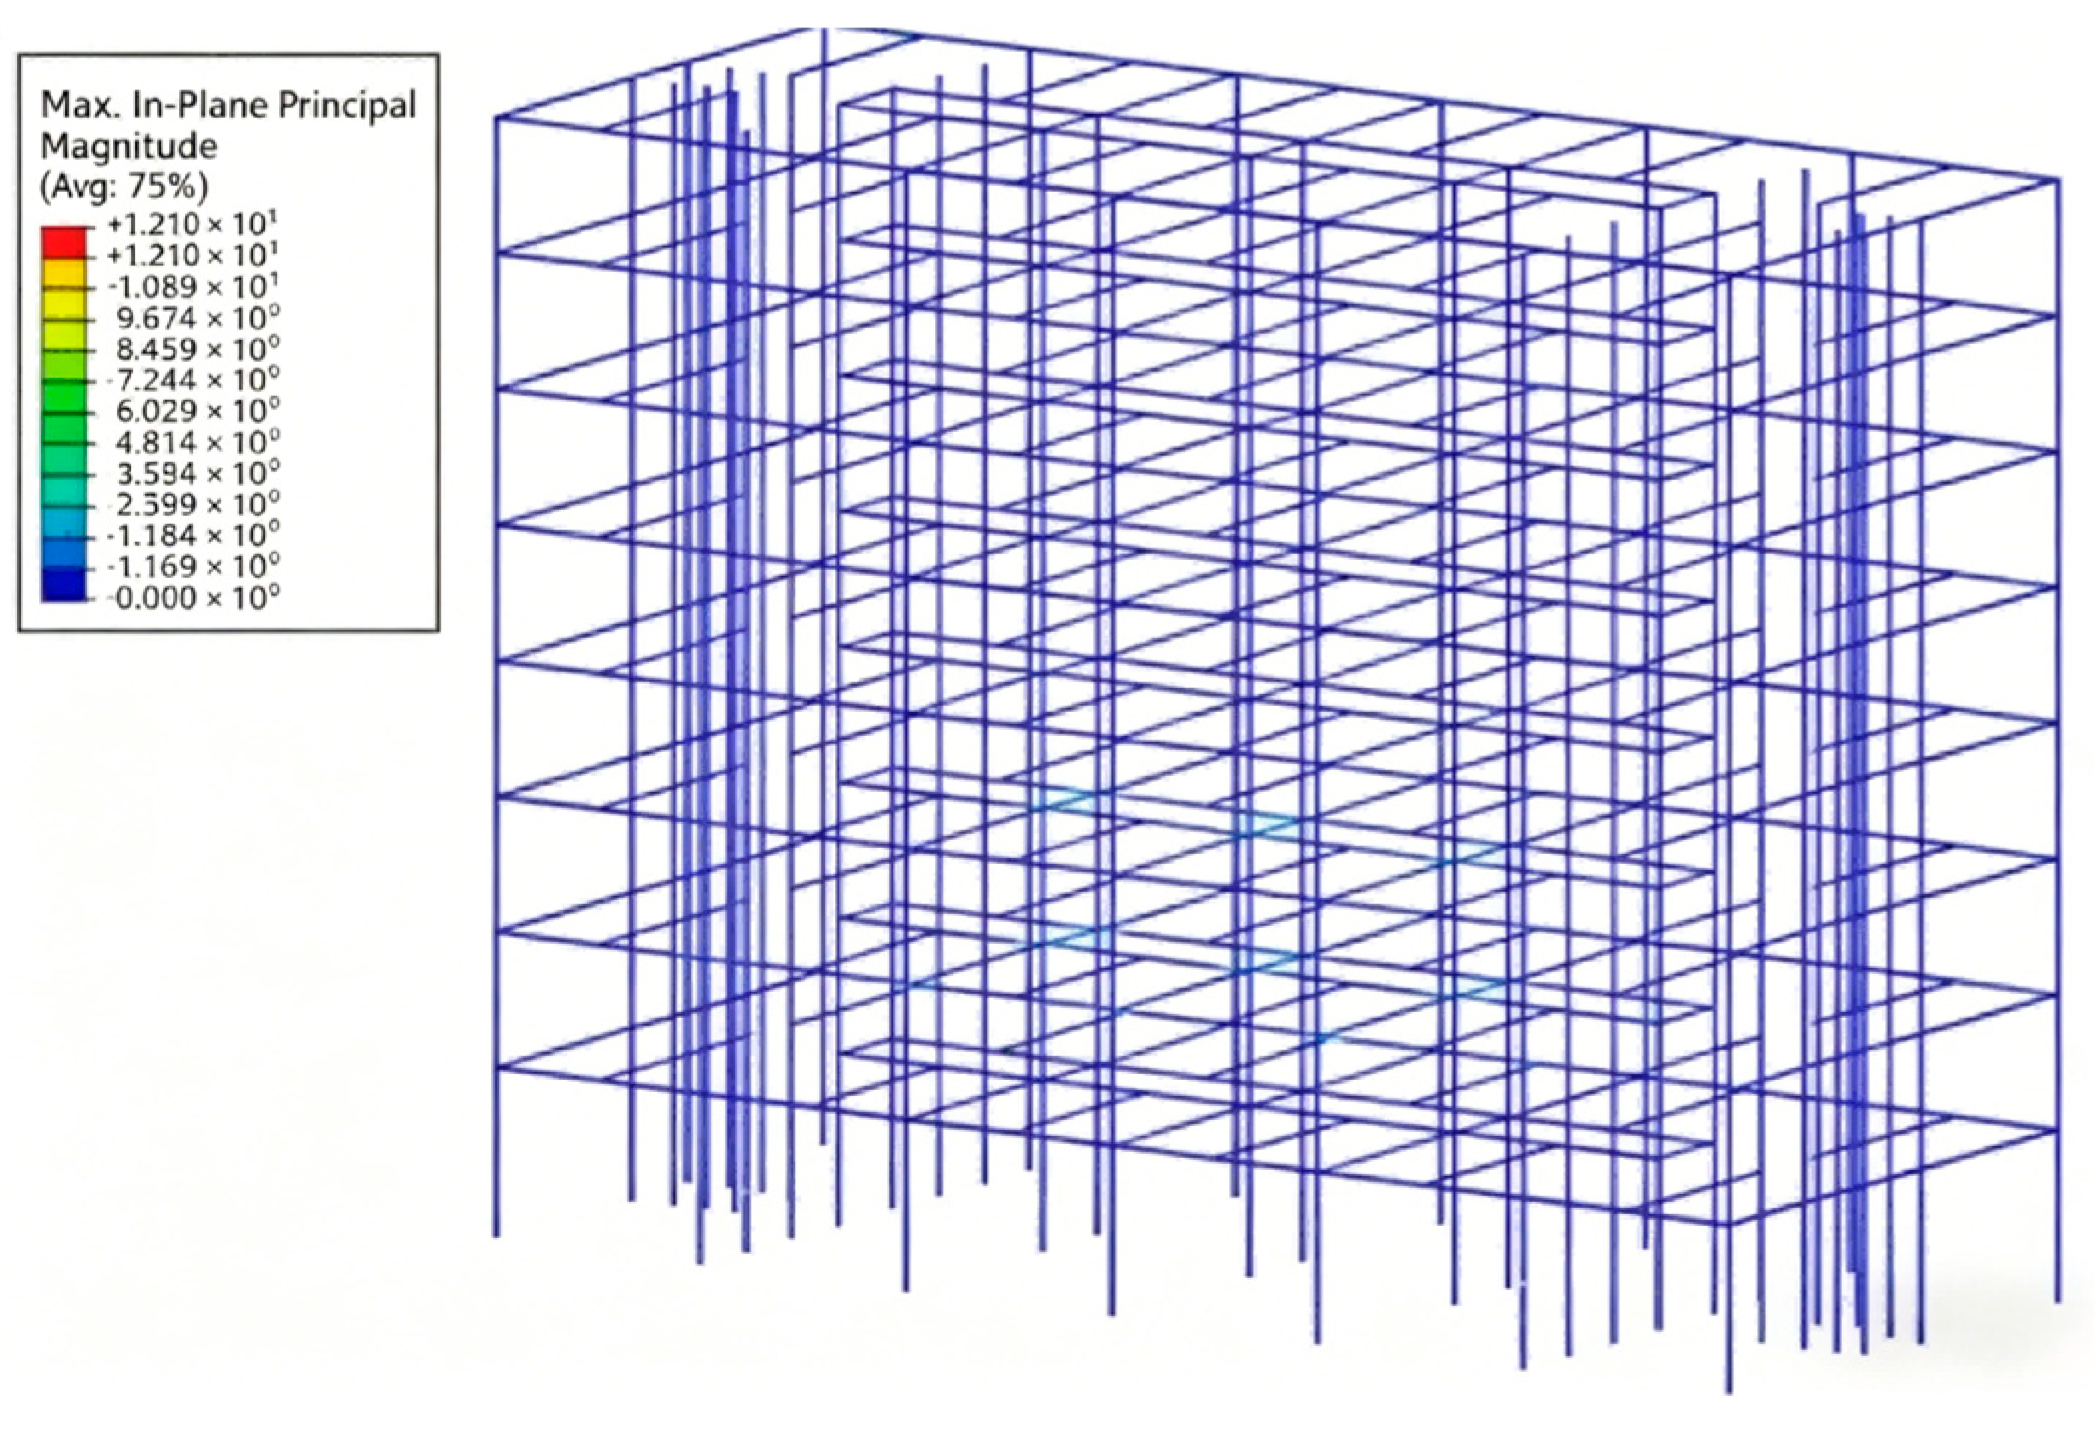
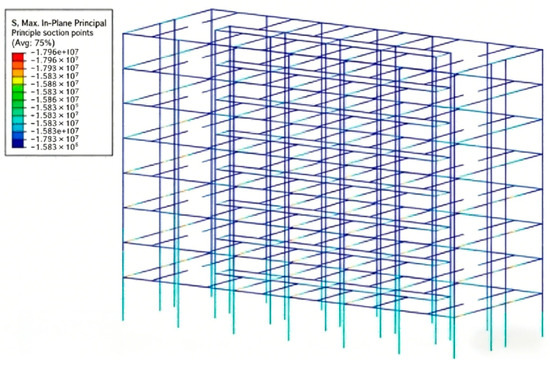
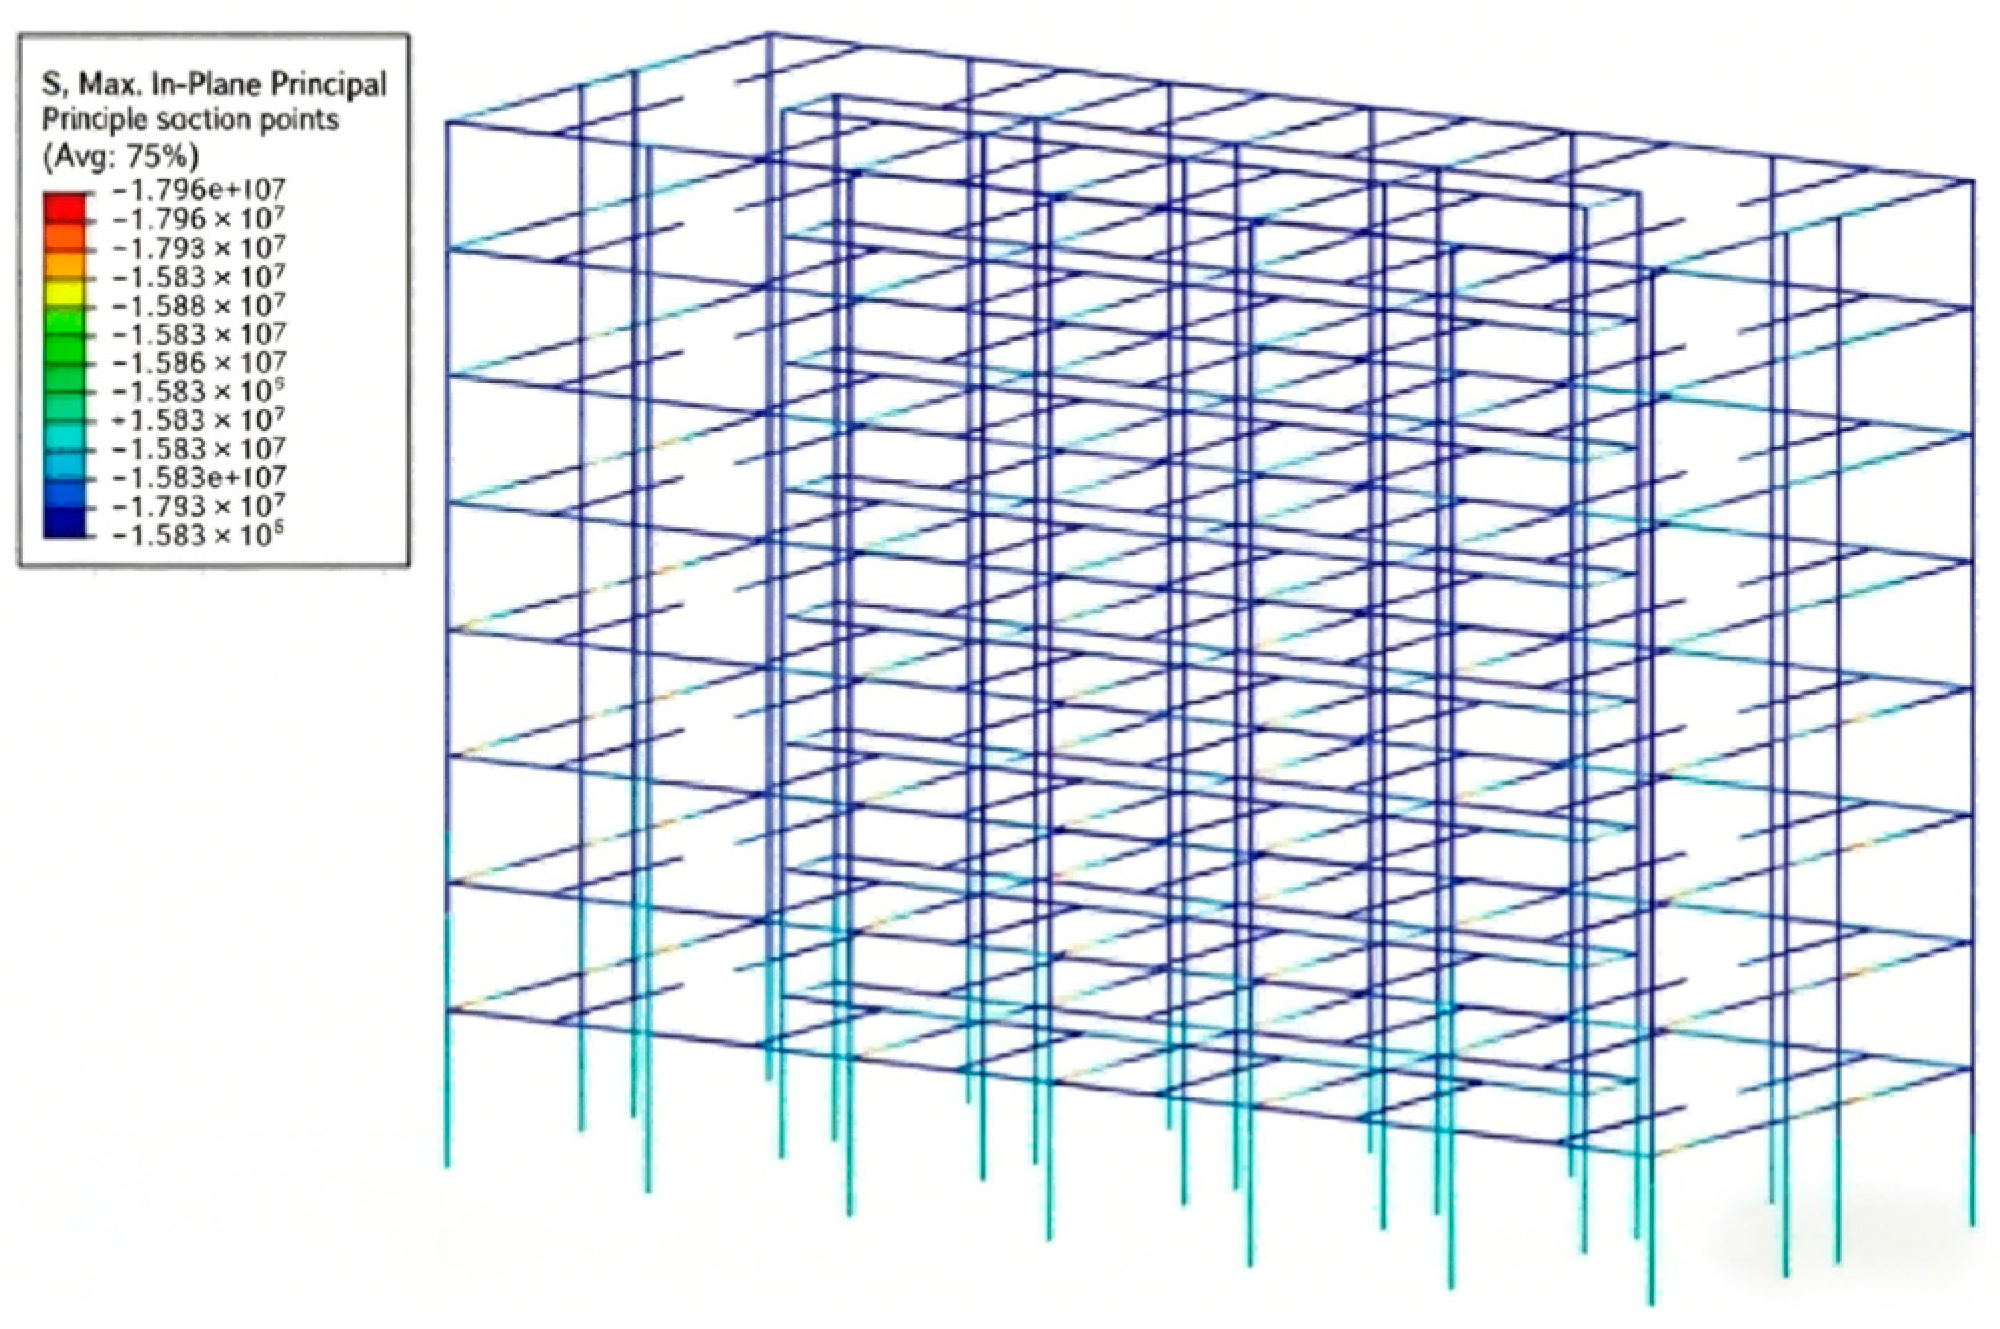
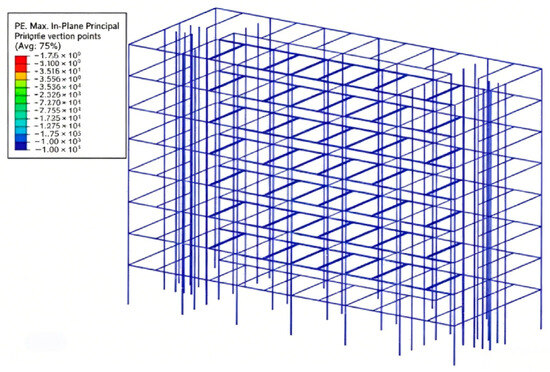
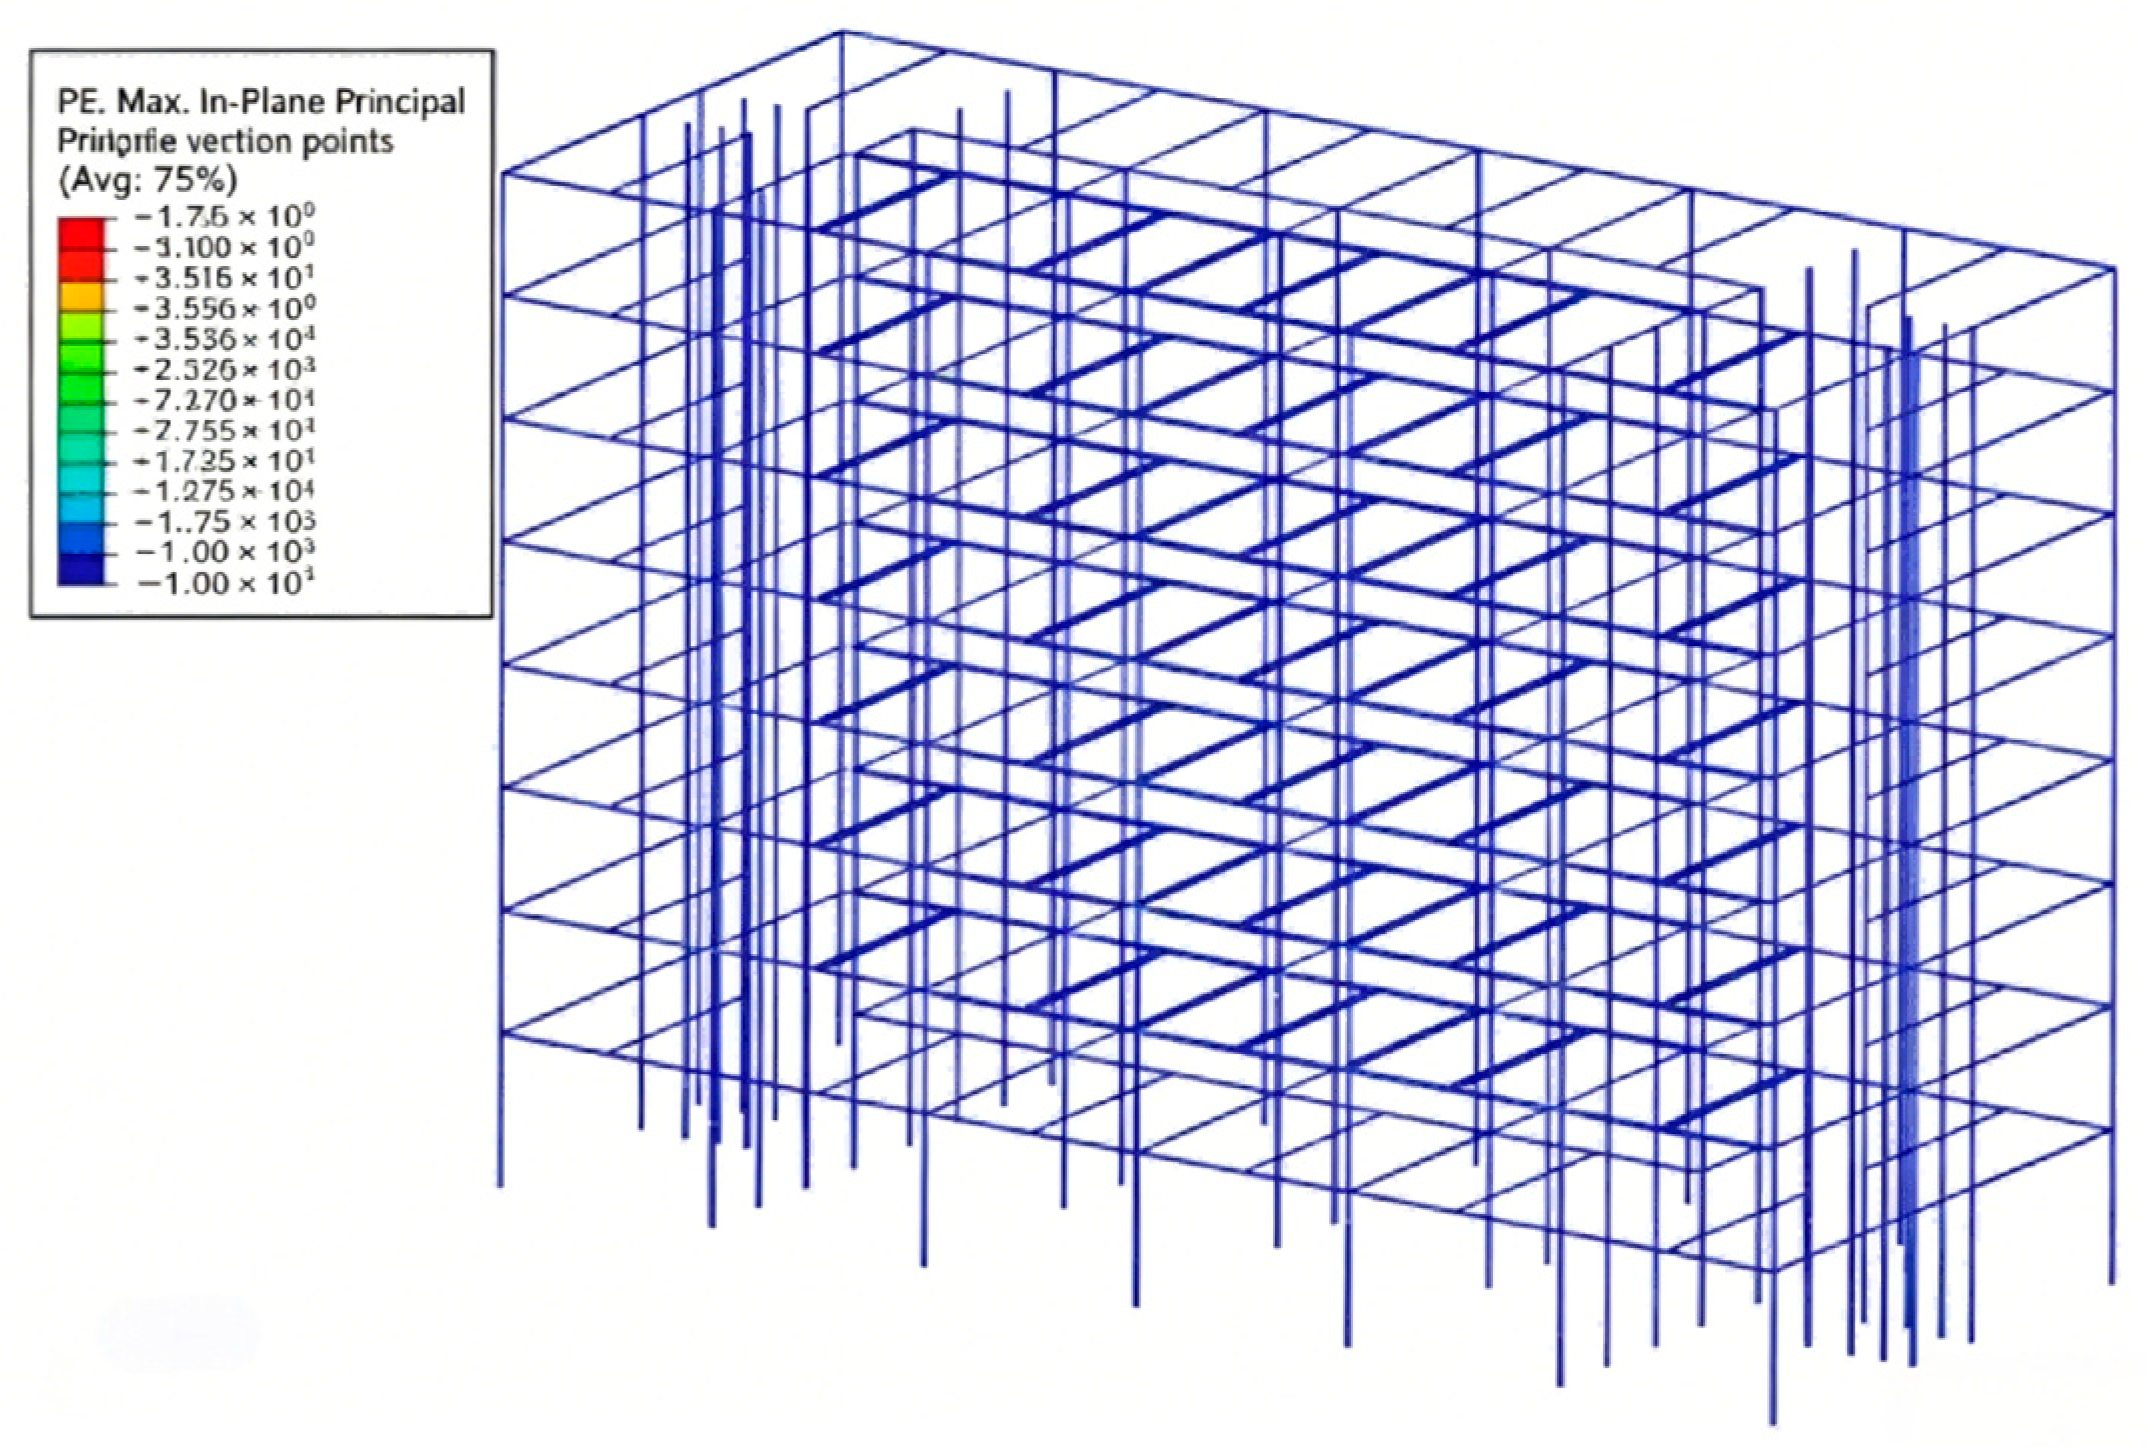
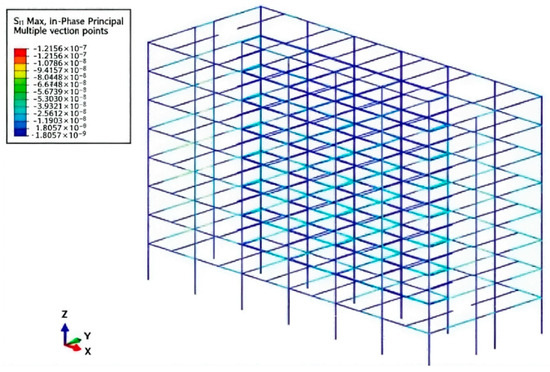
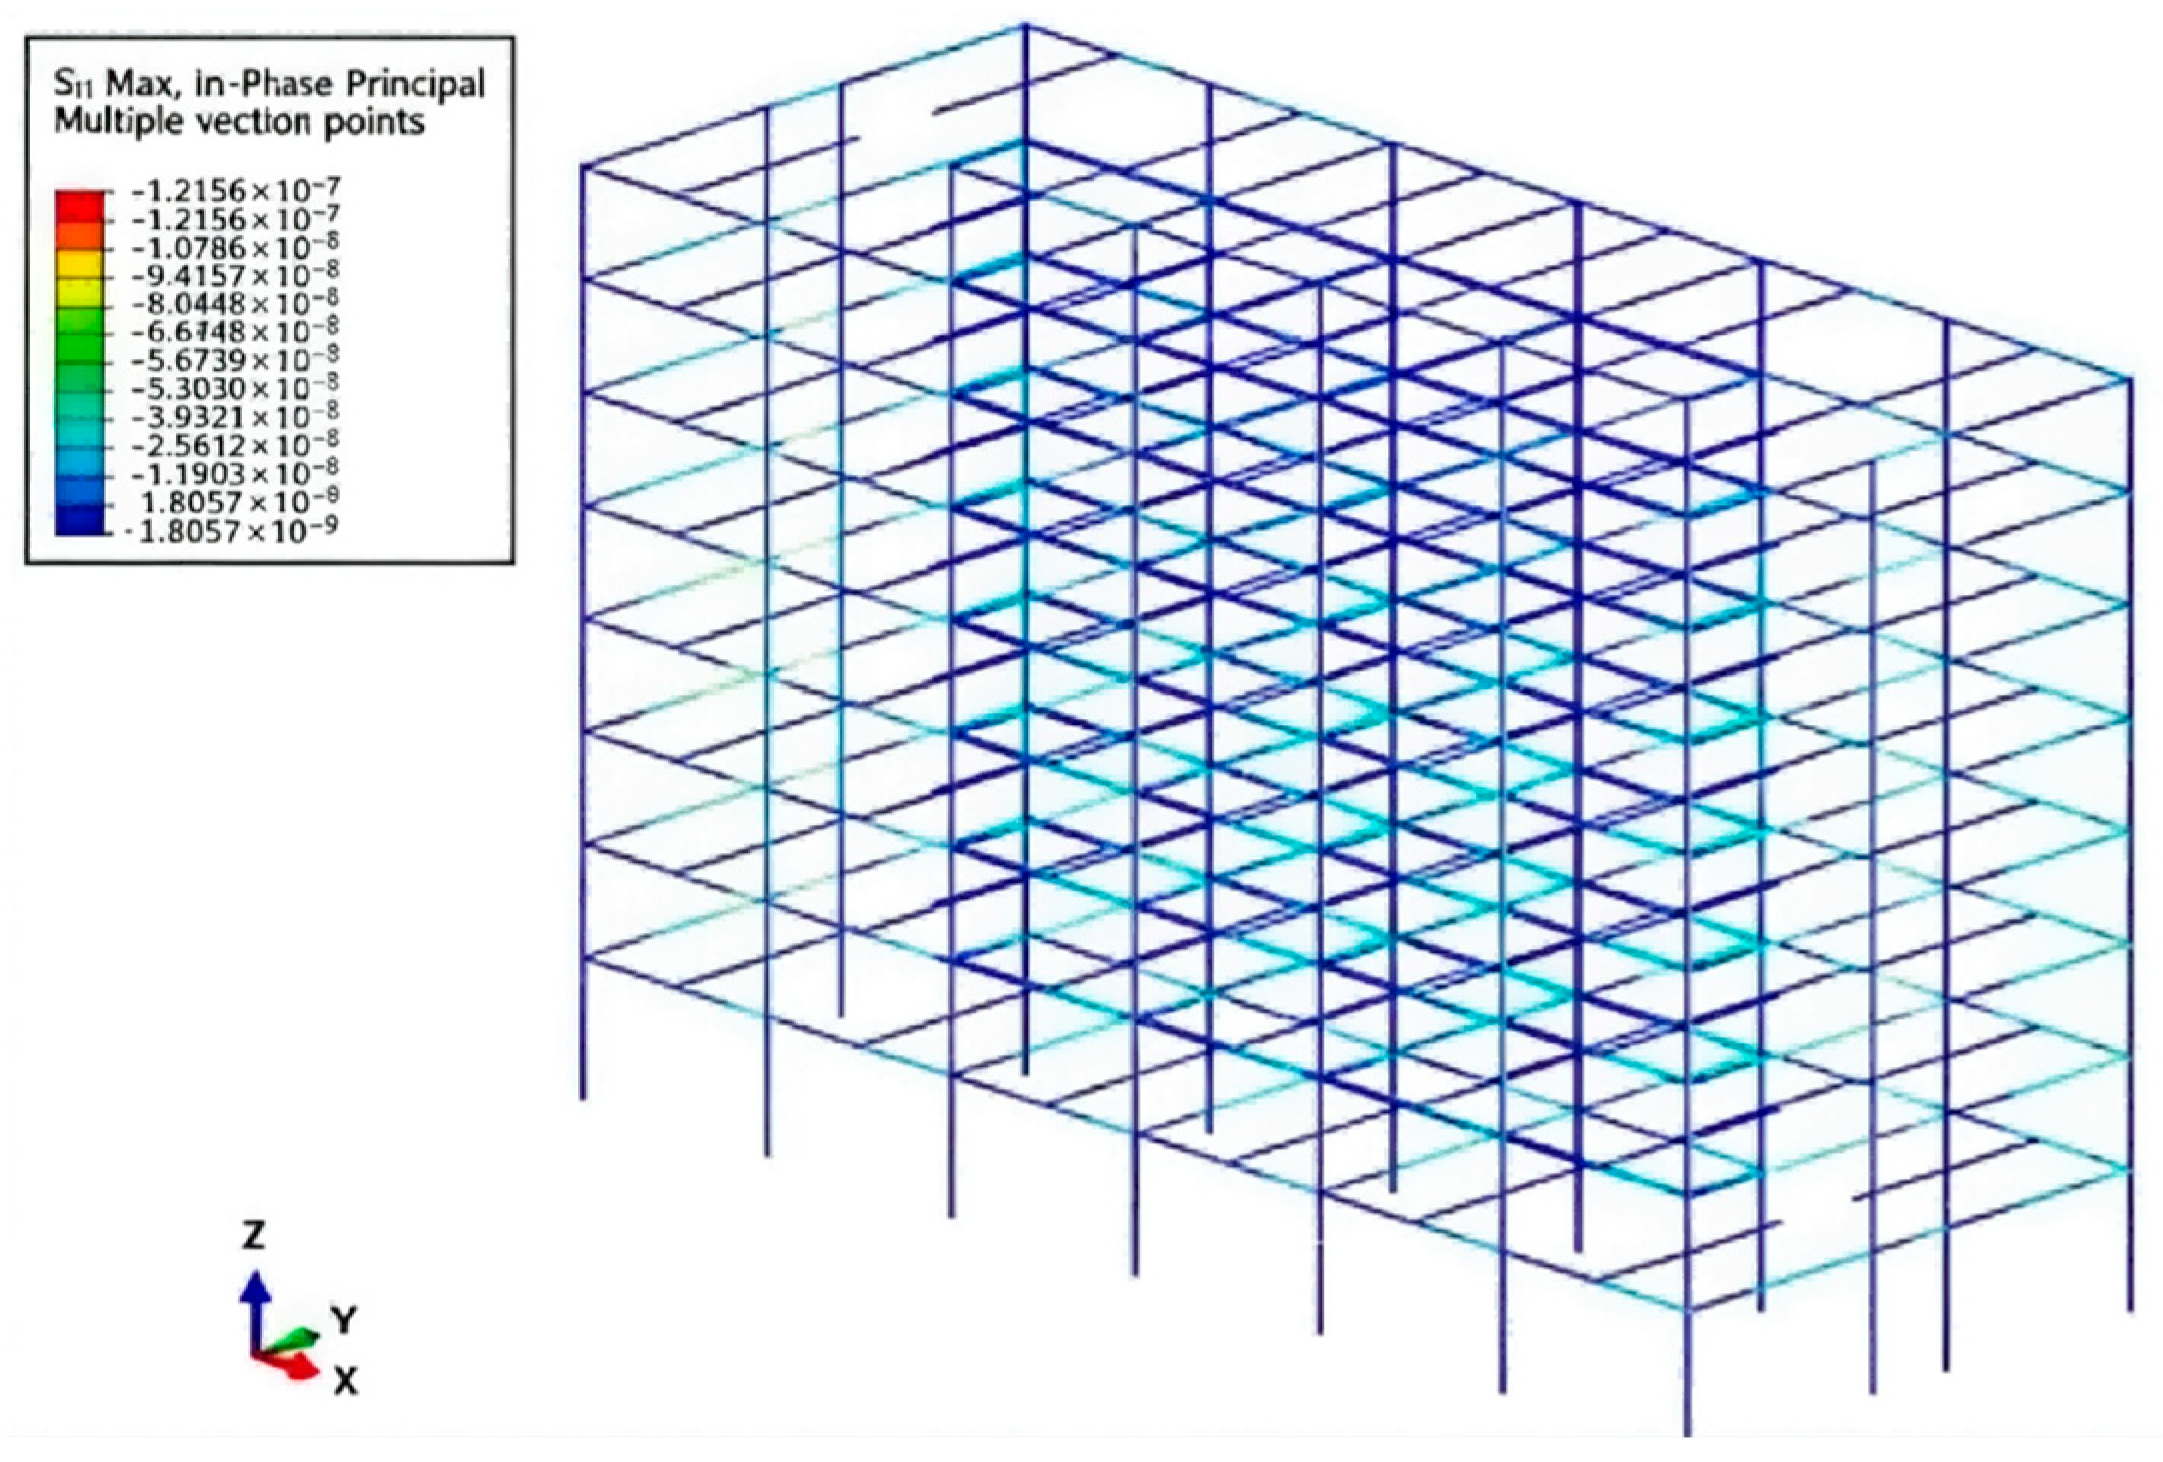
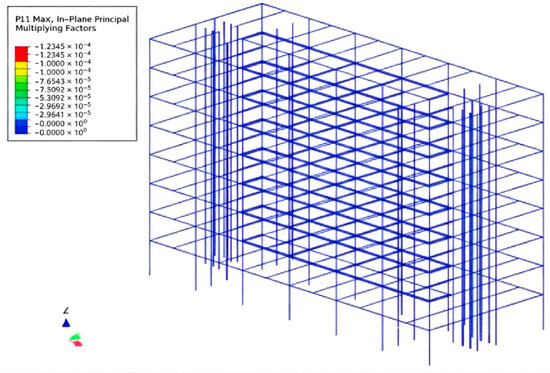
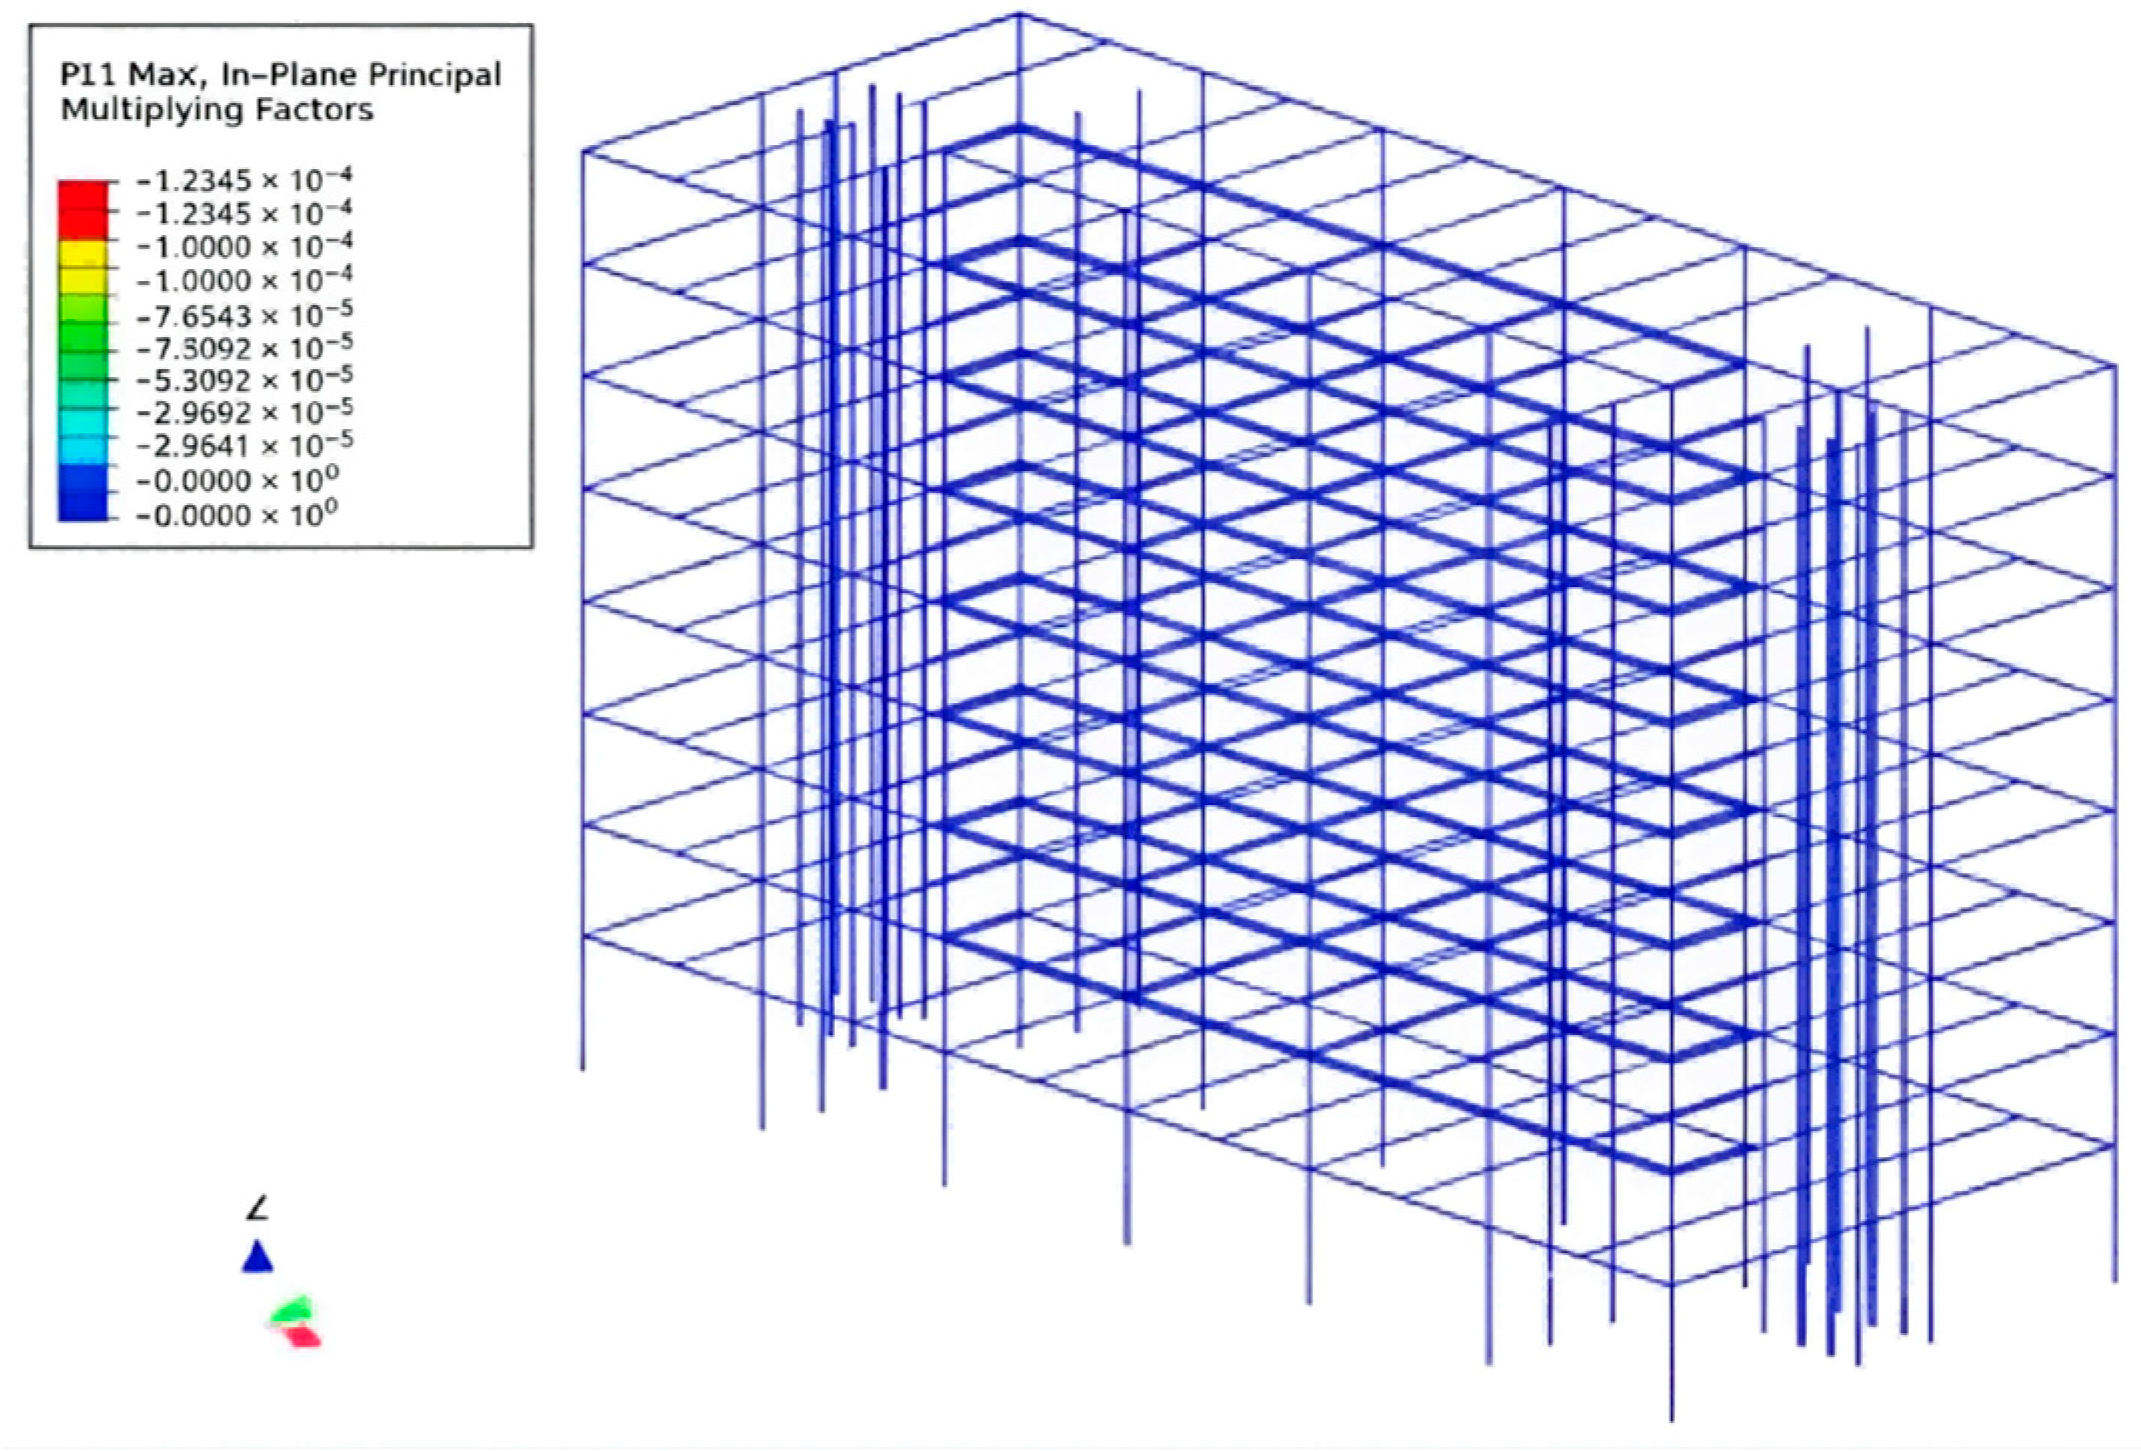
The stress mapping method has been extended to be applied in the structures of beams and columns. Under the action of Taft ground vibration, the stress of concrete beams and columns is shown in Figure 20. The stress distribution at the bottom of the beam and at the connection between the beam and the column reveals the plastic state. The plastic strain of the reinforcing bars in the concrete beams and columns is shown in Figure 21. From the figure, it can be seen that most of the reinforcing bars are still in the elastic working state; only in the intersection area of the beam and the column do some reinforcing bars enter the plastic state. The stress diagram at 20 s shows the peak stress in these areas, and the plastic strain of the reinforcing bars is as high as 3000 microns. The damage is controllable, and most of the components still remain elastic, which confirms the design concept of “strong columns and weak beams”. The stress of concrete beams and columns under El-Centro ground vibration for 20 s is shown in Figure 22. The plastic strain of the reinforcing bars in the beams and columns is shown in Figure 23; the stress of concrete beams and columns under artificial ground vibration for 20 s is shown in Figure 24, and the plastic strain of the reinforcing bars in the beams and columns is shown in Figure 25.
Figure 20.
Beam/column stress at 20 s (TAFT).
Figure 21.
Reinforcement strain at 20 s (TAFT).
Figure 22.
Beam/column stress at 20 s (EI).
Figure 23.
Reinforcement strain at 20 s (EI).
Figure 24.
Beam/column stress at 20 s (Artificial).
Figure 25.
Reinforcement strain at 20 s (Artificial).
This case study demonstrates the efficacy of pressure diagrams in visualizing and quantifying seismic damage progression in an 8-story frame-shear wall structure. The analysis reveals a clear sequence of damage initiation, expansion, and stabilization, consistent across different seismic inputs. Key findings include the prioritized failure of connecting beams, controlled plastic development in beams and columns, and edge-dominated damage in slabs [8]. The methods employed here, grounded in Chapter 4 of Document 1, provide a robust framework for seismic performance evaluation, emphasizing the importance of multi-directional analysis and detailed damage modeling for enhancing structural safety in earthquake-prone regions.
4. Conclusions
This study developed and verified a computational framework for seismic resistance analysis using ABAQUS, ETABS, and SAP2000. The interface programs enabled efficient model conversion, and the constitutive models accurately simulated nonlinear behavior [9]. Case studies demonstrated that the methods can predict damage states and weak links, providing a reliable tool for seismic design [10]. Future work will focus on refining models for broader applications.
Author Contributions
Conceptualization, C.X. and L.C.H.; methodology, C.X.; software, C.X.; validation, C.X. and L.C.H.; formal analysis, C.X.; investigation, C.X.; resources, C.X.; data curation, C.X.; writing—original draft preparation, C.X.; writing—review and editing, C.X.; visualization, xie chengxi; supervision, L.C.H.; project administration, L.C.H.; funding acquisition, C.X. All authors have read and agreed to the published version of the manuscript.
Funding
This study was funded by Universiti Malaysia Sabah (grant number UMS/ENG/2024).
Institutional Review Board Statement
Not applicable.
Informed Consent Statement
Not applicable.
Data Availability Statement
The ground motion records (Taft and El-Centro waves) used in this study are available from the Pacific Earthquake Engineering Research Center (PEER) Ground Motion Database (https://ngawest2.berkeley.edu/). The artificial ground motions were generated based on the target response spectra specified in the Chinese Code for Seismic Design of Buildings (GB 50011-2010) (Ministry of Housing and Urban-Rural Development of the People’s Republic of China, 2010; available at: https://www.codeofchina.com/standard/GB50011-2010(2016).html, accessed on 1 May 2026 [11]) and Eurocode 8, using the harmonic wavelet-based method described in European Committee for Standardization 2013 (EN 1998-1:2004+A1:2013, available at: https://www.civilenghub.com/NewSamples/BSI/182149833/BS-EN-1998-1-2004-A1-2013-1.pdf, accessed on 1 May 2026 [12]). The data presented in this study are available on request from the corresponding author. The data are not publicly available due to privacy restrictions.
Acknowledgments
The authors thank Andrew Lim Chung Han for guidance and the respondents who contributed to the experiments.
Conflicts of Interest
The authors have no competing interests to declare that are relevant to the content of this article.
References
- Soroushian, A.; Moghadam, A.S.; Sabzei, A.; Amiri, S.; Saaed, A.; Yahyapour, A. An Engineering Comment for Simply Accelerating Seismic Response History Analysis of Mid-Rise Steel-Structure Buildings. J. Archit. Eng. Res. 2023, 4, 3–23. [Google Scholar] [CrossRef]
- Li, Y.; Sun, Z.; Li, Y.; Yang, H.; Liu, X.; He, W. A vision transformer-based method for predicting seismic damage states of RC piers: Database development and efficient assessment. Reliab. Eng. Syst. Saf. 2025, 263, 111287. [Google Scholar] [CrossRef]
- Ismail-Zadeh, A. Earthquakes yes, disasters no. npj Nat. Hazards 2024, 1, 46. [Google Scholar] [CrossRef]
- Yang, X.; Lu, D.; Jia, M.; Wang, T. Time-dependent seismic reliability analysis of rocking cold-formed steel frame based on improved HOMM. Thin-Walled Struct. 2024, 200, 111878. [Google Scholar] [CrossRef]
- Kawashima, K.; Watanabe, G.; Hayakawa, R. Seismic Performance of RC Bridge Columns Subjected to Bilateral Excitation. In Proceedings of the 35th Joint Meeting, Panel on Wind and Seismic Effects, UJNR; Available online: https://t2r2.star.titech.ac.jp/cgi-bin/publicationinfo.cgi?lv=en&q_publication_content_number=CTT100483297 (accessed on 1 May 2026).
- Nugroho, H.T.; Suhendra, S.; Nuklirullah, M. Analisa Perhitungan Struktur Baja Menggunakan Program ETABS. J. Talent. Sipil 2021, 4, 120–127. [Google Scholar] [CrossRef]
- Wang, Z.; Zuo, R.; Liu, H. Lithological Mapping Based on Fully Convolutional Network and Multi-Source Geological Data. Remote Sens. 2021, 13, 4860. [Google Scholar] [CrossRef]
- Pop, N.; Marin, M.; Vlase, S. Mathematics in Finite Element Modeling of Computational Friction Contact Mechanics 2021–2022. Mathematics 2023, 11, 255. [Google Scholar] [CrossRef]
- Liu, R. Seismic design methods for concrete buildings. Appl. Comput. Eng. 2023, 24, 158–162. [Google Scholar] [CrossRef]
- Suchocki, C. Finite element implementation of a certain class of elasto-viscoplastic constitutive models. Acta Mech. 2023, 234, 4365–4389. [Google Scholar] [CrossRef]
- GB 50011 2010; Ministry of Housing and Urban Rural Development of the People’s Republic of China. Code for Seismic Design of Buildings. China Architecture & Building Press: Beijing, China, 2010; (2016 Revised Edition). Available online: https://www.codeofchina.com/standard/GB50011-2010(2016).html (accessed on 1 May 2026).
- EN 1998 1:2004+A1:2013; Eurocode 8: Design of Structures for Earthquake Resistance—Part 1: General Rules, Seismic Actions and Rules for Buildings. European Committee for Standardization (CEN): Brussels, Belgium, 2013. Available online: https://www.civilenghub.com/NewSamples/BSI/182149833/BS-EN-1998-1-2004-A1-2013-1.pdf (accessed on 1 May 2026).


Disclaimer/Publisher’s Note: The statements, opinions and data contained in all publications are solely those of the individual author(s) and contributor(s) and not of MDPI and/or the editor(s). MDPI and/or the editor(s) disclaim responsibility for any injury to people or property resulting from any ideas, methods, instructions or products referred to in the content. |
© 2026 by the authors. Licensee MDPI, Basel, Switzerland. This article is an open access article distributed under the terms and conditions of the Creative Commons Attribution (CC BY) license.