1. Introduction
Rapid urbanization has transformed Dhaka into one of the most densely populated megacities in South Asia, characterized by intense land-use conversion, high-rise expansion, and increasing pressure on urban infrastructure. This rapid and often unplanned growth has significantly altered the urban microclimate and built environment, contributing to rising energy demands across residential, commercial, and transportation sectors [
1]. As cities continue to expand, understanding the spatial dynamics of urban energy use has become increasingly important for supporting sustainable urban development and climate-responsive planning [
2]. Urban energy consumption reflects the cumulative energy required to sustain economic activities, infrastructure, and daily life within cities. It is influenced by a complex interaction of factors, including urban morphology, land cover characteristics, population density, and anthropogenic activity [
3,
4]. However, direct measurement of urban energy consumption at fine spatial scales remains challenging, particularly in data-scarce environments where detailed, building-level energy information is not readily accessible [
2,
5]. In this context, proxy-based approaches have been widely explored within Remote Sensing and Urban Energy Modeling to infer spatial variations in urban energy-related patterns. Remotely sensed indicators such as land surface temperature, vegetation indices, built-up indices, and nighttime light intensity provide valuable insights into the physical and functional characteristics of urban areas that are closely associated with energy use intensity. By integrating these indicators, it becomes possible to develop a relative representation of urban energy intensity that captures spatial heterogeneity across the city.
Previous studies have demonstrated the usefulness of individual indicators such as LST, NDVI, NDBI, and nighttime light intensity for assessing urban thermal environments and energy-related processes [
6]. However, much of the existing literature remains focused on single-variable analyses or simple correlation-based assessments, which do not fully capture the complex interactions among environmental, built-environment, and anthropogenic factors. Furthermore, regression-based and machine-learning approaches have increasingly been applied for urban energy prediction and mapping; however, these methods typically require extensive observed energy-consumption datasets for model calibration and validation. Such datasets are often unavailable in rapidly urbanizing cities of the Global South, limiting the applicability of data-intensive approaches in these contexts [
3,
7]. Despite growing interest in urban energy consumption mapping, three key limitations persist in the existing literature. First, most studies rely on single-variable proxies rather than integrated multi-indicator frameworks. Second, existing AHP-MCDA applications in urban energy contexts have primarily focused on developed cities with comprehensive energy databases, leaving data-scarce megacities like Dhaka understudied. Third, the specific interaction between rapid informal urban expansion and energy intensity patterns in South Asian monsoon-climate cities has not been spatially modelled at fine resolution [
8,
9,
10]. Building-scale energy-performance studies and national energy-planning assessments further illustrate the breadth of energy-efficiency considerations relevant to sustainability-oriented decision-making, from passive ventilation design in individual structures [
11] to conservation planning at the national scale [
12]; however, such approaches operate at the building or national level and do not provide the fine-grained, intra-urban spatial resolution required for city-scale planning, which is the gap this study addresses. To address these limitations, this study adopts a GIS-based Analytic Hierarchy Process-Multi-Criteria Decision Analysis (AHP-MCDA) framework. AHP-MCDA was selected because it integrates heterogeneous spatial indicators with different units and scales. The method also incorporates expert knowledge through pairwise comparisons. Unlike machine-learning, regression-based, or statistical prediction methods, which require large volumes of observed energy-consumption data, the AHP-MCDA framework can be effectively implemented in data-constrained environments where direct energy records are unavailable. In addition, the approach provides interpretable criterion weights, making it particularly suitable for planning-oriented decision support and urban sustainability assessments. This study addresses these gaps by constructing a multi-criteria spatial index integrating eight physical and socioeconomic indicators, calibrated through expert-weighted AHP for the Dhaka Metropolitan Area. Given the scale and complexity of Dhaka, such an approach is particularly relevant. The city exhibits pronounced contrasts between densely built-up zones, emerging peri-urban areas, and fragmented green spaces, all of which contribute differently to energy use patterns. A spatially explicit assessment of proxy-based urban energy intensity can therefore provide critical insights into how urban form and environmental conditions interact to shape spatial variations in urban energy intensity. The novelty of this study is the development of a proxy-based Urban Energy Intensity Index (UEI). Although the AHP-MCDA weighted-overlay technique is well established in spatial suitability and environmental assessment research, the novelty of this study lies in (i) the integration of a specific set of eight indicators to represent urban energy intensity rather than land suitability or environmental risk, (ii) its application to a rapidly and informally expanding, data-scarce South Asian megacity under monsoon climatic conditions, and (iii) the integration of AHP-derived weights with formal weight-sensitivity analysis and Global Moran’s I spatial autocorrelation validation, a combination that has rarely been reported in existing AHP-MCDA studies of urban energy intensity. The index integrates eight environmental, built-environment, and anthropogenic indicators within a GIS-based AHP-MCDA framework. By applying this approach to Dhaka, one of the fastest-growing and most data-constrained megacities in South Asia, the study provides new insights into intra-urban energy-intensity patterns and offers a practical decision-support framework for sustainable urban planning and climate-responsive development. To support this, the present study adopts a GIS-based multi-criteria framework, integrating remote sensing-derived indicators through an Analytic Hierarchy Process (AHP) within a Multi-Criteria Decision Analysis (MCDA) approach. This framework enables the systematic combination of heterogeneous variables into a composite urban energy intensity index, facilitating the identification of areas with relatively higher or lower energy intensity. The study provides a spatial perspective on urban energy dynamics, offering insights that can inform urban planning strategies, resource allocation, and sustainable development initiatives in rapidly growing metropolitan environments. Given the unavailability of district-level energy consumption data in rapidly urbanizing cities like Dhaka, direct measurement of urban energy intensity remains infeasible at fine spatial scales. This study therefore adopts a proxy-based spatial modelling approach, wherein variables such as LST, NDVI, NDBI, nighttime light intensity, and population density serve as empirically established surrogates for energy-related urban processes. LST reflects surface heat associated with built-up environments, nighttime lights correlate with anthropogenic activity and electricity use, while impervious surfaces and NDBI represent construction density linked to cooling and heating demand.
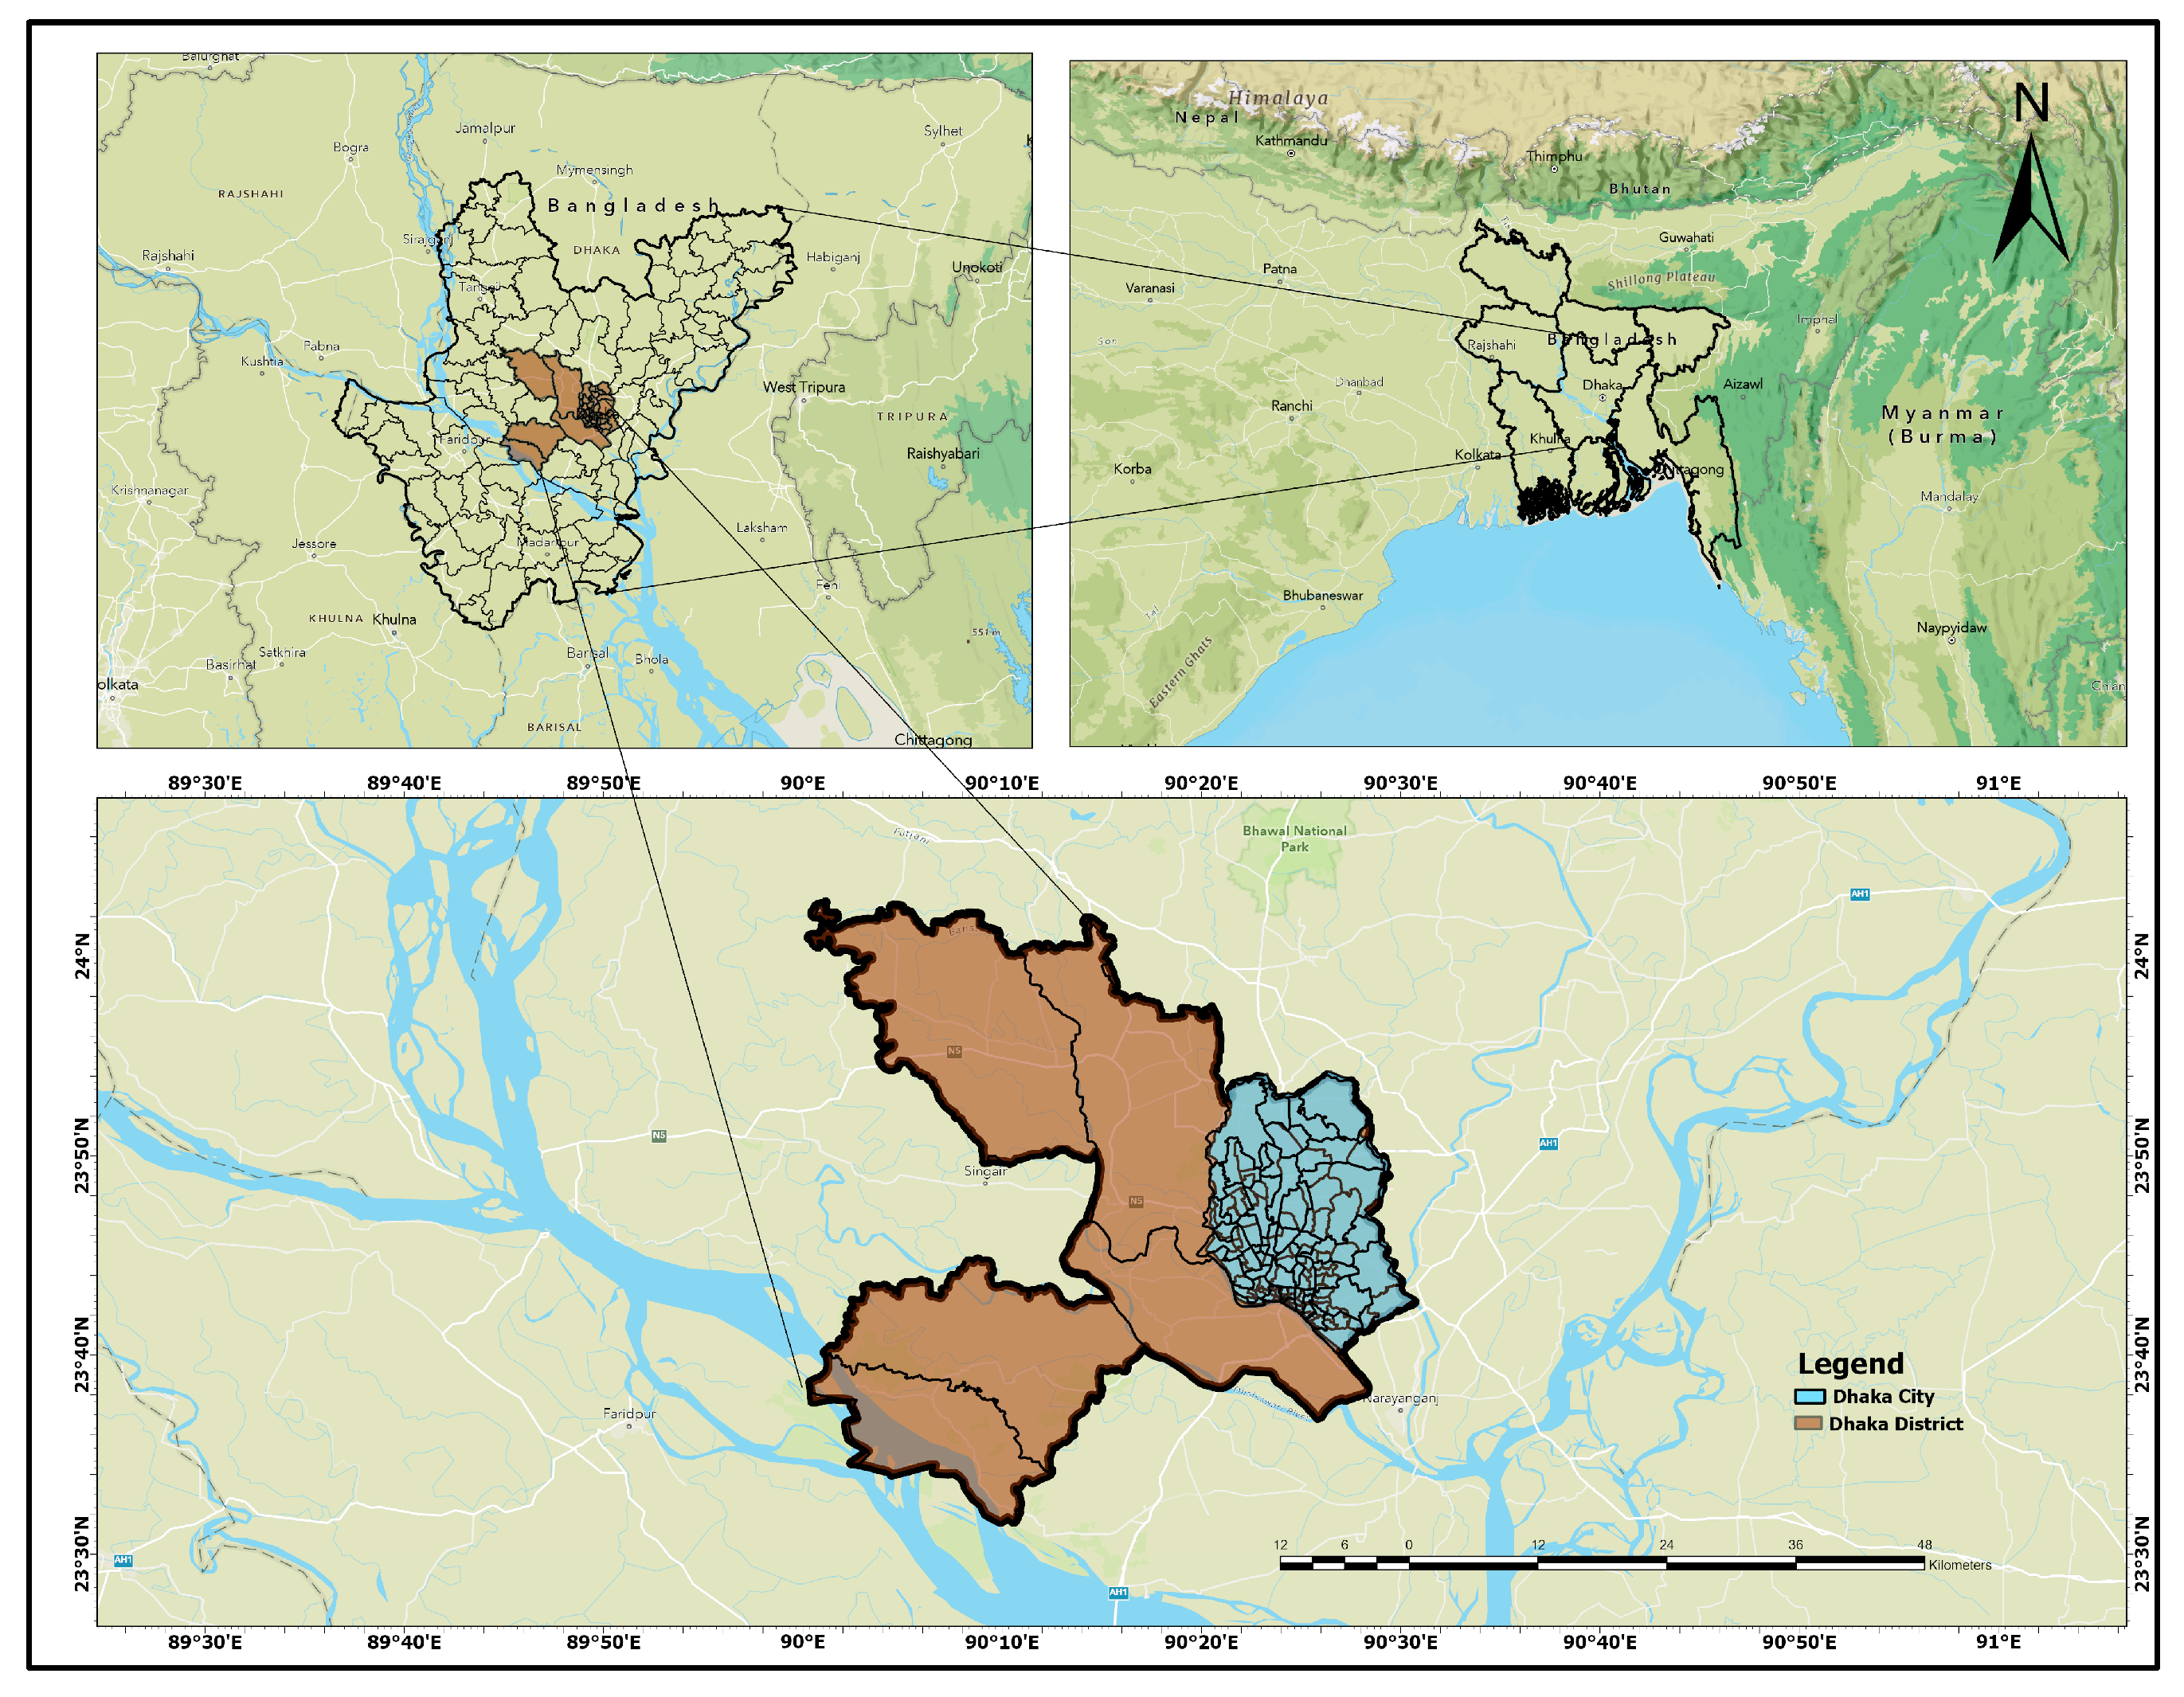
Dhaka, the capital and largest metropolitan region of Bangladesh, is located in the country’s central-eastern region shown in
Figure 1. Geographically, the city lies between approximately 23°42′ N to 24°05′ N latitude and 90°15′ E to 90°30′ E longitude. The city covers an area of about 306 square kilometers and has experienced rapid urban expansion, with built-up areas increasing significantly over recent decades due to unplanned urbanization and population growth. Dhaka’s landscape is predominantly urbanized, with dense built-up zones, limited vegetation cover, and shrinking water bodies, contributing to increased land surface temperatures (LST) and pronounced urban heat island effects. The climate is tropical monsoon, with hot, humid summers and mild winters, where seasonal variations influence surface temperature dynamics and energy consumption patterns [
1,
13].
2. Methodology
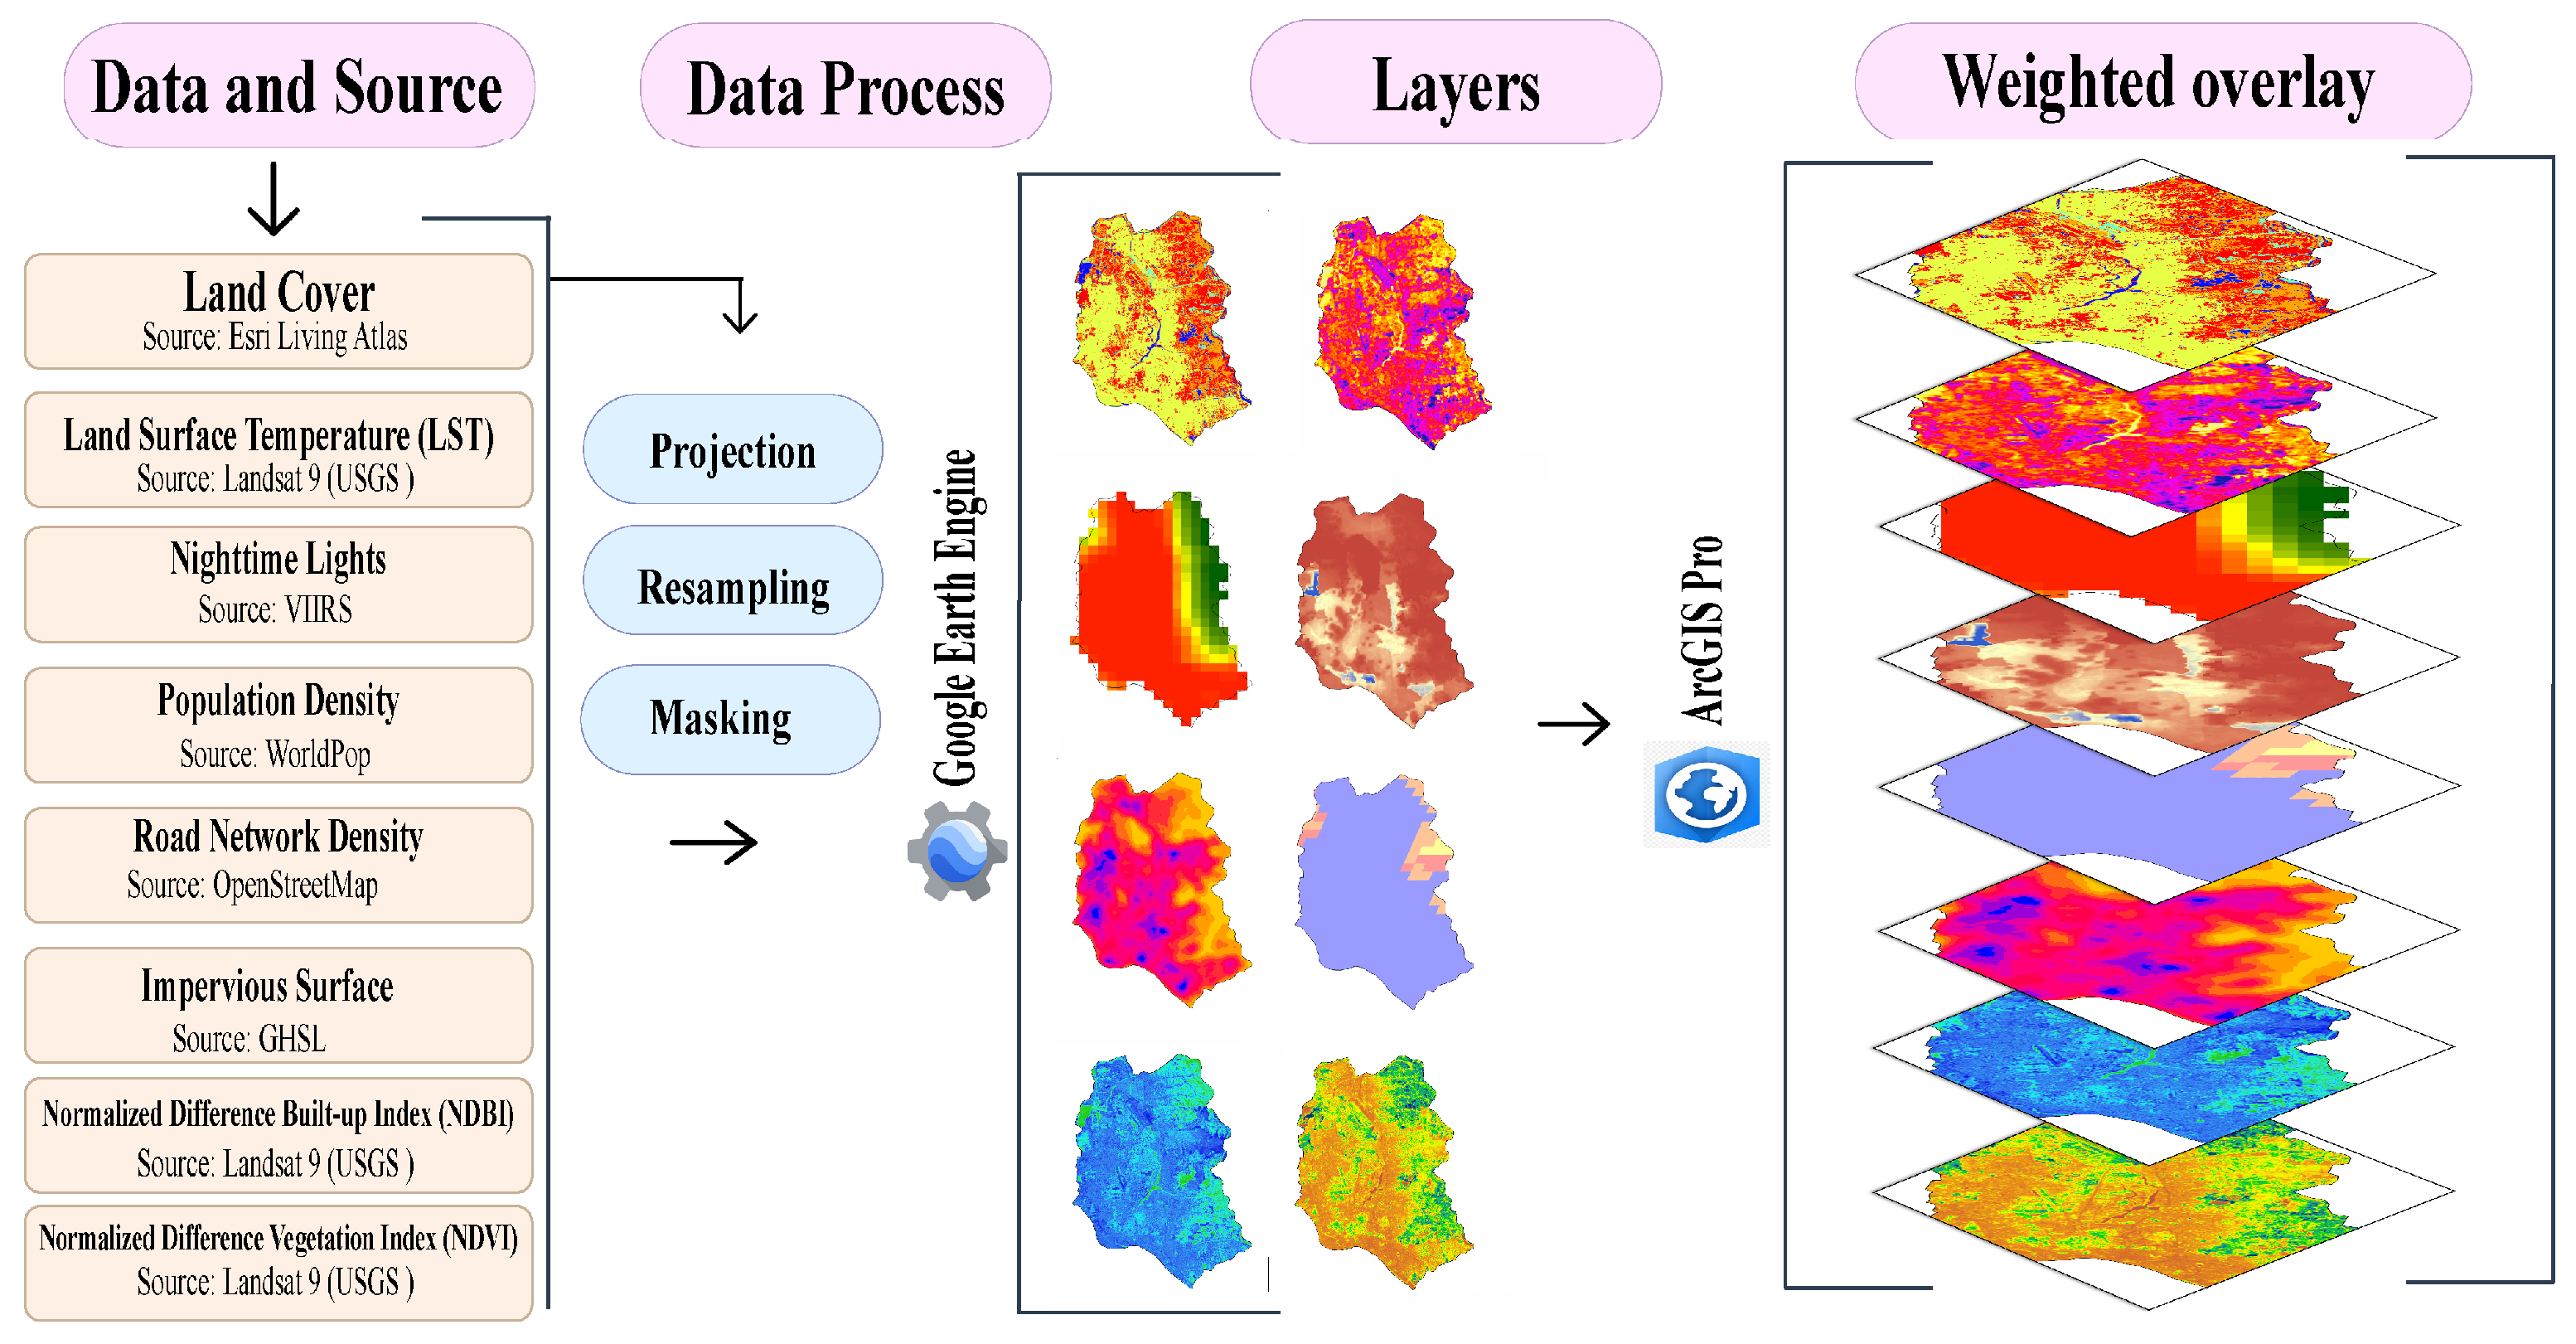
The method integrates multiple geospatial datasets through GIS MCDA-AHP workflow followed by layer generation and standardization. A weighted overlay analysis is then applied to combine these layers, enabling the identification of spatial patterns and suitability zones based on assigned criteria importance shown in
Figure 2.
2.1. Data Source and Collection
The assessment of proxy-based urban energy intensity integrates multiple spatial indicators representing environmental conditions, urban morphology, and anthropogenic activity. Vegetation conditions are captured using the Normalized Difference Vegetation Index (NDVI), while built-up intensity is represented through the Normalized Difference Built-up Index (NDBI). Land Surface Temperature (LST) is incorporated to reflect spatial variations in surface thermal characteristics. These indices are derived from recent imagery acquired by Landsat 9, ensuring consistent spectral and spatial resolution. Anthropogenic activity is represented using nighttime light intensity obtained from VIIRS data, which is widely recognized as a reliable proxy for urban energy use patterns. Population density is incorporated using globally available gridded datasets such as WorldPop or the Global Human Settlement Layer, providing a detailed representation of human concentration [
14]. Impervious surface conditions, indicating the extent of sealed and energy-intensive surfaces, are derived either through spectral analysis or existing global datasets. Land cover information is obtained from the latest global land cover of 2024 product developed by Esri, which is generated using machine learning techniques based on deep learning classification models applied to high-resolution satellite imagery. This dataset provides improved thematic accuracy and up-to-date representation of urban land dynamics. Road network data are extracted from OpenStreetMap and processed to compute road density, representing urban accessibility and transport-related energy activity. All datasets are selected from the most reliable and up-to-date global sources to ensure consistency, accuracy, and suitability for spatial multi-criteria analysis. The selected indicators were derived using established remote sensing and GIS procedures. NDVI was calculated from Landsat 9 near-infrared (NIR) and red bands to represent vegetation abundance, while NDBI was derived from shortwave infrared (SWIR) and near-infrared bands to characterize built-up intensity. LST was retrieved from Landsat 9 thermal infrared data using standard radiometric calibration and emissivity-corrected temperature conversion procedures. Nighttime light intensity was obtained from VIIRS monthly composites and used as a proxy for anthropogenic activity and electricity-use patterns. NDVI and NDBI were derived from Landsat 9 OLI-2 imagery using standard spectral band combinations for vegetation and built-up area characterization, respectively. Land Surface Temperature (LST) was retrieved from Landsat 9 thermal data using an established retrieval approach with appropriate atmospheric and surface emissivity corrections. Impervious surface information was obtained from the selected Global Human Settlement Layer (GHSL) built-up product and resampled to the common analysis grid to ensure spatial consistency across all datasets. Land-cover data from the ESRI Global Land Cover product were reclassified into energy-relevant categories according to their land-surface characteristics and their potential influence on urban thermal behavior. Road-network density was generated from vector road data using a kernel density estimation approach to represent the spatial distribution and intensity of transportation infrastructure. Population density data were acquired from WorldPop and resampled to the common analysis grid. Impervious surface information was obtained from the Global Human Settlement Layer (GHSL), while road-network density was calculated from OpenStreetMap data using kernel-density analysis. Land-cover classes were extracted from the ESRI Global Land Cover dataset and reclassified according to their relative contribution to urban energy intensity. Population density was included because residential and commercial energy demand generally increases with the concentration of occupants per unit area. Road network density was incorporated as a proxy for transportation-related energy consumption and traffic-induced anthropogenic heat emissions. Land cover composition and the NDVI were selected to characterize the balance between energy-intensive impervious surfaces and vegetated areas, which reduce cooling demand through shading and evapotranspiration. All indicators were normalized to a common scale prior to integration to ensure comparability among variables with different units and value ranges.
2.2. Preprocessing of Data Layers
All datasets were preprocessed within Google Earth Engine to ensure consistency and analytical compatibility. The layers were harmonized through reprojection to UTM Zone 46N, which is appropriate for Dhaka, ensuring spatial accuracy across datasets. To avoid resolution mismatch and potential data loss, all layers were resampled to a uniform spatial resolution of 10 m using bilinear interpolation for continuous raster’s and nearest-neighbor resampling for categorical datasets. It is acknowledged that coarser-resolution inputs do not contain sub-pixel information at 10 m; resampling to 10 m was performed for analytical consistency rather than to generate new information. Standard preprocessing steps, including clipping, masking, and normalization, were applied.
Table 1 shows the sources of data.
2.3. Criteria Selection, Structuring, AHP Weight Derivation and Overlay
The selection of criteria is guided by the conceptual framework of proxy-based urban energy intensity, integrating variables that represent environmental conditions, urban morphology, and anthropogenic activity. A total of eight criteria were considered, including NDVI, NDBI, LST, nighttime light intensity, population density, impervious surface fraction, land cover, and road network density. These variables collectively capture the spatial heterogeneity of urban environments and their influence on energy intensity patterns. The criteria were structured hierarchically following the principles of the Analytic Hierarchy Process. At the top level, the overall goal is defined as the assessment of proxy-based urban energy intensity. The second level consists of three major groups: environmental (NDVI, LST, land cover), built environment (NDBI, impervious surface, road density), and anthropogenic activity (nighttime lights, population density). Pairwise comparison matrices were developed using Saaty’s 1–9 scale to evaluate the relative importance of each criterion. Judgments were informed by established relationships in urban energy studies, where variables such as LST, NDBI, and nighttime lights were considered more influential due to their direct association with energy-intensive conditions. The pairwise comparisons were performed by the author team, drawing on their collective expertise in geography, GIS, and environmental remote sensing, and were systematically informed by relationships documented in the peer-reviewed literature on land surface temperature, nighttime lights, and urban energy processes [
13,
15,
16], rather than by an independent multi-expert panel. This literature-informed, author-elicited approach is widely adopted in proceedings-scale AHP-MCDA studies. LST was assigned the highest relative importance because it directly represents the cumulative thermal response of urban surfaces to both environmental and anthropogenic influences. Unlike individual indicators such as NDVI and NDBI, which characterize specific aspects of vegetation cover and built-up intensity, LST integrates the combined effects of land cover, urban morphology, impervious surfaces, vegetation loss, and human activities.
Previous studies have shown that elevated LST is closely associated with urban heat island intensity, increased cooling demand, and greater energy-related stress within densely developed urban environments [
2,
4]. Since the objective of this study is to identify spatial patterns of proxy-based urban energy intensity rather than estimate actual energy consumption, LST provides the most comprehensive representation of the thermal conditions associated with energy-intensive urban areas. Therefore, it was assigned the highest weight within the AHP framework. The complete pairwise comparison matrix constructed using Saaty’s 1–9 scale is presented in
Table 2. LST was assigned the highest relative importance owing to its direct representation of surface thermal energy accumulation within built environments. Nighttime light intensity was ranked second, reflecting its well-established role as a proxy for anthropogenic energy activity at the urban scale. NDBI was rated moderately important relative to population density, as it captures the structural extent of built-up surfaces rather than occupancy-driven energy demand. Impervious surface fraction was considered moderately influential, while NDVI and land cover were assigned comparatively lower weights given their inverse or indirect relationship with energy intensity. Road network density received the lowest weight, as it represents an accessibility measure rather than a direct indicator of energy use.
Other potentially relevant indicators, including building height, floor-area ratio, industrial land-use classification, and metered electricity billing records, were considered but excluded because consistent, city-wide, open-access datasets for Dhaka were unavailable. Consequently, the eight retained indicators were selected based on (i) their well-established association with urban energy-related processes in the literature and (ii) their consistent availability as high-resolution, open-access geospatial datasets covering the entire study area, a prerequisite for ensuring methodological reproducibility in data-scarce megacities. Values above the diagonal represent direct Saaty scale judgments; values below the diagonal are their reciprocals. The matrix was normalized using the eigenvector method to derive the final priority weights for each criterion. The maximum eigenvalue (
λmax) was computed as 8.116. The Consistency Index (CI) was subsequently determined as:
Using Saaty’s Random Inconsistency Index RI = 1.41 for n = 8 criteria, the Consistency Ratio was obtained as
Since CR = 0.012 falls well below the accepted threshold of 0.10, the pairwise judgments are considered acceptably consistent, confirming the reliability of the derived weight structure [
15,
17].
Following preprocessing and weight derivation, the standardized criteria layers were integrated using a weighted overlay approach within ArcGIS Pro 3.4.0. Each raster layer was first normalized to a common scale (0-1) to ensure comparability across variables with different units and value ranges. Directional influence was also considered during standardization, where variables such as NDVI were inversely related to energy intensity, while LST, NDBI, nighttime lights, and population density were positively related. The linear weighted overlay approach was selected because it provides a transparent and interpretable framework for integrating multiple standardized indicators while preserving the relative importance derived from AHP. In contrast, nonlinear integration methods require additional assumptions regarding variable interactions and often reduce interpretability, making them less suitable for planning-oriented decision support. Furthermore, the objective of this study was not to model complex causal relationships among variables but rather to construct a composite spatial index representing the relative distribution of proxy-based urban energy intensity. Linear weighted overlay has been widely applied in GIS-based MCDA studies because it allows straightforward comparison among criteria, facilitates replication, and enables clear communication of results to planners and decision-makers. The weighted overlay was performed using the Raster Calculator tool, applying the AHP-derived weights to each criterion. The composite Urban Energy Intensity Index (UEI) was calculated as a linear combination of all normalized layers:
where w
i represents the weight of each criterion and
Xi denotes the corresponding standardized raster layer. This process resulted in a continuous spatial surface representing relative variations in proxy-based urban energy intensity across Dhaka. The final UEI map was further classified into five categories very low, low, moderate, high, and very high using the natural breaks (Jenks) classification method to enhance interpretability. The Jenks natural breaks algorithm was selected because it minimises within-class variance and maximises between-class variance, making it appropriate for spatially heterogeneous continuous indices. To assess classification sensitivity, the UEII was also classified using equal interval and quantile methods. The UEI map was classified using the natural breaks (Jenks) method to emphasize inherent groupings in the data. High- and very-high energy-intensity zones were consistently concentrated in Mirpur, Old Dhaka, Tejgaon, and Motijheel, while lower-intensity classes predominated in the peripheral and vegetated areas of the city. The statistically significant positive spatial autocorrelation revealed by the Global Moran’s I analysis (Moran’s I = 0.349384, z-score = 14.21,
p < 0.001) confirms that these hotspot patterns are spatially coherent rather than randomly distributed. This classification enabled the identification of spatial clusters and intensity gradients, supporting a clearer understanding of urban energy patterns and facilitating decision-making for urban planning and management.
3. Analysis and Results
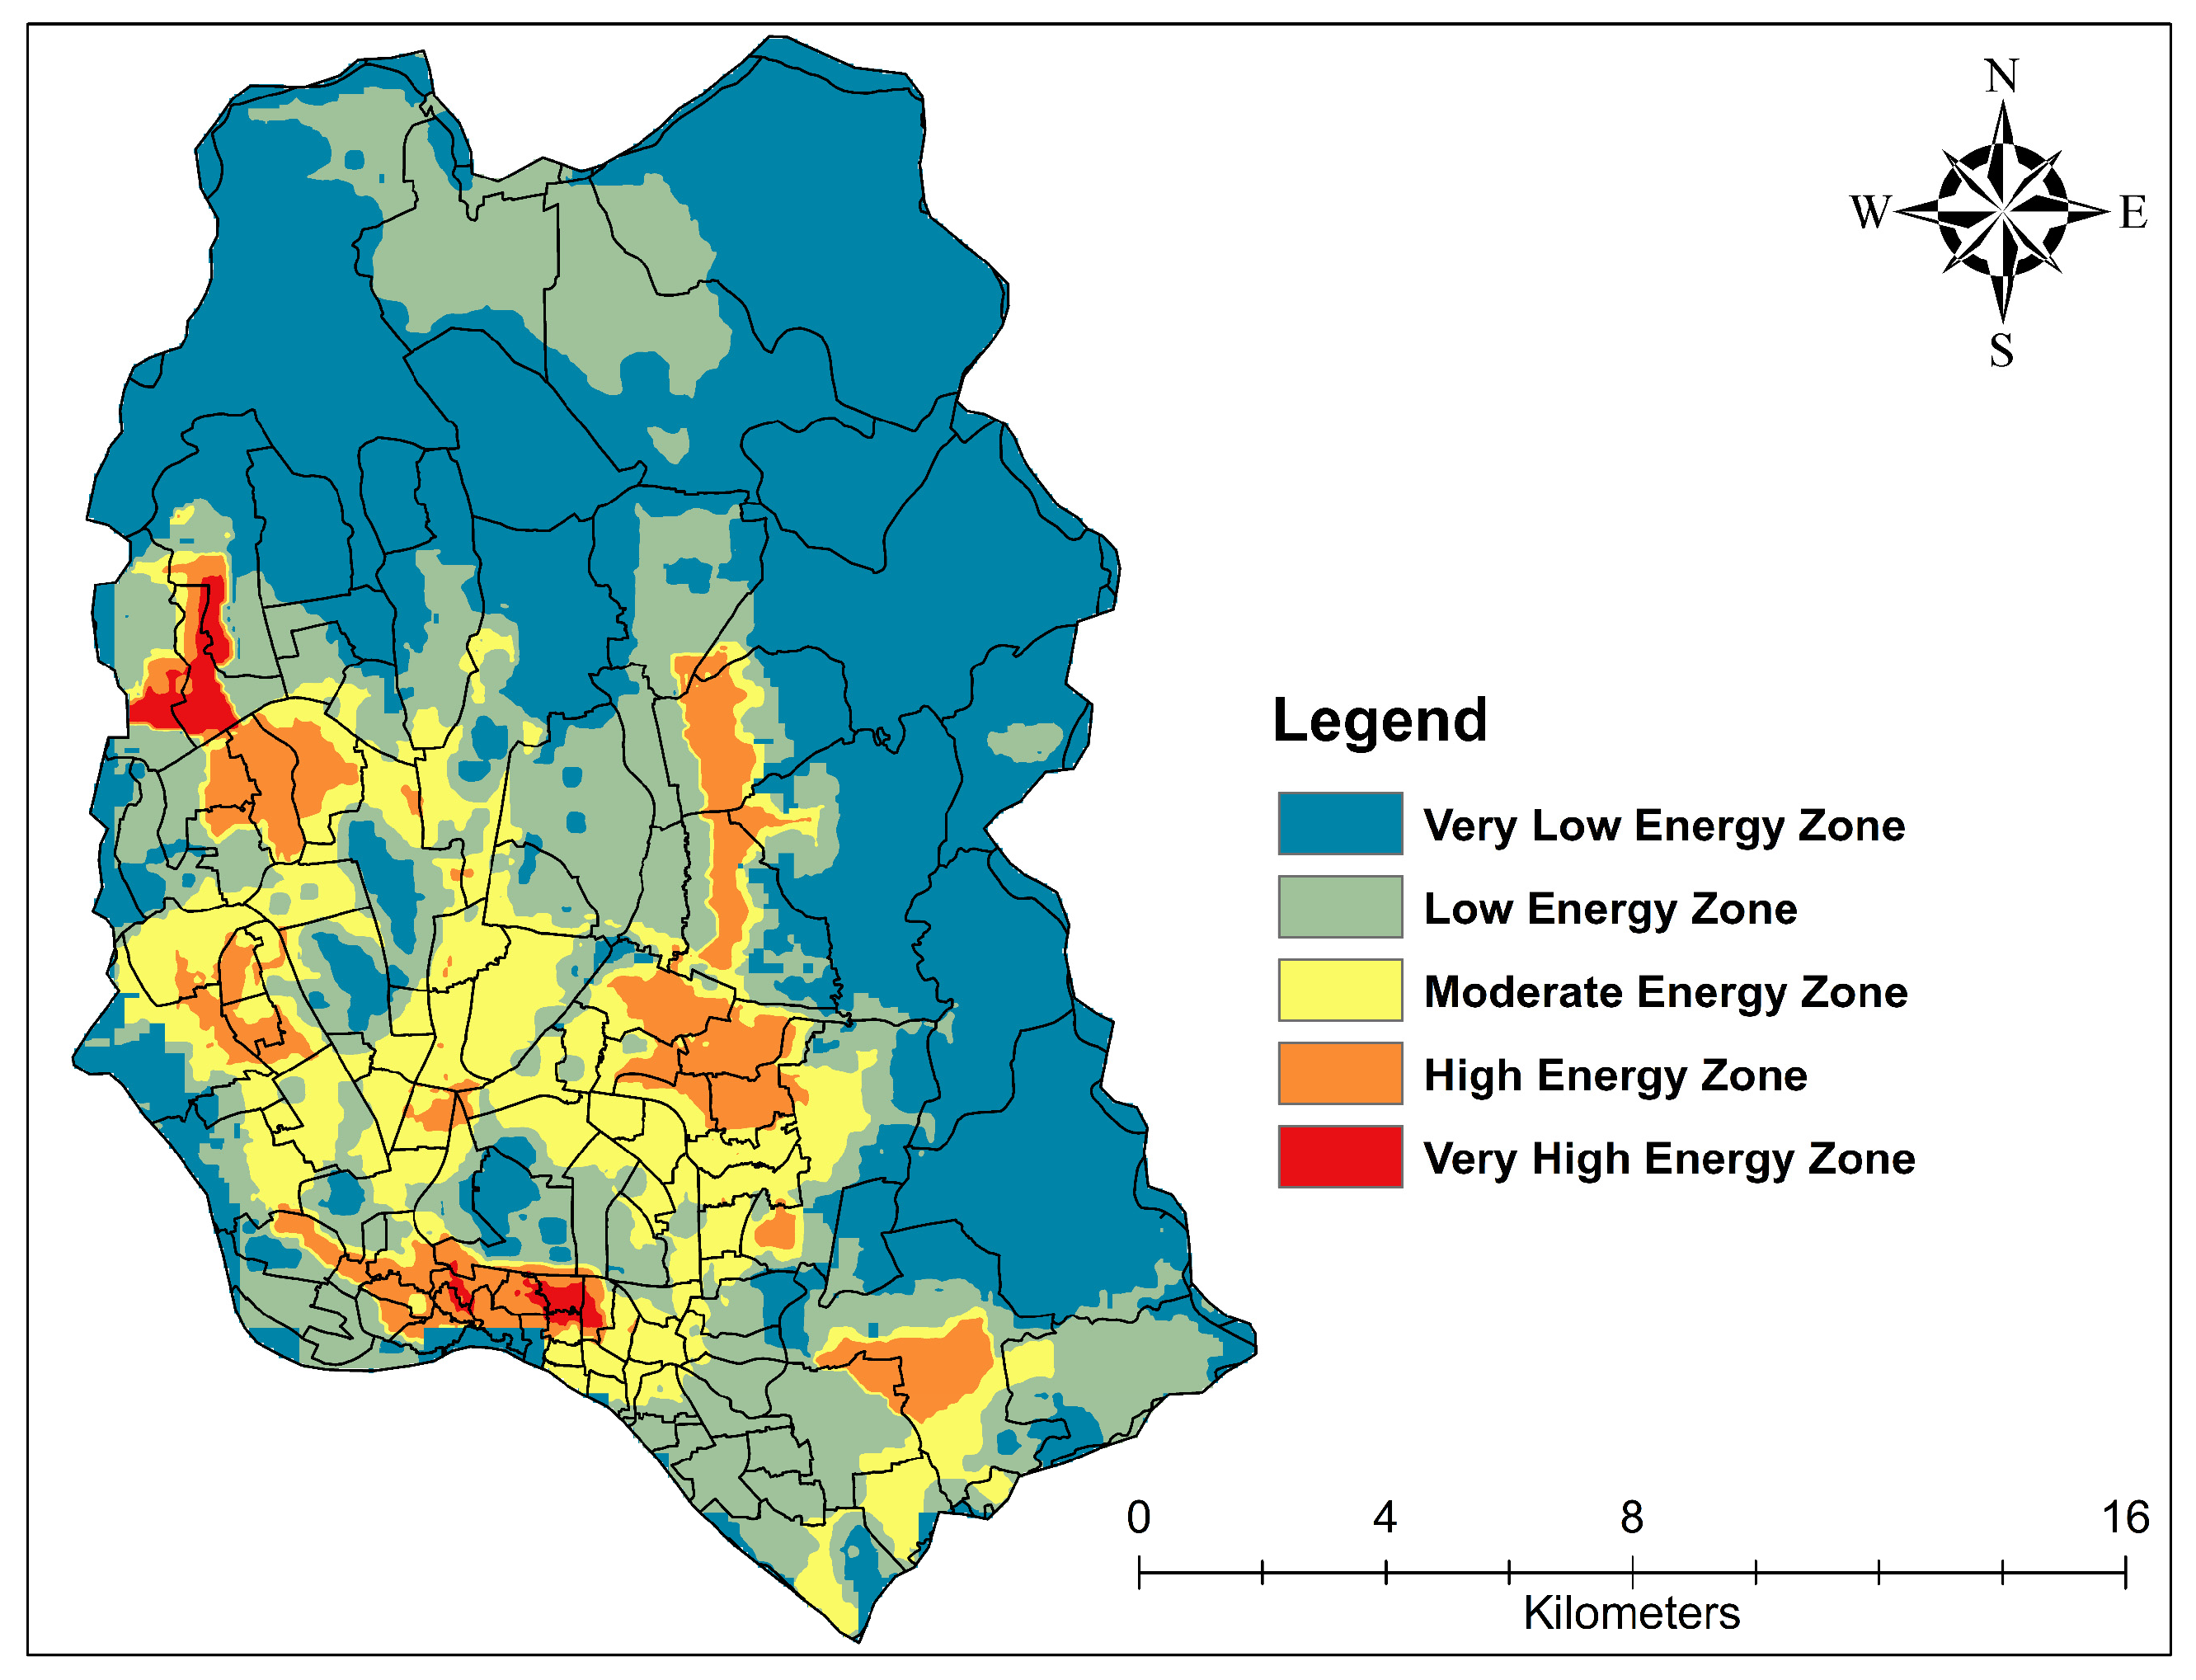
The spatial distribution of the UEI provides important insights into the heterogeneity of energy-related patterns across Dhaka. Based on the classified UEI map, the study area was divided into five distinct energy intensity zones using the natural breaks (Jenks) method. This classification enables a clearer understanding of how different urban and environmental conditions influence relative energy intensity. The resulting zonal distribution highlights the dominance of lower energy intensity classes, alongside the presence of localized high-intensity clusters. The spatial classification of the UEI reveals a clear variation in energy intensity patterns across Dhaka. The very low energy zone occupies the largest share, covering 147.71 km
2, which accounts for approximately 49.37% shown in
Figure 3.
This indicates that nearly half of the region is characterized by relatively low proxy-based energy intensity, likely associated with less dense built-up areas or higher vegetation presence. The low energy zone covers 27.65%, followed by the moderate energy zone, which extends over 15.23%. Together, these three categories dominate the spatial landscape, representing over 92% of the total area. In contrast, the high energy zone and very high energy zone occupy comparatively smaller extents of 6.98% and 0.77%, respectively shown in
Table 3. These zones likely correspond to highly urbanized, dense built-up regions with elevated thermal and anthropogenic activity.
The spatial distribution of the major input indicators reveals considerable heterogeneity across Dhaka. Areas characterized by high NDBI values and elevated nighttime light intensity are primarily concentrated within the central and western urban core, whereas higher NDVI values are observed in peripheral and less-developed regions. Similarly, elevated LST values occur predominantly in densely built-up zones, reflecting increased surface heat accumulation. These patterns provide preliminary evidence that urban morphology and anthropogenic activity influence the spatial distribution of the Urban Energy Intensity Index.
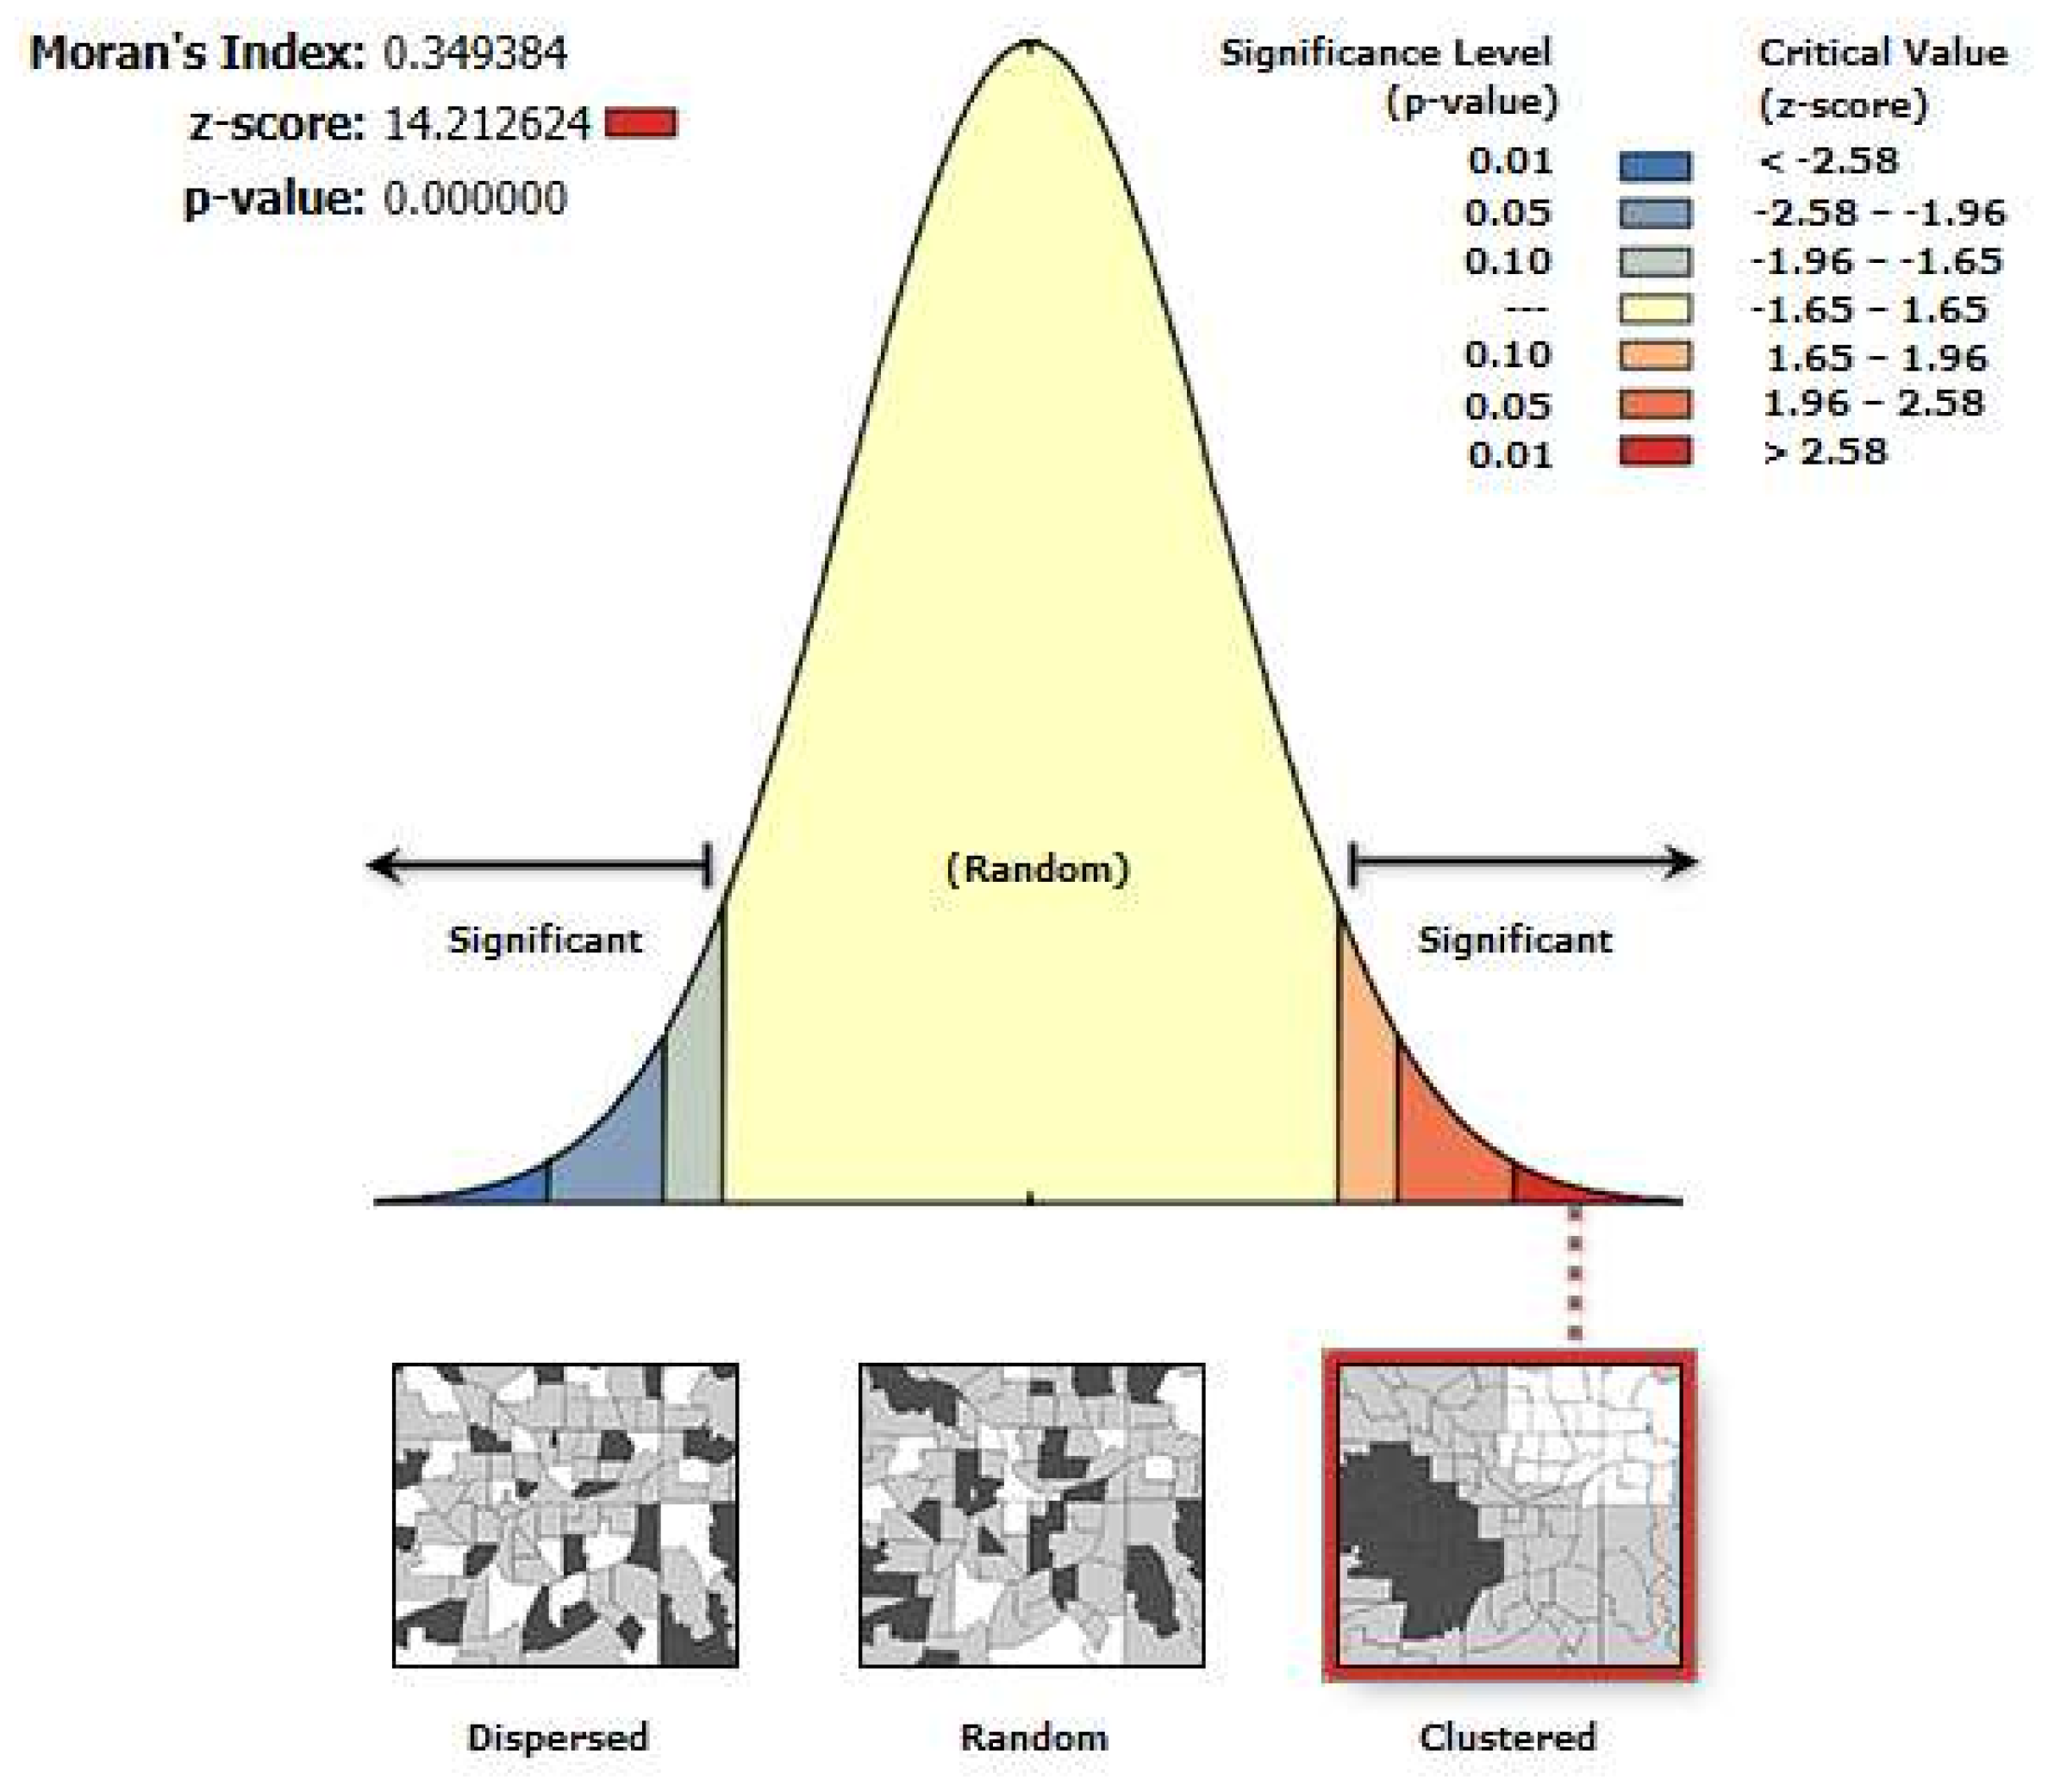
To evaluate the robustness of the AHP-derived weighting scheme, a simple sensitivity analysis was conducted by increasing and decreasing the highest-weighted criterion (LST) by 10% while proportionally adjusting the remaining criteria. The resulting sensitivity analysis demonstrated that the overall spatial distribution of the Urban Energy Index (UEI) remained stable under moderate perturbations of the weighting scheme. Although minor changes in class boundaries were observed, these affected only a limited portion of the study area. Areas classified as high and very high energy intensity, representing the primary priority zones for planning intervention, largely retained their classifications following the weight perturbation, indicating the robustness of the index. Owing to the space limitations of this proceedings paper, the sensitivity analysis was not extended to each criterion individually. Instead, the assessment focused on perturbing the most influential criterion identified through the AHP weighting process, providing a rigorous evaluation of the stability of the proposed weighting framework. To statistically validate the visually observed spatial pattern of the proxy-based Urban Energy Intensity (UEI) zones, a Global Moran’s I spatial autocorrelation analysis was performed on the reclassified UEI raster, using an inverse-distance conceptualization of spatial relationships, Euclidean distance, and a fixed distance threshold of 2270.70 m, without row standardization as shown in
Figure 4. The analysis returned a Moran’s Index of 0.349384 against an expected index of −0.003086 under the null hypothesis of complete spatial randomness, with a variance of 0.000615. The resulting z-score of 14.21 and a
p-value of 0.000000 indicate that the observed clustering is statistically highly significant, with less than a 1% probability that the pattern could have arisen by random chance. Because the Moran’s I value is positive and substantially exceeds the expected index, the spatial distribution of UEI classes across Dhaka exhibits a statistically significant clustered pattern rather than a dispersed or random arrangement. This confirms that areas of similar energy-intensity classification whether high, moderate, or low tend to be located near one another rather than scattered randomly across the study area. The pronounced positive spatial autocorrelation is consistent with the visual interpretation of the UEI map (
Figure 3), which showed high and very high energy-intensity zones concentrated within identifiable urban cores such as Mirpur, Old Dhaka, Tejgaon, and Motijheel, while very low and low energy-intensity zones formed contiguous belts across peripheral and vegetated parts of the city.
The magnitude of the z-score of 14.21, far exceeding the critical value of ±2.58 required for 99% confidence, reinforces that this clustering is unlikely to be an artifact of the classification scheme or sampling variability. These findings statistically substantiate the existence of distinct, spatially coherent energy-intensity hotspots and cold-spots within Dhaka, supporting the suitability of the AHP-MCDA-derived UEI for delineating priority zones for targeted urban energy-efficiency and heat-mitigation interventions.
4. Discussion
The spatial distribution of the UEI reveals a pronounced concentration of high-intensity zones within the densely urbanized core of Dhaka, while lower-intensity zones are predominantly located in peripheral and vegetated areas. Rather than reflecting a single urban characteristic, these patterns emerge from the combined influence of thermal conditions, built-up density, anthropogenic activity, and land-cover composition. The strong spatial coincidence between elevated UEI values, high NDBI, increased nighttime light intensity, and elevated LST suggests that urban morphology and human activity jointly contribute to the formation of energy-intensity hotspots. Conversely, areas characterized by higher vegetation cover and lower impervious surface fractions consistently exhibit lower UEI values, highlighting the moderating influence of urban green spaces on thermal and energy-related conditions. No previously published district-level urban energy intensity map exists for Dhaka. However, the high- and very-high UEI zones identified in this study do spatially coincide with thermal and built-up-intensity hotspots reported in previous Dhaka-focused assessments, providing indirect corroboration of the spatial pattern identified in the present analysis. The results indicate that the spatial variability of urban energy intensity is closely linked to the structure and function of the urban landscape. High-intensity zones are not merely areas of dense population but are associated with concentrations of commercial activities, transportation infrastructure, and mixed land uses. This finding suggests that urban form and functional land-use characteristics may exert a stronger influence on proxy-based energy intensity than population density alone. The concentration of high UEI values within major economic and transportation corridors further demonstrates how anthropogenic activity and built-environment characteristics interact to shape spatial energy-intensity patterns. These findings are consistent with previous studies conducted in Dhaka and other rapidly urbanizing cities, which reported positive relationships between built-up expansion, increasing land surface temperature, and urban energy demand. Earlier studies have shown that NDBI is positively correlated with LST, whereas NDVI exhibits a negative relationship with surface temperature due to the cooling effects of vegetation. The spatial patterns identified in the present study closely align with these observations, as areas characterized by extensive impervious surfaces and limited vegetation consistently correspond to higher UEI values. Furthermore, recent research has highlighted the usefulness of nighttime light intensity as a proxy for anthropogenic activity and electricity consumption, supporting its inclusion within the integrated assessment framework adopted here. The present study extends these previous findings by combining multiple environmental, built-environment, and anthropogenic indicators into a single spatial index, thereby providing a more comprehensive representation of intra-urban energy-intensity patterns. However, the relationship between the selected proxy indicators and actual energy consumption requires careful interpretation. Although LST, nighttime light intensity, NDBI, and impervious surface extent are widely recognized as indicators associated with energy-intensive urban processes, they do not directly measure energy use. Elevated LST may result from urban heat island effects, surface material properties, or meteorological conditions in addition to energy-related activities. Similarly, nighttime lights primarily represent anthropogenic activity and economic intensity rather than direct electricity consumption. Consequently, the UEI developed in this study should be interpreted as a relative indicator of spatial energy-intensity patterns rather than a direct measure of urban energy demand. The absence of building-level or district-scale energy-consumption data prevented validation of the index against observed energy use, representing an important limitation and an avenue for future research. Despite these limitations, the integrated GIS-based AHP-MCDA framework provides a valuable approach for identifying spatial variations in urban energy-intensity proxies in data-scarce environments. The results demonstrate that combining multiple indicators offers a more robust representation of urban energy-related conditions than reliance on any single variable alone. From a planning perspective, the identified hotspots can support targeted interventions such as urban greening, reflective surface implementation, sustainable land-use planning, and energy-efficiency improvements in highly urbanized areas. Such measures may contribute to reducing thermal stress while supporting more sustainable urban development in rapidly growing megacities such as Dhaka. The results suggest that built-environment characteristics exert a stronger influence on UEI variation than population density alone. Areas exhibiting elevated NDBI, nighttime-light intensity, and impervious surface coverage consistently correspond to higher UEI values, indicating that urban morphology and anthropogenic activity play a major role in shaping spatial energy-intensity patterns. High-intensity zones are not simply areas of high population density but, based on their spatial correspondence with established central business and transportation districts, appear to be associated with concentrations of commercial activity, transportation infrastructure, and mixed land uses. It should be emphasized that land-use function (e.g., commercial, industrial, or residential) was not directly quantified in this study. Instead, the eight selected indicators characterize built-form density, surface thermal conditions, and anthropogenic light emissions rather than land-use function per se. Consequently, this association represents an inference derived from the observed spatial patterns rather than a directly measured relationship. These findings tentatively suggest that urban form and functional land-use characteristics may exert a stronger influence on proxy-based urban energy intensity than population density alone. Nevertheless, this hypothesis requires further validation using cadastral records, zoning information, or detailed land-use datasets in future research.
The observed positive association between built-up intensity and proxy-based urban energy intensity is consistent with previous studies highlighting the importance of urban morphology and remotely sensed indicators in urban energy modelling [
2,
16]. Nighttime-light remote sensing has been widely recognized as an effective proxy for anthropogenic activity, economic intensity, and energy-related urban processes [
3,
14]. Furthermore, the spatial patterns observed in Dhaka are consistent with findings from rapidly urbanizing cities where positive relationships between NDBI and LST and negative relationships between NDVI and LST have been reported [
18,
19]. These studies collectively suggest that built-up expansion, vegetation loss, and increasing thermal stress are closely interconnected urban processes. Unlike many previous investigations that relied on individual indicators or pairwise relationships, the present study integrates eight environmental, built-environment, and anthropogenic indicators within a unified GIS-based AHP-MCDA framework to characterize spatial patterns of proxy-based urban energy intensity in a highly data-scarce megacity context.
5. Limitations of the Study
The present study provides an integrated framework for assessing proxy-based urban energy intensity using remote sensing and AHP-MCDA. However, several limitations should be considered when interpreting the results. The analysis relies on proxy indicators such as LST, NDVI, NDBI, and nighttime light intensity. These variables represent indirect measures rather than actual energy consumption. Consequently, the resulting index reflects relative spatial patterns rather than precise quantitative energy use. The study also depends on satellite-derived datasets, including Landsat 9 and VIIRS. These data are affected by atmospheric interference, sensor calibration uncertainty, and temporal acquisition constraints, which may introduce minor inaccuracies in the derived indicators. To ensure consistency, all datasets were resampled to a common spatial resolution of 10 m. While this improves comparability, it may introduce interpolation-related uncertainty, particularly for datasets originally available at coarser resolutions. Furthermore, the selected indicators may exhibit varying degrees of interdependence. For example, NDBI, impervious surface fraction, and LST are often spatially correlated in highly urbanized environments. Although each indicator captures a distinct aspect of urban structure or function, potential multicollinearity among variables may increase the influence of related urban characteristics within the composite index. Future studies could apply multicollinearity diagnostics, such as variance inflation factor (VIF) analysis or principal component analysis, to further assess indicator independence. The weighting scheme derived from the AHP provides a structured approach to evaluating criteria. However, it relies on expert judgment, and some degree of subjectivity cannot be fully avoided despite an acceptable consistency ratio. Although the consistency ratio indicated acceptable internal consistency of the pairwise comparisons, uncertainty associated with expert-derived weighting cannot be entirely eliminated. Alternative expert judgments or weighting schemes may produce slightly different spatial distributions of the UEI. While a sensitivity analysis was conducted for the highest-weighted criterion (LST), future studies could extend this to a systematic multi-criterion or Monte Carlo-based sensitivity analysis, along with propagated uncertainty quantification from input-data error, to further evaluate the robustness of the index. The analysis is based on a single temporal snapshot and does not account for seasonal or multi-temporal variation. In addition, the final spatial patterns are influenced by the selected classification method used to categorize the continuous UEI surface. Different classification approaches may yield modest variations in class boundaries and hotspot delineation. As a result, it captures spatial patterns at a specific point in time but does not reflect dynamic changes in urban energy intensity. An important limitation of this study is the lack of validation of the UEI using actual energy consumption data. Due to the unavailability of building-level, utility, and district-scale energy datasets for Dhaka, the generated index could not be compared with observed energy use patterns. Therefore, the UEI should be interpreted as a relative proxy-based indicator rather than a direct measure of urban energy consumption. Future studies should validate the index using electricity consumption records, utility data, or existing urban energy maps. The index represents relative spatial variation in energy-intensity proxies rather than absolute energy consumption. Validation against utility billing records, smart meter data, or national energy statistics was not performed due to data unavailability and is recommended for future studies. Overall, these limitations do not undermine the validity of the framework or the spatial insights obtained. However, they indicate areas for further refinement in future research.
6. Conclusions
This study provides a spatially explicit assessment of proxy-based urban energy intensity in Dhaka using an integrated GIS-based AHP-MCDA framework, demonstrating how urban form, environmental conditions, and anthropogenic activities collectively shape proxy-based urban energy-intensity patterns. The findings reveal a highly uneven spatial structure, where lower energy intensity zones dominate in areal extent 92%, while high and very high energy zones remain spatially concentrated yet critically significant. High UEI values were identified in Mirpur, Old Dhaka, Tejgaon, and Motijheel, spatially coinciding with elevated thermal stress; while these areas are also expected to be associated with concentrated anthropogenic activity, this relationship was inferred from proxy indicators, particularly nighttime-light intensity, rather than directly measured. The observed patterns may also be associated with dense built-up conditions and concentrated urban development; however, these relationships should be interpreted as spatial associations rather than confirmed drivers. From a policy perspective, this uneven distribution highlights the need for spatially targeted energy management strategies rather than uniform city-wide interventions. High and very high energy-intensity zones characterized by elevated built-up density, thermal stress, and anthropogenic activity as reflected by the UEI represent priority areas for potential energy-efficiency retrofitting, including the implementation of green building standards, enhanced building insulation, and energy-efficient cooling systems. These recommendations are derived from the spatial distribution of the UEI and are supported by established evidence in the urban heat and energy-efficiency literature, rather than by site-specific cost–benefit, energy-savings, or economic-feasibility analyses conducted within the present study. Accordingly, comprehensive feasibility assessments, incorporating projected energy savings, implementation costs, and economic viability, are recommended before prioritizing specific interventions for investment. Additionally, these areas would benefit from integrated urban heat-mitigation strategies, such as rooftop greening, reflective materials, and the expansion of urban tree cover to reduce land surface temperature, which is expected to correspondingly moderate cooling-related energy demand. Moderate energy zones, which represent transitional urban environments, offer a critical opportunity for preventive planning interventions. Strategic zoning regulations, controlled densification, and the incorporation of green infrastructure at this stage can prevent these areas from evolving into future high-intensity hotspots. In contrast, very low and low energy zones, often located in peri-urban or less developed areas, should be preserved through sustainable land-use planning, ensuring that ongoing urban expansion does not lead to uncontrolled increases in energy demand. Furthermore, the study underscores the importance of integrating remote sensing-based proxy indicators into urban policy frameworks, particularly in data-scarce contexts where direct energy consumption data are unavailable. Such approaches enable cost-effective, scalable monitoring of urban energy dynamics and can support evidence-based decision-making for resource allocation, infrastructure development, and climate adaptation planning. In conclusion, the research demonstrates that urban energy intensity in Dhaka is not merely a function of population density but is strongly influenced by urban morphology and spatial planning patterns. The spatial patterns identified by the UEI are also consistent with areas of high built-up density and anthropogenic activity intensity, which are often co-located with commercial and mixed-use development in rapidly urbanizing South Asian cities, though land-use type was not directly assessed in this study. The proposed UEI framework can support evidence-informed identification of areas that may warrant further investigation for energy efficiency and heat-mitigation interventions. Future studies should evaluate the technical, economic, and environmental effectiveness of such interventions using site-specific energy-consumption, land-use, and implementation data. It should be emphasized that the UEI represents a proxy-based spatial index and should not be interpreted as a direct measure of actual energy consumption.