


Abstract
Urban pluvial flooding poses increasing challenges due to climate change and rapid urbanization. The limited availability of information on subsurface drainage infrastructure and of validation data frequently constrain large-scale flood modelling. This study applies a pragmatic modelling framework, using a two-dimensional hydrodynamic model (HEC-RAS 6.7) within the Rain-on-Grid approach to simulate rainfall-induced flooding in Naples, Italy. The adopted method simplifies subsurface drainage processes while enabling a scalable application across large urban areas. The results identify flood-prone areas within the city and provide insights into pluvial flood modelling in data-scarce urban contexts. Preliminary validation is performed using flood photographs and videos collected from social media.
1. Introduction
- Urban flooding has emerged as one of the most critical natural hazards because of climate change and rapid urbanization. Considerable progress has been made in recent decades to enhance the accuracy and efficiency of urban flood modelling through advances in methodology and numerical techniques. Nevertheless, several limitations affect modelling reliability, such as the representation of topographic and geometric urban key features (buildings, bridges, culverts, and underpasses), the scarcity of calibration and validation data, and the treatment of drainage infrastructure within models [1]. Pluvial flooding often develops rapidly, leaving little opportunity to collect direct measurements of flood extents and depths for validation purposes. In this regard, the widespread availability of smartphones, digital photos, and social media offers an alternative source of information to support model verification where field observations are lacking [1].
- Accurate modelling of urban pluvial flooding requires the representation of both surface flow propagation and the interaction with surface and underground drainage systems. Neglecting the drainage infrastructure can lead to an overestimation of the flooded areas [2]. A common approach is the coupled use of one-dimensional (1D) models to simulate flows in drainage networks and two-dimensional (2D) models to simulate surface flooding [3,4]. This approach requires local-scale, detailed information on underground drainage systems, which is often unavailable [5]. For large-scale applications or in cases where drainage data are absent, surrogate representations of urban drainage systems within 2D hydrodynamic models can be used [1,2,5,6].
- The present study adopts a pragmatic modelling framework for large urban contexts lacking detailed drainage data. The case study focuses on Naples, Italy, to identify flood-prone areas and advance understanding of pluvial flood modelling at large scales. Previous investigations of flooding in Naples have primarily concentrated on localized areas, whereas this study extends the analysis to the broader urban context. A 2D hydrodynamic model (HEC-RAS 6.7) is applied using the Rain-on-Grid approach to simulate surface run-off generated by rainfall events. The presence of the sewer system is accounted for with a surrogate representation due to the lack of available information for the entire city.
2. Materials and Methods
2.1. Case Study and Data
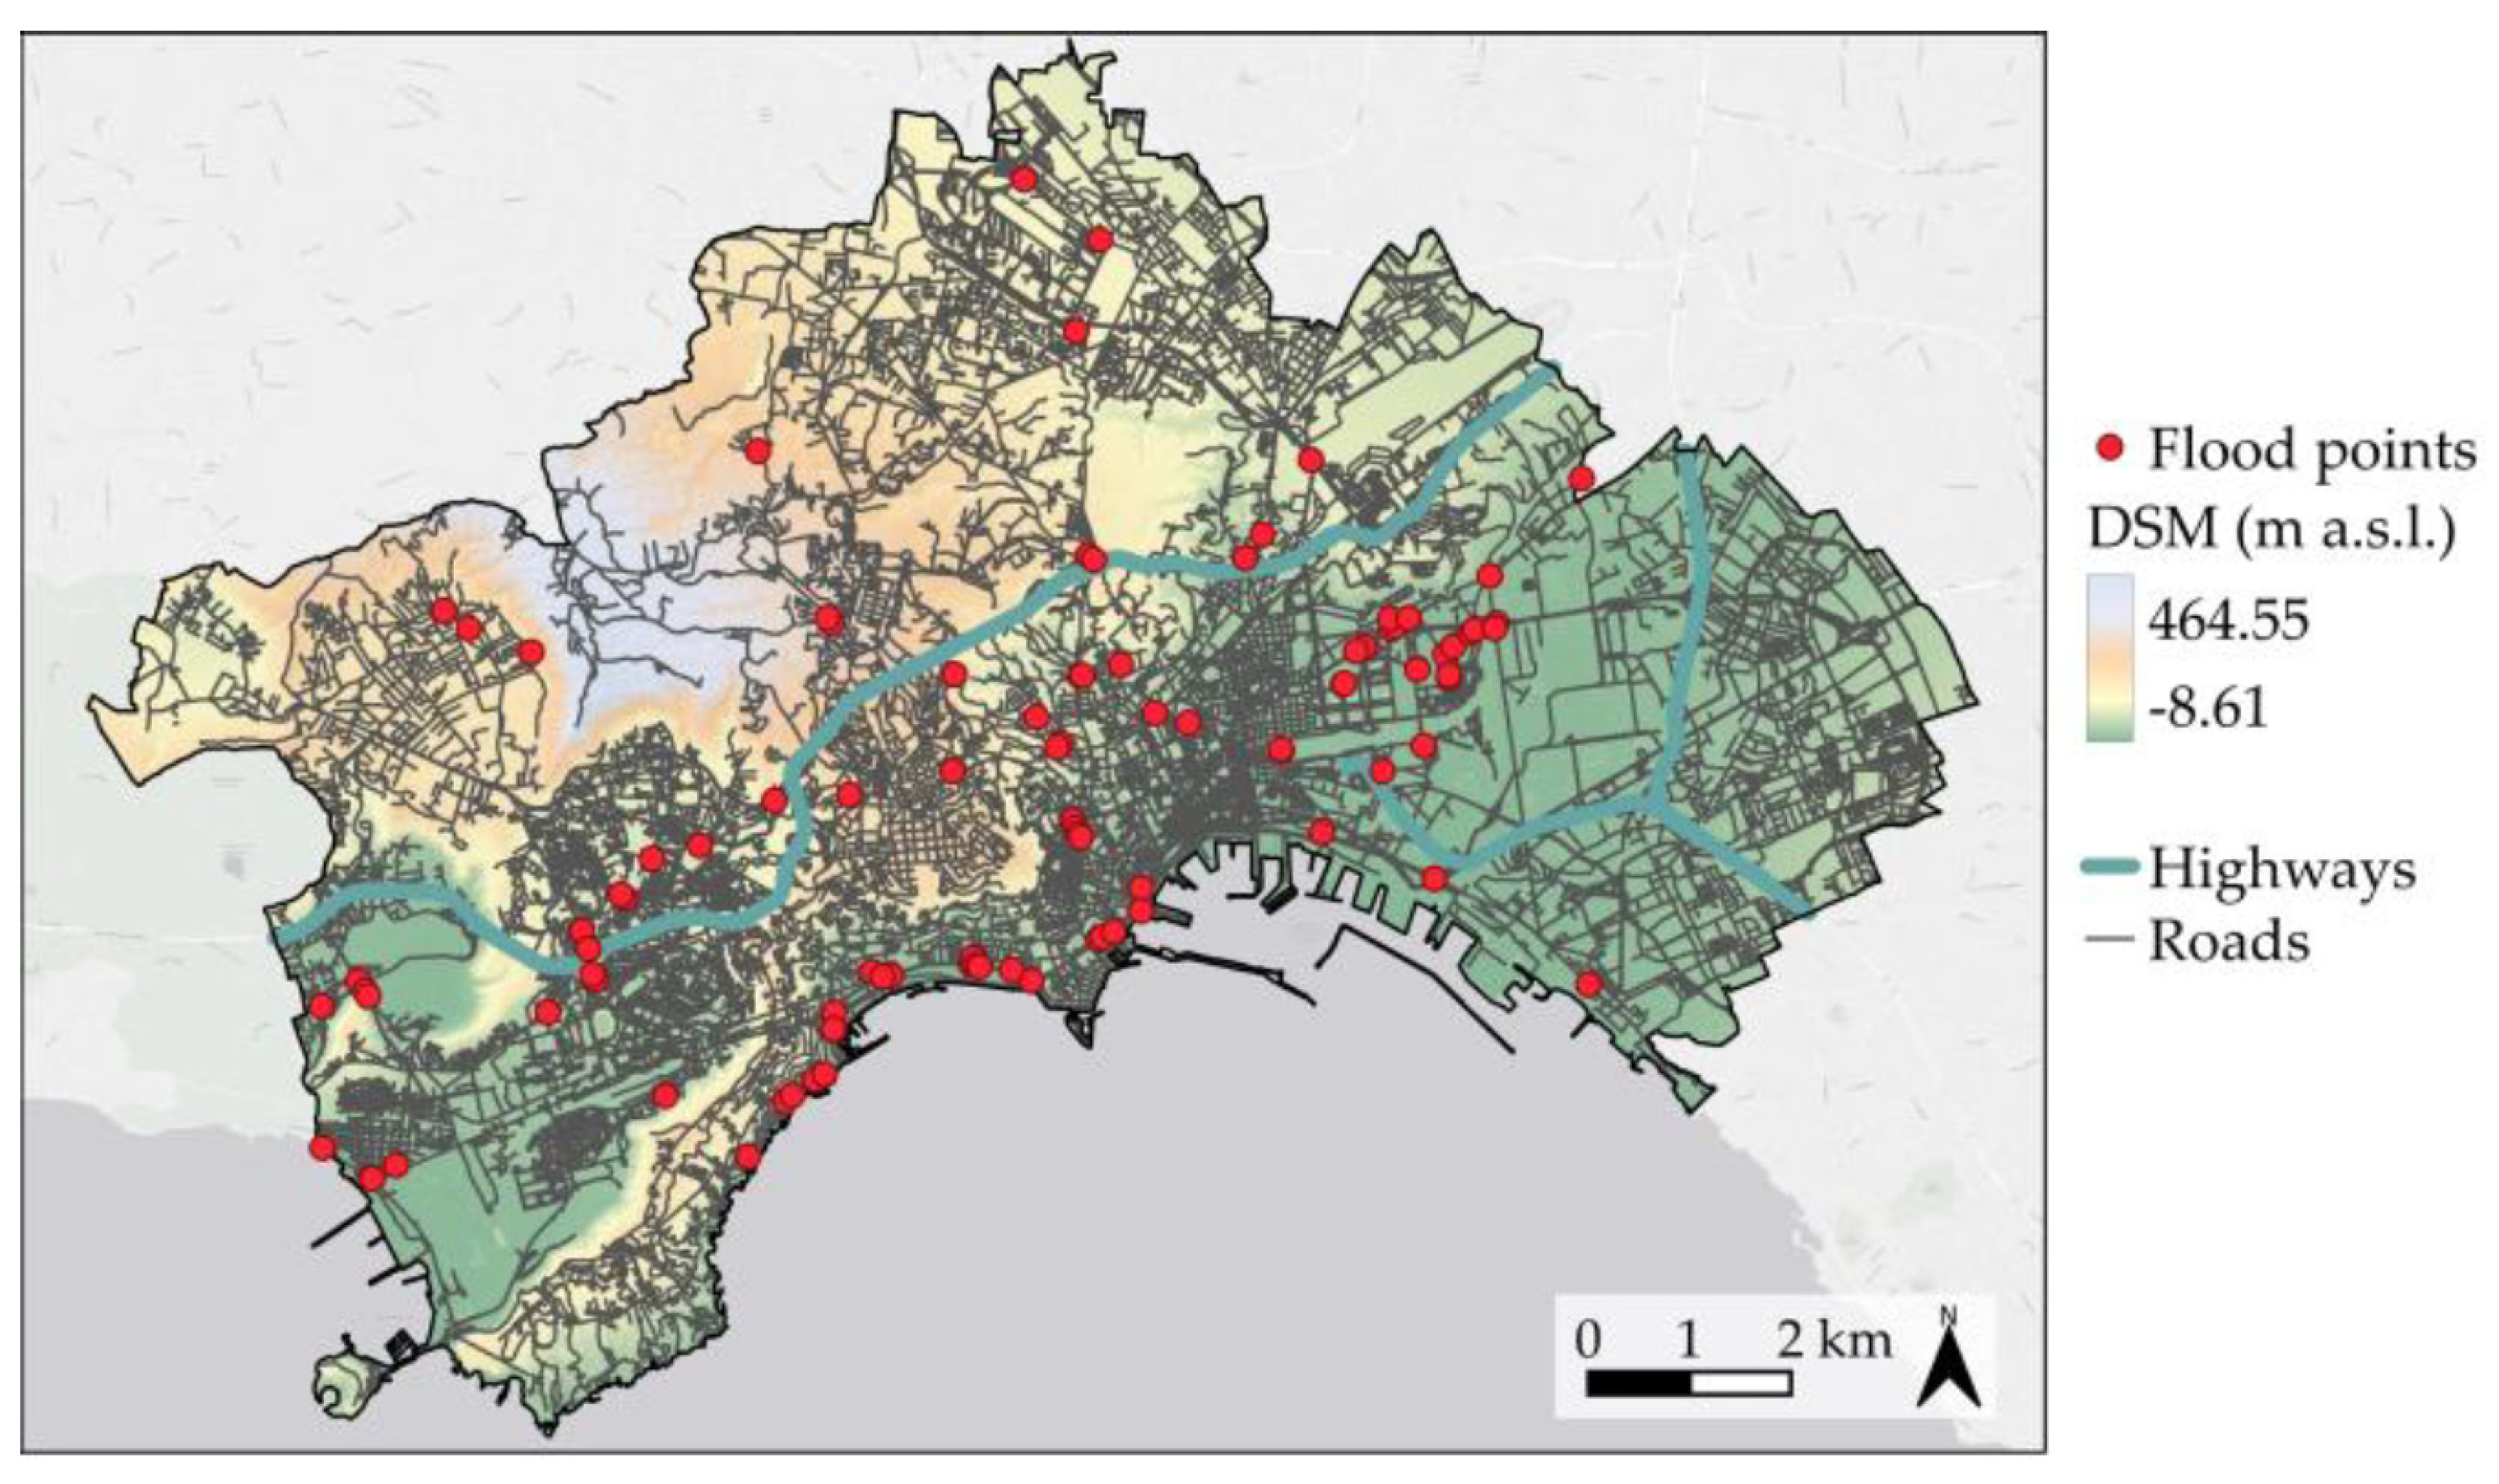
The city of Naples (Figure 1) covers an area of approximately 119 km2 and hosts 906,189 inhabitants, according to the provisional census updated in May 2025 by the Italian National Statistical Institute (ISTAT). It represents one of the most densely populated metropolitan areas in Europe. In the present study, high-resolution topographic data were employed, including a Digital Terrain Model (DTM, representing bare ground) and a Digital Surface Model (DSM, including buildings and vegetation), both with a spatial resolution of 1 m, obtained from the geoportal of the Metropolitan City of Naples. The DSM was corrected to remove artificial barriers and structures that could obstruct surface flow, as well as vegetation features (Figure 1). Land use and land cover information were derived from the Copernicus Land Monitoring Service Urban Atlas 2018 database. To derive the precipitation input for the simulations, Intensity–Duration–Frequency (IDF) curves were constructed for six rain gauge stations located both within and outside the municipal boundaries of Naples. These curves were developed based on the available historical rainfall records at each station. An Inverse Distance Weighting (IDW) interpolation was then applied to obtain an IDF curve representative of the centroid of the city of Naples.
Figure 1.
Map of the city of Naples with the corrected Digital Surface Model (DSM).
Photographs and videos of past flood events from 2007 to 2024 were collected from social media platforms and news websites to visually determine pluvial flood locations. Only multimedia data uploaded to the Internet at most three days after a rainstorm event recorded at the Camaldoli and Capodimonte rain gauges were retained. The validated flood locations (112 points) were subsequently georeferenced in a GIS (Figure 1). The identified flood locations are subject to a certain bias because the likelihood that an individual shares flooded areas on social media may depend on contextual factors such as population density, connectivity, and attractiveness of a given area. Consequently, the absence of re-ported flood points in certain areas does not necessarily imply that these areas are never affected by flooding.
2.2. Model Setup
In this study, a design storm event (alternating block method) with a duration of 6 h and a return period T of 10 years, with a total rainfall depth equal to 83.15 mm, was extracted from the IDF curve and used in the subsequent computations. Flood dynamics were simulated using the 2D hydrodynamic model HEC-RAS 6.7. The computational domain was discretized with a mesh of 10 m x 10 m cells, and the governing equations were those of the diffusive wave approximation for unsteady flow. The model focused exclusively on surface runoff processes and was not explicitly coupled with the urban drainage network. Rainfall–runoff transformation was modelled using the Soil Conservation Service (SCS) Curve Number (CN) method [7]. The numerical simulations incorporated spatially distributed values of Manning’s roughness coefficients and CNs.
In the CN method, the initial abstraction () is usually calculated as a fixed fraction of the storage S (e.g., = 0.1 S), where S is directly related to the CN value [7]. In the present study, a modified approach was adopted, considering that, in common Italian engineering practice, sewer systems are often designed to capture and convey all the rectangular hyetographs extracted from the IDF curve for a given return period T. To represent this condition, was decoupled from S, and for impermeable surfaces (streets and roofs) was assumed equal to the rainfall depth associated with T = 2 years for the considered storm duration. Consequently, of impermeable surfaces is not a fixed parameter, but rather a variable quantity dependent on both the event duration and the shape of the IDF curve.
3. Results
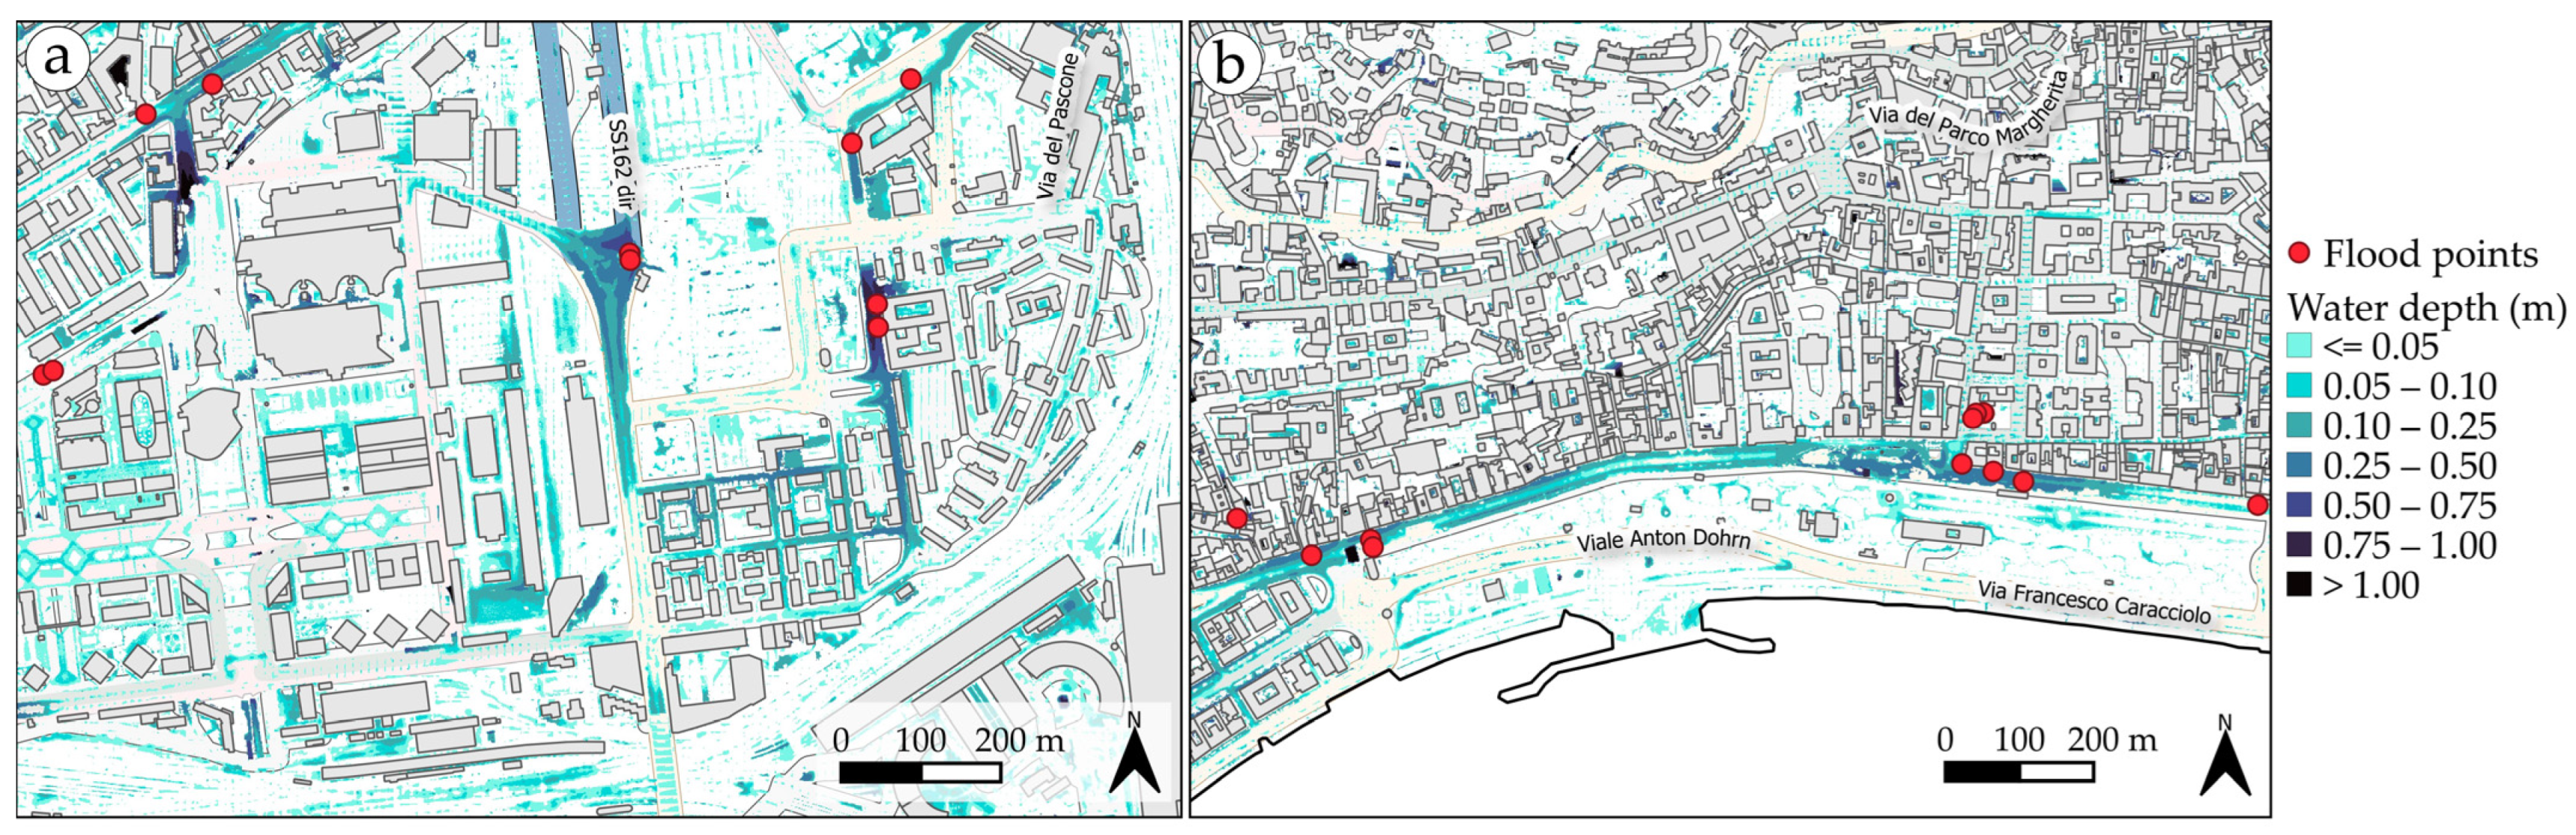
Figure 2 illustrates the simulated maximum water depths generated by the design rainfall event in two representative areas of Naples. The first one is located along the tourist seafront of Via Caracciolo and Riviera di Chiaia (Figure 2b). The second area (Figure 2a), located near the central railway station, constitutes a major business district of strategic importance owing to its highway connections with neighbouring cities. Most of the identified flood points correspond to areas that are known to be frequently inundated, and these locations are also associated with the highest simulated water depths. Despite the relatively coarse mesh employed in the simulations, the model was able to reproduce the flow pathways along major streets, alleys, and built-up areas, capturing the hydrodynamics of stormwater propagation in densely urbanized contexts.
Figure 2.
Maximum simulated water depths in two representative areas of Naples: (a) a major business hub, and (b) a renowned tourist area.
4. Conclusions
The selection of an appropriate urban flood modelling strategy requires careful consideration of trade-offs between accuracy, computational efficiency, data availability, and the intended application. This study has presented a preliminary application of a two-dimensional hydrodynamic model to simulate pluvial flooding in the city of Naples. The results demonstrate that, despite the adoption of a relatively coarse mesh and a simplified representation of drainage processes, the model was able to reproduce the main inundation patterns. Validation using flood locations reported on social media represented a crucial step to corroborate the model’s performance.
Author Contributions
Conceptualization, G.V. and L.C.; methodology, G.V. and L.C.; software, G.V., N.N. and M.B.; validation, G.V. and N.N.; formal analysis, G.V. and L.C.; investigation, G.V., N.N. and M.B.; data curation, G.V., N.N., M.B. and L.C.; writing—original draft preparation, G.V. and L.C.; writing—review and editing, G.V., L.C. and R.D.M.; visualization, G.V.; supervision, L.C. and R.D.M.; project administration, L.C.; funding acquisition, L.C. and R.D.M. All authors have read and agreed to the published version of the manuscript.
Funding
This research was funded by the project “Pluvial Adaptation and Resilience scenarios for urban Areas through improved Data of Intense rainfall, Good practices, and water Management” PARADIGM, grant number CUP-E63C22002000002.
Data Availability Statement
Data will be made available upon request.
Conflicts of Interest
The authors declare no conflicts of interest.
References
- Wang, Y.; Chen, A.S.; Fu, G.; Djordjević, S.; Zhang, C.; Savić, D.A. An integrated framework for high-resolution urban flood modeling considering multiple information sources and urban features. Environ. Model. Softw. 2018, 107, 85–95. [Google Scholar] [CrossRef] [Scilit]
- Cea, L.; Sañudo, E.; Montalvo, C.; Farfán, J.; Puertas, J.; Tamagnone, P. Recent advances and future challenges in urban pluvial flood modelling. Urban Water J. 2025, 22, 149–173. [Google Scholar] [CrossRef] [Scilit]
- Chang, T.-J.; Wang, C.-H.; Chen, A.S. A novel approach to model dynamic flow interactions between storm sewer system and overland surface for different land covers in urban areas. J. Hydrol. 2015, 524, 662–679. [Google Scholar] [CrossRef] [Scilit]
- Fernández-Pato, J.; García-Navarro, P. An efficient implementation of a coupled overland-sewer hydraulic model with pollutant transport. Hydrology 2021, 8, 146. [Google Scholar] [CrossRef] [Scilit]
- Cao, R.; Li, F.; Feng, P. Exploring the hydrologic response to the urban building coverage ratio by model simulation. Theor. Appl. Climatol. 2020, 140, 1005–1015. [Google Scholar] [CrossRef] [Scilit]
- Padulano, R.; Rianna, G.; Costabile, P.; Costanzo, C.; Del Giudice, G.; Mercogliano, P. Propagation of variability in climate projections within urban flood modelling: A multi-purpose impact analysis. J. Hydrol. 2021, 602, 126756. [Google Scholar] [CrossRef] [Scilit]
- Soil Conservation Service (SCS). Section 4—Hydrology (NEH-4). In National Engineering Handbook; U.S. Department of Agriculture: Washington, DC, USA, 1985. [Google Scholar]
Disclaimer/Publisher’s Note: The statements, opinions and data contained in all publications are solely those of the individual author(s) and contributor(s) and not of MDPI and/or the editor(s). MDPI and/or the editor(s) disclaim responsibility for any injury to people or property resulting from any ideas, methods, instructions or products referred to in the content. |
© 2026 by the authors. Licensee MDPI, Basel, Switzerland. This article is an open access article distributed under the terms and conditions of the Creative Commons Attribution (CC BY) license.