


Abstract
Rotating machinery is essential in industrial applications, where early fault detection is critical to prevent catastrophic failures. Shafts are mainly vulnerable to imbalances and cracks; these last ones pose a severe risk as they can lead to sudden failure if not identified during their early stages. Cracks induce progressive stiffness reduction, altering the system’s mechanical properties and affecting the forces transmitted to the supports. This study analyses the effects of cracks on a rotating shaft using experimental data. Vibration signals from accelerometers mounted on the supports are processed to identify changes in the shaft’s response. The methodology focuses on distinguishing crack-induced alterations for different imbalance scenarios by analysing key signal features. A statistical detection algorithm and the extracted feature analysis are exploited for crack identification before a critical failure occurs. The results highlight the distinct impact of cracks on the shaft’s dynamic behaviour and demonstrate effective strategies for early detection. While different features highlight the presence of the crack differently, all successfully contribute to detecting the damage. This study provides an analysis of a novel experimental case study for crack detection, enhancing both safety and economic sustainability of rotating machinery.
1. Introduction
Rotating shafts are widely employed in many engineering applications, as they are responsible for transmitting torque and rotational motion in mechanical systems. A sudden failure of such components can lead to catastrophic consequences, posing serious safety issues in systems involving humans while operating, such as aircraft and helicopters. One of the primary causes of shaft failure is the presence of cracks, which can result in torsional buckling or fatigue-induced breakage. Detecting cracks in rotating shafts, however, presents a major challenge: their continuous motion prevents the direct installation of sensors on the monitored component. Although non-contact sensors offer a potential solution, their implementation in complex or mobile structures is often limited or unfeasible [1].
A more practical and widely used approach relies on accelerometers mounted on the structure, providing indirect measurements of shaft behaviour. These sensors capture the global vibration response of the entire structure rather than the shaft alone, which makes it more complex to identify the effects induced by the presence of cracks or other kinds of damage. In this particular case, the presence of a crack alters the shaft’s stiffness and increases its structural damping. Traditional diagnostic techniques are typically based on frequency analysis, focusing on shifts in natural frequencies or changes in specific spectral components [2]. When such methods are insufficient, feature extraction from the frequency domain and time series can support more detailed fault diagnosis [3,4].
Advancements in computational power and data analysis have recently led to the adoption of Machine Learning (ML) techniques for condition monitoring [5,6]. Among these, Deep Learning approaches, such as Convolutional Neural Networks (CNNs), have been successfully applied for supervised fault classification and regression tasks [7,8]. These data-driven methods require labeled datasets for training, allowing the development of comprehensive diagnostic frameworks. When labeled data from damaged conditions are not available, alternative unsupervised or semi-supervised models, such as Long Short-Term Memory (LSTM) networks, Nonlinear AutoRegressive models with eXogenous inputs (NARX), and Autoencoders, can be employed for anomaly detection [9,10]. These models are trained on data from healthy conditions and use reconstruction errors as indicators of potential damage. Despite their effectiveness, such approaches may require extensive datasets, which are often not available for many real-world machines.
To overcome these limitations, researchers have developed analytical and numerical models to simulate the mechanical behavior of both healthy and cracked shafts [11]. While these models can accurately represent damage-induced changes, their applicability to complex or large-scale systems is limited by nonlinear interactions and uncertainties in boundary conditions. Consequently, experimental data remain essential for developing and validating reliable diagnostic algorithms. Experimental testing, however, involves significant costs and complexity, as it requires dedicated test rigs and datasets encompassing both undamaged and damaged states [12,13].
This work investigates the effects of cracks in rotating shafts through an experimental campaign conducted on a custom-designed test rig. Furthermore, a statistical diagnostic algorithm for crack detection is developed and evaluated for its applicability across a population of similar shafts.
2. Materials and Methods
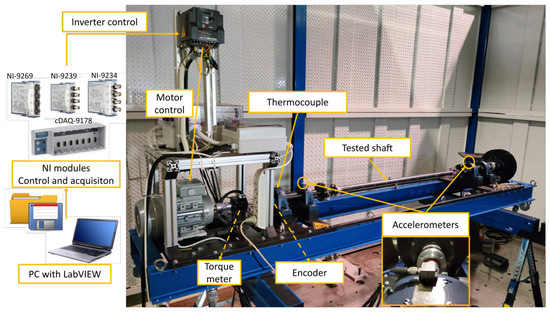
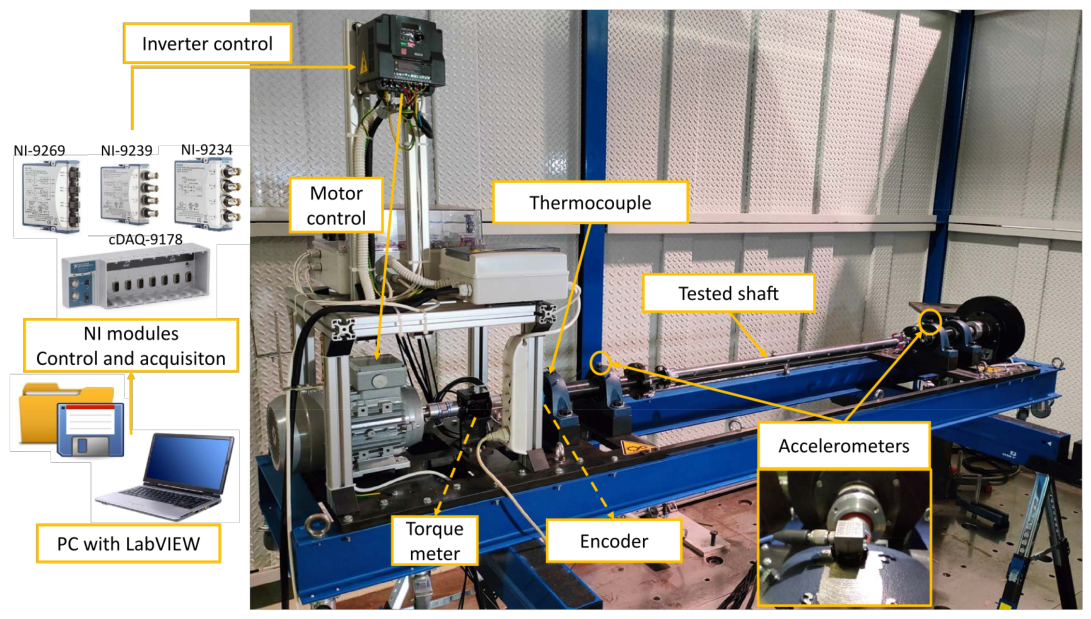
The objective of this work is to investigate the effects and detectability of cracks in a rotating shaft. To achieve this, the shaft is experimentally studied while mounted on a dedicated test rig that maintaines continuous rotation. The experimental setup is illustrated in Figure 1.
Figure 1.
Experimental setup.
The tested shaft, shown in Figure 2, is made of C40 steel, with a total length of 1024 mm and a diameter of 35 mm. It includes 19 threaded M8 holes equally spaced along its longitudinal axis, designed to host imbalance masses. The test rig is remotely operated through a custom dedicated software developed in LabVIEW, enabling both speed control and synchronous data acquisition from multiple sensors. The sensing system consists of four vertically oriented monoaxial accelerometers (PCB Piezotronics 333B30) mounted on the bearing housings, an optical encoder (SICK DGS80) for rotational speed monitoring, and a thermocouple (Tersid FT905) positioned near the motor to measure the external temperature of the nearest bearing. All tests are conducted at a constant rotational speed of 2500 rpm, with the system operating within a temperature range of to .
Figure 2.
Tested shaft.
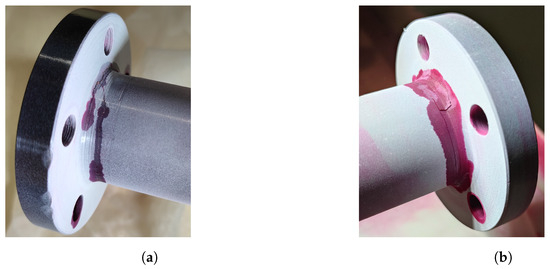
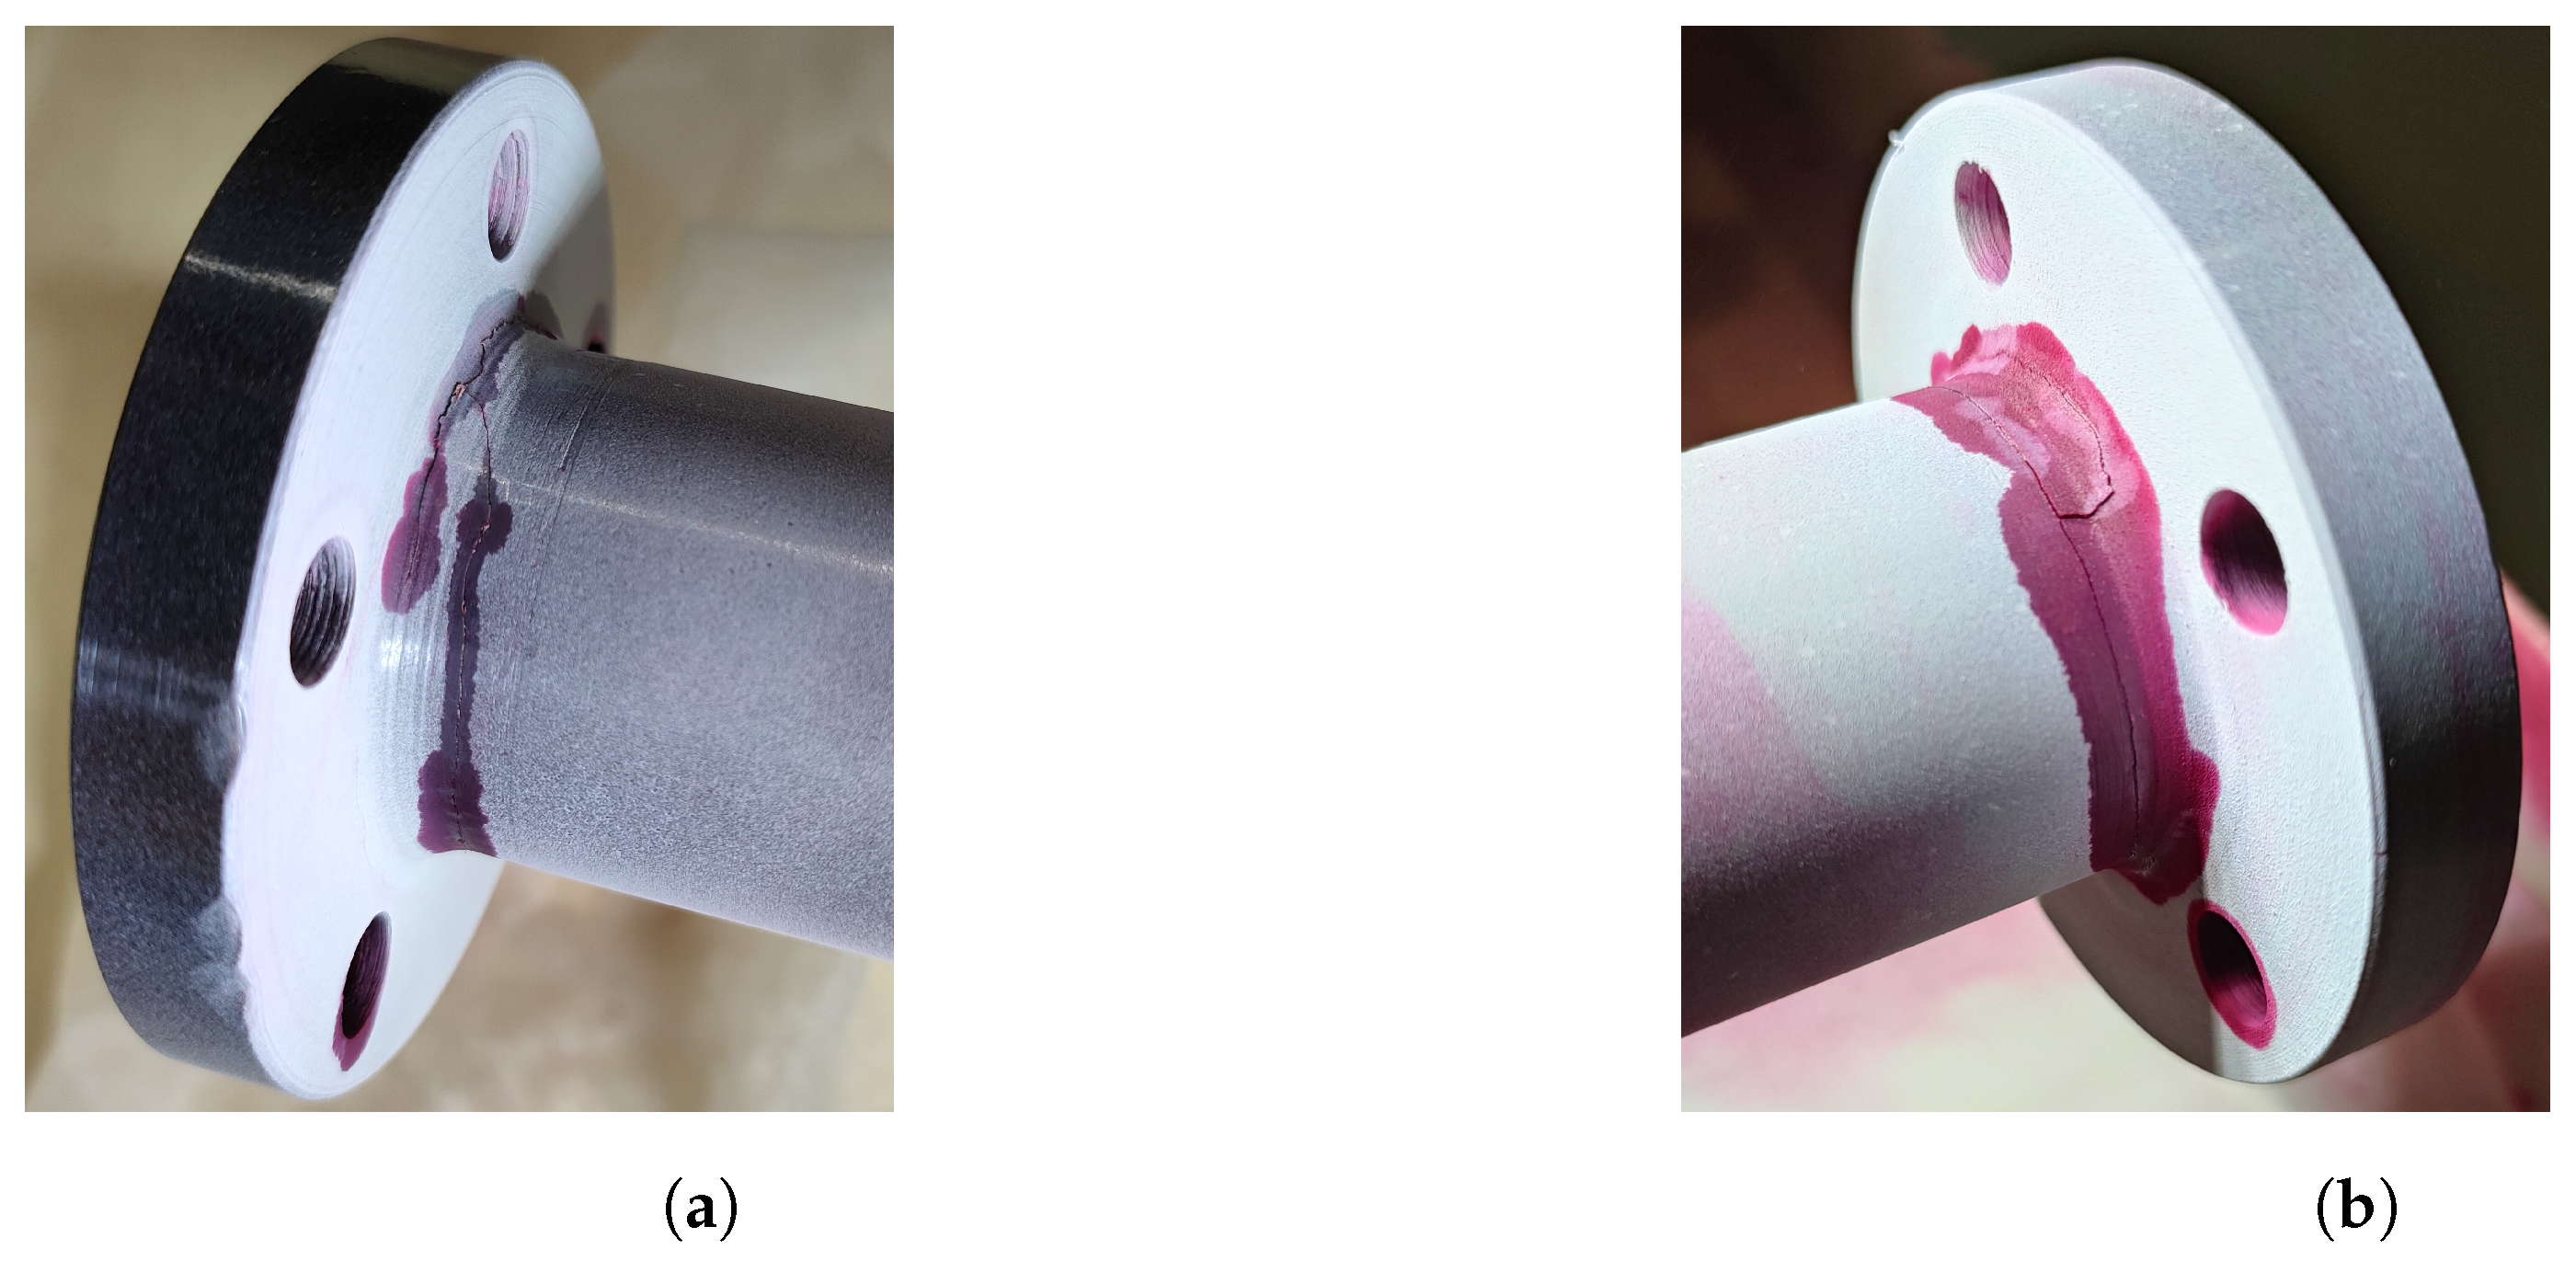
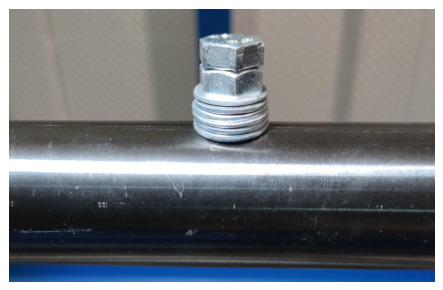
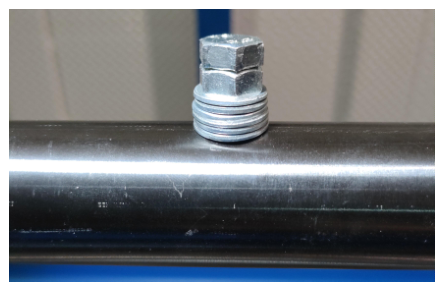
During the experimental campaign, two circumferential cracks opened at the flange welds, as confirmed by penetrant testing (Figure 3). The crack openings, observed after approximately cycles, are attributed to rotary bending fatigue induced by the shaft misalignment, resulting from the manufacturing process. The misalignment generates an alternate stress cycle during rotation, leading to fatigue crack initiation and subsequent propagation along the flange welds, where the highest stress concentration is located. To introduce controlled mass variations, a 14.33 g imbalance mass is mounted in one threaded hole at a time (Figure 4). This procedure is repeated for each of the 19 hole positions, both before and after crack formation, generating two datasets with the same configurations under undamaged and damaged conditions. The additional mass alters the shaft’s mass distribution, generating a centrifugal force of approximately 20 N while rotating at 2500 rpm.
Figure 3.
Circumferential cracks at the weldings: (a) nearest flange to the motor, (b) furthest flange to the motor.
Figure 4.
Imbalance mass.
The acceleration signals are preprocessed using a 5th order Butterworth low-pass filter with a cutoff frequency of 1500 Hz to suppress high-frequency noise. Frequency-domain analysis is first performed to identify possible variations in the system’s eigenfrequencies following crack initiation. The Fast Fourier Transform (FFT) is applied to 10 s signal windows, providing a frequency resolution of 0.1 Hz. No significant frequency shifts are observed, as the dominant components correspond to the engine orders, masking the influence of the cracks.
Due to the limited diagnostic sensitivity of frequency-based analysis, a time-domain approach is adopted. Statistical features are extracted from the acceleration signals to characterise their dynamic behaviour. The first feature, the Root Mean Square (), represents the mean power of the signal and indicates its overall mean energy (Equation (1)).
To represent the properties of the acceleration’s distributions, kurtosis and the skewness are selected, respectively expressed by the Equations (2) and (3). Kurtosis measures the distribution’s "tailedness", since it compares the tails with those of a Gaussian distribution. On the other hand, skewness measures the symmetry of the distribution around its mean value.
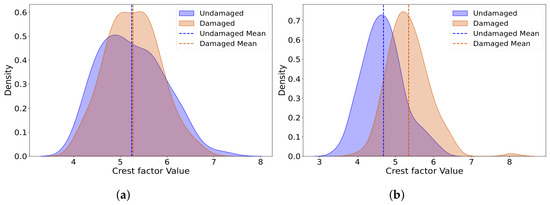
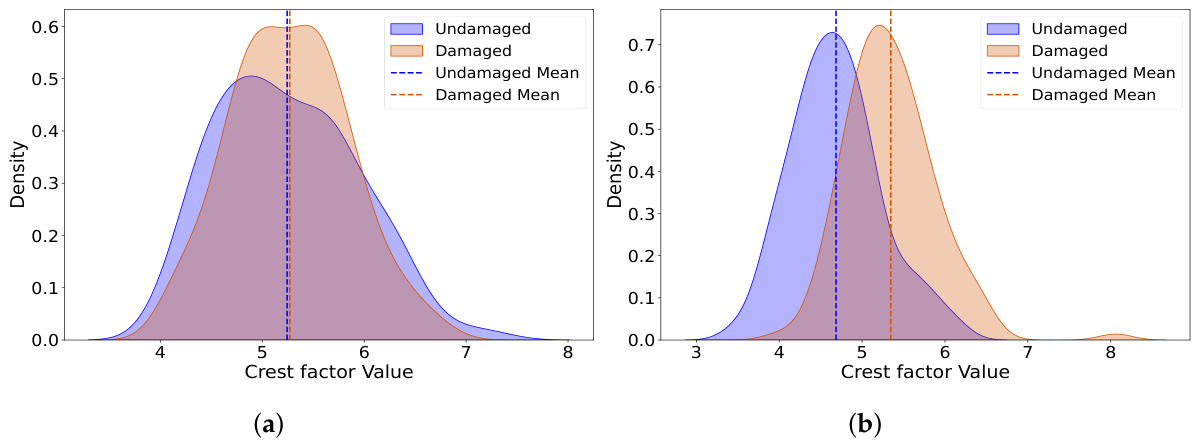
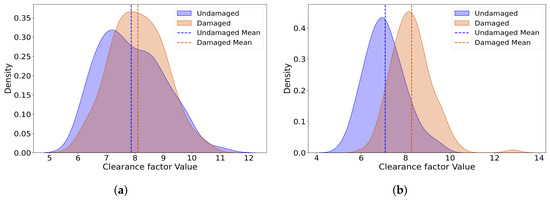
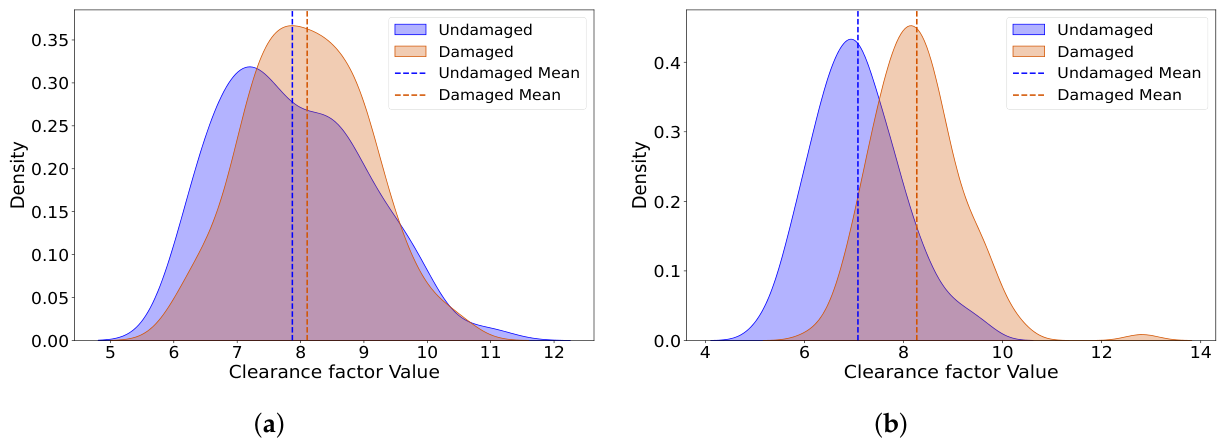
The last two adopted features to analyze the accelerations, crest factor () and clearance factor (), are related to their impulsiveness, meaning that they relate peaks to an average value representative of the signals’ energy. CF, described by Equation (4), compares the maximum peak with the . CLF, although similar to CF, is more sensitive than the previous feature, since the denominator is smaller compared to the , and it is expressed by Equation (5).
These features are not assessed based on their absolute values but rather compared between the undamaged and damaged states. Since environmental conditions, rotational speed fluctuations, and noise may affect individual feature values, their statistical distributions are also analysed. The signals are segmented into windows, and feature values from each segment are collected into vectors to form the corresponding distributions for both structural conditions.
Comparing the distributions obtained from the two scenarios for each feature, it is possible to highlight which one is more sensitive to the presence of damage, and consequently, which is more effective for detection purposes.
To enhance diagnostic reliability, all features are combined into a multivariate statistical distance index using the Mahalanobis Distance (), expressed by Equation (6). is adopted in statistics for multivariate outlier analysis to determine whether a point belongs to a cluster or is considered an outlier. is a weighted Euclidean distance, with the weight function being the inverse of the covariance matrix of the cluster (). In a Structural Health Monitoring (SHM) framework, the healthy condition serves as the reference cluster, and is used to identify outliers corresponding to a structure’s damaged condition. Within the formulation, each point is defined by the vector of observations, also called the feature vector. In this case study, the feature vector is defined as follows: . The element denotes the feature vector mean of the undamaged dataset.
The algorithm is initialized by computing () and () from the undamaged baseline data. is then evaluated for both baseline and damaged conditions, and a threshold, derived from the baseline distribution, is defined to classify each observation as healthy or cracked.
Finally, the damage detection performance is quantified through a confusion matrix, providing the Probability of Detection () and the Probability of False Alarms ().
3. Results
Applying the methodology described in the previous section, the resulting feature distributions reveal small but consistent differences induced by cracks. Two imbalance configurations are considered for each feature: one with the imbalance mass positioned near the flange and the other with the mass located at the midspan. Since the accelerometers are mounted on the bearing housings, these two configurations represent opposite testing conditions, one with the added mass closest to the sensor and the other at the maximum distance, corresponding to the shaft’s midspan. The different configurations also serve to assess the robustness of the proposed diagnostic algorithm under slightly varying shaft conditions. The shaft is classified as damaged whenever cracks are present, regardless of the imbalance mass location. The damage severity is unknown, as the component’s geometry poses several obstacles to ultrasonic and radiographic testing, which are required to quantify the crack depth.
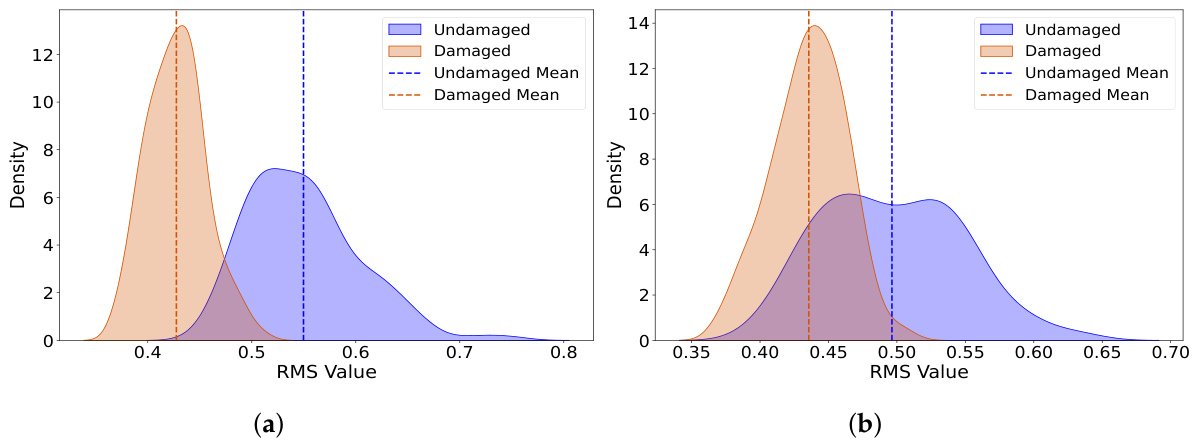
The first analysed feature, the , is shown in Figure 5. The distributions corresponding to the undamaged and damaged cases indicate lower values in the presence of cracks. Physically, this reflects a reduction in the average vibration energy transmitted from the shaft to the supports, which is consistent with a loss of stiffness and an increase in damping. From a monitoring standpoint, this represents a critical situation, as the lower vibration levels may not trigger alarms despite the crack potentially leading to sudden failure due to buckling.
Figure 5.
RMS distributions: (a) Mass screwed near the flange. (b) Mass screwed at the midspan.
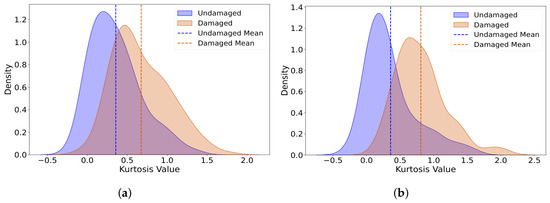
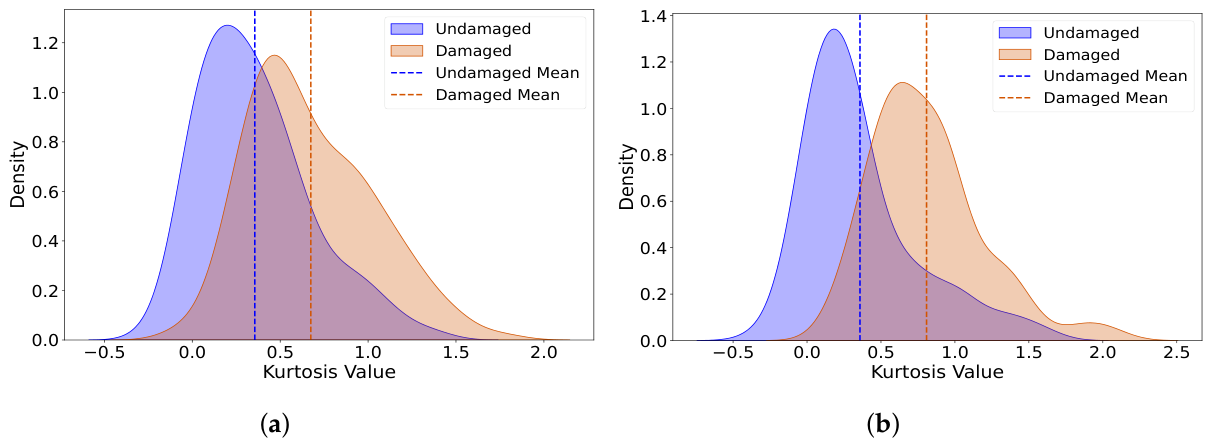
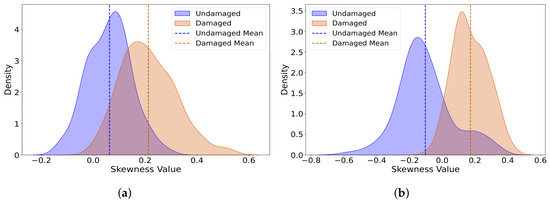
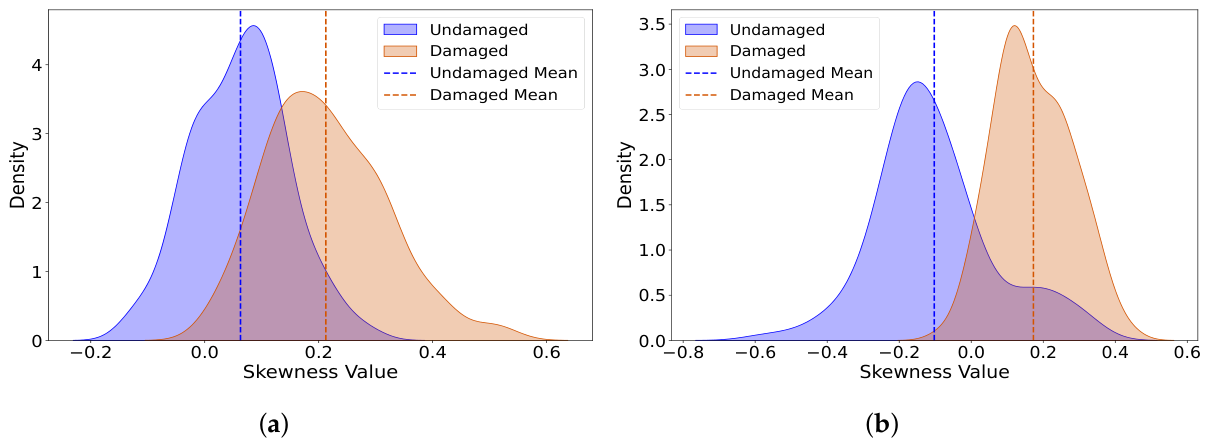
The kurtosis results, reported in Figure 6, show an increase in the mean value after damage, indicating a higher number of samples in the distribution tails. This behaviour suggests the presence of more impulsive, nonstationary events in the signal. Similarly, the skewness distributions shown in Figure 7 exhibit a slight increase for the damaged shaft, implying that the crack introduces asymmetry in the vibration response due to the loss of uniform stiffness and the resulting rotor orbit distortion.
Figure 6.
Kurtosis distributions: (a) Mass screwed near the flange. (b) Mass screwed at the midspan.
Figure 7.
Skewness distributions: (a) Mass screwed near the flange. (b) Mass screwed at the midspan.
The last two analysed features, and , presented in Figure 8 and Figure 9, respectively, both increase in the presence of cracks, revealing higher signal impulsiveness. Among them, the demonstrates greater sensitivity to damage. The configuration with the mass located at midspan exhibits a more pronounced difference between undamaged and damaged conditions for all features.
Figure 8.
distributions: (a) Mass screwed near the flange. (b) Mass screwed at the midspan.
Figure 9.
distributions: (a) Mass screwed near the flange. (b) Mass screwed at the midspan.
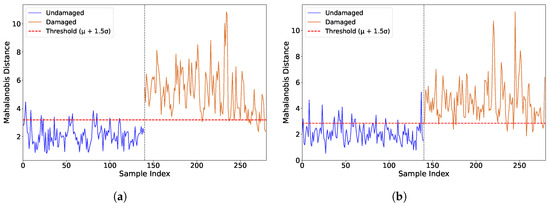
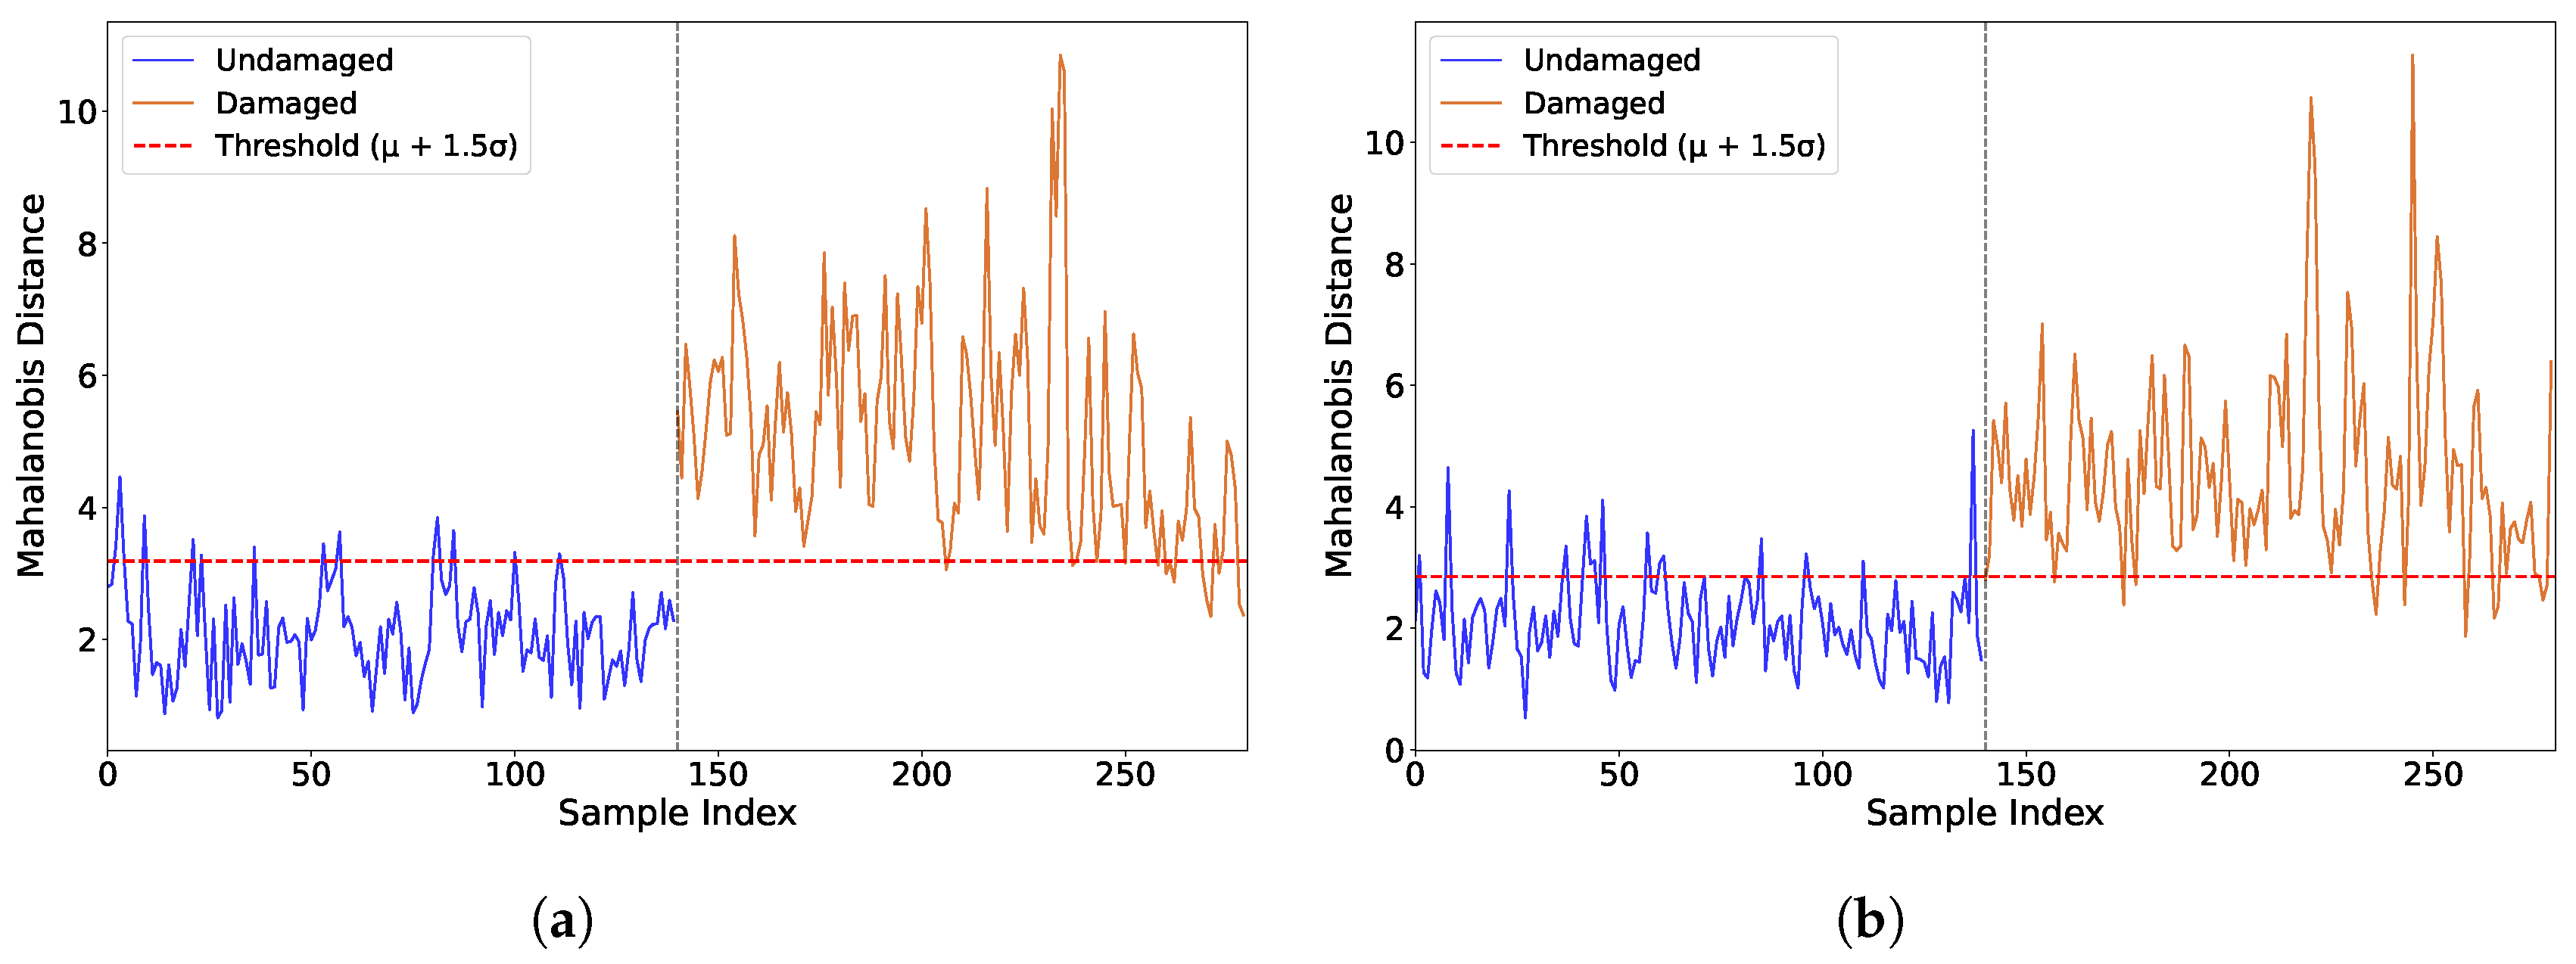
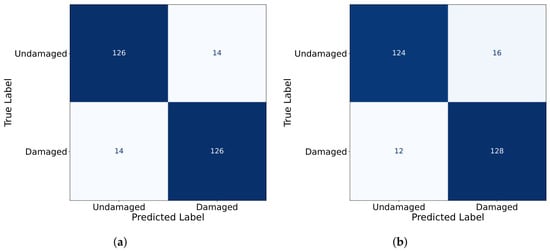
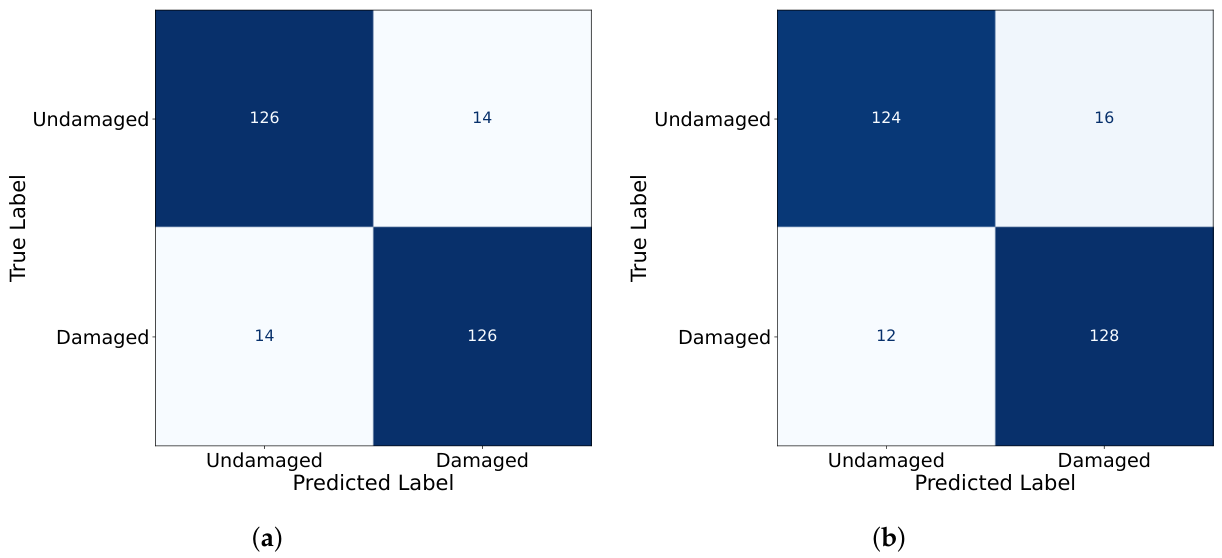
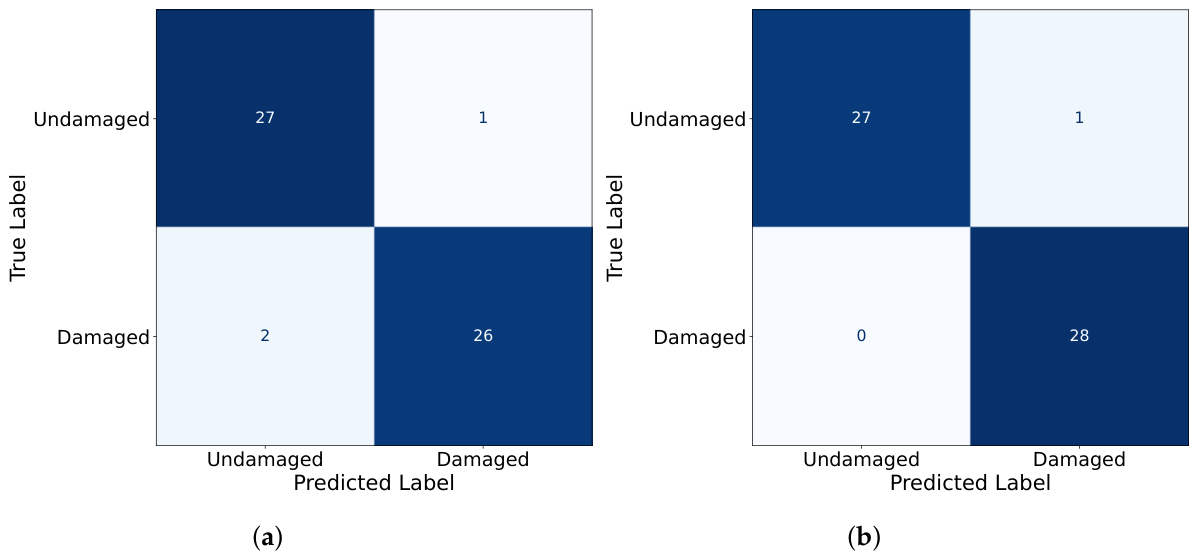
Although individual features reveal discernible changes, they are insufficient for reliable diagnosis when considered independently. Combining all features using the Mahalanobis Distance (MD) improves detection capability, as shown in Figure 10. A threshold of , where is the baseline’s mean and is its standard deviation, is selected to balance missed detections and false alarms. The diagnostic performance, summarised through the confusion matrix in Figure 11, and the corresponding and values, listed in Table 1, confirm the effectiveness of the proposed approach.
Figure 10.
Mahalanobis Distance: (a) Mass screwed near the flange. (b) Mass screwed at the midspan.
Figure 11.
Confusion Matrix: (a) Mass screwed near the flange. (b) Mass screwed at the midspan.
Table 1.
Performance indicators.
The -based diagnosis compares feature sets extracted every second against the baseline threshold. Outliers can occasionally affect the classification accuracy; however, this effect can be mitigated by grouping consecutive measurements and applying a majority-vote strategy. When using batches of five consecutive samples, the influence of outliers is significantly reduced, leading to more stable results, as illustrated in Figure 12 and Table 2. The main limitation of this refinement is the increased detection delay, since the diagnosis is updated every five seconds instead of one.
Figure 12.
Confusion Matrix-Grouped predictions: (a) Mass screwed near the flange. (b) Mass screwed at the midspan.
Table 2.
Performance indicators.
4. Discussion
The results of this study demonstrate that cracks in rotating shafts produce measurable changes in vibration behaviour and transmitted energy, consistent with theoretical expectations. However, these effects are not immediately evident and require detailed signal analysis for proper identification. By extracting and analysing specific statistical features, it was possible to observe consistent trends between undamaged and damaged conditions, regardless of the imbalance mass location. Cracks were found to be more detectable when the imbalance was applied at the shaft midspan, where higher deflections amplify the influence of local stiffness reductions compared to the configuration with the imbalance near the flange.
The diagnostic approach based on the Mahalanobis Distance () effectively combines information from multiple statistical features, overcoming the limitations of using single indicators. The obtained results indicate that the proposed methodology achieves satisfactory detection performance. Its fully statistical and explainable nature makes it particularly suitable for practical implementation, bridging the gap between laboratory experiments and real-world applications.
The present work represents one of several potential research directions that can be pursued using the data from the developed experimental campaign. Future investigations may focus on the development of more advanced diagnostic algorithms capable of operating effectively under data-scarce conditions. Another promising direction involves knowledge transfer between similar shafts, enabling diagnostic generalisation to new components without the need for additional experimental testing.
Author Contributions
Conceptualisation: E.P. and C.S.; Methodology: E.P. and C.S.; Software: E.P.; Validation: E.P.; Formal analysis: E.P.; Investigation: E.P., C.S. and M.G.; Resources: E.P., C.S. and M.G.; Data curation: E.P.; Writing - original draft preparation: E.P., C.S. and M.G.; Writing - review and editing: E.P., C.S. and M.G.; Visualisation: E.P.; Supervision: C.S. and M.G.; Funding acquisition: C.S. and M.G. All authors have read and agreed to the published version of the manuscript.
Funding
This work has been developed within the SAMAS 2 project (Structural health and ballistic impact monitoring and prognosis on a military helicopter), a Cat.-B project (B PRJ-RT 1074) coordinated by the European Defense Agency (EDA) and involving two nations, Italy and Poland.
Institutional Review Board Statement
Not applicable.
Informed Consent Statement
Not applicable.
Data Availability Statement
Data are not publicly available but may be provided by the authors upon reasonable request and subject to case-by-case evaluation.
Conflicts of Interest
The authors declare no conflicts of interest.
Abbreviations
The following abbreviations are used in this manuscript:
| Crest Factor | |
| Clearance Factor | |
| Mahalanobis Distance | |
| Probability of False Alarms | |
| Probability od Detection | |
| Root Mean Square | |
| Structural Health Monitoring |
References
- Ying, F.; Yu, X.; Cao, J.; Li, P.; Yang, L.; Guo, Y. Real-time detection of rotor misalignment using a non-contact triboelectric sensor integrated with deep learning. Measurement 2026, 257, 118704. [Google Scholar] [CrossRef] [Scilit]
- Armon, D.; Ben-Haim, Y.; Braun, S. Crack detection in beams by rankordering of eigenfrequency shifts. Mech. Syst. Signal Process. 1994, 8, 81–91. [Google Scholar] [CrossRef] [Scilit]
- Buckley, T.; Ghosh, B.; Pakrashi, V. A Feature Extraction & Selection Benchmark for Structural Health Monitoring. Struct. Health Monit. 2022, 22, 2082–2127. [Google Scholar] [CrossRef] [Scilit]
- Katam, R.; Pasupuleti, V.D.K.; Kalapatapu, P. Machine learning-driven structural health monitoring: STFT-based feature extraction for damage detection. Structures 2025, 78, 109244. [Google Scholar] [CrossRef] [Scilit]
- Karyofyllas, G.; Giagopoulos, D. Condition monitoring framework for damage identification in CFRP rotating shafts using Model-Driven Machine learning techniques. Eng. Fail. Anal. 2024, 158, 108052. [Google Scholar] [CrossRef] [Scilit]
- Hu, Q.; Si, X.S.; Zhang, Q.H.; Qin, A.S. A rotating machinery fault diagnosis method based on multi-scale dimensionless indicators and random forests. Mech. Syst. Signal Process. 2020, 139, 106609. [Google Scholar] [CrossRef] [Scilit]
- Parziale, M.; Yeung, Y.F.; Youcef-Toumi, K.; Giglio, M.; Cadini, F. Anomaly characterization for the condition monitoring of rotating shafts exploiting data fusion and explainable convolutional neural networks. Struct. Health Monit. 2025, 25, 14759217241301288. [Google Scholar] [CrossRef] [Scilit]
- He, Z.; Shao, H.; Zhong, X.; Zhao, X. Ensemble transfer CNNs driven by multi-channel signals for fault diagnosis of rotating machinery cross working conditions. Knowl.-Based Syst. 2020, 207, 106396. [Google Scholar] [CrossRef] [Scilit]
- Vasiliki, P.; Lorenzo, B.; Emanuele, P.; Andrea, B.; Ugo, M.; Marco, G.; Claudio, S. Comparative study on ballistic impact detection in helicopter transmission shafts using NARX and LSTM models. Appl. Intell. 2025, 55, 264. [Google Scholar] [CrossRef] [Scilit]
- Rastin, Z.; Ghodrati Amiri, G.; Darvishan, E. Unsupervised Structural Damage Detection Technique Based on a Deep Convolutional Autoencoder. Shock Vib. 2021, 2021, 6658575. [Google Scholar] [CrossRef] [Scilit]
- Wang, D.; Cao, H.; Yang, Y.; Du, M. Dynamic modeling and vibration analysis of cracked rotor-bearing system based on rigid body element method. Mech. Syst. Signal Process. 2023, 191, 110152. [Google Scholar] [CrossRef] [Scilit]
- Yamamoto, G.K.; da Costa, C.; da Silva Sousa, J.S. A smart experimental setup for vibration measurement and imbalance fault detection in rotating machinery. Case Stud. Mech. Syst. Signal Process. 2016, 4, 8–18. [Google Scholar] [CrossRef] [Scilit]
- Papadimitriou, V.; Palermo, E.; Giglio, M.; Sbarufatti, C. Deep Learning-Based Identification of Shaft Imbalance Faults in Rotating Machinery Using the NARX Models. J. Vib. Eng. Technol. 2025, 13, 261. [Google Scholar] [CrossRef] [Scilit]



Disclaimer/Publisher’s Note: The statements, opinions and data contained in all publications are solely those of the individual author(s) and contributor(s) and not of MDPI and/or the editor(s). MDPI and/or the editor(s) disclaim responsibility for any injury to people or property resulting from any ideas, methods, instructions or products referred to in the content. |
© 2026 by the authors. Licensee MDPI, Basel, Switzerland. This article is an open access article distributed under the terms and conditions of the Creative Commons Attribution (CC BY) license.