


Abstract
Swarm is a three-satellite mission operated by the European Space Agency to monitor the Earth’s magnetic field. The China Seismo-Electromagnetic Satellite (CSES) is a satellite dedicated to studying the possible seismo-induced effects of earthquake activity on the ionosphere, operated by the China National Space Administration in cooperation with the Italian Space Agency. Such satellites are placed in Low Earth Orbit at an altitude ranging from 460 km to 510 km. We selected orbital combinations with the Swarm satellite in one hemisphere and CSES-01 in the opposite one to study the impact of magnetic pulsations on the ionospheric environment. The data have been filtered in the frequency range of Pi2 pulsations (period between 40 s and 150 s). Similar oscillations of a few nanoTeslas of the magnetic field intensity were detected by both satellites, sometimes in phase and at other times in counterphase. Detected oscillations could be explained by interactions between the Sun’s and Earth’s magnetic fields or the effect of a satellite crossing the auroral ring currents at the Northern and Southern Poles. This work supports the cross-validation of magnetic data from multiple satellite missions in Low Earth Orbit, such as Swarm and CSES. Our results confirm the scientific reliability of magnetic data acquired from the above-cited satellite missions.
1. Introduction
Earth is surrounded by a magnetic field primarily generated by electric currents in the planet’s liquid core. This field, also known as the geomagnetic field, protects the planet from solar wind, a stream of charged particles continuously emitted by the Sun (as any other active star in the main sequence) into outer space. Both the geomagnetic field and solar wind have variable activity levels. In addition, particular phenomena on the Sun’s surface, such as Coronal Mass Ejections, can accelerate high-speed charged particles into space, and, in some cases, they can hit Earth’s orbit, creating strong perturbations to the geomagnetic field known as geomagnetic storms [1]. The delicate interaction between solar activity and the geomagnetic field may induce some perturbations, and they are usually classified into two main categories: regular or irregular; they are subdivided based on their frequency of oscillation: Pc1, Pc2, … Pc5 (continuous pulsations) for the first one and Pi1 and Pi2 (irregular pulsations) for the second one [2]. The exact source mechanisms and propagation way of Pi2 pulsations are debated, even though several hypotheses were proposed [3,4]. Most of Pi2 seems to occur in the onset of a geomagnetic substorm, but geomagnetic observatories at high latitudes have not detected Pi2 in this condition. In the last case, a plasma resonance and Alfvén waves bouncing between hemispheres could be the sources for such events. Pi2 oscillations were identified in the inner magnetosphere and ground geomagnetic observatories also in non-substorm geomagnetic conditions during solar flares [5]. The generation source of Pi2 oscillation is generally in the night-side, but they can then propagate and be observed in all day-sectors, with some delay with respect to the night side [6]. Modern techniques based on machine learning have been proposed to automatically detect Pi2 events by scrutinising the ground magnetic data [7]. In the last decade, the Swarm satellite mission contributed significantly to investigating the ionospheric perturbations [8]. In particular, Martines-Bedenko et al. [9] reported simultaneous detection of Pi2 events from the Swarm satellite and ground magnetometer in Africa during substorm and non-substorm periods, showing a similar intensity of the oscillation from satellite and ground. Ghamry et al. [10] reported for the first time the detection of Pi2 oscillation from the China Seismo-Electromagnetic Satellite (CSES-01) for an event that occurred on 3 September 2018 and confirmed from ground observatory Kakioka (located in Japan) and other satellites, such as the Van Allen Probe (VAP) B.
2. Materials and Methods
In this work, we analysed the magnetic field data measured by Low Earth Orbit (LEO) satellites. We selected the Swarm and China Seismo-Electromagnetic Satellite (CSES) missions. Swarm is a constellation of three identical satellites launched by the European Space Agency (ESA) on 22 November 2013 and still in orbit [11]. The satellite orbits are designed to optimise magnetic field measurements, and they are quasi-polar orbits, with one higher satellite (Swarm Bravo) and two lower ones (Swarm Alpha and Charlie) that fly close to each other (about 1.4 degrees of longitudinal separation) to accurately measure the Field-Aligned Currents (FACs). Each satellite is equipped with several instruments, particularly to measure the magnetic field; the satellite extended a 4 m boom after launch to place the magnetic sensors sufficiently far from the spacecraft to avoid electrical contamination (cross-talk with onboard instrumentation). At the end of the boom, there is the “Absolute Scalar Magnetometer” (ASM) that measures the intensity of the magnetic field, and halfway through the boom there is the “Vector Field Magnetometer” (VFM) that measures the direction of the magnetic field. In order to know the continuous direction of the VFM instrument, three star cameras continuously determine the spacecraft orientation relative to the sky, and they are mounted on the same optical bench as the VFM. This detail allows us to ignore any difference with respect to the body of the satellite and even compensate for eventual oscillations of the boom. VFM acquires the data with a sample frequency of 50 Hz and ASM with 1 Hz in standard working mode, and ESA provided the magnetic field vector, consequently, into two distinct products: LR (Low Resolution) at 1 Hz and HR (High Resolution) at 50 Hz. For this work, we selected the LR product and, specifically, the “SW_OPER_MAGX_LR_1B”.
The China Seismo-Electromagnetic Satellite (CSES) mission is a constellation composed (at present) of two satellites, CSES-01 and CSES-02, launched by China National Space Administration in 2018 and 2025, respectively, dedicated to searching for possible ionospheric effects induced by earthquakes [12]. The mission plan includes launching additional satellites to improve coverage and extend capability by combining different orbits. The altitude of the CSESs is about 500 km, similar to that of Swarm Bravo. An important difference is the local time, which for CSES is fixed; in fact, the orbits are Sun-synchronous, while the Swarm satellites continuously drift in local time. At the equatorial node, CSES-01 passes at 2:00 AM for nighttime orbits and 2:00 PM for daylight orbits. This characteristic was selected from a previous French satellite dedicated to studying possible effects of earthquakes in the ionosphere, DEMETER [13]. CSESs are equipped with multiple instruments, including magnetometers called High Precision Magnetometers (HPMs), plasma measurement (Langmuir) probes, Plasma Analyser Package, electric field detector and two particle detectors sensitive to different energies of the incoming particles. In this study, we analysed data from the HPM, which comprises three instruments (two fluxgate magnetometers and one Coupled Dark State Magnetometer) mounted on one of the satellite’s extension booms, as with the Swarm satellite, to reduce electromagnetic contamination from the satellite body [14]. Data are acquired at 60 Hz of time resolution, but we analysed the product at 1 Hz in analogy with the Swarm satellite. CSES data were demonstrated to be useful not only to study earthquake effects in ionosphere as discussed in [15,16,17] but also other geophysical phenomena including geomagnetic storms [18,19].
3. Selection of Case Studies
For this study, we selected case studies, starting with investigations of the Kakioka geomagnetic ground observatory data. When it detects a Pi2 pulsation, we checked the availability of Swarm and CSES data and the orbital position of the four satellites. For this preliminary investigation, three case studies were selected in January 2021: one on 8 January at 15:45 UT and two on 12 January at 11:30 UT and 19:58 UT, respectively.
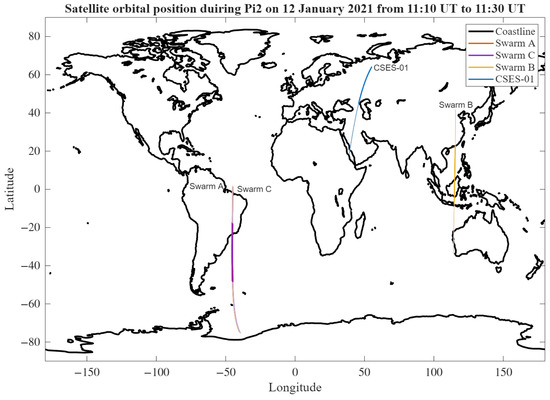
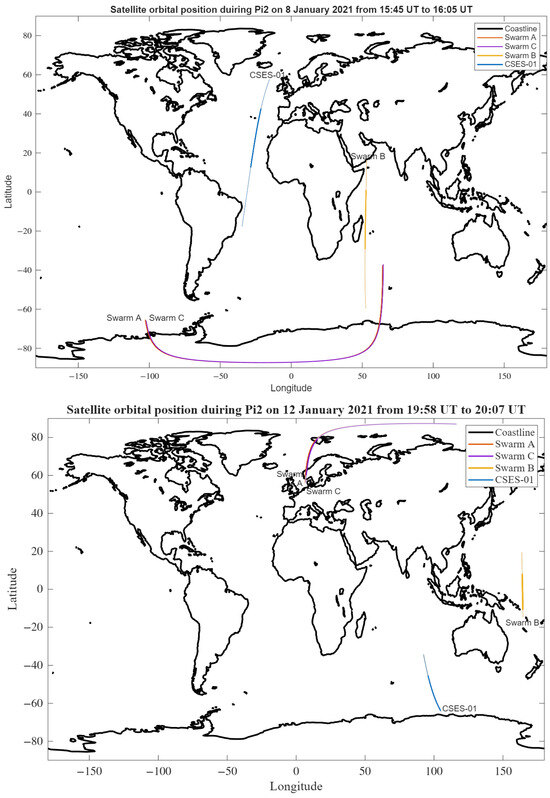
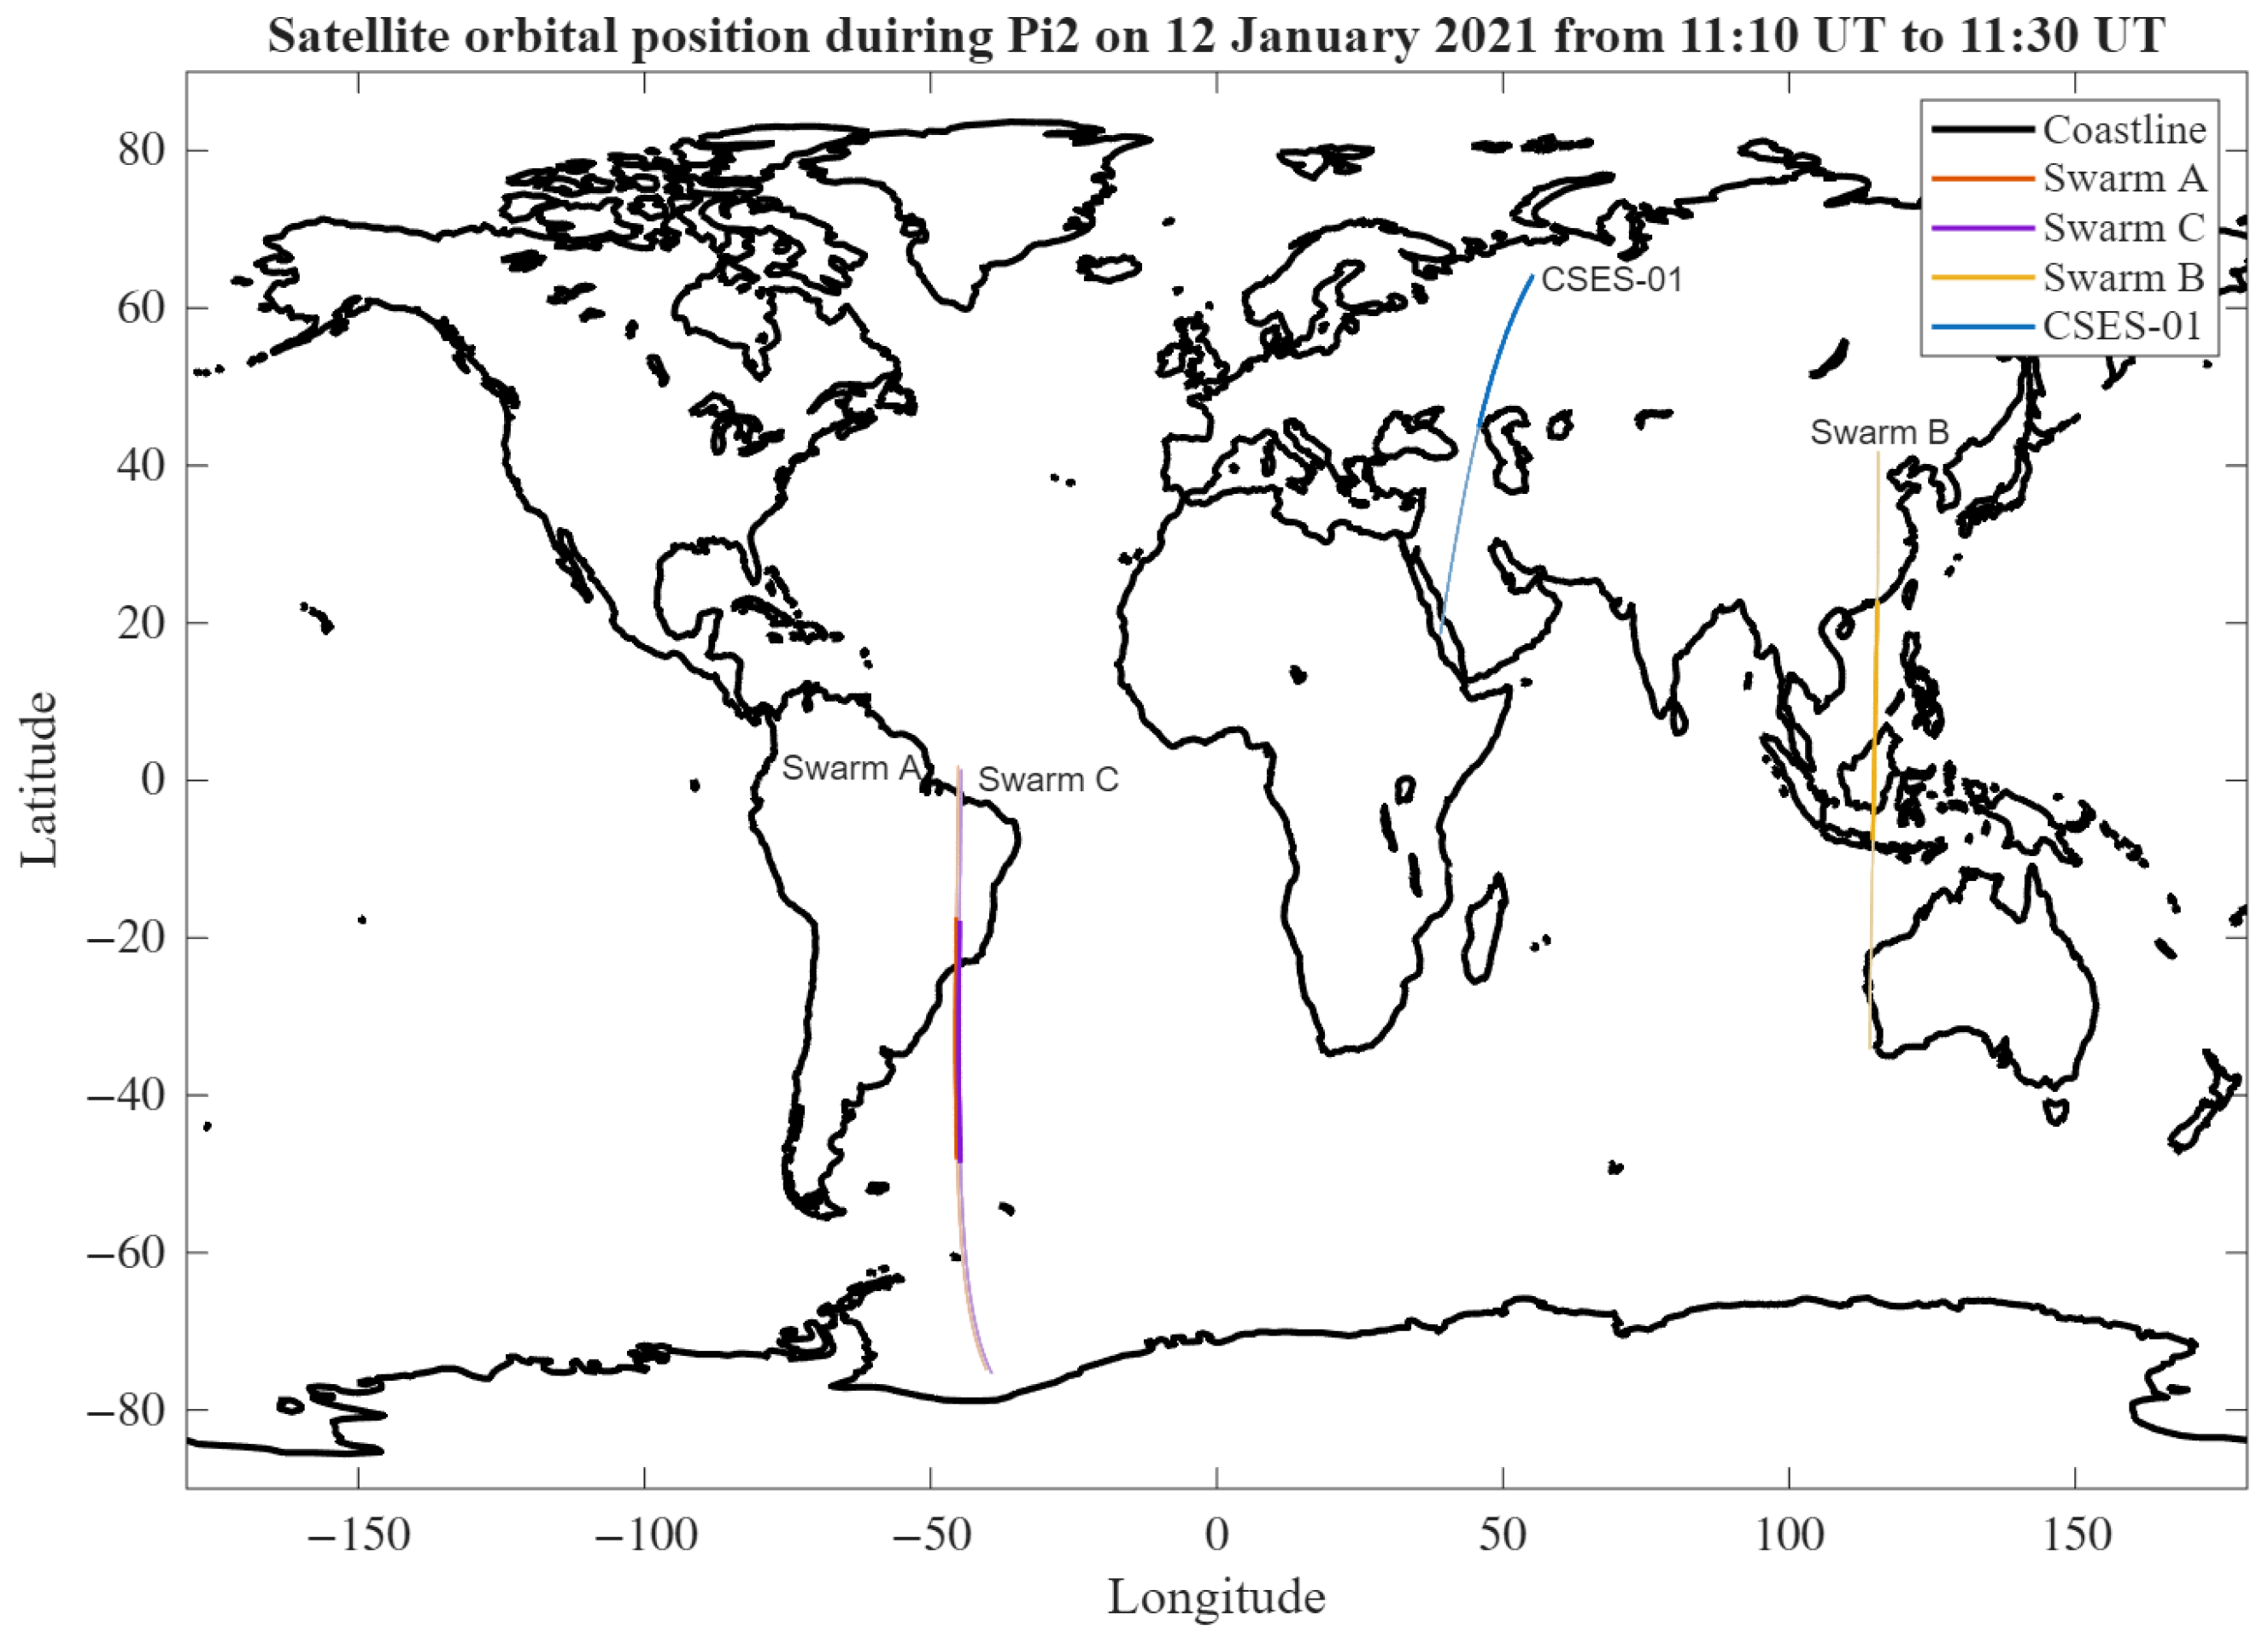
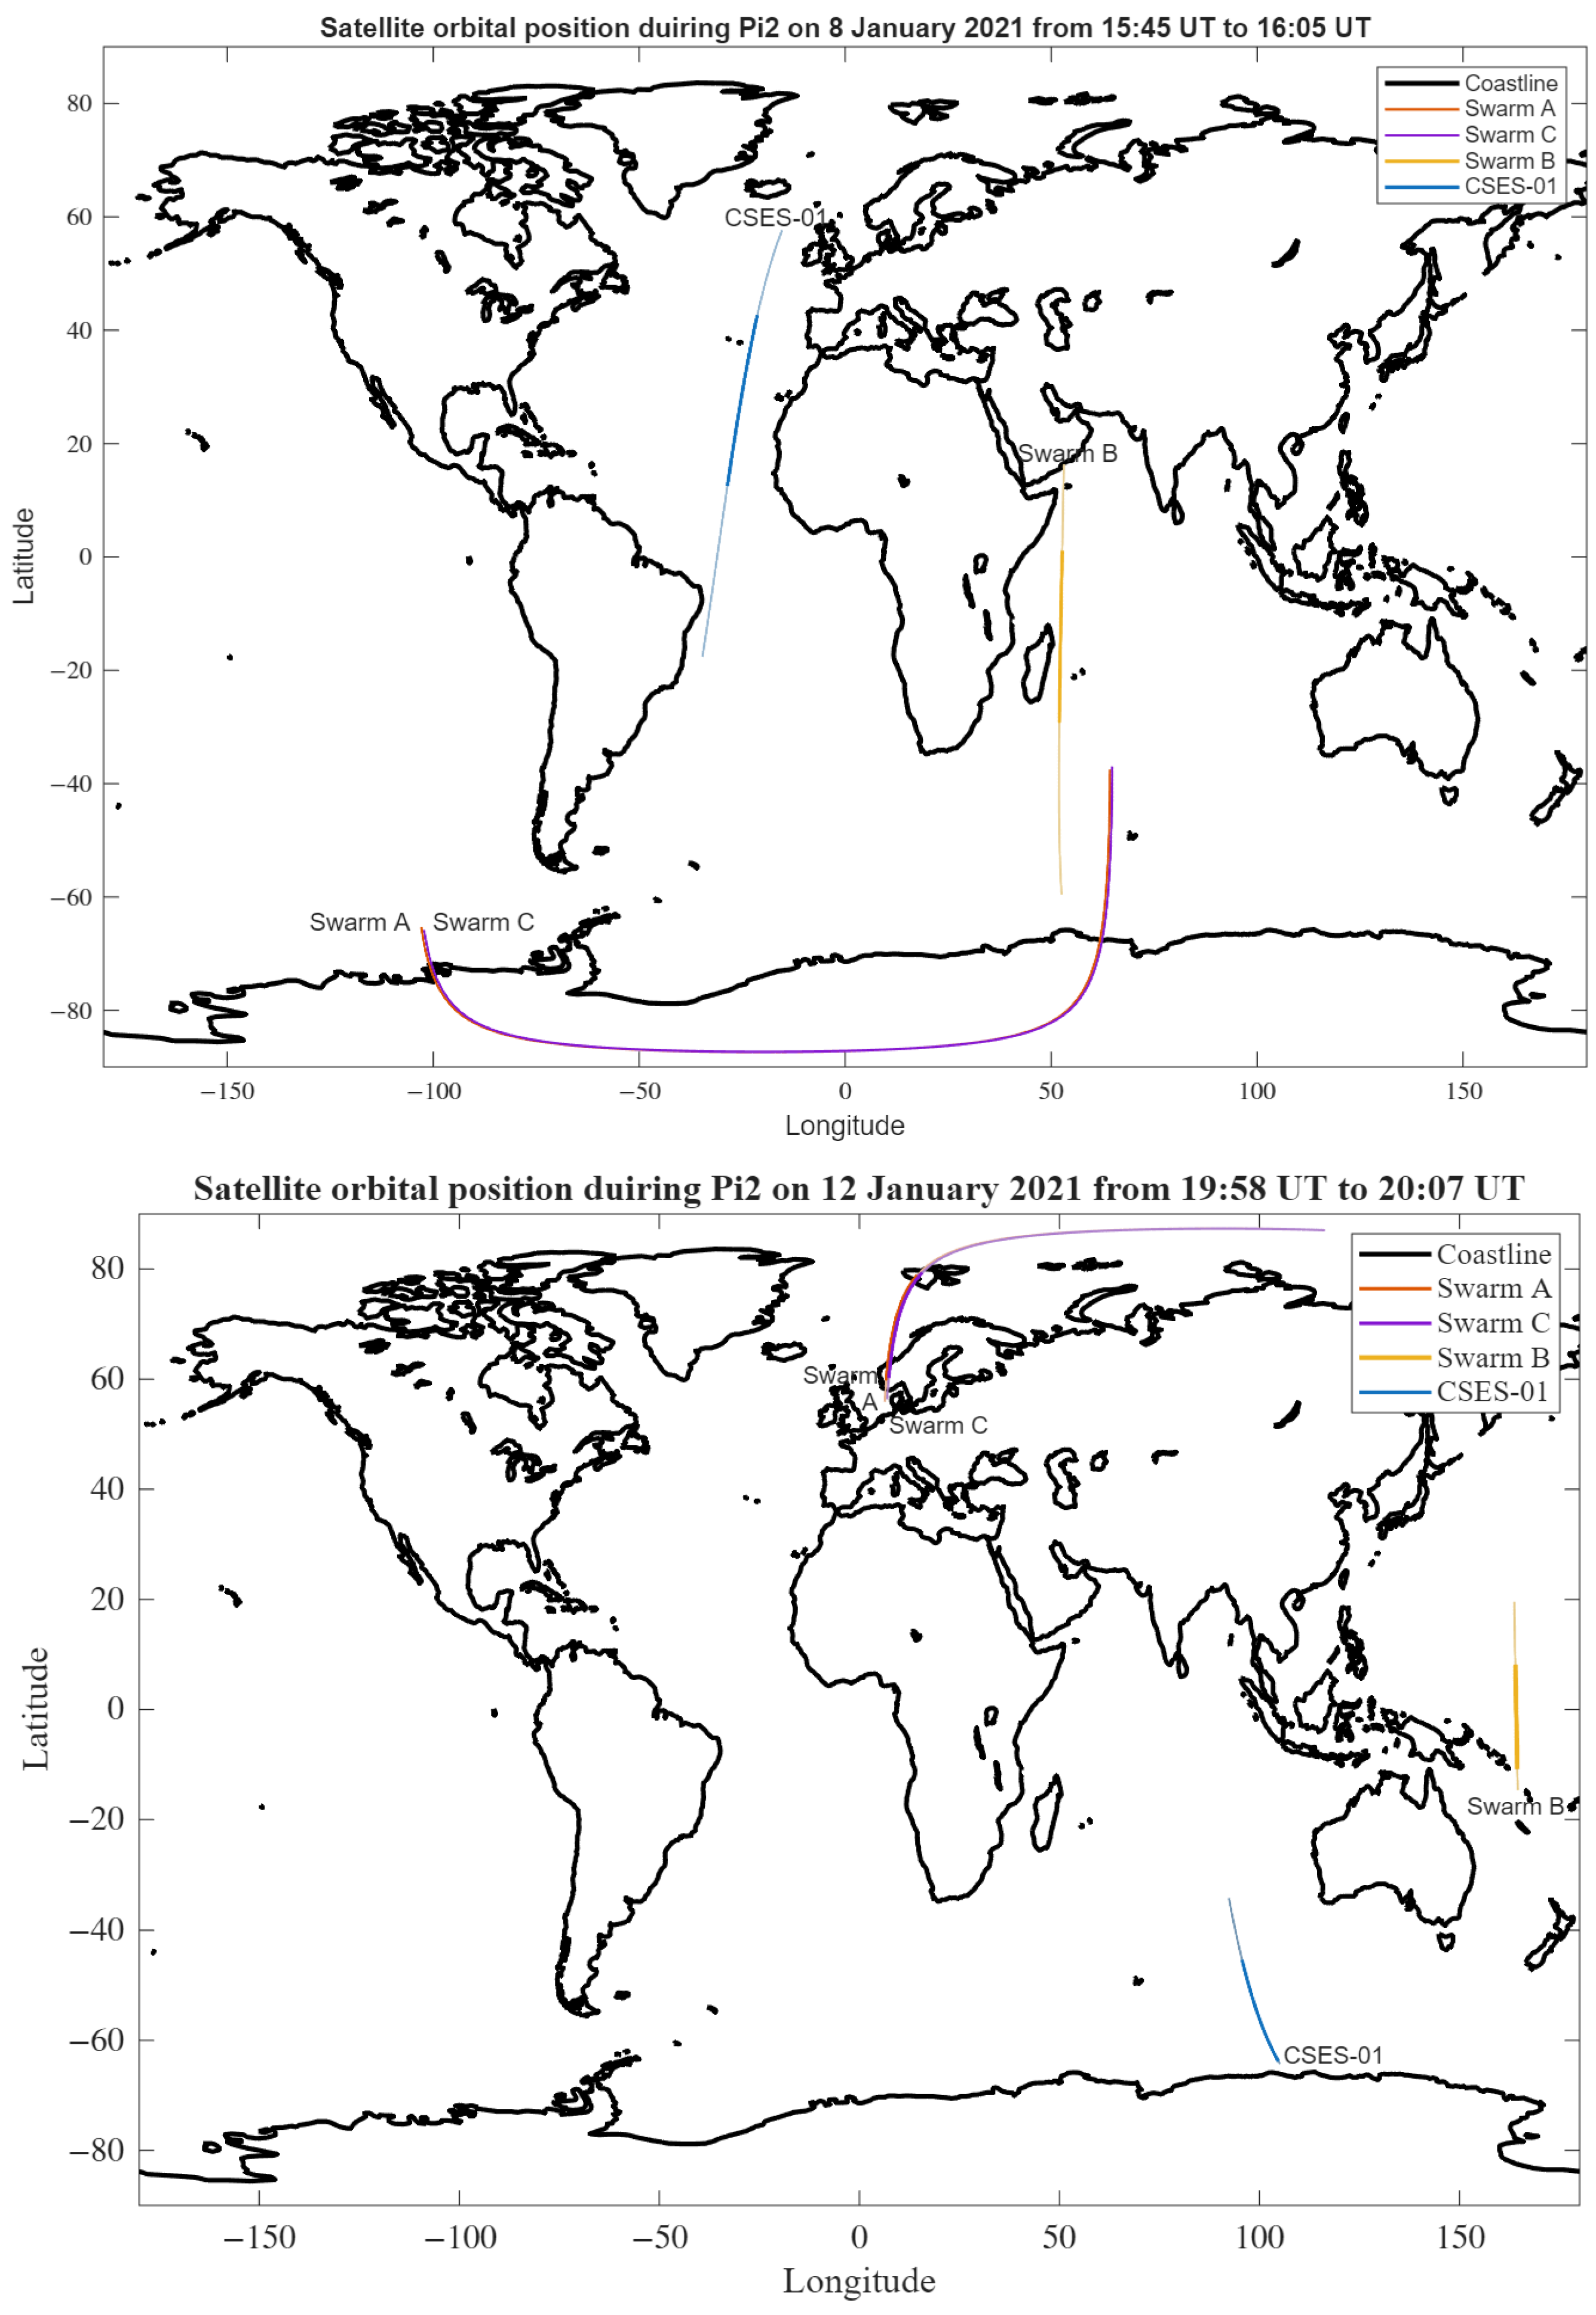
The orbital positions covered by four satellites (CSES, Swarm Alpha, Bravo and Charlie) are represented in Figure 1, and the principal orbital parameters, as well as the time of detection of Pi2, are listed in Table 1. In particular, the three selected cases present opposite hemisphere locations of Swarm and CSES, and on some occasions, one of the satellites was at the equatorial location. We also selected the third case with some data collected at high latitude to cover several scenarios.
Figure 1.
Orbital positions of the three Swarm and CSES-01 satellites during the occurrence of the three selected Pi2 events.
Table 1.
List of the main characteristics of the three selected Pi2 events.
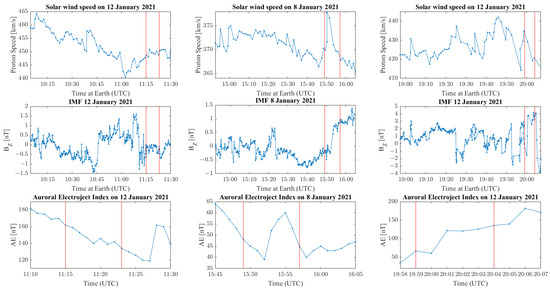
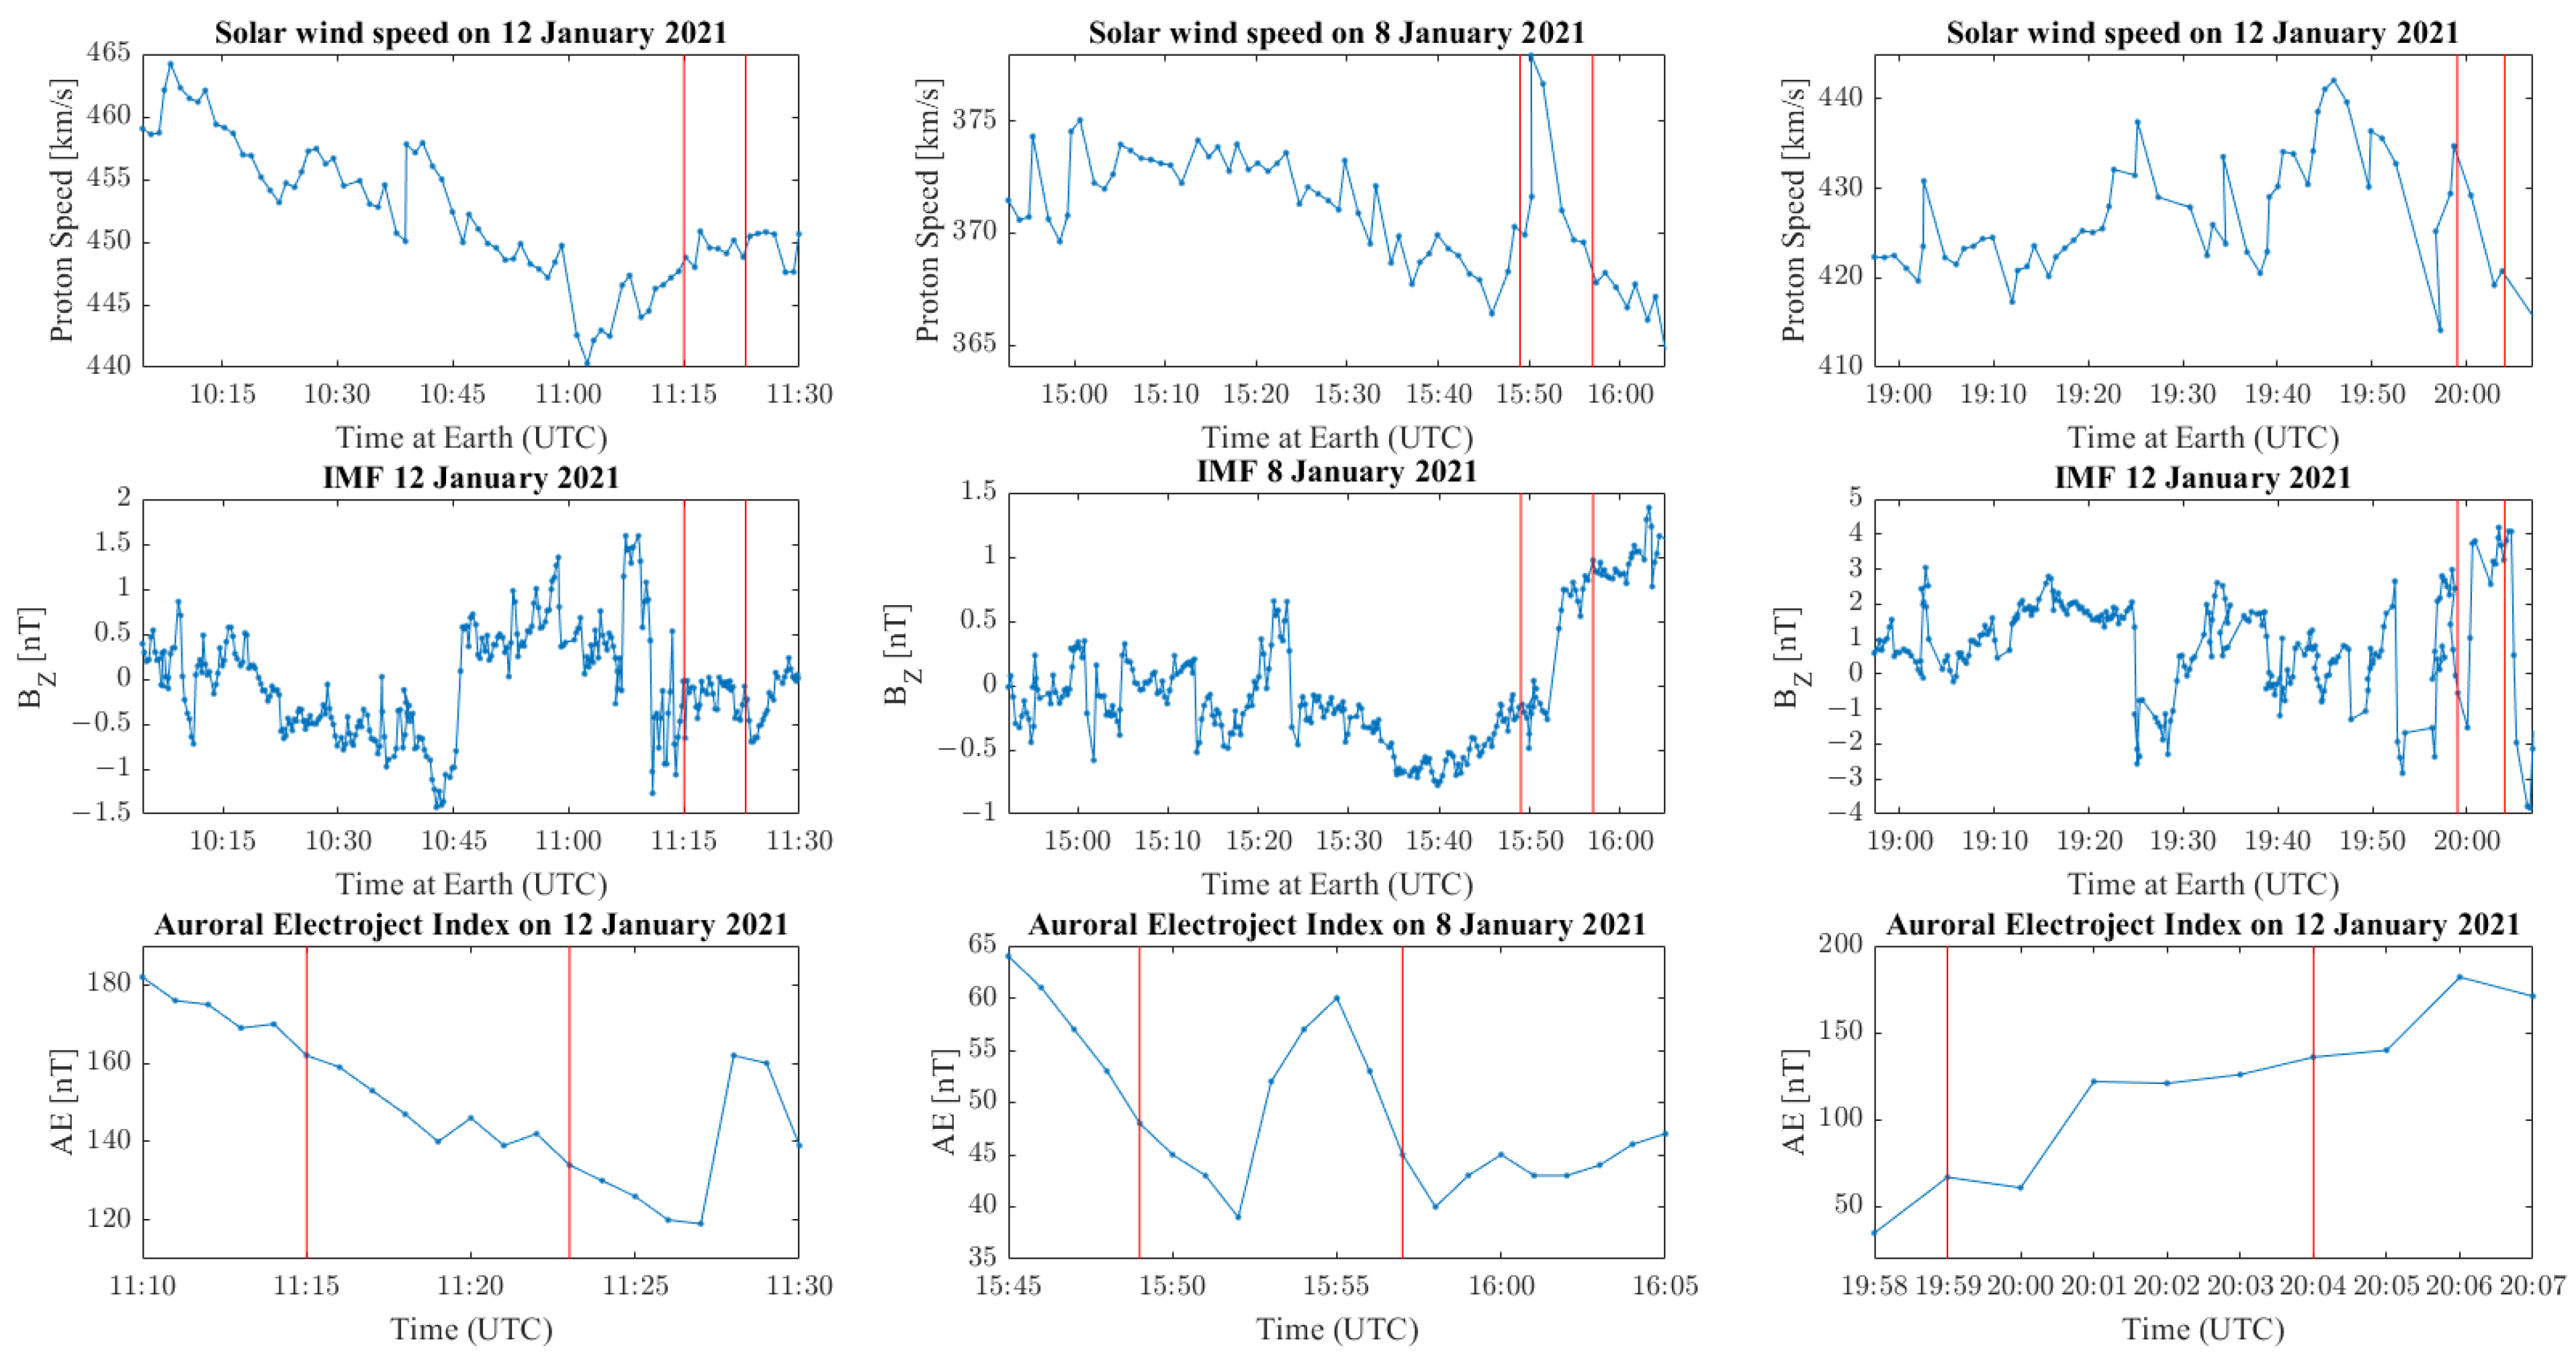
We checked the space weather conditions during the three selected events by collecting and plotting in Figure 2 the solar wind speed, the vertical component BZ of the Interplanetary Magnetic Field (IMF), and the auroral electrojet AE index. The solar wind speed was derived from measurements of proton speed made by the Advanced Composition Explorer (ACE) satellite, which orbits the Lagrangian Point L1 at 1.5 million km from Earth. The IMF was retrieved from the same satellite, too. In order to consider the time of arrival of the solar wind and magnetic field on the Earth’s environment, we calculated it by using the point-by-point measurements of solar wind speed. We selected the IMF BZ components because its inversion was suggested to be related to a specific response of the geomagnetic field [20].
Figure 2.
Solar wind speed, IMF BZ and AE index during the three investigated events. The red vertical lines marked the time window where the Pi2 pulsation have been identified.
4. Results
In order to investigate the three events, we selected the magnetic data from CSES-01 and Swarm satellites at the sample rate of 1 Hz, and we filtered in the Pi2 period range, which is from 40 s to 150 s; we also rotated the data in the mean field-aligned (mfa) coordinate system, as typically done in Pi2 studies [21].
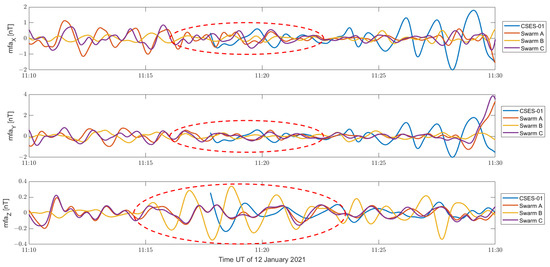
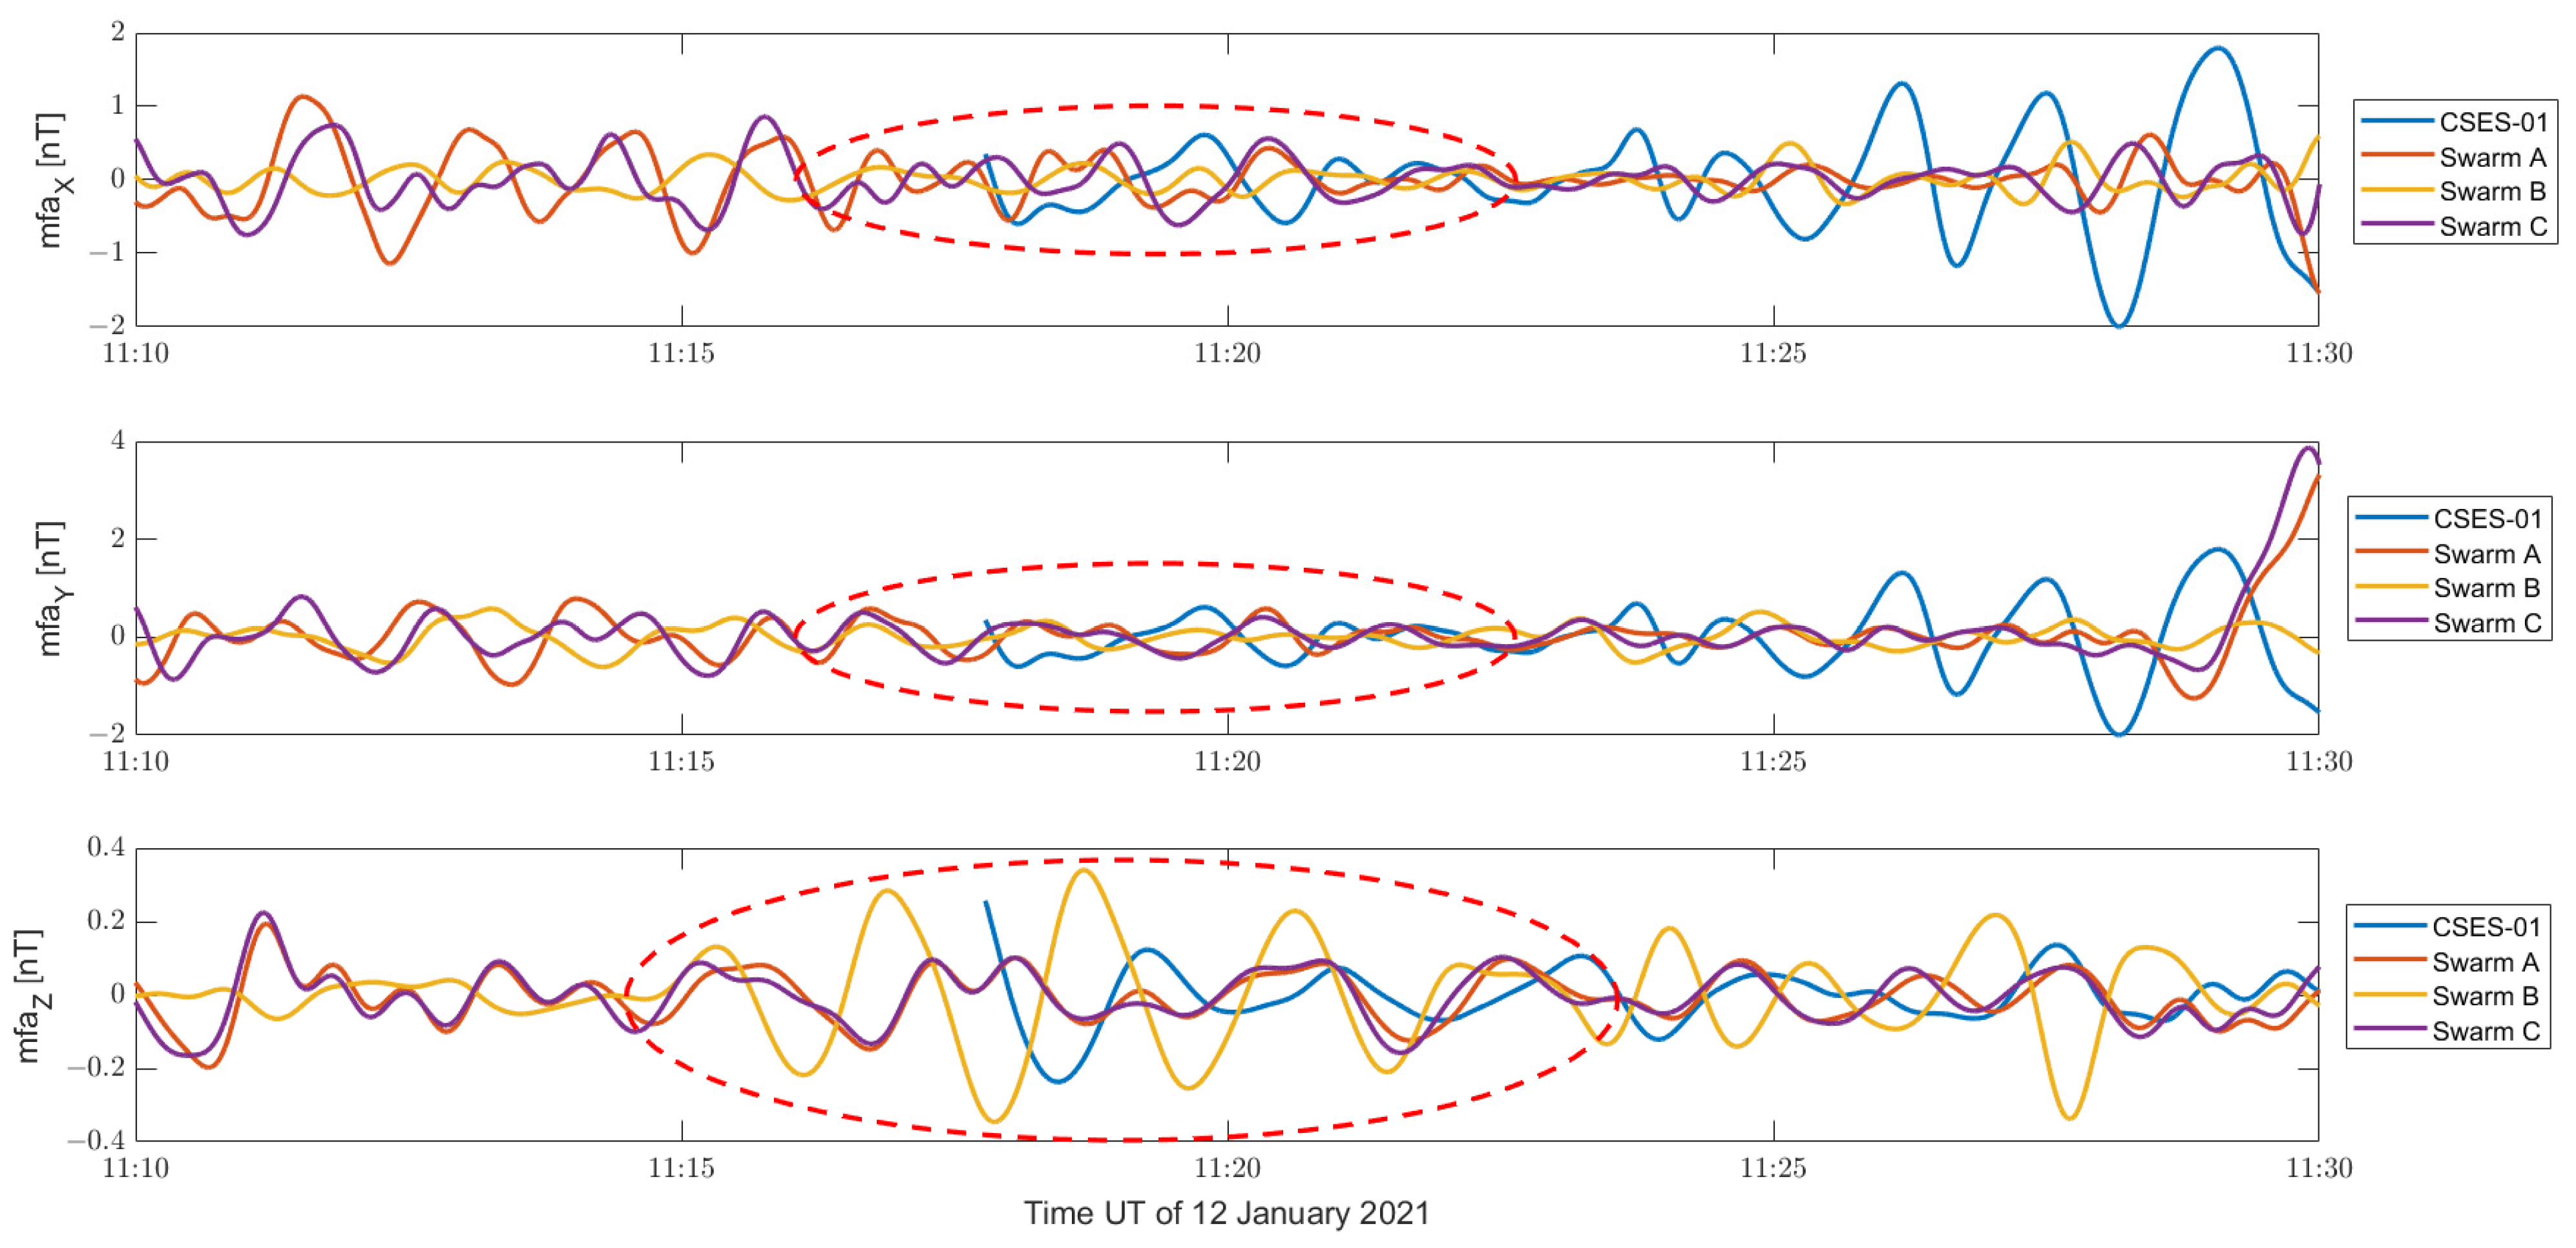
The first case is the one that occurred on 12 January 2021 at about 11:20 UTC, and we reported the filtered data from CSES-01 and Swarm satellite data in the time domain in Figure 3. The Pi2 is better depicted by the vertical component (with respect to the magnetic field that is vertical at the equator with respect to the Earth, as the magnetic field is parallel to its surface). The first part of the Pi2 pulsation (marked by a red dashed oval) was not detected by CSES-01 due to the fact that the satellite normally does not acquire data above 70° geographic latitude to balance power consumption. This was also a decision based on the satellite’s basic scientific goal: to detect possible earthquake signals. Most seismic events occur below this latitude, and eventual seismo-induced effects above it would not be distinguishable from the high polar geomagnetic activity.
Figure 3.
CSES-01 and Swarm Bravo time series of magnetic signal in mfa reference system, filtered in Pi2 frequency range on 12 January 2021 from 11:10 UT to 11:30 UT. The red dashed oval marks the Pi2 event.
In particular, it is worth noting that geomagnetic oscillations are observed by all satellites, and CSES-01 shows the same period but about a 120° or 2/3 π phase shift to Swarm Bravo in the Z mfa component. Table 2 reports the phase shift determined with fit of the sinuidal signal in a period within 40 s and 150 s. The figures obtained with the fit of the pulsations are provided in Supplementary Materials.
Table 2.
Phase shift calculation for the Pi2 events on component BZ in mfa reference frame.
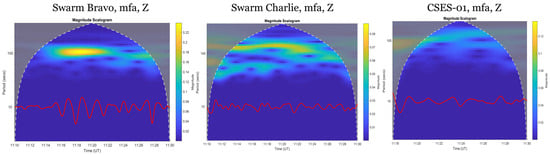
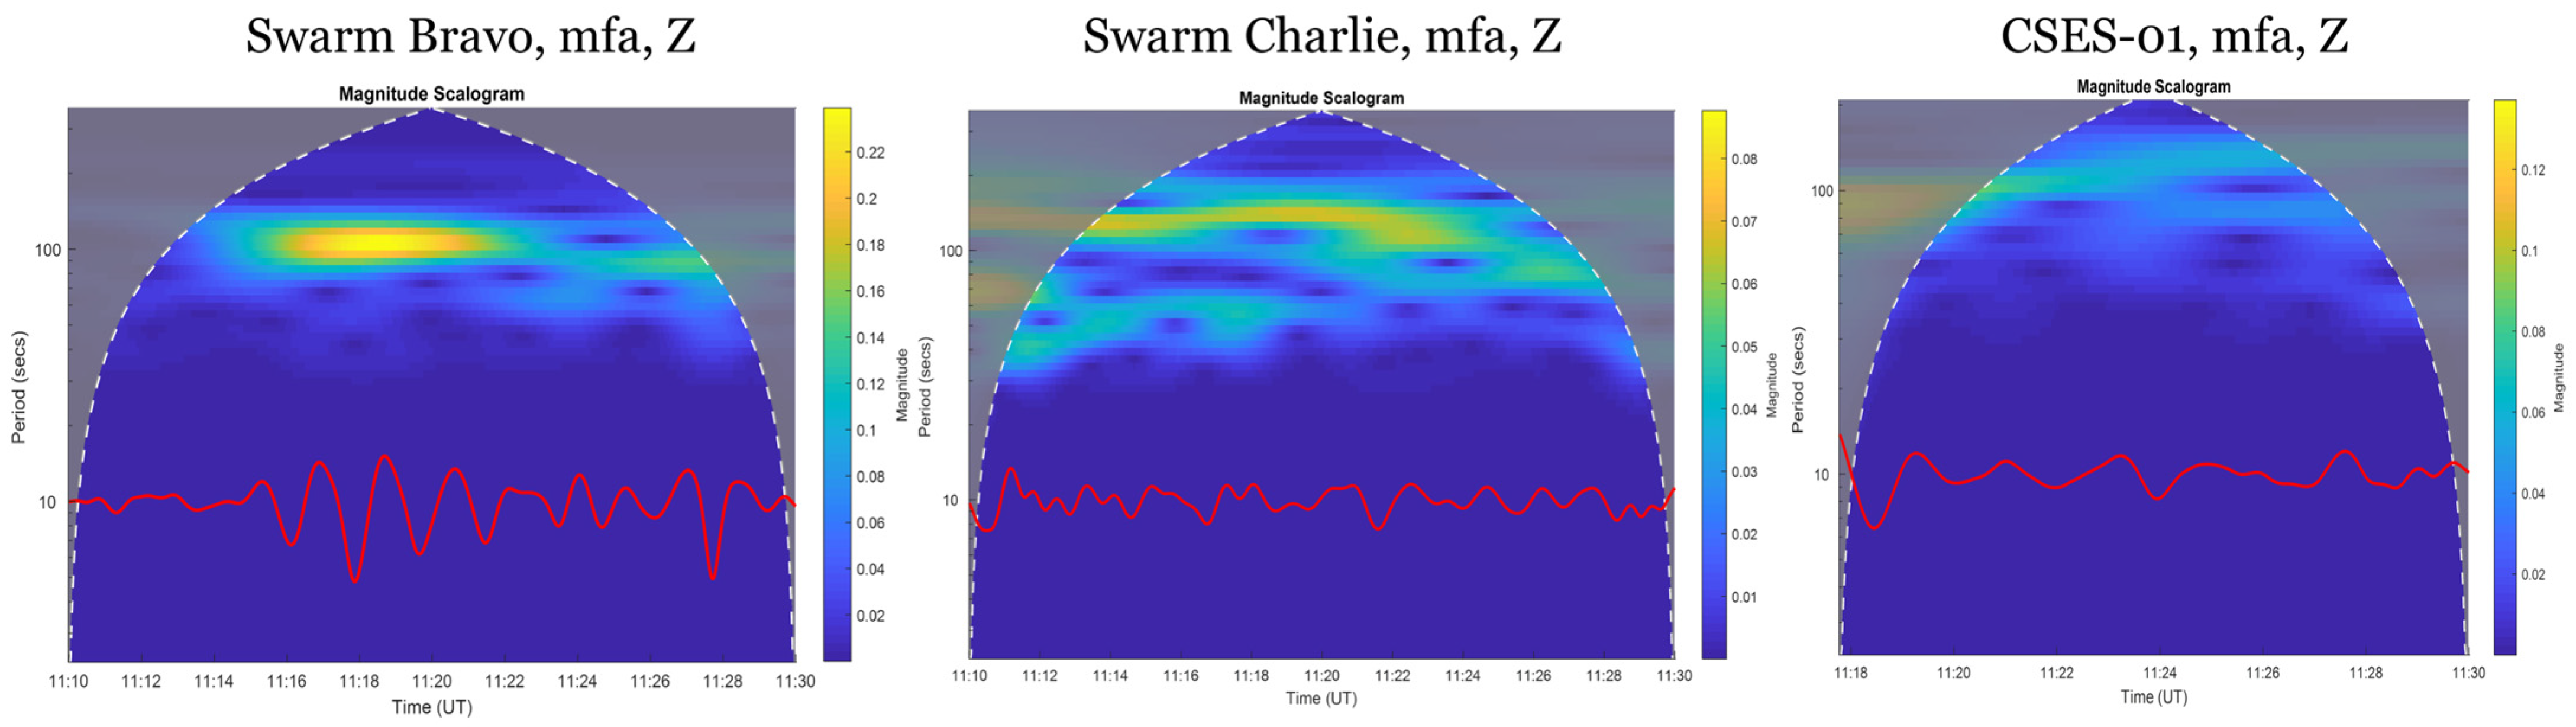
To better investigate the frequency content of the Pi2 pulsation, we have done the scalogram of three selected signals from Figure 3, the vertical component of Swarm Bravo, Charlie and CSES-01, and we show this in Figure 4. It is worth noting that the maximum energy is concentrated in a period of about 100 s. For CSES-01, the signal peak falls outside the cone of confidence. However, the second part of the signal shows very good agreement in frequencies between Swarm Charlie and CSES-01, with the main signal that was split into two distinct parts: one that is slower with about a 100 s period (the same as the main one) and a higher frequency that decreased to about 70 s.
Figure 4.
Scalograms of Swarm Bravo, Charlie and CSES-01 of the mfaZ component. Red line reports the original signal in the time domain superposed to the scalogram for comparison. The parts outside the cone of confidence, defined at 95%, is obscured in grey.
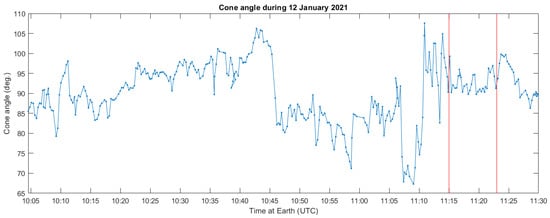
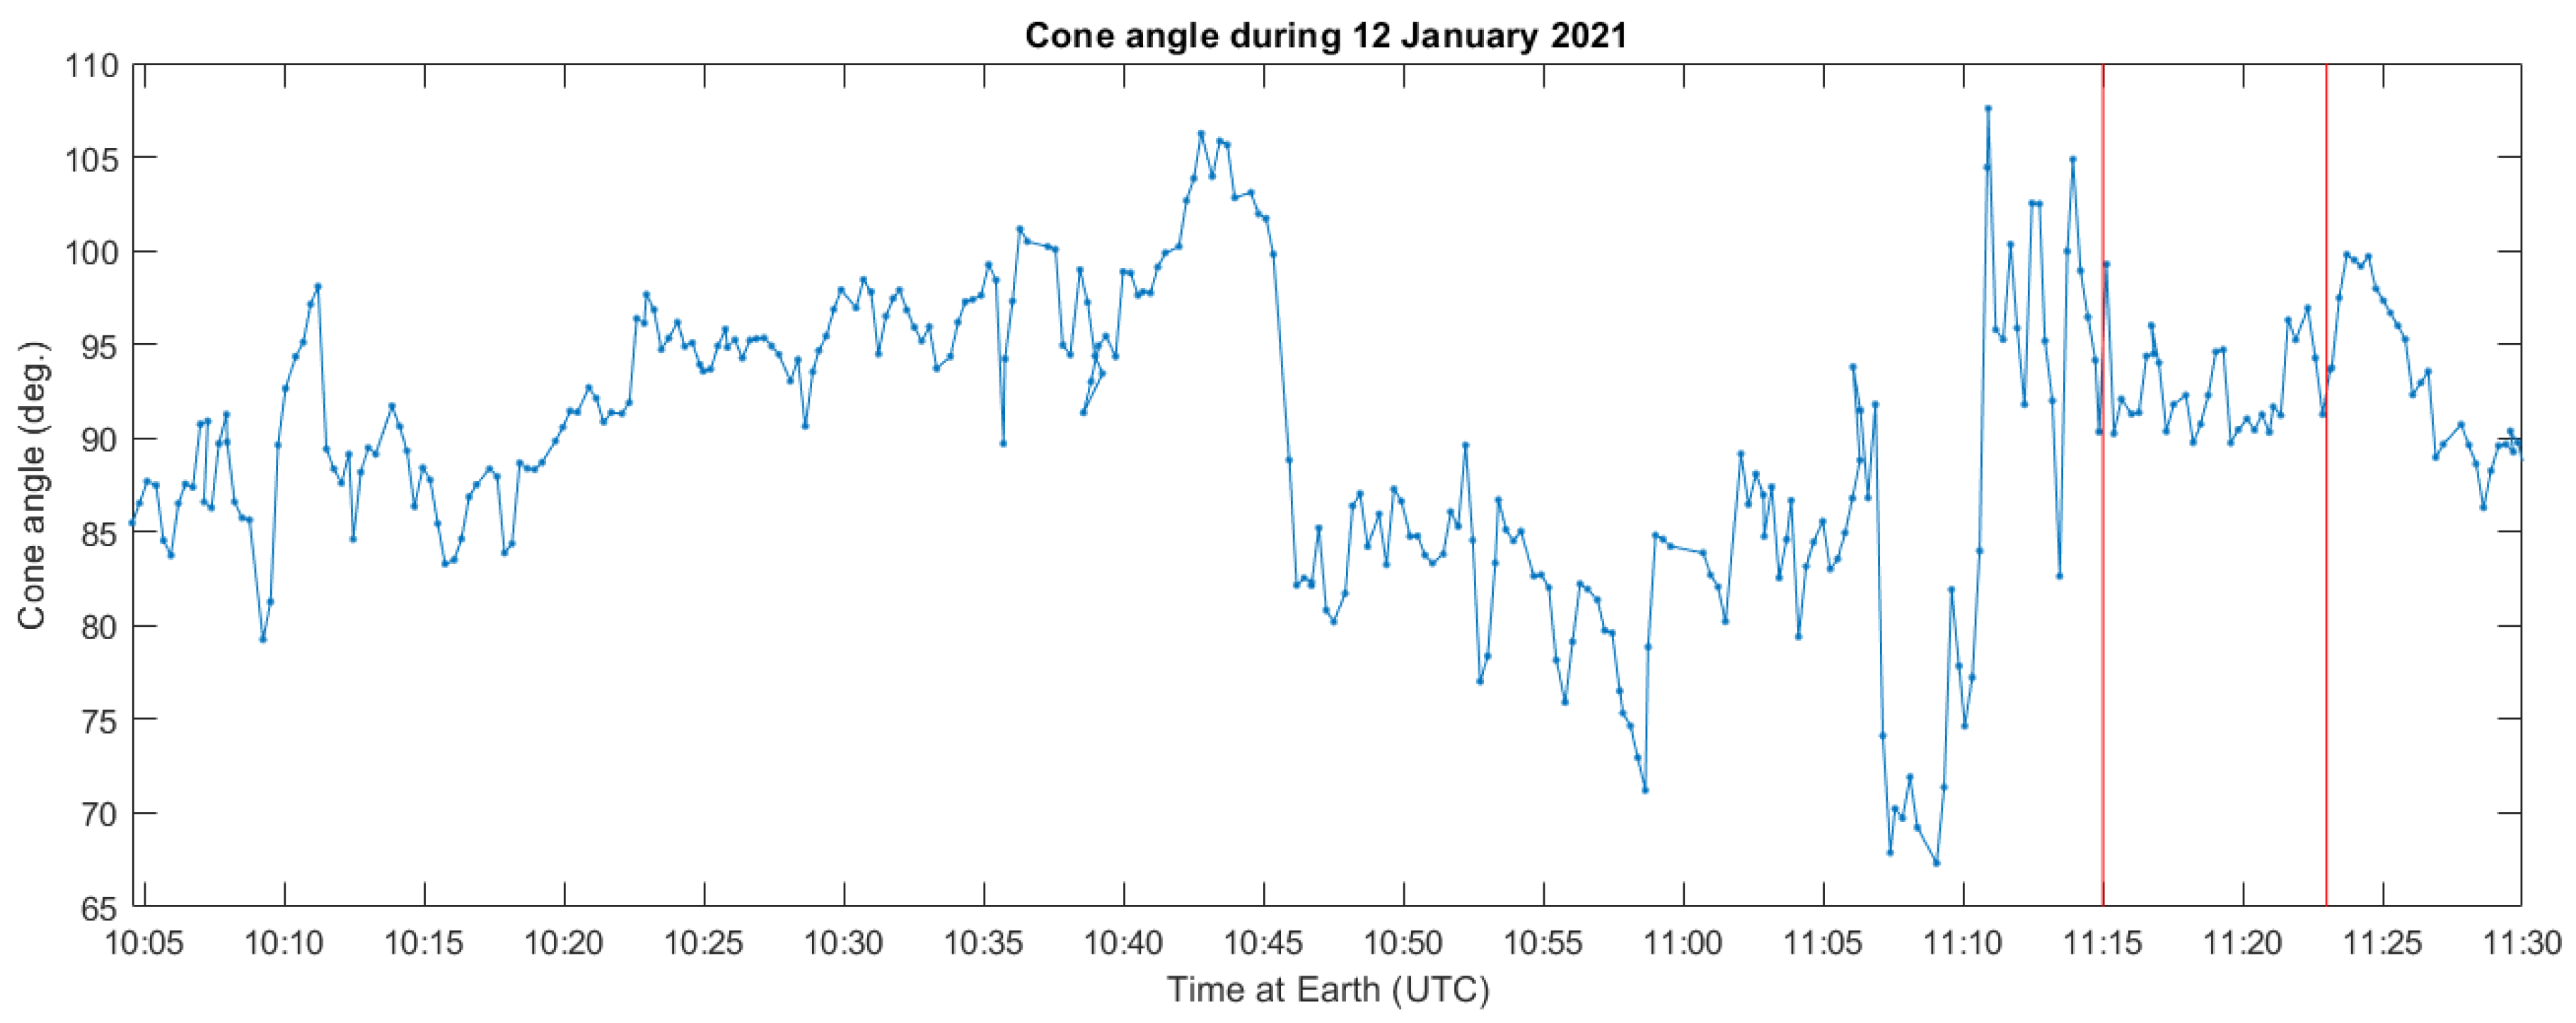
The presence of oscillations in mfa x and y components observed by Swarm Alpha and Charlie before and after the Pi2 event (see Figure 3) suggests the possible detection of a continuous pulsation Pc4 was superposed to the Pi2 event. To further check this hypothesis, we calculated the “cone angle”, i.e., the arccosine of the ratio of the absolute value of IMF BZ over the total intensity of BZ, according to Ghamry [22], and we show it in Figure 5. Noting that the local time of Swarm Alpha and Charlie was on the morning side (~8:18 AM, see Table 1) and that the cone angle is low, the observed oscillation is compatible with a Pc4. The fact that Swarm Bravo detected the Pi2 pulsation very well is also compatible with the fact that it was flying in the night side.
Figure 5.
Cone angle of the IMF during the first Pi2 event of 12 January 2021. The red vertical lines marked the start and end of the Pi2 pulsation.
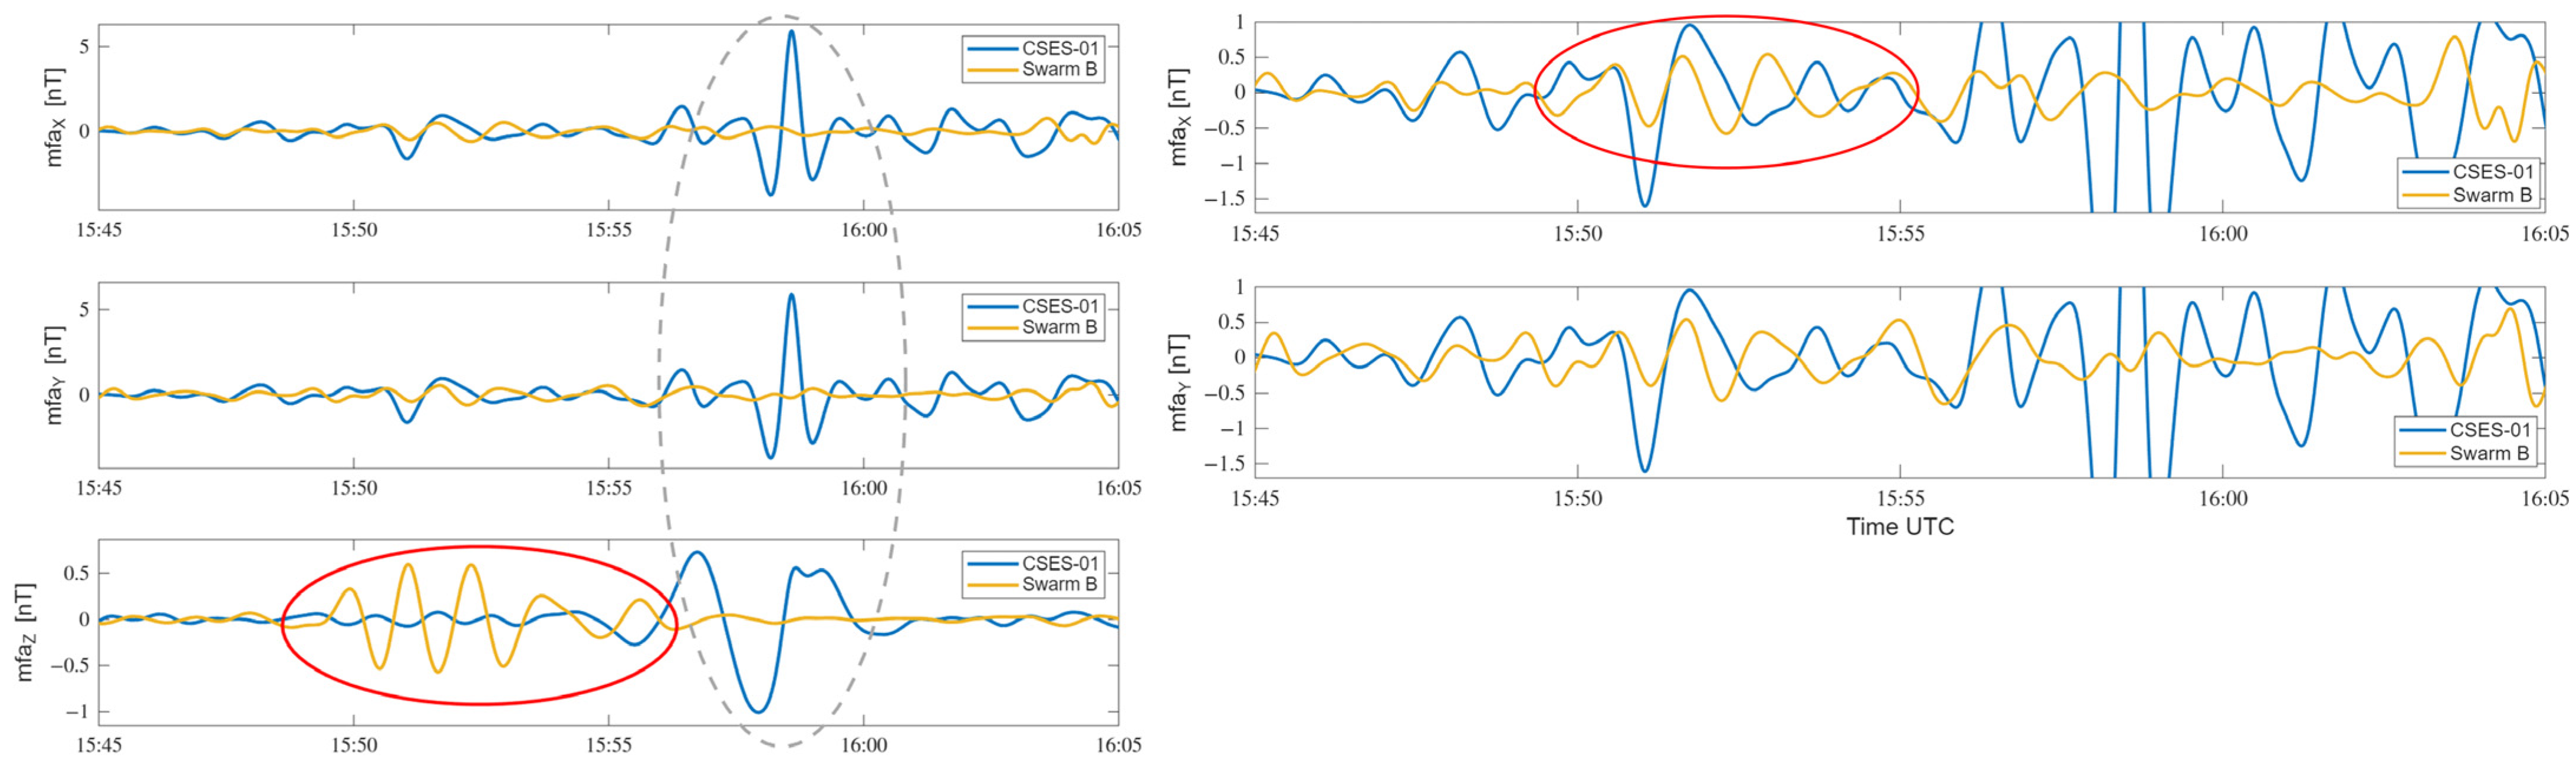
Figure 6 represents the time series signals of our second Pi2 event that we selected on 8 January 2021 at 15:52 UTC. In this case, we show only Swarm Bravo, as Alpha and Charlie were flying in the Southern polar region (see Figure 1), so their data are dominated by other geomagnetic phenomena. CSES-01 showed a signal, depicted by a grey dashed oval, due to satellite operations near the equator, without a geophysical source even though it was real. The Pi2 pulsation is marked by a red oval and is well-depicted by both Swarm Bravo and CSES-01, with perfect synchronicity although in the counterphase (see Table 2 and Supplementary Materials for picking maximum of the signals and corresponding phase shift calculation). The period of the Pi2 extended from 60 s to 90 s as visible in the scalograms in Figure S1 in Supplementary Materials.
Figure 6.
CSES-01 and Swarm Bravo time series of magnetic signal in mfa reference system, filtered in Pi2 frequency range on 8 January 2021 from 15:45 UT to 16:05 UT. The dashed grey oval marked a cross-talk signal from the same satellite. Red oval marks the Pi2 pulsation. On the right side, the X and Y mfa components are replotted using a different vertical scale.
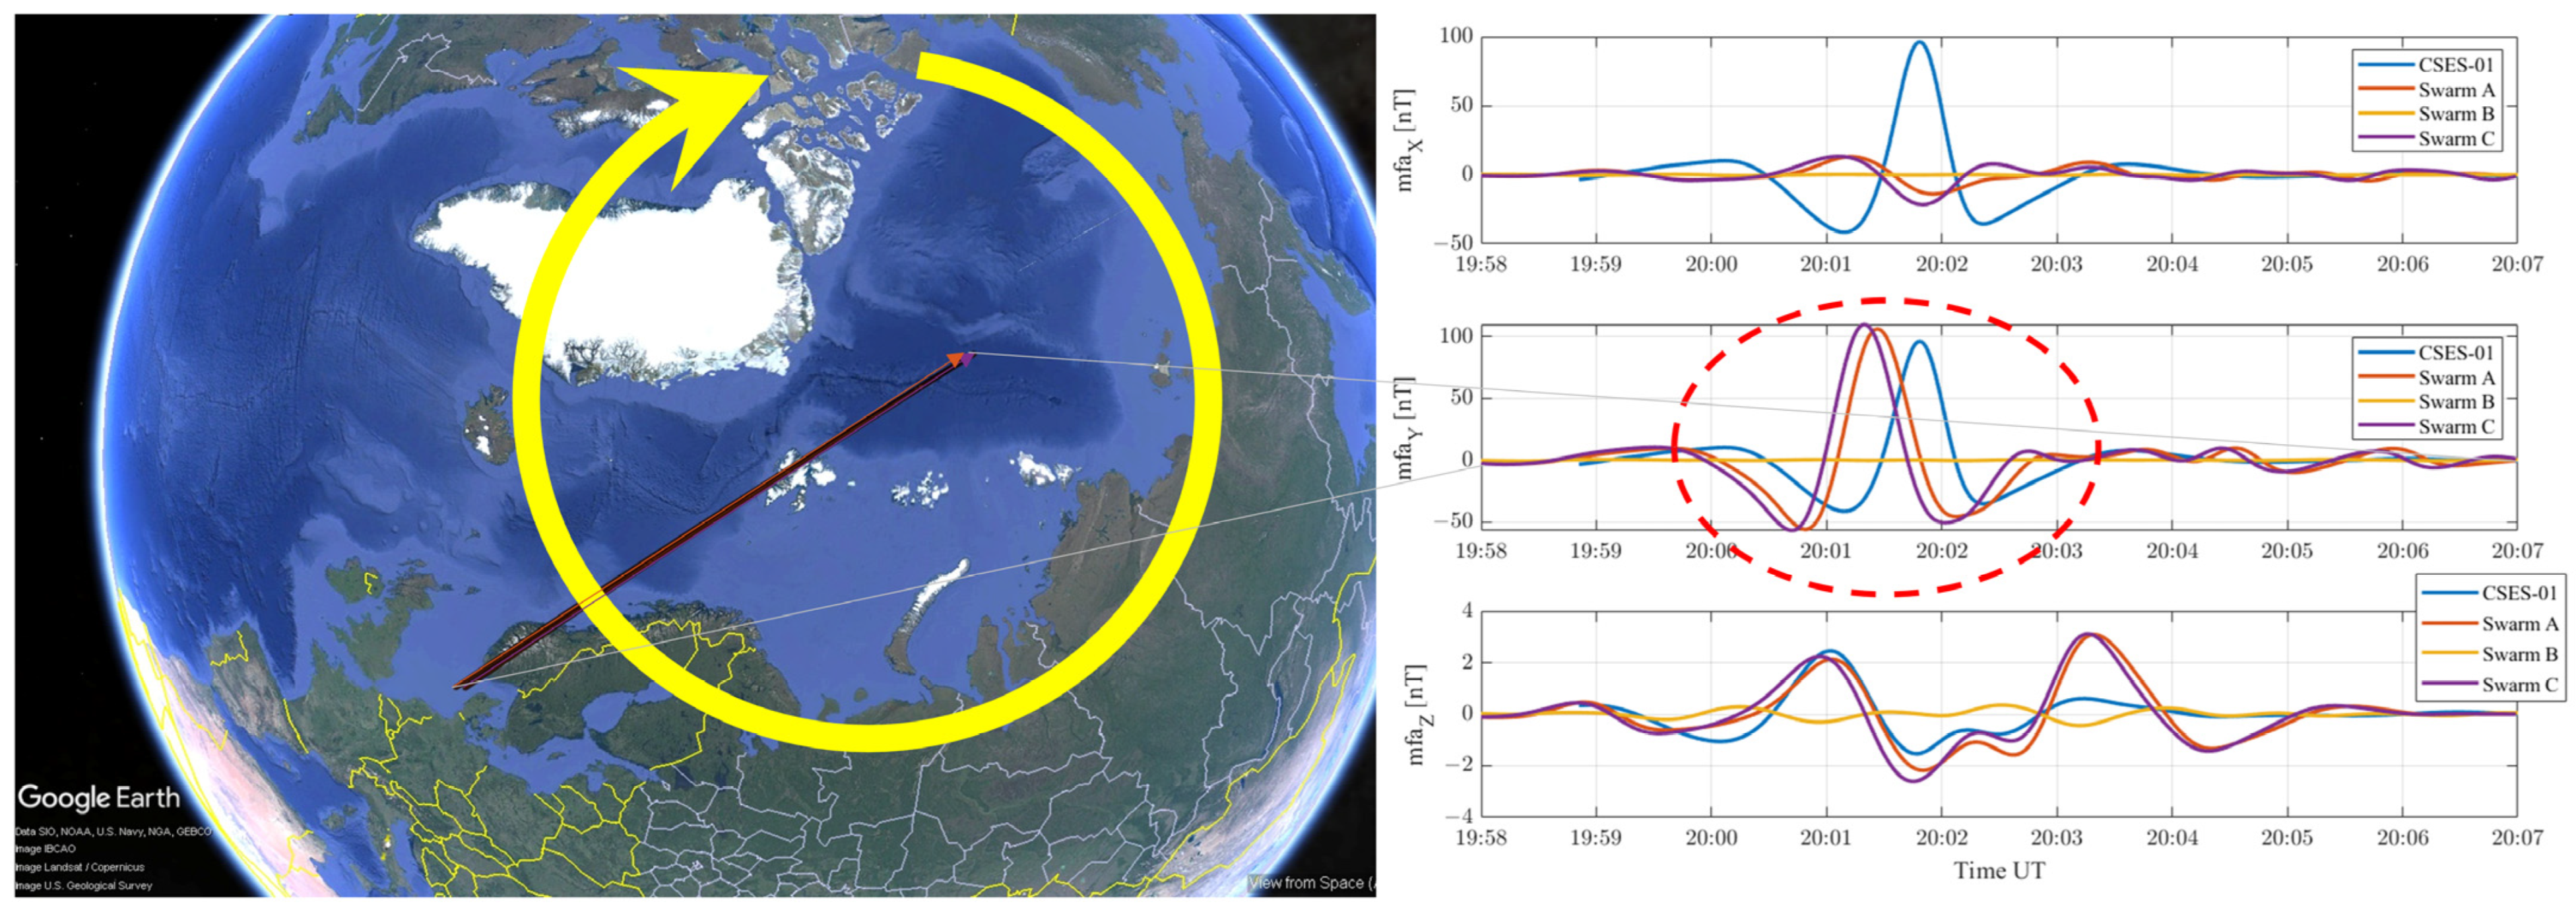
The third event that we selected occurred on 12 January 2021 at about 20:02 UT, and it is the most complex for orbital positions of the satellites (see Figure 1). In fact, Swarm Alpha and Charlie were flying toward the North Pole as is represented in Figure 7. CSES-01 was flying upward from the South Pole (see Figure 1), and Swarm Bravo was crossing the equatorial region. This orbital combination enabled the depiction of Pi2 at different latitudes simultaneously in both hemispheres. However, the most intense signal we observe in Figure 7 is in the mfaY component, with an intensity of about 150 nT, considerably larger than the previously investigated oscillations of the order of 1 or a few nT. In fact, this signal (marked with a red dashed oval in Figure 7) is due to the crossing of the auroral electrojet, a circular current present at both Poles, and we artistically represent it in Figure 7 as a yellow circle with an arrow. It is surprising that CSES-01 depicted the same auroral electrojet in the opposite hemisphere and a similar (slightly smaller) intensity as Swarm Alpha and Charlie. The difference can be due to slightly different current systems in the two hemispheres. This is in agreement with other studies that extensively investigated magnetometers at the North and South Poles to estimate two different auroral electroject indices for the respective poles [23].
Figure 7.
Representation of the third Pi2 event that occurred on 12 January 2021 at 20:02 UT. On the left side, the picture shows the orbital positions of Swarm Alpha and Charlie by arrows (the color is the same as the legend in the right panels), and the yellow circle is a conceptual representation of the auroral electrojet. On the right side, the time series are represented. The red dashed oval marks the signature of crossing the auroral electrojet.
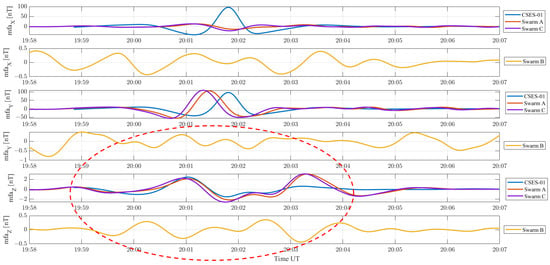
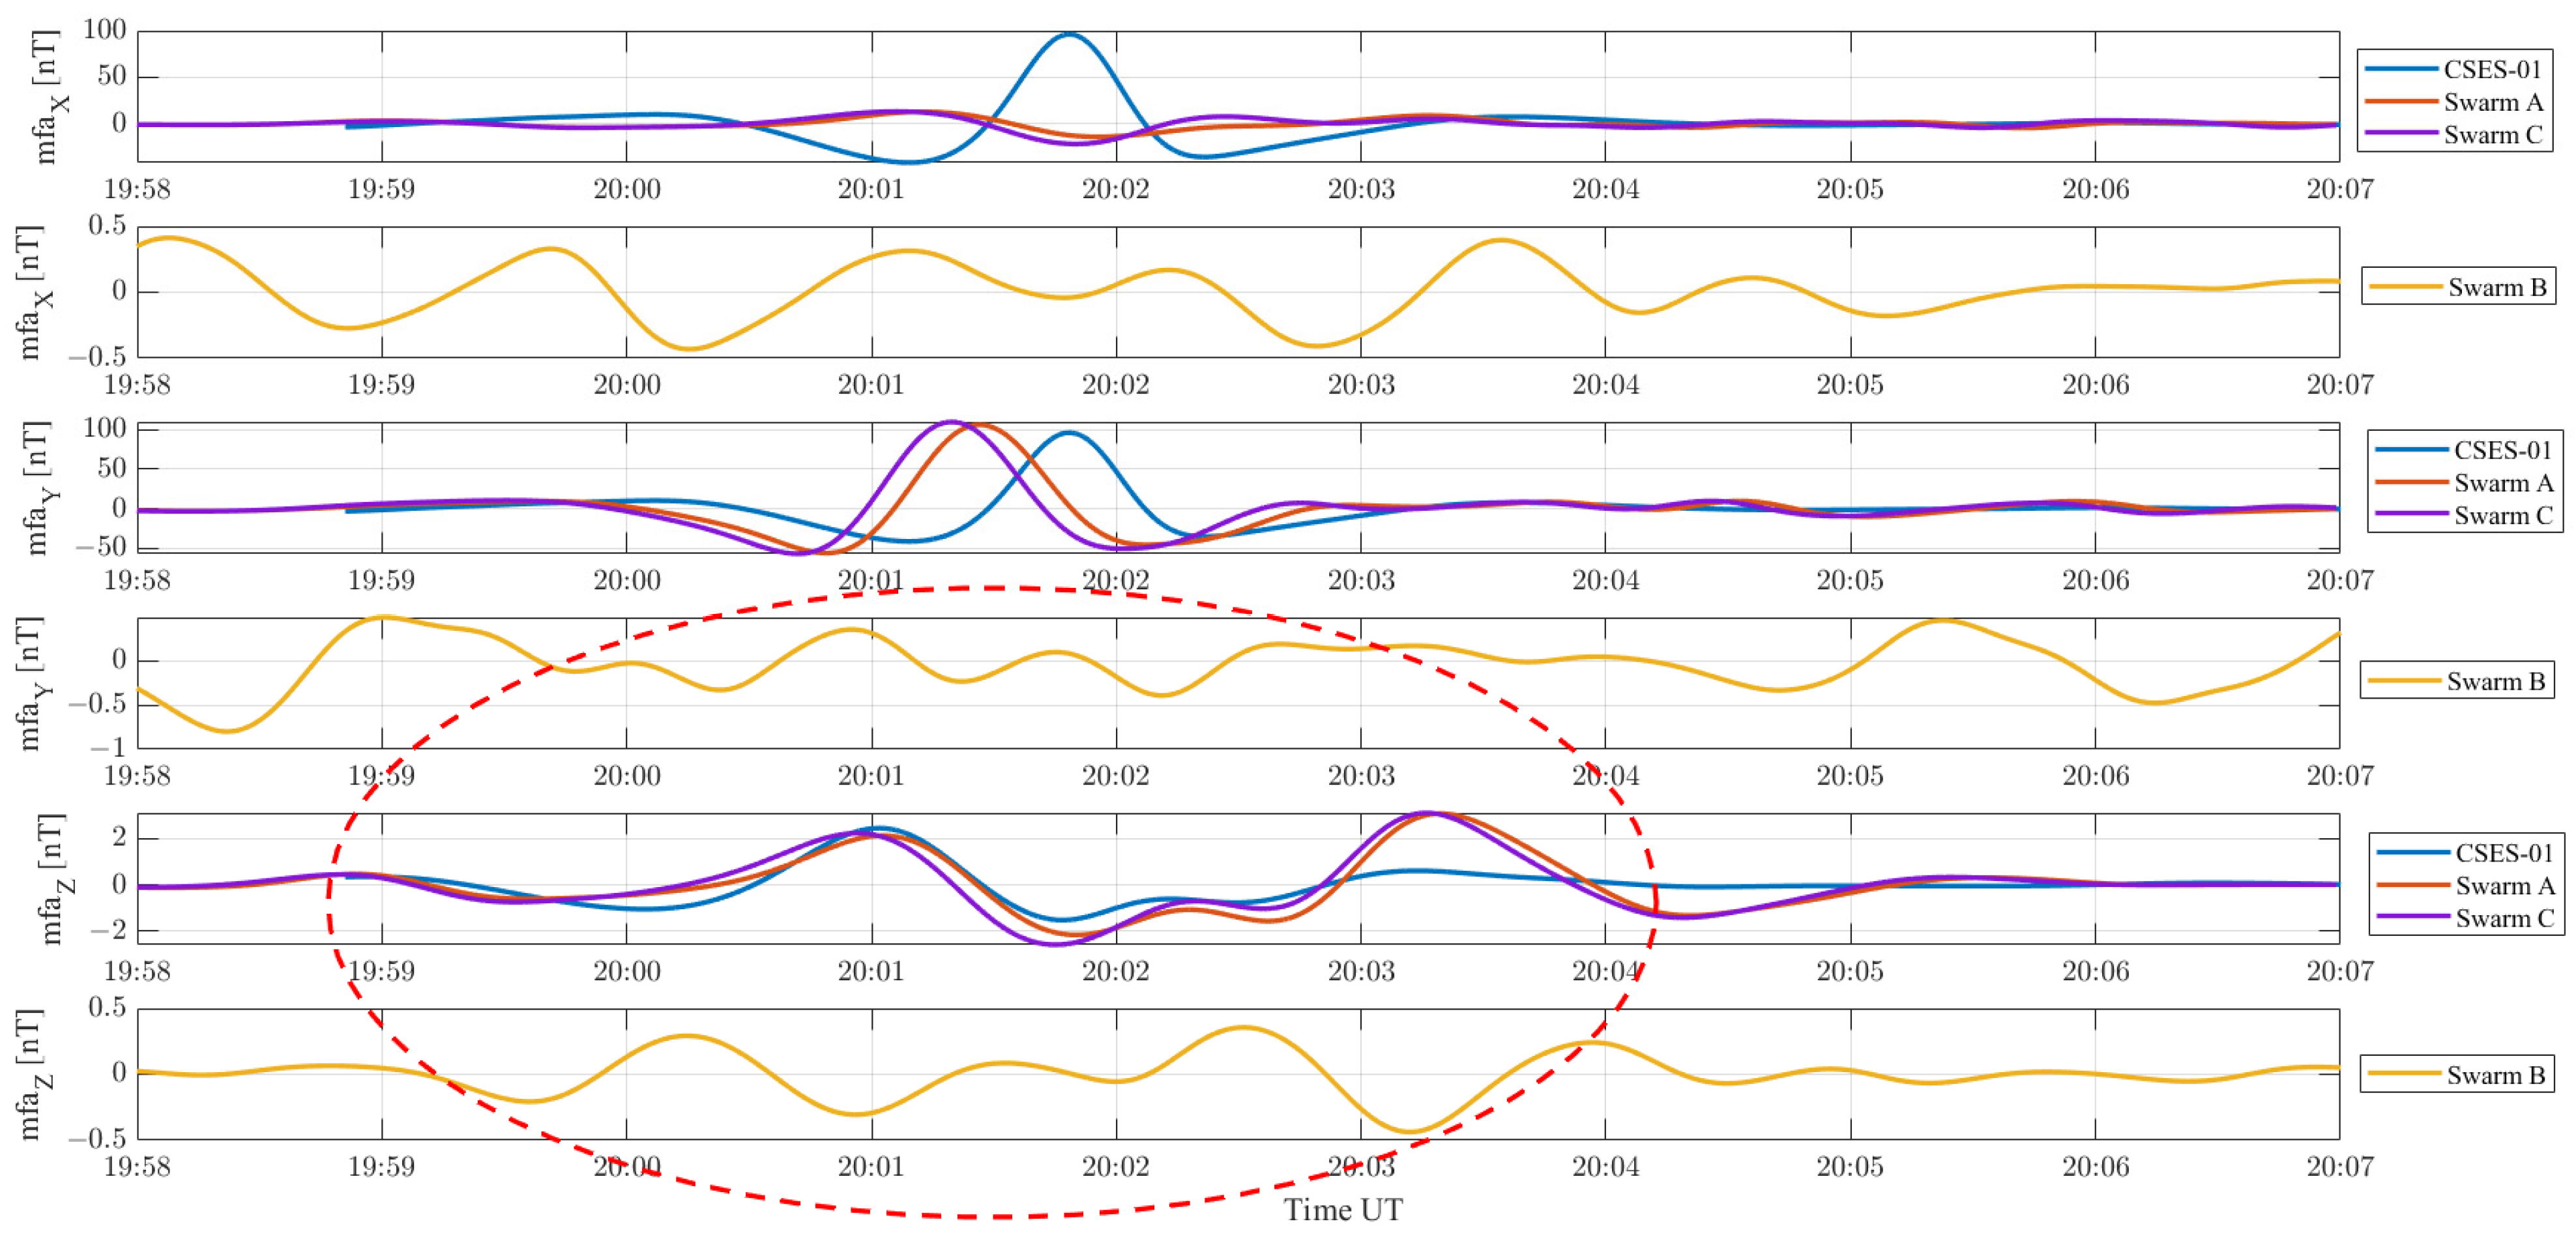
To separate the Pi2 and electrojet signatures, we present in Figure 8 the time series from Swarm Bravo, with a separate panel for each mfa component. We marked the signature of the Pi2 oscillation with a red dashed oval. It is well depicted by the vertical component, with an important difference from the previous cases: this time, the signal was perfectly in phase, and CSES-01 was ascending from the Southern Hemisphere, while Swarm Alpha and Charlie were ascending toward the Northern Hemisphere. On the other hand, Swarm Bravo also depicted the Pi2 signature well (including the mfz Y component, but with a phase shift with respect to the other satellites (see Table 2)). Analysing the scalograms of the four satellites (see Figure S2 in Supplementary Materials), the third Pi2 event is composed of two distinct oscillations with different periods: the faster one with a period of 60–80 s and the slower one with a period of 100–105 s. It is worth noting that the most intense signal is the faster one for Swarm Bravo at the equator, with the slower for the other three satellites orbiting at high latitudes.
Figure 8.
CSES-01 and Swarm Bravo time series of magnetic signal in mfa reference system, filtered in Pi2 frequency range on 12 January 2021 from 19:58 UT to 20:07 UT. The red dashed oval marks the Pi2 event.
5. Discussion and Conclusions
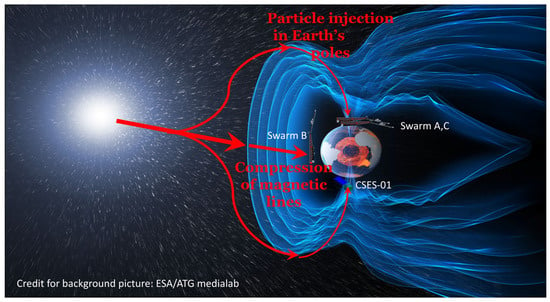
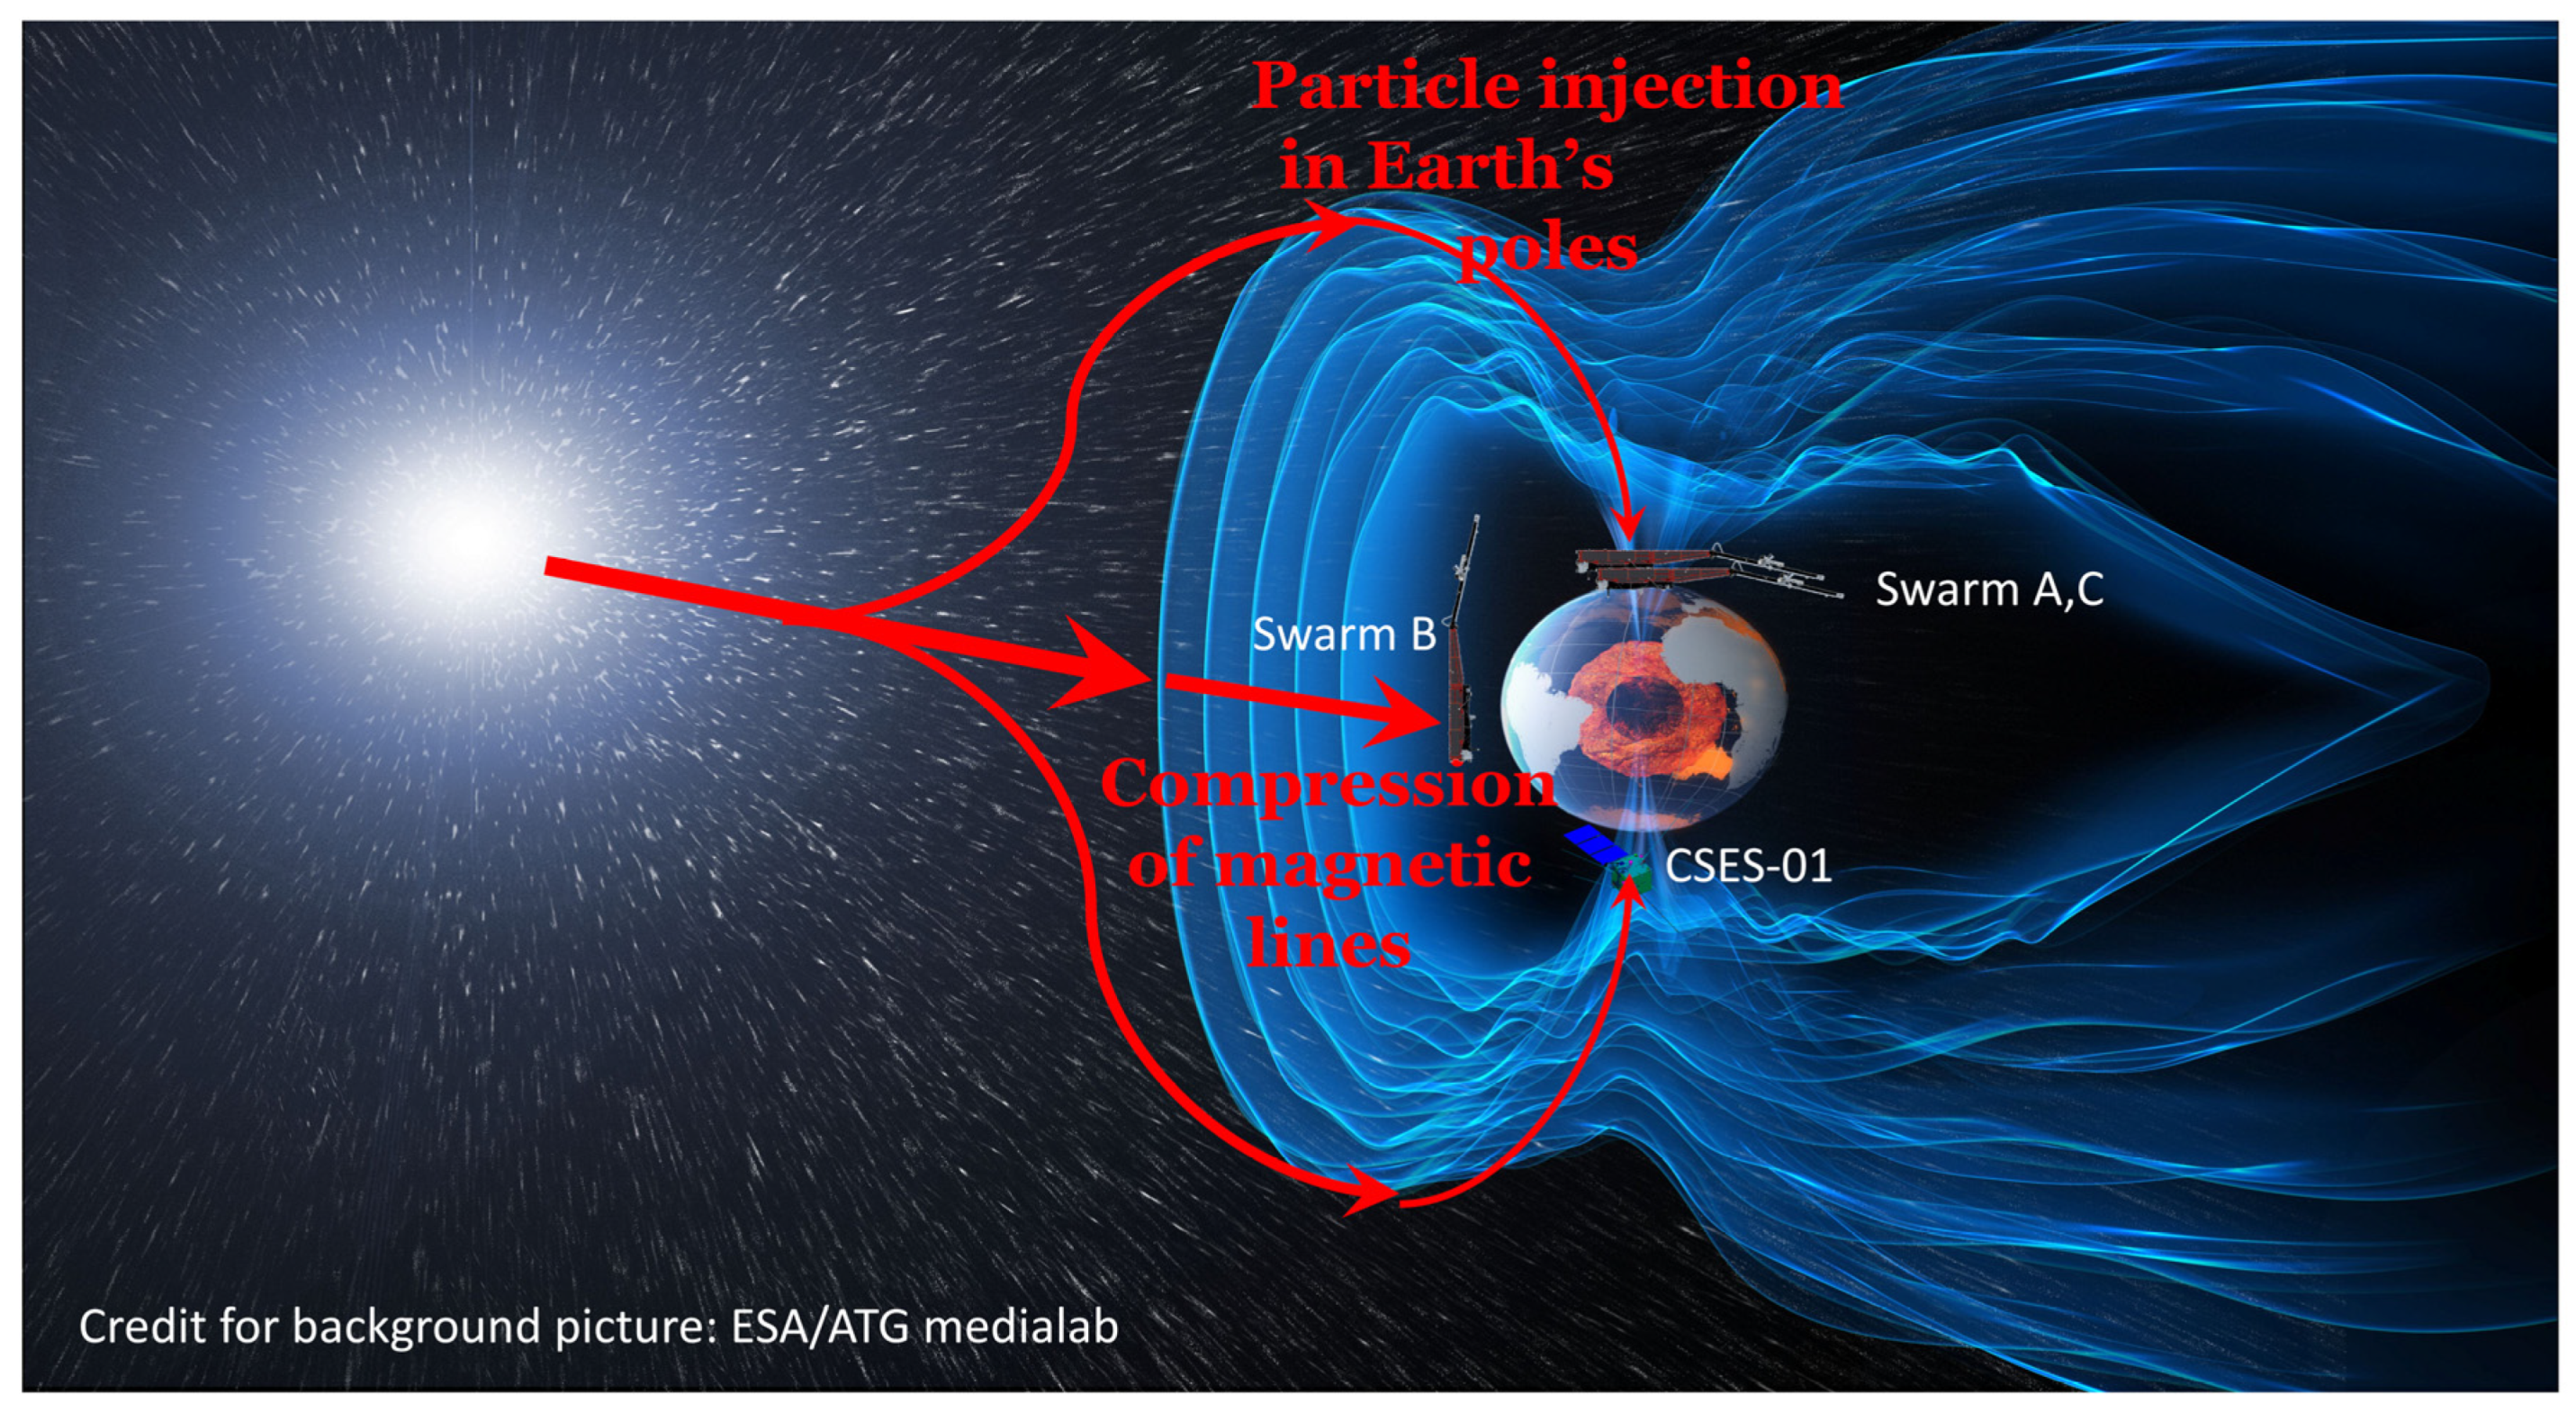
In this work, we investigated three Pi2 events observed by the LEO Swarm and CSESs in opposite hemispheres. Checking the phase of the first event, the BZ mfa components almost show synchronicity, while the horizontal components seem to oscillate in opposite phase between CSES-01 and Swarm Aplha/Charlie, likely due to the satellites’ opposite-hemisphere locations, but their interpretation is not so clear due to a probable superposed continuous Pc4 oscillation (see Figure 3 and Figure 5). An opposite phase was detected in the second Pi2 event. This could be explained as the phenomenon was depicted at a lower latitude by CSES-01 in the Northern Hemisphere and Swarm Bravo in the Southern one. This is in agreement with the third case where the satellites showed a very slight phase shift at high orbits, while Swarm Bravo showed a larger phase shift closer to the equator. The common detection from CSES-01 and Swarm enables us to investigate the impact of geomagnetic pulsations on the ionosphere, which is strongly influenced by Earth’s geomagnetic activity. We tried to depict the phenomena in Figure 9, where it is possible to see the driver of the geomagnetic activity, which is the Sun, that irradiates solar wind in outer space. Then, in proximity with Earth’s magnetic field, the solar wind deviated (because it is mainly composed of positively charged alpha particles). An increase in the solar wind can, at the same time, compress the geomagnetic field lines at the equatorial region, and we proposed that this is the source of oscillations depicted by Swarm Bravo in Figure 8, as well as the injection of particles at high latitude producing the oscillations in Figure 8 depicted by Swarm Alpha and Charlie in the North Pole and CSES-01 in the South Pole.
Figure 9.
Artistic picture showing the impact of solar wind on Earth’s geomagnetic environment. The red lines represent the streams of charged particles that, based on the analysis of this work, are suggested to produce the Pi2 perturbations detected by the four investigated satellites shown in approximate positions as the events occurred on 12 January 2021 at 19:58–20:07 UT. The background picture credit is ESA/ATG medialab and provided under ESA Copyright ©ESA.
The main conclusions of this work are that magnetic data from the Swarm mission and China Seismo-Electromagnetic Satellite (CSES-01) show similar residuals at the level of a few nanoTeslas. Consequently, data quality is good, and data from both missions are reliable for scientific purposes. Furthermore, combining multi-satellite and missions flying in different hemispheres at the same time allows us to better study the impact of geomagnetic pulsations on the Earth’s geomagnetic environment. Swarm and CSES missions have optimal orbital combinations for this purpose.
Regarding the Pi2 scientific investigation, we noted that data closer to the equator are more prone to detecting smaller Pi2 oscillations. However, it is possible to detect some effects at high latitudes as well, probably related to particle precipitation. Pi2 from Swarm and CSES shows synchronicity and the same oscillation periodicity in both hemispheres, but they are generally counterphase.
Supplementary Materials
The following supporting information can be downloaded at: https://www.mdpi.com/article/10.3390/engproc2026124060/s1, Figure S1: Scalograms of the mfa BZ on 8 January 2021; Figure S2: Scalograms of the mfa BZ on 12 January 2021 19:55–20:07 UT; Figures S3–S8: Calculus of phase shift by fitting sinusoidal wave; Figures S9–S13: Fit of the third Pi2 event with fixed period; Table S1: Calculus of the phase differences using the maximum of the Pi2 oscillations on 8 January 2021.
Author Contributions
Conceptualization, methodology, formal analysis, investigation, data curation, E.G. and D.M.; software, writing—original draft preparation, visualization D.M.; validation, resources, supervision, project administration, E.G. and D.B.; writing—review and editing, D.M., E.G. and D.B. All authors have read and agreed to the published version of the manuscript.
Funding
This research received no external funding.
Institutional Review Board Statement
Not applicable.
Informed Consent Statement
Not applicable.
Data Availability Statement
Swarm data are freely available via FTP and HTTP at swarm-diss.eo.esa.int server (last accessed 24 January 2026) upon free registration. China Seismo-Electromagnetic Satellite data are freely available at https://www.leos.ac.cn/#/home (last accessed 24 January 2026) upon registration and approval. Solar wind speed and IMF magnetic data were retrieved from the ACE Science Center and are freely available at https://izw1.caltech.edu/ACE/ASC/index.htm (last access 11 February 2026). The AE index was obtained from the Geomagnetic Data Service, WDC Kyoto: https://wdc.kugi.kyoto-u.ac.jp/aeasy/index.html (last access: 11 February 2026).
Acknowledgments
The authors acknowledge ISSI/ISSI-BJ for supporting the International Team 553 “CSES and Swarm Investigation of the Generation Mechanisms of Low Latitude Pi2 Waves” led by Essam Ghamry and Zeren Zhima. E.G. thanks the Ministry of Higher Education and Scientific Research of the Arab Republic of Egypt for providing him a fellowship for visiting ISEE, Nagoya University, Japan. D.M. and D.B. acknowledge EPOS-MUR initiative. We acknowledge Guido Ventura for scientific discussion.
Conflicts of Interest
The authors declare no conflicts of interest.
Abbreviations
The following abbreviations are used in this manuscript:
| LEO | Low Earth Orbit |
| ASM | Absolute Scalar Magnetometer |
| VFM | Vector Field Magnetometer |
| CSES | China Seismo-Electromagnetic Satellite |
| mfa | Mean field-aligned (coordinate system referred to magnetic field direction) |
| UT/UTC | Universal Time Clock |
References
- Danilov, A.D.; Lastovička, J. Effects of Geomagnetic Storms on the Ionosphere and Atmosphere. Int. J. Geomagn. Aeron. 2001, 2, 209–224. [Google Scholar]
- McPherron, R.L. Magnetic Pulsations: Their Sources and Relationto Solar Wind and Geomagnetic Activity. Surv. Geophys. 2005, 26, 545–592. [Google Scholar] [CrossRef] [Scilit]
- Fujita, S.; Tanaka, T. Possible Generation Mechanisms of the Pi2 Pulsations Estimated from a Global MHD Simulation. Earth Planets Space 2013, 65, 453–461. [Google Scholar] [CrossRef] [Scilit]
- Katsavrias, C.; Raptis, S.; Daglis, I.A.; Karlsson, T.; Georgiou, M.; Balasis, G. On the Generation of Pi2 Pulsations Due to Plasma Flow Patterns Around Magnetosheath Jets. Geophys. Res. Lett. 2021, 48, e2021GL093611. [Google Scholar] [CrossRef] [Scilit]
- Hawash, I.; Ghamry, E.; Samwel, S.W.; Yousef Omar, M.; El-Desoky, H. Investigation of Non-Substorm Pi2 Magnetic Pulsation during Solar Flare Event. Astrophys. Space Sci. 2024, 369, 113. [Google Scholar] [CrossRef] [Scilit]
- Takahashi, K.; Lysak, R.; Majmudar, K. Relationship Between Low-Latitude Pi2 Pulsations and Cavity Mode Oscillations. J. Geophys. Res. Space Phys. 2024, 129, e2024JA032858. [Google Scholar] [CrossRef] [Scilit]
- Abdalzaher, M.S.; Ghamry, E.; Yusof, K.A.; Shaaban, M. Toward Automatic Detection of Pi2 Magnetic Pulsation Using Machine Learning. IEEE Access 2025, 13, 109828–109839. [Google Scholar] [CrossRef] [Scilit]
- Wood, A.G.; Alfonsi, L.; Clausen, L.B.N.; Jin, Y.; Spogli, L.; Urbář, J.; Rawlings, J.T.; Whittaker, I.C.; Dorrian, G.D.; Høeg, P.; et al. Variability of Ionospheric Plasma: Results from the ESA Swarm Mission. Space Sci. Rev. 2022, 218, 52. [Google Scholar] [CrossRef] [Scilit]
- Martines-Bedenko, V.A.; Pilipenko, V.A.; Fedorov, E.N.; Nahayo, E.; Yizengaw, E. Low-Latitude Pi2 Waves According to Observations on SWARM Satellites and Ground Stations. Cosm. Res. 2020, 58, 1–11. [Google Scholar] [CrossRef] [Scilit]
- Ghamry, E.; Marchetti, D.; Yoshikawa, A.; Uozumi, T.; De Santis, A.; Perrone, L.; Shen, X.; Fathy, A. The First Pi2 Pulsation Observed by China Seismo-Electromagnetic Satellite. Remote Sens. 2020, 12, 2300. [Google Scholar] [CrossRef] [Scilit]
- Friis-Christensen, E.; Lühr, H.; Knudsen, D.; Haagmans, R. Swarm—An Earth Observation Mission Investigating Geospace. Adv. Space Res. 2008, 41, 210–216. [Google Scholar] [CrossRef] [Scilit]
- Shen, X.; Zong, Q.-G.; Zhang, X. Introduction to Special Section on the China Seismo-Electromagnetic Satellite and Initial Results. Earth Planet. Phys. 2018, 2, 439–443. [Google Scholar] [CrossRef] [Scilit]
- Lagoutte, D.; Brochot, J.Y.; de Carvalho, D.; Elie, F.; Harivelo, F.; Hobara, Y.; Madrias, L.; Parrot, M.; Pinçon, J.L.; Berthelier, J.J.; et al. The DEMETER Science Mission Centre. Planet. Space Sci. 2006, 54, 428–440. [Google Scholar] [CrossRef] [Scilit]
- Zhou, B.; Cheng, B.; Gou, X.; Li, L.; Zhang, Y.; Wang, J.; Magnes, W.; Lammegger, R.; Pollinger, A.; Ellmeier, M.; et al. First In-Orbit Results of the Vector Magnetic Field Measurement of the High Precision Magnetometer Onboard the China Seismo-Electromagnetic Satellite. Earth Planets Space 2019, 71, 119. [Google Scholar] [CrossRef] [Scilit]
- Marchetti, D.; De Santis, A.; Shen, X.; Campuzano, S.A.; Perrone, L.; Piscini, A.; Di Giovambattista, R.; Jin, S.; Ippolito, A.; Cianchini, G.; et al. Possible Lithosphere-Atmosphere-Ionosphere Coupling Effects Prior to the 2018 Mw = 7.5 Indonesia Earthquake from Seismic, Atmospheric and Ionospheric Data. J. Asian Earth Sci. 2020, 188, 104097. [Google Scholar] [CrossRef] [Scilit]
- Marchetti, D.; Zhu, K.; Piscini, A.; Ghamry, E.; Shen, X.; Yan, R.; He, X.; Wang, T.; Chen, W.; Wen, J.; et al. Changes in the Lithosphere, Atmosphere, and Ionosphere before and during the Mw = 7.7 Jamaica 2020 Earthquake. Remote Sens. Environ. 2024, 307, 114146. [Google Scholar] [CrossRef] [Scilit]
- Zhima, Z.; Yan, R.; Lin, J.; Wang, Q.; Yang, Y.; Lv, F.; Huang, J.; Cui, J.; Liu, Q.; Zhao, S.; et al. The Possible Seismo-Ionospheric Perturbations Recorded by the China-Seismo-Electromagnetic Satellite. Remote Sens. 2022, 14, 905. [Google Scholar] [CrossRef] [Scilit]
- Yang, Y.; Zhou, B.; Hulot, G.; Olsen, N.; Wu, Y.; Xiong, C.; Stolle, C.; Zhima, Z.; Huang, J.; Zhu, X.; et al. CSES High Precision Magnetometer Data Products and Example Study of an Intense Geomagnetic Storm. JGR Space Phys. 2021, 126, e2020JA028026. [Google Scholar] [CrossRef] [Scilit]
- Spogli, L.; Sabbagh, D.; Regi, M.; Cesaroni, C.; Perrone, L.; Alfonsi, L.; Di Mauro, D.; Lepidi, S.; Campuzano, S.A.; Marchetti, D.; et al. Ionospheric Response Over Brazil to the August 2018 Geomagnetic Storm as Probed by CSES-01 and Swarm Satellites and by Local Ground-Based Observations. JGR Space Phys. 2021, 126, e2020JA028368. [Google Scholar] [CrossRef] [Scilit]
- Davis, C.J.; Wild, M.N.; Lockwood, M.; Tulunay, Y.K. Ionospheric and Geomagnetic Responses to Changes in IMF BZ: A Superposed Epoch Study. Ann. Geophys. 1997, 15, 217–230. [Google Scholar] [CrossRef] [Scilit]
- Takahashi, K.; Lysak, R.; Vellante, M. Statistical Analysis of Pi2 Pulsations Observed by Van Allen Probes. J. Geophys. Res. Space Phys. 2022, 127, e2022JA030674. [Google Scholar] [CrossRef] [Scilit]
- Ghamry, E. Morningside Pi2 Pulsation Observed in Space and on the Ground. J. Astron. Space Sci. 2015, 32, 305–310. [Google Scholar] [CrossRef] [Scilit]
- Boudouridis, A.; Weygand, J.M.; Zesta, E. Statistical Comparison of Southern and Northern Auroral Electrojet Indices as a Function of Solar Wind and IMF Conditions. J. Geophys. Res. Space Phys. 2024, 129, e2023JA032362. [Google Scholar] [CrossRef] [Scilit]

Disclaimer/Publisher’s Note: The statements, opinions and data contained in all publications are solely those of the individual author(s) and contributor(s) and not of MDPI and/or the editor(s). MDPI and/or the editor(s) disclaim responsibility for any injury to people or property resulting from any ideas, methods, instructions or products referred to in the content. |
© 2026 by the authors. Licensee MDPI, Basel, Switzerland. This article is an open access article distributed under the terms and conditions of the Creative Commons Attribution (CC BY) license.