


Abstract
Thyroid cancer is the most common type of endocrine cancer. Most cases are called differentiated thyroid cancer (DTC), which includes papillary, follicular, and hurthle cell types. DTC usually grows slowly and has a good prognosis, especially when found early and treated with surgery, radioactive iodine, and thyroid hormone therapy. However, cancer can come back sometimes even years after treatment. This recurrence can appear as abnormal blood tests or as lumps in the neck or other parts of the body. Being able to predict and detect these recurrences early is important for improving patient care and planning follow-up treatment. In this view, this research explores different machine learning algorithms and neural networks to effectively predict DTC recurrence. A total of 17 classifiers were utilized for the experiment, namely, logistic regression, random forest, k-nearest neighbours, Gaussian naïve Bayes, multi-layered perceptron, extreme gradient boosting, adaptive boosting, gradient boosting classifier, extra tree classifier (ETC), light gradient boosting machine, categorical boosting, Bernoulli naïve Bayes, complement naïve Bayes, multinomial naïve Bayes, histogram-based gradient boosting, and nearest centroid, followed by building an artificial neural network. Among the classifiers, ETC performed best with 95.3% accuracy, 95.1% precision, 87.92% recall, 98.18% specificity, 91.21% F1-score, 98.84% AUROC and 97.66% AUPRC on the first dataset, and 99.47% accuracy, 94.83% precision, 98.62% sensitivity, 99.54% specificity, 96.65% F1-score, 99.95% AUROC, and 99.37% AUPRC on the second dataset. To improve model interpretability, Shapley Additive Explanations (SHAP) was also used to explain the contribution of each clinical feature to the model’s predictions, allowing for transparent, patient-specific insights into which factors were most important for predicting recurrence, thereby supporting the proposed model’s clinical relevance.
1. Introduction
Differentiated Thyroid Cancer (DTC) includes papillary, follicular, and hurthle cell variants and accounts for the majority of cases. Although DTC is an indolent disease with favourable survival rates, recurrence remains a significant clinical problem. Despite progress in surgical approaches and radioactive iodine therapy (RAI), DTC recurrence continues to pose clinical challenges. Recurrence usually results from microscopic residual disease present at initial treatment that evades detection, biologically aggressive tumour subtypes, and tumour cells with variable iodine avidity. Extrathyroidal extension, lymph node metastases, less-than-adequate surgical resection, and multifocal tumours increase the risk of disease recurrence years or even decades later. Additionally, it is difficult to predict long-term outcomes based on routine clinical assessment only, as the responses of individual patients to RAI vary according to tumour heterogeneity and genetic alterations and differences in thyroid-stimulating hormone (TSH) suppression. Since such small risk factors accumulate over time, recurrence may occur frequently and insidiously without early clinical manifestations. This indicates the need for improved strategies that might identify individuals who are at high risk before the clinical appearance of recurrence.
The early detection of recurrence provides the opportunity to control risk in time, but there is an emerging need for a dependable system that would assist doctors in predicting recurrence trajectories based on already-available clinical parameters. Recent research has investigated the association of DTC with underlying endocrine or autoimmune diseases. Observations of the prognostic differences in patients with concomitant Graves’ disease have pointed out the subtleties of recurrence patterns and the need for improved methods of risk stratification. Again, the meta-analysis of results points to how differences in outcome remain poorly understood due to diverse clinical manifestations and poor predictive models [1]. Although this research showed just how difficult the prediction of recurrence is, many current approaches depend upon routine clinical tests, which might not fully expose nonlinear associations or mild interactions between patient variables.
Artificial Intelligence (AI) has indeed been progressively transforming healthcare. Explainable AI shows the necessity of being transparent for medical decision-support tools. Instead of having clinicians rely on “black-box” models, they need systems that can interpret, understand, and be trusted [2]. AI-based diagnostic systems have shown great potential in many aspects, such as in predicting heart disease [3], for detecting chronic kidney disease [4], and in supporting AI-enabled healthcare infrastructures [5]. Collectively, these studies showcased how Machine Learning (ML) has helped to enhance diagnostic accuracy and smooth clinical workflows. The generalizability of findings across different datasets is an area where most studies have continuously failed. Other deficits include the limited emphasis placed on the interpretability of predictions and a focused lack on the prediction of disease recurrence in cancer-related studies. Although these findings support the potential of ML for medical diagnosis, they highlight certain consistent gaps, viz., a minimal focus on long-term disease recurrence and a lack of emphasis on personalized reasons of predictions, which are considered important in developing clinically deployable tools.
The rest of the paper is structured as follows: Section 2 summarizes the existing literature on DTC recurrence. Section 3 covers data pre-processing and describes the experimental setup; Section 4 reports the results of the experiment, both with regard to the performance of the different models and the SHAP analysis. Conclusions and future research directions are outlined in Section 5.
2. Literature Review
Recent progress in ML and DL has spurred efforts to improve both the diagnosis and recurrence prediction of thyroid cancer. The studies summarized in Table 1 highlight how researchers have shifted toward interpretable and clinically aligned modelling tactics, focusing on feature selection, multimodal integration, and explainability.
Table 1.
Summary of the recent literature on DTC.
3. Methodology
3.1. Data Preprocessing
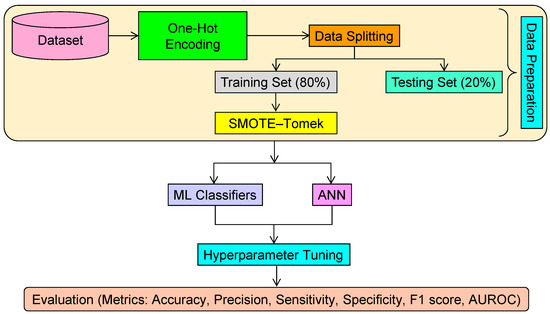
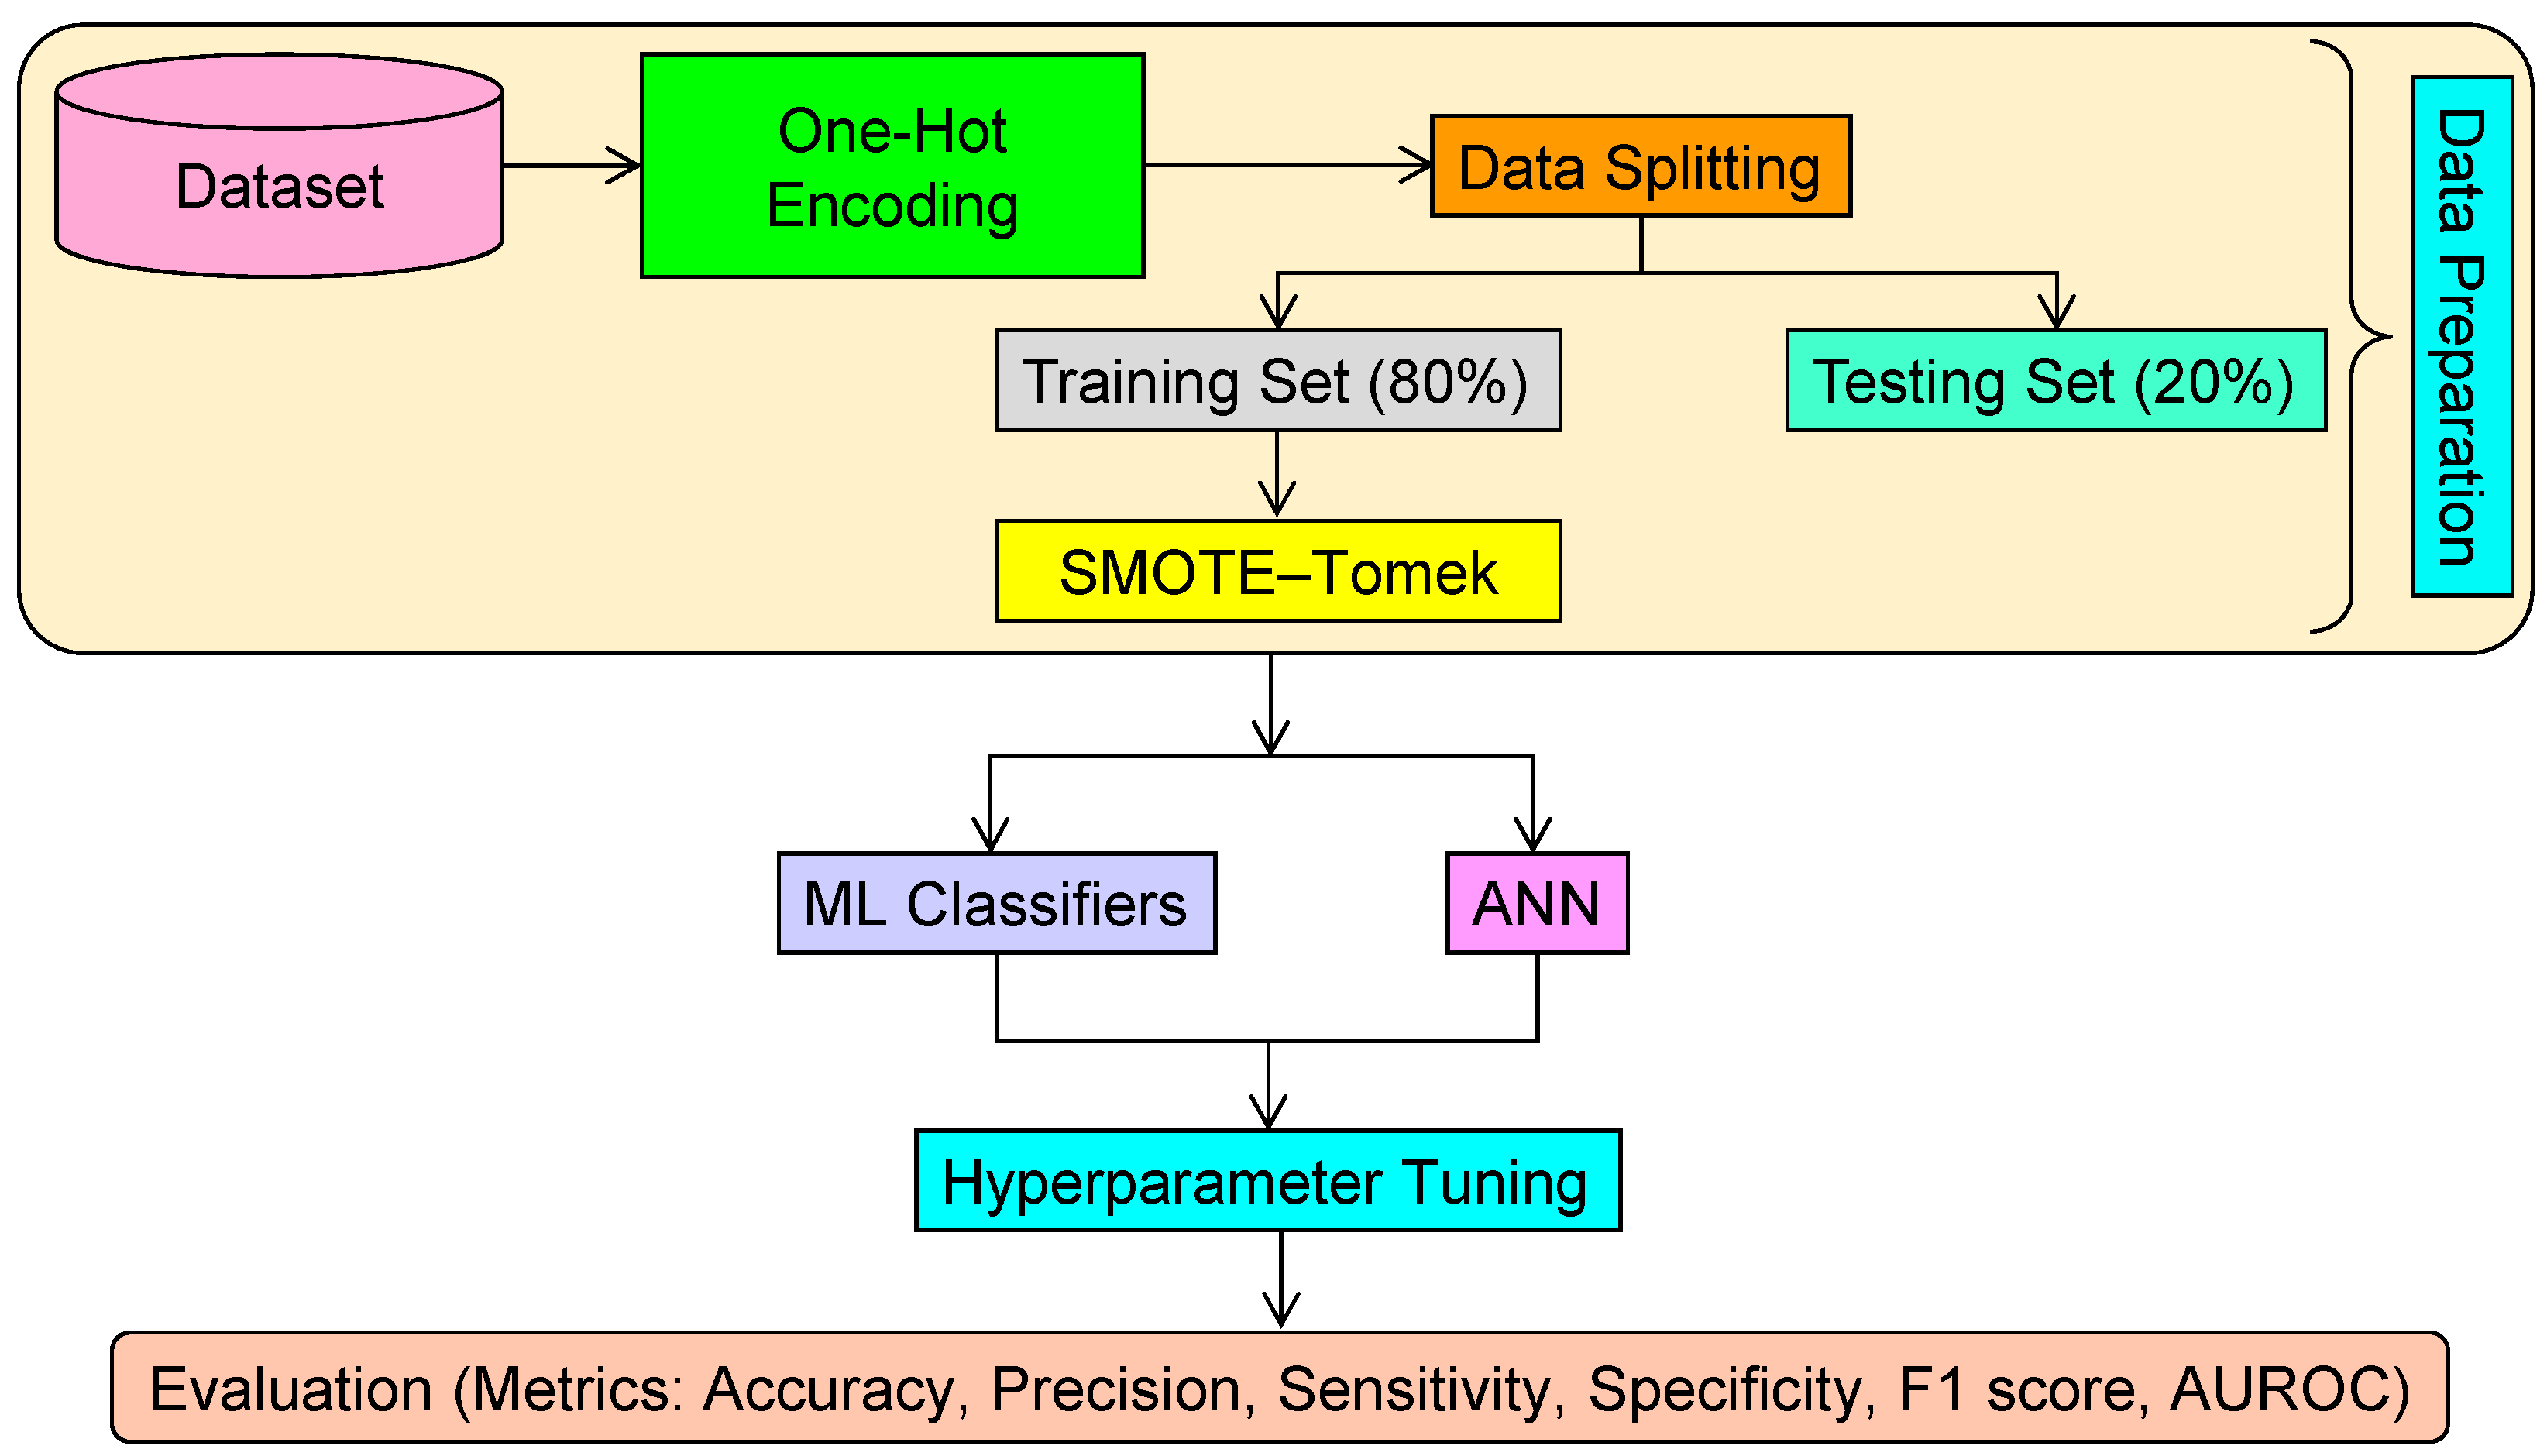
Two datasets were used for the experimentation. The first dataset [23] consists of 383 rows and 16 columns, out of which 14 features are categorical, and 1 is of integer type. The second dataset [24] was pre-cleaned, in which redundant attributes and missing laboratory measurements had already been handled, and consists of 26 features. Categorical values in the first dataset were handled via one-hot encoding, and SMOTE–Tomek [25] was used to address data imbalance, as shown in Figure 1. SMOTE reduces class imbalances by randomly choosing a sample from the minority class, finding the near neighbours of the sample, and creating new instances on the line segment connecting the sample with its neighbours. Tomek connections are pairs of samples from distinct classes that are the closest neighbours. If two samples create a Tomek link, at least one of them is considered borderline or noisy. By deleting the majority class samples from Tomek connections, the dataset becomes better, and the class boundary becomes more distinct. SMOTE–Tomek can be defined mathematically as Equation (1). SMOTE alone may introduce overlap between classes, leading to noisy regions. Tomek links alone only reduce overlapping but do not handle imbalance strongly. SMOTE–Tomek enhances minority representation and removes noisy samples near the decision boundary.
where D = original dataset, = set of synthetic minority samples generated using SMOTE, and = set of majority class samples identified as Tomek links.
Figure 1.
Workflow of the experiment.
3.2. ANN Architecture and Training Configuration
The artificial neural network was built using a sequential approach that included two fully connected hidden layers. The hidden layers included 64 units with ReLU activation functions, followed by a dropout layer with a dropout rate of 0.3. This was followed by another hidden layer that included 32 units with ReLU activation functions, followed by another dropout layer with the same dropout rate of 0.3. Finally, the model ends with an output layer that includes one neuron with a sigmoid activation function for binary classification, as shown in Figure 2.
Figure 2.
Model architecture of ANN.
The model was optimized using the “Adam” optimizer and the “binary cross-entropy” loss function, while accuracy was used to monitor the training. The maximum number of epochs used during training was 300, and the batch size used was 32, while 20% of the training data was used for validation. During training, “early stopping” was used to validate the loss on the validation set with a patience of 10 epochs. If there is no improvement in validation loss for five consecutive epochs, the learning rate is reduced by 0.5 times, with the minimum limit of the learning rate being set to . Hyperparameter tuning of the classifiers, including the ETC, was performed manually. For ETC, parameters such as the number of estimators (100–500), maximum depth (5–20), and minimum samples per leaf (1–5) were tuned to identify the optimal configuration.
3.3. SHAP
In this study, SHAP [26] was used to interpret the predictions of ML models on the dataset. Shapley values indicate the average marginal contribution of a feature when added to all possible coalitions of features. SHAP achieves this by constructing a set of feature subsets by systematically adding and removing features from the model and tracking changes in the predicted output. It is assumed that the prediction can be divided into the summation of the contributions of individual features, as formulated in Equation (2).
where = model’s prediction, = base value (Expected prediction across the dataset), = Shapley value representing the contribution of each feature, and = total number of features.
By adding together SHAP values throughout the whole dataset, interpretability can be obtained. This makes it clear how the model makes its decisions.
4. Results and Discussion
4.1. Results of Classifiers on the First Dataset
Table 2 compares the performance of 17 classifiers that have been evaluated on the first dataset by five-fold cross-validation. Overall, ensemble-based models achieved consistently better results compared with linear and probabilistic classifiers, which underlines their increased capability for modelling complex, nonlinear relationships present in clinical data. Traditional classifiers that included LR, KNN, and variants of naïve Bayes reported overall lower sensitivity and F1-scores, while neural and tree-based ensembles had more balanced and robust predictive behaviour. Out of all the models tested, ETC performed best in overall results with the highest testing accuracy (95.30 ± 2.00%) and precision (95.10 ± 3.26%), and highest specificity (98.18 ± 1.29%), besides having one of the best F1-scores (91.21 ± 4.21%). In terms of model discriminability, ETC also had the highest AUROC (98.84 ± 0.71%) and AUPRC (97.66 ± 1.45%) scores with a minor edge over the best competitors in the area of ensemble models like XGB (AUROC: 98.64 ± 1.04%, AUPRC: 97.17 ± 2.26%), CB (AUROC: 98.61 ± 0.84%, AUPRC: 97.29 ± 1.68%), and GBC (AUROC: 98.42 ± 1.05%, AUPRC: 96.97 ± 1.86%). Although the other models were comparable to ETC in terms of accuracy and F1-scores, ETC was better in terms of model discriminability.
Table 2.
Results of various classifiers on the first dataset (mean ± standard deviation).
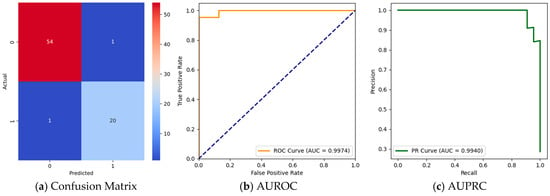
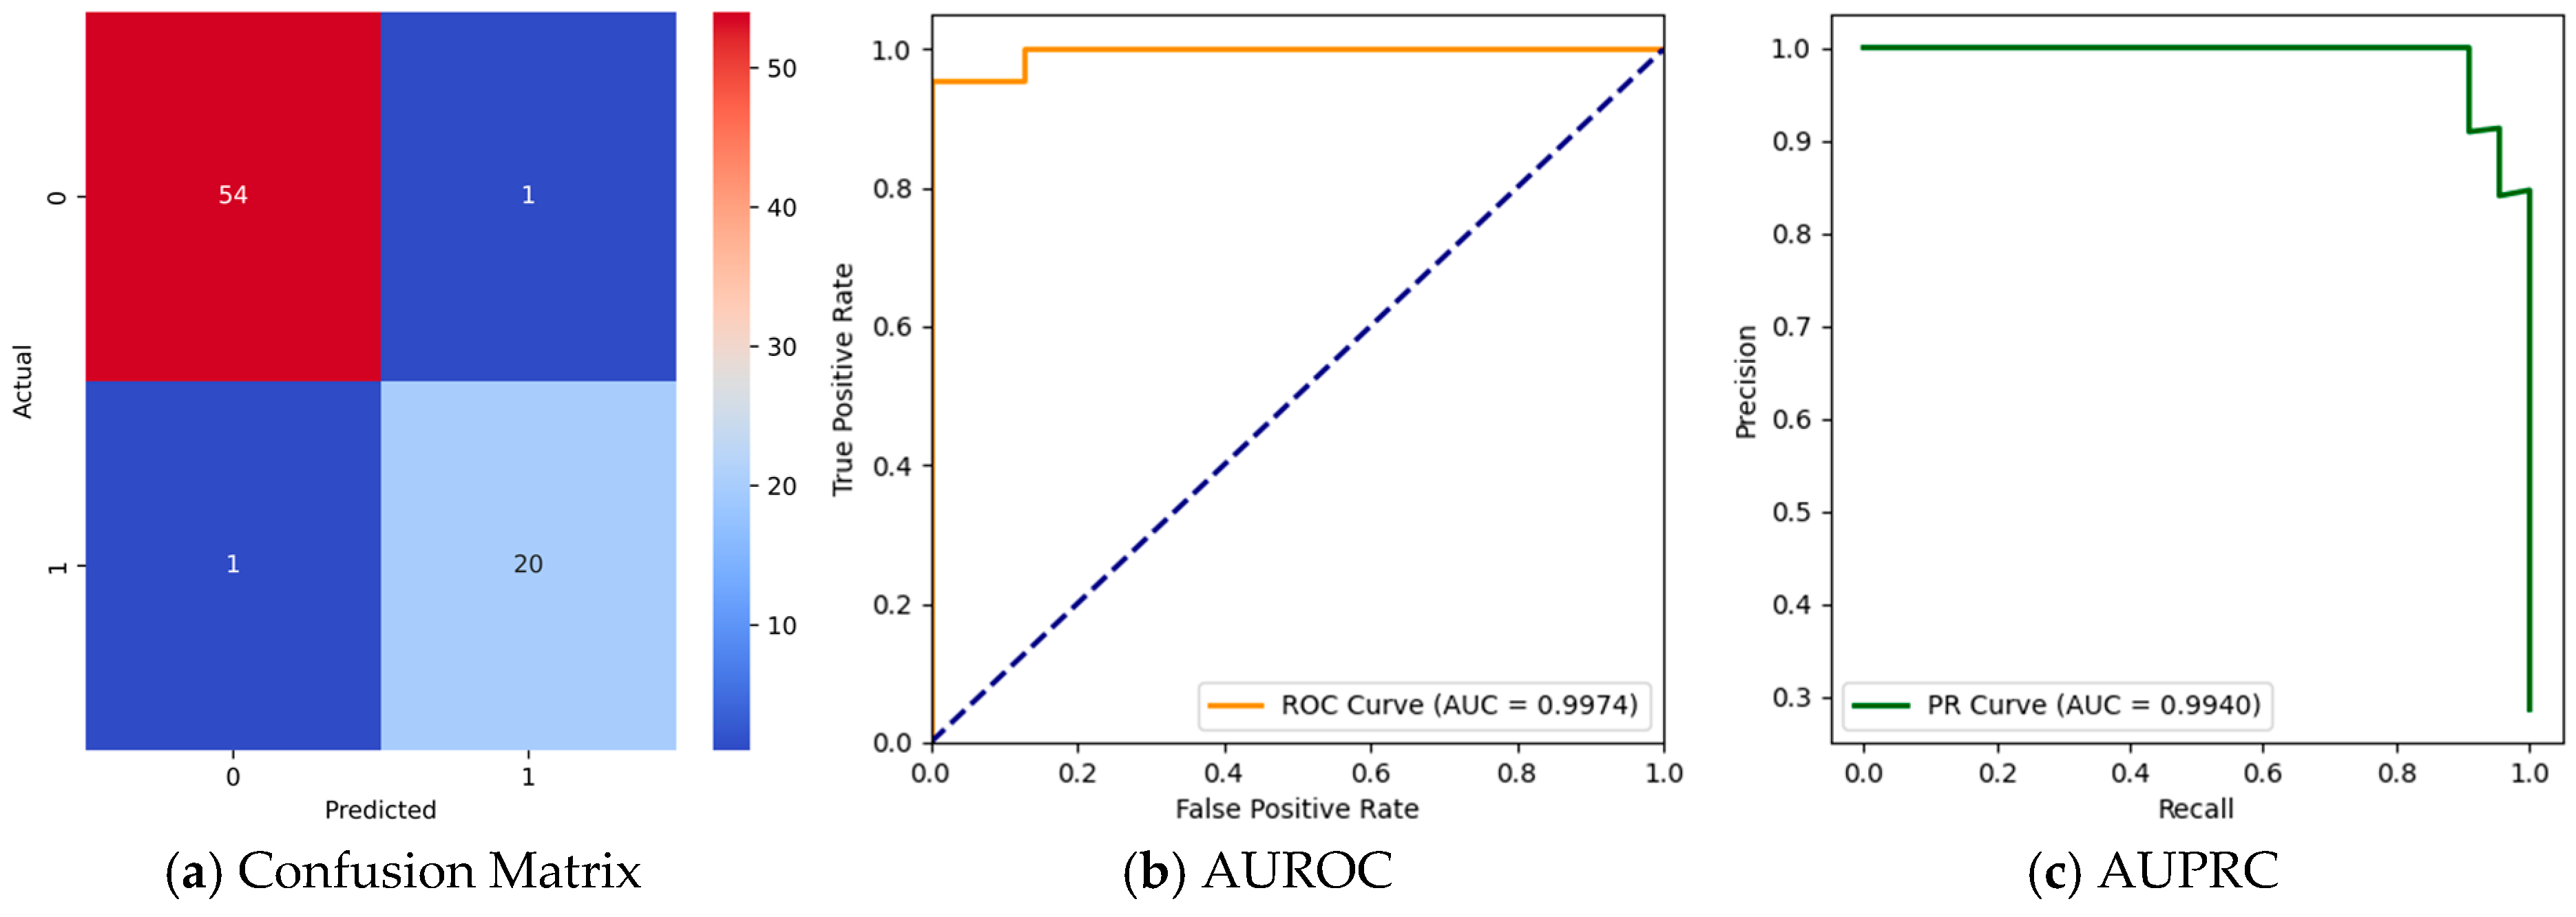
The confusion matrix for the best-performing fold of ETC has also been shown in Figure 3a. ETC has managed to classify 54 out of 55 non-recurrence samples and 20 out of 23 recurrence samples in a correct manner while also obtaining only one false positive instance and one false negative instance. This clearly shows that ETC has achieved a superior trade-off between its sensitivity and specificity compared with the other top-performing models that have had a greater variability in results among the folds. The ROC curve and precision–recall (PR) curve for ETC, shown in Figure 3b,c, clearly show that it has a superb discriminatory power compared with the other models since it has obtained an AUROC value of 99.74% and an AUPRC of 99.4%, which is higher compared with that of the other ensemble models. Although ensemble classifiers performed well in predicting the first dataset, ETC stood out in terms of stability, discriminability, and class balance characteristics and thus proved to be the best classifier.
Figure 3.
Results of ETC on the first dataset.
4.2. Results of Classifiers on the Second Dataset
Table 3 summarizes the results of the comparative analysis of 17 classifiers applied to the second dataset in a five-fold cross-validation setting. Ensemble machine learning algorithms demonstrated a significant advantage over linear predictors, probabilistic predictors, and distance-based predictors due to their ability to learn complex patterns in the imbalanced health datasets. On the other hand, poor results in precision, F1-score, and AUPRC metrics demonstrated that the results of the KNN and naïve Bayes machine learning algorithm variants are not very reliable in predicting recurrence. Among all the investigated models, ETC yielded the highest testing accuracy, precision, specificity, and F1-score—99.47 ± 0.16%, 94.83 ± 2.91%, 99.54 ± 0.28%, and 96.65 ± 0.96%, respectively. In terms of discrimination capability, ETC also attained the highest AUROC and AUPRC, 99.95 ± 0.04% and 99.37 ± 0.59%, respectively, which is very close to those of other powerful ensemble classifiers, including RF, XGB, CB, and ADB: AUROC of 99.87 ± 0.13%, 99.73 ± 0.22%, 99.84 ± 0.13%, and 99.72 ± 0.37%; and AUPRC of 98.29 ± 1.92%, 95.33 ± 4.89%, 97.89 ± 2.20%, and 97.45 ± 2.49%, respectively. Although these models have a similar accuracy and sensitivity, ETC consistently exhibited superior precision with better class-wise balance, leading to a more stable and clinically reliable performance.
Table 3.
Results of various classifiers on the second dataset (mean ± standard deviation).
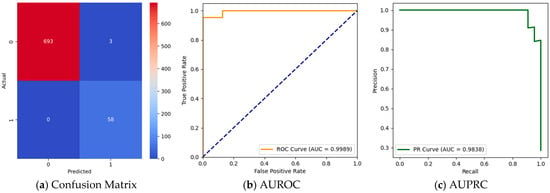
To further demonstrate the efficacy of ETC, Figure 4a presents a confusion matrix corresponding to its best-performing fold: the model appropriately classified 693 non-recurrence and 58 recurrence cases, with only three false positives and no false negatives, which is indicative of perfect sensitivity and near-perfect specificity. The strong classification performance is further reflected by the ROC curve presented in Figure 4b, wherein ETC has obtained an AUROC of 99.89%, thus confirming an excellent discriminability of recurrent versus non-recurrent cases. The PR curve in Figure 4c reports an AUPRC of 98.38%, again illustrating the robustness of ETC for identifying recurrence cases even under severe conditions of class imbalance. In conclusion, while some of the ensemble techniques showed excellent prediction capabilities on the second dataset, ETC was clearly better than the rest of the classifiers in terms of accuracy, discriminative power, and the stability of results across cross-validation runs. This further proves that ETC has consistently performed across both datasets, emerging as the proposed method of this research. The hyperparameters of the proposed ETC model are tabulated in Table 4.
Figure 4.
Results of ETC on the second dataset.
Table 4.
Hyperparameters of ETC.
4.3. Discussion
The results presented in Table 2 and Table 3 clearly reveal that model performance is rather sensitive to both the learning paradigm and underlying data characteristics, given that the ensemble-based classifiers systematically outperformed classifiers from linear, probabilistic, and distance-based learning for most of the metrics used. For the first dataset (Table 2), the performance of classifiers was relatively smooth, with testing accuracies mostly distributed between 90% and 95%. Ensemble models, including GBC, ETC, CB, XGB, and ADB, performed the best and most balanced based on accuracy, F1-score, AUROC, and AUPRC. Among them, ETC and CB obtained the highest testing accuracy of 95.30 ± 2.00% and 95.30 ± 2.00%, respectively. Meanwhile, ETC demonstrated the best precision of 95.10 ± 3.26% and specificity of 98.18 ± 1.29%. Although reasonable performances in accuracy were seen for LR and KNN, their relatively lower values in AUROC and AUPRC did manifest an increasingly weaker discrimination capability in classes with significant imbalance. Then, variants of naïve Bayes and the NC further manifested lower F1-scores and higher variability, indicating weaker robustness for the prediction of recurrence.
In contrast, more diverse performance differences among the classifiers can be seen within the second dataset, as presented in Table 3. The noticeable class imbalance, probably along with more complex interactions between features, induced such differences. Although many of the ensemble models reached a very high testing accuracy—a value of over 99% in some cases—accuracy was not enough to reflect clinical reliability in every case. The probabilistic and distance-based models, including KNN, GNB, BNB, CNB, and MNB, exhibited noticeably poor precision, F1-scores, and AUPRC values, although sometimes yielding high sensitivity; this would mean that they had a strong bias toward the majority class and a higher rate of false positives. ANN and MLP showed competitive performances but lower sensitivity and AUPRC values compared with the ensemble methods, therefore showing reduced stability in the detection of the minority class.
Although accuracy and AUROC are useful indicators of the overall performance of the classification task, they might not address the issue of class imbalance, which is very common in recurrence forecasting problems. Henceforth, there was greater importance attached to F1-score and PR curve, which are generally better indicators to address the precision–sensitivity trade-off. As made evident in Table 2 and Table 3, several ensemble models like ETC, GBC, and CB achieved high F1-scores in both datasets, thus concluding an effective trade-off between predicting the recurrence and avoiding false positives. For the first dataset (Table 2), the precision for the ETC model came out to be 95.10% with slightly reduced sensitivity at 87.92%, and the F1-score and AUPRC were calculated to be 91.21% and 97.66%, respectively. Likewise, for the same dataset, the precision for the ANN model stood at 95.03%, with a slightly reduced sensitivity of 87.88%, and the F1-score and AUPRC were calculated to be 91.08% and 97.67%, respectively. This highlights the appropriateness and efficiency of these models in terms of correctly identifying the actual cases, although a few cases may have gone undetected.
In the second dataset (Table 3), the ETC model outperformed others with an F1-score of 96.65%, an AUROC of 99.95%, and an AUPRC of 99.37%, and this showcases the robustness of ETC irrespective of higher class imbalance. Other ensemble models, such as RF, XGB, and ADB, also had F1-scores of more than 94%, which again ensures reliable performances for making predictions. From a clinical perspective, these results are significant in relation to the trade-off in precision and recall observed in the models. A false negative might indicate a failure in a recurrence case that could have delayed follow-up or treatment. On the other hand, a false positive could result in unnecessary follow-up, an increase in health expenses, and patient anxiety. Models such as ETC and ANN follow a conservative predictive approach that favours high precision in order to minimize the occurrence of false positives at the expense of a slight decrease in recall. The addition of the F1 measure and AUPRC ensures the clinical significance of the comparison in accordance with distinct clinical considerations.
4.4. Comparison with State-of-the-Art Models
The performance of the proposed ETC model on various state-of-the-art models has been presented in Table 5. The models include XGBoost [8,19], KNN [9], LR [10,16], LightGBM [15], Thy-DAMP [17], and RF [18]. Though the existing models performed well in achieving moderate to high accuracy on their respective data sets, they did not perform well in achieving a combined result of accuracy, sensitivity, specificity, F1-score, AUROC, and AUPRC. XGBoost [19] was able to attain a high specificity of 89.6%, but it attained a low sensitivity of 60.1%, implying it was not effective in identifying recurrence well. The same applies to Thy-DAMP models that attained 93.3% accuracy and 83.24% sensitivity. By contrast, the proposed ETC model outperformed all existing methods in two independent datasets.
Table 5.
Comparison of ETC vs. state-of-the-art models.
With the first dataset, ETC yielded 95.3% accuracy, 95.1% precision, 87.92% sensitivity, 98.18% specificity, 91.21% F1-score, 98.84% AUROC, and 97.66% AUPRC. Notice that this result shows an effective balance between true positives and false positives regarding the identification of recurrence cases. This model further improved its scores on the second dataset: 99.47% accuracy, 94.83% precision, 98.62% sensitivity, 99.54% specificity, 96.65% F1-score, 99.95% AUROC, and 99.37% AUPRC. This certainly proves that even with a higher-class imbalance, the proposed model is robust. These findings clearly illustrate that the ETC not only outperforms conventional models in standard evaluation metrics but also offers a good trade-off between precision and recall rates, which is essential in order to avoid false negatives (missed recurrence) and false positives (unwanted monitoring). The proposed ETC certainly establishes a new benchmark in recurrence risk prediction models.
4.5. SHAP Analysis
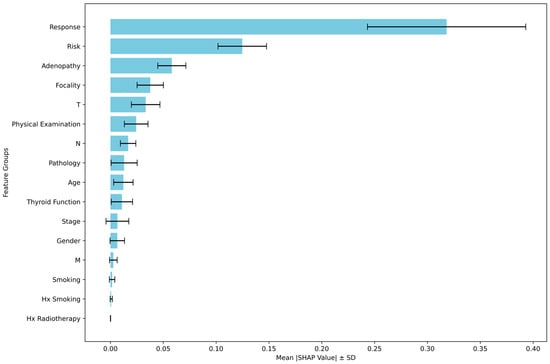
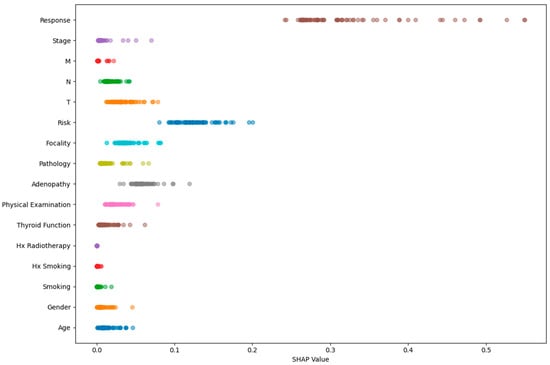
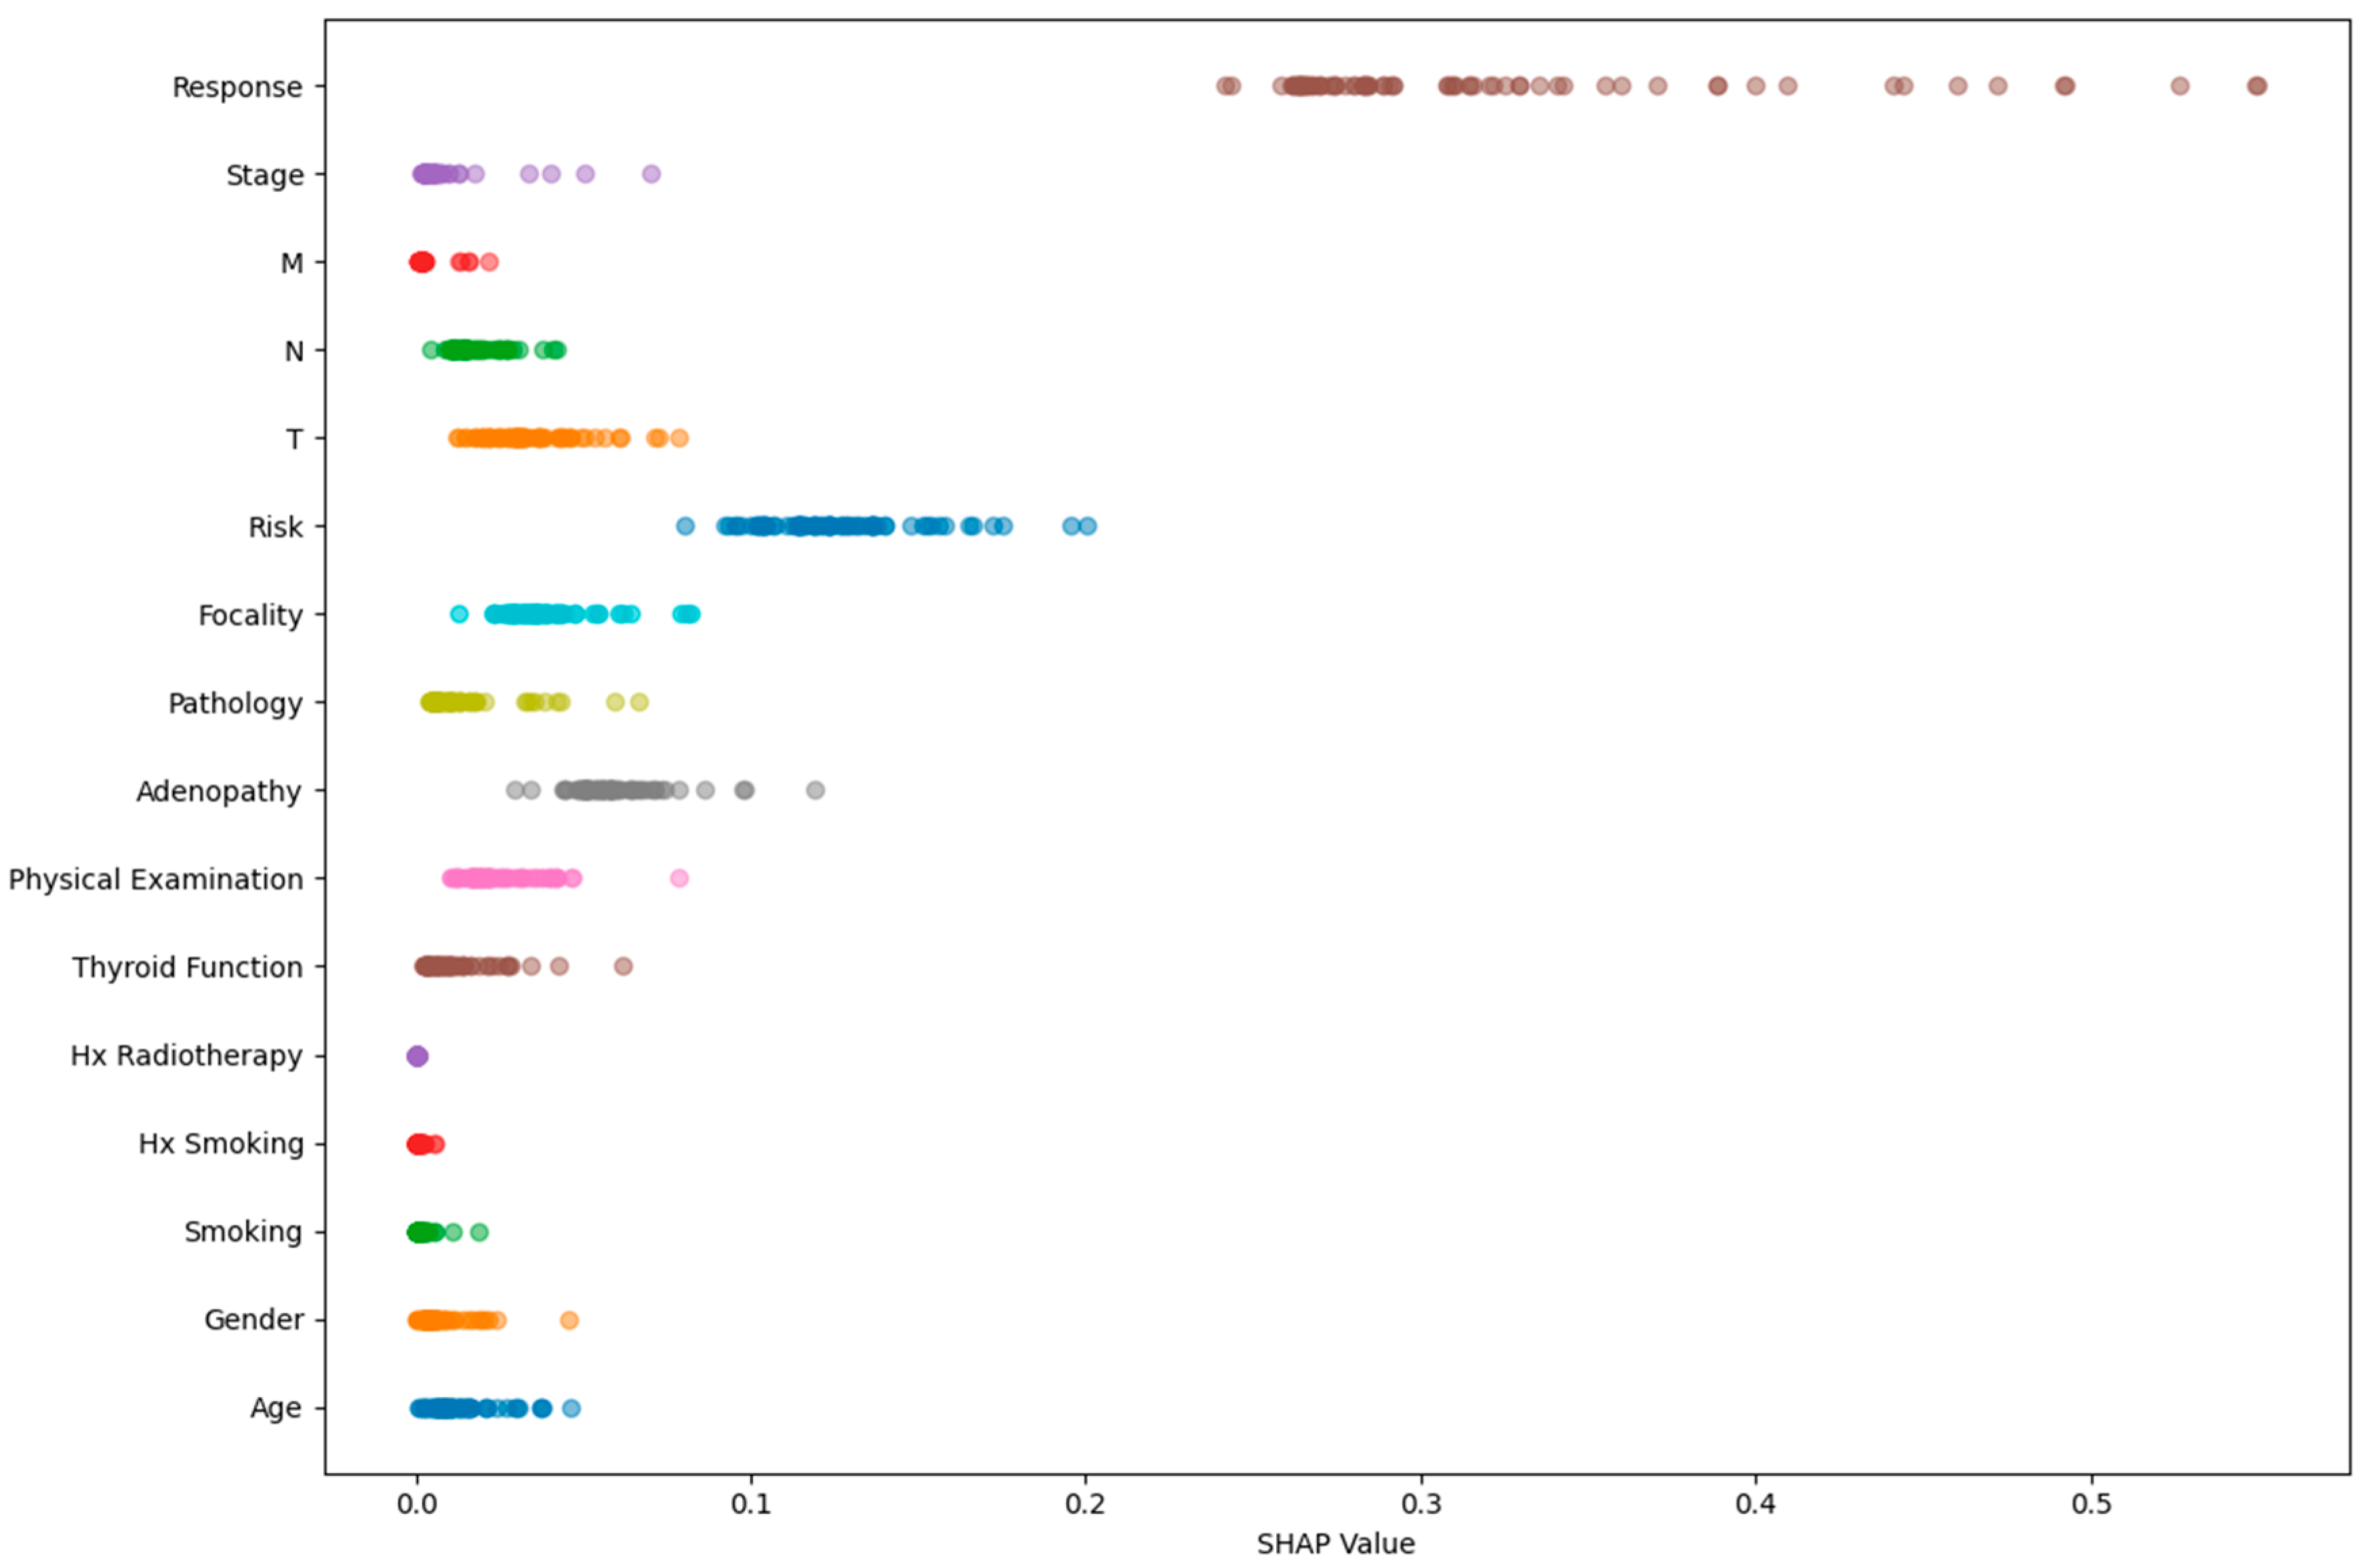
The SHAP values for each feature group after one-hot encoding indicate their impact on recurrence prediction (Table 6). The Response group made the largest contribution (0.31 ± 0.07), suggesting that the model’s judgments are heavily influenced by treatment response. The Risk group came next (0.12 ± 0.02), while Focality and Adenopathy both had a significant impact. While clinical feature groups like Physical Examination and Pathology contributed less, TNM-related features (N and T) contributed moderately. Age, Gender, and Smoking were among the lifestyle and demographic characteristics that had very little effect, and variables like M, Hx Smoking, and Hx Radiotherapy made very little difference. Overall, the SHAP analysis verifies that response-, risk-, and tumour-related factors are the main factors influencing recurrence prediction, as depicted in Figure 5. A beeswarm plot of the feature groups is shown in Figure 6.
Table 6.
The contribution of each feature of the first dataset to recurrence prediction.
Figure 5.
Mean SHAP values of feature groups of the first dataset.
Figure 6.
Beeswarm plot of feature groups of the first dataset.
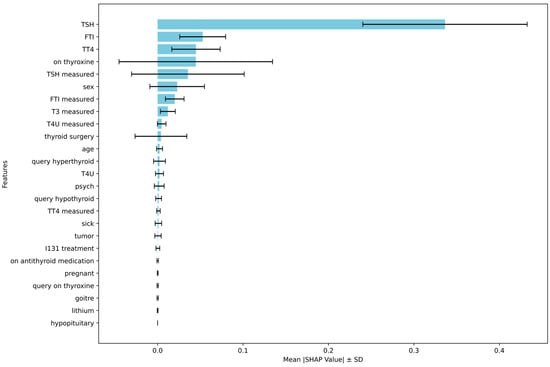
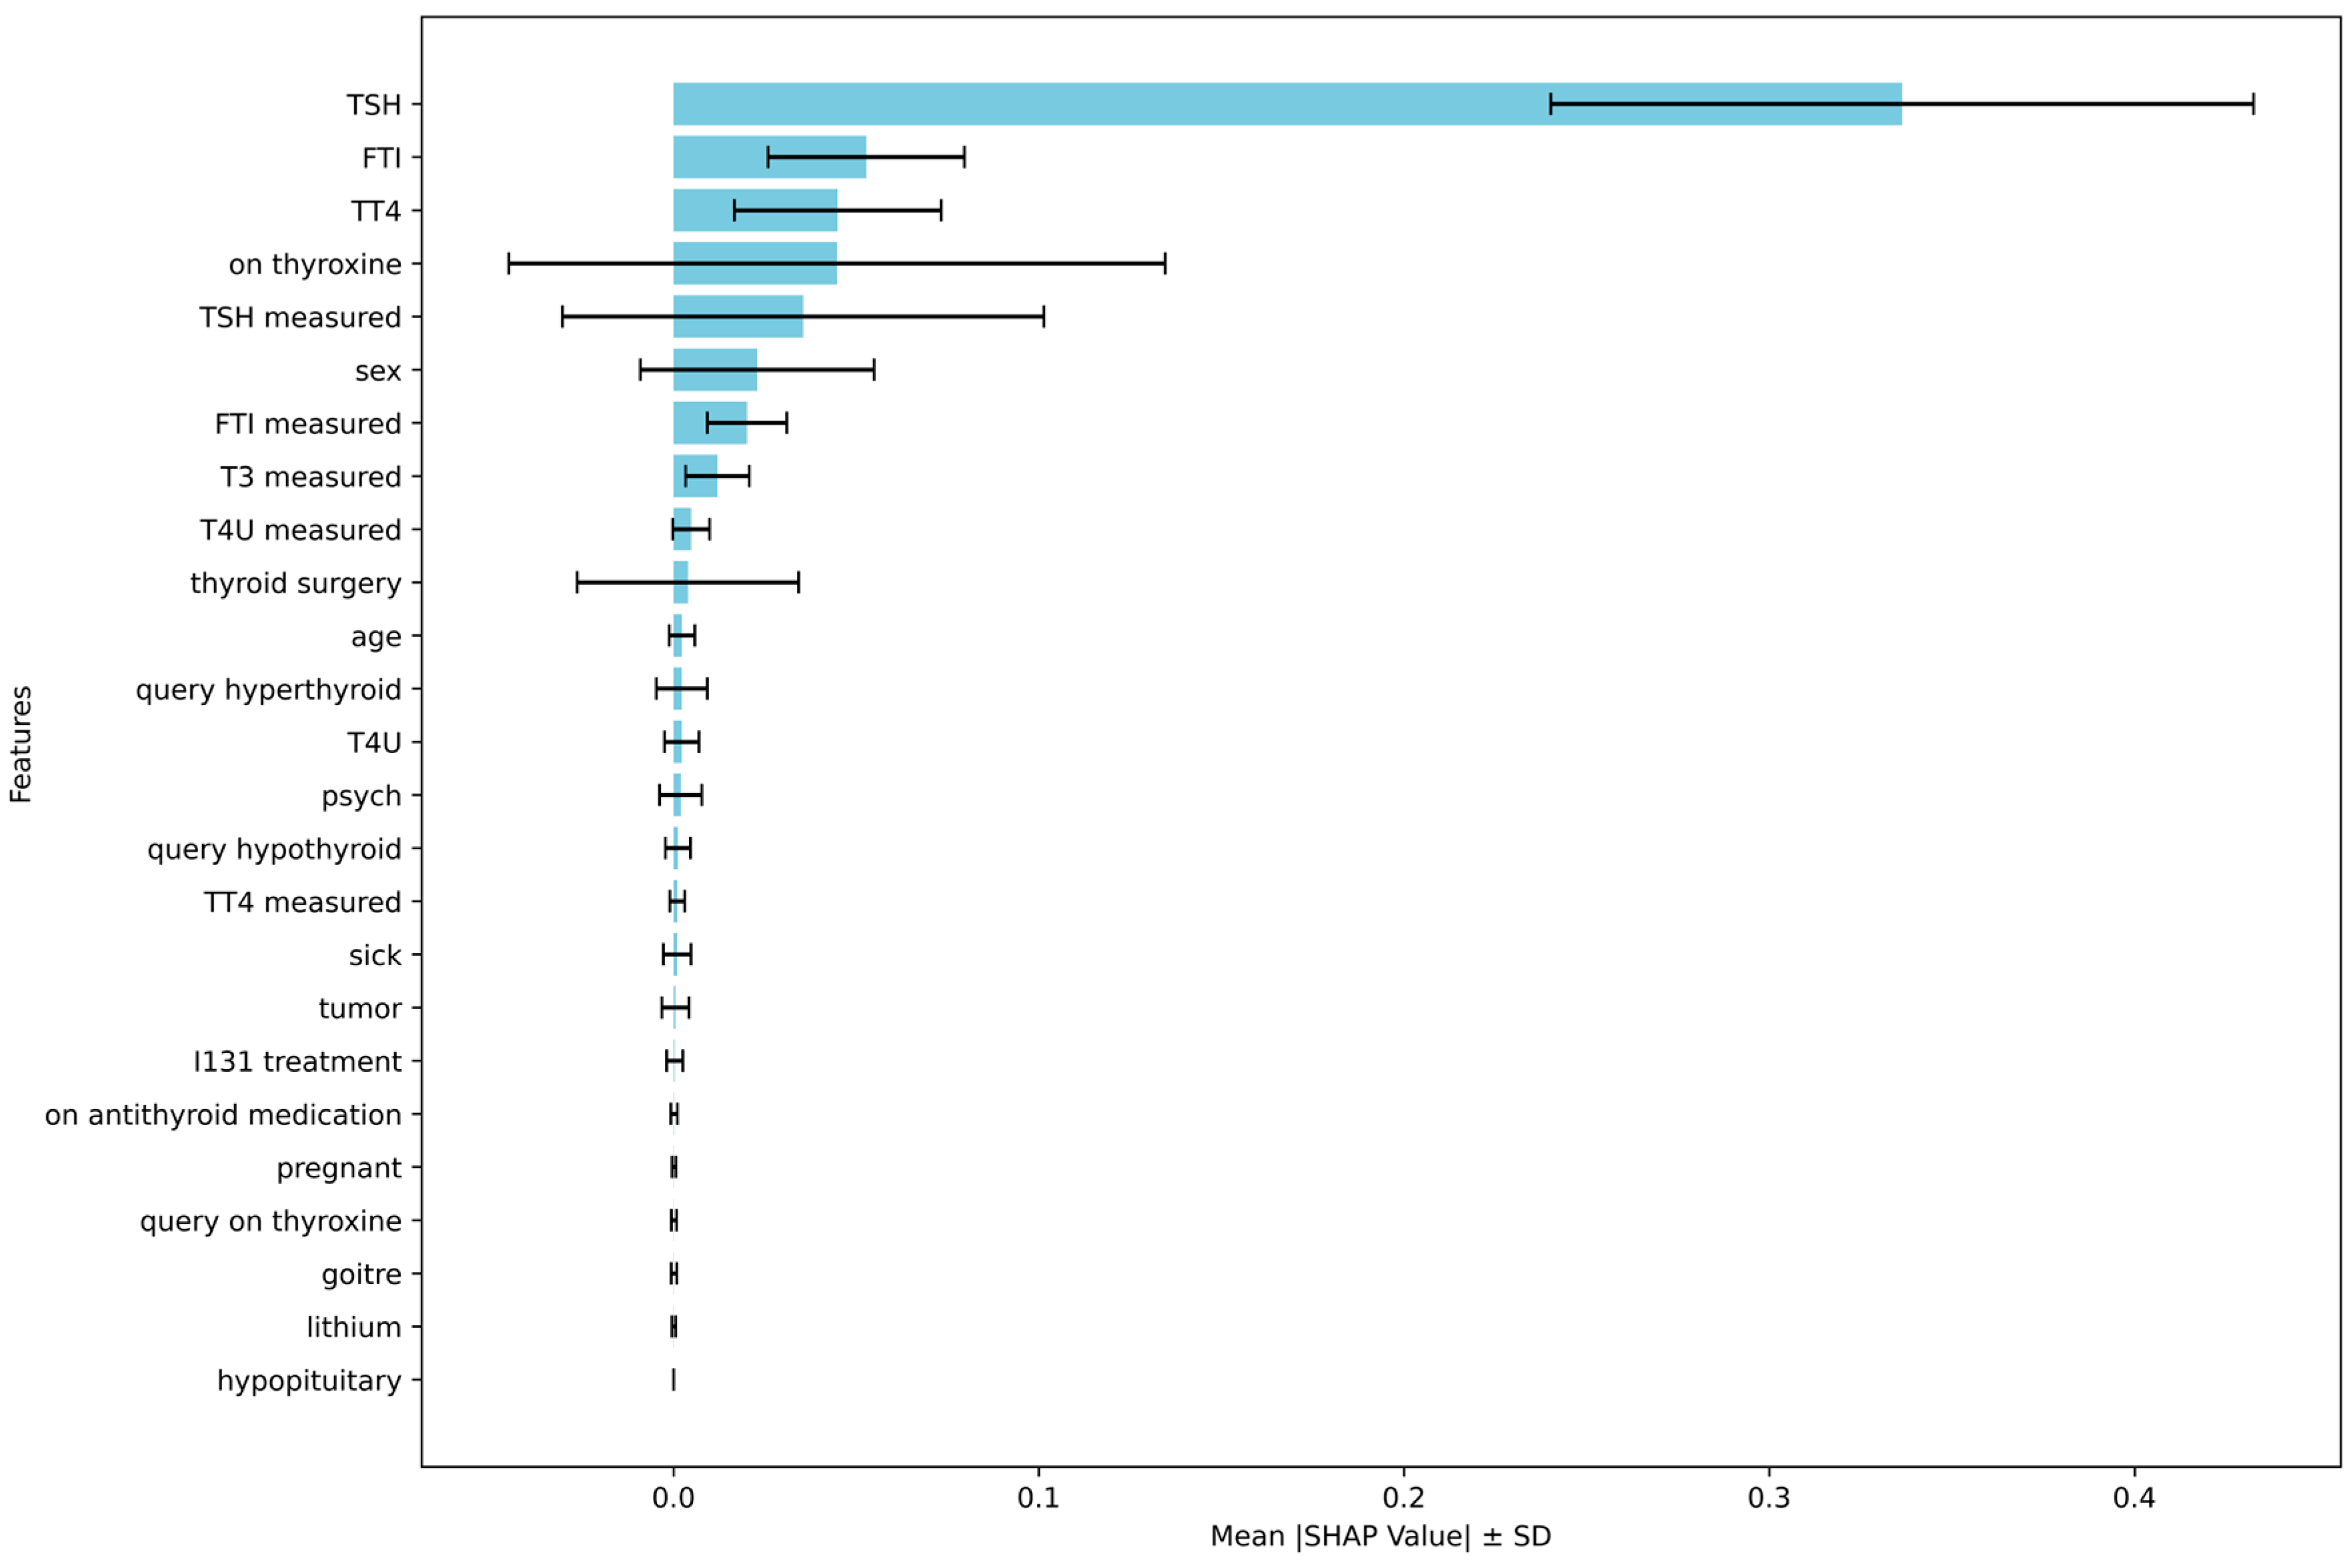
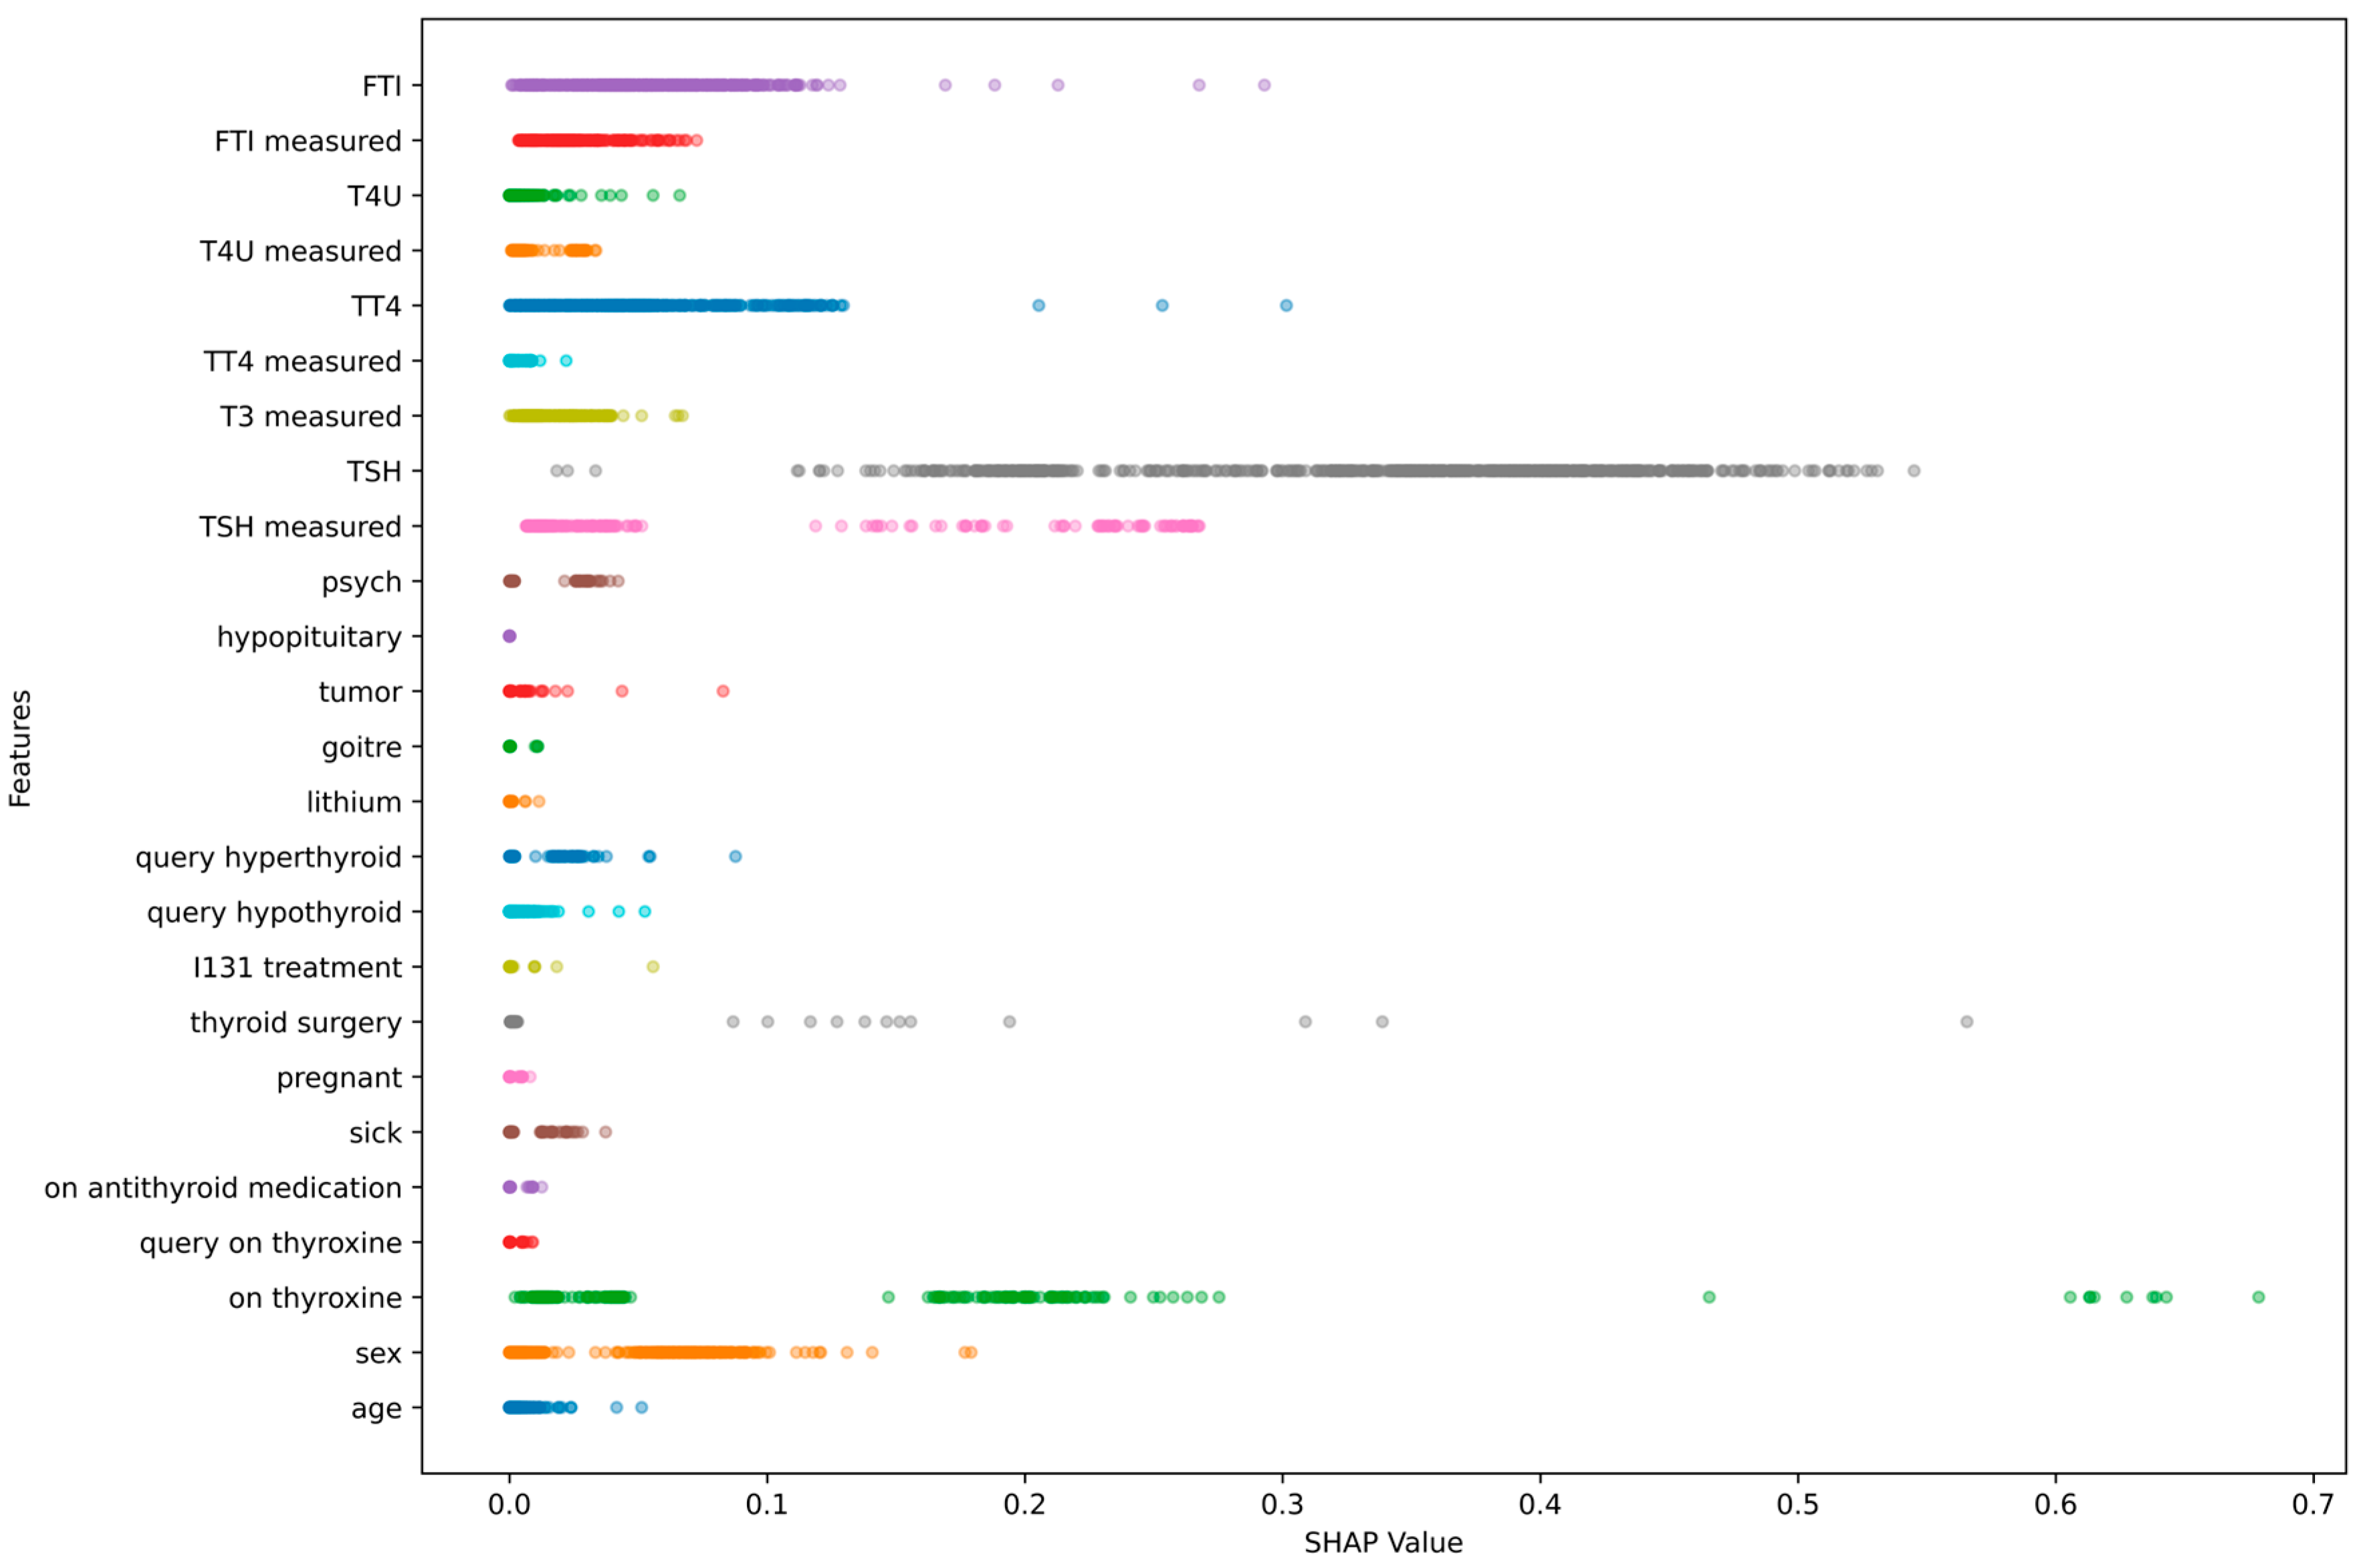
SHAP value analysis shows the relative importance of various clinical features to the predictions made by the model (Table 7). Among all the features, TSH has been shown to have the highest impact on the model predictions, with a mean SHAP value of 0.33 ± 0.09, showing the predominant role of TSH in the model’s decision-making process. This is followed by FTI (0.05 ± 0.02) and TT4 (0.04 ± 0.02), emphasizing the role of biochemical indices for evaluating thyroid function. The treatment feature “on thyroxine” (0.04 ± 0.08) and the test feature “TSH measured” (0.03 ± 0.06) have also been shown to have a significant effect on the predictions. While demographic and auxiliary clinical features are lower in impact, including sex (0.02 ± 0.03) and age (0.002 ± 0.003), several flags of laboratory measurements contribute marginally, such as FTI measured, T3 measured, and T4U measured. Variables describing comorbid conditions and clinical history, such as psych, sick, tumour, and thyroid surgery, have low impacts, whereas the SHAP values for very rare conditions or treatments, like hypopituitary, lithium, I131 treatment, and pregnant, become negligible. By and large, biochemical thyroid markers and features related to treatment are confirmed as the major drivers of the model by the SHAP results, while demographic factors and less frequent clinical conditions contribute minimally, as illustrated in Figure 7.
Table 7.
The contribution of each feature of the second dataset to recurrence prediction.
Figure 7.
Mean SHAP values of features of the second dataset.
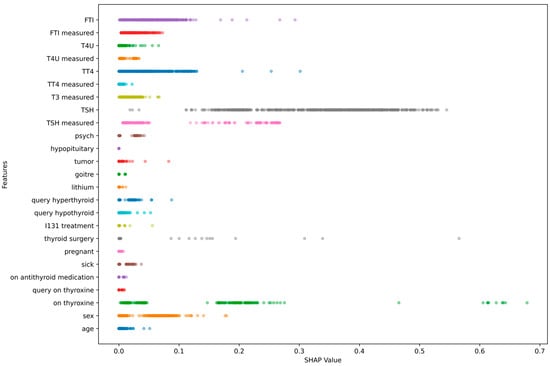
In addition to feature-level behaviour analysis through feature-level plots, beeswarm plots for the SHAP values of each feature have also been created for both datasets. Unlike the aggregated SHAP bar charts, the feature-level behaviour of the beeswarm charts provides insights into the spread of feature behaviour across patients. In the first dataset (Figure 6), the features Response, Risk, T, N, and Adenopathy have a positive SHAP value with less variability. Adenopathy (0.05 ± 0.01) is one of the most influential features; most data points have a positive effect. This implies that the involvement of the lymph nodes increases the chance of recurrence. This result is clinically well supported because cervical lymph node involvement has long been a well-accepted prognostic indicator in thyroid carcinomas and has a strong positive correlation with persistence and recurrence. Several studies support the importance of lateral lymph node involvement in specifically impairing recurrence-free survival rates and are therefore ranked so highly in SHAP. In contrast, demographic and lifestyle variables like age, gender, smoking, and radiotherapy have SHAP values huddled around zero, indicating that these variables have little and unstable effects on the model predictions.
Likewise, for the second dataset (Figure 8), biochemical variables like TSH, FTI, TT4, and treatment variables (on thyroxine, thyroid surgery) strongly influence the SHAP values. These variables have large SHAP ranges, suggesting variability in the treatment responses, especially for those with irregular levels of thyroid hormones and treated cases. Features like TSH are consistent and large in size, re-emphasizing its significance as an endpoint for biochemical analysis for assessing the thyroid condition. Overall, the beeswarm plots revealed that the predictions made by the model are influenced largely by tumour-related factors, lymph node status, treatment response, and markers of thyroid function, and only marginally by other less important factors. This level of explainability at the instance level helps to make the proposed framework more credible and transparent. Although SHAP is a model-agnostic explainability framework, in this study, it was applied specifically to the ETC, as it demonstrated the best overall predictive performance among all evaluated models. The purpose of the SHAP analysis was to enhance the clinical interpretability of the final selected model rather than to conduct a comparative interpretability assessment across classifiers. Since other high-performing models, such as RF, are also tree-based ensemble methods, similar feature contribution patterns are expected. Therefore, SHAP-based interpretation was limited to the ETC model.
Figure 8.
Beeswarm plot of features of the second dataset.
The findings of this study indicate that ETC is a reliable model for predicting the recurrence of ETC. With only one recurrence and non-recurrence case incorrectly classified in the first dataset and three false positives and no false negatives in the second dataset, the confusion matrices demonstrate the model’s steady behaviour. When compared with existing works, ETC demonstrated a better performance across all metrics. XGBoost, KNN, LR, LightGBM, RF, and Thy-DAMP often reported lower sensitivity and uneven performances across the metrics. The usage of SHAP added further explainability to the model’s decision-making process. Features related to post-operative response, such as clinical risk categories, lymph node involvement, and tumour focality, contributed the most to the recurrence prediction, whereas demographic features showed only a marginal influence on the model’s decision-making process.
5. Conclusions
The early identification of thyroid cancer recurrence plays a crucial role in preventing disease progression and guiding personalized medical management. A comprehensive experimental framework was developed to evaluate the recurrence risk using clinical information. After applying one-hot encoding, SMOTE–Tomek balancing, and performing hyperparameter tuning, ETC outperformed the other classifiers with testing accuracies of 95.3% and 99.47%, precision values of 95.1% and 94.83%, sensitivities of 87.92% and 98.62%, specificities of 98.18% and 99.54%, F1-scores of 91.21% and 96.65%, AUROC values of 98.84% and 99.95%, and AUPRC values of 97.66% and 99.37% on the two datasets respectively, demonstrating its predictive power. SHAP feature group analysis was conducted to enhance interpretability, revealing that Response (0.31 ± 0.07), Risk (0.12 ± 0.02), and Adenopathy (0.05 ± 0.01) in the first dataset, and TSH (0.33 ± 0.09), FTI (0.05 ± 0.02), and TT4 (0.04 ± 0.02) in the second dataset emerged as the influential predictors, whereas, features such as Smoking (0.001 ± 0.002), Hx Smoking (0.0007 ± 0.001), and Hx Radiotherapy (0.00008 ± 0.0001) in the first dataset, and goitre (0.0001 ± 0.0007), lithium (0.00008 ± 0.0005), and hypopituitary (0.0000008 ± 0.000002) in the second dataset had minimal impact on the prediction from both datasets respectively. These findings highlight the importance of the post-treatment behaviour of the patient and tumour-related characteristics, which drive the recurrence rather than baseline patient features. This study demonstrates that the integration of balanced pre-processing, optimized classifiers, and XAI techniques enabled reliable and interpretable thyroid cancer recurrence. The proposed experimental framework can be made accessible, practical, and well suited for integration into routine follow-up workflows using standard clinical data. While the performances are all very strong, the lack of diversity in demographics may make the generalization of our findings to populations different from those in the dataset challenging. Future work will include prospective validation studies on patient cohorts over time, integration with electronic health record systems for real-time risk assessment, inter-institutional validation on a wide range of patient demographics for further improved clinical validity and generalizability in the context of personalized medicine practices, and extending the evaluation to larger and more diverse cohorts with a view to further validating the proposed approach.
Author Contributions
Conceptualization, D.R.; methodology, G.P.R.; formal analysis, Y.V.P.K.; software, K.P.P.; validation, M.K.C.; data curation, P.R.C.; resources, Y.V.P.K.; investigation, D.R.; writing—original draft preparation, D.R. and G.P.R.; writing—review and editing, M.K.C. and K.P.P.; visualization, K.P.P.; supervision, G.P.R. and Y.V.P.K.; project administration, P.R.C. All authors have read and agreed to the published version of the manuscript.
Funding
This research received no external funding.
Institutional Review Board Statement
Not applicable.
Informed Consent Statement
Not applicable.
Data Availability Statement
Data are contained within the article. The source code used to implement the proposed methodology is available at: https://github.com/rohandgkp/DTC-Codes (25 January 2026).
Conflicts of Interest
The author declares no conflicts of interest.
References
- Zhang, D.; Zhang, G.; Li, Y.; Liu, H.; Shan, Z.; Teng, W. Prognosis of Differentiated Thyroid Cancer in Patients with Graves’ Disease: A Meta-Analysis. Thyroid Res. 2025, 18, 51. [Google Scholar] [CrossRef] [Scilit] [PubMed]
- Reddy, G.P.; Kumar, Y.V.P. Explainable AI (XAI): Explained. In Proceedings of the 2023 IEEE Open Conference of Electrical, Electronic and Information Sciences (eStream); IEEE: Vilnius, Lithuania, 2023; pp. 1–6. [Google Scholar] [CrossRef] [Scilit]
- Rohan, D.; Reddy, G.P.; Kumar, Y.V.P.; Prakash, K.P.; Reddy, C.P. An Extensive Experimental Analysis for Heart Disease Prediction Using Artificial Intelligence Techniques. Sci. Rep. 2025, 15, 6132. [Google Scholar] [CrossRef] [Scilit] [PubMed]
- Pradeep Reddy, G.; Rohan, D.; Venkata Pavan Kumar, Y.; Purna Prakash, K.; Kalyan Chakravarthi, M. Artificial Intelligence-Based Approach for Chronic Kidney Disease Detection. ASEAN Sci. Technol. Rep. 2025, 28, e258012. [Google Scholar] [CrossRef] [Scilit]
- Sanjeev, S.; Sai Ponnekanti, G.; Pradeep Reddy, G. Advanced Healthcare System Using Artificial Intelligence. In Proceedings of the 2021 11th International Conference on Cloud Computing, Data Science & Engineering (Confluence), Noida, India, 28–29 January 2021; IEEE: Noida, India, 2021; pp. 76–81. [Google Scholar] [CrossRef] [Scilit]
- Shrestha, K.; Rifat, H.M.J.O.; Biswas, U.; Tiang, J.-J.; Nahid, A.-A. Predicting the Recurrence of Differentiated Thyroid Cancer Using Whale Optimization-Based XGBoost Algorithm. Diagnostics 2025, 15, 1684. [Google Scholar] [CrossRef] [Scilit]
- Fountzilas, E.; Pearce, T.; Baysal, M.A.; Chakraborty, A.; Tsimberidou, A.M. Convergence of Evolving Artificial Intelligence and Machine Learning Techniques in Precision Oncology. NPJ Digit. Med. 2025, 8, 75. [Google Scholar] [CrossRef] [Scilit]
- Schindele, A.; Krebold, A.; Heiß, U.; Nimptsch, K.; Pfaehler, E.; Berr, C.; Bundschuh, R.A.; Wendler, T.; Kertels, O.; Tran-Gia, J.; et al. Interpretable Machine Learning for Thyroid Cancer Recurrence Predicton: Leveraging XGBoost and SHAP Analysis. Eur. J. Radiol. 2025, 186, 112049. [Google Scholar] [CrossRef] [Scilit]
- Penner, M.A.; Berger, D.; Guo, X.; Levman, J. Machine Learning in Differentiated Thyroid Cancer Recurrence and Risk Prediction. Appl. Sci. 2025, 15, 9397. [Google Scholar] [CrossRef] [Scilit]
- Onah, E.; Eze, U.J.; Abdulraheem, A.S.; Ezigbo, U.G.; Amorha, K.C.; Ntie-Kang, F. Optimizing Unsupervised Feature Engineering and Classification Pipelines for Differentiated Thyroid Cancer Recurrence Prediction. BMC Med. Inform. Decis. Mak. 2025, 25, 182. [Google Scholar] [CrossRef] [Scilit]
- Shen, P.; Yang, Z.; Sun, J.; Wang, Y.; Qiu, C.; Wang, Y.; Ren, Y.; Liu, S.; Cai, W.; Lu, H.; et al. Explainable Multimodal Deep Learning for Predicting Thyroid Cancer Lateral Lymph Node Metastasis Using Ultrasound Imaging. Nat. Commun. 2025, 16, 7052. [Google Scholar] [CrossRef] [Scilit]
- Obaido, G.; Achilonu, O.; Ogbuokiri, B.; Amadi, C.S.; Habeebullahi, L.; Ohalloran, T.; Chukwu, C.W.; Mienye, E.D.; Aliyu, M.; Fasawe, O.; et al. An Improved Framework for Detecting Thyroid Disease Using Filter-Based Feature Selection and Stacking Ensemble. IEEE Access 2024, 12, 89098–89112. [Google Scholar] [CrossRef] [Scilit]
- Clark, E.; Price, S.; Lucena, T.; Haberlein, B.; Wahbeh, A.; Seetan, R. Predictive Analytics for Thyroid Cancer Recurrence: A Machine Learning Approach. Knowledge 2024, 4, 557–570. [Google Scholar] [CrossRef] [Scilit]
- Alhashmi, S.M.; Polash, M.S.I.; Haque, A.; Rabbe, F.; Hossen, S.; Faruqui, N.; Abaker Targio Hashem, I.; Fathima Abubacker, N. Survival Analysis of Thyroid Cancer Patients Using Machine Learning Algorithms. IEEE Access 2024, 12, 61978–61990. [Google Scholar] [CrossRef] [Scilit]
- Książek, W. Explainable Thyroid Cancer Diagnosis Through Two-Level Machine Learning Optimization with an Improved Naked Mole-Rat Algorithm. Cancers 2024, 16, 4128. [Google Scholar] [CrossRef] [Scilit] [PubMed]
- Liu, J.; Feng, Z.; Gao, R.; Liu, P.; Meng, F.; Fan, L.; Liu, L.; Du, Y. Analysis of Risk Factors for Papillary Thyroid Carcinoma and the Association with Thyroid Function Indicators. Front. Endocrinol. 2024, 15, 1429932. [Google Scholar] [CrossRef] [Scilit] [PubMed]
- Barfejani, A.H.; Rahimi, M.; Safdari, H.; Gholizadeh, S.; Borzooei, S.; Roshanaei, G.; Golparian, M.; Tarokhian, A. Thy-DAMP: Deep Artificial Neural Network Model for Prediction of Thyroid Cancer Mortality. Eur. Arch. Otorhinolaryngol. 2025, 282, 1577–1583. [Google Scholar] [CrossRef] [Scilit] [PubMed]
- Wang, H.; Zhang, C.; Li, Q.; Tian, T.; Huang, R.; Qiu, J.; Tian, R. Development and Validation of Prediction Models for Papillary Thyroid Cancer Structural Recurrence Using Machine Learning Approaches. BMC Cancer 2024, 24, 427. [Google Scholar] [CrossRef] [Scilit]
- Chun, L.; Wang, D.; He, L.; Li, D.; Fu, Z.; Xue, S.; Su, X.; Zhou, J. Explainable Machine Learning Model for Predicting Paratracheal Lymph Node Metastasis in cN0 Papillary Thyroid Cancer. Sci. Rep. 2024, 14, 22361. [Google Scholar] [CrossRef] [Scilit]
- Kumari, P.; Kaur, B.; Rakhra, M.; Deka, A.; Byeon, H.; Asenso, E.; Rawat, A.K. Explainable Artificial Intelligence and Machine Learning Algorithms for Classification of Thyroid Disease. Discov. Appl. Sci. 2024, 6, 360. [Google Scholar] [CrossRef] [Scilit]
- Isiaka, R.M.; Babatunde, R.S.; Ajao, J.F.; Yusuff, S.R.; Popoola, D.D.; Arowolo, M.O.; Adewole, K.S. A Study of Impacts of Artificial Intelligence on COVID-19 Prediction, Diagnosis, Treatment, and Prognosis. J. Adv. Math. Comput. Sci. 2022, 10, 11–62. [Google Scholar] [CrossRef] [Scilit]
- Abdulsalam, S.O.; Arowolo, M.O.; Udofot, E.C.; Sanni, A.M.; Popoola, D.D.; Adebiyi, M.O. A KNN and ANN Model for Predicting Heart Diseases. In Explainable Artificial Intelligence in Medical Decision Support Systems; Imoize, A.L., Hemanth, J., Do, D.-T., Sur, S.N., Eds.; Institution of Engineering and Technology: Stevenage, UK, 2022; pp. 335–356. ISBN 978-1-83953-620-5. [Google Scholar] [CrossRef] [Scilit]
- Borzooei, S.; Briganti, G.; Golparian, M.; Lechien, J.R.; Tarokhian, A. Machine Learning for Risk Stratification of Thyroid Cancer Patients: A 15-Year Cohort Study. Eur. Arch. Otorhinolaryngol. 2024, 281, 2095–2104. [Google Scholar] [CrossRef] [Scilit]
- Thyroid Disease Data Set. Available online: https://www.kaggle.com/datasets/yasserhessein/thyroid-disease-data-set/data (accessed on 18 January 2026).
- Sasada, T.; Liu, Z.; Baba, T.; Hatano, K.; Kimura, Y. A Resampling Method for Imbalanced Datasets Considering Noise and Overlap. Procedia Comput. Sci. 2020, 176, 420–429. [Google Scholar] [CrossRef] [Scilit]
- Lundberg, S.; Lee, S.-I. A Unified Approach to Interpreting Model Predictions. arXiv 2017, arXiv:1705.07874. [Google Scholar] [CrossRef] [Scilit]



Disclaimer/Publisher’s Note: The statements, opinions and data contained in all publications are solely those of the individual author(s) and contributor(s) and not of MDPI and/or the editor(s). MDPI and/or the editor(s) disclaim responsibility for any injury to people or property resulting from any ideas, methods, instructions or products referred to in the content. |
© 2026 by the authors. Licensee MDPI, Basel, Switzerland. This article is an open access article distributed under the terms and conditions of the Creative Commons Attribution (CC BY) license.