


Abstract
Microplastics, plastic particles smaller than 5 mm, are now ubiquitous and represent a form of pollution that threatens ecosystems and human health, infiltrating the environment, air, and food chain. The search for solutions to microplastics requires industrial policies that limit plastic production and technological innovations for removal and recycling. Specifically, this paper reports a sustainable and cost-effective method for the detection of high-density polyethylene (HDPE) and low-density polyethylene (LDPE) microplastics using nitrogen-doped carbon dots (N-CD) synthesized from onion peel and L-cysteine via hydrothermal carbonization. Two precursor ratios (1:1 and 1:0.30 w/w) were evaluated. The resulting N-CDs exhibited bright yellow-green fluorescence (470–500 nm) and excitation-dependent photoluminescence under 365 nm UV light. FTIR and UV-Vis spectroscopy confirmed the presence of nitrogen-containing functional groups and effective graphitization, particularly in the 1:0.30 ratio. Fluorescence imaging revealed stronger intensity and greater stain uniformity in thermally softened MPs treated with 1:0.30 N-CDs, with a peak emission of 10,230.02 a.u. at 2 h and PMT 11—surpassing the 1:1 ratio. Bandgap and absorbance analyses supported the superior optical behavior of the lower-concentration formulation. Image analysis further indicated increased luminescent area over time, and two-way ANOVA confirmed statistically significant effects of heating time and PMT settings (p < 0.05). Compared to traditional filtration staining, thermal-assisted application offered enhanced and stable fluorescence. These findings demonstrate the efficacy of green-synthesized N-CDs for MP detection, with potential scalability and environmental applicability. Future work should explore alternative biomass sources and assess N-CD performance under field conditions to optimize environmental sensing strategies.
1. Introduction
Plastic pollution has become a major global concern as plastic production continues to rise. In the Philippines, approximately 61,000 metric tons of solid waste are generated daily, with about 24% being plastic from consumer goods and packaging [1]. This results in roughly 2.7 million tons of plastic waste annually, much of which ends up in marine environments. Relatively, over 300,000 tons of plastic are discarded into the ocean yearly, primarily from Manila Bay, where 80% are packaging plastics [1]. Improper waste management poses serious threats to biodiversity, with only about 55% of plastics being recycled.
Microplastics (MPs), defined as plastic particles smaller than 5 mm [2], originate from primary sources such as cosmetics and industrial abrasives, and secondary sources that arise from the degradation of larger plastic materials. Common polymers include polyethylene (PE), polypropylene (PP), and polystyrene (PS), which persist in aquatic, atmospheric, and terrestrial systems. These microplastics accumulate in sediments, soil, and organisms across trophic levels, raising concerns about ecological disruption and potential human health implications.
Accurate detection and quantification of microplastics remain challenging due to their small size, chemical diversity, and complex environmental distribution [3]. Recent advances in nanotechnology have introduced nitrogen-doped carbon dots (N-CDs) as a promising fluorescence-based sensing platform for MP detection [4]. N-CDs are nanoscale carbon-based materials containing nitrogen functionalities that enhance their photoluminescence through surface passivation, defect-state emission, and improved electronic transitions. Their excitation-dependent fluorescence, strong emission in the visible range, photostability, and aqueous dispersibility make them suitable for tagging polymer surfaces in environmental samples [5,6].
Nitrogen-doped carbon dots attach to polymeric microplastics through relative physiochemical properties relative to the interactions that help produce strong fluorescence signals. Polymers such as polyethylene are characterized as highly hydrophobic and have very few functional groups, which makes it difficult to stain using typical dyes. N-CDs overcome this by naturally attracting the nonpolar polymer through hydrophobic interactions and weak van der Waals forces when the carbon dots come into close contact with the plastic surface [7]. A gradual temperature increase toward the softening point partially melts the outer layer of polyethylene, enabling the N-CDs to settle and spread more uniformly across the polymer surface. Small nitrogen-containing groups on the N-CDs can also interact with tiny oxidation spots that commonly form on weathered polyethylene [8]. These combined effects make N-CDs more likely to attach to nonpolar, carbon-rich plastics like HDPE and LDPE than to more polar polymers.
Onion peel (Allium cepa), an abundant agricultural waste, serves as a sustainable precursor for carbon dot synthesis due to its high carbon content, polyphenols, flavonoids, and natural heteroatom compounds that facilitate nitrogen incorporation during carbonization [9]. These intrinsic properties enable the formation of graphitic cores and bright fluorescence without the need for hazardous chemical reagents. Utilizing onion peel supports waste valorization, circular economy principles, and environmentally friendly nanomaterial production. Previous studies have demonstrated that biomass-derived carbon dots exhibit tunable fluorescence, high quantum yield, and excellent stability, making them suitable for sensing and imaging applications [10].
Given the rising plastic pollution in the Philippines and the need for accessible, cost-effective detection technologies, this study aims to develop nitrogen-doped carbon dots synthesized from onion peel for fluorescence-based detection of HDPE and LDPE microplastics. This approach integrates waste-to-resource conversion with an emerging nanotechnology platform, offering a sustainable strategy for environmental monitoring.
2. Methodology
2.1. Materials and Instrument
Nitrogen-doped carbon dots (N-CDs) were synthesized from onion peels (Allium cepa) collected in Ermita, Manila, using L-cysteine (C3H7NO2S) as the nitrogen source to enhance fluorescence. Synthesis was done at Adamson University using a muffle furnace, centrifuge, and freeze dryer. FTIR, UV-Vis, and fluorescence spectroscopy characterized the N-CDs, confirming their potential for sustainable microplastic detection.
2.2. Preparation and Synthesis of Nitrogen-Doped Carbon Dots
Cleaned and dried onion peels (Allium cepa) were ground, sieved (200 μm), and mixed with L-cysteine at 1:1 and 1:0.30 w/w ratios in 30 mL distilled water. The mixture was hydrothermally treated at 200 °C for 6 h in a 150 mL Teflon-lined autoclave. The cooled solution was filtered, centrifuged at 12,000 rpm for 20 min, and passed through a 0.2 μm syringe filter to obtain a clear N-CD suspension for characterization.
2.3. Characterization of Nitrogen-Doped Carbon Dots
The synthesized N-CDs were characterized using UV-Fluorescence, UV-Vis, and FTIR spectroscopy to determine optical and structural properties. Fluorescence spectra (320–420 nm) showed strong blue-green emission at ~360 nm due to nitrogen incorporation and surface passivation. UV–Vis analysis revealed peaks at 260–280 nm (π–π* C=C) and 320–350 nm (n–π* C=O/C=N), confirming successful nitrogen doping. FTIR spectra showed broad bands at 3200–3500 cm−1 (O–H, N–H), 1650 cm−1 (C=O), and 1050–1250 cm−1 (C–N, C–O), indicating nitrogen- and oxygen-containing functional groups. The data extracted from the UV-Vis is used to determine the band gap to discuss the photoelectrical property characterizing the electron transition for the MP detection. This is facilitated using the Tauc equation:
where α represents the absorption coefficient, while hν refers to the photon energy. A is a constant associated with the type of electronic transition occurring in the material. The value Eg corresponds to the optical band gap, expressed in electron volts (eV). The exponent n indicates the nature of the electronic transition: a value of 2 represents an indirect allowed transition, which is typical for carbon dots, whereas a value of 1/2 represents a direct allowed transition.
2.4. Microplastic Detection Analysis
The staining performance of N-CDs toward microplastics was assessed using granulated HDPE and LDPE (≈100 µm). A mass of 0.1–0.2 g of each polymer was mixed with 3–5 mL of N-CD solutions (1:1 and 1:0.30 w/w) and heated at 60 °C for 30–120 min to promote surface interaction. After treatment, samples were diluted with 10 mL deionized water, filtered, and examined using a 365 nm UV-fluorescence spectrophotometer and a UV-Vis spectrophotometer to quantify fluorescence and optical absorption. For environmental simulation, 0.2 g of microplastics was dispersed in 10 mL deionized water containing 25 w/w N-CDs, stirred at room temperature for 30 min, and visualized under 365 nm UV light to capture fluorescence images. As a limitation, granulated pristine HDPE and LDPE represent only a simplified model and do not fully mimic the surface chemistry of environmentally aged microplastics.
3. Result and Discussion
3.1. Data Presentation
3.1.1. Synthesized Nitrogen-Doped Carbon Dots Derived from Onion Peel
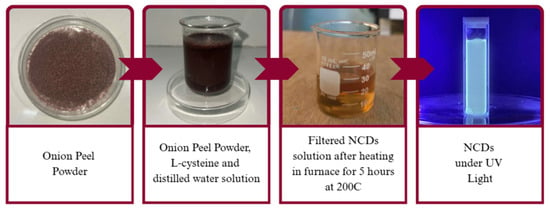
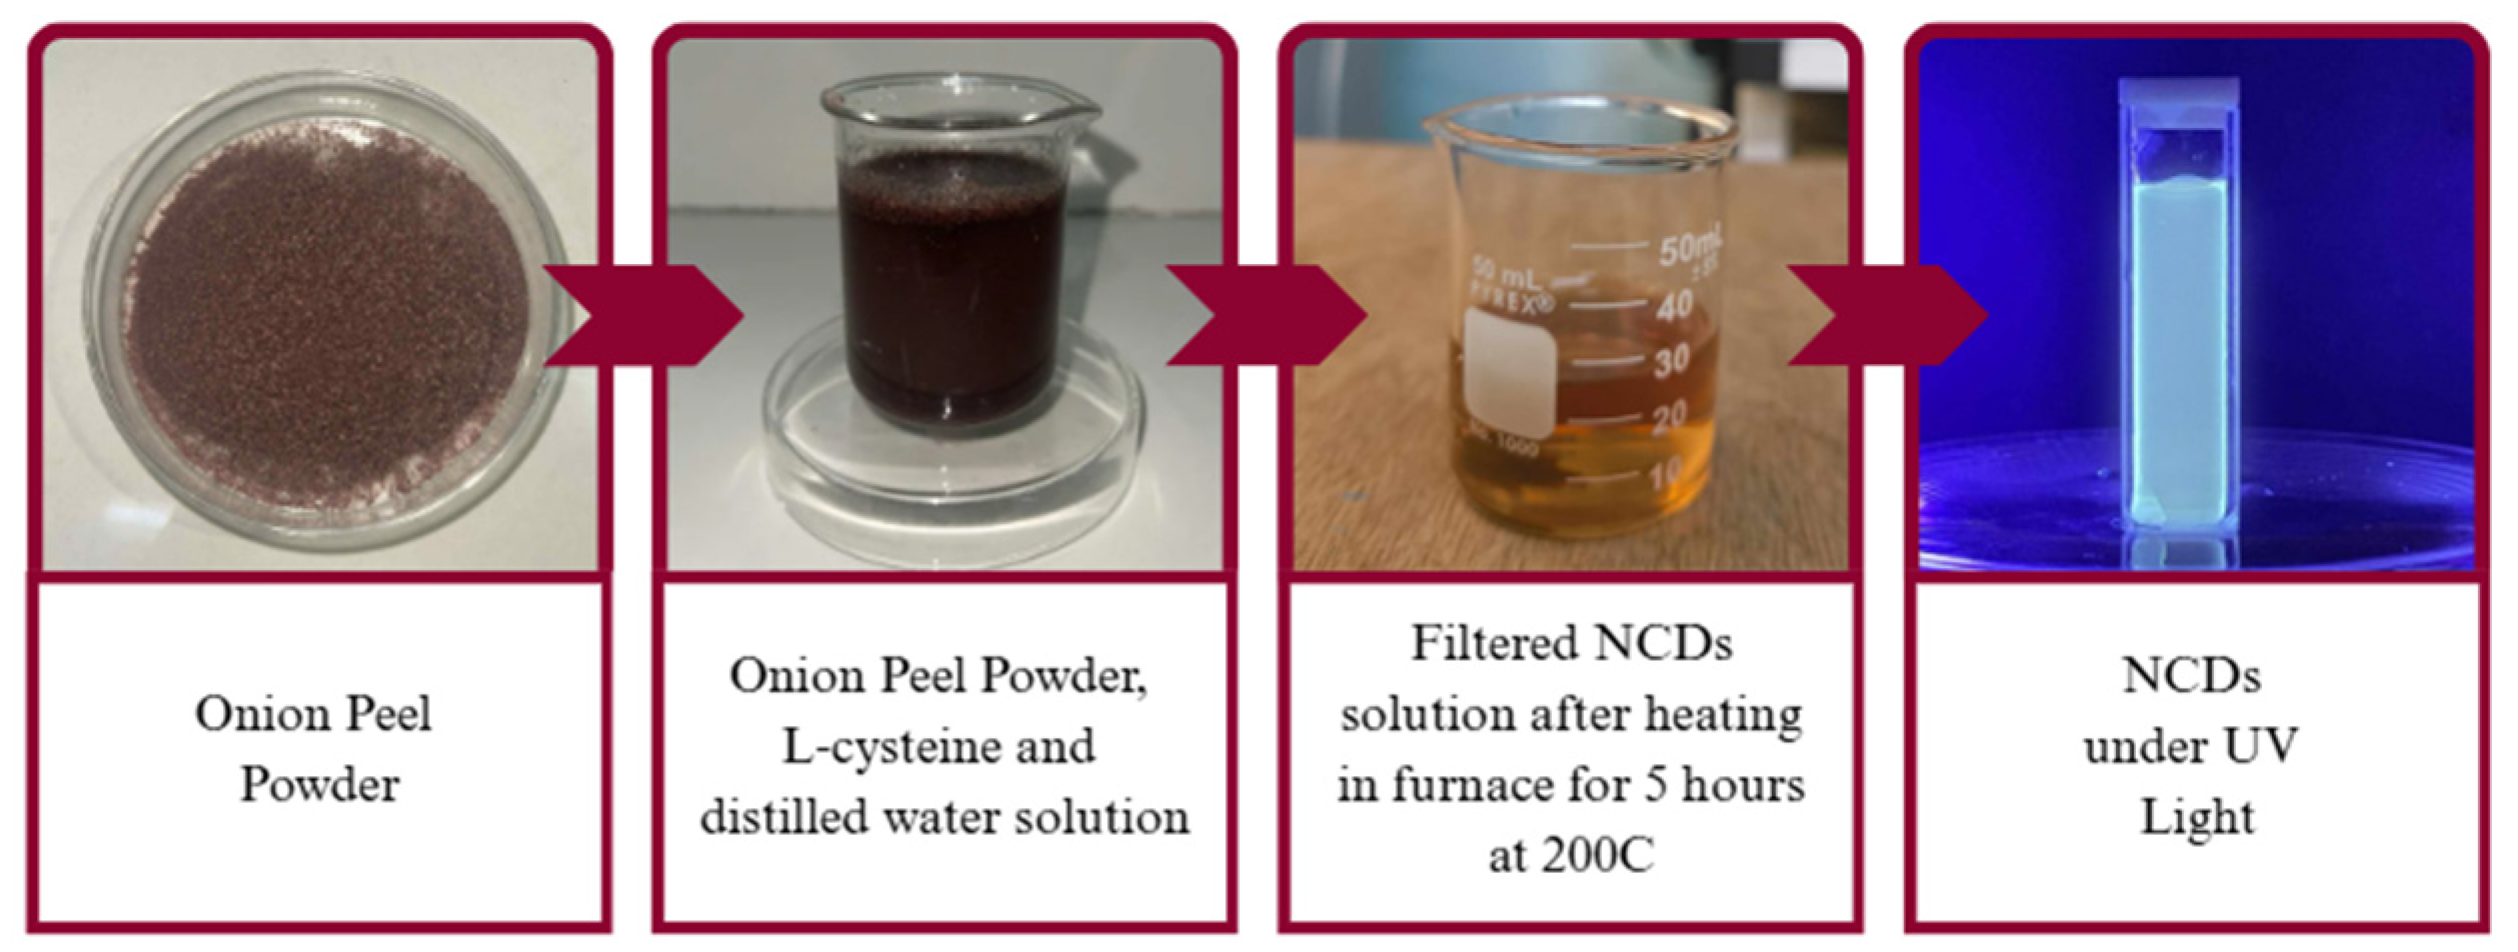
The hydrothermal synthesis successfully produced nitrogen-doped carbon dots (N-CDs) from onion peel and L-cysteine, yielding stable fluorescent nanomaterials with tunable surface properties presented in Figure 1. Thermal decomposition, aromatization, and nitrogen doping facilitated the conversion of biomass into N-CDs. The 1:0.30 ratio exhibited stronger and more uniform fluorescence due to improved nitrogen incorporation and surface control. These results demonstrate the potential of N-CDs for environmental sensing applications, particularly in microplastic detection.
Figure 1.
Synthesis of Nitrogen-Doped Carbon Dots (N-CDS) derived from Onion Peel Powder (OPP).
3.1.2. Characterization of Nitrogen-Doped Carbon Dots from Onion Peel Powder (OPP) Synthesized at 1:1 and 1:0.30 w/w Ratios Using FTIR, UV-Vis, and Fluorescence Spectroscopy
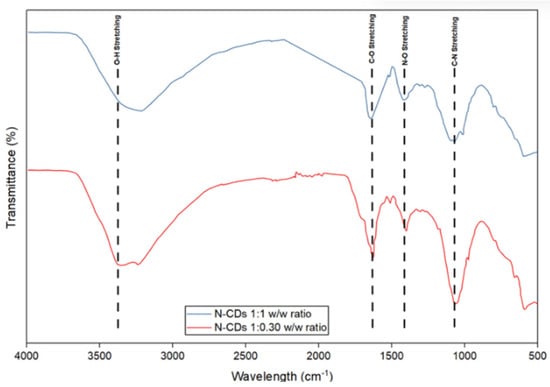
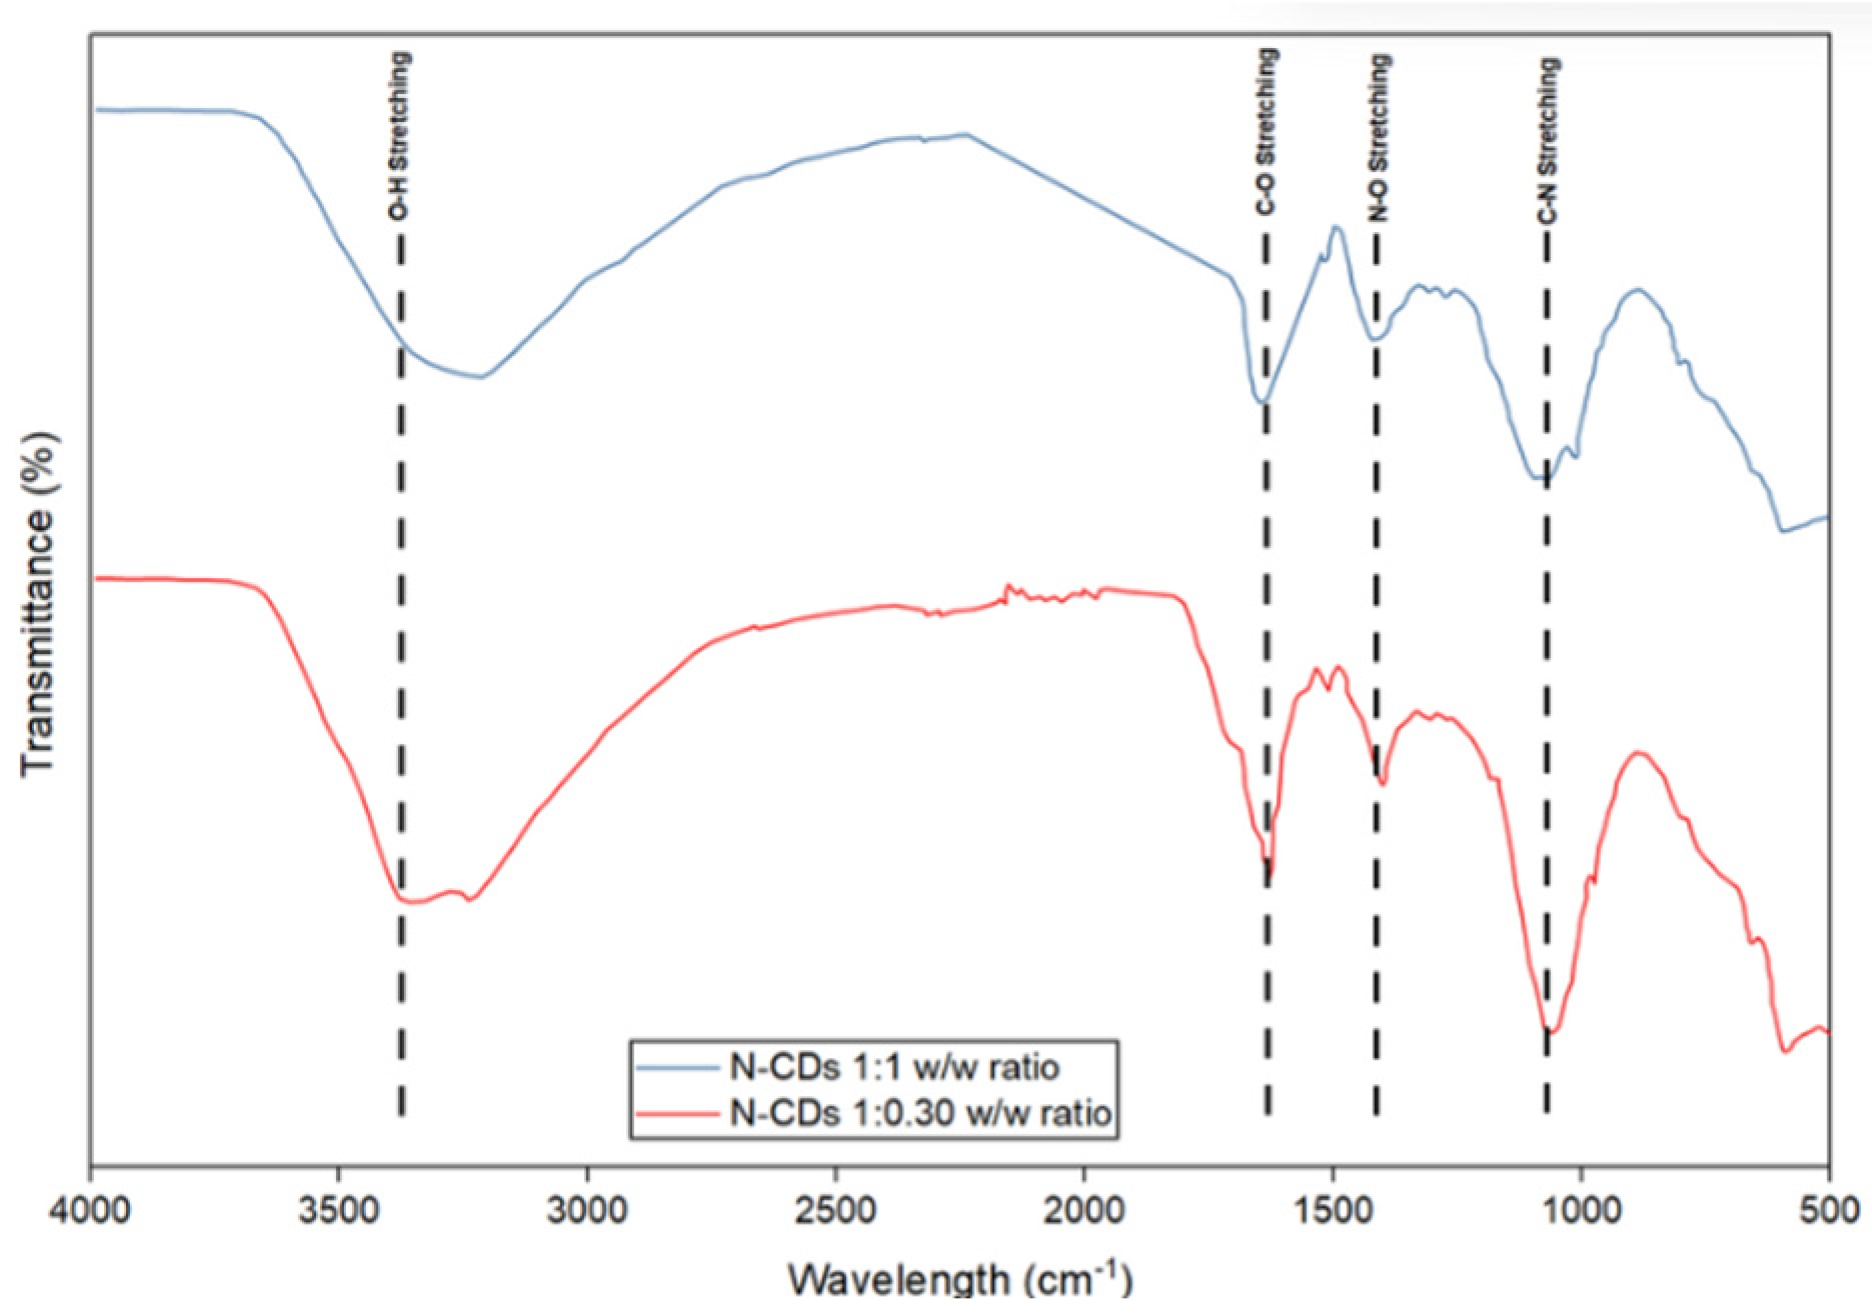
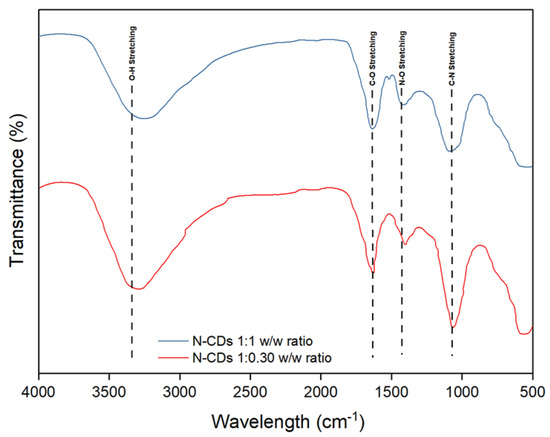
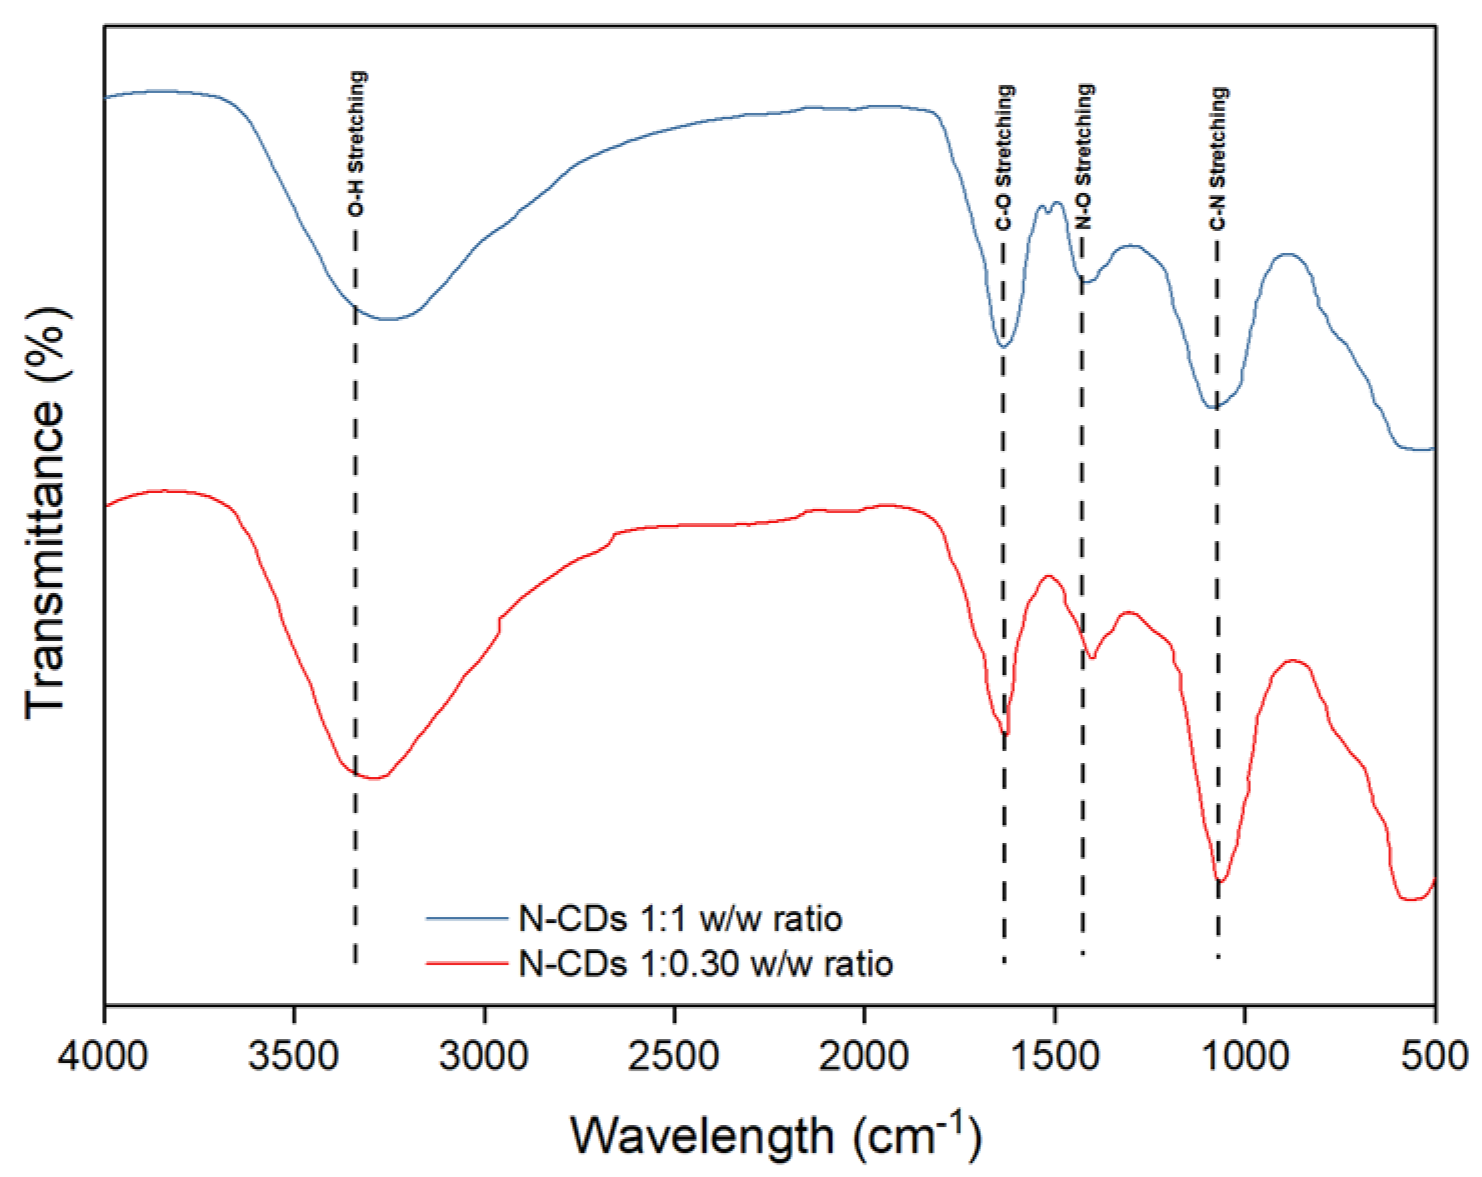
Fourier-transform infrared (FTIR) analysis was conducted to identify the functional groups present on the nitrogen-doped carbon dots (N-CDs) synthesized from onion peel and L-cysteine at 1:1 and 1:0.30 w/w ratios as shown in Figure 2. The 1:1 sample exhibited clear absorption bands at 3233 cm−1 (O–H/N–H), 1650 cm−1 (C=O/C=N), 1424 cm−1 (C–N/N–O), 1075 cm−1 (C–O/C–N), and 597 cm−1 (C–S), reflecting pronounced nitrogen incorporation into the carbon framework. The 1:0.30 sample showed a comparable set of peaks, confirming the presence of key nitrogen- and oxygen-containing functional groups. These results align with the fluorescence findings, as the addition of L-cysteine facilitates nitrogen doping, which improves surface passivation, fluorescence intensity, and particle stability. The observed C–N, N–H, and C=O functional groups confirm successful nitrogen modification of the carbon dots, supporting their effectiveness for fluorescence-based microplastic detection.
Figure 2.
FTIR Analysis of Nitrogen-Doped Carbon Dots from OPP.
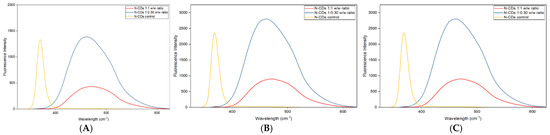
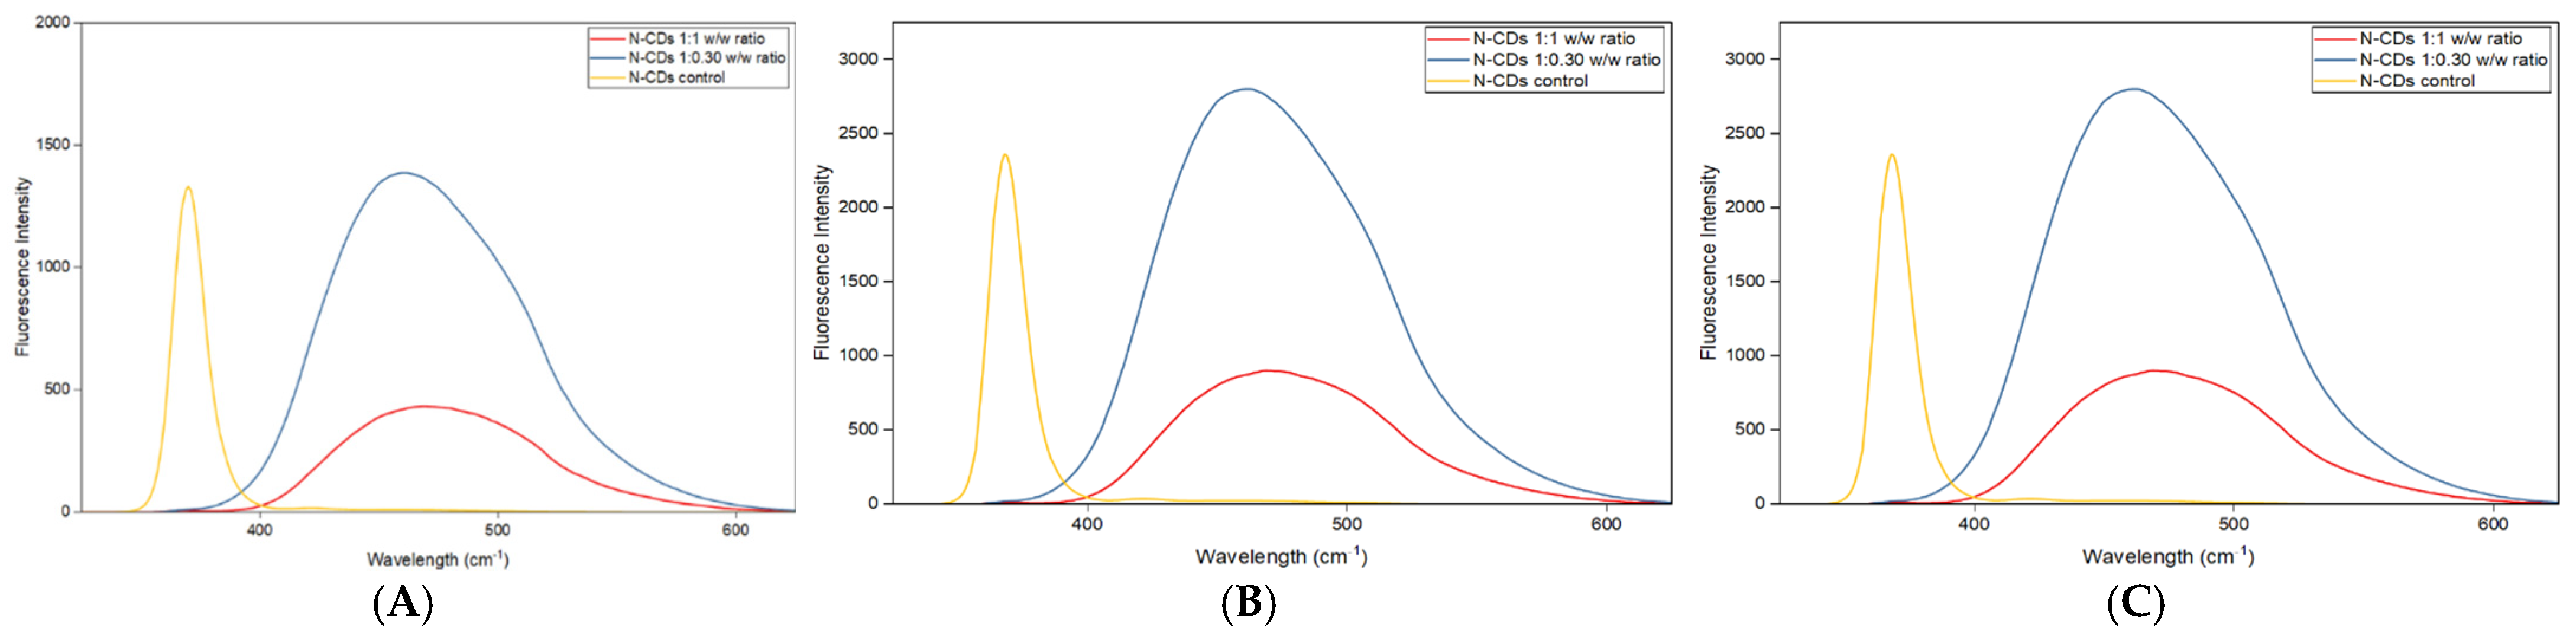
The UV-fluorescence spectra of N-CDs at 1:0.30 and 1:1 ratios, measured using Photomultiplier Tubes (PMT) 9, 10, and 11, showed strong emission peaks between 470–500 nm, characteristic of carbon dots presented in Figure 3. PMT 11 recorded the highest intensity (~5000 a.u.), while PMT 9 had the lowest (~1500 a.u.). In contrast, control carbon dots emitted at 350–400 nm, confirming that nitrogen doping shifts emission and enhances fluorescence. The 1:0.30 ratio produced the most intense fluorescence peak absorbance against the controlled and the 1:1 ratio. The variation of PMT levels facilitates the N-CDs excites at higher level exhibiting higher absorbance of illuminated N-CDs [11]. This can be attributed due to higher nitrogen incorporation and surface passivation, improving quantum yield and reproducibility [12]. These results confirm onion peel-derived N-CDs as effective, sustainable fluorescent probes for microplastic detection.
Figure 3.
(A) UV-Fluorescence at PMT 9, (B) UV-Fluorescence at PMT 10, (C) UV-Fluorescence at PMT 11.
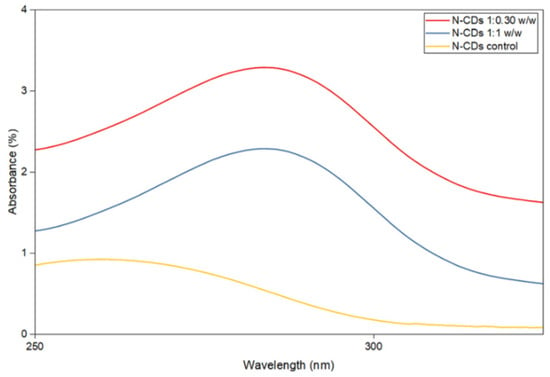
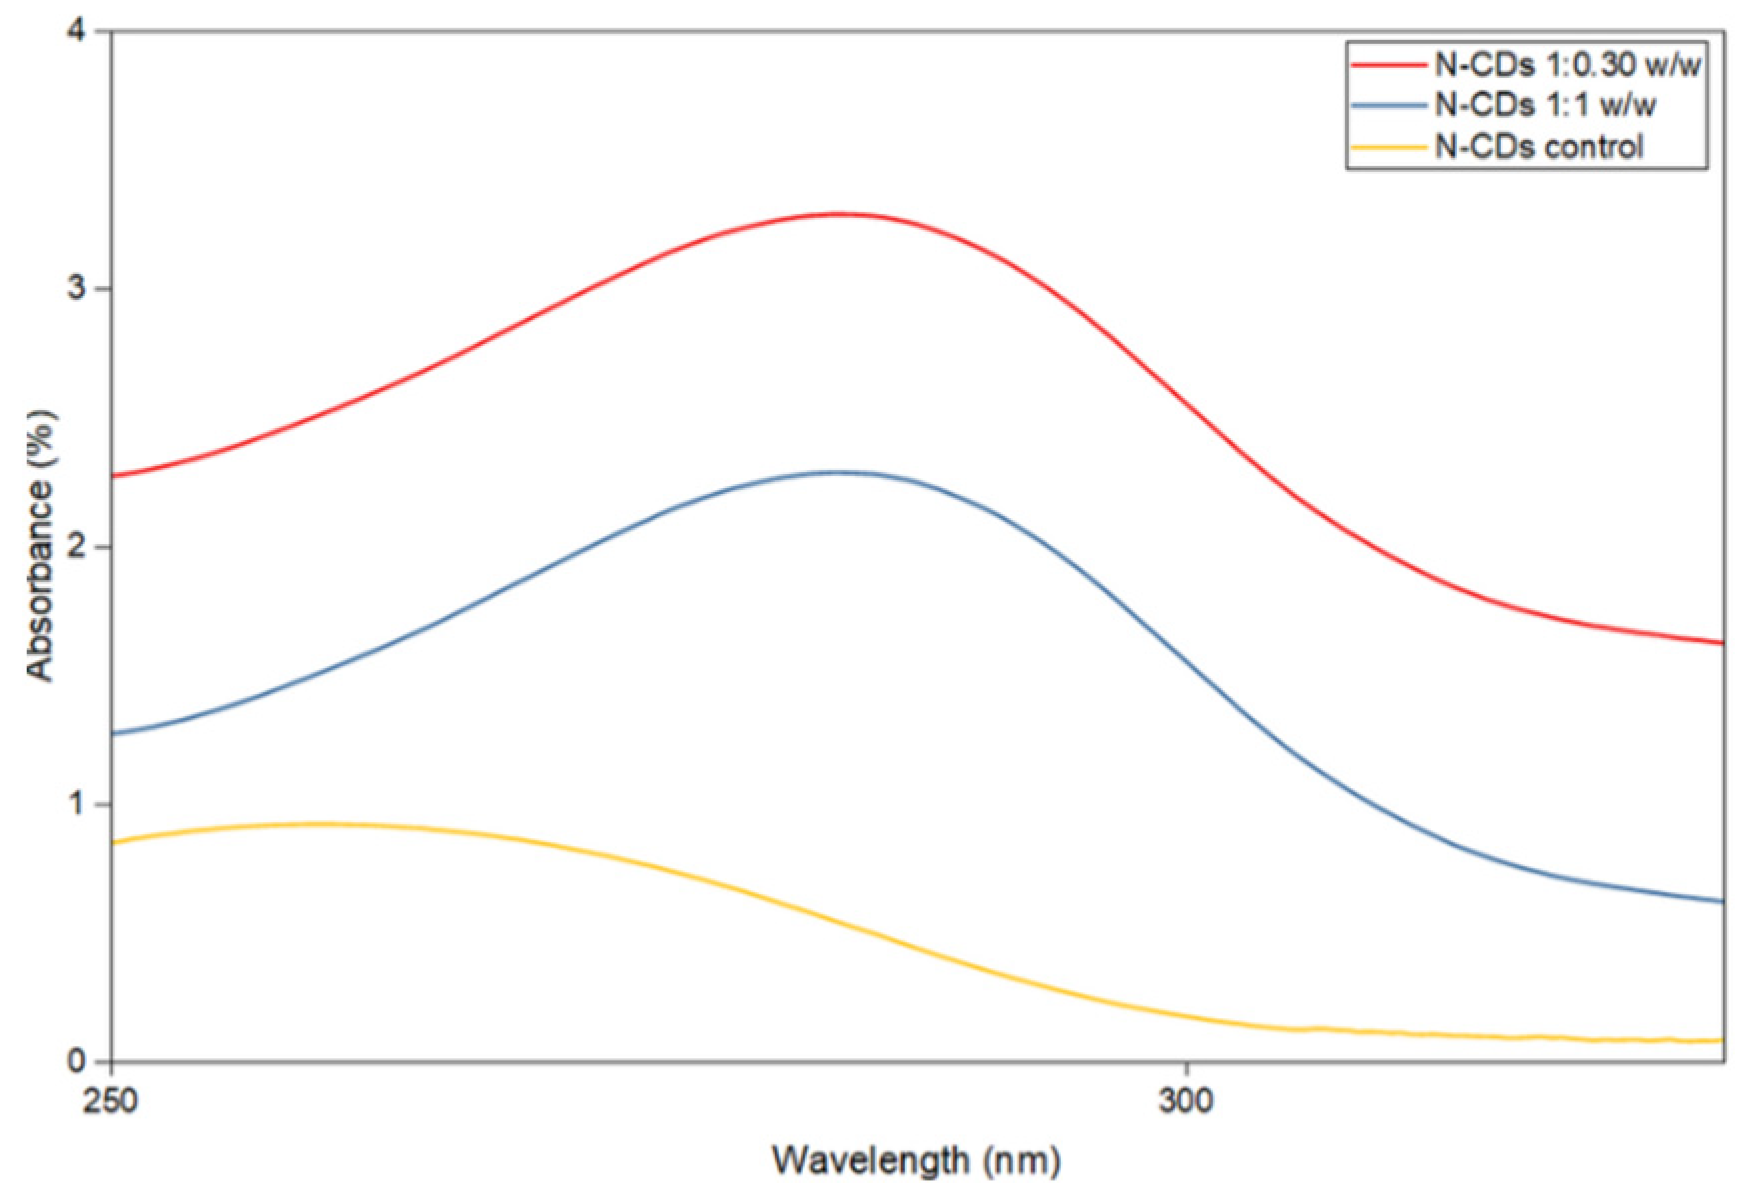
UV-Vis spectroscopy (Figure 4) showed strong absorption peaks at 280–290 nm for N-CDs synthesized at 1:0.30 and 1:1.00 w/w ratios, confirming graphitic C=C π–π* transitions. The 1:0.30 ratio had the highest absorbance, indicating better surface passivation and light absorption, while the 1:1.00 ratio showed lower intensity due to aggregation. Control samples exhibited weaker, blue-shifted peaks near 260 nm. Overall, the 1:0.30 N-CDs displayed superior optical properties for fluorescence-based microplastic detection.
Figure 4.
UV-Vis Spectrophotometry of Nitrogen-Doped Carbon Dots.
3.1.3. Application of Nitrogen-Doped Carbon Dots in Microplastics (High-Density Polyethylene (HDPE) and Low-Density Polyethylene (LDPE)) Detection
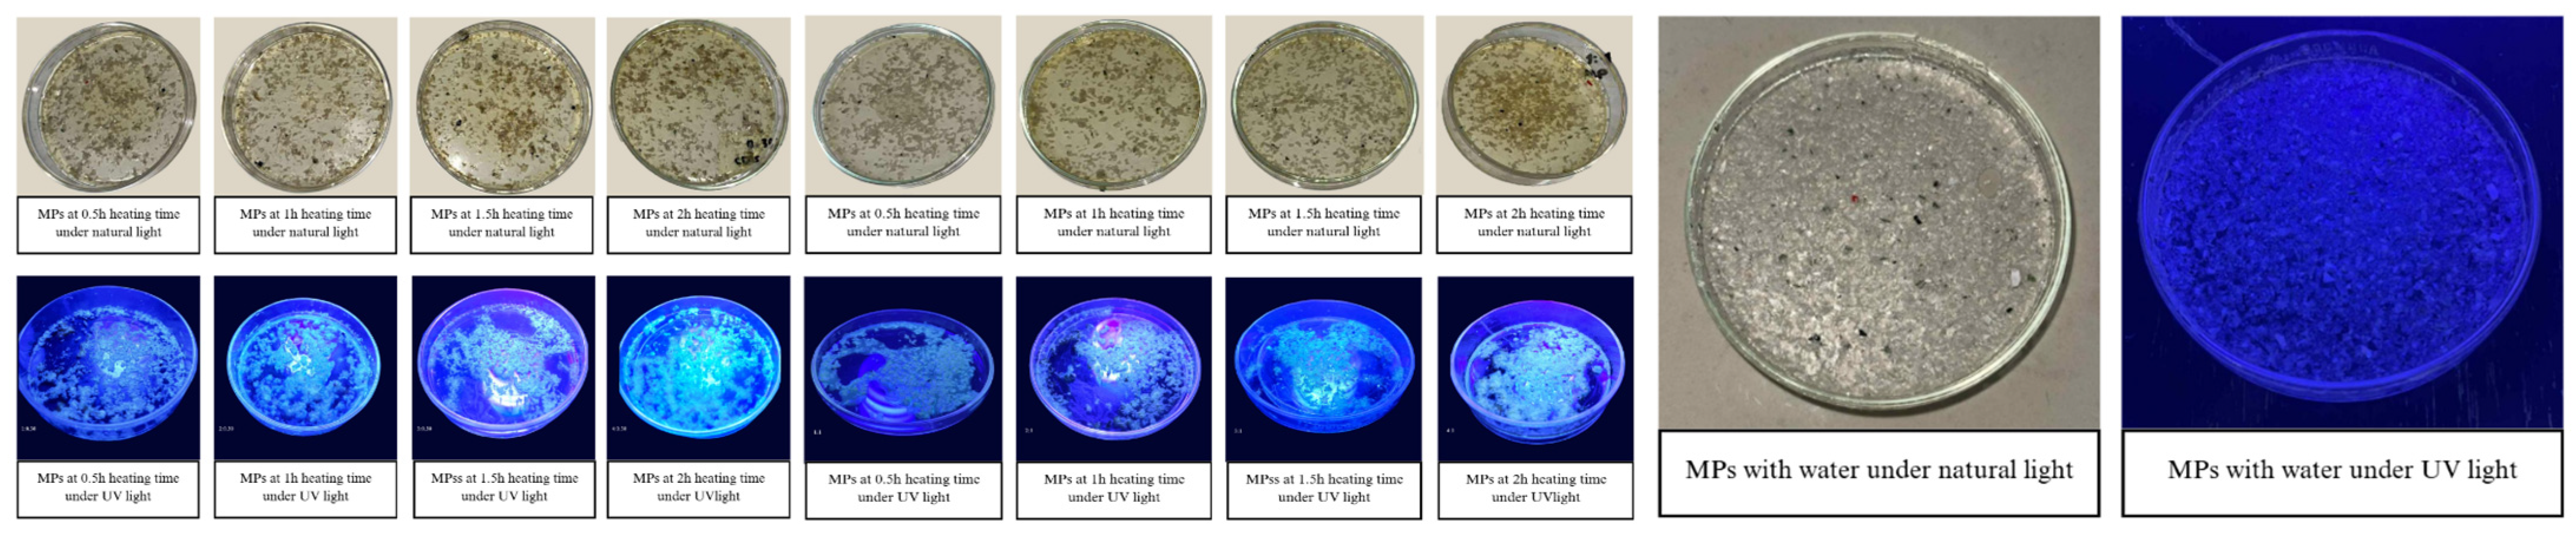
Figure 5 illustrates the fluorescence of HDPE and LDPE microplastics (MPs) tagged with nitrogen-doped carbon dots (N-CDs) at 1:0.30 and 1:1.00 w/w ratios after heating for 0.5–2 h. Both samples showed increasing yellow-green fluorescence with longer heating, as elevated temperatures enhanced N-CD adhesion and diffusion on softened MP surfaces. The 1:0.30 ratio exhibited stronger and more uniform fluorescence, attributed to better surface passivation and optimal nitrogen functionality, while the 1:1.00 ratio likely experienced particle aggregation. HDPE and LDPE were chosen for their environmental relevance and compatibility with N-CDs’ hydrophobic surfaces, resulting in efficient tagging. Overall, the results confirm that optimally synthesized N-CDs effectively label polyethylene-based microplastics, supporting their use in fluorescence-based environmental monitoring.
Figure 5.
Nitrogen-doped Carbon Dots-labeled microplastics at different heating time (0.5 h, 1 h, 1.5 h, and 2 h).
3.1.4. Characterization of Nitrogen-Doped Carbon Dots as Fluorescent Markers for Microplastic Detection
Figure 6 shows the FTIR spectra of HDPE and LDPE microplastics tagged with N-CDs at 1:1.00 and 1:0.30 w/w ratios. Both exhibited broad O–H stretching (3300–3400 cm−1) and C–H stretching (2800–2900 cm−1) bands, confirming hydroxyl and organic group presence. Peaks at 1650 cm−1 (C=O) and 1000–1200 cm−1 (C–O/C–N) indicate chemical interaction between N-CDs and polymer surfaces, while CH2 vibrations (2800–2950, 1460, and 720–730 cm−1) confirm the polyethylene backbone. The stronger peak intensities in the 1:0.30 w/w sample suggest enhanced nitrogen incorporation and stronger surface bonding, verifying effective N-CD–microplastic interaction.
Figure 6.
Fourier Transform Infrared (FTIR) Result of Microplastics in Nitrogen–Doped Carbon Dots (N-CDs at various concentrations.
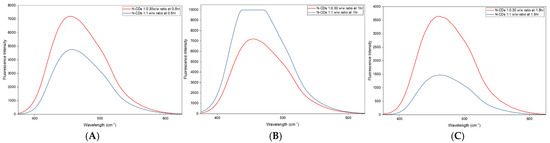
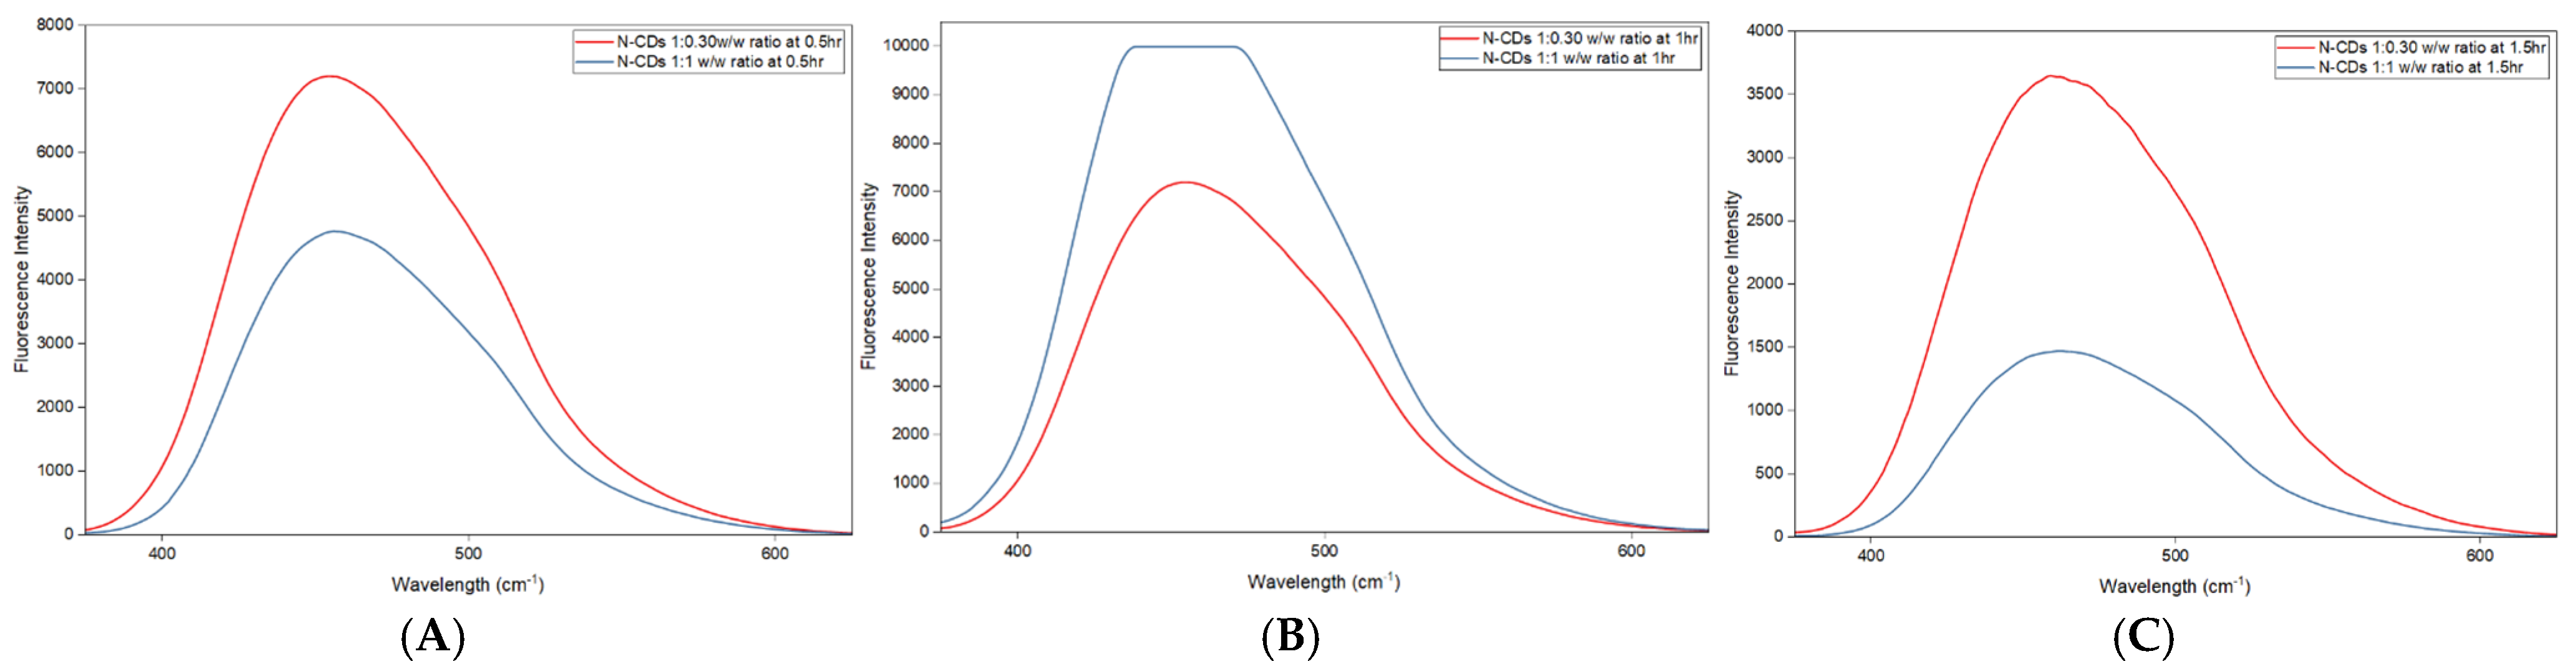
The CDs PMT level 11 are observed in UV-Fluorescence Spectrophotometer (Figure 7A–C). Under PMT 11 and 2 h of heating (Figure 7C), N-CDs exhibited the highest fluorescence intensity, with sharp emission peaks at 450–475 nm, typical of nitrogen-doped carbon structures [4,10]. The 1:0.30 w/w ratio produced the strongest and most stable fluorescence, attributed to improved particle dispersion and optimal nitrogen doping that enhanced surface passivation [12,13]. In contrast, the 1:1.00 w/w ratio showed lower emission intensity (~10,000 a.u.), likely due to self-quenching and aggregation at higher precursor concentrations [14].
Figure 7.
UV—Fluorescence Spectrophotometer of various w/w ratio at PMT level 11 at 0.5, 1, 2 h. Note: (A) 1:1 and 1:0.30 w/w ratio at 0.5 h, (B) 0.30 and 1.00 ratio at 1 h, (C) 0.30 and 1.00 ratio at 2 h.
These results confirm that the 2-h heated N-CDs at PMT 11 provide the most efficient emission and stable fluorescence response, representing the optimal synthesis and detection condition. This is likely due to improved graphitization and nitrogen incorporation enhancing electronic transitions and charge transfer. The consistent emission peak further indicates strong electrostatic and hydrophobic interactions between N-CDs and polyethylene microplastics [15,16]. Relative to the study of Ho et al., 2024 [17] utilized the Nile red as staining agent it exhibits emission maxima around 430–496 nm wave spectrum when bound to polyethylene microplastics, with reported fluorescence intensities in the range of 2000–6000 a.u. depending on concentration and solvent conditions. This mobilized that N-CDs can facilitate rapid identification of MPs.
Overall, the 1:0.30 w/w N-CDs heated for 2 h under PMT 11 achieved the highest fluorescence intensity and signal stability, demonstrating their potential as robust, eco-friendly fluorescent markers for microplastic detection [5,16].
3.1.5. UV-Vis Spectrophotometry of N-CDs Interacting with HDPE and LDPE Microplastics
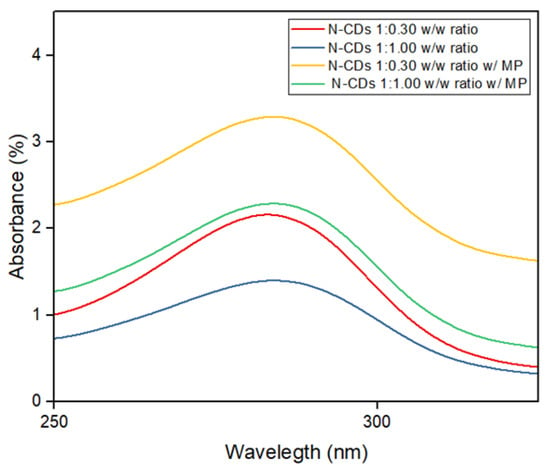
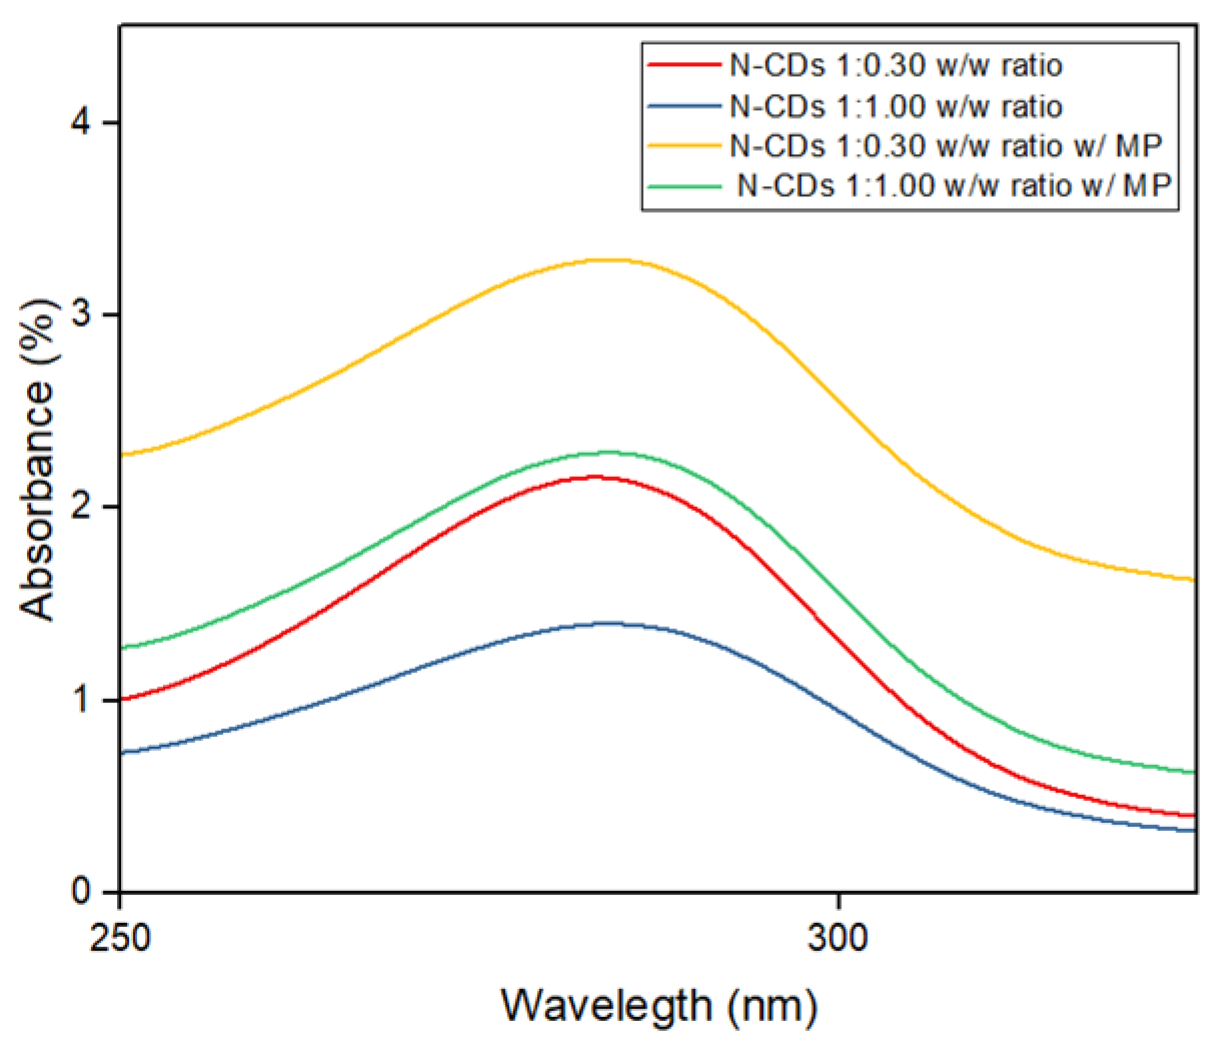
The UV-Vis spectra (Figure 8) of nitrogen-doped carbon dots (N-CDs) at 1:0.30 and 1:1.00 w/w ratios, with and without microplastics, show distinct absorption peaks between 280–290 nm, corresponding to π–π* transitions of aromatic C=C bonds. The 1:0.30 w/w N-CDs exhibited higher absorbance than the 1:1.00 w/w sample, suggesting that higher concentrations may lead to aggregation or quenching effects.
Figure 8.
UV-vis Spectrophotometer Comparison of N-Cds with 1:0.30 and 1:1 w/w ratio with and without Microplastics.
When microplastics were introduced, both N-CD samples showed a significant increase in absorbance the 1:0.30 w/w sample reached a peak of 3.3%. This indicates strong N-CD–microplastic interactions, likely due to improved dispersion, light scattering, or local electronic changes. Overall, the 1:0.30 w/w ratio with microplastics demonstrated the highest optical activity, making it ideal for fluorescence-based detection.
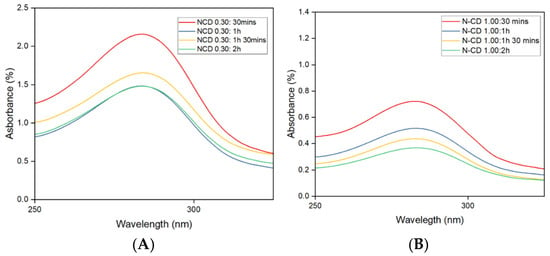
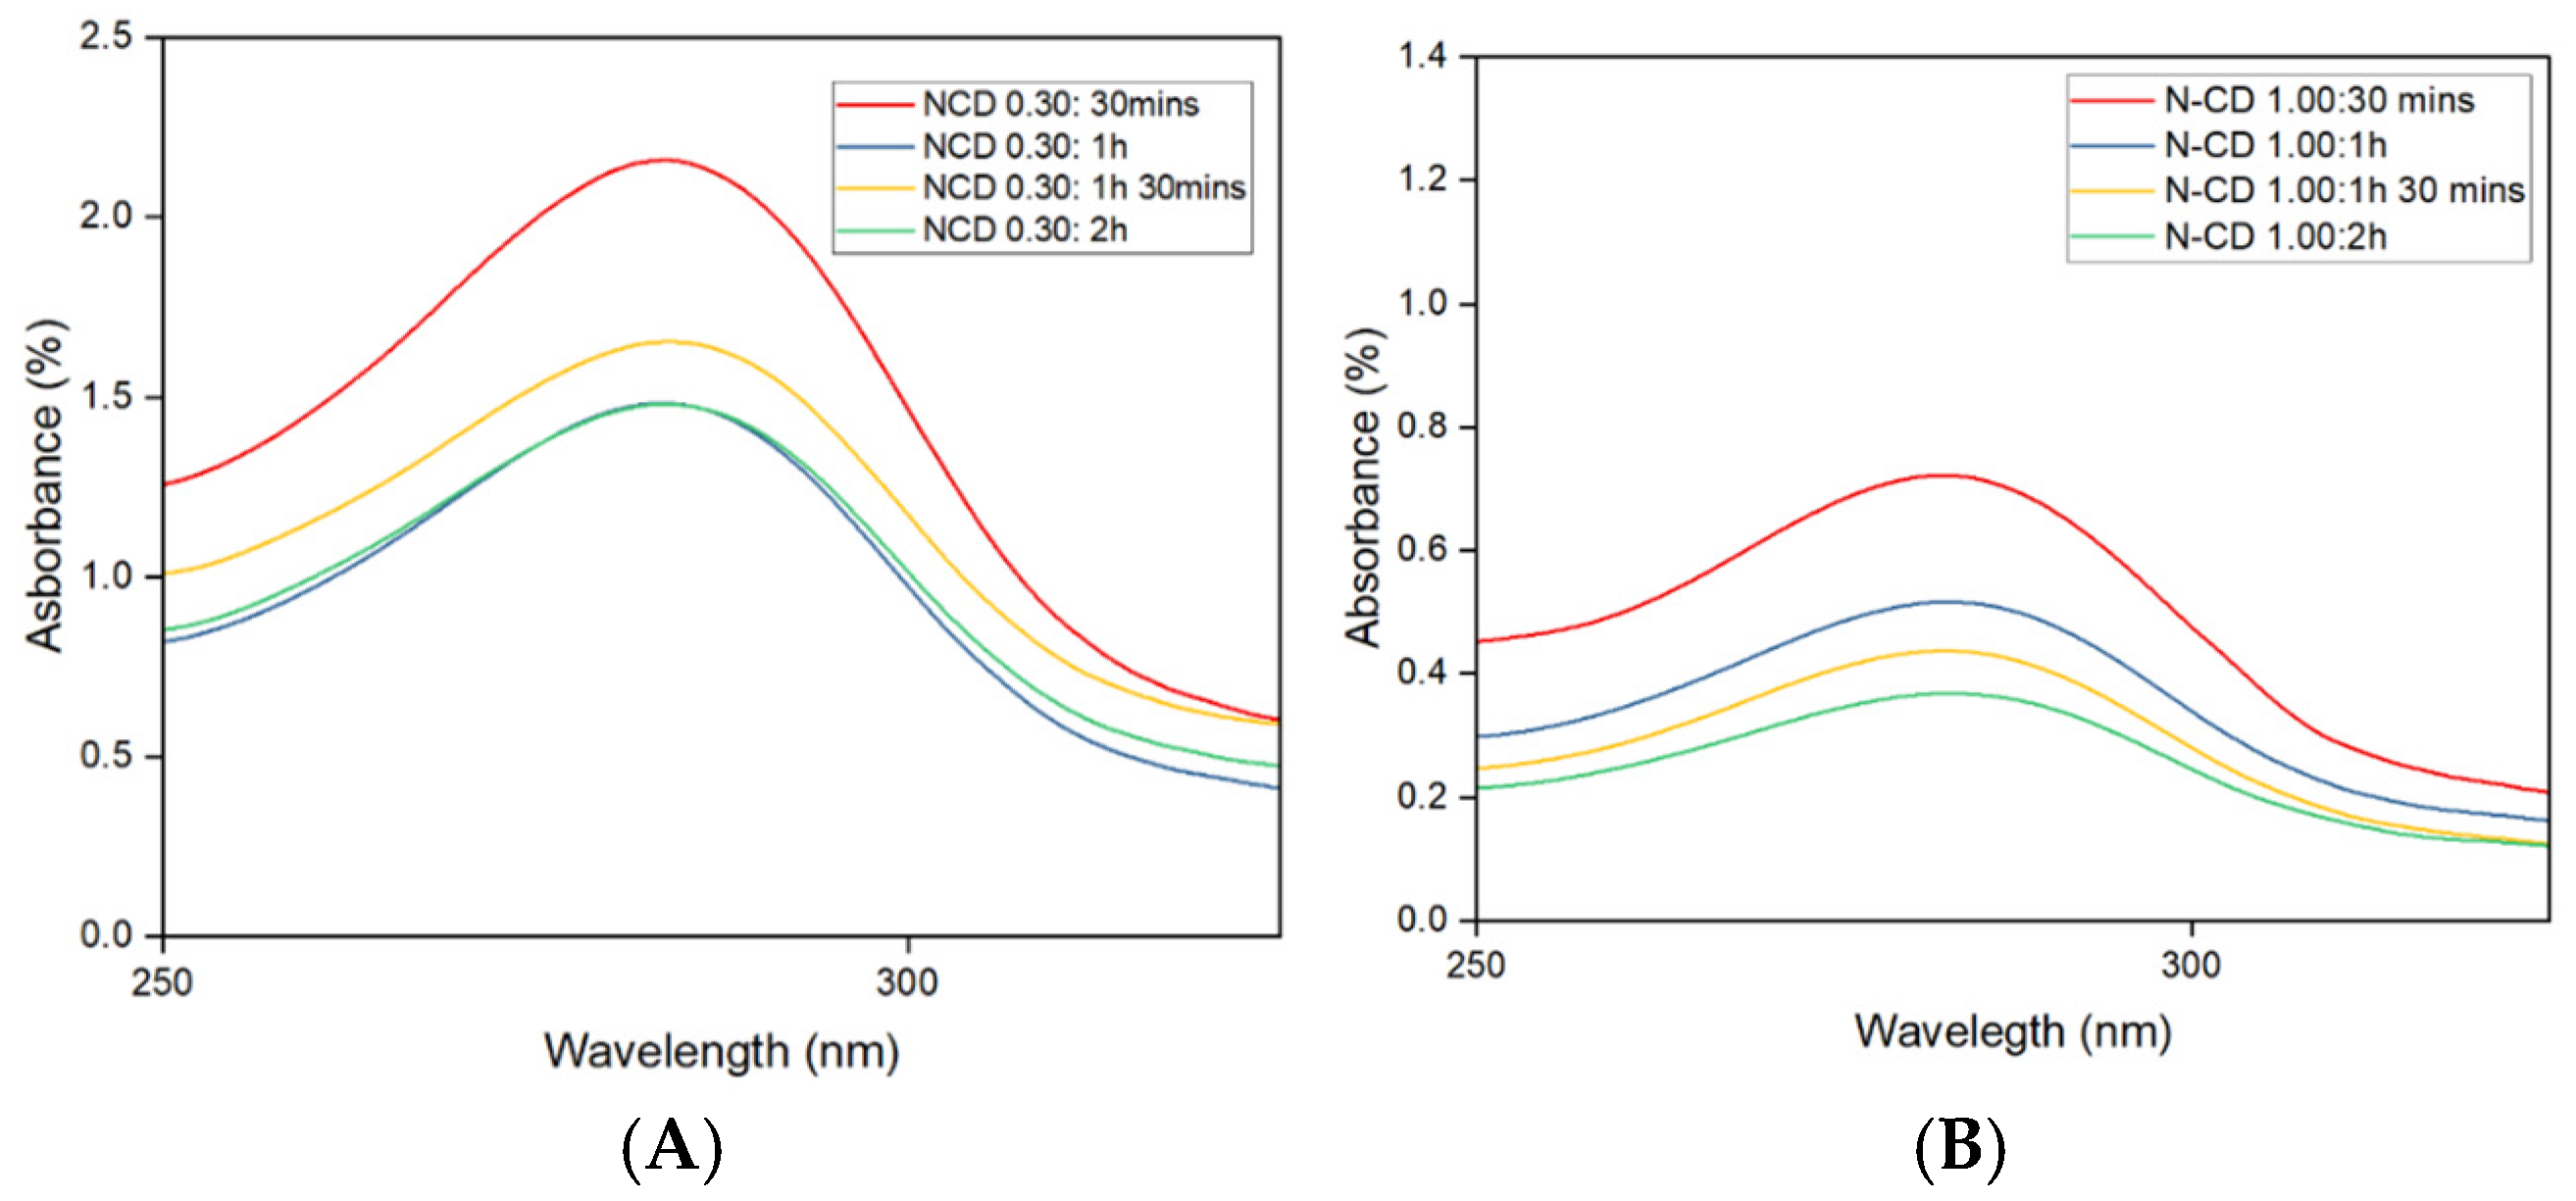
When N-CD samples at 0.30 and 1.00 w/w ratios were heated for 0.5–2 h, both showed distinct absorption peaks between 280–290 nm under UV-Vis (Figure 9A,B), characteristic of π–π* transitions in the carbon lattice. At 0.5 h, the 0.30 w/w sample reached its highest absorbance (over 2.0%), which gradually decreased with longer heating. This decline suggests possible particle aggregation, decomposition, or altered binding with microplastics. Similarly, the 1.00 w/w sample exhibited a lower overall absorbance, peaking at 0.75% at 0.5 h before declining over time. The consistent drop in both ratios indicates that prolonged heating reduces the optical efficiency of N-CD–microplastic systems, likely due to thermal degradation or aggregation effects.
Figure 9.
UV-Vis Spectrophotometer of N-CDs of different ratios with microplastics with four varying times (A) at 0.30 and (B) 1.00 w/w ratios were heated for 0.5–2 h.
3.1.6. Bandgap Analysis of N-CDs and Their Interaction with HDPE and LDPE Microplastics
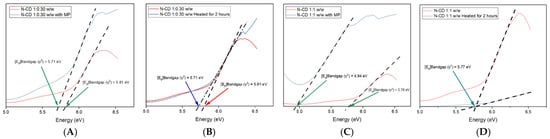
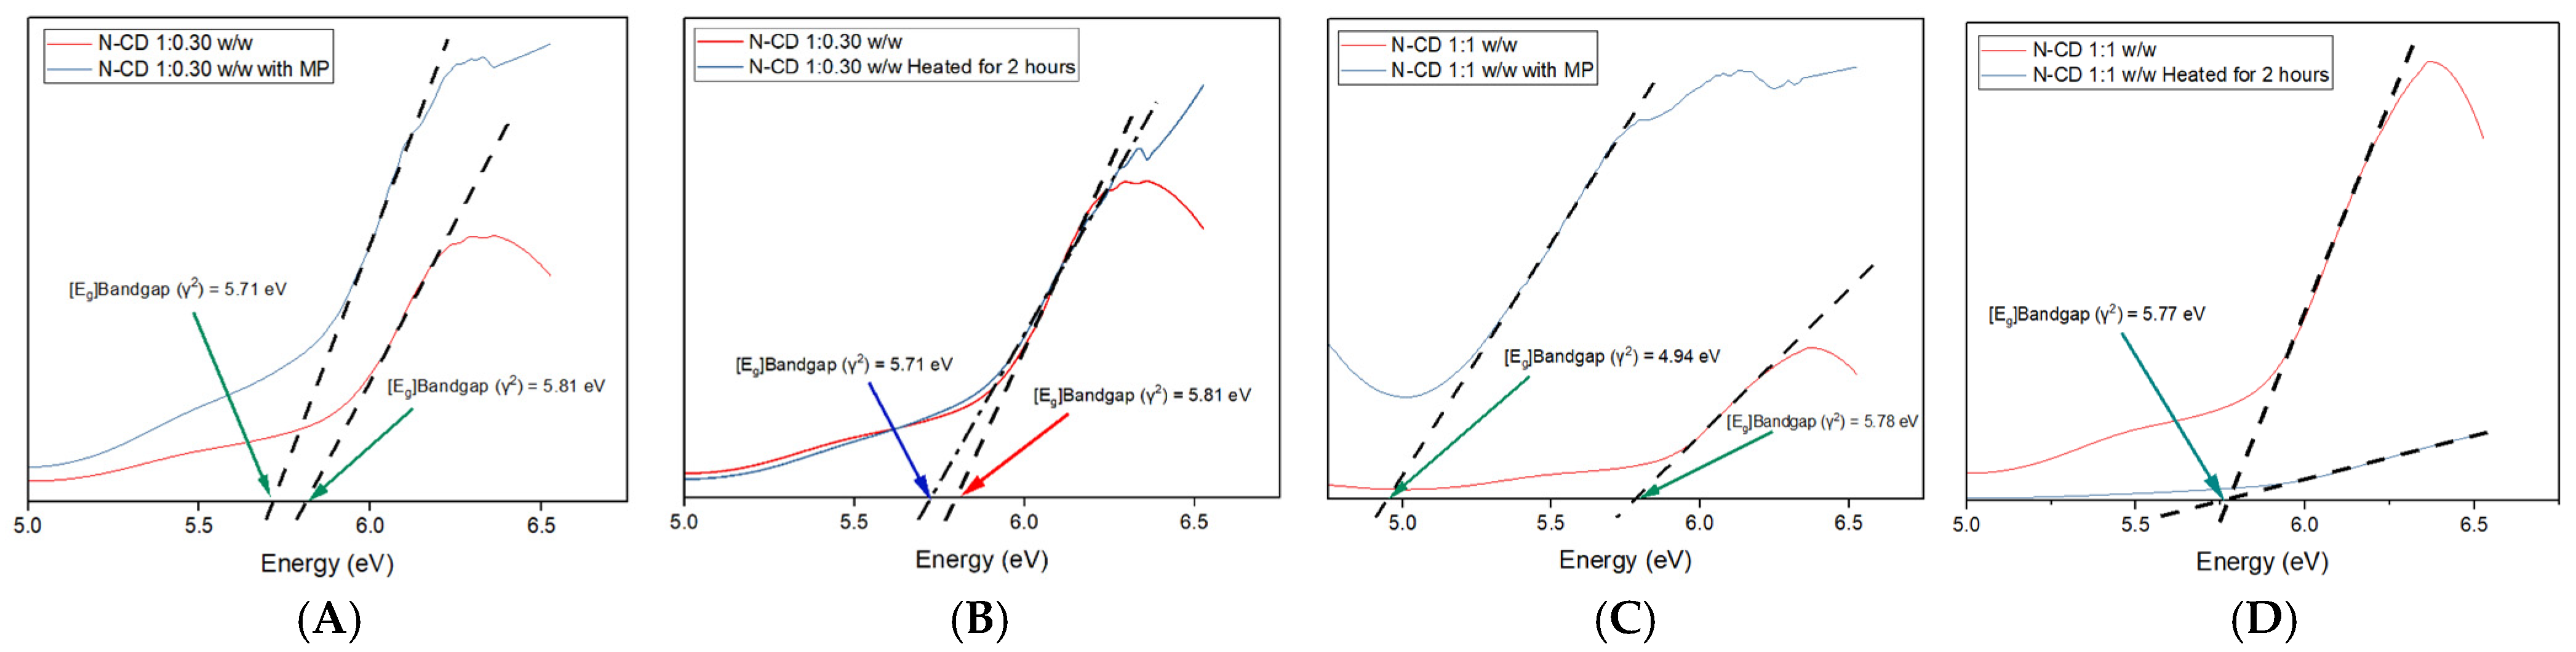
Figure 10A,B show that the bandgap of nitrogen-doped carbon dots (N-CDs) decreases after microplastic addition from 5.81 eV to 5.71 eV indicating altered electronic behavior. This reduction suggests that surface interactions, charge transfer, or chemical rearrangements between N-CDs and microplastics modify the material’s conductivity and optical properties.
Figure 10.
Bandgap of N-CDs with Microplastics (A) at 1:0.30 and 1 h heating; (B) at 1:0.30 and 2 h heating; (C) at 1:1 and 1 h heating; (D) at 1:0.30 and 2 h heating.
At a 1.00 w/w ratio, the bandgap drops further to 4.94 eV when mixed with microplastics, implying defect formation or enhanced charge mobility. After two hours of heating, the bandgap nearly disappears, suggesting a transition toward metallic behavior due to structural rearrangement and increased graphitization.
Overall, heat and microplastic presence jointly influence the electronic and optical behavior of N-CDs enhancing conductivity but reducing bandgap energy is an important consideration for optimizing these materials in fluorescence sensing and environmental detection applications.
3.1.7. Two-Way ANOVA of UV-Fluorescence Interaction Between N-CDs
A two-way ANOVA evaluated the effects of heating time (0–2 h) and photomultiplier tube (PMT) settings (9–11) on the fluorescence intensity of nitrogen-doped carbon dots (N-CDs) synthesized at 1:1 and 1:0.30 w/w ratios presented in Table 1. Control samples (0 h) already showed stronger baseline fluorescence for the 1:0.30 ratio, reaching nearly 5000 under PMT 11, compared to 968–1058 for the 1:1 ratio—indicating better emission efficiency at lower dopant levels.
Table 1.
Two-way ANOVA of UV-Fluorescence Interaction at Different PMT Value in Concentration of N-CDs with MPs.
Statistical results confirmed this, as the 1:0.30 group yielded higher F-values (sample: 72,603.20; PMT: 1,946,148; interaction: 72,553.42) and greater total variance explained (7.77 × 10⁸ vs. 4.41 × 10⁸), suggesting more consistent fluorescence and uniform particle behavior. Fluorescence intensity increased with heating time, peaking at 2 h—likely due to optimal graphitization and nitrogen incorporation—but declined beyond this due to over-carbonization and surface defect loss.
Higher PMT settings (especially PMT 11) consistently amplified fluorescence signals, confirming detector sensitivity’s importance. Overall, the 1:0.30 w/w ratio, 2-h heating duration, and high PMT sensitivity yielded the most stable and intense fluorescence, confirming these conditions as optimal for producing N-CDs suitable for microplastic detection.
4. Conclusions
The study developed an eco-friendly method to synthesize nitrogen-doped carbon dots (N-CDs) from onion peel using L-cysteine for microplastic detection. The 1:1 ratio produced strong fluorescence, confirmed by FTIR peaks of O–H, N–H, C=O, and C–N bonds. UV-fluorescence and UV-Vis analyses showed that N-CDs emitted strong light (470–500 nm) and interacted well with microplastics, with peak absorption at 0.5 h of heating. Bandgap reduction (5.81–5.71 eV) indicated improved charge transfer and graphitization after prolonged heating. N-CDs effectively stained HDPE and LDPE microplastics, producing bright yellow-green fluorescence. The 1:0.30 ratio achieved stronger and more uniform staining. Two-way ANOVA confirmed that heating time and PMT settings significantly affected fluorescence, with 2 h and higher PMT levels yielding the best results. Overall, onion peel-derived N-CDs provide a low-cost, sustainable, and effective approach for detecting microplastics, showcasing waste-to-resource innovation for environmental monitoring.
Author Contributions
Conceptualization, R.V.R., A.N.S., N.P.D. and C.E.; methodology, C.E., R.V.R., M.S.S.P. and F.J.D.; software, J.V.; validation, C.E., M.S.S.P. and J.V., writing—original draft preparation, C.E., M.S.S.P. and F.J.D.; writing—review and editing, C.E.; visualization, J.V. All authors have read and agreed to the published version of the manuscript.
Funding
This research received no external funding.
Data Availability Statement
The data that support the findings of this study are available from the corresponding author on reasonable request.
Conflicts of Interest
The authors declare no conflicts of interest.
References
- International Atomic Energy Agency. NUTEC Plastics: The Philippines Forges Ahead with Radiation Technology for Plastic Recycling; IAEA: Vienna, Austria, 2024. [Google Scholar]
- Ashrafy, A.; Liza, A.A.; Islam, M.N.; Billah, M.M.; Arafat, S.T.; Rahman, M.M.; Rahman, S.M. Microplastics Pollution: A Brief Review of Its Source and Abundance in Different Aquatic Ecosystems. J. Hazard. Mater. Adv. 2023, 9, 100215. [Google Scholar] [CrossRef] [Scilit]
- Latiza, R.J.P.; Olay, J.; Eguico, C.; Yan, R.J.; Rubi, R.V. Surface matters: Passivation in carbon dot synthesis—A critical review. J. Mater. Sci. 2025, 9, 5006–5018. [Google Scholar] [CrossRef] [Scilit]
- Bankoti, K.; Rameshbabu, A.P.; Datta, S.; Das, B.; Mitra, A.; Dhara, S. Onion derived carbon nanodots for live cell imaging and accelerated skin wound healing. J. Mater. Chem. B 2017, 5, 6579–6592. [Google Scholar] [CrossRef] [Scilit] [PubMed]
- Wei, Z.; Wang, B.; Liu, Y.; Liu, Z.; Zhang, H.; Zhang, S.; Chang, J.; Lu, S. Green synthesis of nitrogen and sulfur co-doped carbon dots from Allium fistulosum for cell imaging. New J. Chem. 2019, 43, 718–723. [Google Scholar] [CrossRef] [Scilit]
- Singh, P.; Kumar, S.; Kumar, K. Biogenic synthesis of Allium cepa derived magnetic carbon dots for enhanced photocatalytic degradation of methylene blue and rhodamine B dyes. Biomass Convers. Biorefin. 2025, 15, 869–887. [Google Scholar] [CrossRef] [Scilit]
- Rizvi, M.; Gerengi, H.; Gupta, P. Functionalization of Nanomaterials: Synthesis and Characterization. In Functionalized Nanomaterials for Corrosion Mitigation: Synthesis, Characterization, and Applications; ACS Symposium Series; American Chemical Society: Washington, DC, USA, 2022; pp. 1–26. [Google Scholar]
- Sheikh, M.A.; Chandok, R.S.; Abida, K. Green perspective of N-CDs towards energy crisis and photodegradation of toxic dyes. Discov. Mater. 2024, 4, 9. [Google Scholar] [CrossRef] [Scilit]
- Lim, H.N.; Nurzulaikha, R.; Huang, N.M. Green synthesis of carbon dots from biomass waste for sustainable nanomaterial applications. J. Environ. Chem. Eng. 2021, 9, 105661. [Google Scholar]
- Zhang, M.; Li, P.; Wu, D. Editorial for Special Issue: “Synthesis and Application of Biomass-Derived Carbon-Based Nanomaterial”. Nanomaterials 2023, 13, 2020. [Google Scholar] [CrossRef] [Scilit]
- Dilip Kumar, K.; Praveenkumar, V.; Satyabrata, S.; Harekrishna, P.; Smrutirekha, M. Carbon dots and their polymeric nanocomposites: Insight into their synthesis, photoluminescence mechanisms, and recent trends in sensing applications. ACS Omega 2024, 9, 11050–11080. [Google Scholar] [CrossRef] [Scilit] [PubMed]
- Alcaraz, J.R.; Olay, J.; Eguico, C.; Yan, R.J.; Mendoza, M.; Floresca-Lacsa, F.J.; Godezano, J.; Rubi, R.V.C. A systematic review of microplastic detection in water. In Proceedings of the 3rd International Electronic Conference on Processes—Green and Sustainable Process Engineering and Process Systems Engineering, Online, 29–31 May 2024; p. 150. [Google Scholar]
- Li, W.; Liu, Y.-Y.; Bai, Y.; Wang, J.; Pang, H. Anchoring ZIF-67 particles on amidoximerized polyacrylonitrile fibers for radionuclide sequestration in wastewater and seawater. J. Hazard. Mater. 2020, 395, 122692. [Google Scholar] [CrossRef] [Scilit] [PubMed]
- Liu, J.; Li, R.; Yang, B. Carbon Dots: A New Type of Carbon-Based Nanomaterial with Wide Applications. ACS Cent. Sci. 2020, 6, 2179–2195. [Google Scholar] [CrossRef] [Scilit] [PubMed]
- Zhao, H.; Jiang, Z.; Wang, C.; Li, Y. Preparation of N, Cl Co-Doped Lignin Carbon Quantum Dots and Detection of Microplastics in Water. Crystals 2023, 13, 983. [Google Scholar] [CrossRef] [Scilit]
- Liu, C.; Jiao, Y.; Yang, C.; Li, B.; Li, W.; Qian, T.; Liu, X. Interfacial interactions of submicron plastics with carbon dots: Insights into the interface properties of microplastic weathering. Water Res. 2025, 277, 123377. [Google Scholar] [CrossRef] [Scilit] [PubMed]
- Ho, D.; Liu, S.; Wei, H.; Karthikeyan, K.G. The glowing potential of Nile red for microplastics Identification: Science and mechanism of fluorescence staining. Microchem. J. 2024, 197, 109708. [Google Scholar] [CrossRef] [Scilit]

Disclaimer/Publisher’s Note: The statements, opinions and data contained in all publications are solely those of the individual author(s) and contributor(s) and not of MDPI and/or the editor(s). MDPI and/or the editor(s) disclaim responsibility for any injury to people or property resulting from any ideas, methods, instructions or products referred to in the content. |
© 2025 by the authors. Licensee MDPI, Basel, Switzerland. This article is an open access article distributed under the terms and conditions of the Creative Commons Attribution (CC BY) license (https://creativecommons.org/licenses/by/4.0/).