


Abstract
In the context of the energy transition and the increasing deployment of low-carbon gases (hydrogen, biomethane), reliable analytical monitoring is required to support integrity assessment and traceability of gas infrastructures under diverse on-site conditions while limiting analytical costs through standardized sampling and a single analytical system. We developed and validated integrated workflows combining sampling and laboratory analysis for chemical and compound-specific isotope analysis (CSIA) of natural gas and associated gaseous effluents in underground storage. An original quantification approach was implemented, linking sampling pressure to the amount of each compound collected in vials, and coupled with δ13C and δ2H measurements of alkanes (C1–C3), CO2 and H2. Two complementary sampling modes were optimized and compared: conventional high-pressure cylinders and direct collection into vacuum-sealed vials suitable for a broad range of pressures and field conditions. Using reference gas mixtures and operational samples, both approaches showed good reproducibility and isotopic accuracy during laboratory validation and over two years of monitoring. In particular, δ2H determinations for alkanes and H2 remained robust under low-pressure sampling typical of annular spaces (~1–2 bar), despite gas-composition fluctuations. These validated methodologies provide a flexible basis for routine, standardized monitoring of stored and circulating gases, including emerging low-carbon components.
1. Introduction
Gas infrastructures—encompassing production, transport, distribution, and storage systems for methane, biomethane, hydrogen, and carbon dioxide are a cornerstone of the modern energy transition. They ensure supply flexibility, support large-scale energy storage, and contribute to the decarbonization and resilience of energy networks. Yet, the physical and chemical environments within these infrastructures are dynamic, and the transported or stored gases can be affected by a range of processes, including gas migration and leakage [1,2,3], microbial activity [4,5,6], and geochemical or material interactions with fluids, rocks, and engineered surfaces [7,8,9]. High-resolution, continuous monitoring is therefore critical to detect subtle anomalies and reaction pathways that may influence gas composition, transport efficiency, or containment integrity. Integrating advanced analytical tools—such as molecular and isotopic fingerprinting—into routine surveillance programs enables the early identification of deviations from baseline conditions. Such data-driven insights not only facilitate timely operational adjustments but also deepen our understanding of gas behavior and reactivity within complex infrastructure systems, ultimately supporting their safe, efficient, and long-term performance.
Gas sampling within monitoring programs requires standardized protocols designed to preserve the integrity of collected samples and avoid fractionation or contamination [10,11,12,13]. Common approaches include direct sampling from pipelines, injection, production, or observation wells using pressurized cylinders as described in GPA 2166-22 standard [14], as well as specialized tools capable of capturing fluids under representative pressure and temperature conditions. The choice of sampling frequency and location is guided by system heterogeneity, operational dynamics, and the need to capture representative temporal and spatial variability [15]. Strict quality control during sample collection, storage, and transport is essential to ensure reliable downstream molecular and isotopic analyses [16].
Chemical characterization is typically performed using gas chromatography (GC) to quantify hydrocarbon fractions (C1–C6+) and non-hydrocarbon gases such as CO2, N2, and H2S [11,17]. Stable isotope analyses, commonly achieved through isotope ratio mass spectrometry (IRMS) or cavity ring-down spectroscopy (CRDS), provide valuable tracers for identifying gas origin, migration pathways, and geochemical alterations [18,19,20]. More advanced techniques, such as compound-specific isotope analysis (CSIA), allow the isotopic composition of individual hydrocarbons (e.g., methane, ethane, propane) to be measured with high precision [9,18,19], enabling detailed interpretation of mixing processes, biodegradation, or thermochemical transformations [2,3,6]. The integration of chemical and isotopic data and tools enhances the capacity to detect subtle changes that may indicate reservoir or operational anomalies.
The analytical methodology developed in this study enables highly precise chemical and isotopic monitoring of industrial gas infrastructures. The sampling system, previously described and used by A. Lecharlier et al. [21] for laboratory applications, has been further optimized here for on-site industrial gas sampling. This latter is applicable to a wide range of field conditions and sampling locations, from high-pressure sources (e.g., gas wellheads) to low-pressure environments (e.g., annulus spaces of well). The procedure ensures full operational safety for users, with no direct contact with the storage matrix during sampling. A second key objective is to guarantee consistent and representative sampling during large-scale field campaigns, which may involve numerous gas wells and sampling points (>10 per day). In addition, reliable long-term monitoring of such structures requires repeated campaigns over several years to achieve a comprehensive understanding of the studied system.
2. Materials and Methods
2.1. Chemicals and Products
A custom-made calibration gas standard was used for quantitative and isotopic analyses of light hydrocarbons. The mixture was gravimetrically prepared and certified by Air Products (France, Paris) to ensure high compositional accuracy and traceability to international reference standards. Its detailed composition, expressed in mol/mol%, is reported in Figure S1. The standard contains methane (88.765 ± 0.023%), ethane (3.0066 ± 0.0075%), propane (3.0015 ± 0.0091%), and minor components including iso- and n-butane, neopentane, iso- and n-pentane, and n-hexane, as well as hydrogen (1.972 ± 0.011%), nitrogen (2.0125 ± 0.055%), and carbon dioxide (0.9948 ± 0.0027%). This calibration gas was used to verify the linearity, precision, and reproducibility of chromatographic and isotopic measurements. A complete certificate of composition and conformity, provided by the manufacturer, is included in Figure S1.
The carrier gas used for GC–MS analyses was a grade 5.0 gas supplied by Linde (France, Lyon). Two reference gases were used for isotopic ratio calibration: (i) carbon dioxide (CO2, grade 4.5, Linde) for carbon isotope ratio (δ13C) measurements, with a certified δ13C value of −3.520‰ relative to the international VPDB standard, and (ii) hydrogen with a purity > 99.999% by Air Liquide (France, Paris), characterized by a δ2H value of—161.144‰ relative to the VSMOW standard.
2.2. Analytical Instruments
Analyses were conducted by gas chromatography–mass spectrometry (GC–MS) and gas chromatography–isotope ratio mass spectrometry (GC–IRMS), with samples introduced through a headspace system (Figure S2). GC–MS analyses were performed on a Thermo Scientific TRACE 1310 GC (Bremen, Germany) coupled to an ISQ QD MS for compound identification and quantification. Compound-specific isotope measurements were obtained using a TRACE 1310 GC connected to an ISOLINK II–IRMS system. Samples were injected with a Headspace HS–TRIPLUS RSH autosampler, and standard-gas reference pulses were delivered via a Thermo Scientific ConFlo IV interface.
2.3. Sampling Methods
Gas sampling was performed using a pressure-regulated system specifically designed for this purpose. It was developed and optimized for field deployment, while ensuring sampling accuracy and reproducibility equivalent to those achieved under controlled laboratory conditions.
The optimized sampling system can be operated in two modes to accommodate site-specific technical constraints:
- (i)
- Gas cylinder sampling (high-pressure/high-volume source only): This is the conventional approach, in which gas cylinders are pressurized and filled at the wellhead. The collected gas is subsequently transferred into headspace (HS) vials using the sampling system, which depressurizes the gas to ~1 bar and enables filling of evacuated vials while preventing atmospheric contamination.
- (ii)
- Direct sampling from the gas source: In this configuration, the sampling system is connected directly to the on-site gas source, allowing direct filling of vials regardless of operating conditions (high or low pressure/volume). This is not achievable with the conventional approach. An additional advantage is a substantially reduced sampling cost per well compared with scoot cylinder sampling.
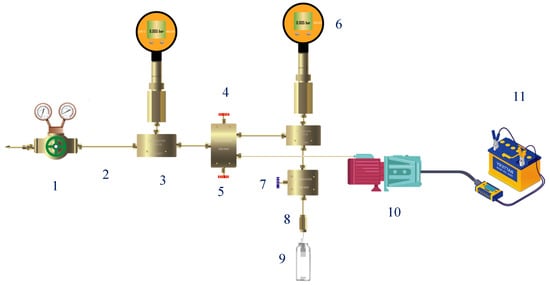
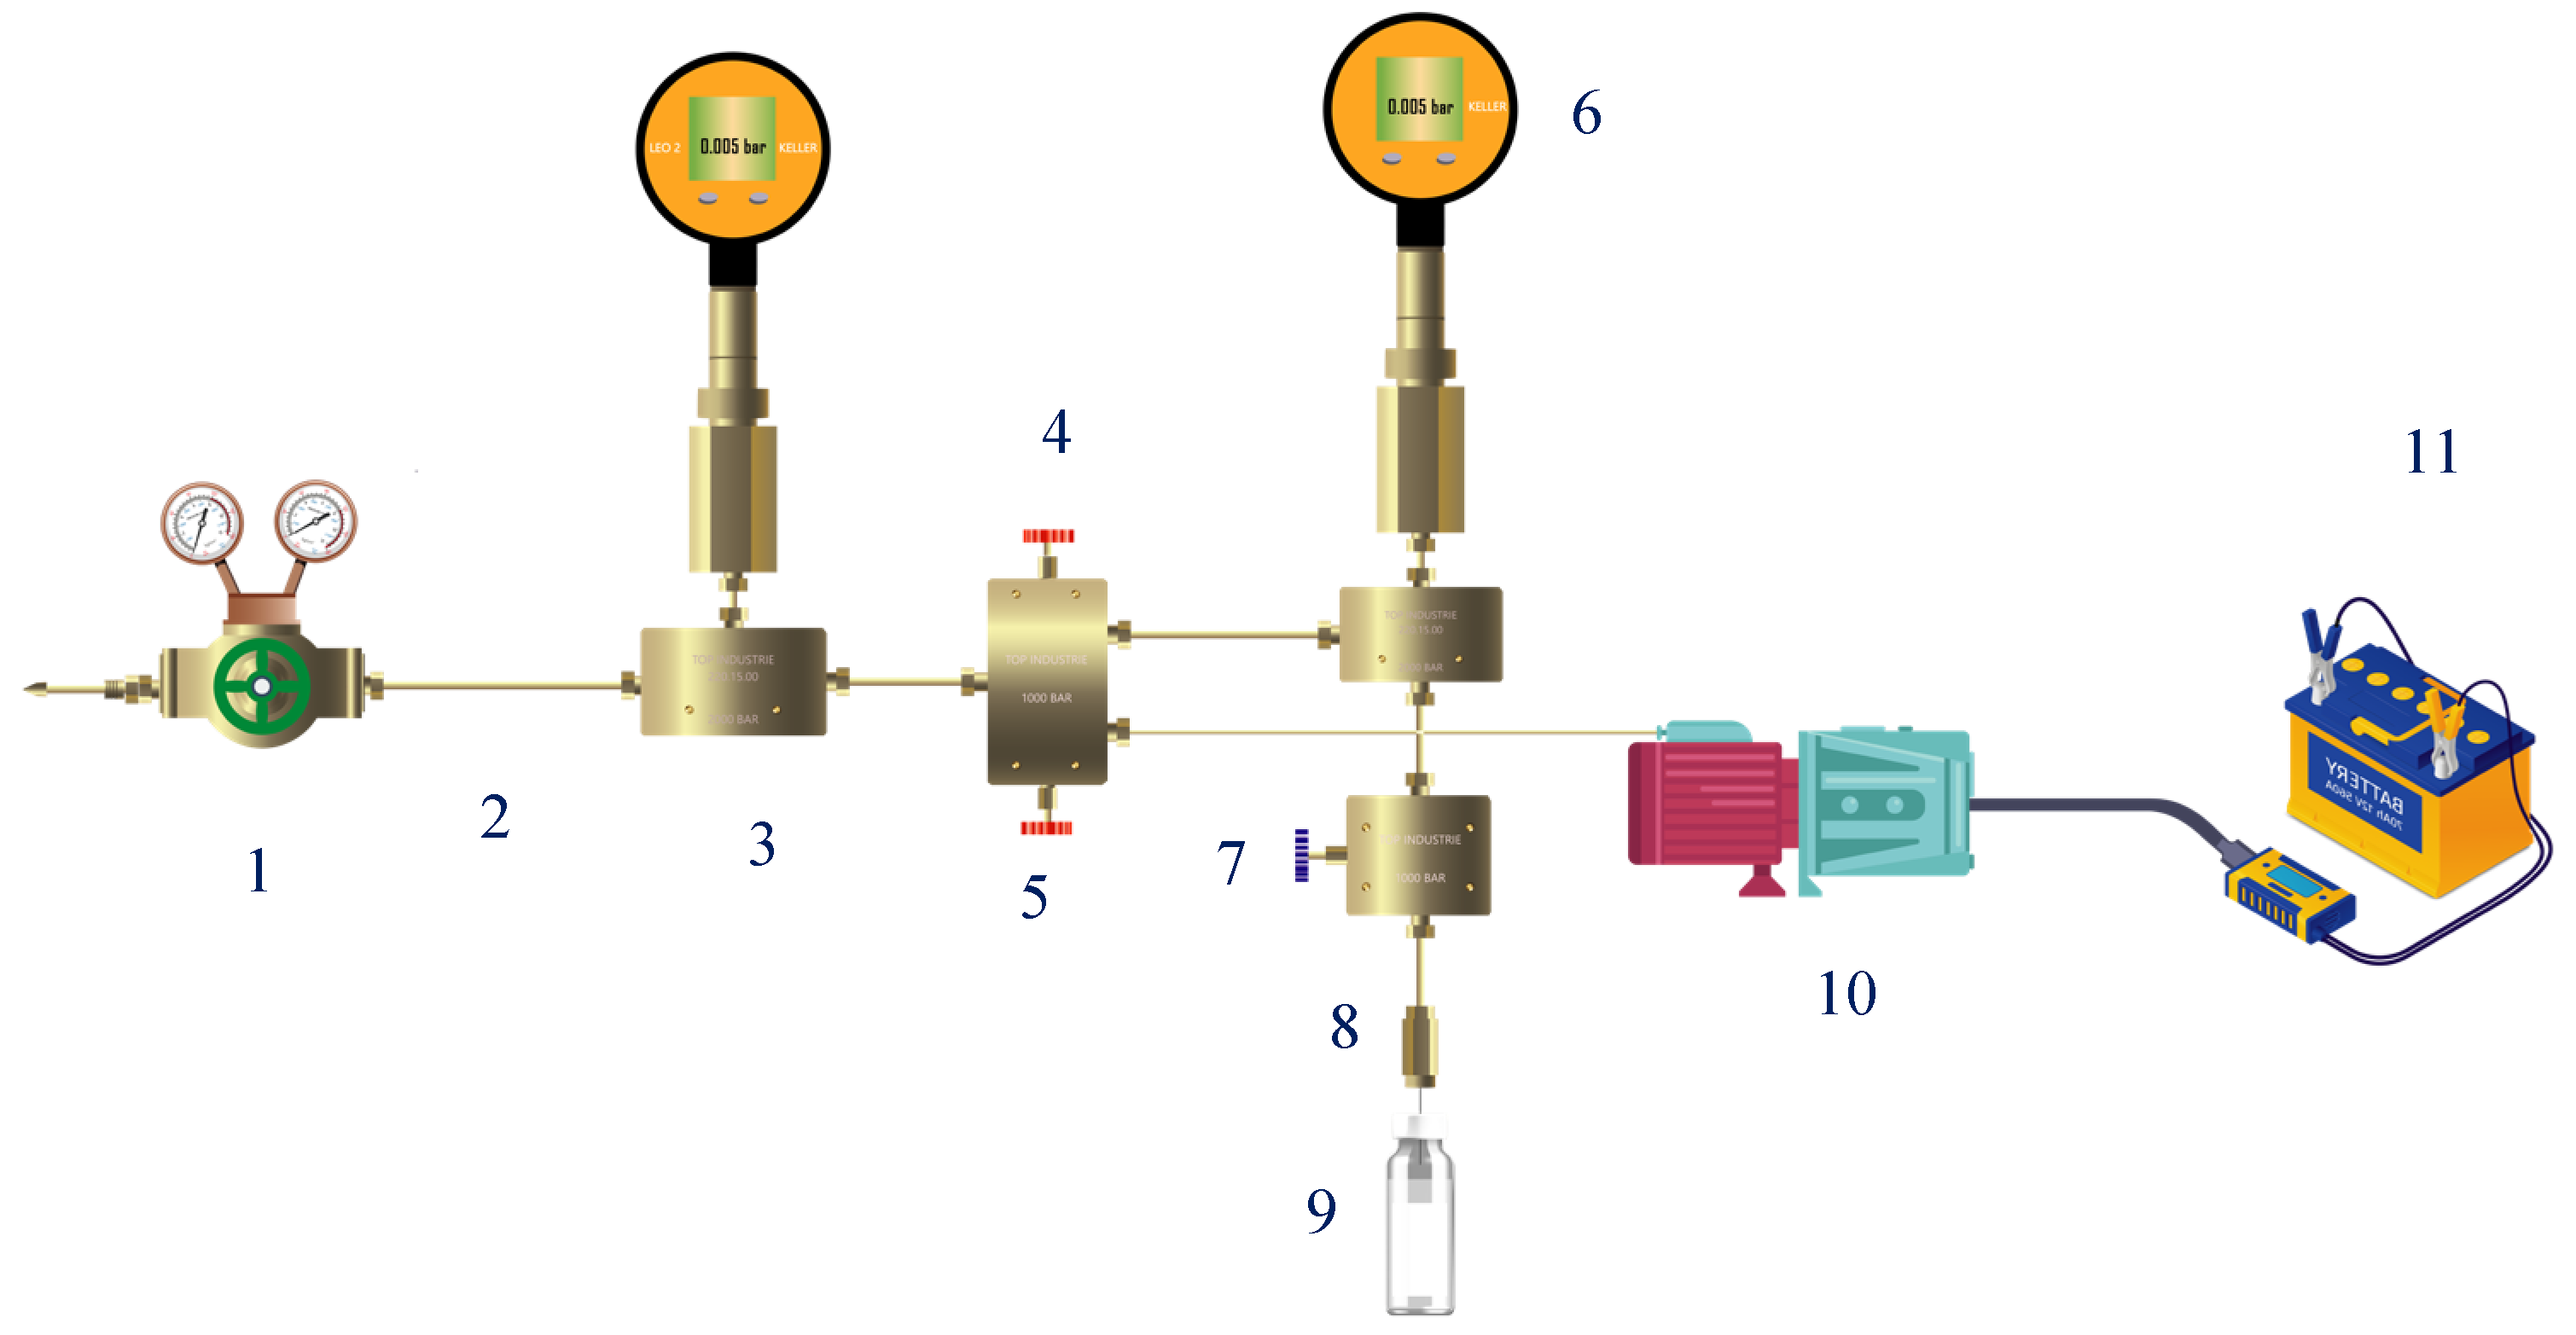
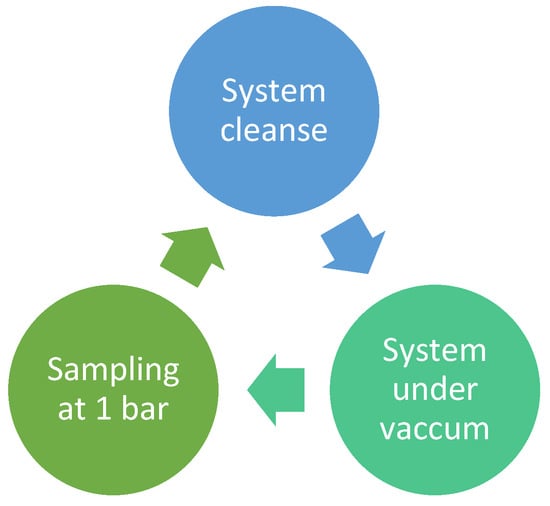
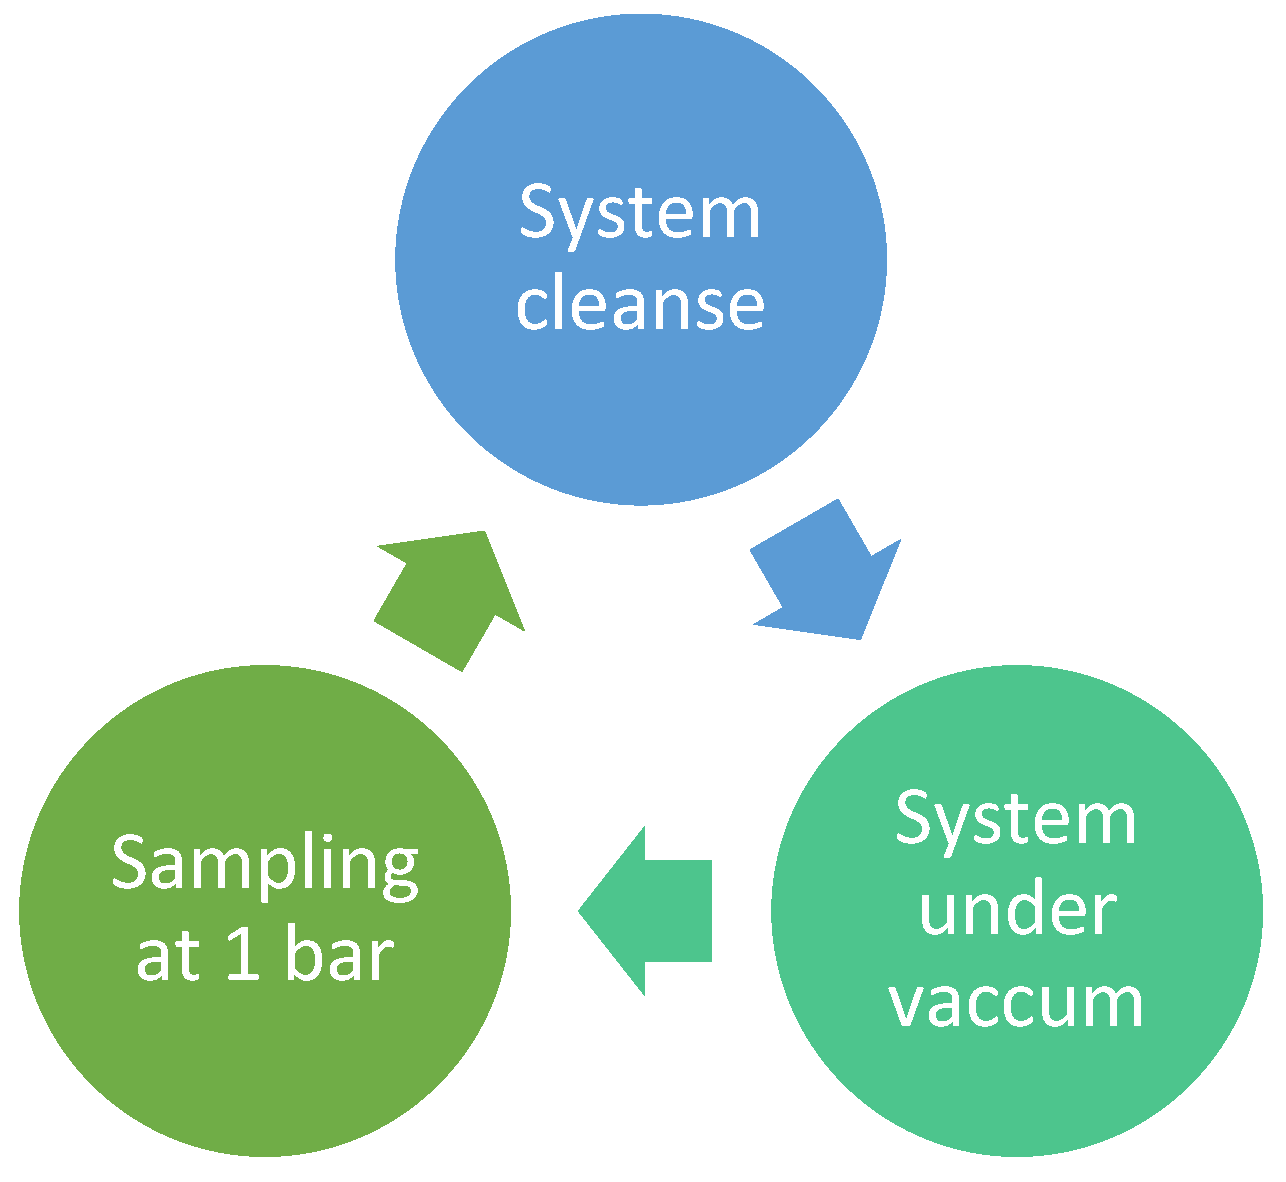
The gas is first sampled in a high-pressure cylinder by connecting it to a high-pressure gas source (typically >50 bar), such as a gas wellhead (i). When sampling directly into vials, this step is not required (ii). In both methods, the gas is depressurized until a low pressure of 3 bar using the pressure-reducing regulator in the system (Scheme 1) and transferred into Headspace HS vials (20 mL, PTFE) at atmospheric pressure, 1 bar for each sample. Vials should be vacuuming until 0.004 bar right before sampling. The vacuum gas sampling system operates according to three functional steps in Scheme 2. The detailed protocol is given in Data S1, Tables S4 and S5.
Scheme 1.
High- and low-pressure gas sampling system 1. pressure-reducing regulator; 2. Capillary; 3. Fitting ‘T’ high pressure; 4. Sampling micrometric hand valve; 5. Vacuum hand valve; 6. digital manometer; 7. sampling/vacuum hand valve; 8. Gastight needle; 9. HS vial; 10. Vacuum pump; 11. Deep cycle battery 140 Ah.
Scheme 2.
Sampling process steps.
This system provides an efficient and reliable method for gas sampling from any gas sources, especially those characterized by low pressure, low flow rate, and limited volume such as the annular space of gas storage wells without the need for prior purging or cleaning, owing to its inherent vacuum-maintained configuration. This approach ensures consistent sampling across multiple campaigns over time. It also represents a cost-effective alternative to gas cylinder sampling, which can be more expensive and necessitate specific transport protocols, particularly for highly flammable gases such as hydrogen molecule H2. For safety and security reasons, a portion of the system (10 and 11) is systematically installed outside the ATEX-classified zone of the gas well—approximately 10 m from the wellhead—to prevent any potential contact with atmospheric gas within this hazardous area.
This novel method, applied directly using vials (ii), is well suited for large-scale gas sampling campaigns involving multiple gas wells (>10 wells per day). In the present study, it was tested during a single-day campaign involving the collection of 14 gas samples (15 vials per well) and compared to first method (i) largely used in literature.
2.4. GC-MS Quantification Method
Gas Compound separation was achieved using an HP-PLOT Q capillary column, with sample introduction carried out via HeadSpace ‘HS’ injection. The optimized technical parameters are given in Table 1.
Table 1.
HS-GC-MS Experimental Parameters for the Quantitative Analysis of Major Natural Gas Compounds.
Quantification is carried out using a custom-certified standard gas (Air Products) with a composition similar to that of natural gas (i). Both the standard and the samples are introduced at atmospheric pressure (1 bar) from 20 mL headspace vials. The mole fraction (%) of each component is calculated using the Equation (1) [11].
- Ai sample: Sample peak area of component i
- Ai std: Standard peak are of component i
- % Pi: Percentage in (% mol/mol)
To ensure reliable comparisons, it is essential that gas standards and field samples are collected, stored, and analyzed under identical conditions. Gas standards must be sampled using the same procedures and methods as those applied to field samples.
The linear regression analysis was conducted using a novel experimental approach designed to assess the system’s performance across a range of pressures. Six 20 mL HS vials were filled at controlled pressures of (0.39; 0.52; 0.65; 0.78; 0.91, and 1.00 bar) using a certified gas standard.
The estimation of the measurement repeatability was evaluated by calculating the recovery percentage for each sample to the mean of all samples, using the Equation (2) [22,23].
- R (%): Recovery percentage
- An: n sample peak area
- Am: Average peak area
2.5. Isotopic Methods
Isotopic ratio mass spectrometry ‘IRMS’ analyses were performed using a Thermo Fisher ‘ISOLINK II—DELTA V PLUS’ GC-IRMS system.
Two main studies were carried out to ensure the accurate determination of isotopic ratios. First, a linearity study was performed using isotopic reference gases CO2 with a known δ13C signature and H2 with a known δ2H signature referenced to the international standards Vienna Peedee belemnite ‘V-PDB’ and Vienna Standard Mean Ocean Water ‘V-SMOW’, respectively. Second, a stability assessment was conducted using 10 repeated injections of the reference gas to validate the precision and reliability of the isotopic ratio mass spectrometer.
Alkanes and Carbon Dioxide Isotopic Analyses
- IR δ13C
Due to the large differences in concentration between methane and the other target compounds (ethane, propane, and carbon dioxide), the analyses were conducted in three separate runs, as illustrated Figure 1 for methane and Figure S3 for ethane ‘C2H6’ and propane ‘C3H8’. The δ13C analytical parameters for each method are detailed (i, ii, iii).
- (i)
- δ13C methane CH4 experimental parameters for IR determination: Fixed method, Direct injection using Gas-tight syringe, 10 µL split 50:1, gas reference: 6000 mV.
- (ii)
- δ13C Carbone dioxide CO2 experimental parameters for IR determination: Fixed method, Headspace Injection ‘HS’, 300 µL, split 50:1, gas reference: 6000 mV.
- (iii)
- δ13C ethane C2H6 and propane C3H8 experimental parameters for IR determination: Fixed method, Headspace Injection ‘HS’, 100 µL, split 50:1, gas reference: 6000 mV.
Figure 1.
Representative GC–IRMS ion-current traces (m/z 44, 45 and 46) used to determine δ13C of methane (CH4), showing three reference-gas pulses and the CH4-derived CO2 peak (isotopologue signals summarized in Table 2).
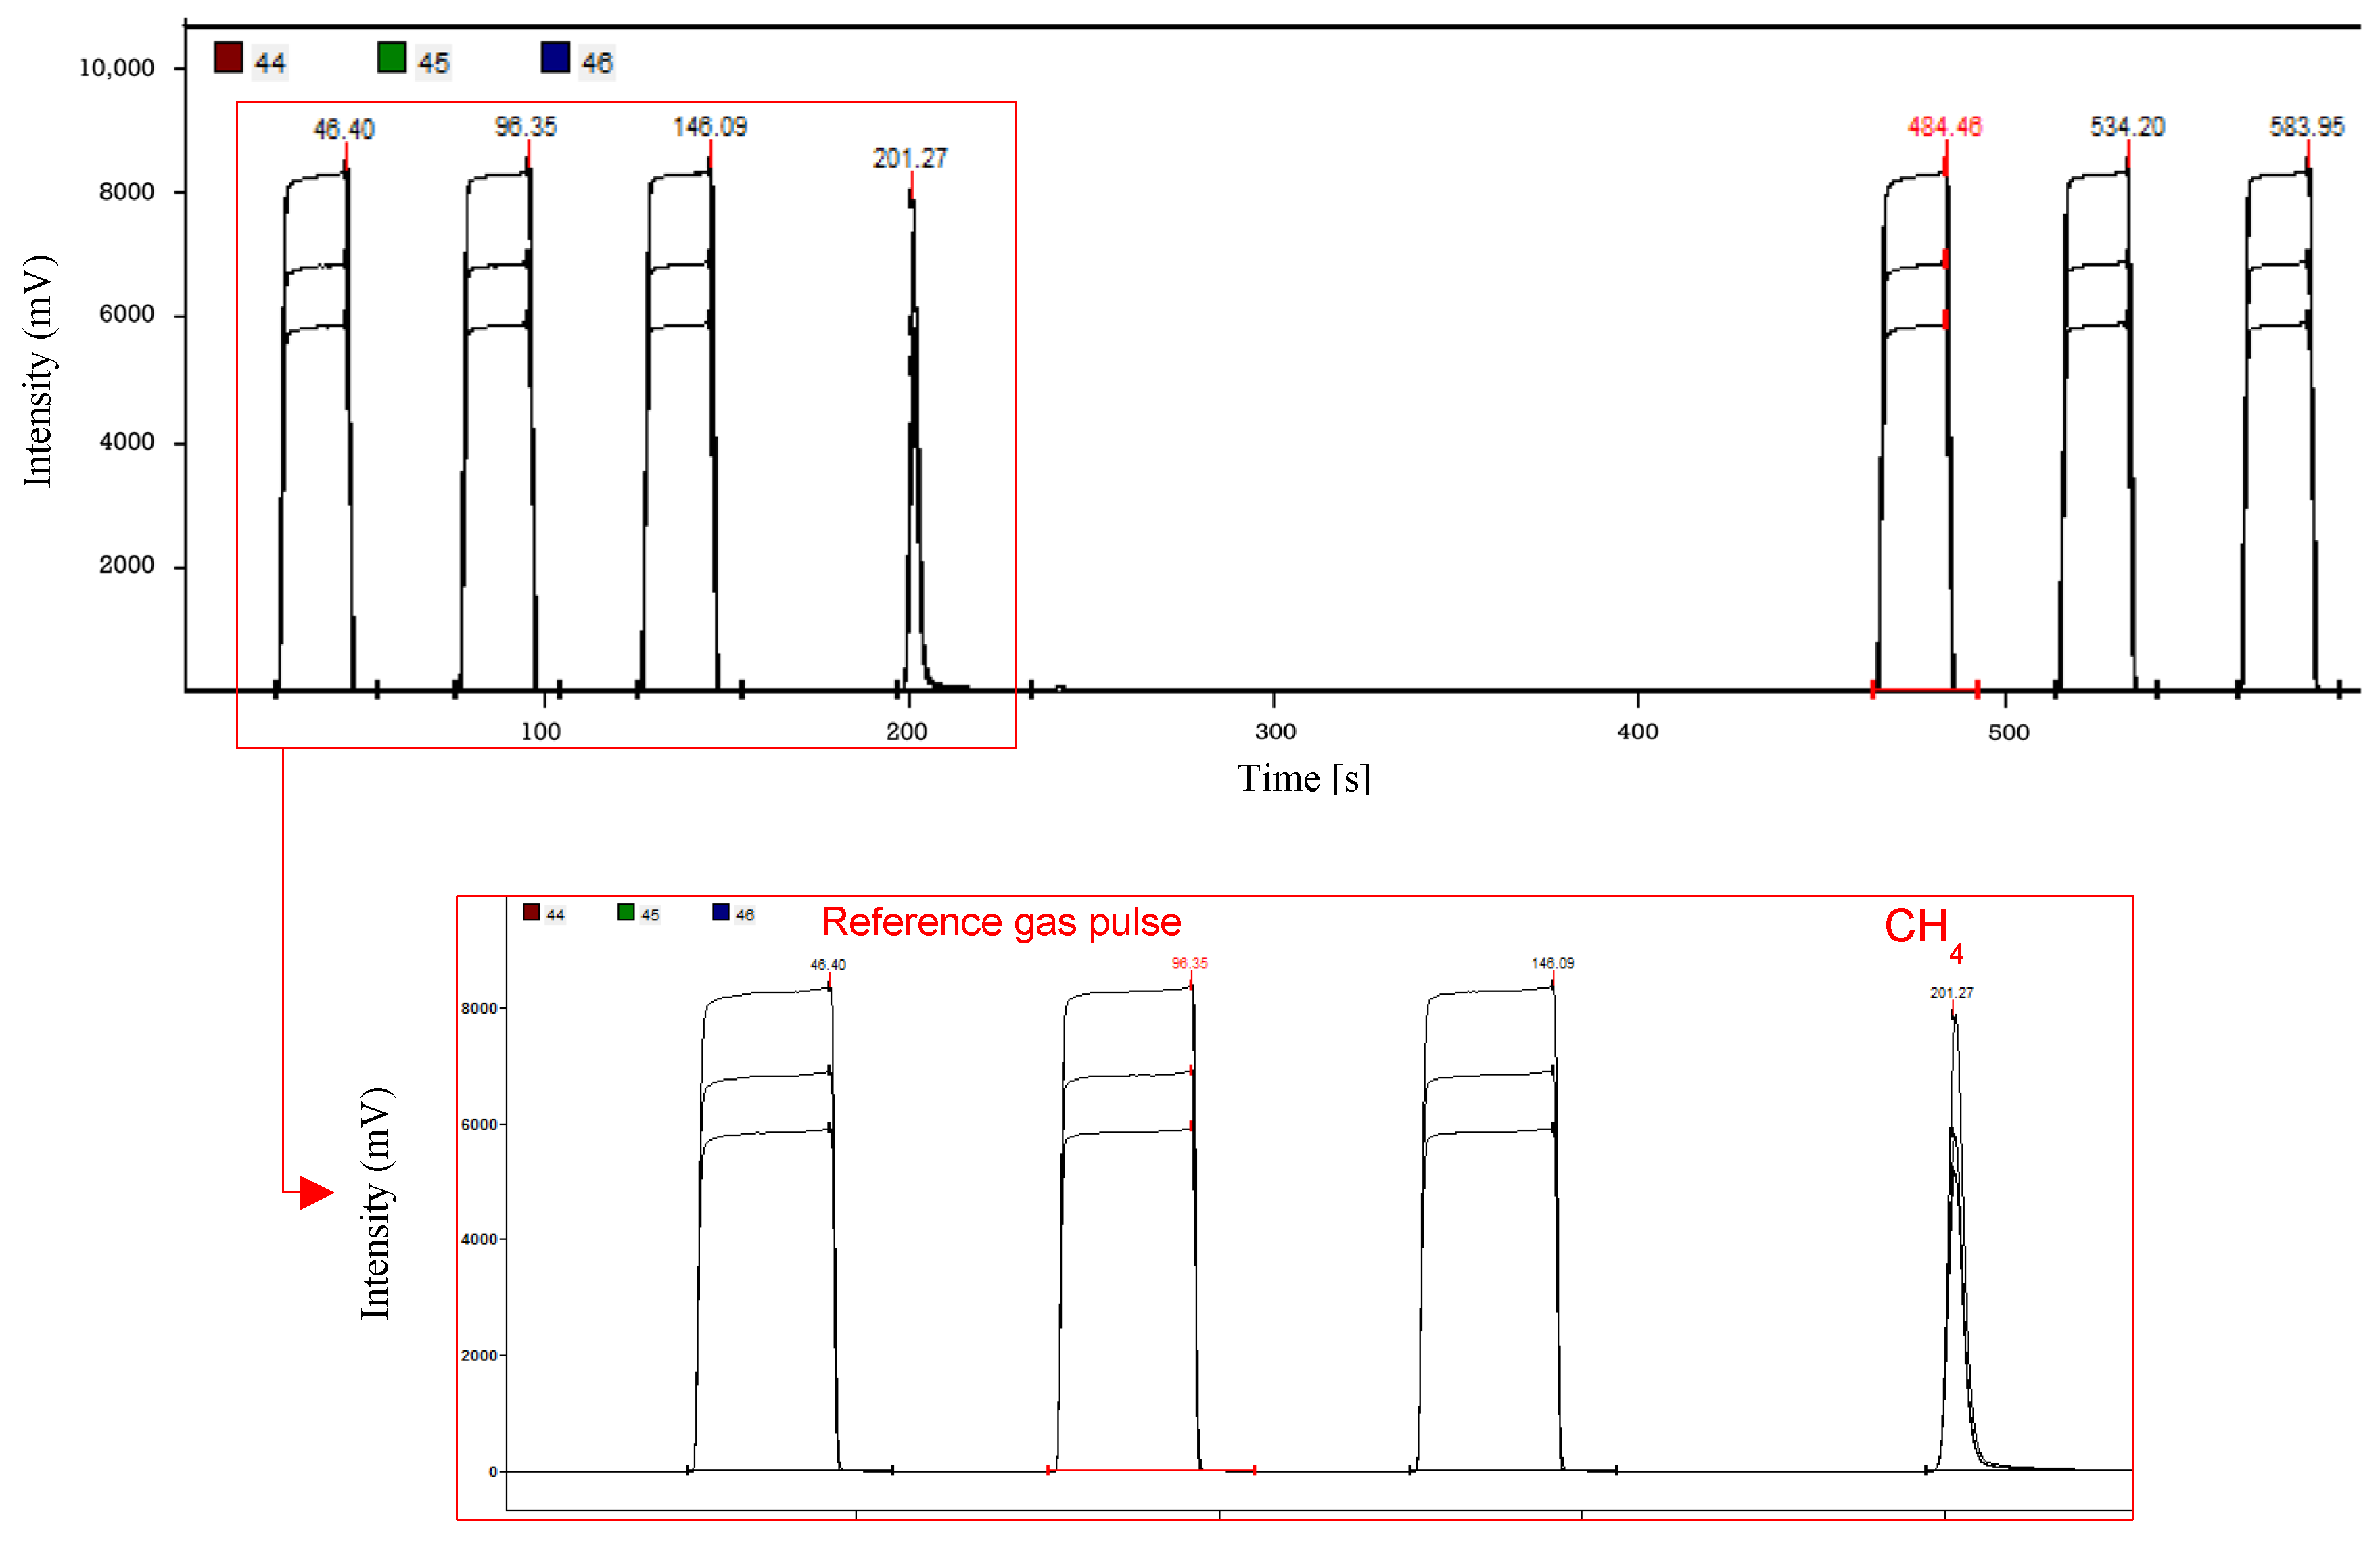
Table 2.
Relative abundance of carbon dioxide ‘CO2’ isotopologue.
The molecular relative abundance is determined from the relative abundances of the respective isotopic species:
12C: ~98.93%, 13C: ~1.07%
16O: ~99.76%, 17O: ~0.04%, 18O: 0.20%
- IR δ2H
The same methodology is used for the determination of δ2H IR of methane, ethane and propane:
- (i)
- δ2H methane CH4 experimental parameters for IR determination: Fixed method, Direct injection using Gas-tight syringe, 10 µL, split 20:1, gas reference: 6000 mV.
- (ii)
- δ13C ethane C2H6 and propane C3H8 experimental parameters for IR determination: Fixed method, Headspace Injection ‘HS’, 100 µL, split 10:1, gas reference: 6000 mV.
- (iii)
- δ2H Hydrogen: the GC column (HP-Molesieve 5 A° 30 m × 0.32 mm × 25 µm), and oven program: 40 °C (10 min) have been changed for hydrogen approach in order to obtain a better separation and selectivity, the isotopic experimental parameters, Direct injection using Gas-tight syringe, 100 µL, split 10:1, gas reference: 6000 mV.
3. Results
3.1. Development of a GC-MS Method for Quantifying CO2 and Light Alkanes
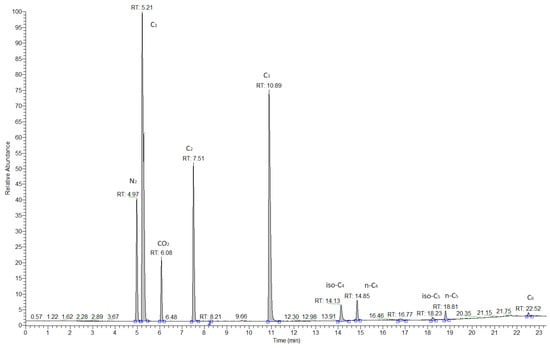
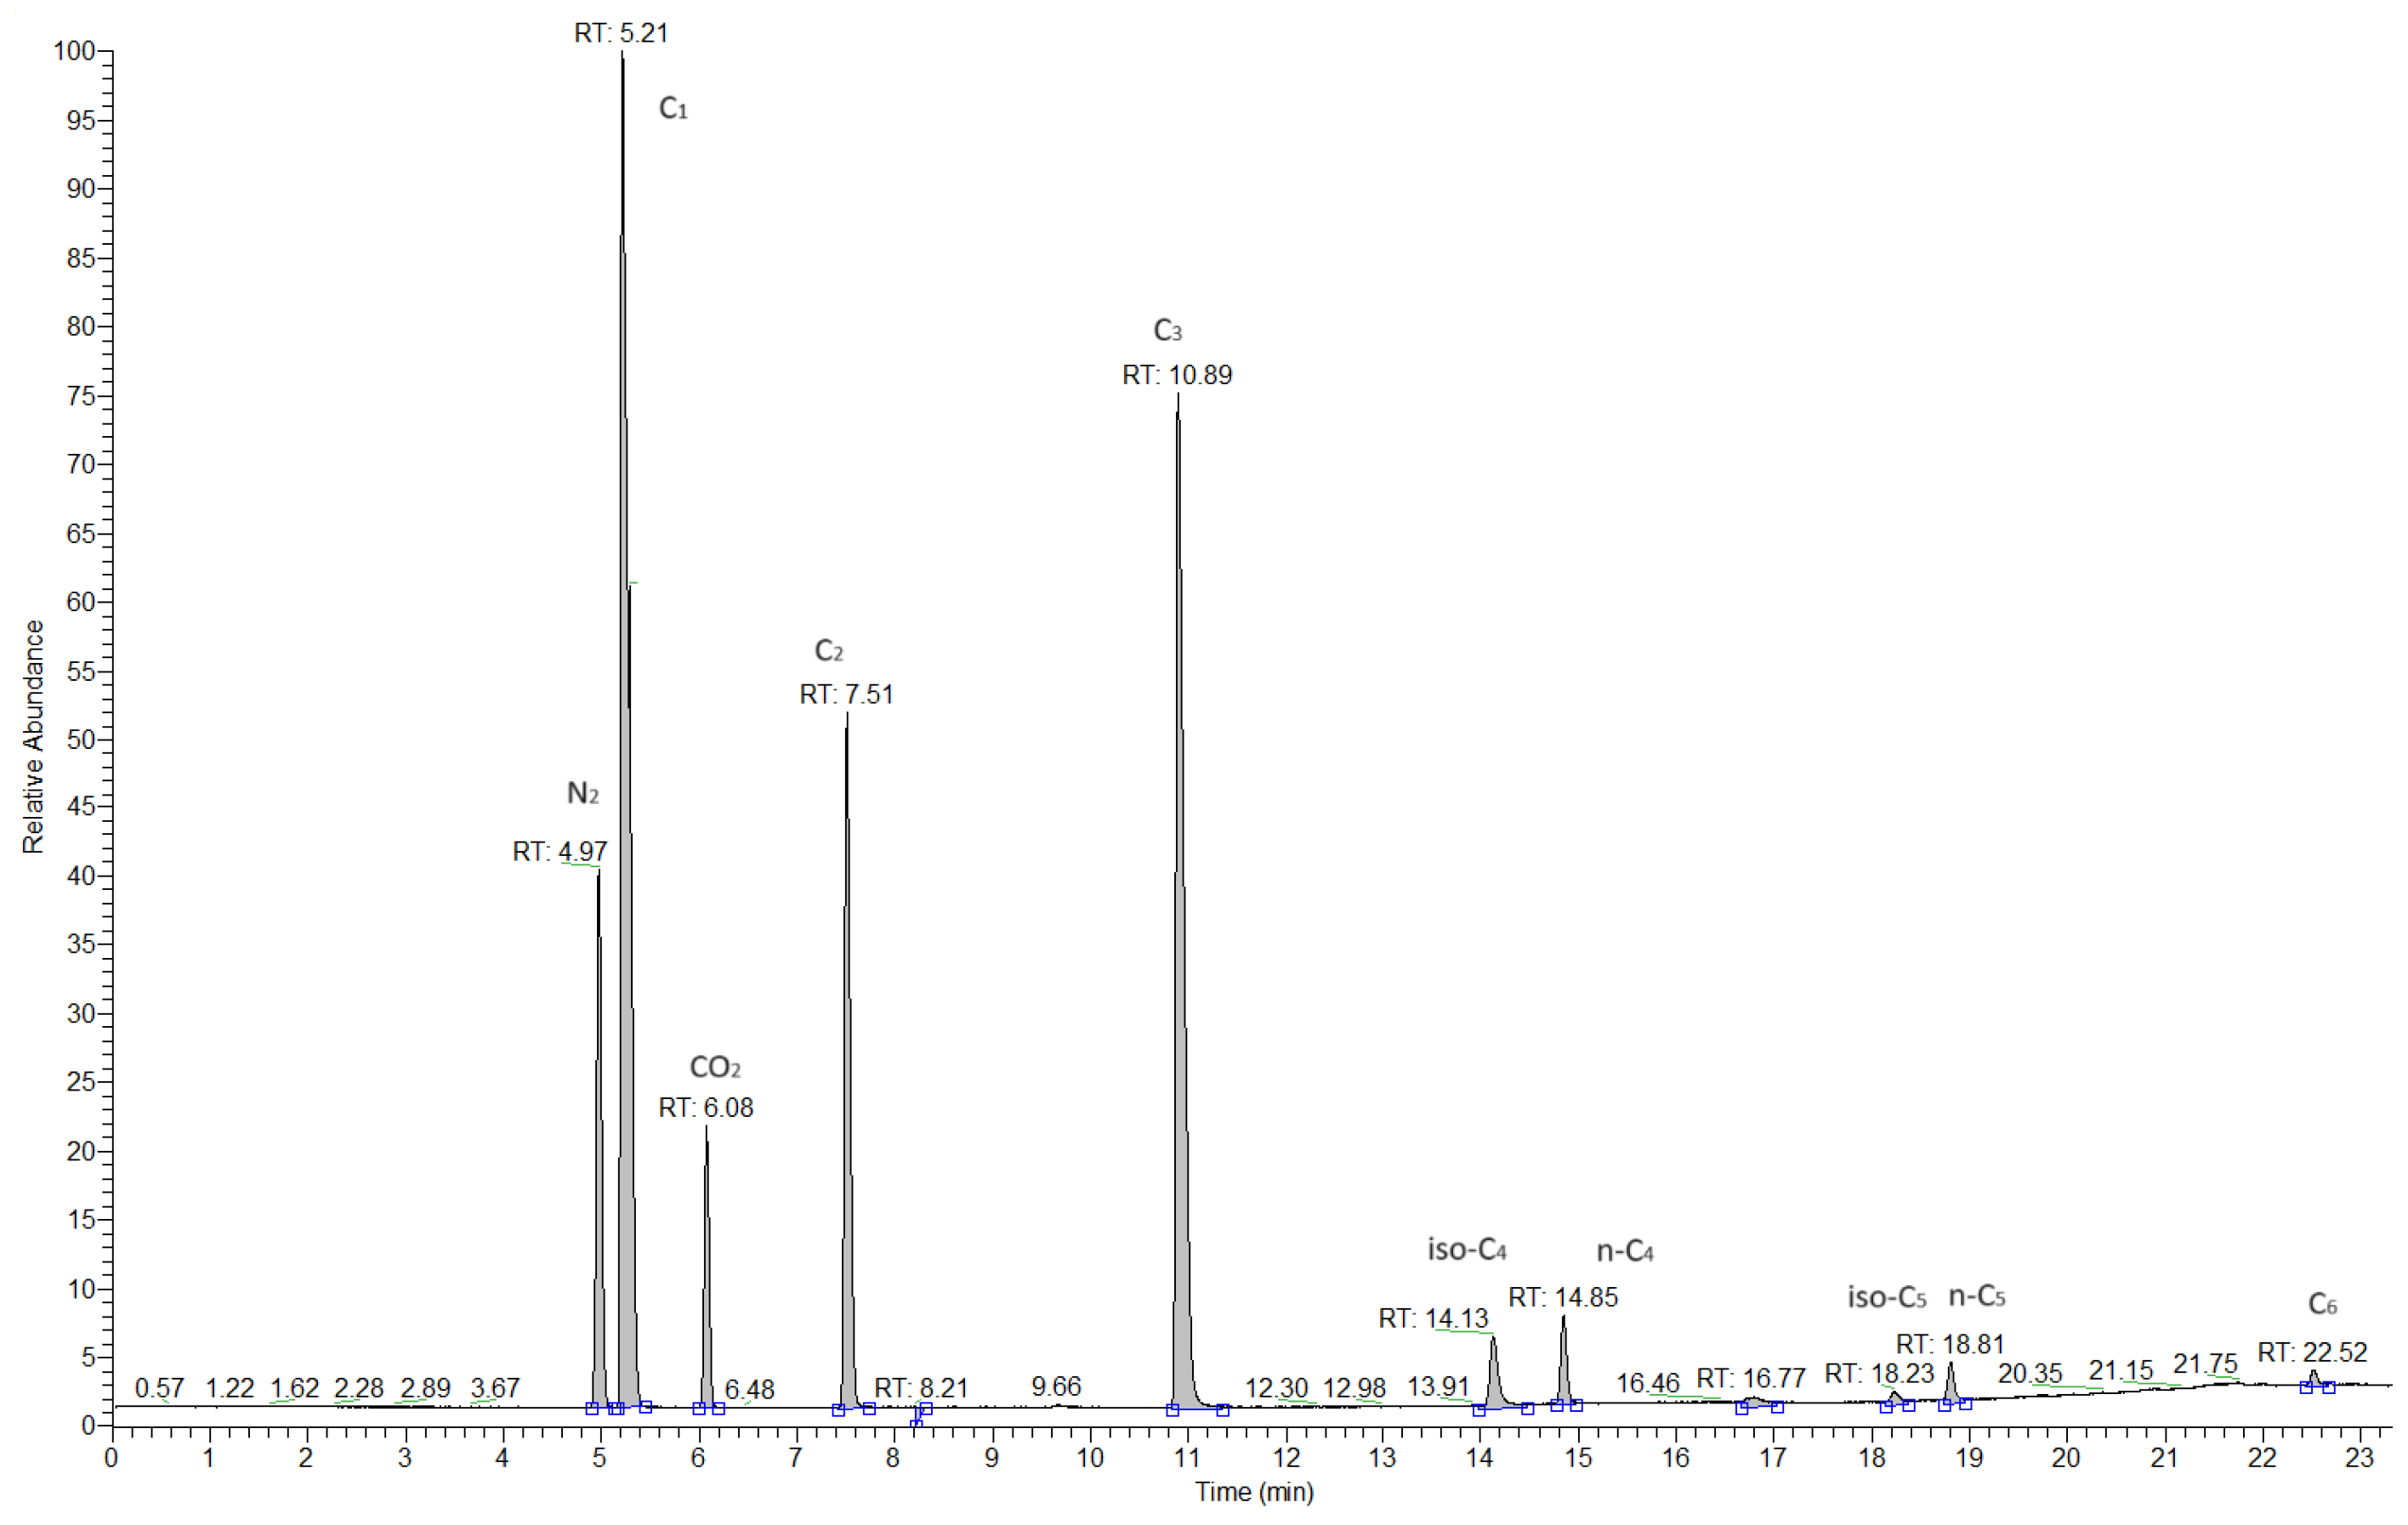
The chromatogram in Figure 2 depicts a good separation for all-natural gas compounds CO2 and alkanes C1–C6 with a good Signal-to-Noise ‘S/N’ for each one according to chromatographic parameters summarized in Table A1. The first chromatogram peak is related to dinitrogen ‘N2’, the separation of hydrogen and permanent gas is not possible with this column, a specific column is necessary for their separation such as molecular sieve Column.
Figure 2.
Representative GC-MS chromatogram of natural gas obtained using a PLOT column, showing baseline separation of permanent gases (N2, CO2) and C1–C6 hydrocarbons (C1, C2, C3, iso-C4, n-C4, iso-C5, n-C5, C6); retention times are indicated above peaks.
- Linearity
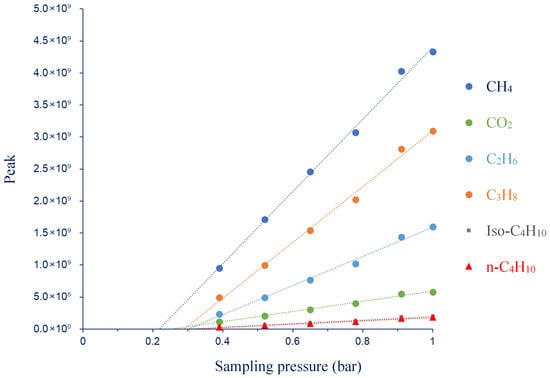
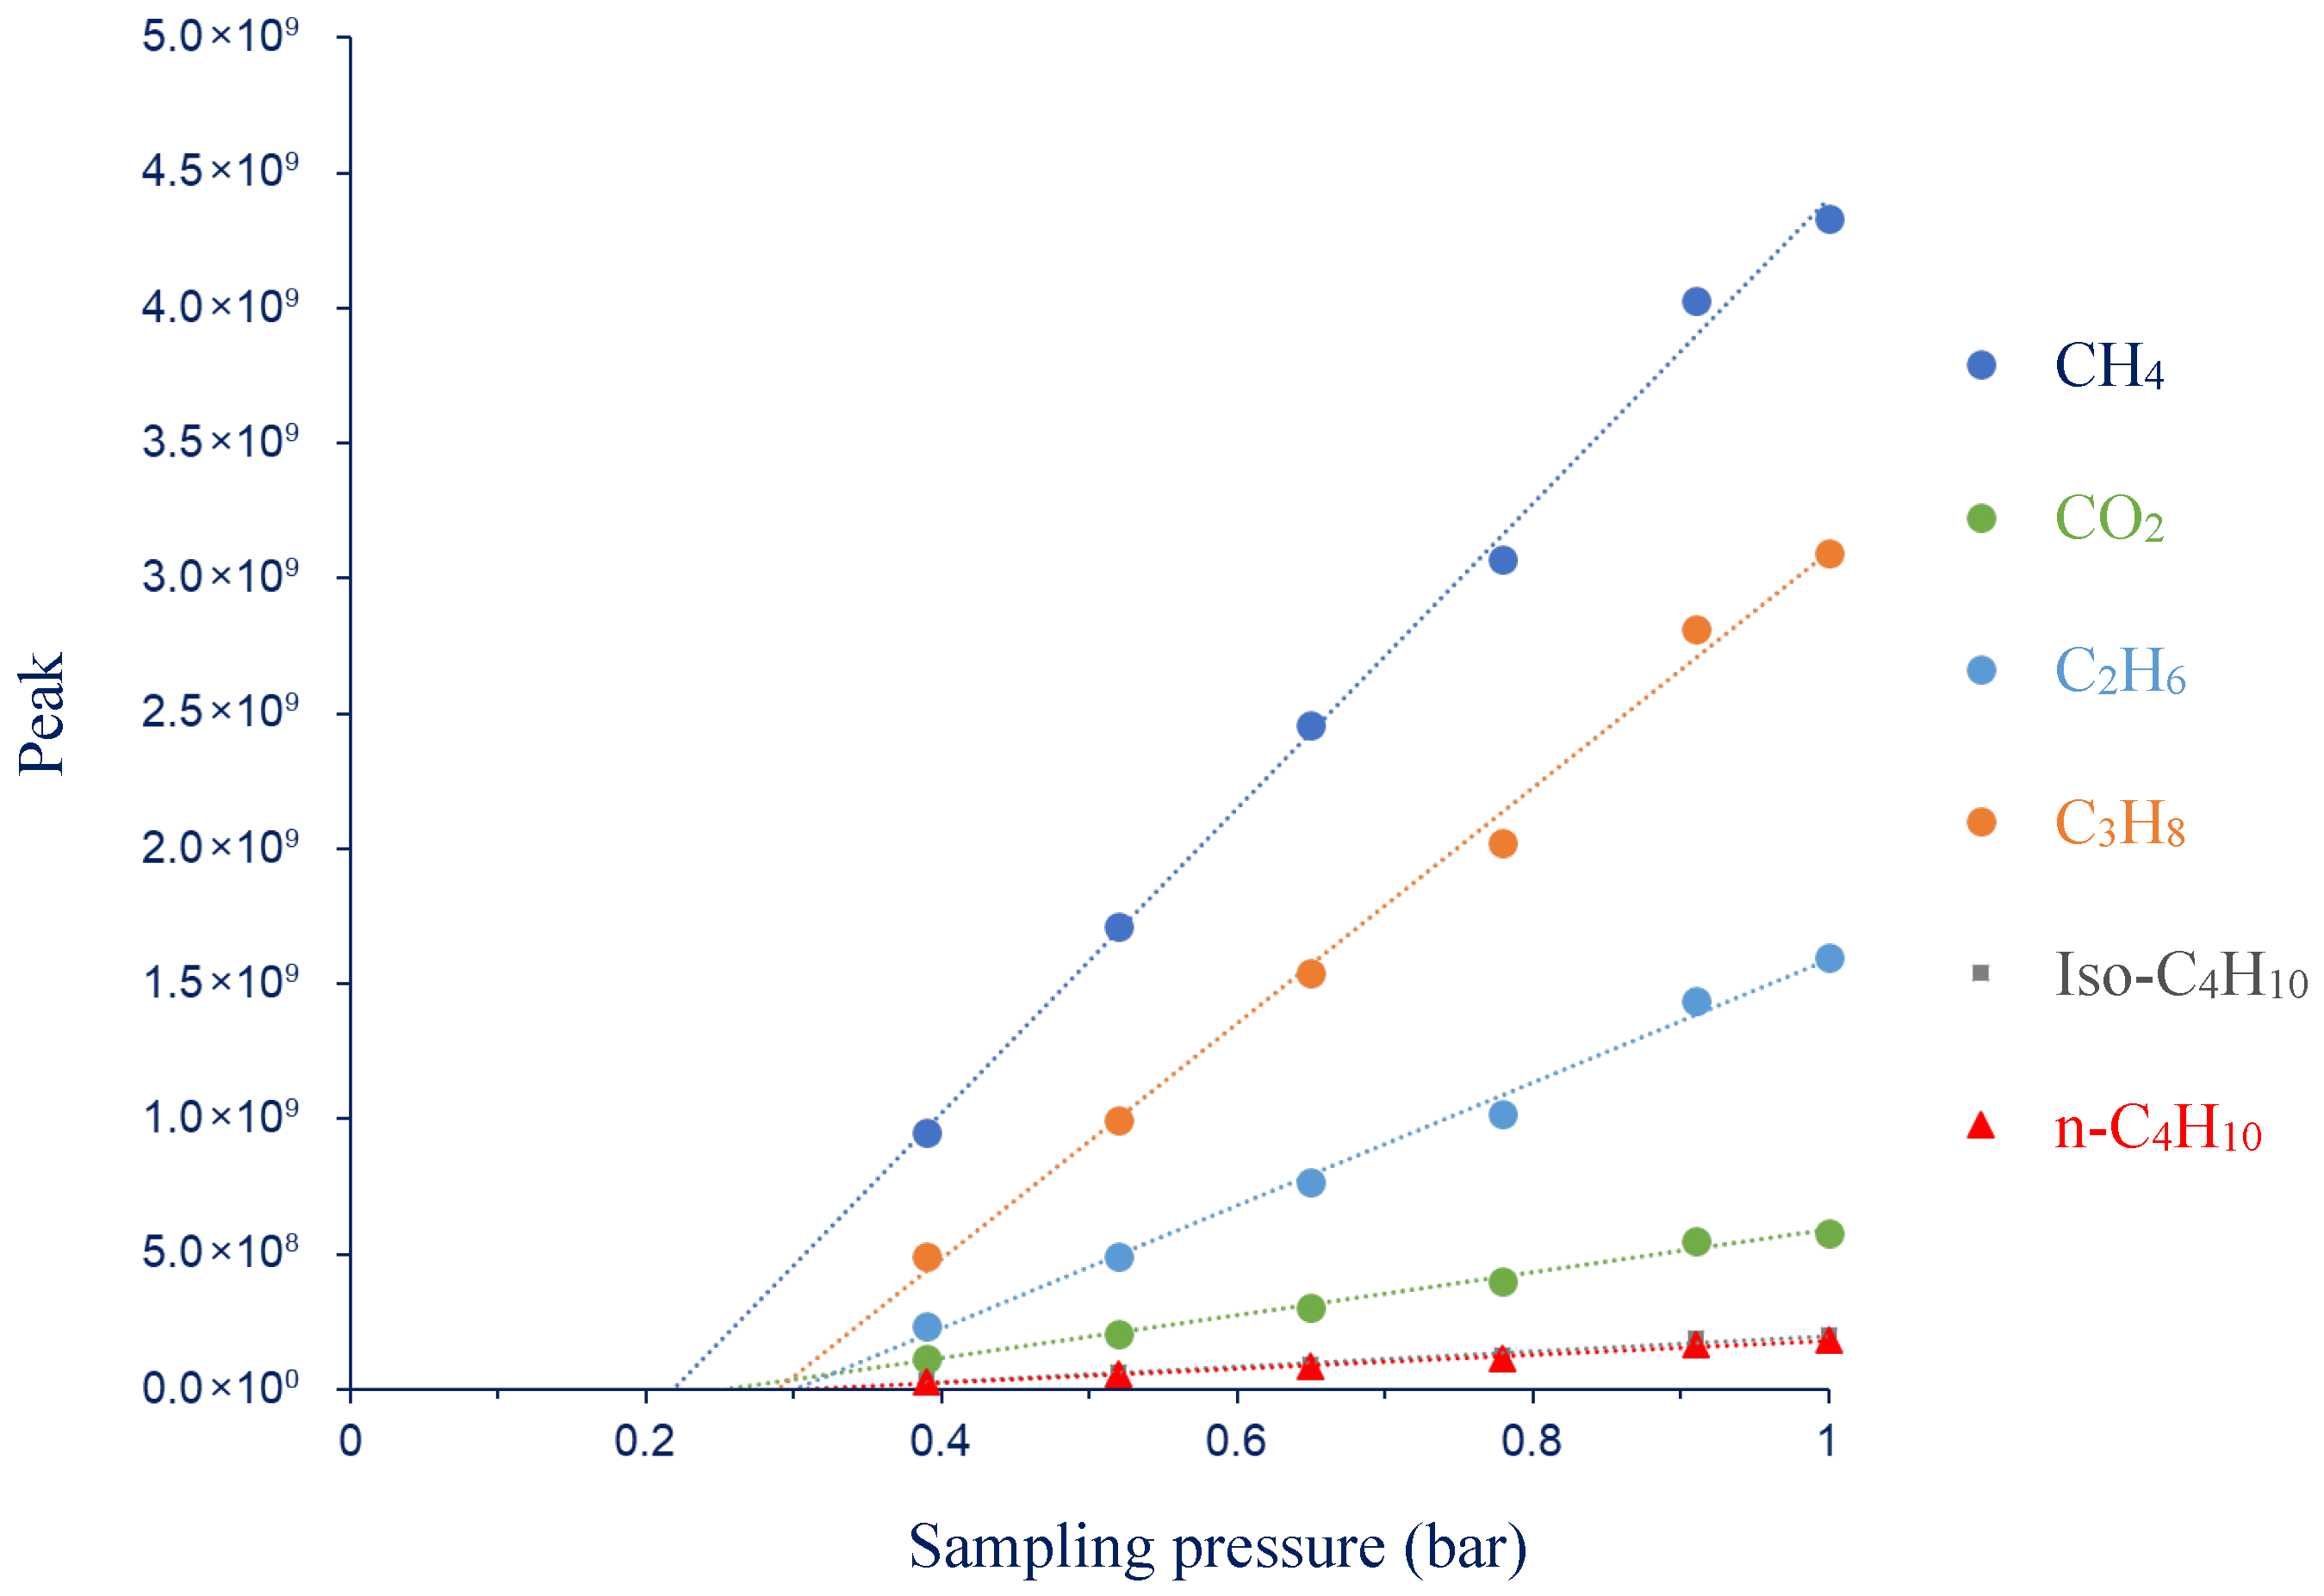
The linear regression study is illustrated in Figure 3 and summarized in Table 3. The linearity of the GC–MS response was assessed for each compound by determining the coefficient of determination (R2), the Fisher statistic (F), and the standard errors associated with the slope (m) and intercept (b).
Figure 3.
Linearity of detector response for a certified gas-mixture standard: peak area as a function of sampling pressure for CH4, CO2 and C2–C5 hydrocarbons.
Table 3.
Statistical linear regression parameters.
A minimum pressure of 0.39 bar was selected because it represents the lowest filling pressure at which all analytes are simultaneously detected and quantified with acceptable repeatability. While certain compounds remain detectable below this threshold, quantification is not consistently reliable across the full set of species, justifying 0.39 bar as the lower bound of the working range.
The calibration curves shown in Figure 3 display an apparent non-zero intercept, i.e., the linear fit does not pass through the origin. This behavior is consistent with a pressure-defined LOQ: below a certain filling pressure, the amount of substance in the vial becomes too small to yield a measurable and reproducible GC–MS peak area. Consequently, the low-pressure portion of the response is effectively truncated by the LOQ, and the regression performed over the quantifiable range yields a positive intercept rather than a line constrained to (0,0). The fact that methane and minor compounds exhibit different intercepts is also consistent with compound-specific detection/quantification limits, which depend on abundance and instrumental sensitivity/response for each species.
Within the validated working interval [0.39–1 bar], proportionality between GC–MS peak area and amount of substance is ensured using the calibration standard. Under constant vial volume and temperature, the amount of gas is proportional to pressure (n ∝ P); therefore, a pressure-based LOQ can be expressed as an equivalent mole-fraction threshold at 1 bar by scaling the standard composition according to the LOQ pressure:
For example, if ethane is 3% (mol/mol) in the standard and its compound-specific pressure range is [0.26–1 bar], the corresponding equivalent concentration range is [0.78–3% (mol/mol)]. Accordingly, for samples analyzed at 1 bar, ethane mole fractions below 0.78% (mol/mol) are operationally considered below quantification (i.e., “blank” with respect to ethane), because they correspond to an amount of substance lower than that produced by the LOQ pressure.
Finally, additional systematic contributions may arise from (i) reduced accuracy of the pressure gauge during low-pressure filling and (ii) possible losses during headspace sampling/transfer. Because these effects appear stable during method validation, their impact is treated as a constant bias and is considered negligible within the investigated pressure range.
For all gases, R2 values above 0.98 and F values ranging from 224 to 1096 indicate an excellent linear relationship between signal intensity and gas pressure. The statistical significance of each regression was evaluated using the Fisher–Snedecor distribution, with one degree of freedom in the numerator and four in the denominator (corresponding to six calibration points). At a 95% confidence level, the critical value is F(1,4) = 7.71. Since all experimental F values greatly exceed the critical threshold, the linear regressions can be considered statistically significant, demonstrating that the GC–MS response behaves linearly across the tested concentration range for all compounds.
The slopes (2.6 × 10⁷ to 5.6 × 10⁹) reflect detector sensitivity, which varies among compounds according to their relative ionization efficiencies, and this ionization behavior is also strongly influenced by molecular structure. Linear alkanes, which share similar structural features, typically exhibit comparable ionization responses, whereas branched alkanes or compounds with distinct chemical structures such as CO2 show markedly different ionization efficiencies.
The low standard errors on the slopes (generally below 5%) demonstrate the high precision and stability of the detector response. Similarly, the intercepts (b) are close to zero with small uncertainties, indicating a negligible background signal and effective baseline correction. The variability observed in signal intensity between compounds mainly results from concentration differences in the calibration mixtures rather than from deviations in instrumental linearity
Overall, these results confirm that the GC–MS system provides a robust and reproducible linear response suitable for quantitative analyses. The calibration study is critical before any analysis sequence in order to ensure a good detector response and accurate quantification. The calibration method developed here, based on the proportional relationship between substance quantity and vial sampling pressures, provides a convenient and efficient solution for quantifying multiple components within gas mixtures. This approach obviates the necessity for multiple certified gas standards at varying molar concentrations, especially when gas calibration mixtures for some specific volatile organic compounds (VOCs) are unavailable.
- Repeatability
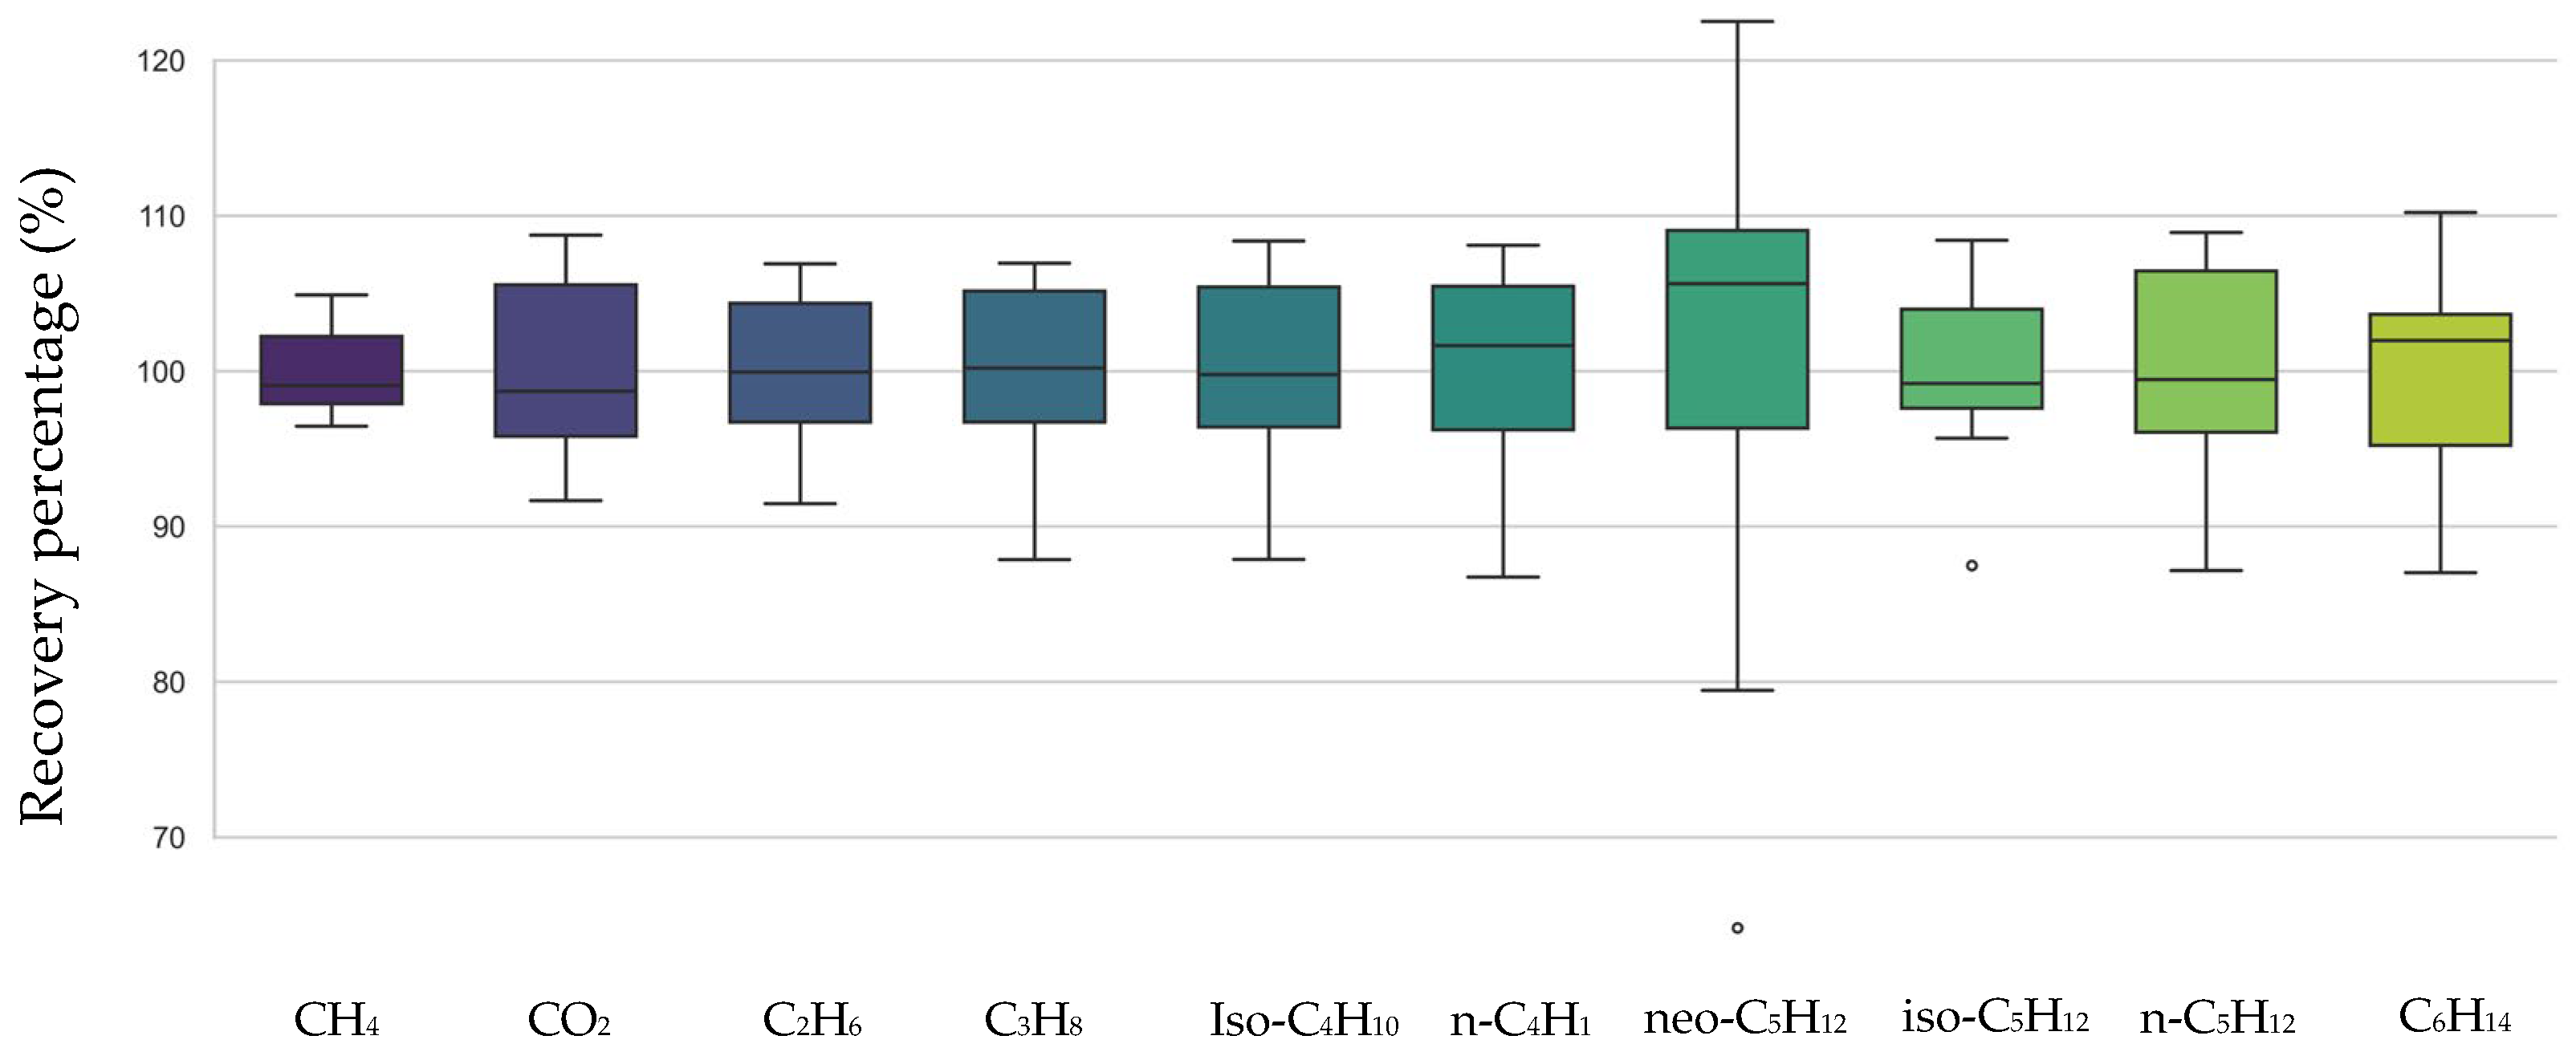
A repeatability assessment was performed to evaluate the precision of the GC–MS method for the quantification of hydrocarbon and non-hydrocarbon components in the tested gas mixture. The Equation (2) was employed to assess the repeatability of both quantification measurements and sampling. Five vials of a gas standard were sampled at 1 bar, with each vial injected twice.
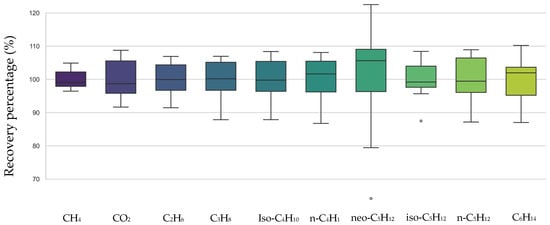
The results reported in Figure 4 and Table S1 exhibited recoveries closely clustered around 100% for most compounds, with mean values ranging from 97.54% (C6H14) to 100.53% (n-C4H10). The relative standard deviations (%RSD) were generally low, between 2.96% (CH4) and 7.11% (n-C5H12), except for neo-C5H12 which showed higher variability (16.82%), mainly due to isolated deviations in R_%2 (122.51%), R%_9 (64.17%) and R%_10 (87.49%) for iso-C5H12. These anomalies may reflect compound-specific ionization fluctuations, transient chromatographic instabilities, or minor matrix effects. Overall, the narrow %RSD values for most compounds confirm the high repeatability and robustness of the method within the investigated concentration range, supporting its suitability for high-precision routine analyses in similar applications.
Figure 4.
Assessment of Analytical Recovery Efficiency (%) Across Various Light Gaseous Species (C1–C6) and carbone dioxide (CO2). Data are presented as mean ± SD, n = 10.
- Limit of quantification ‘LOQ’
The limit of quantification (LOQ) for each compound was determined based on a linear calibration curve established by plotting peak area against the filling pressure of a gas standard mixture, ranging from 0.13 to 1.00 bar. The injection system was maintained at constant volume and temperature, ensuring that the molar amount of each component introduced into the GC-MS was directly proportional to the filling pressure. The gas standard composition at 1.00 bar was used as the reference, and the corresponding molar concentrations were expressed in mol%. The LOQ was defined as the lowest pressure at which the signal was reproducible (relative standard deviation < 20%) and provided a signal-to-noise ratio greater than 10. The corresponding molar concentration was then calculated by proportionally scaling the known composition at 1.00 bar to the minimum validated pressure using the following equation:
where C1 bar is the molar concentration (in mol%) of the compound in the standard at 1.00 bar, and PLOQ is the lowest pressure (in bar) at which quantification is reliable. This approach allows for direct estimation of LOQ in mol% under experimental conditions identical to those used for sample analysis.
The limits of quantification (LOQ) values obtained for the developed GC–MS method are summarized in Table 4. The method exhibits low LOQs for most hydrocarbons and CO2, ranging from 0.04% to 0.78%, with the exception of methane (11.54%). The relatively higher LOQ observed for CH4 mainly reflects its lower analytical sensitivity under the fixed injection and acquisition conditions used in this study. These parameters were deliberately kept constant to provide a single, robust method applicable to the full natural-gas matrix and to avoid saturation from major components, which inherently limits the extent to which methane can be optimized.
Table 4.
Limit of quantification estimation of carbon dioxide and alkanes (S/N > 10) in % mol/mol.
In comparison with standardized natural-gas composition protocols, the CH4 LOQ achieved here (11.54% mol/mol) is lower than the lower applicability limit reported in ISO 6974-5:2014 (34% mol/mol) [24], indicating improved methane performance within a normalized framework. By contrast, when compared to a published GC-MS method developed outside such standardization, our CH4 LOQ is of the same order of magnitude (≈12.4% mol/mol), while markedly lower LOQs for several heavier alkanes are obtained in this work [25]. These differences are consistent with changes in analytical objectives and instrument settings (e.g., injected amount, split ratio, and tuning strategy), which strongly control sensitivity and dynamic range; therefore, apparent discrepancies in LOQ largely reflect differing methodological constraints rather than contradictory analytical performance.
Achieving a lower LOQ for methane is not critical for the objectives of this study, because CH4 is the dominant component of natural gas and is quantified at concentrations far above the quantification limit in the investigated samples. Nonetheless, if lower methane LOQs were required for specific applications, they could be significantly improved by increasing the injected amount (e.g., larger sample volume and/or reduced split) and, where appropriate, by implementing a dedicated CH4 protocol with acquisition settings optimized for methane.
Overall, the method developed here provides a robust and pragmatic compromise between sensitivity, dynamic range, and operational simplicity. In contrast to internationally standardized procedures that rely on stringent and highly constrained analytical setups, this approach preserves good analytical performance while remaining flexible and easy to deploy. It is therefore well suited for high-quality routine analyses in laboratory settings and can be readily leveraged for research studies spanning diverse themes in natural-gas characterization.
3.2. UGS Well Composition GC-MS Analyzes
The quantification method was applied to real gas samples collected from both the wellhead and annular space to assess its validity on field-collected samples. Table S2 presents the monitoring data from two gas wellheads (GW_WH_B_8 and GW_WH_A_2), with gas sampling performed using high-pressure cylinders as previously described. In contrast, the results shown in (Table S3) were obtained by directly connecting the sampling system either to the wellhead (under high pressure) or to the annular space (under low pressure). Across several years of sampling, the method demonstrated excellent repeatability for all measured compounds. These findings confirm both the reliability and robustness of the sampling system, regardless of the sampling approach employed.
The optimized parameter method represents the best compromise for analyzing all targeted compounds within a single run. However, the repeatability of methane (CH4) measurements is less precise compared to other compounds. This reduced accuracy is attributed to the significantly higher concentration of methane relative to the other analytes, given that the injection parameters were specifically optimized for the determination of the minor components. To improve the accuracy of methane quantification, the method could be divided into two separate runs: one dedicated to methane and another for the less concentrated compounds.
Precise quantification of target gas species is critical for robust isotopic monitoring in gas well environments later, particularly in the annular space where concentrations may vary significantly. Such variations are closely linked to the origin and composition of the gas, necessitating methodological adjustments during analysis. For example, biomethane is typically enriched in carbon dioxide compared to thermogenic natural gas. This higher (CO2) concentration requires the adaptation of injected gas volumes to ensure accurate and reproducible isotopic ratio determinations. Failure to account for such compositional differences may compromise the reliability of isotopic interpretations.
3.3. Development of Isotopic Ratio Analyzes Methods
- IR validation ‘δ13C’ and ‘δ2H’ for alkanes, carbon dioxide and hydrogen
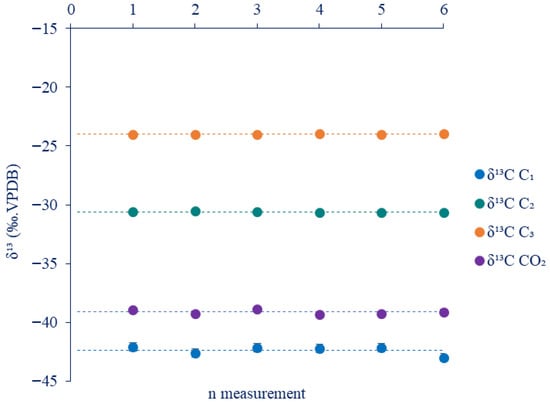
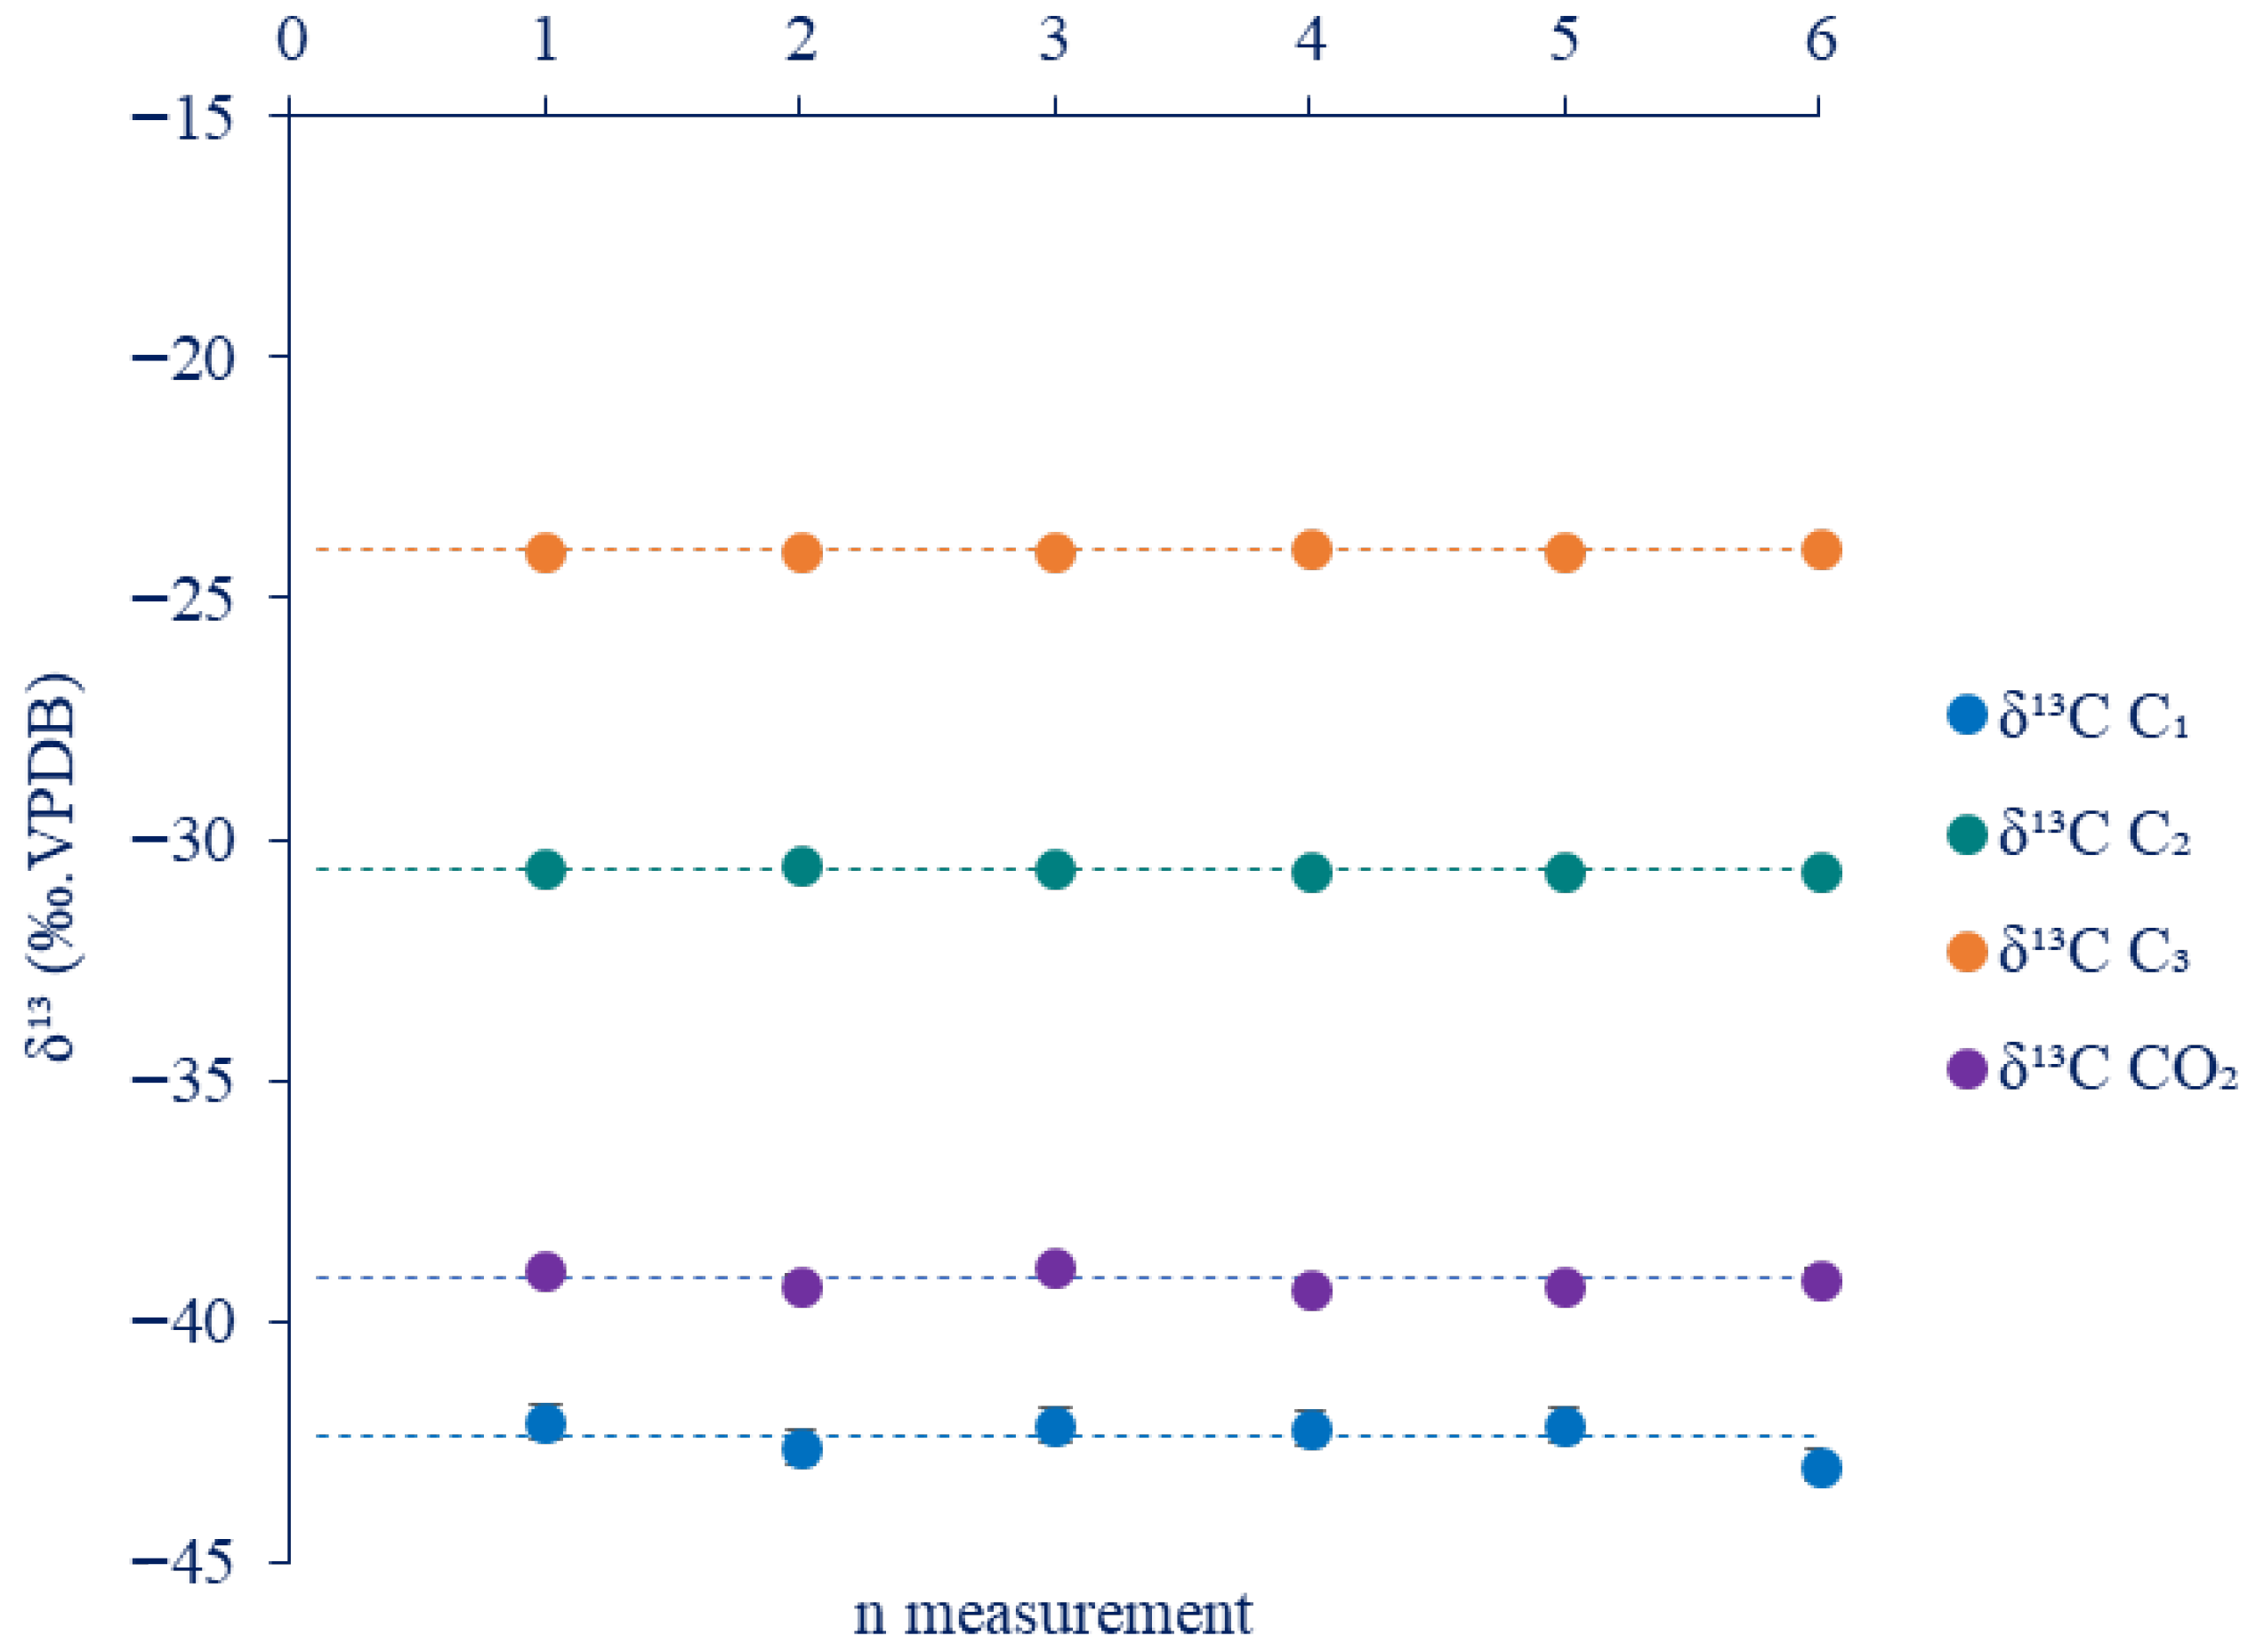
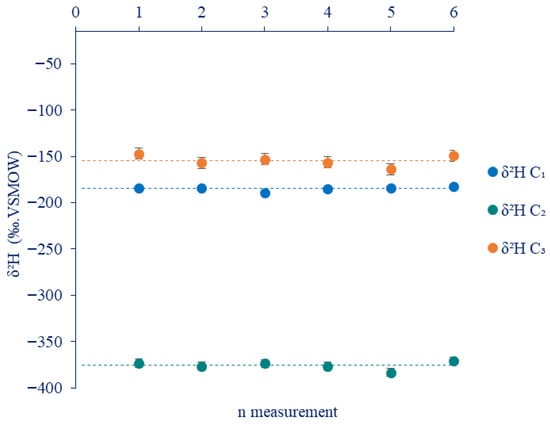
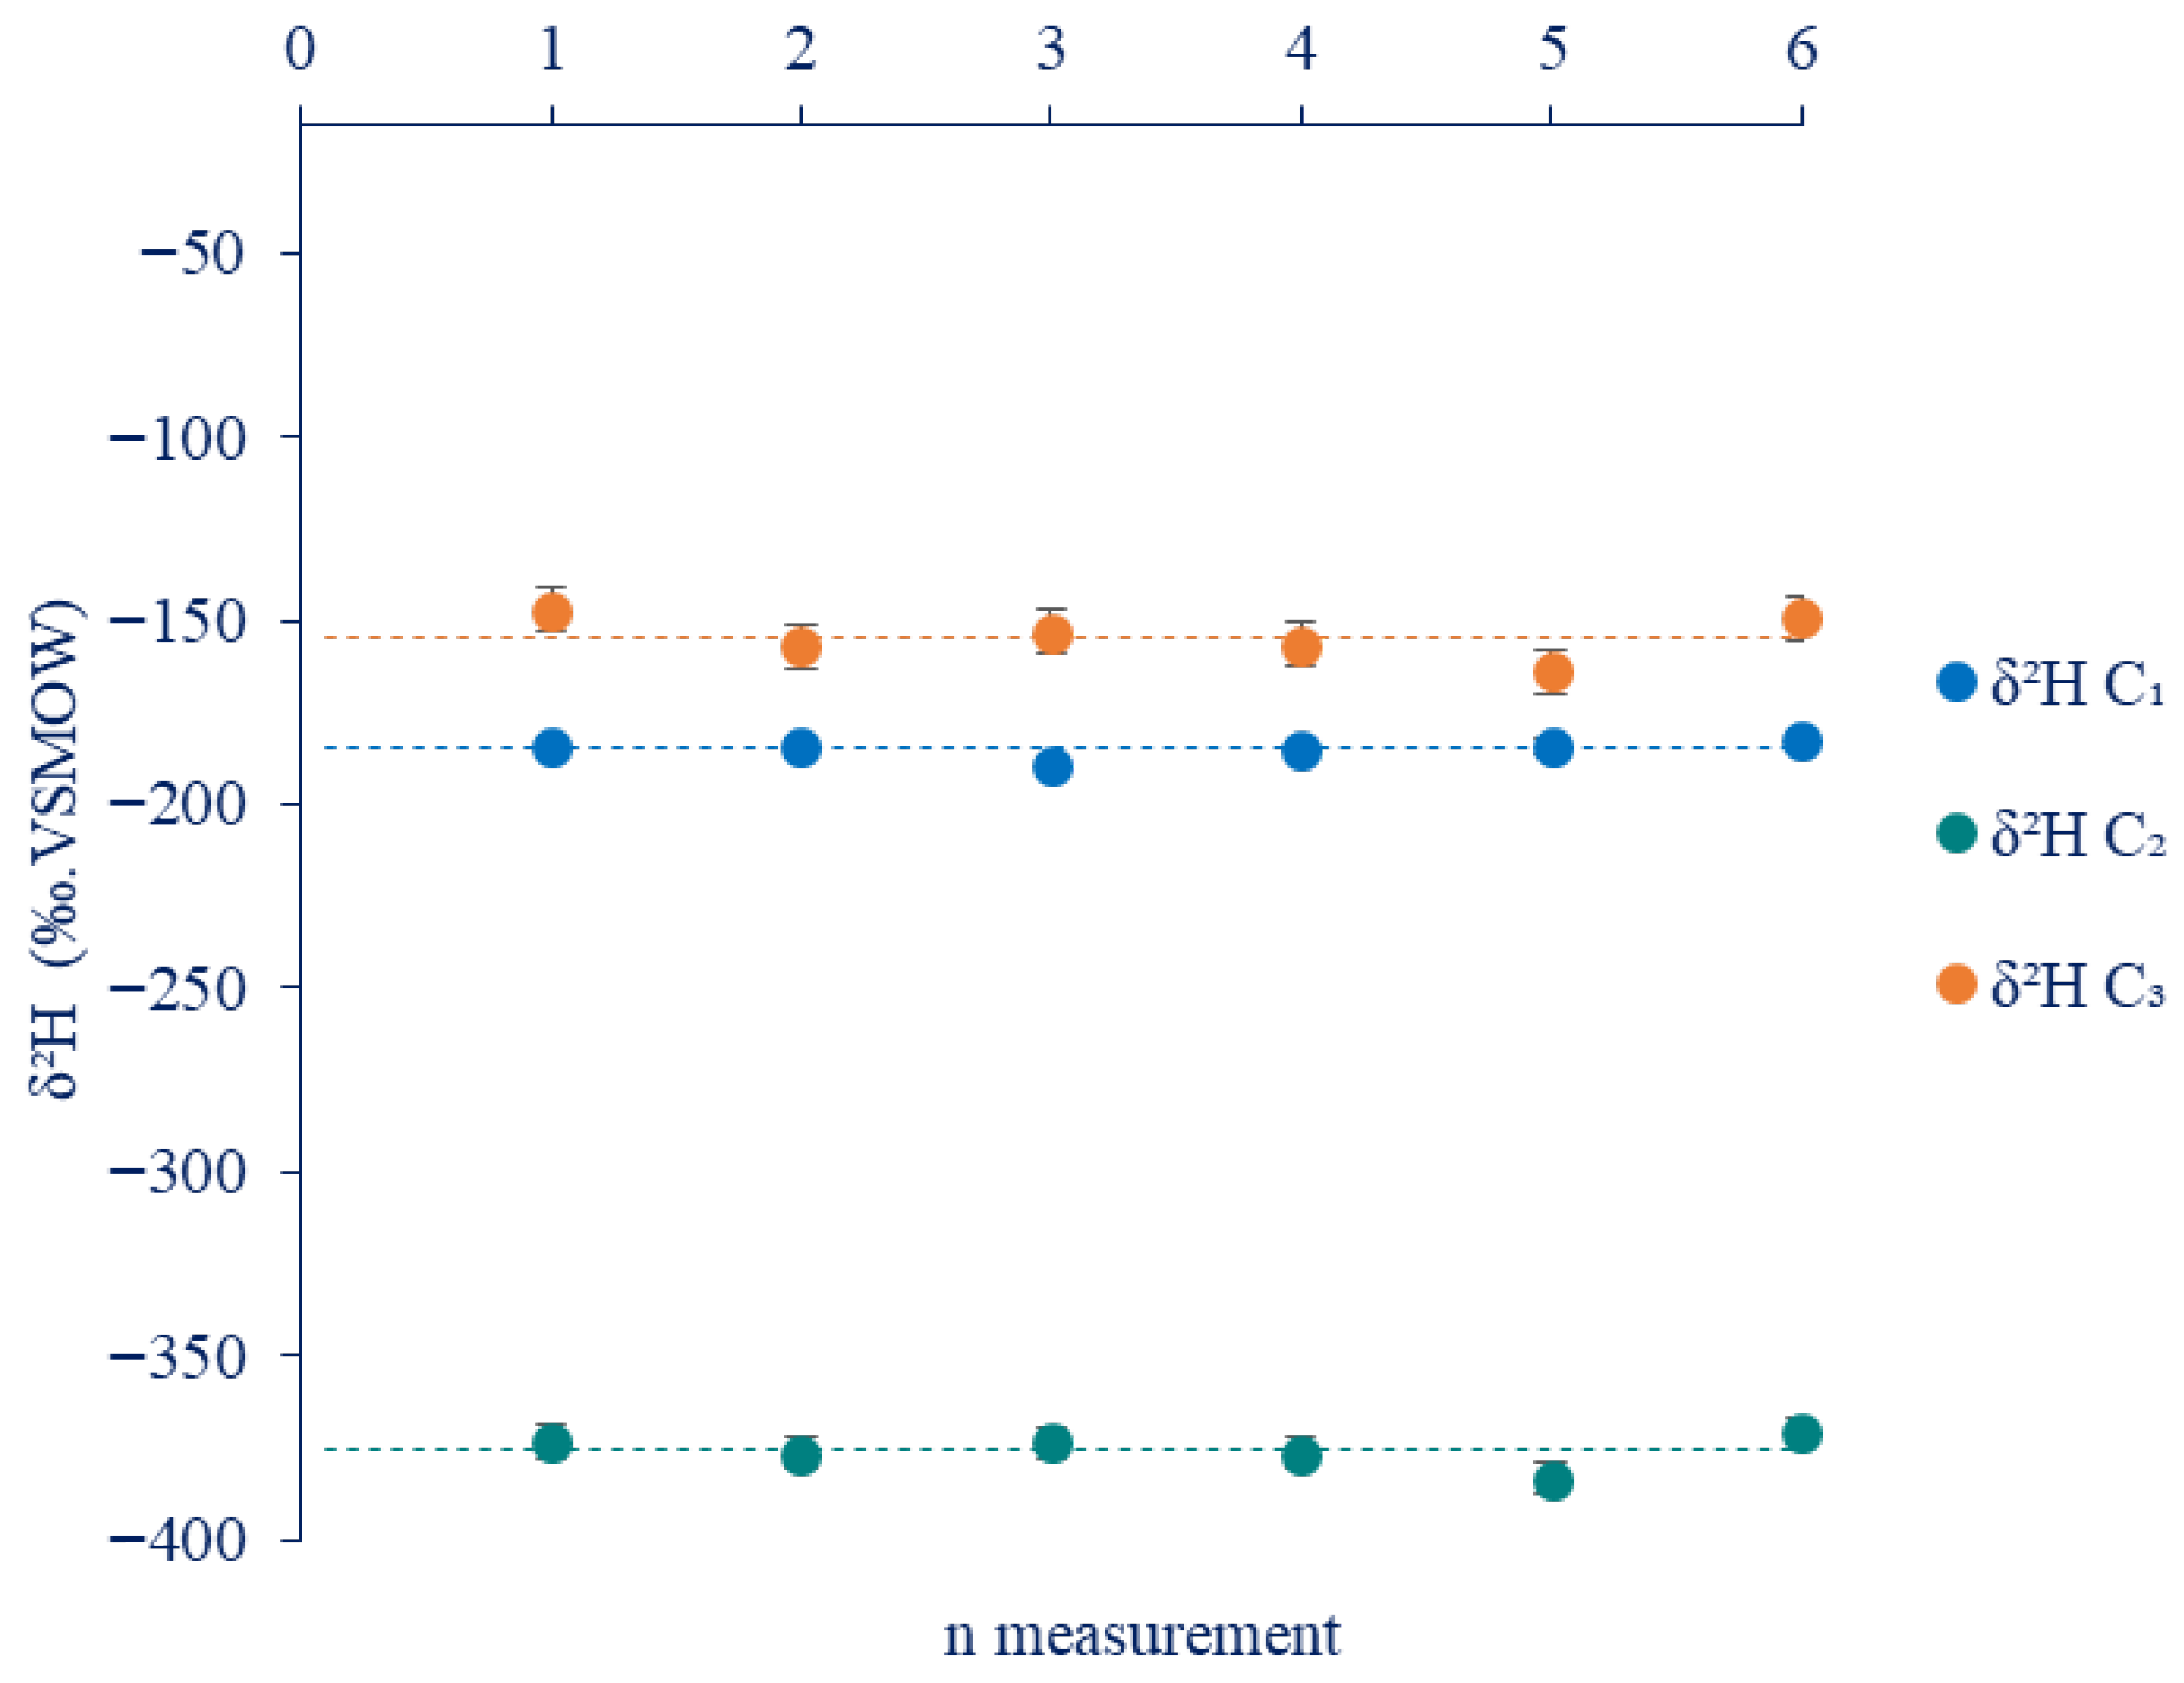
The repeatability study for δ13C and δ2H IR shows a very good repeatability with a very low standard deviation (around) as depicted in Figure 5 and Figure 6 for δ13C and δ2H of major compounds of natural gas, respectively.
Figure 5.
Alkanes repeatability study of δ13C Isotopic Analysis. (Data are presented as mean ± SD, n = 6).
Figure 6.
Alkanes Repeatability study of δ2H Isotopic Analysis. (Data are presented as mean ± SD, n = 6).
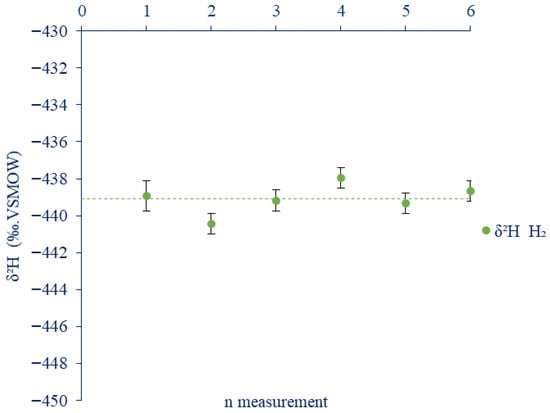
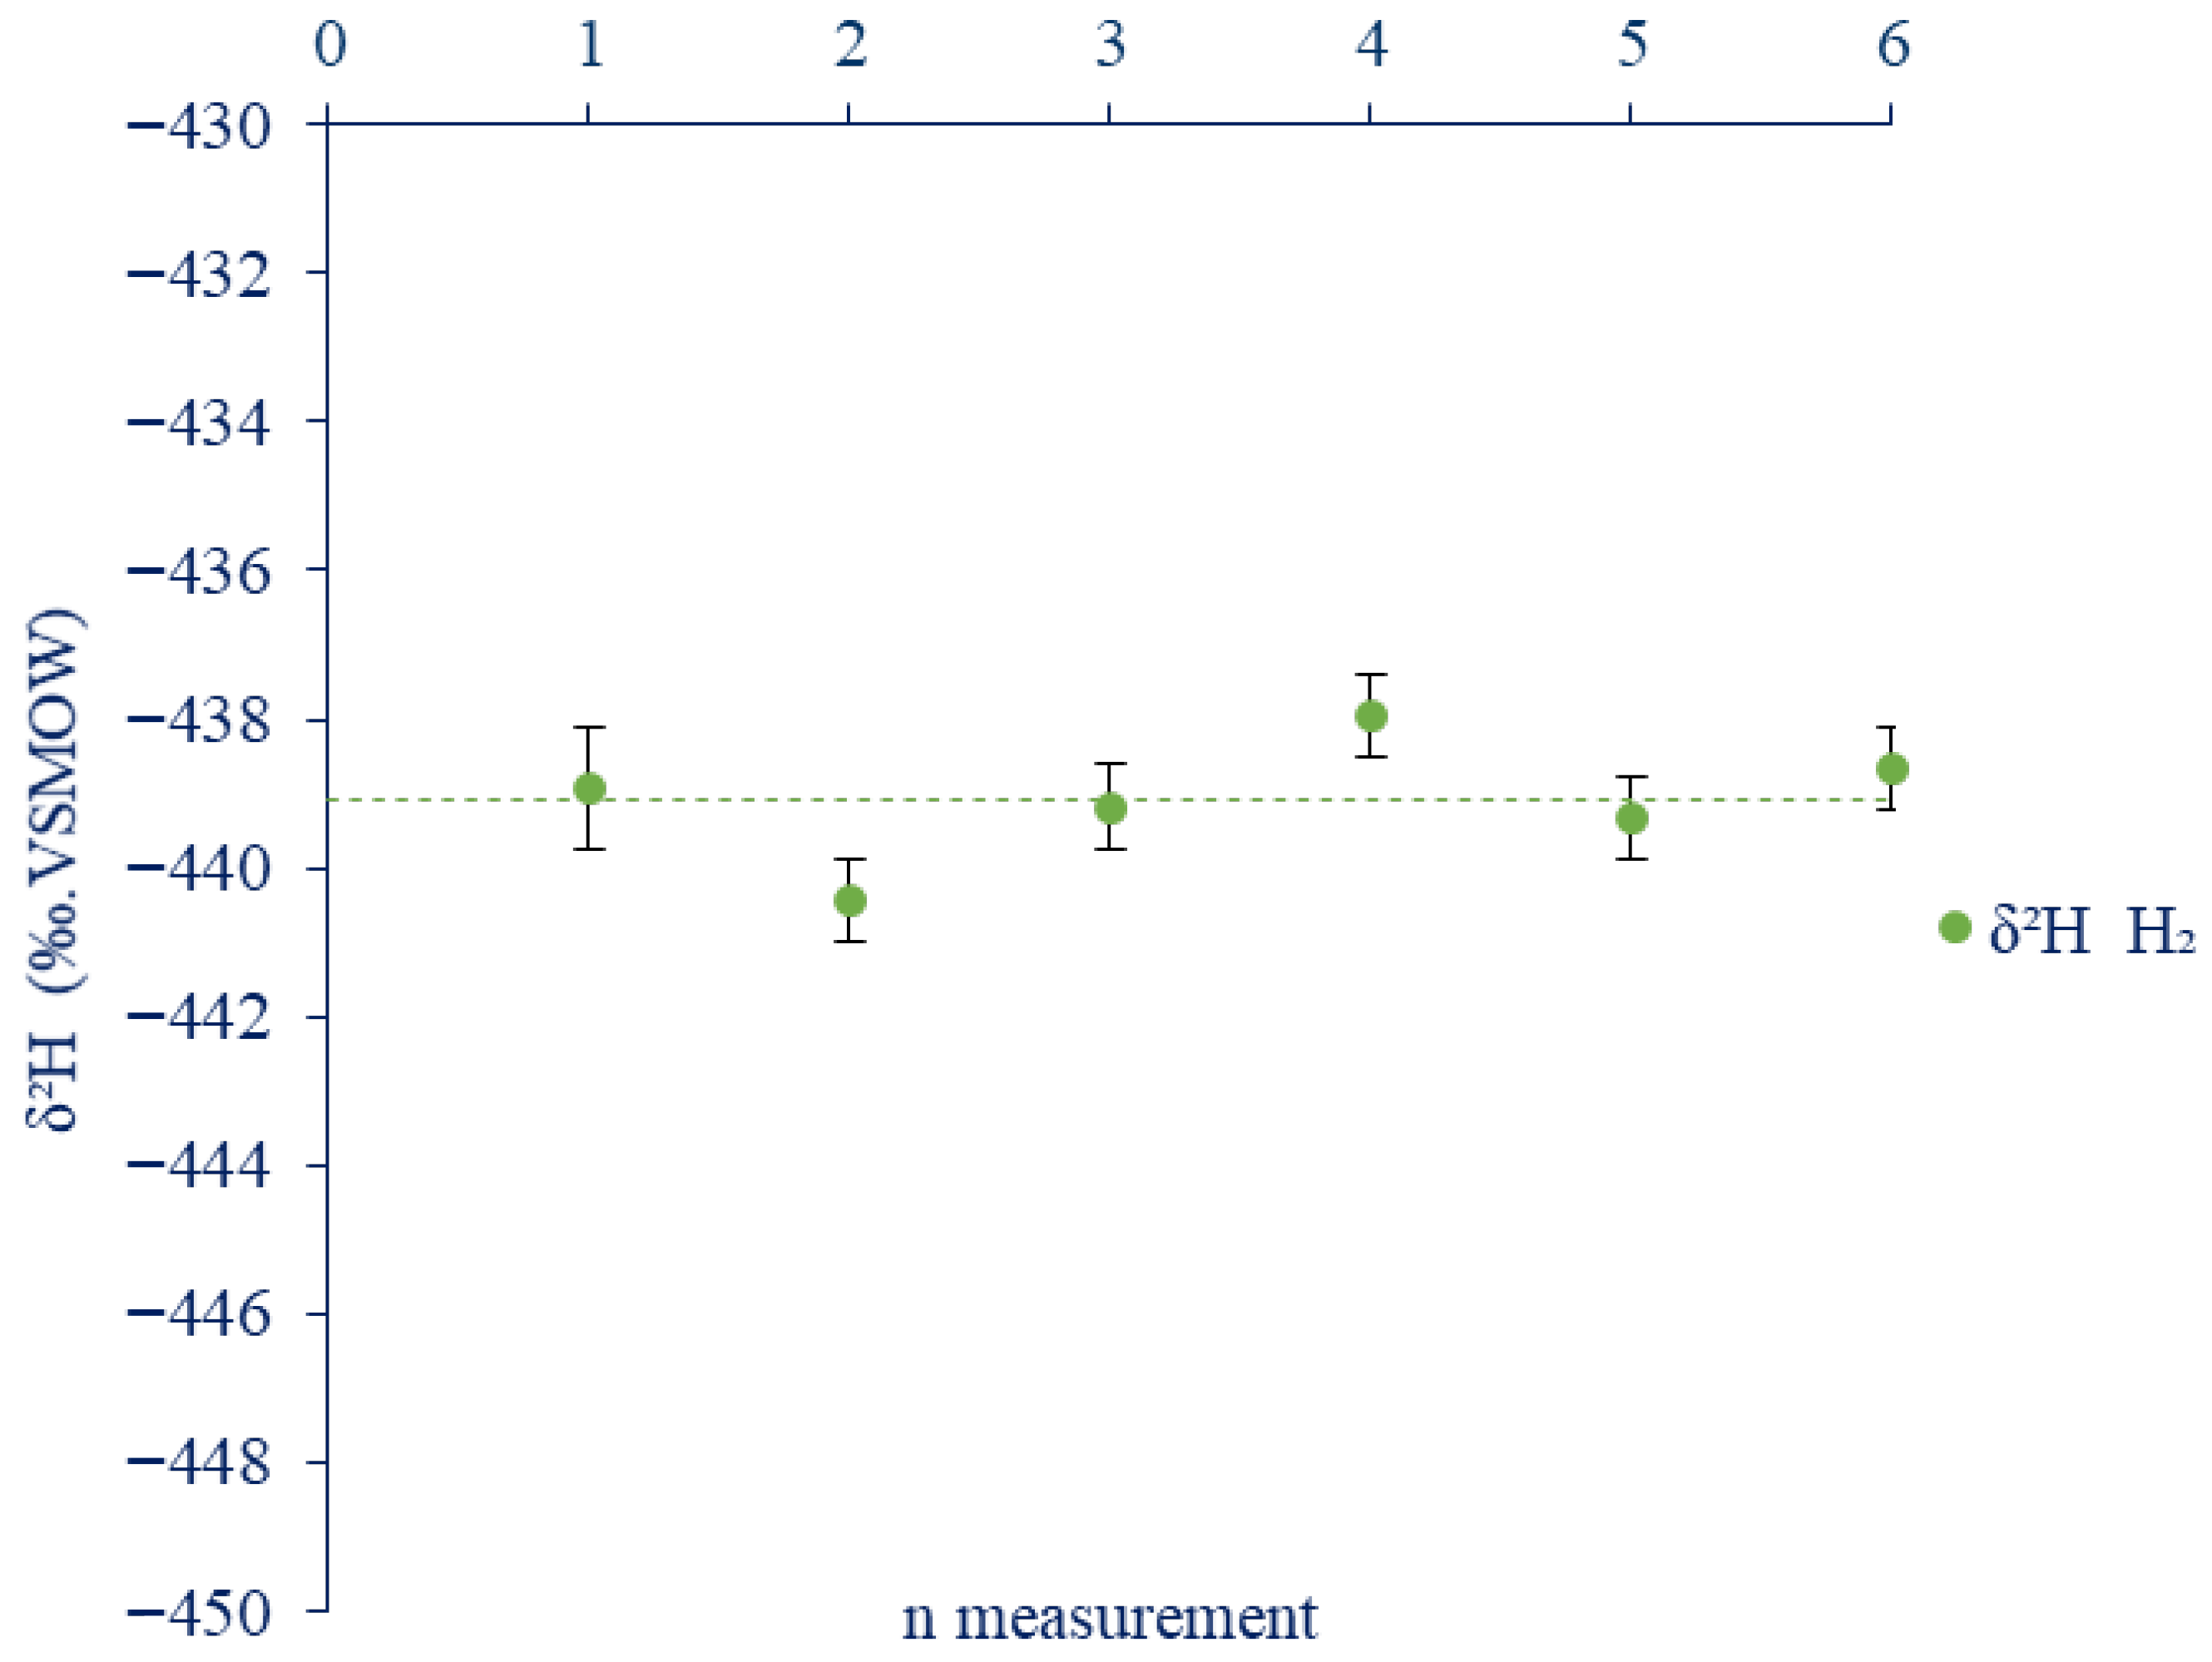
The results demonstrate excellent measurement repeatability for all element isotopic ratio of analyzed compounds, including alkanes (C1–C3), carbon dioxide and molecular hydrogen ‘H2’ (Figure 7), in both δ13C and δ2H. Standard deviations for δ13C were consistently low, typically below 0.2 ‰, while δ2H measurements also showed high precision, with standard deviations generally below 2 ‰. This high level of analytical precision reinforces the robustness of the method and provides strong confidence in its ability to deliver reliable isotopic measurements for real samples in subsequent analyses.
Figure 7.
Hydrogen ‘H2’ repeatability study of δ2H Isotopic Analysis (Data are presented as mean ± SD, n = 6).
The results obtained for these isotopic methods are insured with a typical natural gas composition around (90% of methane, 3% of ethane and propane and 1% of carbon dioxide). In case of a meaningful difference in the gas mixture, injection parameters need to be changed and adapted in order to obtain a coherent signal for samples and isotopic reference gas. Our IR analyses indicate that significant deviations in IR signal amplitude relative to the reference lead to biases in isotopic determinations, most noticeably in δ2H measurements. This effect highlights the sensitivity of δ2H to variations in signal intensity and suggests that careful signal normalization is required. Conversely, in cases where the IR response exhibits a clear linear relationship with the concentration of the target compound in the gas mixture, the injected volume can be directly inferred from the established injection parameters. For example, for a gas mixture containing 6% ethane, an injection volume of 50 µL with a 50:1 split is appropriate for δ13C analysis, in accordance with the fixed parameters (ii). This proportionality underscores the robustness of δ13C measurements under controlled injection conditions, in contrast to the greater susceptibility of δ2H to amplitude-related artifacts.
- UGS well IR ‘δ13C’ and ‘δ2H’ analyzes
The results shown in Table 5 and Table 6 present the δ13C and δ2H isotopic ratios measured on several on-site gas samples collected over multiple years using the two sampling procedures (cylinder and direct sampling) described in the Section 2. These data correspond to repeated analyses of nominally identical samples and therefore document the analytical performance of the developed and validated on-site sampling and measurement method. Over several years of field campaigns, the pooled standard deviation of replicate measurements remains better than 0.3‰ (1σ) for δ13C and 4‰ (1σ) for δ2H, demonstrating the good long-term analytical precision and robustness of the whole procedure, from field sampling to laboratory isotope ratio determination. Higher standard deviations observed for some samples are mainly related to variations in the concentration of the measured compounds. Overall, the standard deviations obtained with the two sampling approaches are comparable, as illustrated in Table 5 and Table 6, indicating that both cylinder and direct sampling provide similar analytical precision. The following results validate the accuracy of the analysis process including sampling at different field conditions, the variability of the targeted compound amount as shown in Table 6 and the various sampling campaigns across several years.
Table 5.
Stable carbon and hydrogen isotope compositions (δ13C, δ2H) of field gas samples collected by high-pressure cylinder sampling at natural-gas wellheads (WH) and at a biomethanisation plant (biomethane).
Table 6.
Stable carbon and hydrogen isotope compositions (δ13C, δ2H) of field gas samples collected during a one-day direct-connection campaign: wellhead gas (WH; 40–60 bar) and annular-space gas (AS; 1–2 bar).
This methodology has also been successfully applied to sampling from a biomethanisation plant (biomethane), as shown in Table 5. The results demonstrate that the approach can be extended to any type of gaseous source and site, regardless of composition. In the case of biomethane, which consists almost exclusively of CH4 and CO2, only the isotopic signatures of these major species are relevant. This confirms both the applicability and the robustness of the method, although its precision is inherently constrained by the chemical simplicity of the gas mixture.
- UGS well IR ‘δ2H’ Hydrogen analyzes
The δ2H isotopic composition of molecular hydrogen (H2) was determined for three gas field samples (Table 7), using a sampling system directly connected to the annular space under low pressure (1 bar) and with a small gas volume.
Table 7.
Hydrogen isotope composition (δ2H) of molecular hydrogen (H2) in annular-space (AS) field gas samples.
The results presented in Table 7 demonstrate good repeatability for δ2H measurements of H2. The standard deviations associated with δ2H measurements are relatively small, ranging from ±1‰ to ±3‰, which indicates a good analytical precision despite the very low-pressure sampling conditions. The replicate measurements at the same sampling point on 18 April 2025 (–755‰ with σ = 1 and –755‰ with σ = 3) show excellent agreement within error margins, supporting the reliability of the data. Overall, the low variability in δ2H compared to the analytical uncertainty suggests that the observed isotopic values are robust and not significantly influenced by measurement error. This methodology, applied to gaseous hydrogen, once again highlights the reliability of the implemented sampling protocol, as well as its versatility and suitability for application to various target molecules.
4. Discussion
The analytical work presented in this article is not a basic aleatory quantification and isotopic methods, it represents an ultimate guide to introduce a high-quality measurement for industrial gas fields research studies. It is the gate between the standardization of accurate analytical methods and the technical facilities requirement on-site and in the laboratory.
4.1. Gas Sampling Method
The optimized gas sampling system developed and validated in this study for multiple industrial applications—including a natural gas underground storage site (UGS-A) and a methanisation plant unit—demonstrates high robustness and versatility. The design allows for precise and reproducible sampling by maintaining accurate filling pressures and accommodating a wide range of experimental conditions, from high to low pressures and various sampling volumes. These features make the system a reliable sampling tool for high-precision industrial gas investigations, encompassing both chemical and isotopic analyses, in line with previous evaluations of vial-based sampling systems for free and dissolved gases in environmental studies [26].
While this work focused on the validation of the system for gaseous samples, its design is readily adaptable to more complex applications, such as the collection of dissolved gases in aqueous matrices. The capability of the system to ensures airtight, contamination-free filling, which is particularly beneficial for trace gas and noble gas analyses, as highlighted in dedicated protocols for dissolved gas and noble gas sampling and measurement [27]. In addition, the use of gas vials offers significant safety and logistical advantages compared to conventional cylinder-based sampling methods, particularly when handling highly flammable gases such as hydrogen, Furthermore, it represents a cost-effective alternative to cylinder sampling, which is especially advantageous for large-scale field campaigns requiring the collection of numerous samples (e.g., >10 samples per day). This combination of analytical reliability, adaptability, and operational safety positions the system as a valuable asset for industrial and environmental gas studies.
4.2. Pressure Quantification Principle
The quantification approach based on the relationship between pressure and the amount of substance in a gas mixture offers a robust and versatile framework for the development and validation of standardized analytical methods for gaseous compounds. This principle enables the establishment of a well-defined or extended analytical range using a single, tailor-made gas standard, thereby eliminating the need for multiple calibration cylinders at various concentrations. Such simplification significantly reduces both costs and lead times typically associated with the preparation of gas standards, and is consistent with current metrological practice for standard gas mixtures and volumetric or gravimetric preparation techniques [28,29].
The optimized injection volume represents an ideal compromise for the simultaneous quantification of multiple compounds exhibiting a wide range of concentrations (0.09 to 88% mol/mol) within a single run. This compromise, however, affected the pressure calibration range, leading to a slight offset and a regression line that does not intersect the origin. Consequently, the calibration range was set between 0.2 and 1 bar for methane (88.765%) and between 0.3 and 1 bar for the other components. Despite this offset, proportionality between signal response and concentration remains valid across the investigated pressure and concentration ranges. Performing the analysis in two separate runs—one optimized for methane and another for the remaining compounds—would improve quantification accuracy and yield calibration lines passing through the origin.
In the present study, a custom gas mixture enriched in hydrogen was employed, enabling the investigation of variable gaseous energy systems (e.g., natural gas/hydrogen blends). This methodological choice is particularly relevant within the current context of the energy transition, where accurate and adaptable analytical tools are required to characterize evolving gas compositions and support the development of emerging energy technologies, as emphasized in recent studies on hydrogen-mixed natural gas transport and quality control [30].
4.3. Isotopic Ratio Measurement
Isotopic analyses are key tools for both geochemical investigations and gas-infrastructure monitoring. While δ13C measurements of alkanes are now routine and widely reported in the literature, δ2H determinations remain more challenging—especially for heavier alkanes (C2–C3)—because of the high analytical sensitivity of their isotopologues.
In this context, the δ2H methodological development presented here provides a validated approach for on-site samples, delivering precision that is close to what is typically achieved for δ13C. This improved performance helps broaden the scope of geochemical studies by enabling a single, consistent sampling and a standardized analytical strategy, which in turn strengthens data comparability across sites and monitoring campaigns.
This integrated methodology also provides a solid analytical framework to support emerging energy transition challenges, particularly for the monitoring and management of renewable gases such as hydrogen and biomethane. Accurate isotopic determinations of δ13C and δ2H in alkanes (C1–C3), CO2, and H2 allow precise assessments of gas origin, mixing, and migration processes, which is consistent with established approaches for genetic classification of natural gas and dissolved hydrocarbons using combined carbon and hydrogen isotope systematics [31,32]. These assessments are essential for verifying the geological integrity of underground gas storage sites, CO2 sequestration reservoirs, and hydrogen infrastructure.
The robustness of this approach has been demonstrated over multiple sampling campaigns, maintaining consistent isotopic results despite natural compositional variations. Similar combined use of gas composition, stable isotopes and noble gases has proven effective for long-term geochemical surveillance at underground gas and CO2 storage sites, such as the Aquifer natural gas storage and the Rousse CO2 pilot site [33].Overall, this system offers a reliable and adaptable solution for geochemical surveillance in support of safe and sustainable subsurface energy storage and transport, in line with broader developments in hydrogen-mixed natural gas infrastructure [30].
5. Conclusions
The combination of the developed approaches—sampling and analytical—provides a comprehensive framework for large-scale monitoring of complex gaseous systems across diverse industrial environments and subsurface applications. The excellent reproducibility and accuracy achieved under both laboratory and field conditions demonstrate the robustness and versatility of the system, enabling extensive and long-term gas monitoring through a single high-performance methodology. The strong agreement between laboratory and on-site results confirms the complementarity of this approach with conventional gas cylinder sampling. Full compliance with ATEX safety standards ensures safe operation, while the implemented procedures effectively prevent contamination of the sampled gas. Furthermore, its capability to operate across a wide pressure range (1–250 bar), combined with a constant vacuum mechanism, ensures technical adaptability and preservation of sample integrity under a variety of field conditions.
Moreover, the developed methodology can be extended and adapted to a wide range of other compound studies, particularly those sensitive to atmospheric contamination, such as noble gas measurements. It is also suitable for applications requiring sampling at very low pressures and volumes, as well as for the collection and analysis of dissolved gases in water or other liquid matrices, further broadening its applicability in geochemical and environmental investigations.
Supplementary Materials
The following supporting information can be downloaded at: https://www.mdpi.com/article/10.3390/analytica7010014/s1, Figure S1: Calibration Certificate of the Certified Natural Gas Reference Mixture (EffecTech, 2023); Figure S2: Gas chromatograph coupled to Isotopic Ratio Mass Spectrometer system (GC-IRMS); Figure S3: Isotopic ratio mass spectrometry analysis of δ13C ethane ‘C2H6’ and propane ‘C3H8’; Table S1: Assessment of Repeatability for Natural Gas Compound Quantification (n = 10); Table S2: Quantification of gas well field samples, gas cylinder sampling (n = 3); Table S3: Quantification of gas well field samples, One day sampling campaign, direct plugging (n = 3); Table S4: Manometer Specifications; Table S5: Maximum Pressure Supported by the Different Components (bar); Data S1. Detailed Gas Sampling Protocol.
Author Contributions
Conceptualization, Z.E.H., H.C., I.L.H., P.C. and M.L.; methodology, Z.E.H., H.C., I.L.H., M.L. and P.C.; validation, Z.E.H.; formal analysis, Z.E.H., H.C., P.C., I.L.H., M.L. and B.B.; investigation, Z.E.H.; data curation, Z.E.H., H.C. and I.L.H.; writing—original draft preparation, Z.E.H.; writing—review and editing, Z.E.H., H.C., P.C., I.L.H. and B.B.; visualization, Z.E.H.; supervision, I.L.H., H.C. and P.C.; funding acquisition, H.C., I.L.H. and P.C. All authors have read and agreed to the published version of the manuscript.
Funding
This research was funded by Teréga (40 Avenue de l’Europe, CS 20 522–64010 PAU Cedex, France) and The APC was funded by Université de Pau et des Pays de l’Adour.
Data Availability Statement
For privacy protection, data presented in this study are available upon reasonable request from the corresponding author.
Acknowledgments
The authors gratefully acknowledge Teréga (40 Avenue de l’Europe, CS 20 522–64010 PAU Cedex, France) for its contribution to this work.
Conflicts of Interest
The authors declare that they have no known competing financial interests or personal relationships that could have appeared to influence the work reported in this paper.
Abbreviation
The following abbreviations are used in this manuscript:
| A-UGS | Aquifer Underground Gas Storage |
| CSIA | Compound-Specific Isotopic Analysis |
| δ13C | 13C/12C isotopic ratio (expressed per mill ‰) |
| δ2H | 2H/1H isotopic ratio (expressed per mill ‰) |
| PTFE | Polytetrafluoroethylene |
| HS | Head-Space |
| GC | Gas Chromatography |
| MS | Mass Spectrometry |
| IR | Isotopic Ratio |
| PDB | Vienna Peedee Belemnite |
| V-SMOW | Vienna Standard Mean Ocean Water |
| S/N | Signal/Noise |
| VOCs | Volatile Organic Compound (s for semi) |
| TCD | Thermal Conductivity Detector |
| % mol/mol | Molar percent % |
| R2 | Determination factor |
| Std dev | Standard deviation |
| ATEX | potentially explosive atmospheres |
| LOQ | Limit of Quantification |
| GW | Gas Well |
| WH | Well-Head |
| AS | Annular Space |
Appendix A
Table A1.
Estimation of GC separation by chromatographic parameters.
References
- Llewellyn, G.T.; Dorman, F.; Westland, J.L.; Yoxtheimer, D.; Grieve, P.; Sowers, T.; Humston-Fulmer, E.; Brantley, S.L. Evaluating a Groundwater Supply Contamination Incident Attributed to Marcellus Shale Gas Development. Proc. Natl. Acad. Sci. USA 2015, 112, 6325–6330. [Google Scholar] [CrossRef] [Scilit] [PubMed]
- Prinzhofer, A.; Battani, A. Gas Isotopes Tracing: An Important Tool for Hydrocarbons Exploration. Oil Gas Sci. Technol. 2003, 58, 299–311. [Google Scholar] [CrossRef] [Scilit]
- Hammond, P.A.; Wen, T.; Brantley, S.L.; Engelder, T. Gas Well Integrity and Methane Migration: Evaluation of Published Evidence during Shale-Gas Development in the USA. Hydrogeol. J. 2020, 28, 1481–1502. [Google Scholar] [CrossRef] [Scilit]
- Liu, Q.; Wu, X.; Zhu, D.; Meng, Q.; Xu, H.; Peng, W.; Huang, X.; Liu, J. Generation and Resource Potential of Abiogenic Alkane Gas under Organic–Inorganic Interactions in Petroliferous Basins. J. Nat. Gas Geosci. 2021, 6, 79–87. [Google Scholar] [CrossRef] [Scilit]
- Han, S.-B.; Xiang, C.-H.; Du, X.; Xie, L.-F.; Huang, J.; Wang, C.-S. Geochemistry and Origins of Hydrogen-Containing Natural Gases in Deep Songliao Basin, China: Insights from Continental Scientific Drilling. Pet. Sci. 2024, 21, 741–751. [Google Scholar] [CrossRef] [Scilit]
- Buriánková, I.; Molíková, A.; Vítězová, M.; Onderka, V.; Vítěz, T.; Urbanová, I.; Hanišáková, N.; Černý, M.; Novák, D.; Lochman, J.; et al. Microbial Communities in Underground Gas Reservoirs Offer Promising Biotechnological Potential. Fermentation 2022, 8, 251. [Google Scholar] [CrossRef] [Scilit]
- Winnefeld, F.; Leemann, A.; German, A.; Lothenbach, B. CO2 Storage in Cement and Concrete by Mineral Carbonation. Curr. Opin. Green Sustain. Chem. 2022, 38, 100672. [Google Scholar] [CrossRef] [Scilit]
- Omosebi, O.; Maheshwari, H.; Ahmed, R.; Shah, S.; Osisanya, S. Experimental Study of the Effects of CO2 Concentration and Pressure at Elevated Temperature on the Mechanical Integrity of Oil and Gas Well Cement. J. Nat. Gas Sci. Eng. 2017, 44, 299–313. [Google Scholar] [CrossRef] [Scilit]
- Cesar, J.; Nightingale, M.; Becker, V.; Mayer, B. Stable Carbon Isotope Systematics of Methane, Ethane and Propane from Low-Permeability Hydrocarbon Reservoirs. Chem. Geol. 2020, 558, 119907. [Google Scholar] [CrossRef] [Scilit]
- George, D.L.; Hart, R.A.; Nored, M. Evaluation of a Proposed Gas Sampling; Southwest Research Institute: San Antonio, TX, USA, 2004; pp. 7–10. [Google Scholar]
- GPA 2261; Analysis of Natural Gas and Similar Gaseous Mixtures by Gas Chromatography. Gas Producers Association: Tulsa, OK, USA, 2000.
- ISO 10715:2022(F); Natural Gas—Gas Sampling. ISO: Geneva, Switzerland, 2022.
- American Petroleum Institute. Chapter 14—Natural Gas Fluids Measurement. In Manual of Petroleum Measurement Standards; American Petroleum Institute: Washington, DC, USA, 2007. [Google Scholar]
- GPA Midstream Standard 2166-22; Collecting and Handling of Natural Gas Samples for Analysis by Gas Chromatography. GPA Midstream Association: Tulsa, OK, USA; American Petroleum Institute: Washington, DC, USA, 2022.
- Lawrence, P. Overview of Practical Natural Gas Sampling. Trans. Inst. Meas. Control 2024, 34, 6–8. [Google Scholar]
- Rosen, M.E.; Pankow, J.F.; Gibs, J.; Imbrigiotta, T.E. Comparison of Downhole and Surface Sampling for the Determination of Volatile Organic Compounds (VOCs) in Ground Water. Groundw. Monit. Rem. 1992, 12, 126–133. [Google Scholar] [CrossRef] [Scilit]
- ASTM D1945-14(2019); Test Method for Analysis of Natural Gas by Gas Chromatography. ASTM International: West Conshohocken, PA, USA, 2019. [CrossRef] [Scilit]
- Braeckevelt, M.; Fischer, A.; Kästner, M. Field Applicability of Compound-Specific Isotope Analysis (CSIA) for Characterization and Quantification of in Situ Contaminant Degradation in Aquifers. Appl. Microbiol. Biotechnol. 2012, 94, 1401–1421. [Google Scholar] [CrossRef] [Scilit]
- Blessing, M.; Proust, E.; Fléhoc, C. Customized Injection Techniques for Compound-Specific Isotope Analysis of Natural Gas Samples. Procedia Earth Planet. Sci. 2015, 13, 227–231. [Google Scholar] [CrossRef] [Scilit]
- García-Rincón, J.; Gatsios, E.; Lenhard, R.J.; Atekwana, E.A.; Naidu, R. (Eds.) Advances in the Characterisation and Remediation of Sites Contaminated with Petroleum Hydrocarbons; Environmental Contamination Remediation and Management; Springer International Publishing: Cham, Switzerland, 2024; ISBN 978-3-031-34446-6. [Google Scholar]
- Lecharlier, A.; Bouyssiere, B.; Carrier, H.; Hécho, I.L. Promises of a New Versatile Field-Deployable Sorbent Tube Thermodesorber by Application to BTEX Analysis in CH4. Talanta Open 2021, 4, 100066. [Google Scholar] [CrossRef] [Scilit]
- Burns, D.T.; Danzer, K.; Townshend, A. Use of the Terms “Recovery” and “Apparent Recovery” in Analytical Procedures: (IUPAC Recommendations 2002). Pure Appl. Chem. 2009, 74, 2201–2205. [Google Scholar] [CrossRef] [Scilit]
- ICH M10; ICH Guideline M10 on Bioanalytical Method Validation and Study Sample Analysis_Step 5. European Medicines Agency: Amsterdam, The Netherlands, 2022.
- ISO 6974-5:2014(E); Natural Gas—Determination of Composition and Associated Uncertainty by Gas Chromatography. ISO: Geneva, Switzerland, 2014.
- Ribessi, R.L.; Neves, T.D.A.; Rohwedder, J.J.R.; Pasquini, C.; Raimundo, I.M.; Wilk, A.; Kokoric, V.; Mizaikoff, B. iHEART: A Miniaturized near-Infrared in-Line Gas Sensor Using Heart-Shaped Substrate-Integrated Hollow Waveguides. Analyst 2016, 141, 5298–5303. [Google Scholar] [CrossRef] [Scilit]
- Nauer, P.A.; Chiri, E.; Jirapanjawat, T.; Greening, C.; Cook, P.L.M. Technical Note: Inexpensive Modification of Exetainers for the Reliable Storage of Trace-Level Hydrogen and Carbon Monoxide Gas Samples. Biogeosciences 2021, 18, 729–737. [Google Scholar] [CrossRef] [Scilit]
- Hunt, A.G. U.S. Geological Survey Noble Gas Laboratory’s Standard Operating Procedures for the Measurement of Dissolved Gas in Water Samples; USGS: Reston, VA, USA, 2015.
- Słomińska, M.; Konieczka, P.; Namieśnik, J. Standard Gas Mixtures—Indispensable Reference Materials in the Analysis of Gaseous Media. TrAC Trends Anal. Chem. 2010, 29, 419–429. [Google Scholar] [CrossRef] [Scilit]
- Raal, J.D.; Nelson, W.M. Gas Chromatograph Calibration of Gas Mixtures Using a Versatile Precision Volumetric Apparatus. Rev. Sci. Instrum. 2022, 93, 054108. [Google Scholar] [CrossRef] [Scilit]
- Zhang, C.; Shao, Y.; Shen, W.; Li, H.; Nan, Z.; Dong, M.; Bian, J.; Cao, X. Key Technologies of Pure Hydrogen and Hydrogen-Mixed Natural Gas Pipeline Transportation. ACS Omega 2023, 8, 19212–19222. [Google Scholar] [CrossRef] [Scilit]
- Liu, Q.; Wu, X.; Wang, X.; Jin, Z.; Zhu, D.; Meng, Q.; Huang, S.; Liu, J.; Fu, Q. Carbon and Hydrogen Isotopes of Methane, Ethane, and Propane: A Review of Genetic Identification of Natural Gas. Earth-Sci. Rev. 2019, 190, 247–272. [Google Scholar] [CrossRef] [Scilit]
- Schloemer, S.; Elbracht, J.; Blumenberg, M.; Illing, C.J. Distribution and Origin of Dissolved Methane, Ethane and Propane in Shallow Groundwater of Lower Saxony, Germany. Appl. Geochem. 2016, 67, 118–132. [Google Scholar] [CrossRef] [Scilit]
- Garcia, B.; Billiot, J.H.; Rouchon, V.; Mouronval, G.; Lescanne, M.; Lachet, V.; Aimard, N. A Geochemical Approach for Monitoring a CO2 Pilot Site: Rousse, France. A Major Gases, CO2-Carbon Isotopes and Noble Gases Combined Approach. Oil Gas Sci. Technol. 2012, 67, 341–353. [Google Scholar] [CrossRef] [Scilit]

Disclaimer/Publisher’s Note: The statements, opinions and data contained in all publications are solely those of the individual author(s) and contributor(s) and not of MDPI and/or the editor(s). MDPI and/or the editor(s) disclaim responsibility for any injury to people or property resulting from any ideas, methods, instructions or products referred to in the content. |
© 2026 by the authors. Licensee MDPI, Basel, Switzerland. This article is an open access article distributed under the terms and conditions of the Creative Commons Attribution (CC BY) license.