


Abstract
The primary objective of the current study is to establish and validate for the first time a method to determine and quantify praziquantel (PZQ) and its main degradation products loaded in poly(methyl methacrylate–co-2-(diethylamino)ethyl methacrylate) P(MMA-co-DEAEMA) microparticles. A high-performance liquid chromatography (HPLC) approach was developed and validated in accordance with the United States Pharmacopeia (USP) guidelines, addressing parameters such as accuracy, linearity, solution stability, precision, specificity, robustness, sensitivity, and system suitability. The method employed a gradient mobile phase consisting of ultrapure water and acetonitrile, flowing at a rate of 1 mL/minute over a Phenomenex Kinetex® C18 column (5 µm, 100 Å, 250 × 4.6 mm) maintained at 35 °C. Detection was performed at the wavelength of 210 nm using a DAD/UV detector. Samples of the active pharmaceutical ingredient (API) praziquantel, microencapsulated praziquantel, placebo, and a mixture of related substances (A, B, and C) were prepared with 0.5% formic acid in water/ethanol, 45:55 v/v as the diluent, and injected at 20 °C. The method demonstrated a limit of quantification (LOQ) of 0.20 µg/mL for praziquantel and related substances. The method exhibited an excellent linear response, with all correlation coefficients (R2) values exceeding 0.998, which is well above the recommended specified limit of R2 > 0.995. Percent recoveries fell within the acceptable range of (95.0–105.0%), and all results indicated a percentage of relative standard deviation (%RSD) ≤ 2.0, indicating a robust methodology. Thus, the proposed HPLC technique proved to be selective, accurate, sensitive, and consistent in analyzing both the material content and its main degradation products.
1. Introduction
Schistosomiasis is the second most prevalent parasitic disease worldwide and remains a major public health concern in tropical and subtropical regions. More than 250 million people are infected, about 800 million are at risk, and mortality reaches 280,000 deaths annually in Sub-Saharan Africa [1,2,3]. Beyond prevalence, the disease causes significant acute and chronic morbidity in school-age children, contributing to persistent poverty in endemic areas [4,5,6]. Control strategies include health education, sanitation improvements, access to clean water, snail control, and treatment of infected individuals [7,8]. Praziquantel (PZQ) is the primary drug for schistosomiasis and is listed as an essential medicine by the WHO [9,10]. It is a cost-effective tetrahydrogenated pyrazino-isoquinoline anthelmintic with broad-spectrum efficacy [11]. Despite its effectiveness, limitations such as poor palatability and the absence of child-friendly formulations pose challenges, particularly because the available tablets are large and have an unpleasant taste [12,13]. As a result, new pharmaceutical forms of PZQ have been explored to better meet pediatric needs [14,15,16].
One of the proposed solutions involves the development of a sachet for oral suspension, based on polymer microparticles loaded with PZQ through the in situ suspension copolymerization of methyl methacrylate (MMA) and 2-(diethylamino)ethyl methacrylate (DEAEMA), in order to enhance drug swallowing and mask the characteristic taste and odor of PZQ [17,18,19]. This enhanced PZQ form has been investigated in previously published works, demonstrating its viability as a promising alternative for a product specifically designed for pediatric use. However, as new formulations introduce additional excipients and structural complexity, ensuring compliance with regulatory quality standards becomes even more crucial. In this context, chemical stability studies supported by reliable analytical methodologies are fundamental to guarantee product safety and performance [20,21].
For this reason, regulatory authorities emphasize the need to determine degradation profiles based on degradation products (DPs) generated under different stress conditions [22,23,24]. Given the chemical vulnerability of drug molecules to environmental conditions, detecting DPs is a critical concern during the development of new formulations [22,25,26]. The official monographs of the United States Pharmacopeia [27], the European Pharmacopeia [28], and the Brazilian Pharmacopeia [29] assess the purity of PZQ using a high-performance liquid chromatography–ultraviolet (HPLC-UV) assay. Although several analytical methods for quantifying PZQ and its related substances have been described, none were applicable to the present material. The matrix composed of PMMA-co-DEAEMA microparticles introduces a peak that is not present in conventional tablet formulations. When the pharmacopeial method (as well as other published methods) was applied to our polymeric system, the copolymer (placebo) generated a peak in the same region where the known degradation product, Compound A, elutes. This co-elution interferes with the accurate quantification of this impurity. Therefore, the limitation is not related to PZQ itself, but to the interaction between chromatographic conditions and the polymeric excipient. The unique chromatographic behavior of PMMA-co-DEAEMA requires a separation method capable of resolving Compound A from the polymer contribution. Since existing methods cannot ensure selectivity, accuracy, and specificity in this matrix, the development of a new analytical method was necessary. Although methods for praziquantel quantification exist, none address the specific analytical challenges posed by our novel formulation. Establishing a robust and selective method tailored to this matrix is scientifically relevant and indispensable, as it enables rigorous regulatory studies—including forced-degradation and stability assessments—and provides the analytical foundation required for the future certification and translation of this material into a viable product for effective schistosomiasis control.
In 2017, Hashem and colleagues developed and validated a liquid chromatography method for determining praziquantel and its pharmacopeial impurities [30]. For this purpose, a calixarene column (Caltrex AI®) and an isocratic mobile phase of acetonitrile and ammonium acetate were used. The validation process encompassed system suitability, linearity, precision, limits of detection and quantitation, specificity, stability, and robustness. It was demonstrated that the proposed method could ensure the precise and accurate determination of PZQ in oral tablet formulations while guaranteeing a satisfactory separation from degradation impurities. Building upon these concepts and addressing the specific analytical challenges posed by polymer-loaded PZQ microparticles, the primary objective of the present study was to establish and validate, for the first time, a method for determining and quantifying praziquantel (PZQ) and its primary degradation products loaded into PMMA-co-DEAEMA microparticles. To achieve this, an HPLC-UV approach was developed and validated in accordance with the United States Pharmacopeia (USP) guidelines, encompassing parameters such as accuracy, linearity, solution stability, precision, specificity, robustness, sensitivity, and system suitability.
2. Materials and Methods
2.1. Chemicals
The reference materials used in this study were the praziquantel working standard (Instituto Nacional de Controle de Qualidade em Saúde—INCQS, Rio de Janeiro, Brazil) and USP related substances A, B, and C (United States Pharmacopeia, Rockville, MD, USA). Commercially available PZQ (with minimum purity of 98 wt%) was provided by YIXING CITY XINGYU MEDICINE CHEMICALS Co (Yixing, China) and kindly donated by Fiocruz (Rio de Janeiro, Brazil). PMMA-co-DEAEMA microencapsulated praziquantel and the respective microparticle placebo were produced for the present study, as described elsewhere [17]. Ethanol and acetonitrile (ACN) (HPLC grades, with minimum purity of 99.8 wt%) were provided by Biograde (Anápolis, Brazil), while formic acid was supplied by Supelco (Merck, Rio de Janeiro, Brazil) with minimum purity of 98 wt%. Poly(vinylidene fluoride) (PVDF) syringe filters with a pore size of 0.45 µm were provided by Merck (Rio de Janeiro, Brazil). For the preparation of the samples and the mobile phase, deionized ultrapure water was produced using a water purification system provided by Merck (Millipore, model Milli Q-Plus, Merck, Rio de Janeiro, Brazil).
2.2. Instrumentation
The chromatographic studies were conducted using an Agilent Series 1100 HPLC System (Agilent Technologies, Santa Clara, CA, USA), equipped with a quaternary pump, a degasser, an autosampler, a column oven, a sample cooler, and a UV detector. The proprietary system control software OpenLab CDS2 version 3.2 was used for data acquisition, monitoring, and peak integration of output chromatograms.
2.3. Chromatographic Conditions
During method development, several parameters were systematically evaluated to ensure adequate separation of praziquantel (PZQ), its degradation products, and the signal originating from the PMMA-co-DEAEMA matrix. Although the column type was not changed (only additional batches of Phenomenex Hyperclone BDS C18 column were assessed, with no changes to column type or manufacturer), multiple mobile-phase compositions and elution strategies were explored. Initially, isocratic elution systems with different water–acetonitrile ratios were evaluated. However, these conditions did not provide sufficient resolution between the copolymer (placebo) peak and the known degradation product, Compound A, which co-eluted under all isocratic conditions tested. To overcome this limitation, gradients with varying slopes and organic-phase proportions were investigated. Gradient elution proved essential to achieve separation between the interfering placebo peak and Compound A, which was a critical requirement for method selectivity in this formulation. The mobile phase ultimately selected consisted of ultrapure water and acetonitrile (Table 1), both filtered through a 0.22 μm cellulose membrane and ultrasonically degassed. Chromatographic analyses were performed on a Phenomenex Kinetex® C18 column (250 × 4.6 mm i.d., 5 μm particle size, 100 Å), maintained at 35 °C, with the initial sample temperature set to 20 °C. Detection at 210 nm using a diode array detector (DAD) was chosen after evaluating the UV absorption profile of PZQ and its degradation products, as this wavelength provided the best compromise between sensitivity and stability of the baseline. The injection volume was 20 μL, and the flow rate was set to 1.0 mL/min.
Table 1.
Gradient Elution Procedure.
2.4. Sample Preparation
To ensure accurate quantification of praziquantel (PZQ) and its related substances (RS) in PMMA-co-DEAEMA PZQ-loaded microparticles (Enhanced PZQ), different sample preparations were employed for content determination and RS evaluation, reflecting the distinct analytical requirements of each assay. For content evaluation, standard PZQ, API, and enhanced PZQ solutions were diluted to obtain working concentrations around 20 µg/mL of PZQ, which provided optimal detector response for accurate quantification. In the case of Enhanced PZQ, the weighed mass was corrected for the actual drug load ~24% (w/w). Consequently, larger masses of microparticles were required to reach the same effective PZQ concentration as in the standard solutions. For related substances, higher concentrations were required because degradation products occur at much lower levels relative to PZQ and typically exhibit weaker UV absorbance. Therefore, RS assays employed concentrated solutions (from 0.5 µg/mL to 500 µg/mL, depending on the analyte) to ensure adequate sensitivity, linearity, and specificity for both PZQ degradation products and the polymeric matrix. The praziquantel molecule and its known impurities, compounds A, B, and C, can be observed in the Supplementary Material Figure S1. Placebo solutions (microparticles without PZQ) were prepared for both assays to evaluate specificity and to identify potential chromatographic contributions from the material. All solutions were prepared using the designated diluent (0.5% formic acid in water/ethanol, 45:55 v/v), with ultrasonic assistance, followed by filtration through 0.45 µm PVDF membranes. Detailed preparation procedures and theoretical concentration calculations are provided in the Supplementary Material.
2.4.1. Percentage of Impurity in the Sample
The percentage of each impurity present in the sample was calculated based on Equation (1):
where Cp is the concentration of the active ingredient in the standard solution for related substances (μg/mL); Cam is the theoretical concentration of the active ingredient in the sample solution for related substances (μg/mL); Ai is the peak area of the related substance, unknown impurity or degradation product found in the sample solution for related substances; Ap is the area of the active peak in the standard solution for related substances; and F is the response factor of each related substance, unknown impurity or degradation product (equal to 1.0 for unknown impurities or degradation products).
2.4.2. Content Calculation
The calculation of the active ingredient contents in the samples was based on Equations (2) and (3):
where Cam is the concentration of the active ingredient found in the sample solution (mg/mL), and Cd is the declared concentration of the active ingredient in the sample.
where Mpd is the mass of the solution standard used for content evaluation (mg); Fdp is the dilution factor of the standard solution; Pot is the power of the standard in decimal (as provided by the respective certificates of analysis of the standards); Aam is the sample area of the test solution used for content evaluation; Apd is the average area of the respective standard solution; Fda is the dilution factor of the sample solution used for content evaluation; and Mam is the mass of the sample used for content evaluation (g).
2.5. System Suitability Test (SST)
The acceptance criteria adopted in the present study to characterize the system suitability encompass various parameters [27]. For content analysis, these criteria included: (i) ensuring a relative standard deviation smaller than 2.0% of the average for six injections of the calibration standard, (ii) achieving a minimum number of 2000 theoretical plates for column efficiency, (iii) maintaining a tail factor smaller than 2.0, and (iv) ensuring a total recovery of 98 to 102% of the obtained concentration, when compared to the theoretical concentration of the verification standard. Regarding related substances, the criteria included: (i) ensuring a relative standard deviation smaller than 6.9% which were derived according to the statistical approach recommended in the relevant USP chapters for impurity analysis, based on the investigated concentration levels and number of replicates, (ii) achieving a minimum number of 2000 theoretical plates for column efficiency, (iii) maintaining a tail factor smaller than 2.0, (iv) ensuring a resolution higher than 2.0 between specific peaks, and (v) ensuring a recovery of 95 to 105% of the obtained concentration, when compared to the theoretical concentration of the standard verification. It is important to note that the angular, linear, and correlation coefficients, as well as the number of theoretical plates (N) and the tailing factors, were determined using the equipment software employed for the analysis (as described previously) and that all acceptance limits were established following USP guidance and standard validation practices, rather than as fixed numerical values.
2.6. Validation of the Proposed Method
Key considerations such as limit of quantification, precision, selectivity, accuracy, linearity, and robustness underscore the significance of validating an analytical method. Validation limits and criteria described below were defined in accordance with the USP, unless explicitly described otherwise.
2.6.1. Limit of Quantification (LOQ)
To establish the LOQ, three key criteria were employed [27]. Firstly, the relative standard deviation (RSD) of six injections should not exceed 8.0% of the respective average. This criterion ensures consistency and precision of the analytical measurements. Secondly, the recovery of the concentration obtained from the analysis should fall within the range of 90% to 107% relative to the prepared theoretical concentration. This criterion evaluates the accuracy of the analytical method by comparing the measured concentration with the expected value. Lastly, a minimum signal-to-noise ratio of 10 is required. This ensures that the signal produced by the analyte is sufficiently distinguishable from background noise, guaranteeing reliable quantification.
2.6.2. Precision
For content, the acceptance criteria required the relative standard deviation (RSD) of six preparations to be smaller than certain specified values, as described before. For both repeatability and intermediate precision, the RSD of twelve preparations should not exceed 2.0% of the respective averages. Regarding the unknown impurities, the RSD of six preparations was required to be smaller than 6.9%. Moreover, the recovery of the obtained concentration of the prepared standards should fall within the range between 95% and 105%. Similarly, for repeatability and intermediate precision, the RSD of twelve preparations should not exceed 6.9% of the respective average. For known impurities, the RSD of six preparations should be smaller than 6.3% of the respective average. Additionally, the recovery of the obtained concentration of the prepared standards should also fall within the range of 95% to 105%. Furthermore, for repeatability and intermediate precision, the RSD of twelve preparations should not exceed 6.3% of the respective averages.
2.6.3. Specificity
To assess the specificity of the method, chromatographic runs were performed using praziquantel (PZQ) and placebo standard solutions. The potential interference from the analytical matrix was evaluated by examining the retention region of the PZQ peak in the presence of the placebo using a UV detector. The PZQ peak region was required to remain free from interference originating from the mobile phase, diluent, placebo, and any potential degradation products. Additionally, unknown impurities and peaks arising from the mobile phase, diluent, placebo, or potential degradation products should exhibit a minimum resolution of 1.5 relative to the PZQ peak [27]. This evaluation ensures that the method can reliably distinguish the analyte from excipients and impurities, including those that may arise under stress or degradation conditions, without specifying the exact degrading solutions at this stage.
2.6.4. Accuracy
For contents, the RSD of three preparations at low, medium, and high concentration levels should be kept below 2.0% of the respective averages. Additionally, the recovery of the obtained concentrations of the prepared standards should fall within the range of 98% to 102%. Regarding unknown impurities, the RSD of three preparations should be smaller than 8.0% of the respective average at the 0.04% level; smaller than 6.9% of the respective average at the 0.10% level; and smaller than 6.8% of the respective average at the 0.12% level. Furthermore, the recoveries of the concentrations obtained for standards prepared at the 0.04%, 0.10%, and 0.12% levels should fall within the ranges of 90–107%, 95–105%, and 95–105%, respectively, considering the increased variability expected at low impurity levels, in accordance with ICH Q2(R1)/(R2) recommendations. For known impurities, the RSD of three preparations should be smaller than 8.0% of the respective average at the 0.02% level, smaller than 6.3% of the respective average at the 0.10% level, and smaller than 6.1% of the respective average at the 0.12% level. Similarly, the recoveries of the concentrations obtained for standards prepared at the 0.02%, 0.10%, and 0.12% levels should fall within the ranges of 90–107%, 95–105%, and 95–105%, respectively, which are commonly accepted for impurity quantification near the LOQ and were selected based on the purpose of the method.
2.6.5. Robustness
For contents, the RSDs of three injections of the calibration standards should be kept below 2.0% of the respective averages. Additionally, the column efficiency should provide a minimum of 2000 theoretical plates, while the tail factor should not exceed 2.0. Moreover, the recovery of concentrations obtained from prepared standard solutions under changed conditions (as described below) should fall within the range of 98 to 102% when compared to the nominal condition. Regarding unknown impurities, the RSD of three injections of the calibration standard should be smaller than 6.9% of the respective average.
The robustness of the method was evaluated by introducing small, deliberate perturbations to the analytical conditions, assessing the method’s reliability under various scenarios. For content determination, the relative standard deviations (RSDs) of three injections of the calibration standards were required to remain below 2.0% of the respective averages. Column efficiency was maintained at a minimum of 2000 theoretical plates, and the tail factor was required not to exceed 2.0. Recovery of concentrations obtained from prepared standard solutions under changed conditions—specifically, variations in flow rate (0.9–1.1 mL/min), column temperature (33–37 °C), mobile phase composition, and column selection—was expected to fall within the range of 98–102% relative to the nominal condition. For unknown impurities, the RSD of three injections of the calibration standard should be smaller than 6.9% of the respective average, with column efficiency and tail factor meeting the same criteria as above. Additionally, the recovery of concentrations under perturbed conditions, the comparison between different filters (e.g., PVDF 0.45 μm versus other filters), and various extraction times were assessed, yielding acceptable recovery ranges of 95–105% with respect to the nominal condition. For known impurities, the RSD, column efficiency, tail factor, and recovery were evaluated similarly, with recovery also required to be within 95–105% of the nominal concentration.
2.6.6. Linearity
The acceptance criteria required correlation coefficients above 0.990 between the calculated areas and the standard concentrations, with angular coefficients significantly different from zero, as characterized by the standard minimum squares procedure [27]. Additionally, as previously described, for calibration standards, the column efficiency should not fall below a minimum of 2000 theoretical plates, with a tail factor of less than 2.0. Furthermore, the recovery of the obtained concentrations of calibration standards should fall in the range between 95 to 105%.
3. Results and Discussion
3.1. Chromatographic Behavior Under Isocratic Conditions and Justification for Gradient Method Development
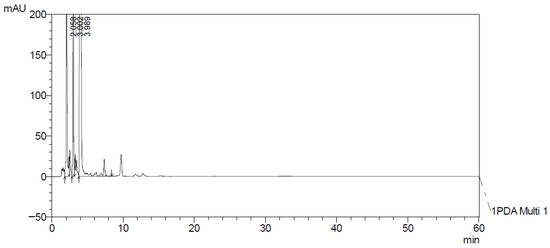
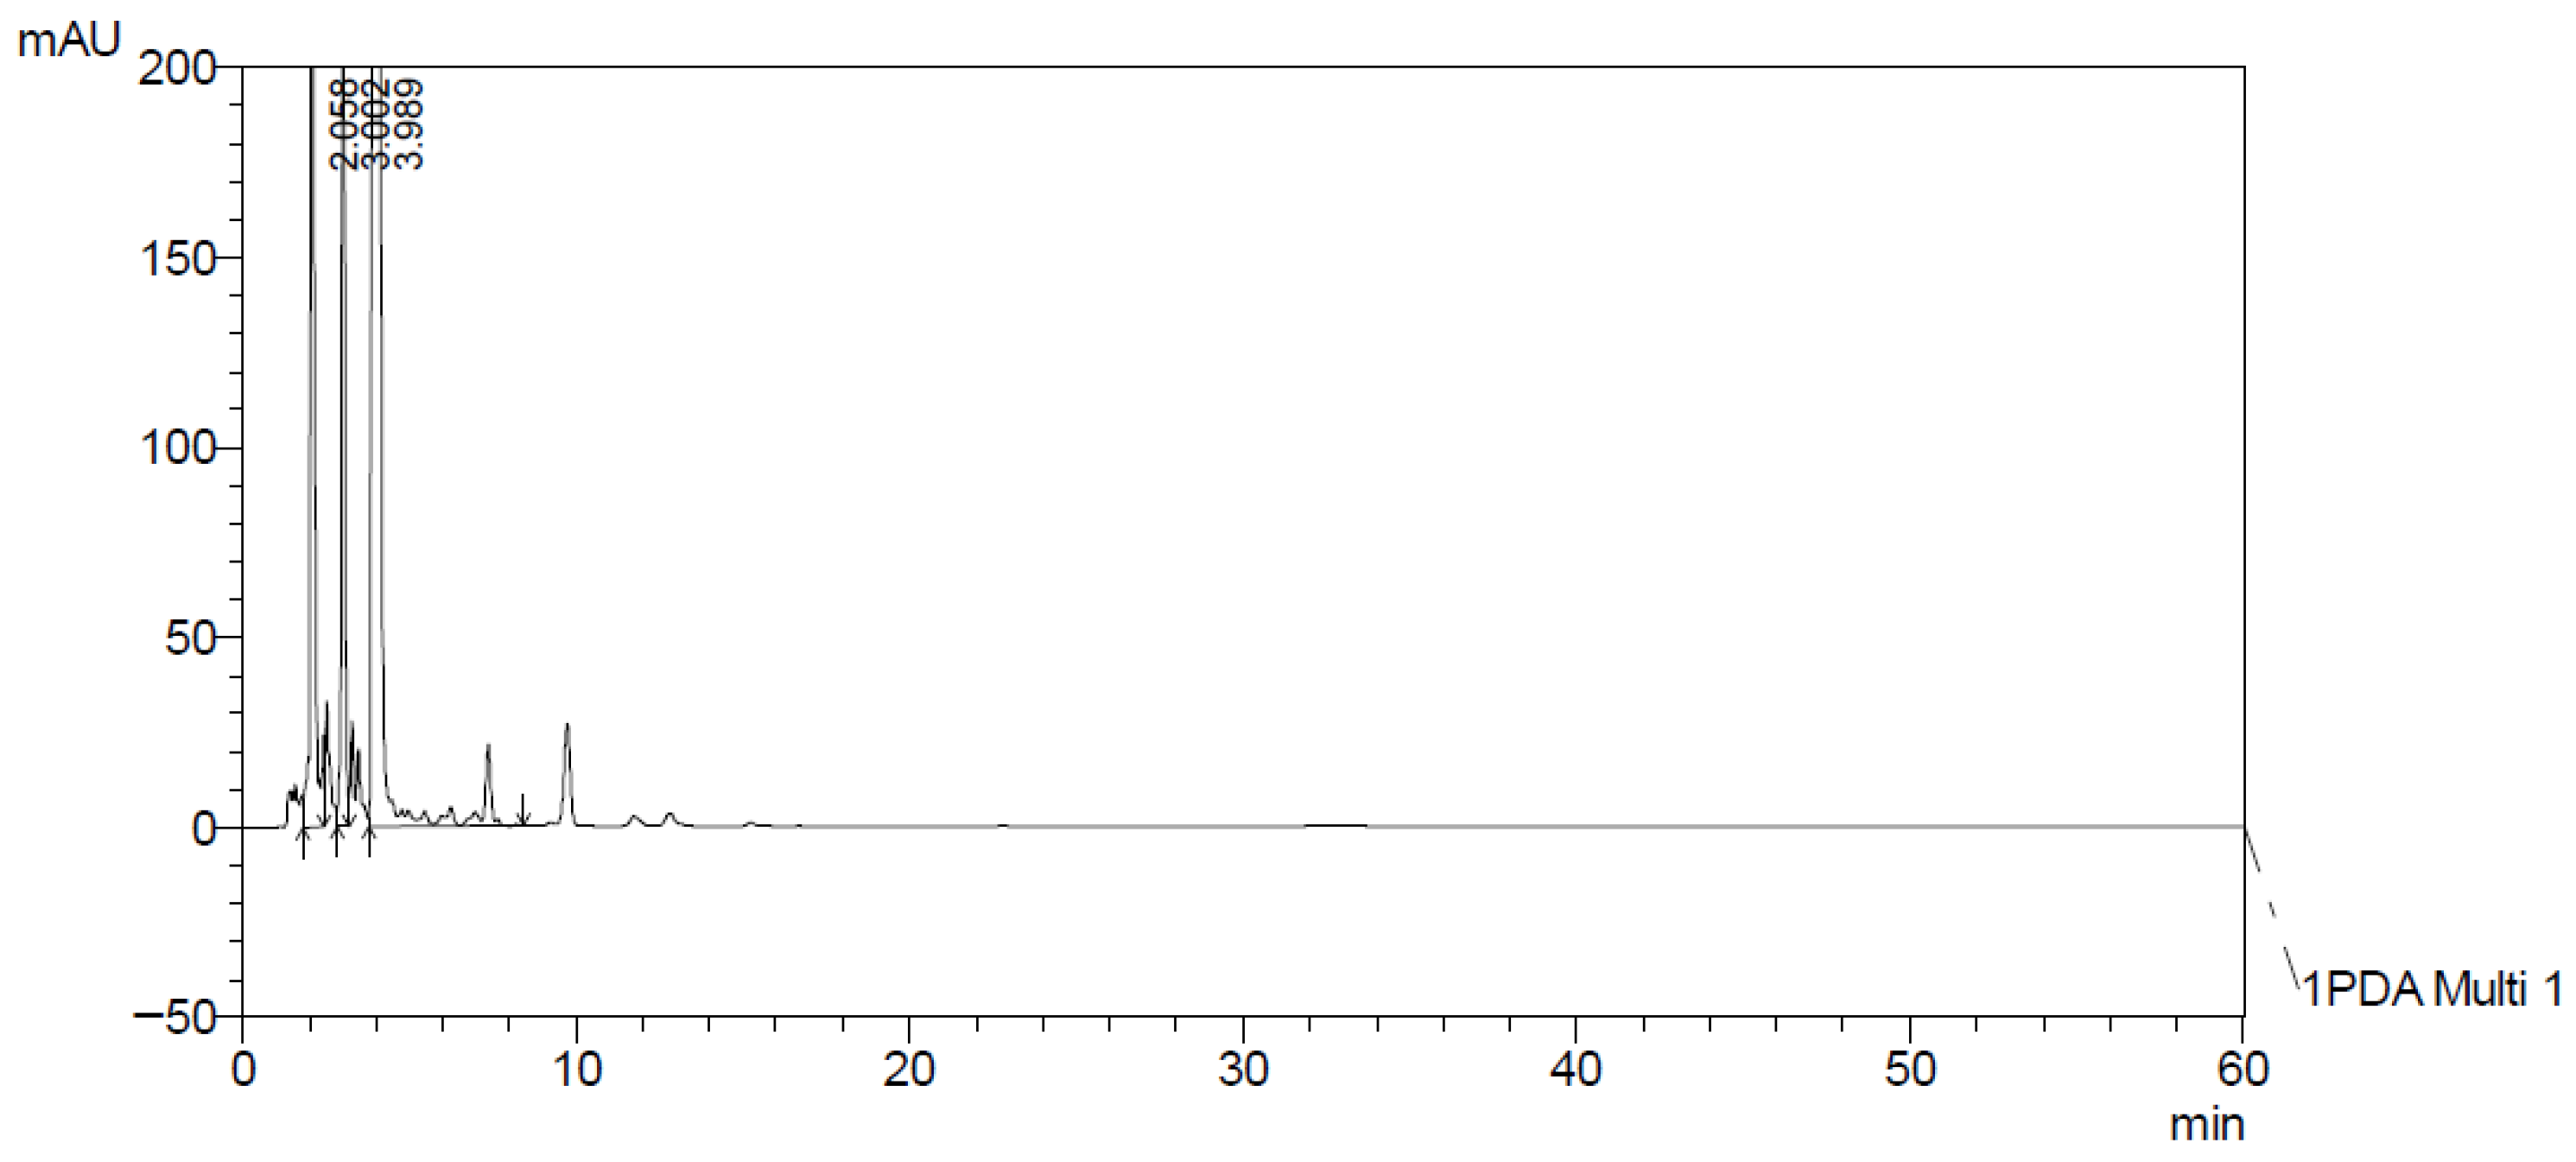
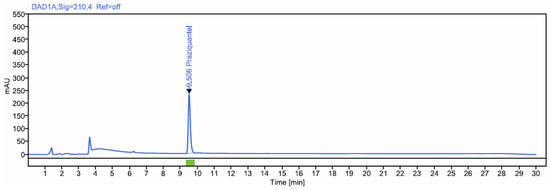
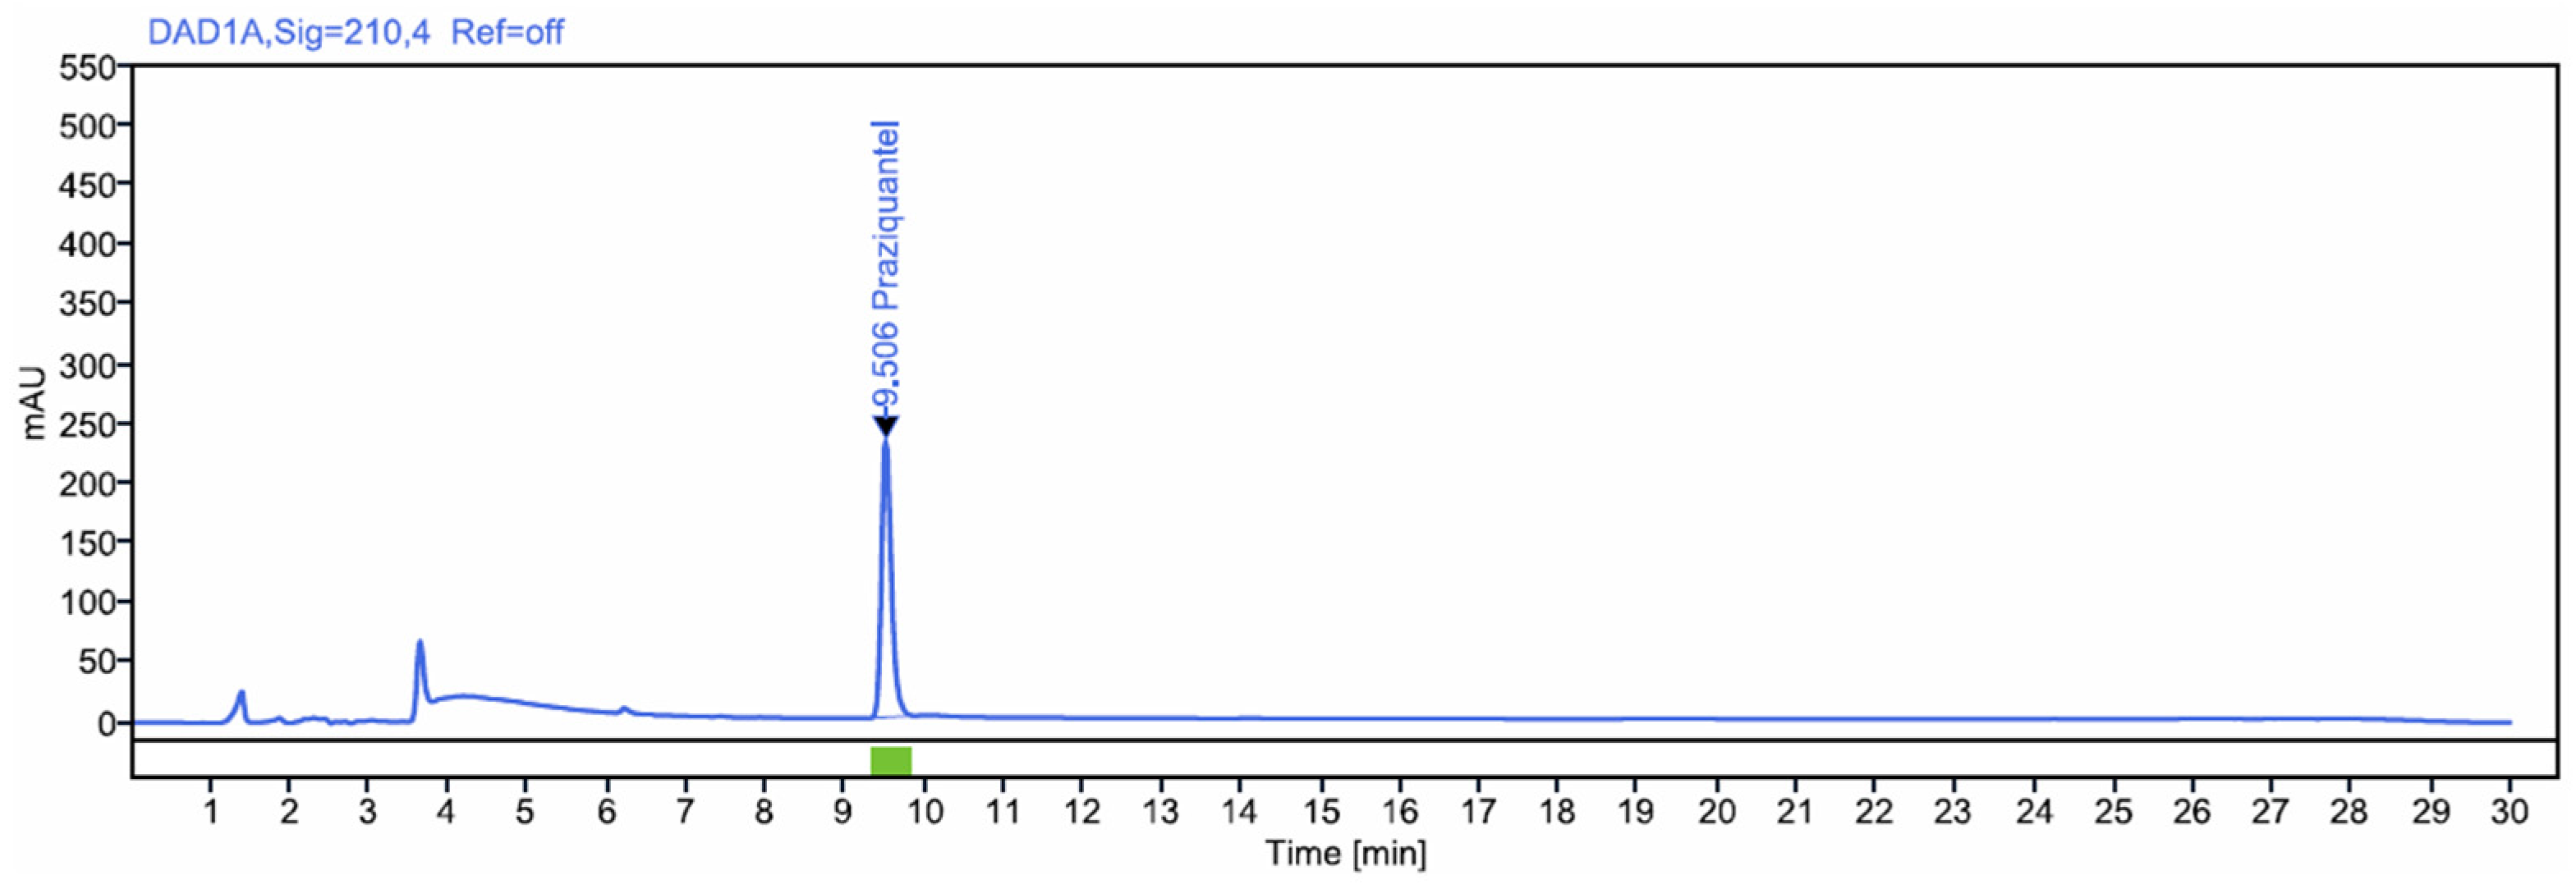
The PMMA-co-DEAEMA microparticle matrix introduces an additional chromatographic peak that is not observed in conventional tablet formulations. As shown in Figure 1, when the official USP isocratic method was applied to the PMMA-co-DEAEMA formulation containing PZQ, the copolymer (placebo) generated a peak eluting in the same chromatographic region as the known degradation product, Compound A, whose chromatogram under USP conditions is shown in Figure 2. This co-elution compromises the specificity and accurate quantification of the impurity. This limitation is not related to PZQ itself, but rather to the interaction between the chromatographic conditions and the polymeric excipient. Therefore, the distinct chromatographic behavior of PMMA-co-DEAEMA requires a separation method capable of resolving Compound A from the polymer contribution. Although the proposed gradient method is inherently more complex than the official isocratic approach and may involve a modest increase in analysis time and solvent consumption, it provides substantially improved selectivity and reliable separation. Consequently, the development of a new gradient method was necessary to ensure adequate analytical performance for this polymer-based formulation.
Figure 1.
Chromatogram of PMMA-co-DEAEMA containing PZQ following the USP method.
Figure 2.
Chromatogram Compound A following the USP method.
3.2. System Suitability
The system suitability parameters met all acceptance criteria established in the method validation protocol. For content analysis, the calibration standard exhibited an RSD of 0.64% (acceptance ≤ 2.86%), a column efficiency exceeding 145,684 theoretical plates (acceptance ≥ 2000), and a tailing factor of 1.15 (acceptance ≤ 2.0). The recovery of the verification standard was 101.48% (acceptance range: 95–105%). For related substances, the calibration standard presented an RSD of 0.75% (acceptance ≤ 2.86%), resolution between critical peaks of 1.5 (acceptance ≥ 1.5), and recovery of 101.26% (acceptance 95–105%). Detailed data for all replicate injections are presented in the Supplementary Material (Tables S1–S3).
3.3. Limit of Quantification (LOQ)
The LOQ was established by evaluating precision, accuracy, and sensitivity. Based on the experimental data, the LOQ of the method was set at 0.20 µg/mL for praziquantel (PZQ) as well as for related substances (Impurities A, B, and C). The RSD of six replicate injections at the LOQ concentration was 5.37%, complying with the acceptance criterion of ≤8.0%. Recovery was 98.4%, which is within the acceptance range of 90–107% relative to the theoretical concentration. Additionally, the signal-to-noise ratio ranged from 29.61 to 41.27, exceeding the minimum required value of 10. Therefore, the method demonstrated suitable precision, accuracy, and sensitivity at the LOQ level. Detailed data for all replicate injections for PZQ and impurities are presented in the Supplementary Material (Tables S4–S7).
3.4. Precision
The method’s precision was evaluated through repeatability and intermediate precision assays. For content analysis, the RSD of six independent preparations was 0.28%, meeting the acceptance criterion of ≤2.0. Regarding unknown impurities, the RSD of six preparations was 1.59% (acceptance ≤ 6.9%), and the recovery of the prepared standards ranged from 98.05% to 100.68%, within the acceptance range of 95–105%. For repeatability and intermediate precision of PZQ, the RSD was 0.75%, complying with the ≤6.9% criterion. For known impurities, the RSD of six preparations was around 2.54–2.73 (acceptance ≤ 6.3%), and the recovery of prepared standards was approximately 99.33–99.66%, within the 95–105% range. In addition, the resolution criterion (Rs ≥ 1.5) was specifically evaluated for the critical peak pair corresponding to the polymer (placebo) peak and Compound A, which represents the most challenging separation in the method. All other known and unknown impurities exhibited resolution values higher than 1.5 under the final chromatographic conditions. These results confirm that the method demonstrated adequate precision for both content determination and quantification of PZQ impurities. Detailed data for all replicate injections are presented in the Supplementary Material (Tables S8–S22).
3.5. Specificity
The specificity of the method was confirmed by comparing chromatographic runs of praziquantel (PZQ) with placebo and blank solutions. In all cases, the retention region corresponding to the PZQ peak remained free from interference by the mobile phase, diluent, placebo, or potential degradation products. For impurity assessment, unknown peaks originating from the analytical matrix presented a resolution of 1.5 relative to the PZQ peak, complying with the acceptance criterion of ≥1.5. Similarly, known impurities exhibited a resolution of 1.7, also meeting this requirement. These results demonstrate that the method can reliably distinguish the analyte from excipients and impurities, including potential degradation products, thereby confirming its specificity.
3.6. Accuracy
The accuracy of the method was evaluated at three concentration levels (low, medium, and high) for PZQ content and at three concentration levels for both known and unknown impurities. For content analysis, the recoveries at the three levels ranged from 98.61% to 98.71%, complying with the acceptance range of 98–102%, which reflects the stricter accuracy requirements for quantitative assay of the drug substance. The relative standard deviation (RSD) of three replicate preparations at each level was 0.11%, below the acceptance limit of 2.0%. For known impurities, the recoveries ranged from 97.93% to 100.88%, meeting the acceptance range of 90–107%, which was considered appropriate for impurity quantification, particularly at low concentration levels where higher variability is expected. The RSD values obtained were within the respective acceptance limits. Altogether, these results demonstrate that the method meets the established criteria for accuracy, ensuring reliable quantification of PZQ and its impurities across the tested concentration ranges, in accordance with the method purpose and ICH Q2(R1)/(R2) principles. Detailed data for all replicate injections are presented in the Supplementary Material (Tables S23–S27).
3.7. Robustness
The robustness of the method was evaluated by introducing small, deliberate variations in analytical conditions, including flow rate (0.9–1.1 mL/min), column temperature (33–37 °C), mobile phase composition, column selection, filter type (e.g., PVDF 0.45 µm versus alternative filters), and extraction time. For content determination, the relative standard deviations (RSDs) of three injections of calibration standards remained below the acceptance limit of 2.0%. Column efficiency, theoretical plates, and the tail factor did not exceed the criteria. Recovery of concentrations under the altered conditions ranged within the acceptance criteria of 98–102%. Overall, the method demonstrated robustness under most tested conditions. However, deviations were observed for variations in the proportion of mobile phase component A (ultrapure water) evaluated for Compound A recovery and extraction time evaluated for Compound A, where recoveries fell outside the specified acceptance ranges. These findings suggest that the method remains robust overall but requires strict control of these specific parameters during routine application. Detailed data for all replicate injections are presented in the Supplementary Material (Tables S28–S46).
3.8. Linearity
The linearity of the method was evaluated by preparing calibration standards at different concentration levels for praziquantel (PZQ) and its related impurities A, B, and C. The acceptance criteria required correlation coefficients (r2) above 0.990 between the calculated peak areas and the standard concentrations, with angular coefficients significantly different from zero, as determined through the standard least squares procedure. Additionally, column efficiency should not fall below 2000 theoretical plates, the tailing factor should remain below 2.0, and recoveries of the obtained concentrations were expected to fall within 95–105% of the theoretical values. A summary of the linearity results, including calibration ranges and correlation coefficients for all analytes, is provided in Table 2.
Table 2.
Summary of linearity evaluation.
For PZQ, the calibration range was 16.0477–24.2630 µg/mL. The correlation coefficient was 0.999, and the angular coefficients were statistically significant, within the acceptance criteria. Statistical tests further confirmed robustness: normality (Anderson–Darling test, p = 0.548), homoscedasticity (Breusch–Pagan test [31], CCalculated = 0.287 < CCritical = 3.842), absence of outliers, and independence of residuals (Durbin–Watson test [32], value = 2.69). For Impurity A, the range was 0.1996–1.1865 µg/mL. Correlation coefficient was 0.9997, R2 = 0.9994; slope and intercept were statistically significant (p = 1.5678 × 10⁻²² and 0.000758, respectively); normality and homoscedasticity assumptions were met (Anderson–Darling [33] p = 0.791, Breusch–Pagan CCalculated = 0.249); residuals were independent (Durbin–Watson = 1.559) and no outliers were detected. For Impurity B, the range was 0.1964–1.1633 µg/mL. Correlation coefficient was 0.9987, R2 = 0.9975; slope and intercept were statistically significant (p = 2.8544 × 10⁻¹⁸ and 0.000758, respectively); Anderson–Darling p = 0.888, Breusch–Pagan CCalculated = 1.080; Durbin–Watson = 1.353; residuals showed no outliers. For Impurity C, the range was 0.1968–1.1750 µg/mL. Correlation coefficient was 0.9994, R2 = 0.9988; slope and intercept were statistically significant (p = 2.2258 × 10⁻²⁰ and 0.08499); Anderson–Darling p = 0.791, Breusch–Pagan CCalculated = 1.239, Durbin–Watson = 1.847; residuals were independent and no outliers were detected. Overall, these results confirm that the method exhibits excellent linearity across all analytes and concentration ranges tested. Both pharmacopeial acceptance criteria and detailed statistical validation were fulfilled, ensuring reliable quantification of PZQ and its impurities A, B, and C. Detailed data for all replicate injections are presented in the Supplementary Material (Tables S47–S53).
After verifying that the methodology fell within the analytical parameters, a solution of the praziquantel sample embedded in the microparticles was injected to confirm the method’s effectiveness. For the related substances, approximately 50 mg of the sample was accurately weighed into a 25 mL volumetric flask, to which 10 mL of diluent was added. The mixture was sonicated for 20 min in an ultrasonic bath, then the volume was made up with the diluent, homogenized, and filtered through a 0.45 μm PVDF membrane filter. Subsequently, 1 mL of this sample solution (containing related substances) was transferred to a 25 mL volumetric flask, diluted to volume with the same diluent, and homogenized for content determination.
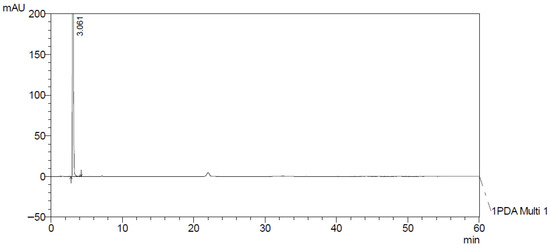
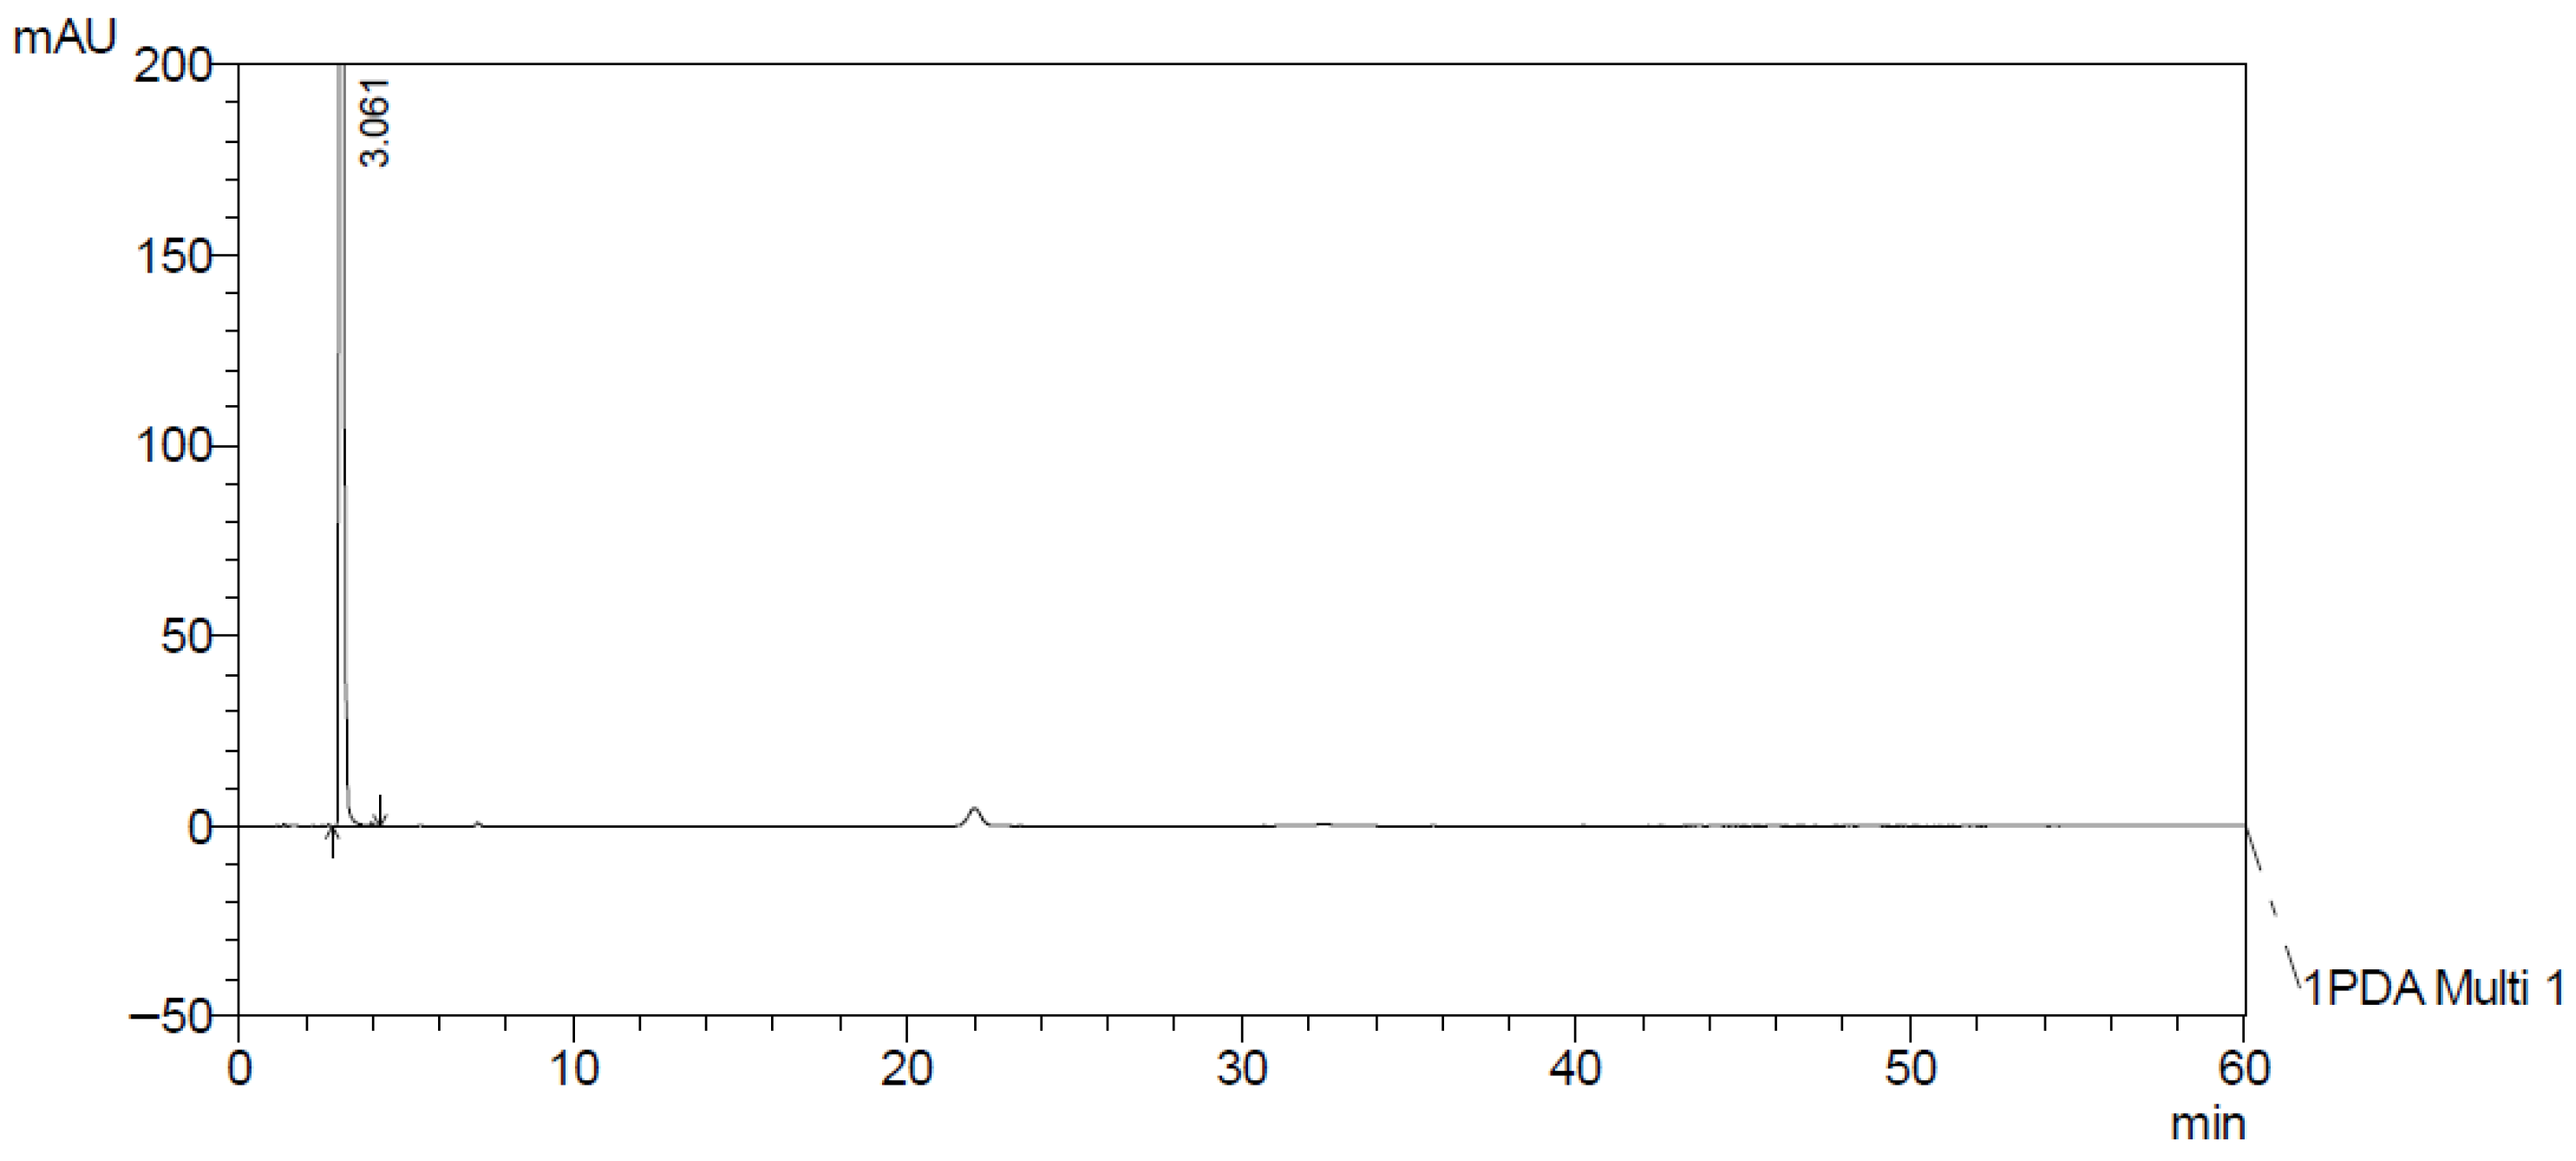
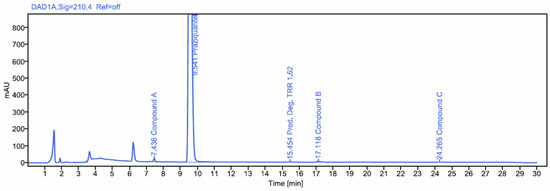
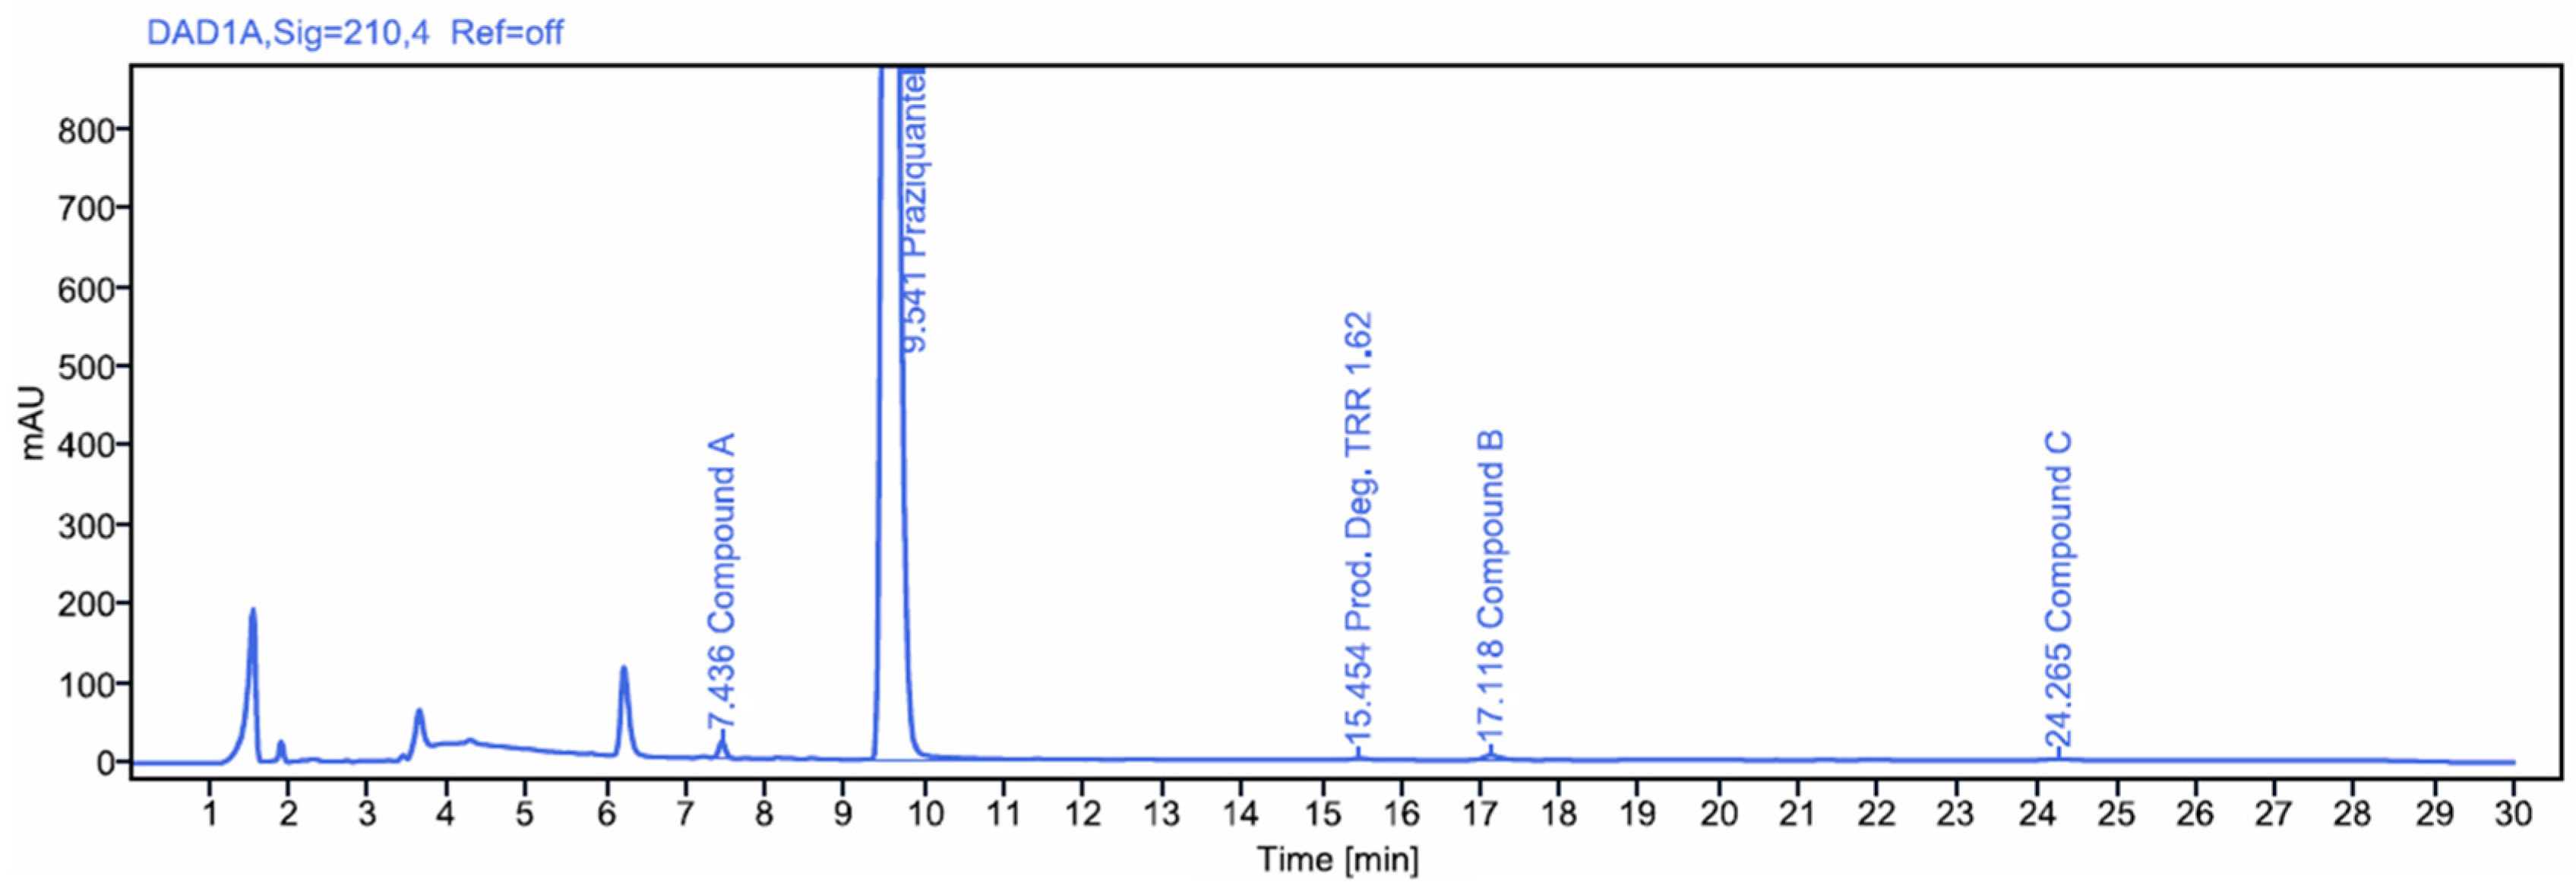
The chromatogram and the calculation of the praziquantel content and related substances are shown below in Figure 3 and Figure 4, respectively, and Table 3. Since the content and related substances in the sample can be accurately and quantitatively determined using the developed and validated method, it can be concluded that this method is applicable to the forced degradation study of microencapsulated praziquantel in PMMA-co-DEAEMA.
Figure 3.
Chromatogram of praziquantel microparticles—Content.
Figure 4.
Chromatogram of praziquantel microparticles—Related Substances.
Table 3.
Related Substances Content of Praziquantel Microparticles.
4. Conclusions
A high-performance liquid chromatography (HPLC) method was developed to quantify praziquantel (PZQ) and its main related substances encapsulated in P(MMA-co-DEAEMA) polymer microparticles. The method was specifically designed to overcome the limitations of compendial procedures, which were not suitable for ensuring complete extraction and accurate quantification of PZQ and its impurities from the polymer matrix. The method involves sample solubilization in 0.5% formic acid in water/ethanol (45:55, v/v), followed by chromatographic separation under a water–acetonitrile gradient. Based on the experimental data, it was demonstrated that: (i) the method is suitable for the intended purpose; (ii) the analytical response is linear across the tested concentration ranges, with correlation coefficients (r2) above 0.999; (iii) the method is selective, with all impurities exhibiting minimum resolution values ≥ 1.5 from praziquantel; (iv) the method meets the criteria for limit of quantification at the evaluated level, showing acceptable precision, accuracy, and signal-to-noise ratio; (v) the method presents high precision, with relative standard deviations of 0.28% for repeatability and 2.86% for intermediate precision; (vi) the method is accurate, with recoveries between 95% and 105% (mean ≈ 100%); (vii) the method is robust, remaining stable under small variations in flow rate (0.9–1.1 mL/min), column temperature (33–37 °C), and mobile-phase composition. Overall, the proposed method is valid and suitable for determining PZQ content and related substances in P(MMA-co-DEAEMA) microparticles, supporting the characterization and quality control of formulations based on these polymeric systems.
Supplementary Materials
The following supporting information can be downloaded at: https://www.mdpi.com/article/10.3390/analytica7010013/s1.
Author Contributions
Conceptualization, E.D., J.C.P., H.V.A.R. and L.D.P.; methodology, J.E.; validation, J.E.; formal analysis, J.E.; data curation, J.E.; writing—original draft preparation, E.D.; writing—review and editing, E.D., J.C.P., H.V.A.R. and L.D.P.; supervision, J.C.P.; project administration, J.C.P.; funding acquisition, J.C.P. All authors have read and agreed to the published version of the manuscript.
Funding
This research was funded by the Banco Nacional de Desenvolvimento Econômico e Social (BNDES, grant number PEQ-19391); the Fundação Carlos Chagas Filho de Amparo à Pesquisa do Estado do Rio de Janeiro (FAPERJ, grant number 26/211.404/2021); and the Financiadora de Estudos e Projetos (FINEP, project number 01.22.0514.00).
Data Availability Statement
Part of the data presented in this study is available in the Supplementary Materials. Additional data supporting the findings of this study are available from the corresponding author upon reasonable request.
Acknowledgments
The authors would like to express their sincere gratitude to CAPES (Coordenação de Aperfeiçoamento de Pessoal de Nível Superior), CNPq (Conselho Nacional de Desenvolvimento Científico e Tecnológico), FAPERJ (Fundação Carlos Chagas Filho de Amparo à Pesquisa do Estado do Rio de Janeiro), and BNDES (Banco Nacional de Desenvolvimento Econômico e Social) for the financial support and scholarships that made this research possible.
Conflicts of Interest
The authors declare that they have no conflicts of interest.
Abbreviations
The following abbreviations are used in this manuscript:
| HPLC | High-performance liquid chromatography |
| MMA | Methyl methacrylate |
| DEAEMA | 2-(diethylamino)ethyl methacrylate |
| P(MMA-co-DEAEMA) | Poly(methyl methacrylate–co-2-(diethylamino)ethyl methacrylate) |
| PZQ | Praziquantel |
| WHO | World Health Organization |
| USP | United States Pharmacopeia |
| DAD/UV | Diode Array Ultraviolet Detector |
| API | Active Pharmaceutical Ingredient |
| ODS | Octadecylsilane |
| RSD | Relative Standard Deviation |
| INCQS | Instituto Nacional de Controle de Qualidade em Saúde |
| ACN | Acetonitrile |
| PVDF | Poly(vinylidene fluoride) |
References
- Tabo, Z.; Wangalwa, R.; Rwibutso, M.; Breuer, L.; Albrecht, C. Future Climate and Demographic Changes Will Almost Double the Risk of Schistosomiasis Transmission in the Lake Victoria Basin. One Health 2025, 21, 101148. [Google Scholar] [CrossRef] [Scilit] [PubMed]
- Abebe, W.; Kassanew, B.; Misganaw, T.; Ashagre, A.; Kumie, G.; Nigatie, M.; Gashaw, Y.; Tamrat, E.; Woldesenbet, D.; Bazezew, A. Prevalence of Malaria and Schistosoma Mansoni Coinfection in Sub-Saharan Africa: A Systematic Review and Meta-Analysis. Parasite Epidemiol. Control 2025, 29, e00422. [Google Scholar] [CrossRef] [Scilit] [PubMed]
- Vere, M.; Ham-Baloyi, W.T.; Oyedele, O.; Mduluza, T.; Melariri, P.E. Urinary Biomarkers and Haematuria as Indicators of Urogenital Schistosomiasis: A Systematic Review and Meta-Analysis. Acta Trop. 2025, 269, 107716. [Google Scholar] [CrossRef] [Scilit] [PubMed]
- Li, Q.; Li, Y.-L.; Guo, S.-Y.; Li, S.-Z.; Wang, Q.; Lin, W.-N.; Zhang, L.-J.; Li, S.-Z.; Zhou, X.-N.; Xu, J. Global Trends of Schistosomiasis Burden from 1990 to 2021 across 204 Countries and Territories: Findings from GBD 2021 Study. Acta Trop. 2025, 261, 107504. [Google Scholar] [CrossRef] [Scilit]
- Kołodziej, P.; Szostakowska, B.; Lass, A.; Sulima, M.; Sikorska, K.; Kocki, J.; Krupski, W.; Starownik, D.; Bojar, P.; Szumiło, J.; et al. Chronic Intestinal Schistosomiasis Caused by Co-Infection with Schistosoma Intercalatum and Schistosoma Mansoni. Lancet Infect. Dis. 2024, 24, e196. [Google Scholar] [CrossRef] [Scilit]
- Oliosi, E.; Angoulvant, A.; Marteau, A.; Paris, L.; Bouchaud, O.; Guegan, H.; Choinier, P.; Tattevin, P.; Gangneux, J.-P.; Delobre, G.; et al. Chronic Schistosomiasis Imported in France: A Retrospective Multicentre Analysis of 532 Patients, Calling for International Recommendations. Travel Med. Infect. Dis. 2023, 56, 102644. [Google Scholar] [CrossRef] [Scilit]
- Knopp, S.; Person, B.; Ame, S.M.; Ali, S.M.; Hattendorf, J.; Juma, S.; Muhsin, J.; Khamis, I.S.; Mohammed, K.A.; Utzinger, J.; et al. Evaluation of Integrated Interventions Layered on Mass Drug Administration for Urogenital Schistosomiasis Elimination: A Cluster-Randomised Trial. Lancet Glob. Health 2019, 7, e1118. [Google Scholar] [CrossRef] [Scilit]
- Ladislas, N.; Aimable, M.; Alison, O.; Mbonigaba, J.B.; Ursin, B.; Johannes, W.; Karen, P.; Eugene, R. From Mapping to Elimination: A Comprehensive Overview of Rwanda’s Schistosomiasis Program. Elimin. Neglected Trop. Dis. 2025, 152, 107799. [Google Scholar] [CrossRef] [Scilit]
- Singer, B.J.; Gomes, M.; Coulibaly, J.T.; Daigavane, M.; Tan, S.T.; Bogoch, I.I.; Lo, N.C. Population-Level Impact of Mass Drug Administration against Schistosomiasis with Anthelmintic Drugs Targeting Juvenile Schistosomes: A Modelling Study. Lancet Microbe 2025, 6, 101065. [Google Scholar] [CrossRef] [Scilit]
- Bustinduy, A.L.; Edielu, A.; Ayebazibwe, G.K.; Nakyesige, R.; Anguajibi, V.; Mpooya, S.; Nassuna, J.; Adriko, M.; Elliott, A.; van Dam, G.; et al. Safety and Efficacy of Praziquantel 40 Mg/Kg versus 80 Mg/Kg in Preschool-Aged Children with Intestinal Schistosomiasis in Uganda: A 2 × 2 Factorial, Double-Blind, Placebo-Controlled, Phase 2 Randomised Trial. Lancet Glob. Health 2025, 13, e1091. [Google Scholar] [CrossRef] [Scilit]
- Nogueira, R.A.; Lira, M.G.S.; Licá, I.C.L.; Frazão, G.C.C.G.; dos Santos, V.A.F.; Filho, A.C.C.M.; Rodrigues, J.G.M.; Miranda, G.S.; Carvalho, R.C.; Nascimento, F.R.F. Praziquantel: An Update on the Mechanism of Its Action against Schistosomiasis and New Therapeutic Perspectives. Mol. Biochem. Parasitol. 2022, 252, 111531. [Google Scholar] [CrossRef] [Scilit] [PubMed]
- Lo, N.C.; Bezerra, F.S.M.; Colley, D.G.; Fleming, F.M.; Homeida, M.; Kabatereine, N.; Kabole, F.M.; King, C.H.; Mafe, M.A.; Midzi, N.; et al. Review of 2022 WHO Guidelines on the Control and Elimination of Schistosomiasis. Lancet Infect. Dis. 2022, 22, e327. [Google Scholar] [CrossRef] [Scilit] [PubMed]
- Doenhoff, M.J.; Cioli, D.; Utzinger, J. Praziquantel: Mechanisms of Action, Resistance and New Derivatives for Schistosomiasis. Curr. Opin. Infect. Dis. 2008, 21, 659. [Google Scholar] [CrossRef] [Scilit] [PubMed]
- Bustinduy, A.L.; Friedman, J.F.; Kjetland, E.F.; Ezeamama, A.E.; Kabatereine, N.B.; Stothard, J.R.; King, C.H. Expanding Praziquantel (PZQ) Access beyond Mass Drug Administration Programs: Paving a Way Forward for a Pediatric PZQ Formulation for Schistosomiasis. PLoS Negl. Trop. Dis. 2016, 10, e0004946. [Google Scholar] [CrossRef] [Scilit]
- Reinhard-Rupp, J.; Klohe, K. Developing a Comprehensive Response for Treatment of Children under 6 Years of Age with Schistosomiasis: Research and Development of a Pediatric Formulation of Praziquantel. Infect. Dis. Poverty 2017, 06, 1. [Google Scholar] [CrossRef] [Scilit]
- Trastullo, R.; Dolci, L.S.; Passerini, N.; Albertini, B. Development of Flexible and Dispersible Oral Formulations Containing Praziquantel for Potential Schistosomiasis Treatment of Pre-School Age Children. Int. J. Pharm. 2015, 495, 536. [Google Scholar] [CrossRef] [Scilit]
- Pereira, E.D.; da Silva Dutra, L.; Paiva, T.F.; de Almeida Carvalho, L.L.; Rocha, H.V.; Pinto, J.C. In Vitro Release and In Vivo Pharmacokinetics of Praziquantel Loaded in Different Polymer Particles. Materials 2023, 16, 3382. [Google Scholar] [CrossRef] [Scilit]
- Alves, J.B.; Franckini Paiva, T.; Salim, V.M.; Conceição Ferraz, H.; Pinto, J.C. In Situ Encapsulation of Praziquantel through Methyl Methacrylate/Diethylaminoethyl Methacrylate and MMA/DMAEMA Miniemulsion Copolymerizations in Presence of Distinct Ionic Surfactants. SPE Polym. 2021, 2, 110. [Google Scholar] [CrossRef] [Scilit]
- Paiva, T.F.; Alves, J.B.; Melo, P.A.; Pinto, J.C. Macromol. React. Eng. 6/2019. Macromol. React. Eng. 2019, 13, 1970011. [Google Scholar] [CrossRef] [Scilit]
- Chew, Y.-L.; Khor, M.-A.; Lim, Y.-Y. Choices of Chromatographic Methods as Stability Indicating Assays for Pharmaceutical Products: A Review. Heliyon 2021, 7, e06553. [Google Scholar] [CrossRef] [Scilit]
- Sharma, S.; Goyal, S.; Chauhan, K. A Review on Analytical Method Development and Validation. Int. J. Appl. Pharm. 2018, 10, 8. [Google Scholar] [CrossRef] [Scilit]
- Maggio, R.M.; Vignaduzzo, S.E.; Kaufman, T.S. Practical and Regulatory Considerations for Stability-Indicating Methods for the Assay of Bulk Drugs and Drug Formulations. TrAC Trends Anal. Chem. 2013, 49, 57. [Google Scholar] [CrossRef] [Scilit]
- Bakshi, M.; Singh, S. Development of Validated Stability-Indicating Assay Methods—Critical Review. J. Pharm. Biomed. Anal. 2002, 28, 1011. [Google Scholar] [CrossRef] [Scilit] [PubMed]
- Sengupta, P.; Chatterjee, B.; Tekade, R.K. Current Regulatory Requirements and Practical Approaches for Stability Analysis of Pharmaceutical Products: A Comprehensive Review. Int. J. Pharm. 2018, 543, 328. [Google Scholar] [CrossRef] [Scilit] [PubMed]
- Wu, Y. The Use of Liquid Chromatography–Mass Spectrometry for the Identification of Drug Degradation Products in Pharmaceutical Formulations. Biomed. Chromatogr. 2000, 14, 384. [Google Scholar] [CrossRef]
- Singh, S.; Junwal, M.; Modhe, G.; Tiwari, H.; Kurmi, M.; Parashar, N.; Sidduri, P. Forced Degradation Studies to Assess the Stability of Drugs and Products. TrAC Trends Anal. Chem. 2013, 49, 71–88. [Google Scholar] [CrossRef] [Scilit]
- United States Pharmacopeial Convention. United States Pharmacopeia and National Formulary (USP–NF), 43rd ed.; United States Pharmacopeial Convention: Rockville, MD, USA, 2020. [Google Scholar]
- Council of Europe. European Pharmacopeia, 12th ed.; Council of Europe: Strasbourg, France, 2025. [Google Scholar]
- Agência Nacional de Vigilância Sanitária. Farmacopeia Brasileira, 7th ed.; Agência Nacional de Vigilância Sanitária (ANVISA): Brasília, Brazil, 2024. [Google Scholar]
- Hashem, H.; Ibrahim, A.E.; Elhenawee, M. A Rapid Stability Indicating LC-Method for Determination of Praziquantel in Presence of Its Pharmacopoeial Impurities. Arab. J. Chem. 2017, 10, S35. [Google Scholar] [CrossRef] [Scilit]
- Breusch, T.S.; Pagan, A.R. A Simple Test for Heteroscedasticity and Random Coefficient Variation. Econometrica 1979, 47, 1287. [Google Scholar] [CrossRef] [Scilit]
- Durbin, J.; Watson, G.S. Testing for Serial Correlation in Least Squares Regression: I. Biometrika 1950, 37, 409–428. [Google Scholar] [CrossRef] [Scilit]
- Anderson, T.W.; Darling, D.A. A Test of Goodness of Fit. J. Am. Stat. Assoc. 1954, 49, 765. [Google Scholar] [CrossRef]

Disclaimer/Publisher’s Note: The statements, opinions and data contained in all publications are solely those of the individual author(s) and contributor(s) and not of MDPI and/or the editor(s). MDPI and/or the editor(s) disclaim responsibility for any injury to people or property resulting from any ideas, methods, instructions or products referred to in the content. |
© 2026 by the authors. Licensee MDPI, Basel, Switzerland. This article is an open access article distributed under the terms and conditions of the Creative Commons Attribution (CC BY) license.