


Abstract
Background: The dietary index for gut microbiota (DI-GM) holds promise for improving metabolic status, yet its mechanistic insight into metabolic syndrome (MetS) is unclear. Methods: In this cross-sectional study, we analyzed data from 20,800 participants in the NHANES (2005–2018). The DI-GM was developed based on dietary patterns, and MetS was defined according to the NCEP-ATP III criteria. Global DI-GM scores came from the Global Dietary Database (164 nations), with MetS burden estimation employing Global Burden of Disease data. We explored mediation by phenotypic age, insulin resistance (HOMA-IR), and inflammation. Secondary analyses involved subgroup stratification, restricted cubic splines (RCS), sensitivity testing, propensity score matching, and multiple imputations. Results: Globally, higher national DI-GM correlated inversely with metabolic risk factor frequency and major MetS sequelae. NHANES analysis found each one-unit DI-GM rise was associated with an 11% lower MetS likelihood (adjusted OR = 0.89, 95%CI: 0.87–0.91). RCS indicated a non-linear exposure–response curve, with prevalence reduction stabilizing above DI-GM = 4.972. Stratification showed significant effect modification by race/ethnicity, education, and income (p-interaction < 0.05). Mediation analysis identified significant roles for phenotypic aging (24.77%) and HOMA-IR (47.98%), but not inflammation (0.54%). Conclusions: A DI-GM-aligned diet correlated with lower MetS prevalence, with insulin sensitivity and phenotypic aging accounting for part of this association. Microbiota-targeted nutrition guidelines for MetS should prioritize metabolic health over anti-inflammation.
1. Introduction
Metabolic syndrome (MetS) is characterized by central obesity, hypertension, dyslipidemia, and impaired glucose metabolism driven by insulin resistance [1,2]. Affecting 20–25% of adults globally [3], MetS increases the risks of type 2 diabetes and cardiovascular disease by 3- to 5-fold, while doubling all-cause mortality [4]. The rising prevalence in developing nations underscores its status as a critical global health priority, highlighting the urgent need to identify novel intervention targets [5].
Dietary intervention has emerged as a frontline microbiota-shaping therapeutic strategy for managing MetS—primarily by ecologically remodeling the gut microbiota—orchestrating energy harvesting, short-chain fatty acid (SCFA) production, and immunometabolic pathways to profoundly influence metabolic homeostasis [6,7,8,9,10]. Evidence confirms that high-fat diets deplete beneficial taxa such as Bifidobacteriumand exacerbate metabolic phenotypes [11], whereas fiber- and polyphenol-enriched diets reinforce glucose homeostasis via SCFA-mediated mechanisms [12]. However, although established patterns like the Mediterranean and DASH diets confer metabolic benefits [13,14], their design lacks systematic consideration of the microbiota’s key role. Consequently, this mechanistic gap hinders the translation of dietary strategies into personalized microbiota-targeted therapies.
A novel gut microbiota-targeted dietary index (DI-GM) has recently been proposed [15]. This index incorporates 14 dietary components stratified by microbial impact: 10 components (e.g., avocado, broccoli, chickpeas, coffee) are positively associated with microbial diversity and SCFA production, whereas four components (red/processed meats, refined grains, high-fat diets) are negatively correlated with microbial homeostasis [16,17,18,19]. Epidemiological investigations have established inverse associations between elevated DI-GM scores and disease risk, particularly for metabolic dysregulation, neuropsychiatric disorders, and accelerated aging phenotypes [17,18,20,21]. Nevertheless, a critical translational gap persists: despite these ecological associations, the specific biological pathways through which DI-GM exerts its metabolic benefits remain mechanistically undefined. Furthermore, current evidence is largely derived from single-population cohort, lacking the multi-population generalizability required for clinical implementation. Specifically, the complex interplay among key risk factors—especially insulin resistance, phenotypic age acceleration, and systemic inflammation—within DI-GM profiles has not been systematically explored. This absence of mechanistic granularity impedes the optimization of microbiota-informed dietary prescriptions for MetS management.
To bridge this gap, this study investigates the mechanisms linking DI-GM to MetS using individual-level data from NHANES and population-level data from the Global Burden of Disease (GBD) and Global Dietary Database (GDD). Furthermore, we explore potential mediators, specifically examining the roles of insulin resistance, phenotypic age acceleration, and inflammation. By delineating the mechanisms by which diet–microbiota interactions govern metabolic homeostasis, this study offers actionable insights to update clinical practice guidelines for MetS, paving the way for microbiota-informed precision nutrition.
2. Materials and Methods
2.1. Data Source
This cross-sectional study leveraged data from seven consecutive NHANES cycles (2005–2018), utilizing publicly accessible datasets to evaluate metabolic health outcomes. The NHANES database, approved by the Institutional Review Board of the National Center for Health Statistics, Centers for Disease Control and Prevention, serves as a national surveillance program. The survey employs a complex, multistage probability-sampling design to generate population-representative estimates of non-institutionalized U.S. civilians. It comprises three core components: (1) structured household interviews that provide data on demographics, dietary habits, and socioeconomic conditions; (2) standardized physical examinations that assess cardiovascular health and body measurements; and (3) advanced laboratory tests that analyze biochemical markers and environmental exposures. This comprehensive approach facilitates an understanding of the relationship between nutritional status, health promotion, and population health trends in the U.S. Written informed consent was obtained from all participants before their inclusion in the study. As this research involved secondary analysis of de-identified public data, additional Institutional Review Board (IRB) clearance was not necessary.
2.2. Study Design and Population
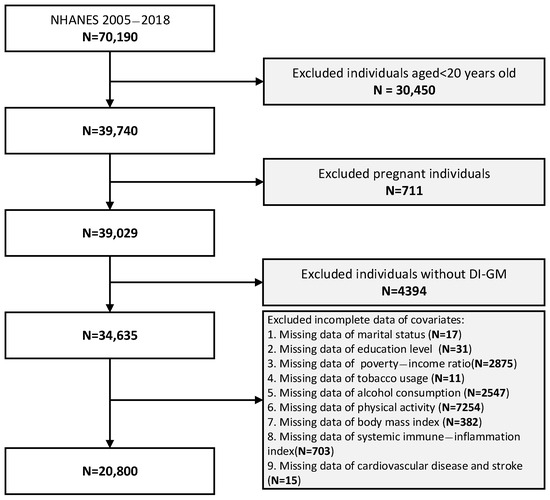
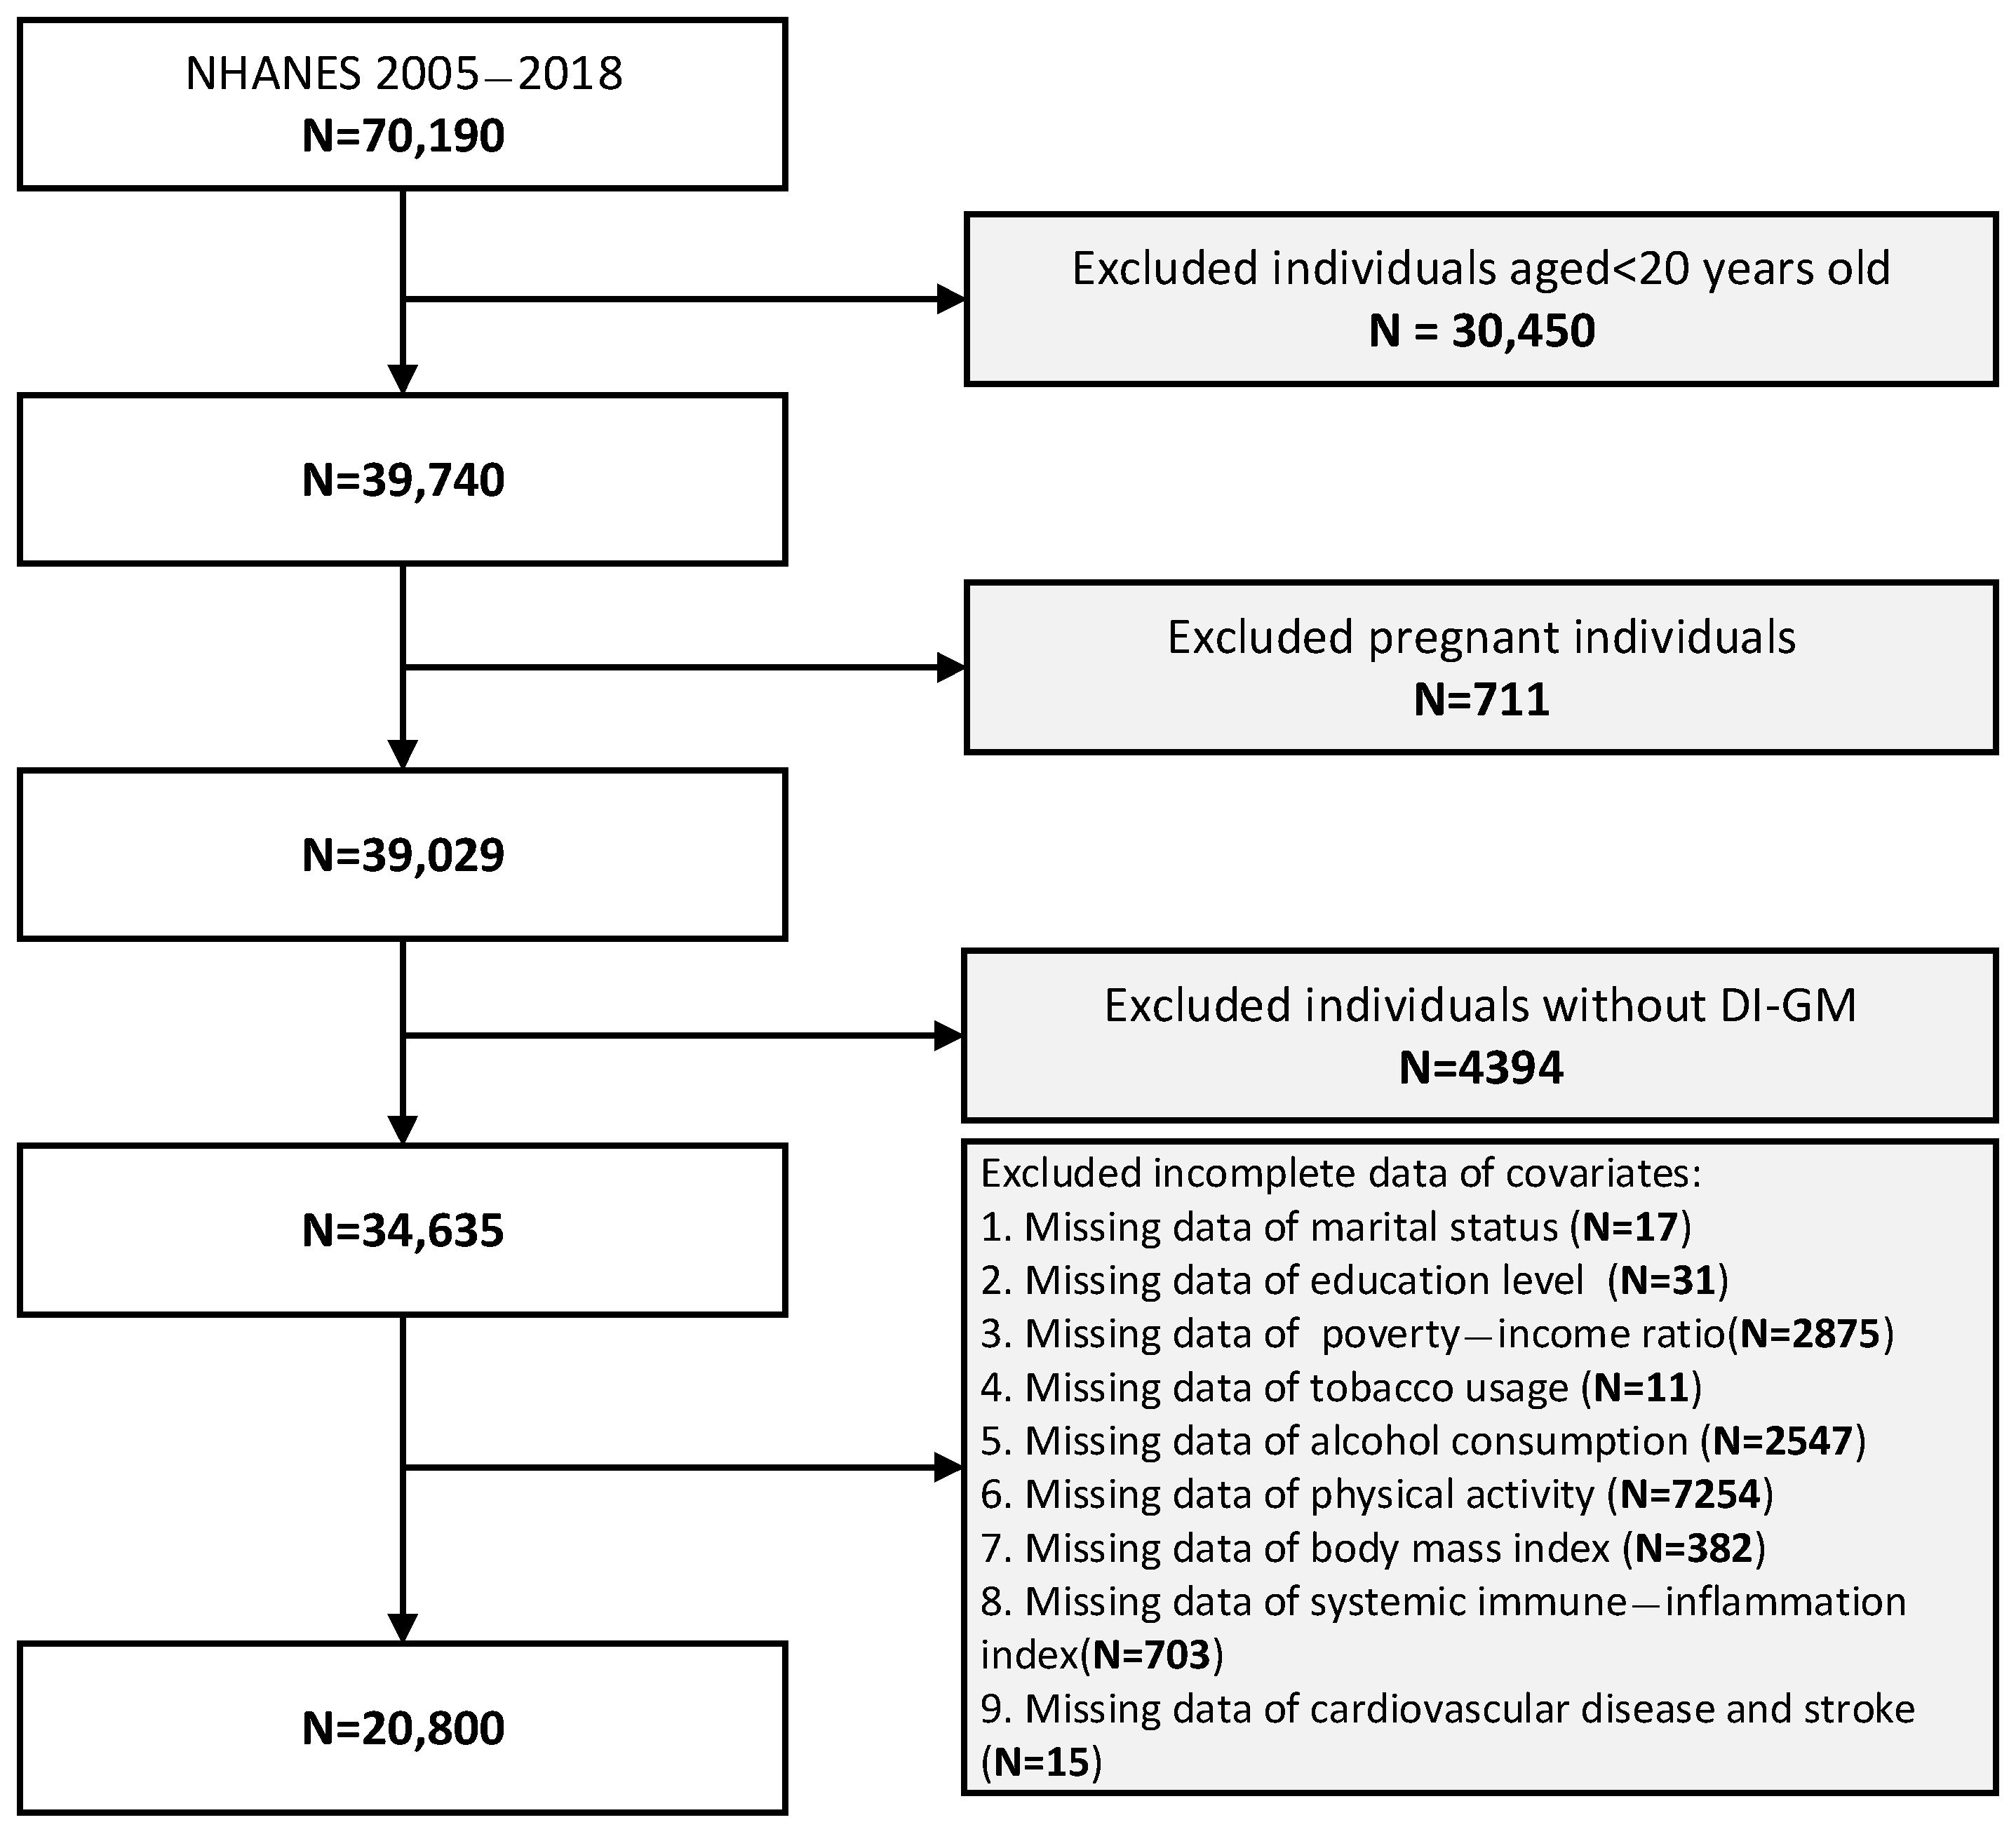
The NHANES 2005–2018 cohort initially included 70,190 participants. After individuals aged <20 years (30,450), pregnant individuals (711), and those lacking DI-GM data (4394) were excluded, the following covariates were excluded: marital status (N = 17), education level (N = 31), income (N = 2875), tobacco/alcohol use (N = 11/2547), physical activity (N = 7254), BMI (N = 382), immune–inflammation index (N = 703), and cardiovascular history (N = 15). The final cohort comprised 20,800 participants. As illustrated in Figure 1, the flowchart adheres to standardized reporting STROBE guidelines ensuring screening transparency.
Figure 1.
Flowchart of study participant screening, exclusion criteria application, and final cohort enrollment. Abbreviations: NHANES, National Health and Nutrition Examination Survey; DI–GM, dietary index for gut microbiota.
2.3. Definition of MetS
MetS represents a constellation of clinical conditions characterized by central obesity, hypertension, hyperglycemia, and dyslipidemia. These interrelated metabolic abnormalities synergistically increase the risk of cardiovascular disease and type 2 diabetes mellitus. For this investigation, MetS diagnosis was established according to the National Cholesterol Education Program Adult Treatment Panel III (NCEP-ATP III) criteria [22], requiring ≥3 of the following components: (1) serum triglycerides ≥ 1.69 mmol/L; (2) reduced HDL cholesterol (<1.03 mmol/L in males; <1.29 mmol/L in females); (3) fasting plasma glucose ≥ 6.1 mmol/L; (4) elevated waist circumference (>102 cm in males; >88 cm in females); and (5) systolic blood pressure ≥ 130 mmHg and/or diastolic blood pressure ≥ 85 mmHg. All participants followed standardized protocols, with venous blood samples obtained following ≥9 h of overnight fasting; blood pressure measurements performed in triplicate by trained personnel using mercury sphygmomanometers; and mean values employed for analysis.
2.4. Definition of DI-GM
The DI-GM was derived following Kase et al.’s scoring protocol, which quantifies the consumption patterns across 14 dietary components categorized as follows: (1) 10 beneficial items (e.g., avocado, broccoli, chickpeas and coffee) and (2) 4 detrimental items (red meat; processed meats; refined grains; and high-fat diets [≥40% energy from fat]) [15] (Supplementary Table S1). Scoring followed sex-specific median thresholds, where beneficial components received 1 point for consumption ≥ median (0 if otherwise), while detrimental components scored inversely (0 for ≥median, 1 if otherwise). Composite scores (range: 0–14) were subsequently stratified into four tiers of 0–3, 4, 5, and ≥6 for analytical purposes [21].
2.5. Definitions of Phenotypic Age, Body Mass Index, HOMA-IR, the SII, and the NLR
Phenotypic age was computed via a multi-biomarker algorithm reflecting biological aging [18]. Following Morgan E. Levine’s methodology [23], we derived this measure using ten variables: chronological age; hepatic markers (albumin, alkaline phosphatase); renal function (creatinine); glucose; C-reactive protein; and immune parameters (lymphocyte percentage, mean corpuscular volume, red cell distribution width and white blood cell count). Phenotypic age was calculated as previously described [24] and detailed in Supplementary Method S1.1. Blood samples were collected after ≥8 h of fasting at mobile examination centers via standardized protocols [9], with computational procedures adhering to established methods [18]. Body mass index (BMI) was calculated as weight/height2 (kg/m2); systemic immune–inflammation index (SII) as (platelets × 109/L × neutrophils × 109/L)/lymphocytes × 109/L; neutrophil-to-lymphocyte ratio (NLR) as neutrophils × 109/L/lymphocytes × 109/L; and homeostatic model assessment for insulin resistance (HOMA-IR) as [fasting insulin (μU/mL) × fasting glucose (mmol/L)]/22.5 (general population screening).
2.6. Covariates
This study comprehensively controlled for potential confounding factors based on clinical judgment and existing evidence [5,20,21,25]. The analysis incorporated the following: (1) demographic indicators—age, sex, race/ethnicity [Mexican American, Other Hispanic, Non-Hispanic White, Non-Hispanic Black, Other], marital status, education level [less than high school, high school or equivalent, college or above], poverty–income ratio [PIR]); (2) lifestyle factors—physical activity, calculated as metabolic equivalents (MET) min/week according to WHO guidelines and categorized as insufficient (600-<900), moderate (900-<1200), or high intensity (≥1200)], including smoking status [never, current, former], alcohol consumption [light: ≤2 drinks/day for women/≤1 for men; moderate: 2–4 drinks/day for women/1–3 for men; heavy: ≥5 drinks/day for women (or ≥4 per occasion)/≥4 for men (or ≥3 per occasion)], sleep quality [poor (<2 points), moderate (2 points), good (≥3 points)], energy intake [calculated from day 1 dietary recall data]); (3) clinical indicators—HOMA-IR, SII, and NLR [dichotomized into non-inflammatory/inflammatory groups using a cutoff of 2]); and (4) disease history—CVD, stroke [dichotomized into with/without disease groups].
2.7. External Validation of the DI-GM and MetS Association Using Global Data
This study utilized an indirect validation strategy to explore the relationship between the DI-GM score and MetS, drawing on data from the Global Dietary Database (GDD) and the Global Burden of Disease (GBD) study. This method was necessary due to the lack of a direct operational definition for MetS within the GBD framework. The DI-GM score was developed using dietary survey data from 164 countries in the 2018 GDD (Supplementary Method S1.2). We then gathered exposure data and Disability-Adjusted Life Years (DALYs) for key MetS metabolic risk factors and associated disease outcomes from the 2018 GBD study. These risk factors included metabolic risks such as high systolic blood pressure, high body mass index, high fasting plasma glucose, and high LDL cholesterol. The disease outcomes considered were non-alcoholic fatty liver disease (NAFLD), chronic kidney disease due to type 2 diabetes, hypertensive heart disease, various cardiovascular and circulatory diseases, chronic kidney disease due to hypertension, type 2 diabetes, pulmonary arterial hypertension, and stroke. We matched and integrated these GBD-derived metrics with the DI-GM scores based on country, year, age, and sex. Finally, we conducted Spearman correlation analysis to evaluate the associations between the DI-GM score, the identified core metabolic risk factors, and the MetS-related disease outcomes, adhering to standardized analytical procedures.
2.8. Statistical Analysis
- (1)
- Sample Size and Power
An a priori power analysis using G*Power (v3.1.9.2) indicated that 82 participants were required to detect a medium effect (Cohen’s d = 0.5) with 80% power (α = 0.05). Our analytic sample of 20,800 participants vastly exceeded this threshold, providing ample power to detect even small effect sizes and ensuring robust, generalizable estimates.
- (2)
- Covariate Selection and Bias Mitigation
Covariate was informed by clinical rationale and the established literature [26,27,28,29,30,31]. Multicollinearity among covariates was assessed using the variance inflation factor (VIF), with VIF ≥5 denoting significant collinearity. To mitigate potential selection bias from missing data, participants with incomplete key variables were excluded (Figure 1). Baseline characteristics were rigorously compared between included and excluded participants (Supplementary Table S2). To address residual missingness, multiple imputation by chained equations (MICE) was performed, generating five imputed datasets; estimates were pooled via Rubin’s rules to ensure robust statistical inference [32,33]. Finally, comprehensive sensitivity analyses were conducted to confirm the robustness of the findings.
- (3)
- Descriptive Statistics and Group Comparisons
Continuous variables were evaluated for normality using histograms, Q–Q plots, and Kolmogorov–Smirnov tests. Data are presented as mean ± SD (normally distributed) or median (IQR; nonnormally distributed). Categorical variables are expressed as frequencies (%). Intergroup differences across DI-GM strata were assessed using Chi-square or Fisher’s exact tests for categorical variables; one-way ANOVA for normally distributed continuous variables; and Kruskal–Wallis tests for nonparametric variables. Post hoc pairwise comparisons employed Bonferroni correction, Tukey’s HSD, or LSD testing where applicable.
- (4)
- Association Modeling and Subgroup Analyses
Adjusted odds ratios (ORs) and 95% CI for MetS were derived from multivariable logistic regression. Univariate analyses were performed initially (Supplementary Table S3), followed by multivariable models treating DI-GM as a categorical variable partitioned into quartiles (Q1: 0–3; Q2: 4; Q3: 5; Q4: ≥6). Subgroup analyses were stratified by sociodemographic characteristics (age, sex, race/ethnicity, marital status, education, PIR). Restricted cubic splines (RCS) with three knots (10th, 50th, 90th percentiles) examined non-linearity.
- (5)
- Mediation Analysis and Sensitivity Analyses
The mediating roles of phenotypic age and HOMA-IR in the DI-GM–MetS pathway were evaluated using the Sobel test, non-parametric bootstrapping (1000 iterations), and quasi-Bayesian Monte Carlo approximation. Mediation effect size was quantified as the proportion mediated (indirect effect/total effect × 100%) for clinical interpretability [20]. Robustness was validated through: (1) outlier exclusion—removing participants with caloric intake ≤500 or ≥5000 kcal/d, or those outside the 0.5th–99.5th percentile for PIR and METs; and (2) propensity score matching (PSM)—performing 1:1 matching using MetS status as the reference to reduce selection bias [20]. Results are presented in Supplementary Tables S4 and S5.
- (6)
- Software and Statistical Inference
Effect sizes and two-sided p values (<0.05 significance) were computed using R (v4.2; R Foundation) and FreeStatistics (v2.3 beta; Beijing, China). The FreeStatistics platform integrates an R computational engine with a Python-based graphical interface to standardize analytical pipelines.
3. Results
3.1. Characterization of the Study Population
The cohort comprised 20,800 participants stratified into DI-GM quartiles (Q1: 0–3, Q2: 4, Q3: 5, Q4: ≥6; Table 1). Significant interquartile differences were observed in age distribution (Q4: 39.9% ≤45 y vs. Q1: 57.5%; p < 0.001), sex distribution (Q4: 50.0% female vs. Q1: 43.6%), and racial/ethnic composition (Mexican American: Q1 40.1% vs. Q4 50.3%). Higher DI-GM scores were associated with greater educational attainment (college-educated: Q4 63.3% vs. Q1 50.4%) and higher income levels (PIR > 3.5: Q4 39.9% vs. Q1 28.2%). Metabolic parameters showed progressive improvements across increasing quartiles: BMI decreased (Q1: 30.3 ± 7.5 kg/m2 vs. Q4: 28.4 ± 6.3 kg/m2) and MetS prevalence declined (Q1: 30.1% vs. Q4: 24.8%; all p < 0.001). No significant differences were found for alcohol consumption (p = 0.901) or the systemic immune–inflammation index (p = 0.094).
Table 1.
Population characteristics by categories of DI-GM score (n = 20,800).
3.2. Association Between DI-GM and MetS
As shown in Table 2, when DI-GM was treated as a continuous variable, higher DI-GM scores were associated with lower likelihood of MetS in the unadjusted model (crude OR = 0.93 per unit increase, 95%CI:0.91–0.95, p < 0.001). After sequential adjustments for demographic factors, lifestyle factors, and clinical covariates, the negative correlation remained consistent across all models (adjusted OR = 0.89, p < 0.001). Furthermore, stratified analysis based on DI-GM cutoffs revealed a progressive reduction in MetS prevalence with increasing DI-GM scores: participants with scores ≥6 had the lowest odds of MetS (OR = 0.63, 95%CI:0.56–0.72, p < 0.001) compared to the reference group (score ≤ 3). Trend tests confirmed a significant inverse linear relationship between DI-GM scores and MetS prevalence (p < 0.001 for all models).
Table 2.
Association between DI-GM score and MetS odds ratio (n = 20,800).
To further consolidate the association between DI-GM and MetS, sensitivity analyses were performed. After excluding outliers for continuous variables (e.g., calorie intake ≤500 or ≥5500 kcal/day) and restricting values to the 0.5th–99.5th percentiles for PIR and MET, DI-GM maintained a significant inverse correlation with MetS (OR = 0.90, 95% CI: 0.88–0.92; p < 0.001; Supplementary Table S4). Following PSM for MetS status, the association remained robust (OR = 0.89, 95% CI: 0.86–0.91; p < 0.001; Supplementary Table S5).
3.3. Global Validation of the Association Between DI-GM and MetS Using GBD and GDD Data
Table 3 shows that although no statistically significant association was found (p > 0.05), Spearman correlation analysis indicates a consistent negative trend between the DI-GM score and core metabolic risk factors, suggesting that a higher DI-GM score might correlate with reduced prevalance of MetS. Furthermore, since both the GBD and GDD encompass global population data, the observed effect size (|r| ≈ 0.11) is noteworthy. This value, which is near Cohen’s threshold for a small effect (0.1), suggests potential practical significance for global public health interventions.
Table 3.
Association of the DI-GM score with the prevalence of MetS core risk factors (n = 164).
This study further examined the correlation between DI-GM and MetS-related disease outcomes. As shown in Table 4, the analysis revealed negative correlation coefficients between the DI-GM score and prevalence of all MetS-related diseases, ranging from −0.010 to −0.202. Notably, the higher negative correlations were found for chronic kidney disease due to type 2 diabetes, chronic kidney disease due to hypertension, and non-alcoholic fatty liver disease, with correlation coefficients of −0.202, −0.167, and −0.156, respectively (p = 0.009, 0.033, and 0.046). The results provide further evidence of DI-GM’s negative correlation with MetS.
Table 4.
Correlation between the DI-GM score and the prevalence count of MetS-related diseases (n = 164).
3.4. Curve Fitting and Inflection Point Analysis
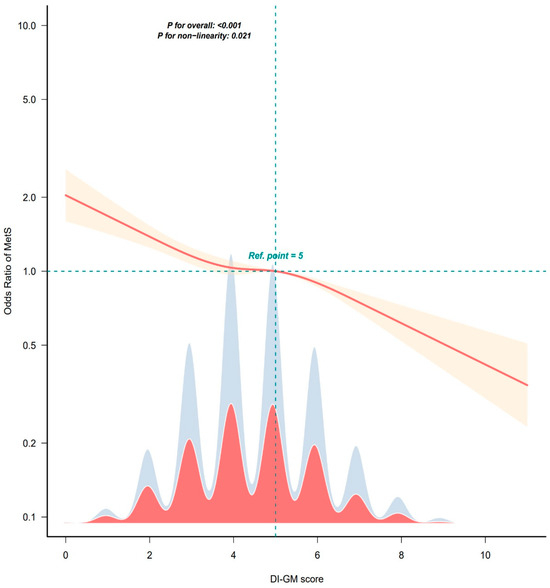
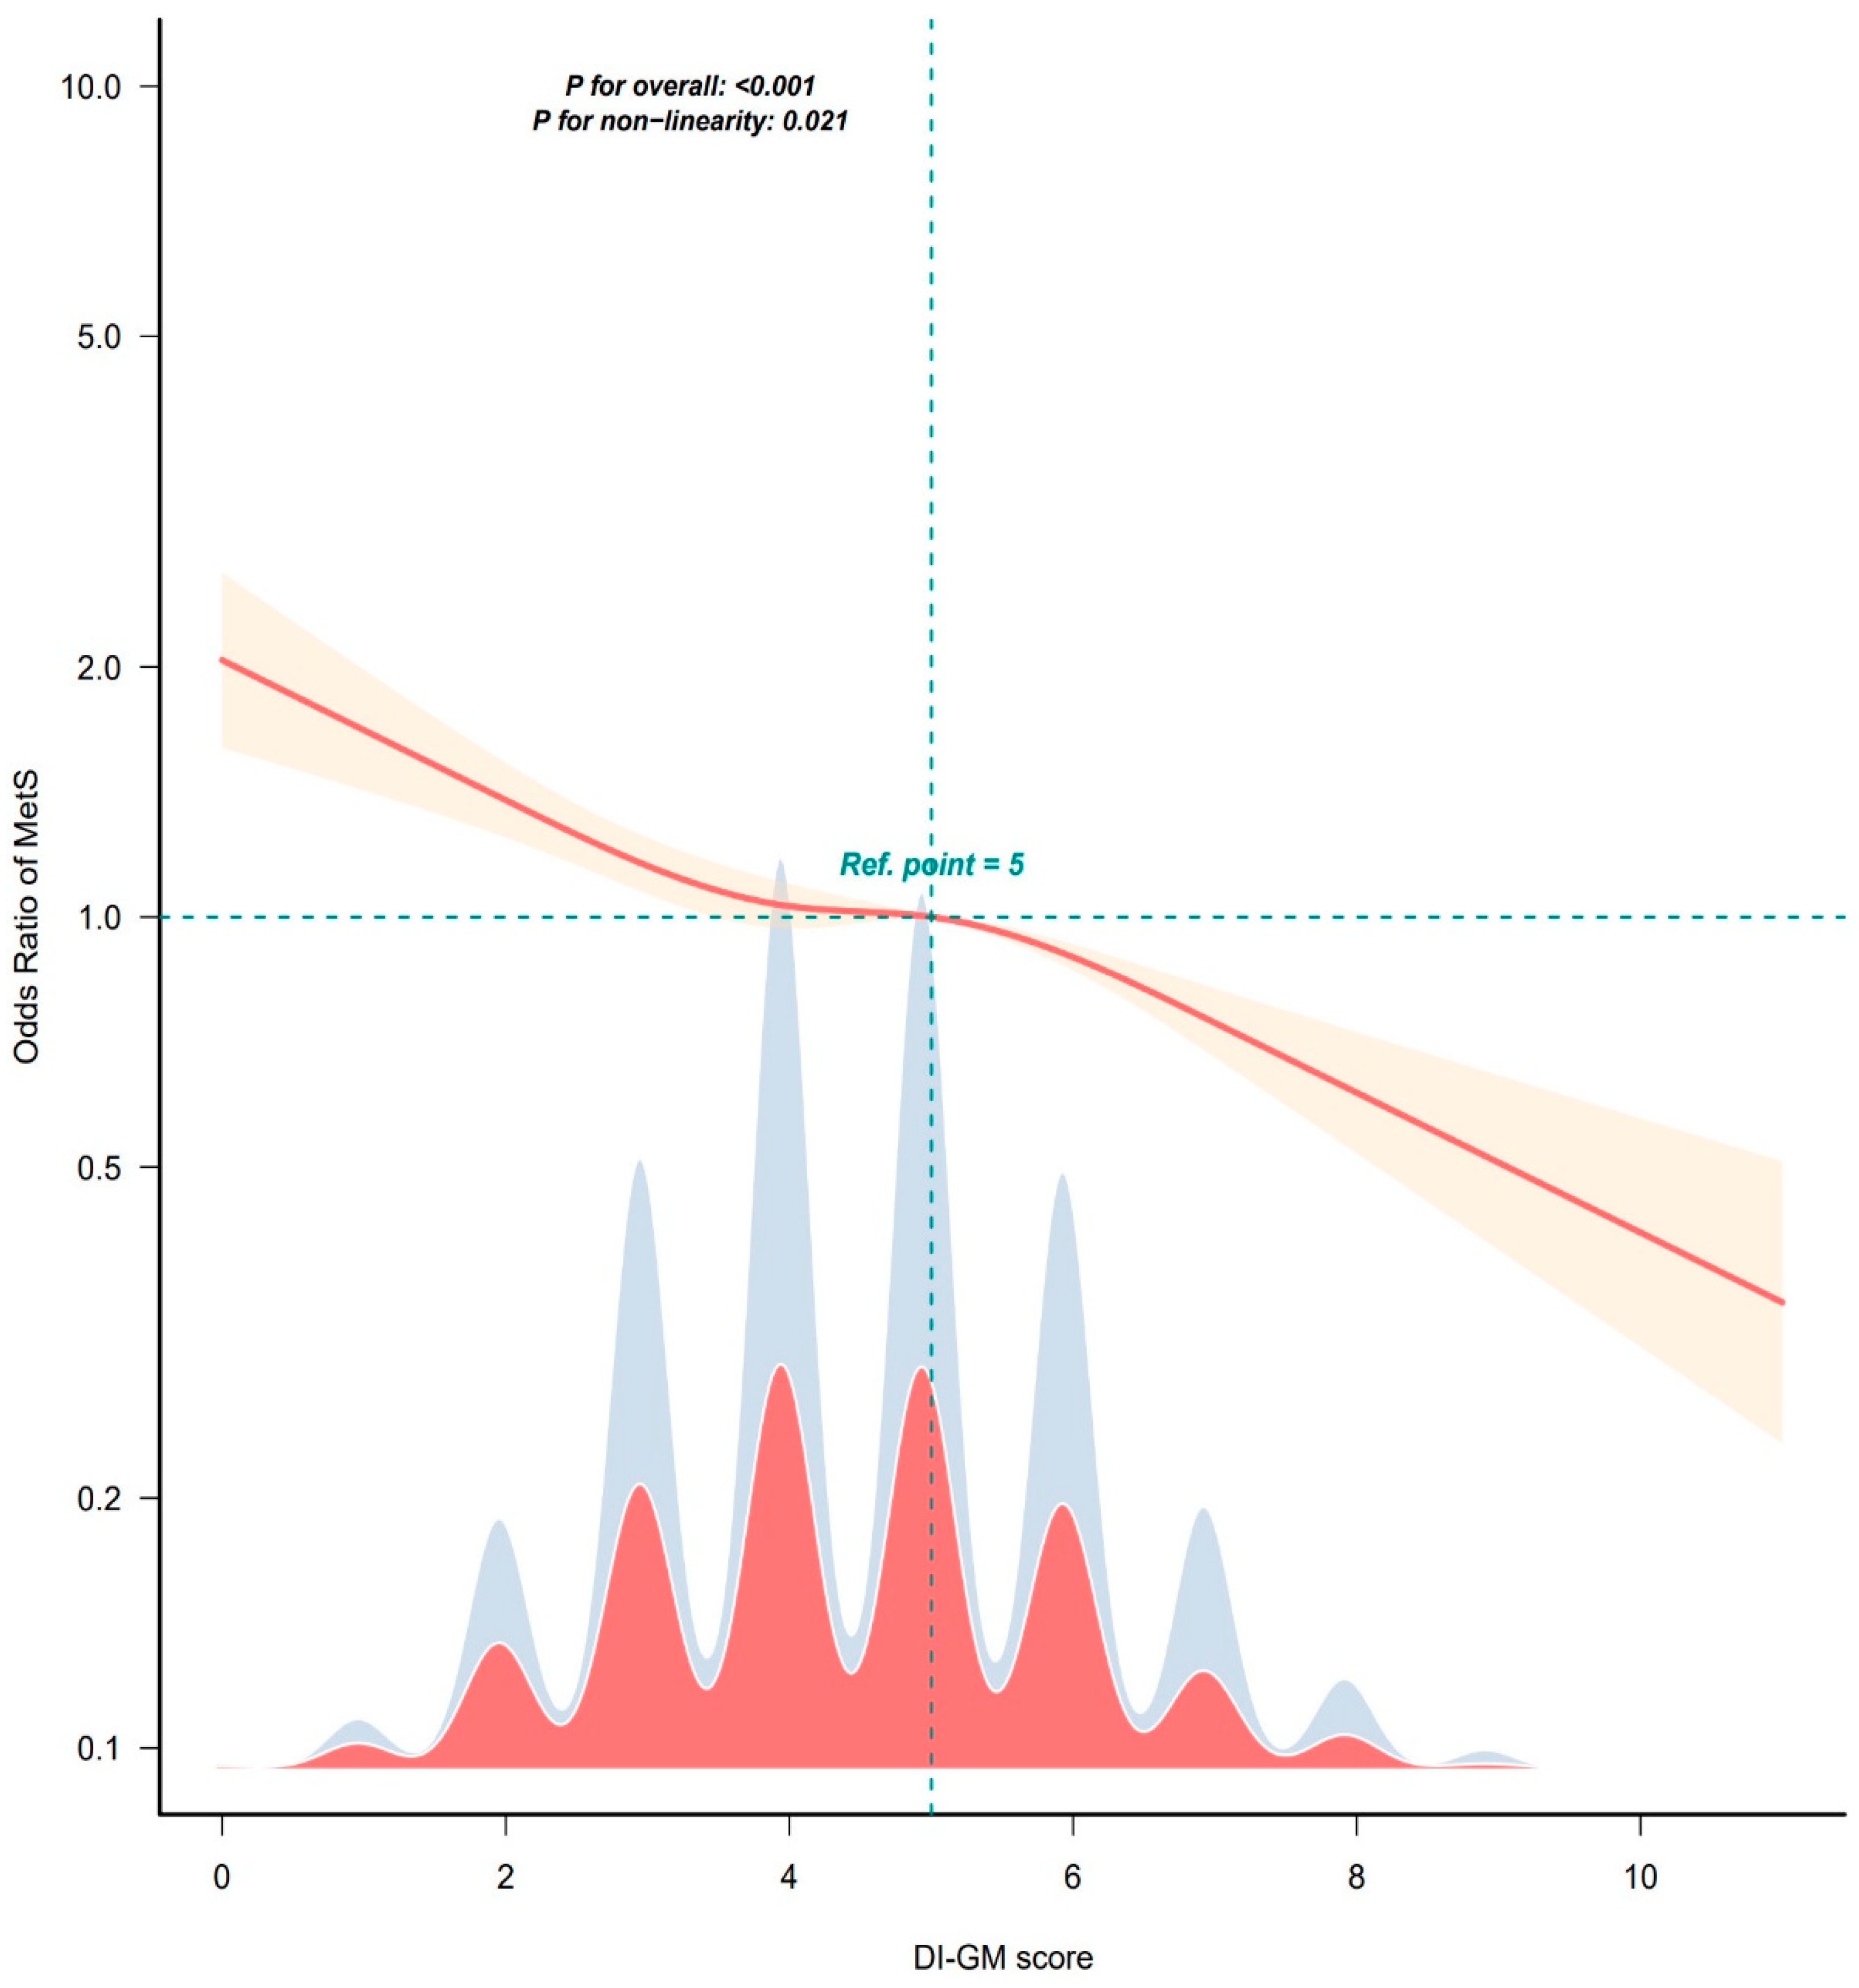
Multivariate-adjusted RCS analyses (Figure 2) identified a non-linear association between DI-GM and MetS prevalence (p for overall < 0.001; p non-linear = 0.021). Subsequent threshold effect analysis (Table 5) identified a significant inflection point at a DI-GM score of 4.972. At DI-GM values <4.972, each one-unit increase in DI-GM was accompanied by a decrease in MetS prevalence of 16% (OR 0.84, 95% CI 0.80–0.89; p < 0.001). In contrast, at DI-GM values > 4.972, each one-unit decrease in DI-GM was associated with a 14% relative reduction in MetS prevalence (OR 0.86, 95% CI 0.82–0.91; p < 0.001).
Figure 2.
Restricted cubic splines analysis with multivariate-adjusted correlations between DI-GM score and MetS odds ratio. The solid red line denotes expected values, while the light yellow zone indicates 95% confidence intervals. The background density plot (light gray, non-MetS; light red, MetS) displays the relative density distribution of DI-GM scores within the study population. All analyses were adjusted for age, sex, marital status, race/ethnicity, education level, family income, smoking status, physical activity, alcohol use, sleep quality, calorie intake, cardiovascular disease, and stroke. Overall, 100% of the data are presented.
Table 5.
Threshold effect analysis of the relationship of DI-GM with MetS (n = 20,800).
3.5. Subgroup Analysis
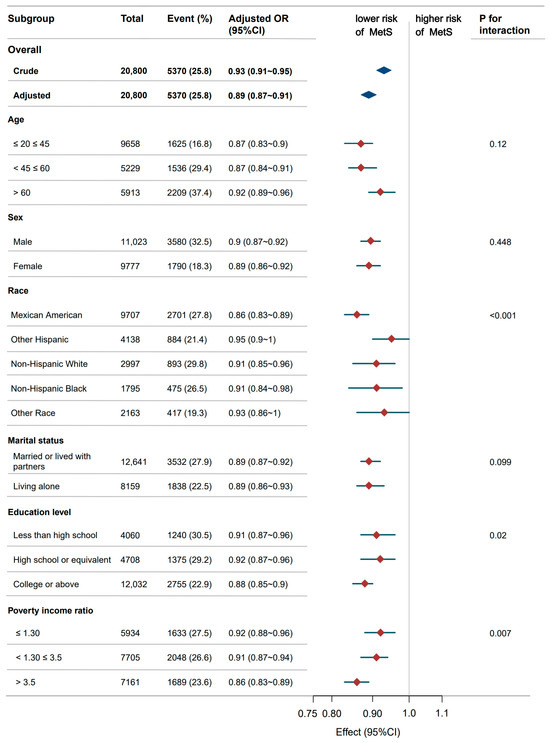
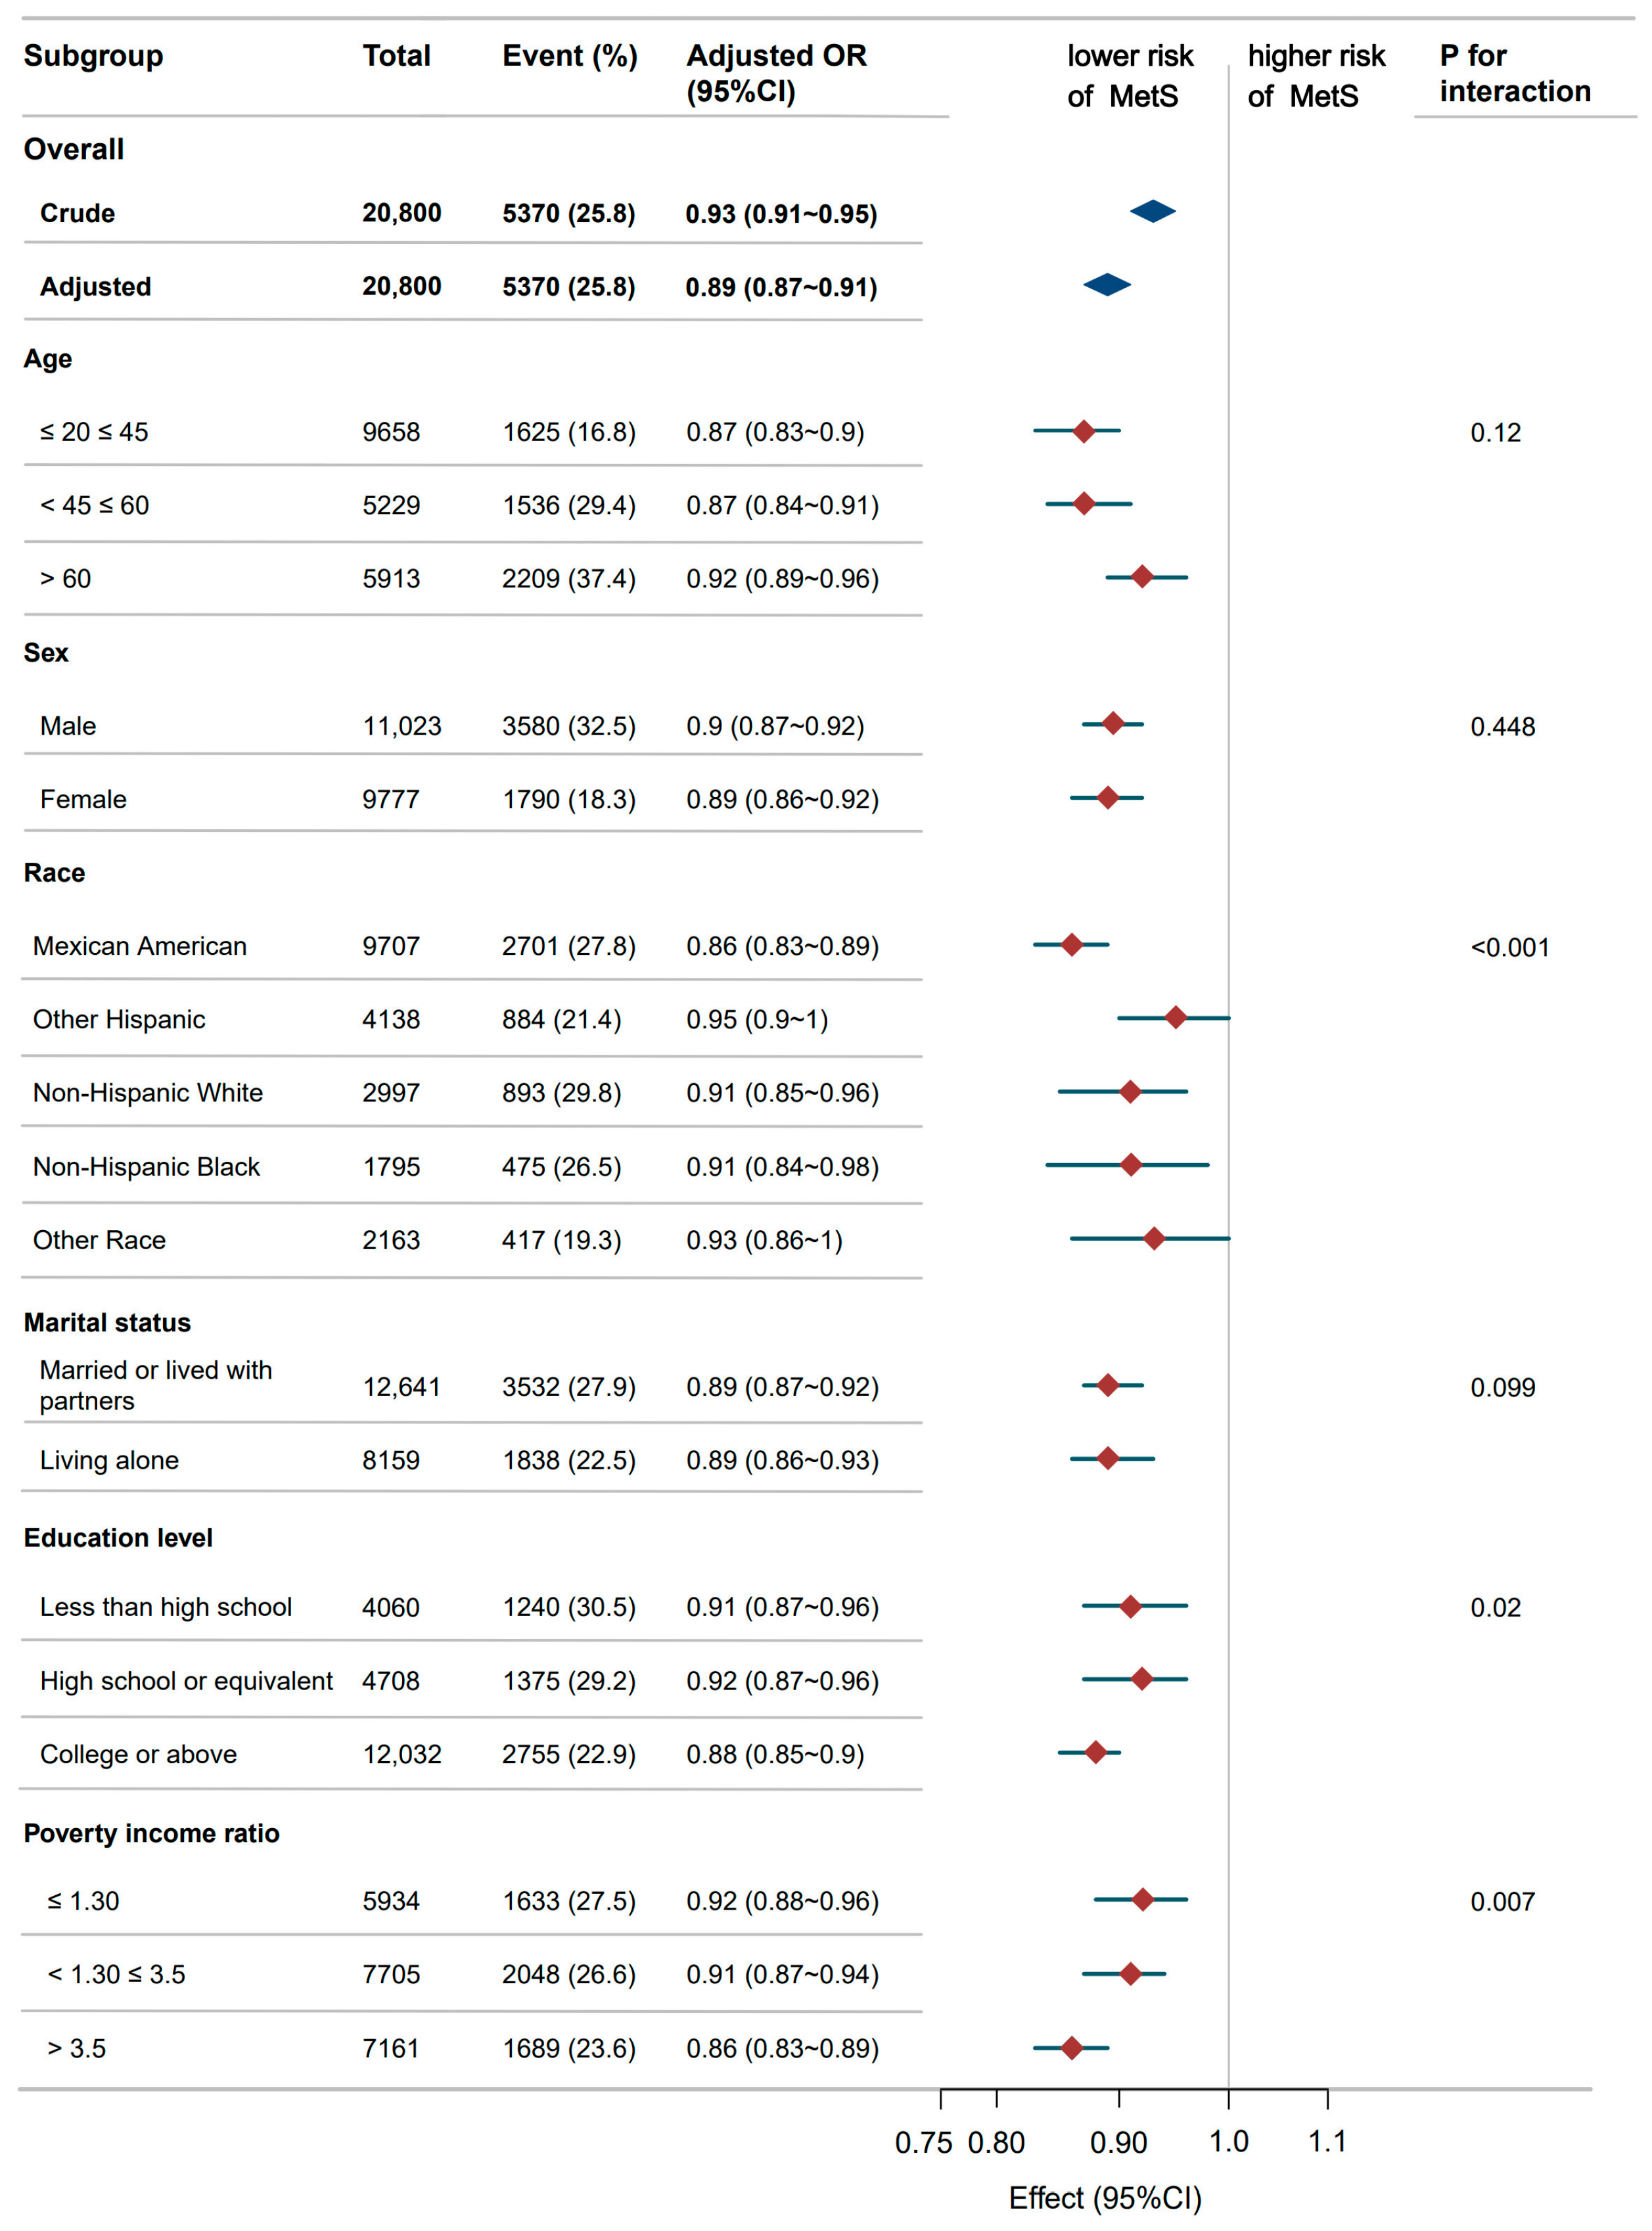
Subgroup and interaction analyses were conducted, with results visualized in a forest plot (Figure 3). Stratified analyses of age, sex, race, marital status, educational attainment, and PIR were performed. Consistent with expectations, DI-GM significantly correlated with reduced MetS prevalence in all subgroup analyses. Furthermore, significant interaction effects were detected for incident MetS across race (p < 0.001), educational attainment (p < 0.05), and PIR strata (p = 0.007). Among high-income individuals (PIR ≥ 3.5), each unit increase in DI-GM was associated with a 14% lower likelihood of MetS prevalence compared to the low-income group (OR = 0.86 vs. 0.92, respectively). Similarly, college-educated participants demonstrated a stronger inverse association (OR = 0.88 vs. 0.91) than those with less than high school-level education.
Figure 3.
Associations between DI-GM score and MetS odds ratio in different subgroups. All stratification factors, except for the component itself, were adjusted for variables in Model 3 (age, sex, marital status, race/ethnicity, educational attainment, household income, smoking status, alcohol consumption, physical activity, sleep quality, caloric intake, cardiovascular disease, and stroke history). MetS, metabolic syndrome; DI-GM, dietary index for gut microbiota; OR, odds ratio; CI, confidence interval.
3.6. Mediation Effect Analysis
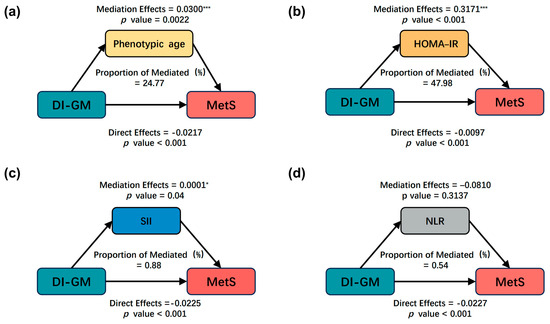
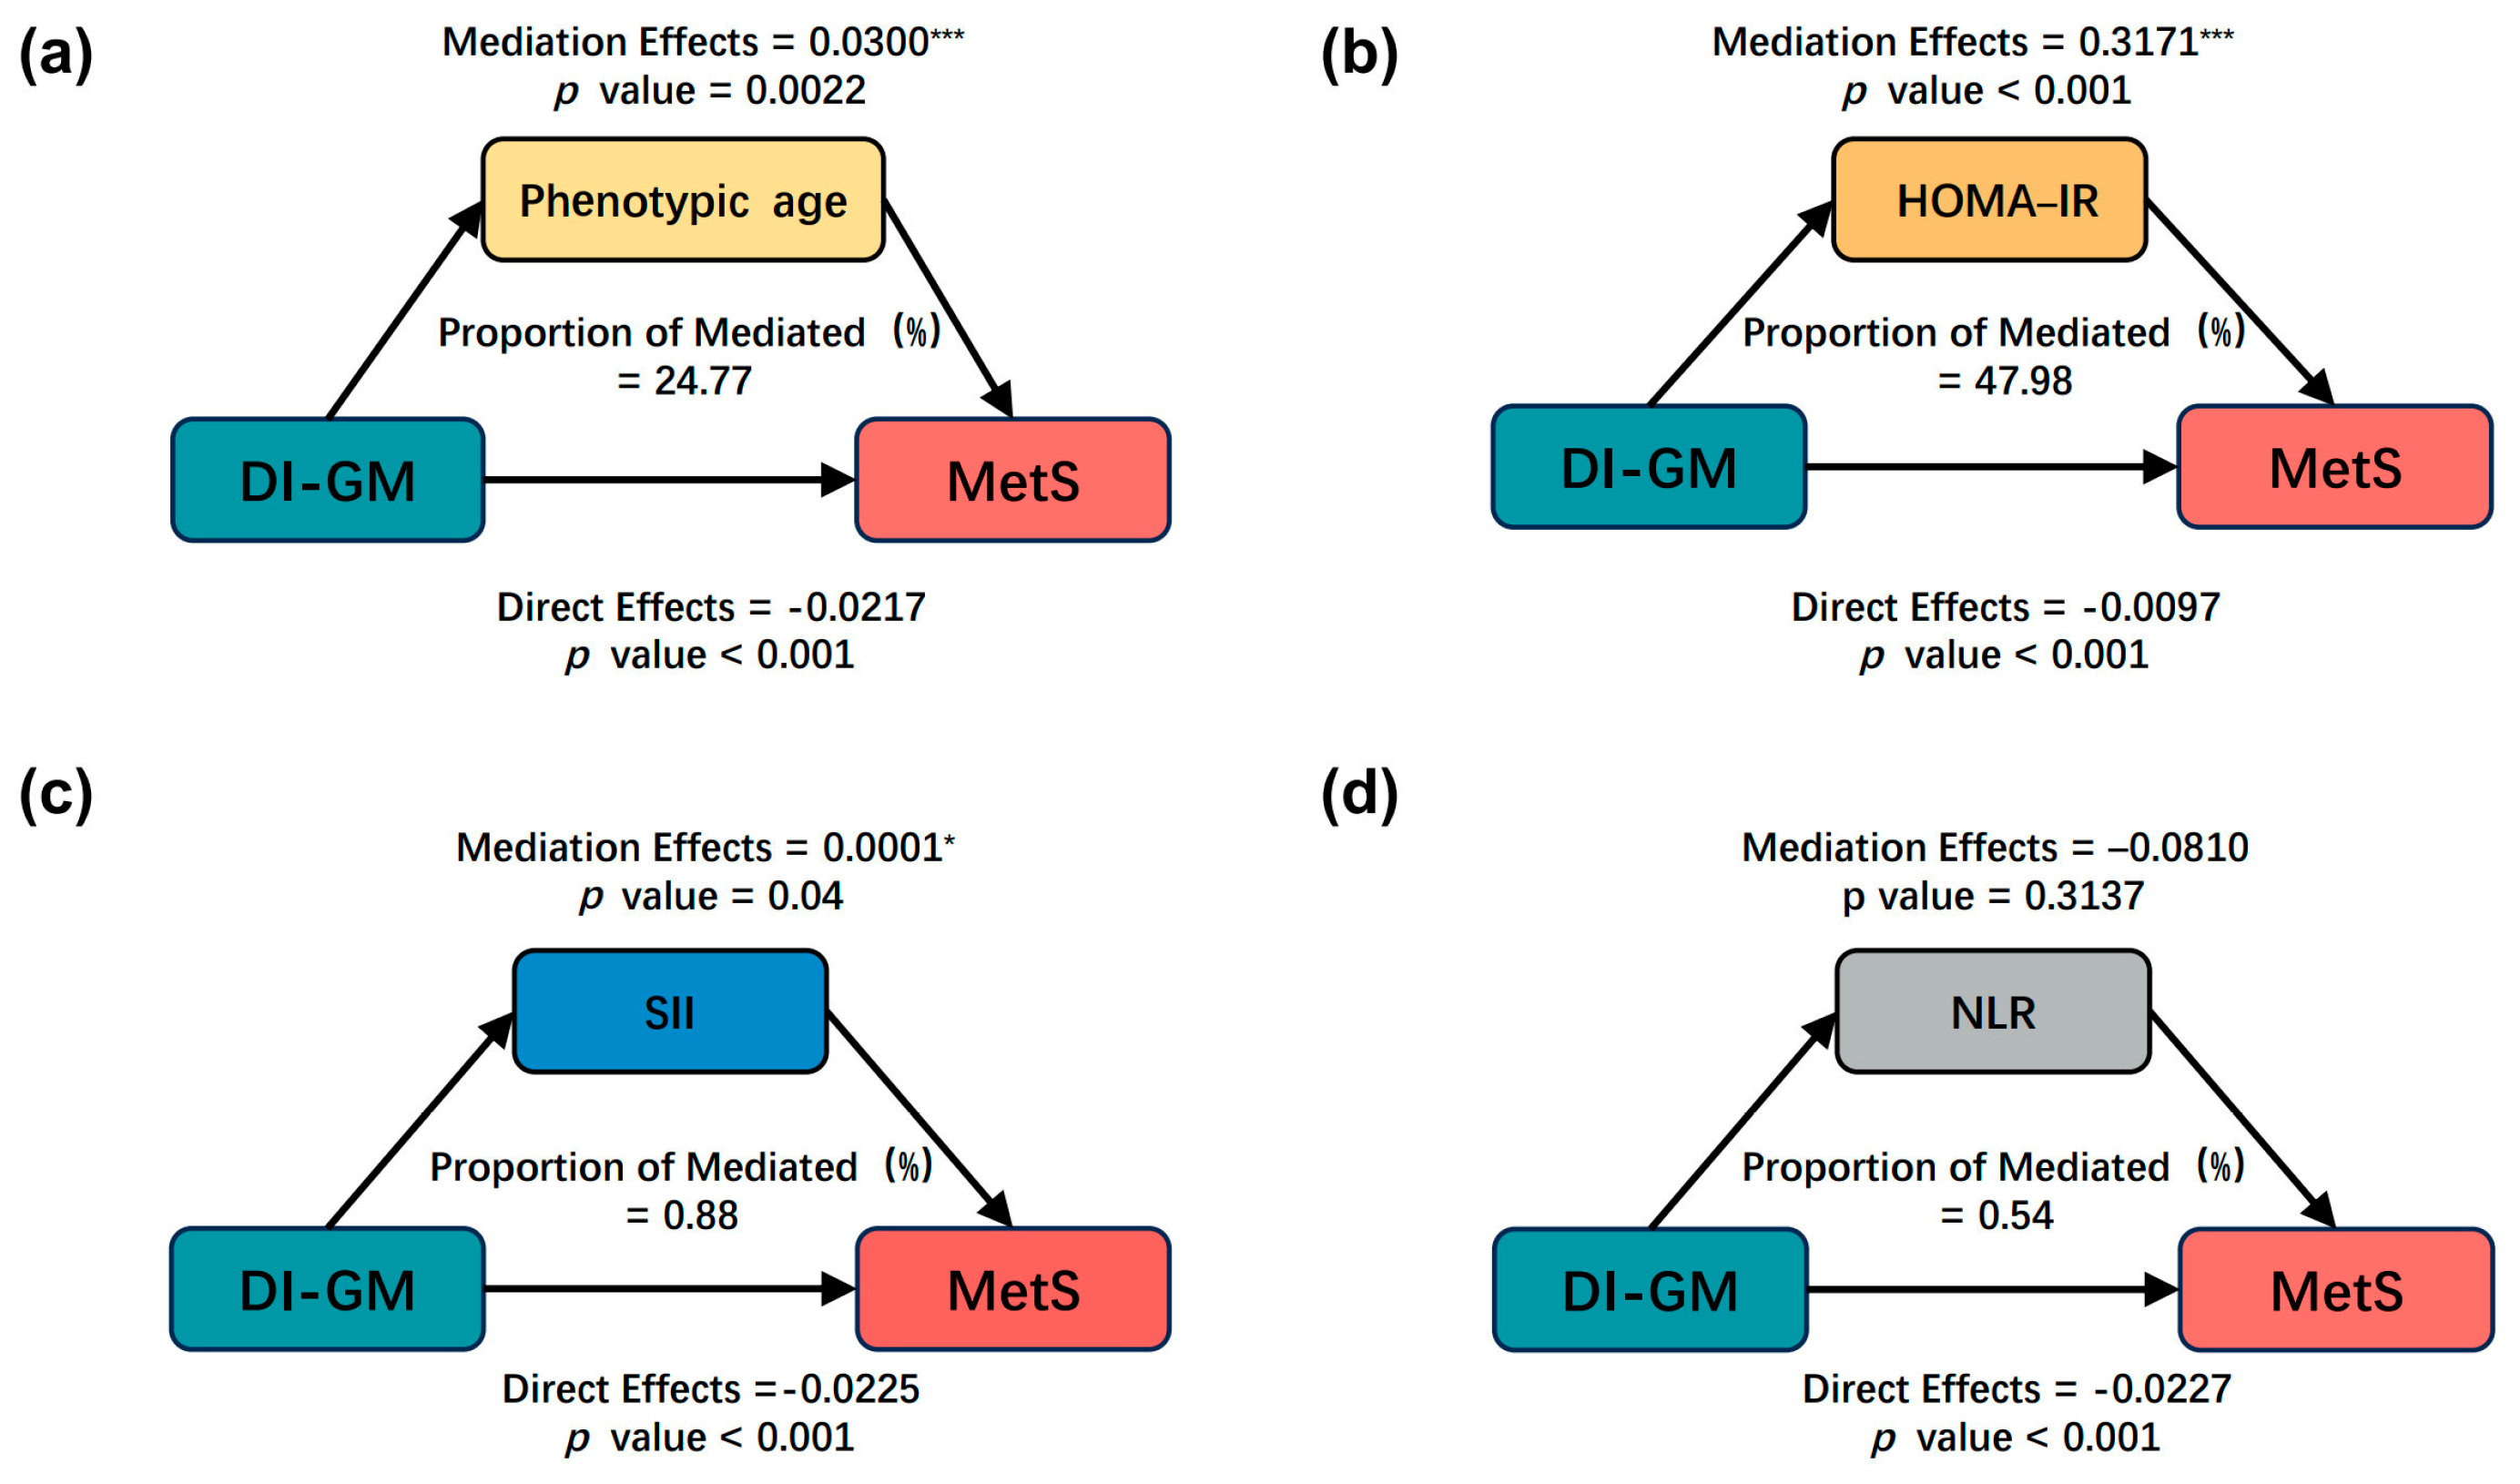
To elucidate potential mediating pathways linking DI-GM to MetS, we assessed total effects and conducted a comprehensive mediation analysis examining phenotypic age, HOMA-IR, SII, and NLR as candidate mediators. As depicted in Figure 4, the analysis revealed distinct mechanistic pathways connecting DI-GM with MetS. Figure 4a,b demonstrate robust mediation effects for insulin resistance (HOMA-IR; 47.98% of total effect, β = 0.3171, p < 0.001) and phenotypic age (24.77%, β = 0.0300, p = 0.0022). Conversely, inflammatory markers exhibited negligible roles (Figure 4c,d), including SII (0.88%; β = 0.0001, p = 0.04) and NLR (0.54%; β = −0.0810, p = 0.3137). All models demonstrated a significant inverse association between DI-GM and MetS (p < 0.001), supporting partial mediation involving the quantified pathways.
Figure 4.
Mediating effect of the DI-GM on MetS risk: (a) mediation effect of phenotypic age; (b) mediation effect of HOMA-IR; (c) mediation effect of SII; (d) mediation effect of NLR. Asterisks denote statistical significance (* p < 0.05, *** p < 0.001). Analyses were adjusted for age, sex, marital status, race/ethnicity, educational attainment, household income, smoking status, alcohol consumption, physical activity, sleep quality, caloric intake, cardiovascular disease, and stroke. Abbreviations: DI-GM, dietary index for gut microbiota; MetS, metabolism syndrome; HOMA-IR, homeostatic model assessment for insulin resistance; SII, systemic immune–inflammation index; NLR, neutrophil-to-lymphocyte ratio.
4. Discussion
Our large-scale analysis revealed a consistent inverse association between DI-GM and MetS, a finding robustly observed across both individual-status (NHANES) and global-level (GBD/GDD) data. Subgroup analyses demonstrated significant effect modification by race/ethnicity and socioeconomic status, indicating heterogeneity in this dietary-metabolic link. Utilizing mediation modeling, we identified insulin sensitivity (HOMA-IR) and phenotypic age as potential contributors accounting for a substantial proportion of this association. While these findings suggest that gut health-promoting diets correlate with favorable metabolic profiles, interpretations must remain cautious; the cross-sectional design precludes establishing temporality, and thus these pathways should be regarded as exploratory.
We firstly observed a significant inverse association between DI-GM scores and MetS prevalence (Table 2), whereby each unit increase in DI-GM corresponded to an 11% reduction in MetS prevalence (OR = 0.89, 95% CI: 0.85–0.93). To validate this relationship at a macro level, we integrated data from the GBD and GDD to perform a global analysis. As presented in Table 3 and Table 4, DI-GM scores were negatively correlated with the burden of metabolic risk factors and MetS-related comorbidities, corroborating the robustness of this dietary–metabolic link from both individual and global perspectives. Furthermore, as depicted in Figure 2, RCS modeling revealed a non-linear association, identifying an inflection point at a DI-GM threshold of 4.972. This result potentially provides a quantitative dietary target for optimizing metabolic health. The potential association between DI-GM and MetS may stem from the multi-target actions of its components with emerging evidence indicating that they operate through diverse mechanisms. Whole grains and dietary fiber, for example, promote the growth of butyrate-producing bacteria like Roseburia and Faecalibacterium, which in turn enhance intestinal barrier integrity and reduce lipopolysaccharide-induced inflammation [34]. Fermented dairy products boost GLP-1-mediated insulin secretion via metabolites from Lactobacillus [35]. On the other hand, limiting red meat consumption can decrease FXR-driven hepatic lipogenesis by lowering secondary bile acids [36]. Additionally, dietary polyphenols, such as chlorogenic acid and EGCG, enhance fatty acid β-oxidation by modulating the microbiota–bile acid axis [37]. This integrated “diet–microbiota–metabolism” paradigm establishes a quantifiable biomarker system for precision nutrition.
As shown in Figure 3, subgroup analyses further demonstrate significant racial disparities in DI-GM efficacy, with Mexican Americans exhibiting stronger protection (OR = 0.86 vs. 0.93 of other race), which was concordant with Qu et al.’s diabetes findings [14]. This heterogeneity likely stems from interracial variations in gut microbiota composition (e.g., the Bacteroidetes/Firmicutes ratio) [38], dietary practices [39], and healthcare access [40]. Moreover, socioeconomic status—including education and PIR—further modified effects, reflecting economic barriers to healthy foods [41], health literacy differentials [42], and occupation-related chronic stress [43]. These findings underscore the necessity of addressing structural inequities to achieve metabolic health equity.
In the next quantitative mediation analysis (Figure 4), we identified distinct pathways linking DI-GM to lower MetS prevalence. Attenuated insulin resistance and decelerated phenotypic aging accounted for most of the mediated effect, whereas inflammatory biomarkers (NLR/SII) contributed minimally. Diverging from prior studies focused primarily on inflammation [44], our findings suggest that insulin sensitivity and phenotypic aging may represent key contributing factors within the diet–microbiota–metabolism axis, complementing rather than replacing conventional inflammatory pathways. To our knowledge, this is the first observational study to identify insulin resistance and phenotypic age—rather than systemic inflammation—as statistically significant contributors to this specific dietary index association. Mechanistically, the observed associations may be partly explained by synergistic pathways: (1) gut microbiota fermentation of dietary fiber generates SCFAs (e.g., butyrate/propionate), which activate GPR41/43 and inhibit HDACs, thereby augmenting intestinal barrier function and hepatic lipid metabolism [45,46]; (2) modulation of secondary bile acids (e.g., deoxycholic acid) may influence glucose/lipid homeostasis via FXR/TGR5 receptors [47]; and (3) upregulation of tight junction proteins (e.g., occluded-in/ZO-1) likely limits LPS translocation, potentially reducing subclinical inflammation in insulin target tissues [48]. In addition, recent new findings reveal that DI-GM attenuates phenotypic aging through SCFAs-induced activation of the SIRT1/AMPK pathway, which enhances mitochondrial function and telomere maintenance, along with Treg/Th17 immune balance remodeling and folate-mediated epigenetic modifications, all of which synergistically combated aging [49].
From a policy perspective, these findings advocate integrating microbiota-centric metrics (e.g., DI-GM) into national dietary frameworks. We propose DI-GM as an actionable precision nutrition framework manifesting in three dimensions: (1) Clinical actionability—defining DI-GM ≥ 4.972 as a clinical action threshold (16% risk reduction below vs. 14% above threshold) enables the transition from vague dietary advice to targeted interventions. (2) Paradigm-shifting mechanistic insights—mediation analysis identifies insulin resistance and phenotypic aging as core mediators, directly challenging current inflammation-centric primary prevention strategies. We advocate for prioritizing “gut–liver axis insulin sensitivity optimization” and “biological age reversal” in clinical guidelines [16]. (3) Health equity restructuring—significant effect modification exists across racial/socioeconomic strata. Achieving health equity requires addressing biosocial disparities through integrated biosocial interventions (e.g., eliminating healthcare access barriers).
While methodological rigor was prioritized, several limitations warrant acknowledgment. First, the inherent nature of the cross-sectional design precludes definitive causal inference. Although integrating NHANES, GBD, and GDD data provided robust, multi-scale validation of the DI-GM–MetS association, temporal ambiguity persists. Specifically, we cannot exclude the possibility of reverse causation (e.g., individuals with MetS altering their diet) or the impact of survival bias. Second, this temporal limitation fundamentally constrains the interpretation of our mediation analysis. While we employed bootstrapping to quantify the mediated effects, cross-sectional mediation inherently lacks the sequential temporal data required to disentangle true mechanistic pathways. Consequently, the proportions mediated by insulin resistance and phenotypic aging should be viewed strictly as hypothesis-generating estimates rather than mechanistic proof. Third, measurement limitations persist regarding dietary assessment. The DI-GM index serves only as an indirect proxy for gut microbiota composition and cannot capture inter-individual microbial heterogeneity or personalized dietary responses [50]. Furthermore, reliance on 24 h dietary recalls introduces inherent measurement error, including recall bias and an inability to capture long-term habitual intake. Finally, despite rigorous multivariable adjustment, residual confounding from unmeasured factors cannot be entirely excluded. Variables such as genetic predisposition, specific medication use (e.g., antibiotics or probiotics), and other lifestyle factors may still influence the observed associations.
5. Conclusions
This study reveals DI-GM as a dietary metric consistently associated with lower MetS prevalence across diverse populations, with observed associations linked predominantly to favorable insulin resistance and phenotypic age profiles. These findings support a potential shift—moving beyond traditional anti-inflammatory foci toward gut–liver axis metabolic optimization. Given the inherent limitations of cross-sectional design, prospective cohort studies and randomized controlled trials are required to validate these pathways and confirm causality.
Supplementary Materials
The following supporting information can be downloaded at: https://www.mdpi.com/article/10.3390/obesities6030033/s1, Table S1: Components and scoring calculation of DI-GM in NHANES; Table S2: Comparison of baseline characteristics between included and excluded participants; Table S3: Association of covariates and MetS odds ratio; Table S4: Association between DI-GM score and MetS odds ratio (n = 19,919); Table S5: Association between DI-GM score and MetS odds ratio after PSM (n = 10,678).
Author Contributions
X.L.: Conceptualization, data curation, formal analysis, writing—original draft; J.G., Y.L. and S.L.: writing—review and editing, methodology, investigation; Y.G., Y.L. and J.G.: conceptualization, methodology; H.J. and C.S.: resources, supervision, validation, visualization, writing—review and editing. All authors have read and agreed to the published version of the manuscript.
Funding
This research did not receive any specific grants from funding agencies in the public, commercial, or not-for-profit sectors.
Data Availability Statement
The datasets analyzed in this study are publicly available from the NHANES database, managed by the Centers for Disease Control and Prevention. All data can be visited through the official NHANES website. The specific datasets used in this analysis are from the 2005 to 2018 survey cycles.
Acknowledgments
We extend our sincere gratitude to all participants, research staff, and fellow investigators for their invaluable contributions to this study. Special thanks goes to Jie Liu from the Department of Vascular and Endovascular Surgery at the Chinese PLA General Hospital for his expert consultation on the study design, statistical support, and insightful comments regarding the manuscript.
Conflicts of Interest
The authors declare that the research was conducted in the absence of any commercial or financial relationships that could be construed as potential conflicts of interest.
Abbreviations
| DI-GM | Dietary index for gut microbiota |
| MetS | Metabolic syndrome |
| SII | Systemic immune–inflammation index |
| NLR | Neutrophil-to-lymphocyte ratio |
| HOMA-IR | Homeostatic model assessment for insulin resistance |
| NHANES | National Health and Nutrition Examination Survey |
| BMI | Body mass index |
| RCS | Restricted cubic splines |
| PIR | Poverty-to-income ratio |
| MET | Metabolic equivalent |
| SCFA | Short-chain fatty acid |
| GDD | Global Dietary Database |
| GBD | Global Burden of Disease |
References
- Tian, Y.; Li, D.; Cui, H.; Zhang, X.; Fan, X.; Lu, F. Epidemiology of multimorbidity associated with atherosclerotic cardiovascular disease in the united states, 1999–2018. BMC Public Health 2024, 24, 267. [Google Scholar] [CrossRef] [Scilit]
- Hirode, G.; Wong, R.J. Trends in the prevalence of metabolic syndrome in the united states, 2011–2016. JAMA 2020, 323, 2526–2528. [Google Scholar] [CrossRef] [Scilit] [PubMed]
- Islam, M.S.; Wei, P.; Suzauddula, M.; Nime, I.; Feroz, F.; Acharjee, M.; Pan, F. The interplay of factors in metabolic syndrome: Understanding its roots and complexity. Mol. Med. 2024, 30, 279. [Google Scholar] [CrossRef] [Scilit]
- Saklayen, M.G. The global epidemic of the metabolic syndrome. Curr. Hypertens. Rep. 2018, 20, 12. [Google Scholar] [CrossRef] [Scilit]
- Huang, L.; Zhang, Z.; Zhang, F.; Zhang, W.; Meng, X.; Jian, T.; Ding, X.; Chen, J. Amelioration of metabolic syndrome in high-fat diet-fed mice by total sesquiterpene lactones of chicory via modulation of intestinal flora and bile acid excretion. Food Funct. 2025, 16, 1830–1846. [Google Scholar] [CrossRef] [Scilit]
- Gao, Y.; Liu, Y.; Li, Z.; Lu, L.; Guo, Y.; Su, D.; Zhang, H. Multi-strain probiotics attenuate carbohydrate-lipid metabolic dysregulation in type 2 diabetic rats via gut-liver axis modulation. mSystems 2025, 10, e0036925. [Google Scholar] [CrossRef] [Scilit]
- Li, X.; Suo, J.; Huang, X.; Dai, H.; Bian, H.; Zhu, M.; Lin, W.; Han, N. Whole grain qingke attenuates high-fat diet-induced obesity in mice with alterations in gut microbiota and metabolite profile. Front. Nutr. 2021, 8, 761727. [Google Scholar] [CrossRef] [Scilit]
- Scheithauer, T.P.M.; Rampanelli, E.; Nieuwdorp, M.; Vallance, B.A.; Verchere, C.B.; van Raalte, D.H.; Herrema, H. Gut microbiota as a trigger for metabolic inflammation in obesity and type 2 diabetes. Front. Immunol. 2020, 11, 571731. [Google Scholar] [CrossRef] [Scilit] [PubMed]
- Liu, D.; Zhang, S.; Li, S.; Zhang, Q.; Cai, Y.; Li, P.; Li, H.; Shen, B.; Liao, Q.; Hong, Y.; et al. Indoleacrylic acid produced by parabacteroides distasonis alleviates type 2 diabetes via activation of AhR to repair intestinal barrier. BMC Biol. 2023, 21, 90. [Google Scholar] [CrossRef] [Scilit]
- Tzeng, H.; Lee, W. Impact of transgenerational nutrition on nonalcoholic fatty liver disease development: Interplay between gut microbiota, epigenetics and immunity. Nutrients 2024, 16, 1388. [Google Scholar] [CrossRef] [Scilit] [PubMed]
- Sonnenburg, J.L.; Backhed, F. Diet-microbiota interactions as moderators of human metabolism. Nature 2016, 535, 56–64. [Google Scholar] [CrossRef] [Scilit]
- Yan, J.; Wang, L.; Gu, Y.; Hou, H.; Liu, T.; Ding, Y.; Cao, H. Dietary patterns and gut microbiota changes in inflammatory bowel disease: Current insights and future challenges. Nutrients 2022, 14, 4003. [Google Scholar] [CrossRef] [Scilit] [PubMed]
- Wu, Z.; Gong, C.; Wang, B. The relationship between dietary index for gut microbiota and diabetes. Sci. Rep. 2025, 15, 6234. [Google Scholar] [CrossRef] [Scilit]
- Qu, H.; Yang, Y.; Xie, Q.; Ye, L.; Shao, Y. Linear association of the dietary index for gut microbiota with insulin resistance and type 2 diabetes mellitus in u.s. adults: The mediating role of body mass index and inflammatory markers. Front. Nutr. 2025, 12, 1557280. [Google Scholar] [CrossRef] [Scilit]
- Kase, B.E.; Liese, A.D.; Zhang, J.; Murphy, E.A.; Zhao, L.; Steck, S.E. The development and evaluation of a literature-based dietary index for gut microbiota. Nutrients 2024, 16, 1045. [Google Scholar] [CrossRef] [Scilit]
- Zheng, Y.; Hou, J.; Guo, S.; Song, J. The association between the dietary index for gut microbiota and metabolic dysfunction-associated fatty liver disease: A cross-sectional study. Diabetol. Metab. Syndr. 2025, 17, 17. [Google Scholar] [CrossRef] [Scilit]
- Shu, Y.; Hong, W.; Liu, J.; Zhu, X. Exploring the association of dietary index for gut microbiota with parkinson’s disease and depression: Insights from NHANES. J. Affect. Disord. 2025, 386, 119461. [Google Scholar] [CrossRef] [Scilit] [PubMed]
- Yang, Q.; Wu, X.; Duan, J.; Chen, Y.; Yang, T. Inflammatory parameters mediates the relationship between dietary index for gut microbiota and frailty in middle-aged and older adults in the united states: Findings from a large-scale population-based study. Front. Nutr. 2025, 12, 1553467. [Google Scholar] [CrossRef] [Scilit] [PubMed]
- Zhang, J.; Guo, J.; Zhang, J.; Liu, H.; Zhou, L.; Cheng, C.; Cao, H. The mediating role of biological age in the association between dietary index for gut microbiota and sarcopenia. Front. Immunol. 2025, 16, 1552525. [Google Scholar] [CrossRef] [Scilit]
- Zhang, X.; Yang, Q.; Huang, J.; Lin, H.; Luo, N.; Tang, H. Association of the newly proposed dietary index for gut microbiota and depression: The mediation effect of phenotypic age and body mass index. Eur. Arch. Psychiatry Clin. Neurosci. 2025, 275, 1037–1048. [Google Scholar] [CrossRef] [Scilit]
- Li, X.; Liu, Y.; Shen, C.; Shao, C.; Jiang, H. Association of dietary index for gut microbiota with frailty in middle-aged and older americans: A cross-sectional study and mediation analysis. Front. Nutr. 2025, 12, 1615386. [Google Scholar] [CrossRef] [Scilit]
- Ozcan, S.; Erhan, B. Prevalence of metabolic syndrome among individuals with spinal cord injury: A cross-sectional analysis. Cureus 2025, 17, e86420. [Google Scholar] [CrossRef] [Scilit] [PubMed]
- Liu, Z.; Kuo, P.; Horvath, S.; Crimmins, E.; Ferrucci, L.; Levine, M. A new aging measure captures morbidity and mortality risk across diverse subpopulations from NHANES IV: A cohort study. PLoS Med. 2018, 15, e1002718. [Google Scholar] [CrossRef] [Scilit]
- Chen, L.; Zhao, Y.; Liu, F.; Chen, H.; Tan, T.; Yao, P.; Tang, Y. Biological aging mediates the associations between urinary metals and osteoarthritis among U.S. adults. BMC Med. 2022, 20, 207. [Google Scholar] [CrossRef] [Scilit]
- Liu, H.; Xu, X.; Yao, Z.; Kang, J.; Shen, Y.; Liu, W. Association between the dietary index for gut microbiota and metabolic syndrome in adults: The mediating role of body mass index. Front. Nutr. 2025, 12, 1598664. [Google Scholar] [CrossRef] [Scilit] [PubMed]
- Miao, M.; Qiao, S.; Pan, W.; Xia, Z.; Li, W.; Lin, C. Association between the dietary index for gut microbiota and atherosclerotic cardiovascular disease risk among US elderly adults: A cross sectional study. Nutr. J. 2025, 24, 77. [Google Scholar] [CrossRef] [Scilit]
- Zeng, Q.; Xiao, C.; Zeng, X.; Cao, G.; Liu, G.; Wu, J.; Lin, X.; Deng, W.; Luo, J. Association between dietary index for gut microbiota and hypertension: A large cross-sectional study from NHANES. BMJ Nutr. Prev. Health 2025, 8, e001163. [Google Scholar] [CrossRef] [Scilit]
- Jiang, J.; Liu, Y.; Yang, H.; Ma, Z.; Liu, W.; Zhao, M.; Peng, X.; Qin, X.; Xia, Y. Dietary fiber intake, genetic predisposition of gut microbiota, and the risk of metabolic dysfunction-associated steatotic liver disease. Food Res. Int. 2025, 211, 116497. [Google Scholar] [CrossRef] [Scilit]
- Liu, J.; Huang, S. Association between the dietary index for gut microbiota and alzheimer’s disease: A cross-sectional study from the national health and nutrition examination survey (2004 to 2018). Alzheimers Dement. 2025, 17, e70170. [Google Scholar] [CrossRef] [Scilit]
- Liu, J.; Huang, S. Association between dietary index for gut microbiota and sleep duration in US adults: A cross-sectional study. Curr. Res. Microb. Sci. 2025, 9, 100412. [Google Scholar] [CrossRef] [Scilit] [PubMed]
- Song, J.; Fu, J. Association between dietary index for gut microbiota and osteoarthritis in the US population: The mediating role of systemic immune-inflammation index. Front. Nutr. 2025, 12, 1543674. [Google Scholar] [CrossRef] [Scilit] [PubMed]
- White, I.R.; Royston, P.; Wood, A.M. Multiple imputation using chained equations: Issues and guidance for practice. Stat. Med. 2011, 30, 377–399. [Google Scholar] [CrossRef] [Scilit] [PubMed]
- Beesley, L.J.; Bondarenko, I.; Elliot, M.R.; Kurian, A.W.; Katz, S.J.; Taylor, J.M. Multiple imputation with missing data indicators. Stat. Methods Med. Res. 2021, 30, 2685–2700. [Google Scholar] [CrossRef] [Scilit]
- Geirnaert, A.; Calatayud, M.; Grootaert, C.; Laukens, D.; Devriese, S.; Smagghe, G.; De Vos, M.; Boon, N.; Van De Wiele, T. Butyrate-producing bacteria supplemented in vitro to crohn’s disease patient microbiota increased butyrate production and enhanced intestinal epithelial barrier integrity. Sci. Rep. 2017, 7, 11450. [Google Scholar] [CrossRef] [Scilit]
- Hussain, T.; Murtaza, G.; Kalhoro, D.H.; Kalhoro, M.S.; Metwally, E.; Chughtai, M.I.; Mazhar, M.U.; Khan, S.A. Relationship between gut microbiota and host-metabolism: Emphasis on hormones related to reproductive function. Anim. Nutr. 2021, 7, 1–10. [Google Scholar] [CrossRef] [Scilit]
- Jia, W.; Xie, G.; Jia, W. Bile acid-microbiota crosstalk in gastrointestinal inflammation and carcinogenesis. Nat. Rev. Gastroenterol. Hepatol. 2018, 15, 111–128. [Google Scholar] [CrossRef] [Scilit]
- Murase, T.; Haramizu, S.; Shimotoyodome, A.; Nagasawa, A.; Tokimitsu, I. Green tea extract improves endurance capacity and increases muscle lipid oxidation in mice. Am. J. Physiol. Regul. Integr. Comp. Physiol. 2005, 288, R708–R715. [Google Scholar] [CrossRef] [Scilit] [PubMed]
- Zaiou, M.; Joubert, O. Racial and ethnic disparities in NAFLD: Harnessing epigenetic and gut microbiota pathways for targeted therapeutic approaches. Biomolecules 2025, 15, 669. [Google Scholar] [CrossRef] [Scilit]
- Wang, D.D.; Nguyen, L.H.; Li, Y.; Yan, Y.; Ma, W.; Rinott, E.; Ivey, K.L.; Shai, I.; Willett, W.C.; Hu, F.B.; et al. The gut microbiome modulates the protective association between a mediterranean diet and cardiometabolic disease risk. Nat. Med. 2021, 27, 333–343. [Google Scholar] [CrossRef] [Scilit] [PubMed]
- Bragazzi, N.L.; Woldegerima, W.A.; Siri, A. Economic microbiology: Exploring microbes as agents in economic systems. Front. Microbiol. 2024, 15, 1305148. [Google Scholar] [CrossRef] [Scilit]
- Phillips, E.; Zobrist, S.; Milner, E.M.; Kung’u, J.K.; Heidkamp, R.A.; Benedict, R.K. Nutrition intervention coverage and inequities along the continuum of care: Results from the eighth demographic and health survey in six sub-saharan african countries. Matern. Child. Nutr. 2025, 22, e70085. [Google Scholar] [CrossRef] [Scilit]
- Mackessy, J.A.; Thompson, A.L.; Bentley, P.E.; Hoke, M.K.; Woods Barr, A.L.; Wasser, H.M. The impact of labor mismatch on achieving breastfeeding goals among non-hispanic black women in north carolina. Am. J. Biol. Anthropol. 2025, 188, e70115. [Google Scholar] [CrossRef] [Scilit] [PubMed]
- Wei, N.; Quan, Z.; Zhao, T.; Yu, X.; Xie, Q.; Zeng, J.; Ma, F.-K.; Wang, F.; Tang, Q.-S.; Wu, H.; et al. Chronic stress increases susceptibility to food addiction by increasing the levels of DR2 and MOR in the nucleus accumbens. Neuropsychiatr. Dis. Treat. 2019, 15, 1211–1229. [Google Scholar] [CrossRef] [Scilit]
- Niu, Y.; Xiao, L.; Feng, L. Association between dietary index for gut microbiota and metabolic syndrome risk: A cross-sectional analysis of NHANES 2007–2018. Sci. Rep. 2025, 15, 15153. [Google Scholar] [CrossRef] [Scilit] [PubMed]
- Kimura, I.; Ozawa, K.; Inoue, D.; Imamura, T.; Kimura, K.; Maeda, T.; Terasawa, K.; Kashihara, D.; Hirano, K.; Tani, T.; et al. The gut microbiota suppresses insulin-mediated fat accumulation via the short-chain fatty acid receptor GPR43. Nat. Commun. 2013, 4, 1829. [Google Scholar] [CrossRef] [Scilit]
- Canfora, E.E.; Jocken, J.W.; Blaak, E.E. Short-chain fatty acids in control of body weight and insulin sensitivity. Nat. Rev. Endocrinol. 2015, 11, 577–591. [Google Scholar] [CrossRef] [Scilit]
- Wahlstrom, A.; Sayin, S.I.; Marschall, H.; Backhed, F. Intestinal crosstalk between bile acids and microbiota and its impact on host metabolism. Cell Metab. 2016, 24, 41–50. [Google Scholar] [CrossRef] [Scilit]
- Chen, J.; Wang, M.; Zhang, P.; Li, H.; Qu, K.; Xu, R.; Guo, N.; Zhu, H. Cordycepin alleviated metabolic inflammation in western diet-fed mice by targeting intestinal barrier integrity and intestinal flora. Pharmacol. Res. 2022, 178, 106191. [Google Scholar] [CrossRef] [Scilit]
- Smith, P.M.; Howitt, M.R.; Panikov, N.; Michaud, M.; Gallini, C.A.; Bohlooly-Y, M.; Glickman, J.N.; Garrett, W.S. The microbial metabolites, short-chain fatty acids, regulate colonic treg cell homeostasis. Science 2013, 341, 569–573. [Google Scholar] [CrossRef] [Scilit]
- Liu, T.; Cao, Y.; Liang, N.; Ma, X.; Fang, J.; Zhang, X. Investigating the causal association between gut microbiota and type 2 diabetes: A meta-analysis and Mendelian randomization. Front. Public Health 2024, 12, 134. [Google Scholar] [CrossRef] [Scilit] [PubMed]

Disclaimer/Publisher’s Note: The statements, opinions and data contained in all publications are solely those of the individual author(s) and contributor(s) and not of MDPI and/or the editor(s). MDPI and/or the editor(s) disclaim responsibility for any injury to people or property resulting from any ideas, methods, instructions or products referred to in the content. |
© 2026 by the authors. Licensee MDPI, Basel, Switzerland. This article is an open access article distributed under the terms and conditions of the Creative Commons Attribution (CC BY) license.