1. Introduction
Obesity is characterized by excessive fat mass and expansion of adipose tissue resulting from adipocyte hyperplasia and hypertrophy, which cause weight gain and pose health risks [
1]. The World Health Organization defines obesity as a body mass index (BMI) (weight (kg)/height (m)
2) of 30 or above for adults. Recent data indicate that abdominal obesity is a cardiovascular risk factor independent of BMI. Abdominal obesity is measured by the waist-to-weight index, which takes both weight and waist circumference into account. Therefore, obesity can no longer be evaluated solely by BMI, as it represents a heterogeneous condition [
2].
Since the 1970s, the prevalence of obesity has increased across all age groups, reaching epidemic proportions globally and becoming a significant health and economic burden [
3]. Currently, about 650 million adults and 340 million children and adolescents are affected by obesity. Notably, obesity has a higher incidence among women and older age groups.
Obesity is a well-established risk factor for the development of cardiovascular disease and type 2 diabetes mellitus. More recently, it has also emerged as a strong independent risk factor for the development and progression of chronic kidney disease (CKD) and end-stage renal disease (ESRD) [
4].
CKD is defined as abnormalities in kidney structure or function that persist for at least three months, leading to irreversible nephron loss, progression to ESRD, and increased risk of cardiovascular disease. It is classified based on underlying cause, glomerular filtration rate category, and albuminuria category [
5]. This complex disease affects about 13% of the global population, yet only 6% of those affected are aware of their CKD status. This low level of awareness is due to the disease’s asymptomatic nature in its early stages. Clinical symptoms appear in advanced stages when treatment options are limited. This highlights the importance of increasing physician awareness and promoting early detection and treatment to slow disease progression and prevent complications [
6].
Obesity-related CKD is clinically characterized by proteinuria, glomerulomegaly, progressive glomerulosclerosis, and reduced kidney function [
7]. Although the exact mechanisms by which obesity contributes to nephropathy are not fully understood, several potential mechanisms have been proposed. These include hemodynamic disorders leading to increased glomerular pressure, renal tissue hypoxia, insulin resistance (IR), and activation of the renin–angiotensin–aldosterone system [
7].
Given that obesity itself is a risk factor for the development of CKD, the aim of this paper is to present the incidence of obese patients in a typical nephrology clinic setting.
3. Results
In this study, 3033 participants were included: 1675 (55.3%) women and 1358 (44.8%) men. The overall median age was 60 years (IQR 23), with 1876 (61.9%) participants under 65 years of age. The overall median BMI was 28.0 kg/m
2 (IQR 8.2). There were 98 (3.23%) participants who were underweight (BMI under 18.5 kg/m
2), 808 (26.64%) with normal BMI (18.5–24.9 kg/m
2), 1004 (33.1%) who were overweight (BMI 25–29.9 kg/m
2), 923 (30.43%) who were obese (BMI 30–39.9 kg/m
2), and 200 (6.6%) with class III obesity (BMI over 40 kg/m
2). The overall median fat mass was 23.4 kg (IQR 16.5), with a median fat mass percentage of 28% (IQR 13). Detailed descriptive data are presented in
Table 1.
3.1. Differences in Age Groups
In further analysis, participants were divided by age into two groups: those under 65 years and those 65 years and older. Of the total, 1157 (38.2%) participants were 65 years and older. Among these, 597 (51.6%) were women, while in the group under 65 years, there were slightly more women (1078, 57.5%). When comparing overall BMI values, there was no statistically significant difference between the two groups (28.0 vs. 28.0, p = 0.38). However, those under 65 years had a significantly higher prevalence in the underweight, normal, and obese categories (4.1%, 27.8%, and 39.2% vs. 1.9%, 24.7%, and 33.5%, p < 0.001 for all, respectively), while the overweight category was significantly more prevalent among those 65 years and older (39.8% vs. 28.9%, p < 0.001).
Additionally, fat mass was significantly higher in those under 65 years (24.0 vs. 22.8 kg,
p < 0.001), while there was no significant difference in fat mass percentage between the groups (28.0% vs. 27.8%,
p = 0.208). Fat-free mass was also significantly higher in those under 65 years (61.2 vs. 58.5,
p < 0.001), as was the percentage of muscle mass (58.1% vs. 55.6%,
p < 0.001). Phase angle values were consistently higher in those under 65 years (5.6 vs. 4.9,
p < 0.001). All detailed data are presented in
Supplementary Table S2.
Participants were also stratified into seven age categories: 18–24 years (206; 6.8%), 25–34 years (188; 6.2%), 35–44 years (287; 9.5%), 45–54 years (468; 15.4%), 55–64 years (727; 24.0%), 65–74 years (821; 27.1%), and ≥75 years (336; 11.1%).
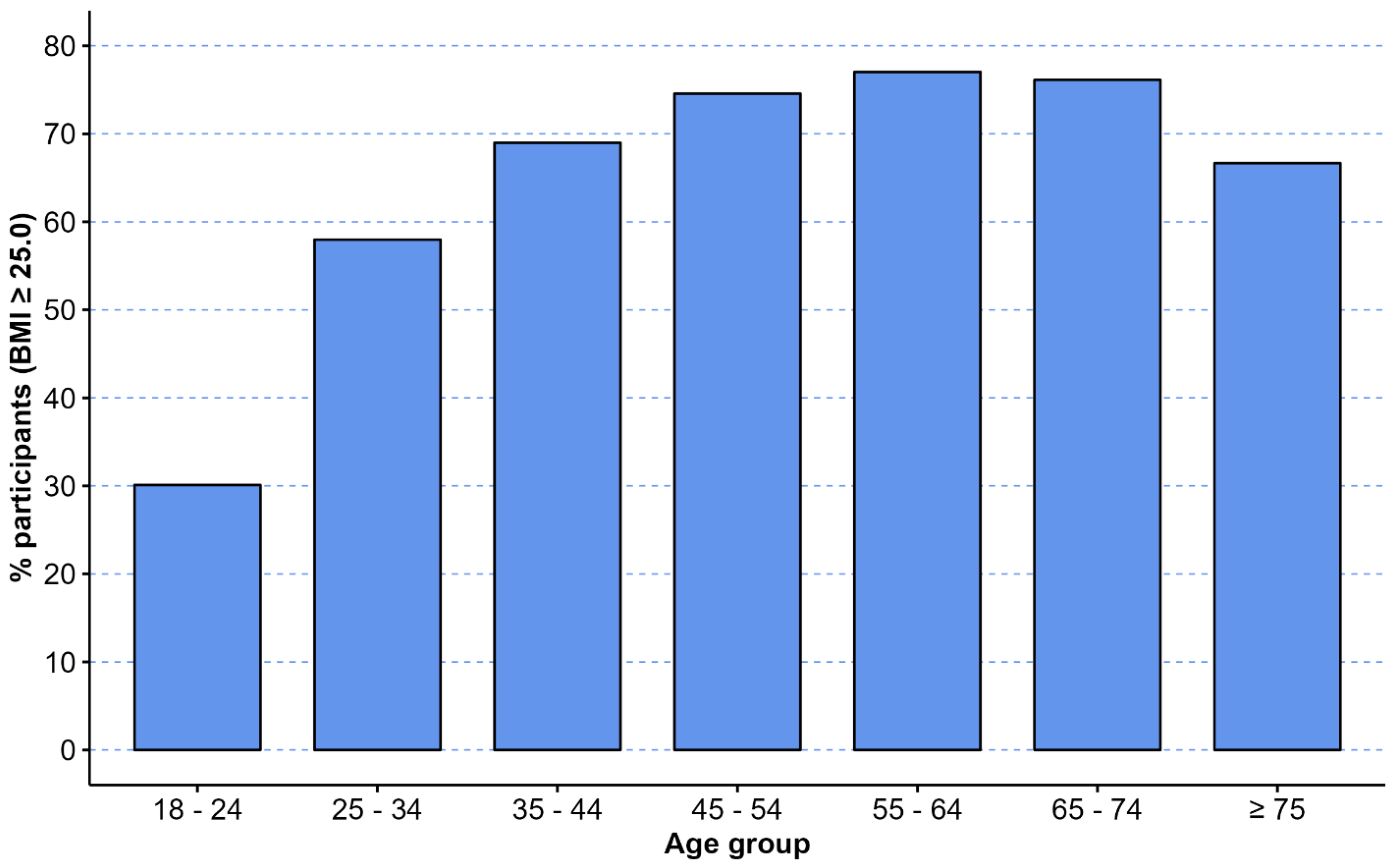
Figure 1 shows the prevalence of overweight and obesity (BMI ≥ 25.0 kg/m
2) across age groups. The proportion of individuals with excess body weight increased sharply with age, rising from 30% among those aged 18–24 years to nearly 70% in the 35–44-year group. The prevalence peaked at 75–78% in the 55–64 and 65–74-year groups, before declining slightly to around 67% in participants aged 75 years and older. Overall, overweight and obesity are most prevalent in middle-aged and older adults, with the burden peaking in the sixth and seventh decades of life before modestly decreasing in the oldest age group.
3.2. Differences in BMI Groups with Distribution of Age and Body Composition Analysis
To further analyze differences regarding BMI, firstly participants were divided in two groups with a cut-off BMI being 25. Those with a BMI of 25 or higher were more numerous (2127 vs. 906) and significantly older than those with a BMI below 25 (61 vs. 56 years,
p < 0.001), with a higher proportion of patients over 65 years old (39.9% vs. 34%;
p = 0.002). All body composition parameters were consistently higher in those with a BMI over 25. Over the study years, individuals with higher BMI became more prevalent in later years (2022–2024), reaching peak prevalence in 2024 (638; 30%), while lower BMI values were more common in earlier years (2016–2019). Furthermore, participants were also divided into four groups (underweight, normal, overweight and obese) according to BMI values as previously specified. Those in normal, overweight and obese group were significantly older as opposed to those in underweight group (
p < 0.001). All body composition parameters significantly increased from underweight to obese group (
p < 0.001 for all parameters, respectively). All detailed data is presented in
Supplementary Table S3.
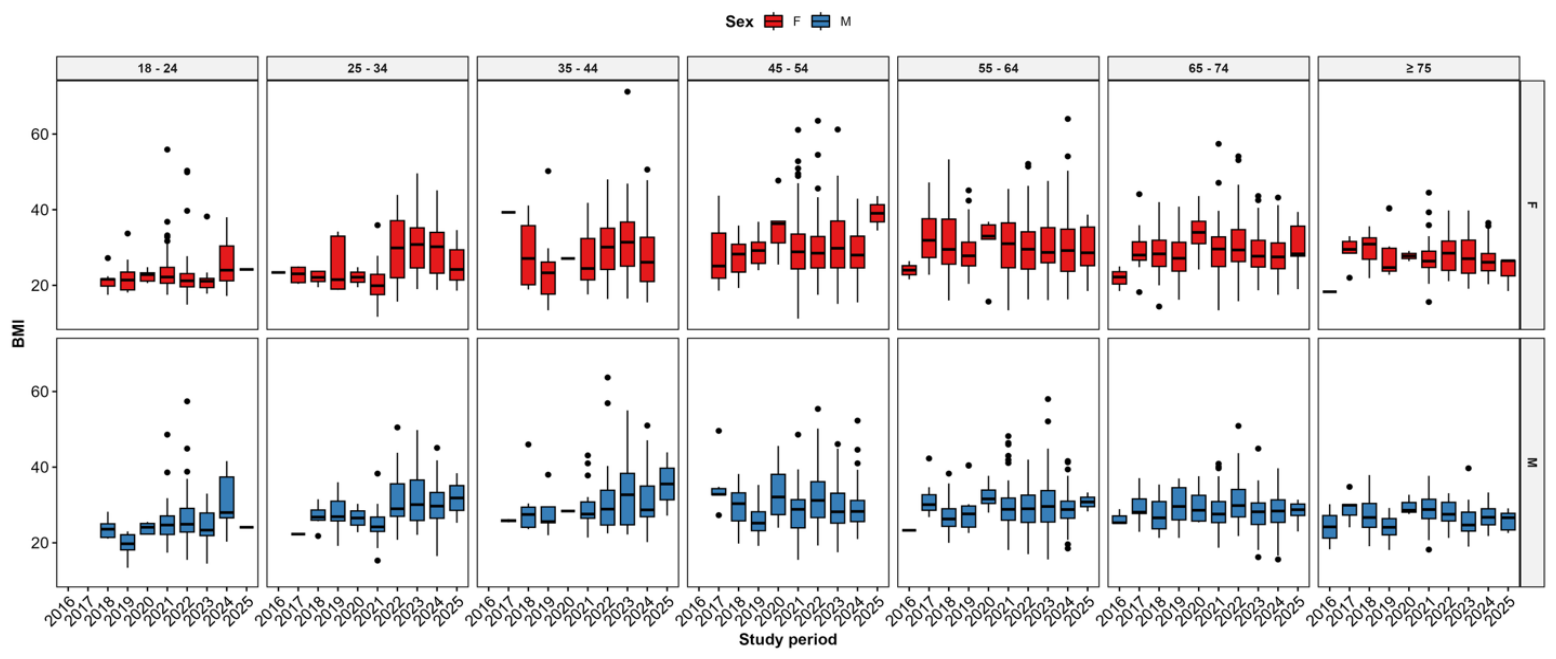
To further present the differences in BMI from 2016 to 2025, participants were stratified by sex and age group. In both sexes, BMI increased with advancing age, with the greatest variability observed in the 35–54 year groups. Among younger adults (18–24 years), median BMI values remained within the normal range, although men showed a more pronounced upward trend than women. In middle-aged participants (35–54 years), BMI distributions widened, with obesity (BMI ≥ 30) more frequently observed in women. In older adults (≥65 years), BMI values stabilized, with medians generally in the overweight range but with narrower interquartile ranges compared with middle-aged groups. Across nearly all age categories, women displayed higher variability in BMI than men, particularly in recent years. Detailed BMI stratification according to sex and age groups can be seen in
Figure 2.
3.3. Differences in Age, BMI, and Body Composition Parameters in Participants Before 2020, During 2020–2023, and After 2023
Participants were furthermore divided according to period in which they were measured as follows—pre-COVID (before 2020), COVID (2020–2023) and post-COVID (after 2023) period. Of total participants, 506 (16.68%) were included in pre-COVID period, 1091 (35.97%) in COVID period, and the highest proportion of participants (1436; 47.35%) were included in post-COVID period.
Median age varied across study periods, with significantly lower age during COVID (57 years) compared with pre-COVID and post-COVID periods (both 61 years, p < 0.001). This reflected a higher proportion of participants < 65 years during COVID period (67.1%), while the prevalence of older participants (≥65 years) increased in post-COVID period (41.6%). Stratified age groups confirmed this trend, with younger groups (18–54 years) being more common in COVID period, and older groups (≥65 years) predominating after 2023 (p < 0.001).
Median weight and BMI increased significantly over time, from 80.3 kg and 26.95 kg/m2 in pre-COVID period to 85.9 kg and 28.3 kg/m2 in COVID period and remaining elevated in post-COVID with 85.0 kg and 28.0 kg/m2 (p < 0.001). The prevalence of overweight (BMI ≥ 25) rose steadily, affecting 64.2% in pre-COVID period and 72.6% in post-COVID period (p = 0.004). As well, obesity (BMI ≥ 30) was more frequent during COVID period compared with pre-COVID period (40.05% vs. 31.03%, p = 0.001).
For body composition, median fat mass increased significantly from 19.6 kg before 2020 to 24.7 kg after 2023 (
p < 0.001), and fat percentage rose from 24.6% to 29.1% (
p < 0.001). Fat-free mass showed no significant changes across the pre-COVID, COVID, or post-COVID periods (60.7 kg vs. 60.6 kg vs. 59.5 kg,
p = 0.081). Phase angle declined significantly in the post-COVID period compared to pre-COVID and COVID periods (5.2 vs. 5.5 and 5.5,
p < 0.001). Detailed analysis is presented in
Supplementary Table S4.
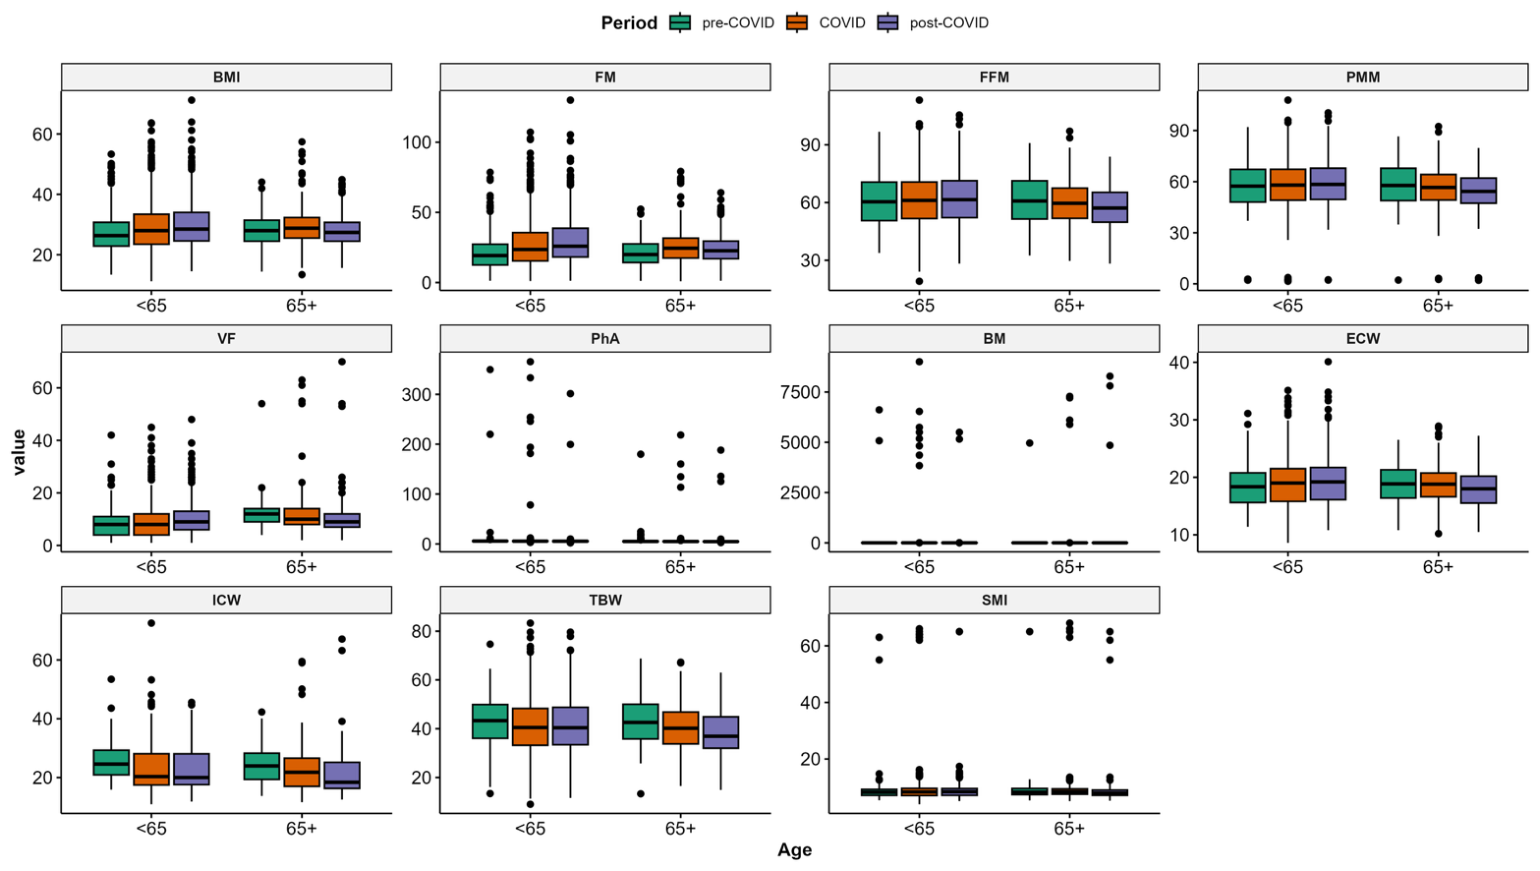
When trends were compared between those younger than 65 years of age, and 65 and older, no major temporal shifts were observed across the pre-COVID, COVID, and post-COVID periods. However, among participants aged <65, a slight post-COVID increase in BMI and FM, as well as a small decline in ICW and PhA were observed. Detailed analysis is shown in
Figure 3.
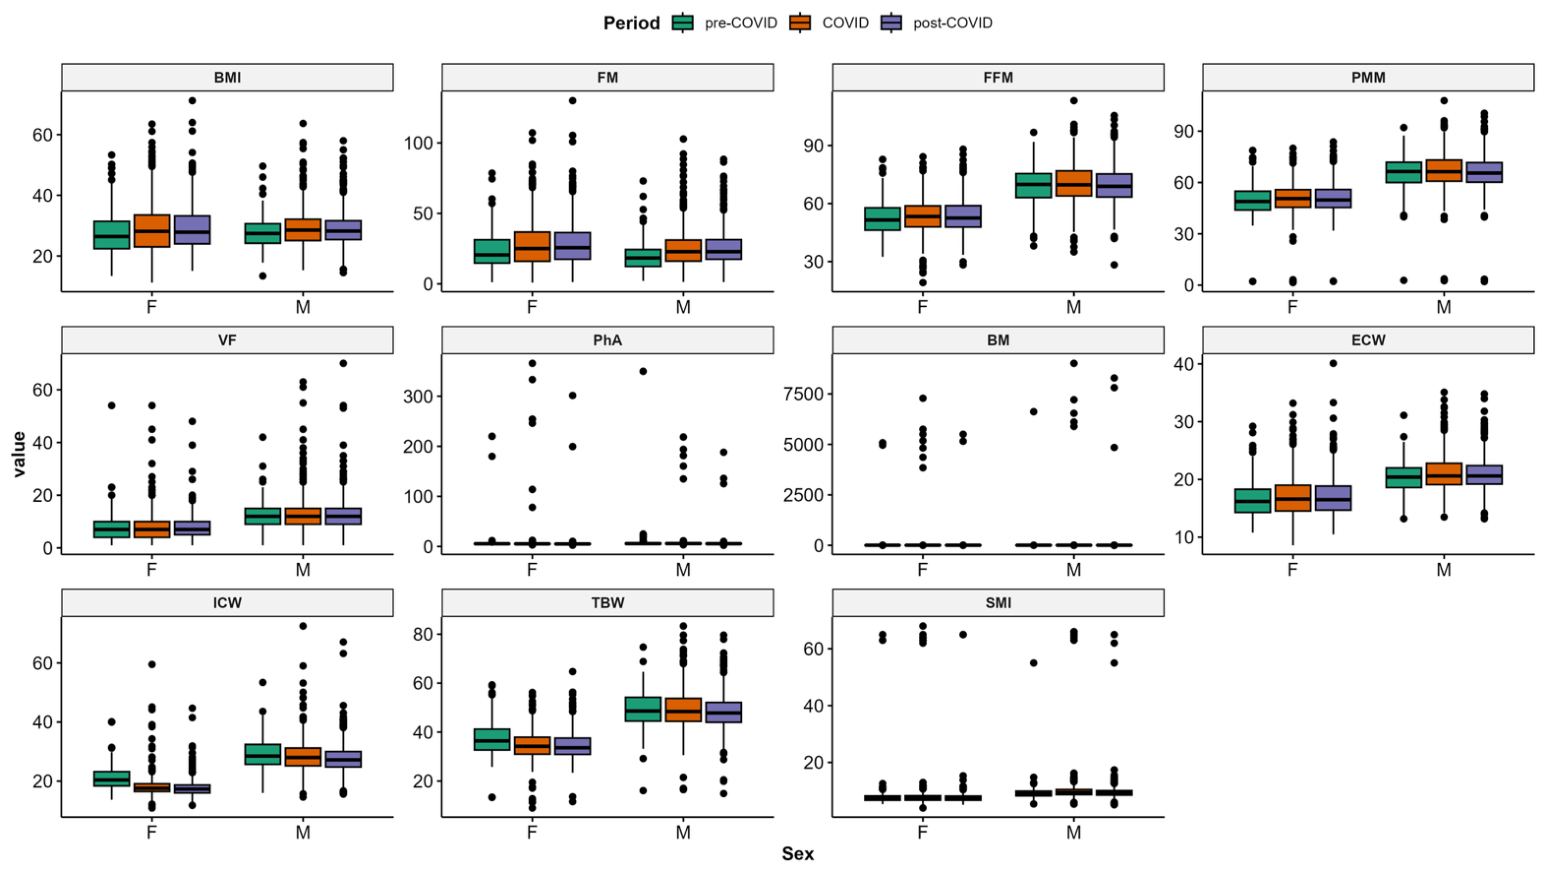
Across the three time periods, trends were relatively stable for both sexes. However, a small post-COVID increase in BMI and FM was observed in both males and females while FFM, PMM, and SMI did not show notable declines. More details are shown in
Figure 4.
4. Discussion
Our study included 3033 participants with a median age of 60 years and a slightly higher proportion of women. The median BMI was 28.0 kg/m
2, reflecting an overall overweight population, with 33% overweight and 37% obese, including 6.6% with class III obesity. This high prevalence of overweight and obesity is even higher than that of the general Croatian adult population, according to 2022 data, where the prevalence of obesity was 23% and overweight was 41.7% [
10]. In comparison with international cohorts, the prevalence of overweight and obesity observed in our study appears notably high. Similar patterns have been described in several European countries, particularly in Central and Eastern Europe, where obesity rates tend to be higher than those reported in Northern Europe [
11,
12]. These differences are likely influenced by lifestyle habits, dietary patterns, socioeconomic factors, and physical activity levels [
11,
12]. In Asian populations, obesity prevalence is generally lower when traditional BMI cut-offs are used; however, studies have shown that individuals from Asian populations often develop metabolic complications at lower BMI values due to increased visceral fat accumulation [
13,
14]. This further highlights the limitations of BMI alone and supports the importance of body composition assessment in evaluating cardiometabolic risk [
11,
12,
13,
14].
When it comes to sex differences, our population showed higher prevalence of obesity in women which is in contrast to the general Croatian population [
10]. Women also had higher prevalence of underweight compared to men which is in contrast to previously published data on the healthy Croatian population. Sex differences in adipose tissue are linked to obesity, with women generally having a higher percentage of body fat but storing it in subcutaneous adipose tissue, which may reduce the risk of metabolic diseases. Postmenopausal women experience a sharp increase in obesity-related metabolic diseases. Traditionally, these differences were attributed to sex hormones such as estrogen and testosterone. However, large-scale genome-wide association studies (GWAS) have identified numerous obesity-associated genes, suggesting a complex interplay between genetic loci and endocrine signals. Emerging evidence supports multifactorial regulation, in which sex-specific genetic variants interact dynamically with hormonal environments to influence fat distribution, energy metabolism, and disease susceptibility [
15]. Unfortunately, data on receiving obesity treatment in our study were not available, so we cannot compare it. However, recent literature shows disparities in being offered weight loss interventions, with women more likely to be offered therapy for weight loss than men [
16].
When discussing age-related differences, this study found that participants aged 65 years and younger had higher absolute fat mass, higher fat-free mass, and a higher percentage of muscle mass, despite having similar fat mass percentages. Sarcopenia is common in older populations, with contributing factors including aging, early developmental effects, poor diet, bed rest or a sedentary lifestyle, chronic illnesses, and certain medications. It is a health condition with significant personal costs, including mobility issues, increased risk of fractures and falls, difficulty performing daily tasks, impairments, loss of independence, and a higher risk of death [
17]. Several pathophysiological mechanisms have been proposed to explain sarcopenic obesity. A recent one is the concept of myosteatosis, also known as the metabaging cycle. The metabaging cycle is a self-perpetuating loop in which transient or local hyperlipidemia leads to lipid spillover into skeletal muscle, resulting in myosteatosis, mitochondrial dysfunction, lipotoxicity, insulin resistance, and chronic low-grade inflammation. This inflammation-driven lipid and metabolic dysfunction further amplifies insulin resistance and lipotoxicity, creating a vicious cycle that contributes to sarcopenic obesity [
18]. The age-related changes observed in our cohort are also in line with findings from other European and Asian studies [
12,
17]. Aging is commonly associated with progressive accumulation of visceral fat together with gradual loss of skeletal muscle mass and strength, even in individuals whose body weight remains relatively stable. In recent years, phase angle obtained by bioelectrical impedance analysis has attracted increasing attention as a marker of cellular health, nutritional status, frailty, and mortality risk. Therefore, the significant reduction in phase angle observed in the post-COVID period in our study may reflect broader deterioration in functional and metabolic health rather than simple anthropometric changes alone [
17,
19,
20,
21].
Regarding age-related trends, our study results indicate that the prevalence of overweight and obesity increases with age, rising from 30% in young adults (18–24 years) to nearly 70% in the 35–44-year group, and peaking at 75–78% in those aged 55–74 years. Interestingly, we found that the absolute fat mass was higher in participants under 65 years old, but there was no difference in fat mass percentage. Additionally, fat-free mass and muscle mass were also higher in this age group. The increase in body fat with age is not uniform. Studies have shown a more central distribution of visceral fat and upper body subcutaneous fat in the elderly compared to total body fat. Fat mass increases linearly with age up to a point, after which it begins to decline. There is a greater rise in visceral fat than subcutaneous fat in elderly males and females compared to younger individuals [
22]. Fat redistribution can occur independently of changes in total adiposity, body weight, or waist circumference. Excessive fat deposition also occurs within the visceral area, liver, heart, muscle, and bone marrow with increasing age [
23].
When it comes to differences across study periods, during the COVID period, participants were significantly younger than those in the pre- and post-COVID periods. Median BMI increased from 26.95 kg/m2 pre-COVID to 28.3 kg/m2 during COVID and remained elevated post-COVID (28.0 kg/m2, p < 0.001). Obesity prevalence also rose from 31% pre-COVID to 40% during COVID (p = 0.001). Median fat mass increased significantly from before 2020 to after 2023, while fat-free mass remained stable. Importantly, phase angle declined significantly post-COVID.
These results highlight the indirect effects the pandemic had on multiple aspects of life. For example, shopping habits were impacted by the lockdown, buying patterns were disrupted by the COVID-19 epidemic and the requirement for social distancing and self-isolation, and there were changes in eating habits and physical activity [
24,
25].
As an example of changes in dietary habits and physical activity during the COVID-19 period, a previous regional study reported both favorable and unfavorable lifestyle modifications. Positive changes included more frequent home cooking and increased consumption of fruits, vegetables, homemade meals, and water intake. However, adverse trends were also observed, such as reduced fish consumption and increased intake of sweets and salty snacks. In addition, increased daily food consumption combined with reduced physical activity contributed to weight gain among participants [
26].
Results from the retrospective study conducted in Japan showed no change in the distribution of weight changes regarding the COVID-19 lockdown, but they did find more frequent exercising and increased alcohol consumption in the post-lockdown period [
27].
On the other hand, a study of more than 30,000 participants in Massachusetts found that a higher proportion of women gained weight during the lockdown period, and obesity rates among women also increased compared to men. Spanish and Brazilian Portuguese speakers had 25% and 22% higher odds of experiencing ≥5% weight gain compared to English speakers, and overweight prevalence was highest among Hispanic men and Haitian women [
28]. Another important thing to notice is the reduction in phase angle as a novel cardiovascular risk prognostic marker [
29] and a marker that has been shown as prognostic indicator of mortality and complications in hospitalized COVID-19 patients [
30].
Future research should increasingly focus on novel biomarkers that could improve early detection and risk stratification in obesity and sarcopenic obesity. While anthropometric measures and bioelectrical impedance analysis remain practical and widely available tools, they cannot fully capture the complex biological mechanisms underlying obesity-related complications. Recently, growing attention has been directed toward epigenetic mechanisms, including DNA methylation, histone modifications, and obesity-related microRNAs. These processes are involved in the regulation of adipogenesis, inflammation, insulin resistance, and metabolic aging. Importantly, epigenetic alterations may partly explain why individuals with similar BMI values can have markedly different metabolic risk profiles. In the future, such biomarkers could potentially help identify high-risk individuals earlier and guide more personalized therapeutic approaches [
31,
32].
Another emerging area of interest is the role of extracellular vesicles (EVs), including exosomes released from adipose tissue, skeletal muscle, and immune cells. These vesicles act as mediators of intercellular communication by transporting proteins, lipids, and genetic material such as microRNAs. Recent evidence suggests that EVs may contribute to chronic inflammation, endothelial dysfunction, and insulin resistance in obesity. Because they can be detected in blood samples, circulating EVs are increasingly being investigated as minimally invasive biomarkers for metabolic dysfunction, cardiovascular risk assessment, and monitoring of treatment response [
33].
Future advances in obesity assessment will likely involve combining traditional body composition methods with more advanced imaging techniques such as dual-energy X-ray absorptiometry (DEXA), computed tomography, and magnetic resonance imaging. These methods provide more detailed information about visceral adiposity, ectopic fat deposition, and muscle quality, including myosteatosis. In addition, integration of wearable technologies, digital health monitoring, and machine-learning-based predictive models may allow more individualized and longitudinal assessment of obesity-related risk in clinical practice [
34,
35].
This study has several limitations that should be acknowledged. First, because the research was conducted at a single university hospital outpatient clinic, the generalizability of the findings to broader populations may be limited. Second, the cross-sectional study design restricts the establishment of causal relationships between changes in body composition and factors such as aging or the COVID-19 pandemic. In addition, the study cohort consisted exclusively of patients receiving nephrology care, which may have introduced selection bias, as these individuals are more likely to have underlying health conditions affecting body composition.
A further limitation is the absence of clinically important nephrological parameters, including CKD stage, dialysis status, and routine monitoring indicators (such as serum urea, creatinine and blood pressure). Due to the study design, these variables were not included in the analysis, thereby limiting the possibility of performing stratified analyses. The study also lacked detailed information on lifestyle-related factors, including physical activity, dietary habits, socioeconomic status, medical history, and medication use, all of which may substantially influence body composition outcomes.
Moreover, no longitudinal follow-up was performed, preventing assessment of individual changes over time. Also, COVID-19 infection status, related complications and the need for treatment or hospitalization were not recorded, potentially missing an important confounding factor. Other potential confounders, such as comorbidities and hormonal differences, were also not fully accounted for.
Despite these limitations, the study’s large sample size of over 3000 participants provides valuable demographic insight into body composition trends in this population and serves as a solid foundation for future research.





 ,
,