


Abstract
The performance of a Proton Exchange Membrane Fuel Cell (PEMFC) stack is largely determined during assembly, where component materials, sealant selection, and clamping force jointly influence both sealing effectiveness and interfacial losses. These factors interact through coupled mechanical, thermal, and electrical phenomena. Although detailed multiphysics models can accurately capture these effects, their high computational cost limits their application in parametric analyses and optimisation studies. The Equivalent Stiffness Model (ESM) provides an efficient alternative, representing each stack component as a simplified stiffness formulation. Starting from an earlier ESM that reproduces the nonlinear compression of the Membrane Electrode Assembly (MEA) and sealants, this work adds the calculation of the electrical contact resistance at the Gas Diffusion Layer (GDL)–Bipolar Plate (BPP) interface and the resulting GDL porosity. Given the large number of input parameters, a Design of Experiments (DoE) approach systematically explores a wide range of stack configurations and operating conditions. The analysis shows that GDL type, sealant properties, and clamping force are the main drivers of assembly-related performance, whereas BPP material and thermo-hygrometric conditions become more influential during operation. These results provide quantitative guidance on which design and operating choices most strongly affect stack behaviour and under which conditions.
1. Introduction
Proton exchange membrane fuel cells (PEMFCs) present experimental challenges, making modelling an essential vehicle for technology development. To the authors’ knowledge, the pioneering models were created in the early 1990s by Bernardi and Verbrugge [1,2], Springer et al. [3] and Fuller and Newman [4], laying the foundation for the simulation of fuel cells’ working. The models have deeply evolved in the last three decades, helping to understand the phenomena that occur during the fuel cell’s operation through different approaches and scales [5]. After a delay of around 15 years, the first models (to the authors’ knowledge) that implemented the mechanical constraints at the component scale in the simulation were developed in the early 2000s [6,7], highlighting the importance of including the mechanical behaviour of the system. Mechanical modelling has likewise progressed, enabling analyses of stack assembly, single-component design and multiscale stress distributions [8]. Nevertheless, such models remain fewer than those centred on the electrochemical, transport and thermal aspects of PEMFCs, and the latter are often not coupled to the mechanical state of the system. This is due to the computational limitations when all of these different phenomena are included in a single numerical simulation, such as finite elements or computational fluid dynamics analysis, constraining the researchers to assume simplifications in the models or explore different strategies [5,8]. The Equivalent Stiffness Model (ESM) offers a convenient framework for capturing the mechanical response of complex assemblies through simplified yet physically consistent stiffness formulations, thereby reducing computational effort while retaining predictive capability. The principle is generally to represent every component by a constant equivalent stiffness within a network of springs combined in series and parallel simulating the PEMFC stack structure. This modelling strategy has also been exploited in the literature to investigate a variety of phenomena relevant to PEMFC operation [9,10,11,12]. Ahmad et al. used this approach to evaluate the stack’s performance [13]. In the authors’ previous work [14], an Equivalent Stiffness Model (ESM) was developed, integrating the nonlinear mechanical behaviour of the Membrane Electrode Assembly (MEA) components and sealants and simulating the assembly process of the entire stack. Some components, such as the End Plates (EPs), Insulator Plates (IPs), Current Collectors (CCs), washers and Bipolar Plates (BPPs), are described by a constant stiffness:
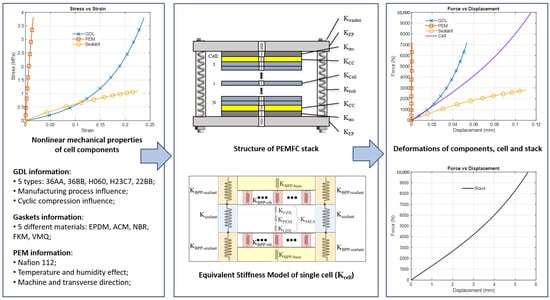
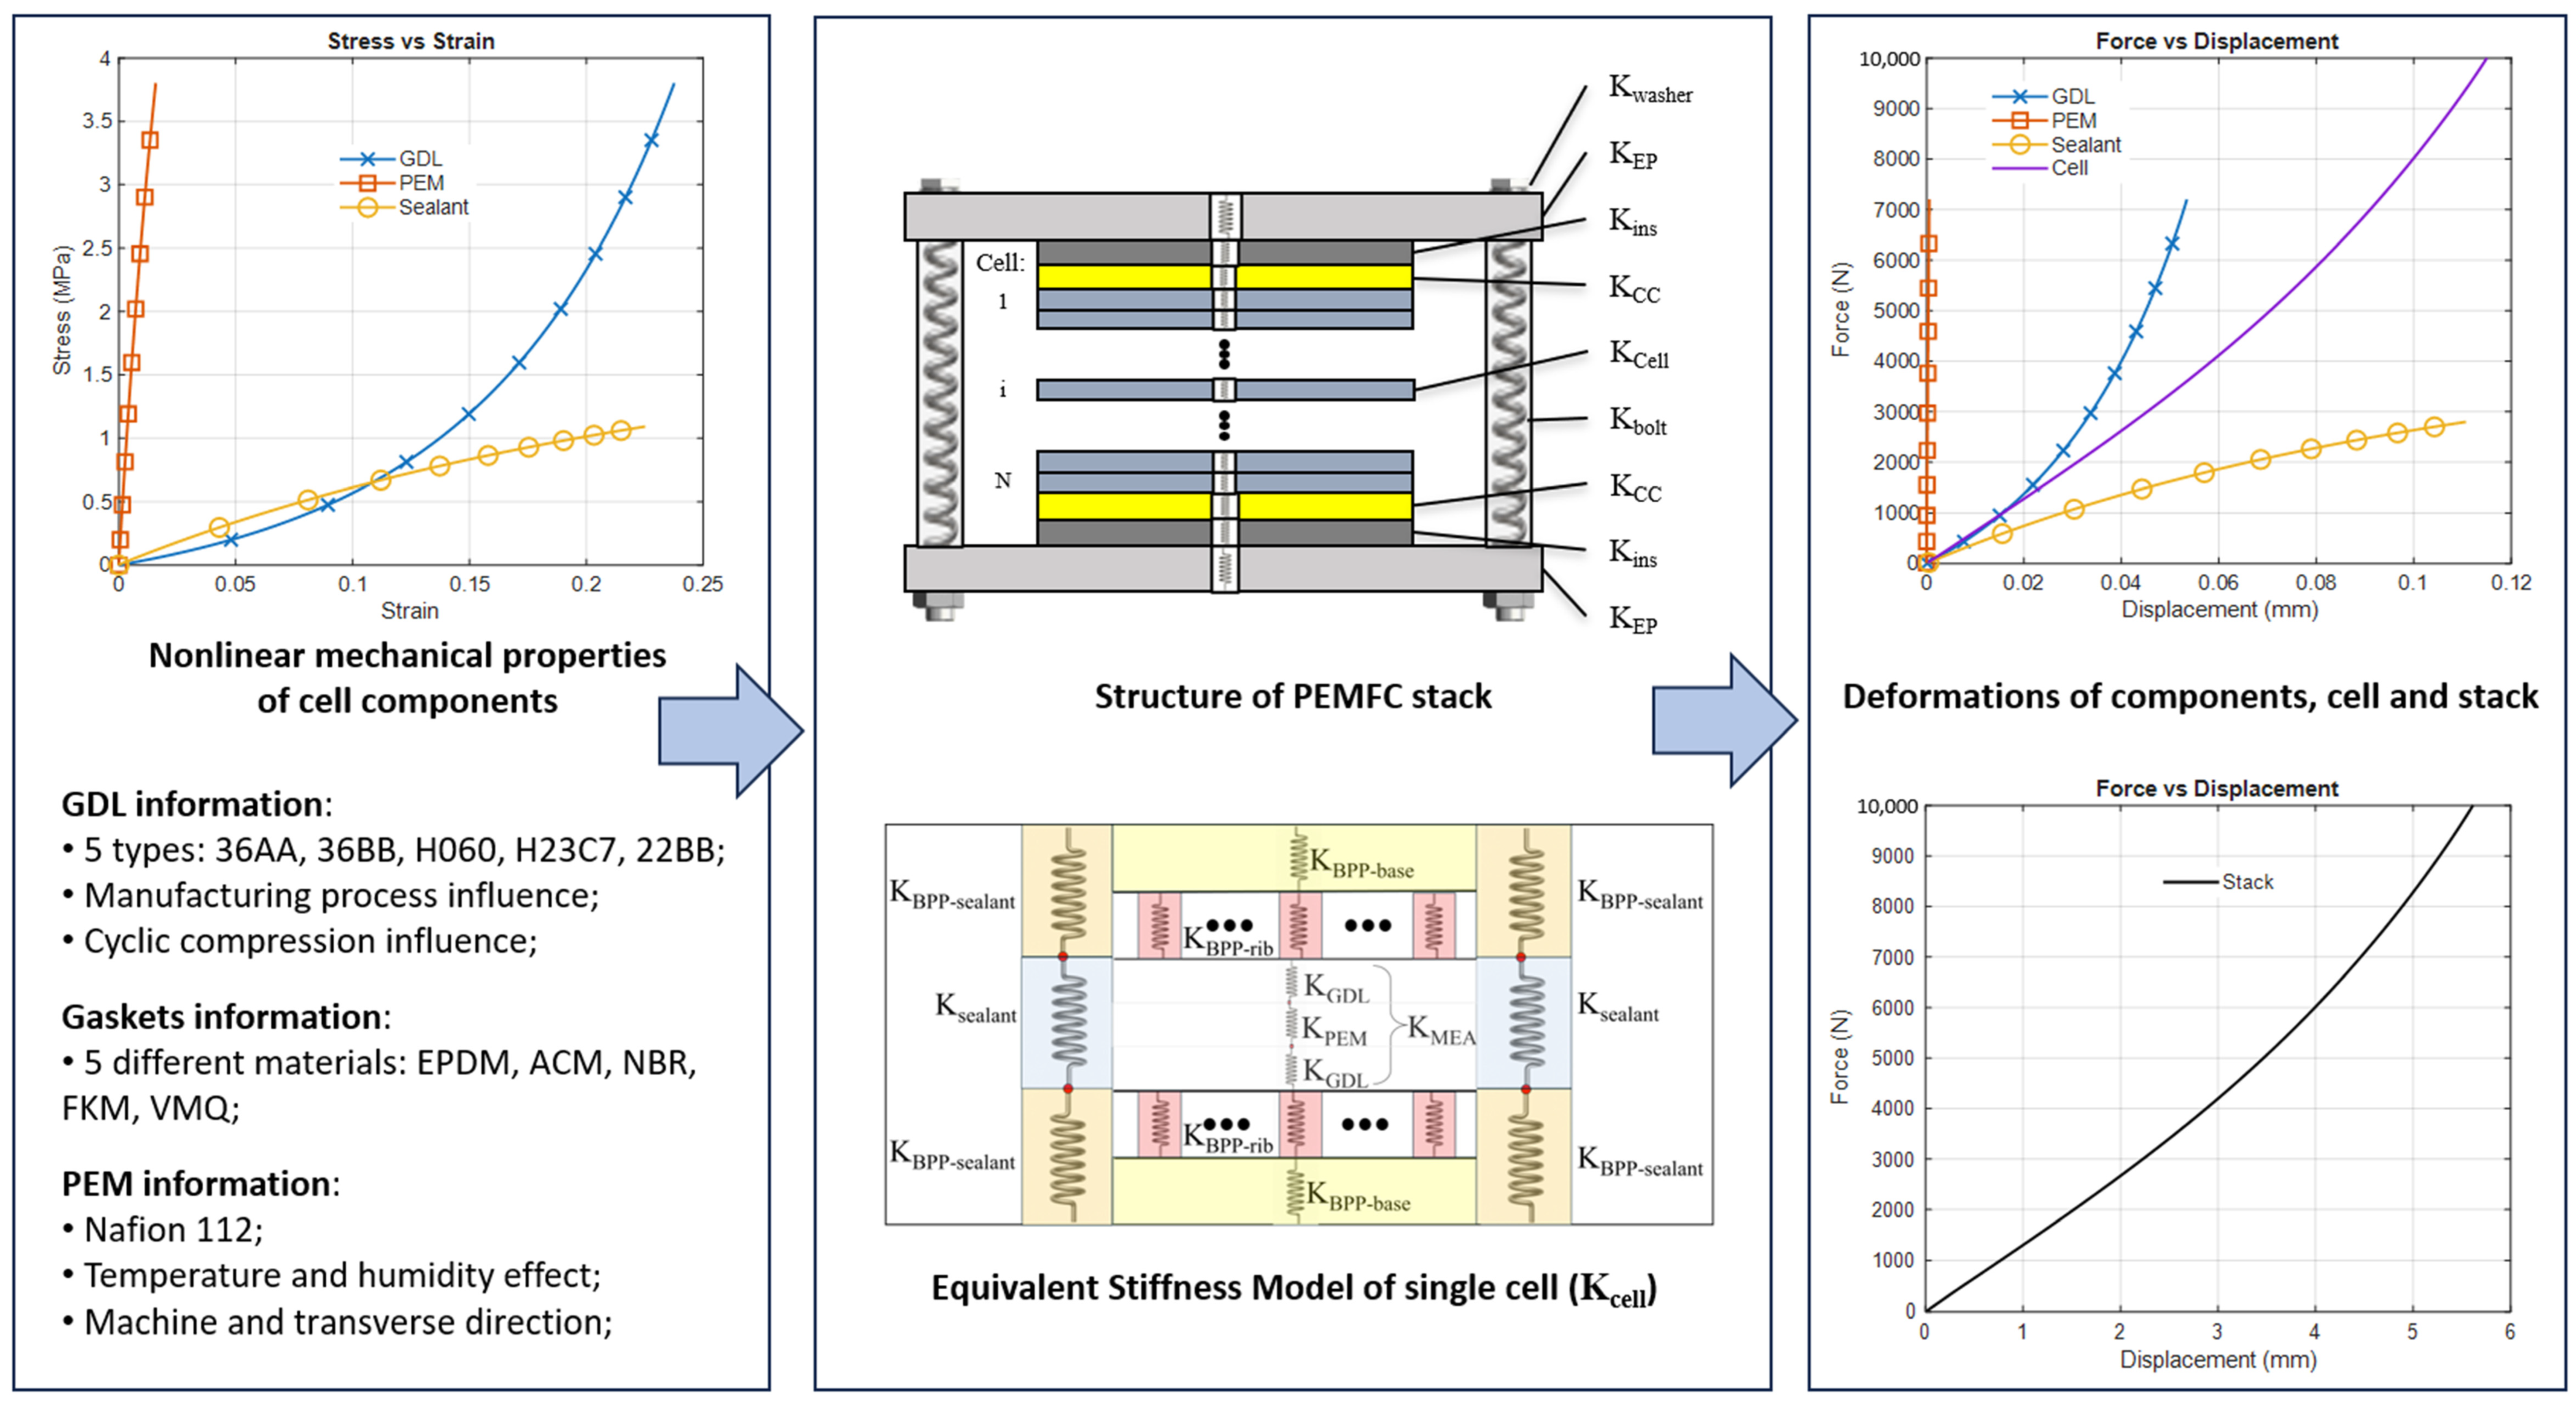
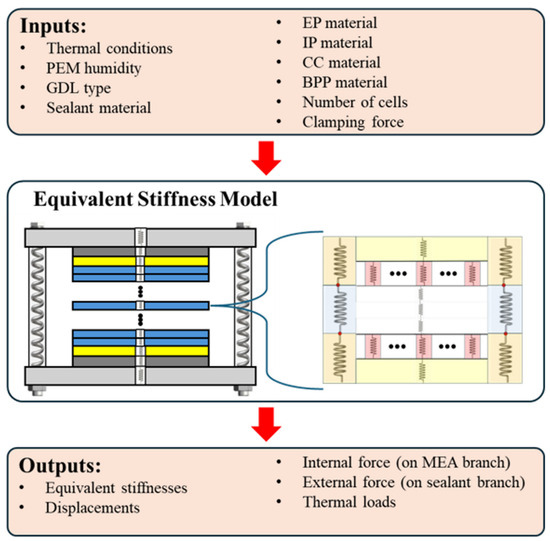
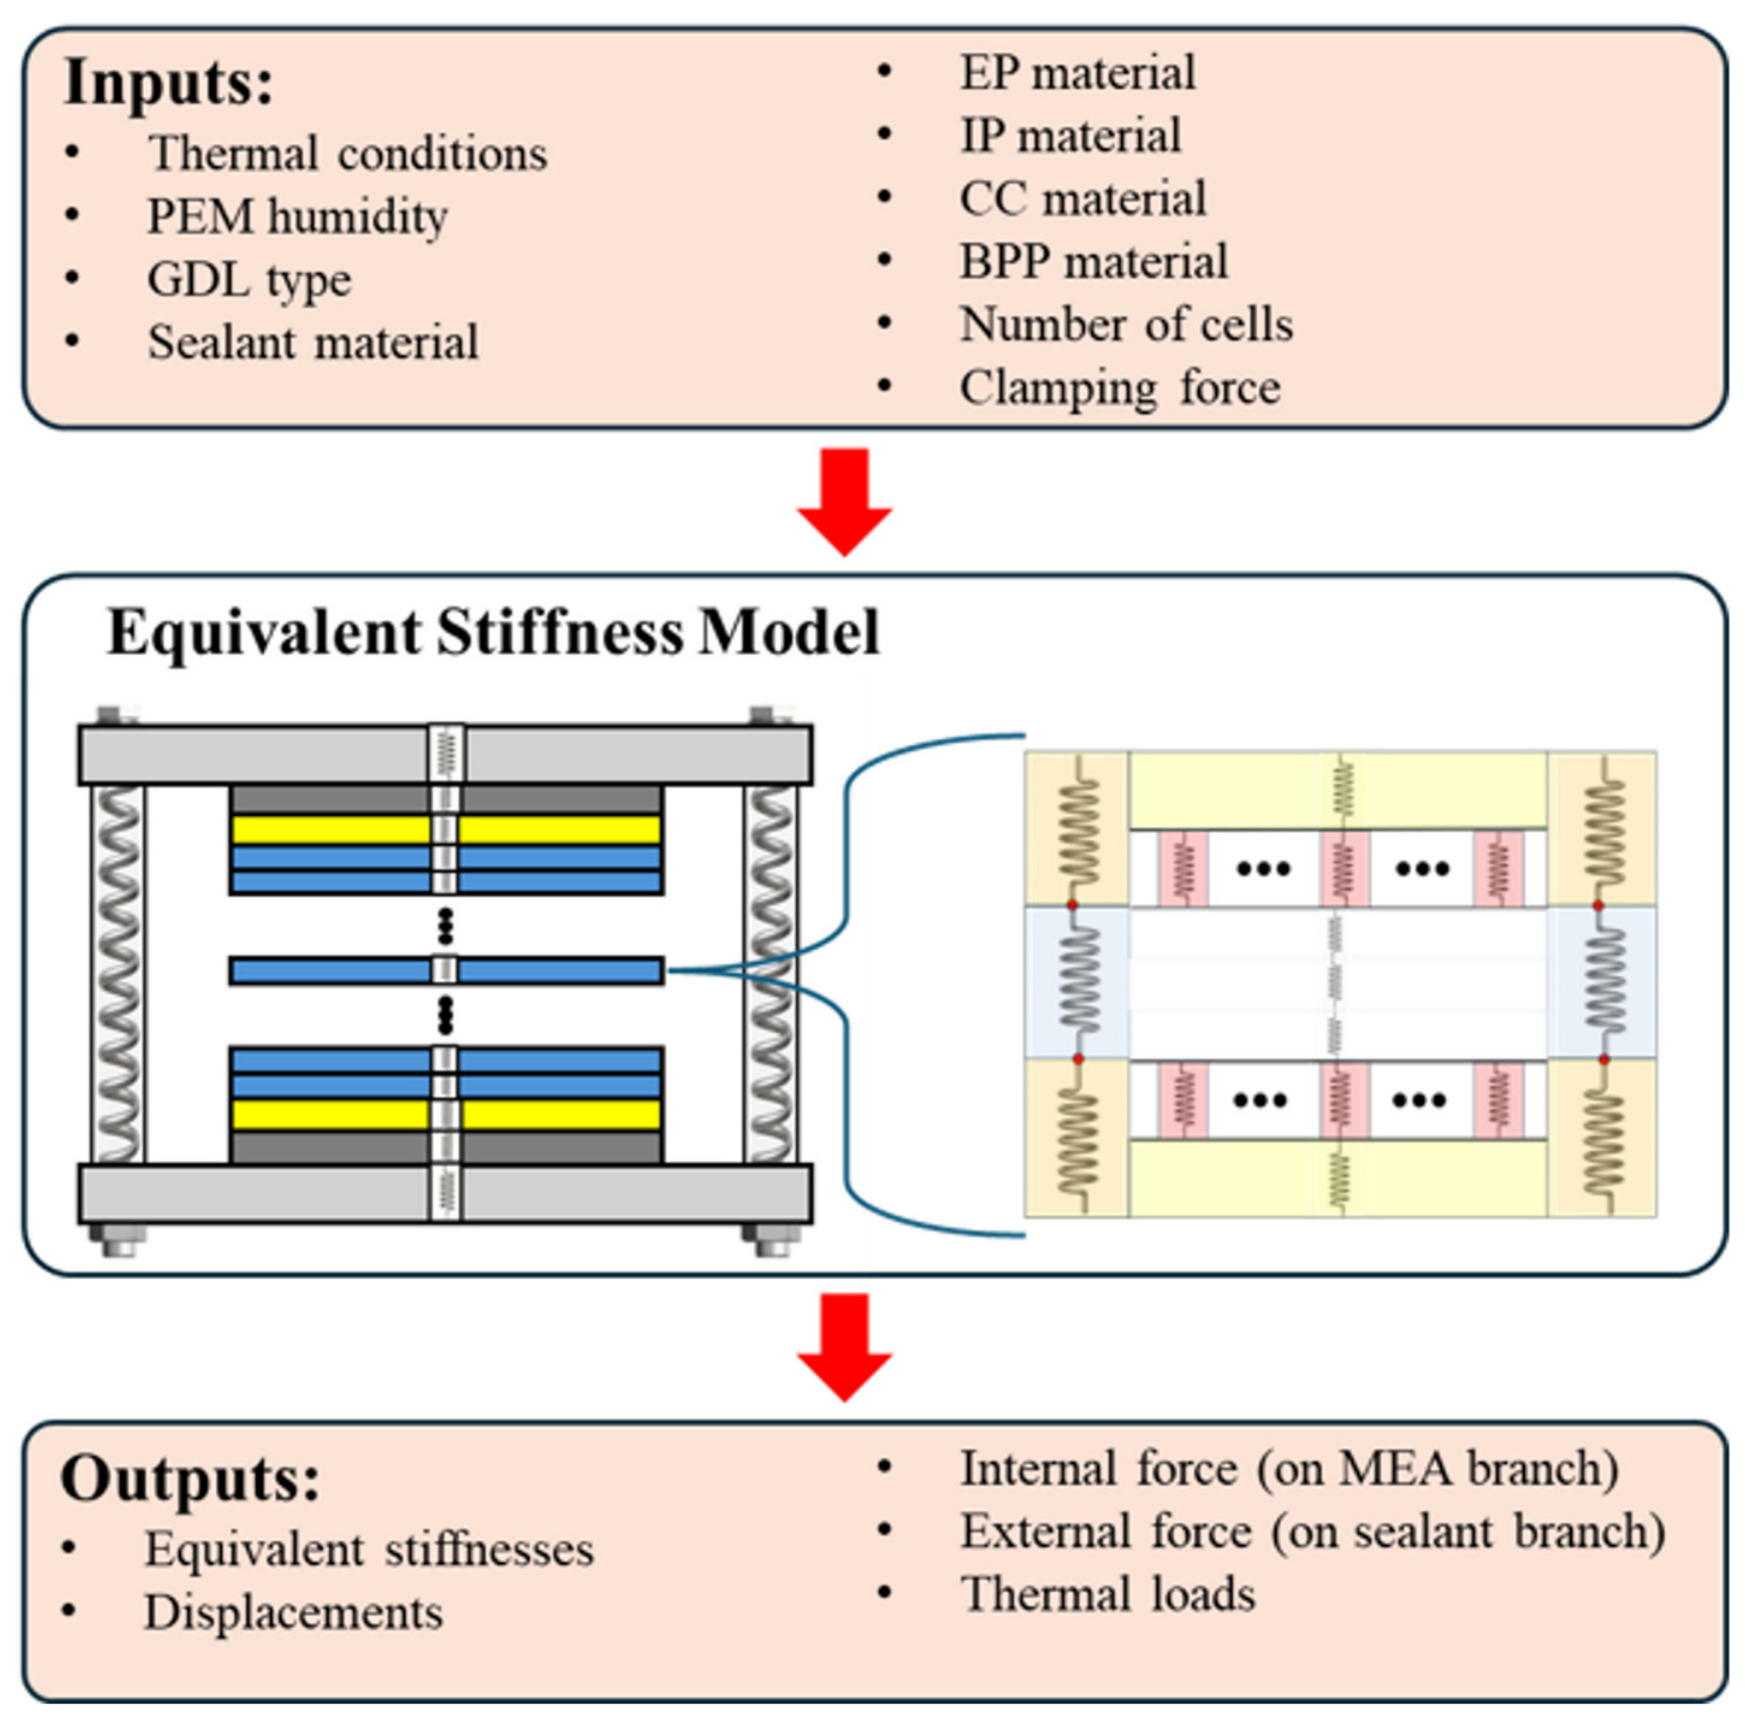
where E is the Young’s modulus, A is the cross-sectional area, and L is the thickness of the component. The Gas Diffusion Layer (GDL), the Proton Exchange Membrane (PEM) and the sealants follow nonlinear constitutive laws taken from the literature [15,16,17] and they are recast as a stress-dependent secant modulus at each increment. Since the PEM and sealant laws are not analytically invertible, the clamping force is applied incrementally and the Newton–Raphson approach is used to retrieve the strain. Once the assembly state is reached, the operating conditions are implemented as constrained linear thermal expansion of the components, hygroscopic swelling of the PEM, and the force exerted by the reactant gases. In brief, the ESM treats bolts in parallel with the stack, decomposes each cell into internal (PEM–GDL–BPP ribs) and external (sealant–BPP sealant) branches, where the internal and external forces are respectively applied, and updates component stiffness via a secant-modulus logic at each force increment (Figure 1). Furthermore, it allows for selecting several stack configurations to evaluate the impact of specific elements on the global state and produces a high amount of data. Figure 2 summarises the inputs and outputs of the ESM simulation from the previous study [14].
Figure 1.
Previously developed ESM [14].
Figure 2.
Inputs and outputs of the ESM simulation from a previous work [14]. GDL = Gas Diffusion Layer; PEM = Proton Exchange Membrane; EP = End Plate; IP = Insulator Plate; CC = Current Collector; BPP = Bipolar Plate.
In the ESM, the constitutive behaviour of the individual components is likewise described using experimentally derived material models: the GDL compression response follows the characterisation of Carral and Mélé [15,18], the PEM behaviour is based on the stress–strain measurements of perfluorosulfonic acid membranes reported by Kusoglu et al. [16], and the sealants are represented using the hyperelastic model identified by Cheon et al. [17].
The Equivalent Stiffness Model on which the present study builds was validated in [14] against a finite-element reference [19]. The constitutive and analytical models adopted in this work are all based on experimentally validated formulations available in the literature. The GDL-BPP electrical contact resistance is calculated using the analytical expression proposed by Marcelli et al. [20], developed from an experimental investigation of the pressure-contact resistance relationship and subsequent Design of Experiments analysis. The GDL porosity is evaluated through the geometric relationship proposed by Carral and Mélé [15], which relates porosity to the compressed GDL thickness using a compression law calibrated against experimental measurements for non-woven GDLs.
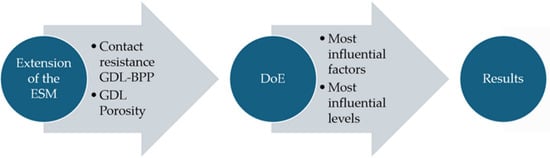
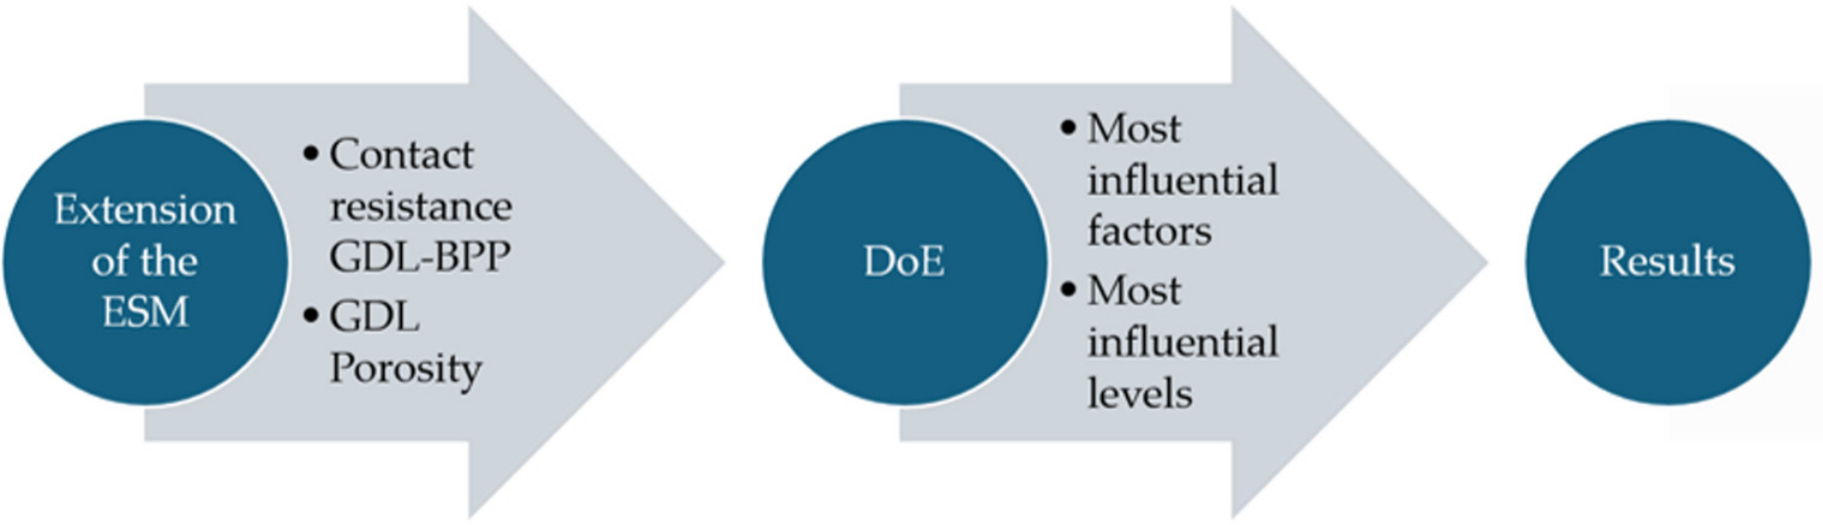
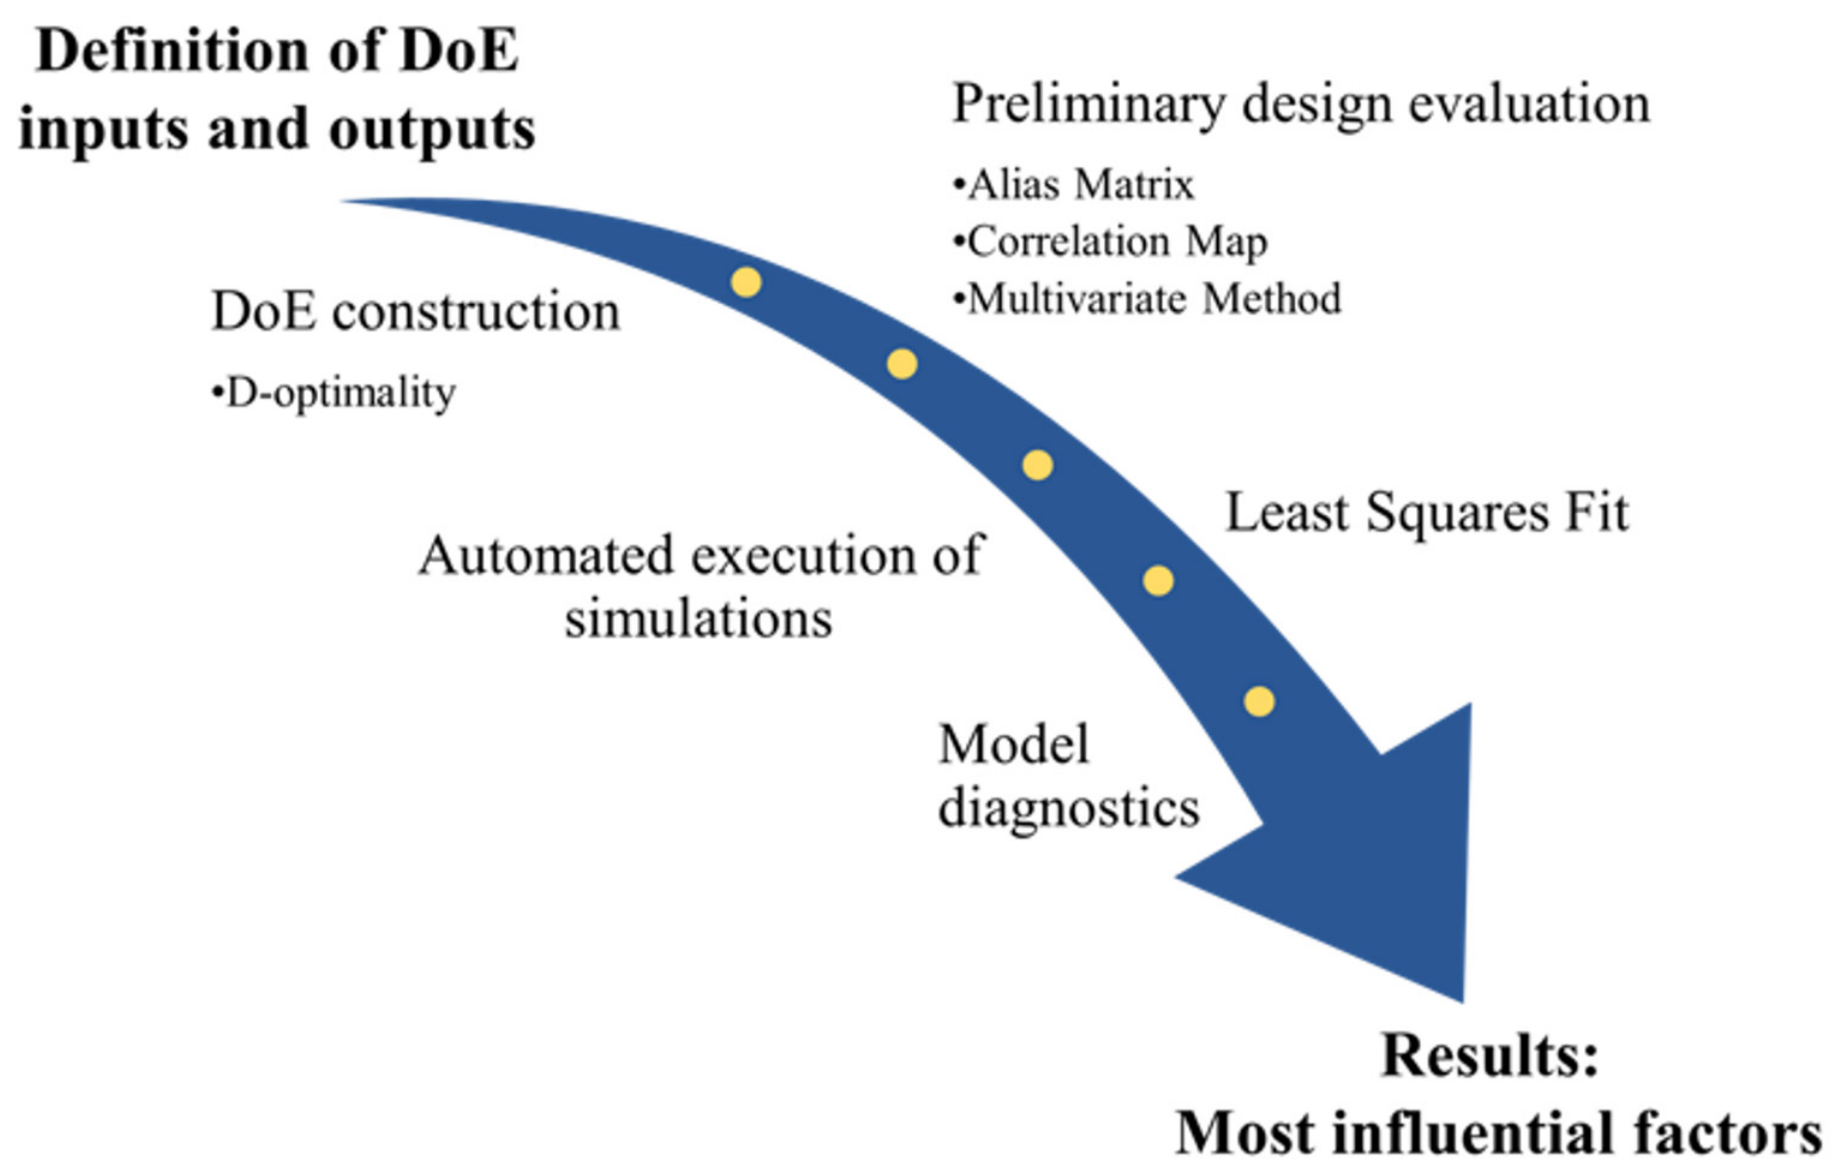
In this study, the ESM is extended to predict the effect of the mechanical compression on some parameters, such as the electrical contact resistance between the BPP and GDL and the GDL porosity. These parameters represent the primary mechanisms through which the mechanical state of an assembled PEMFC influences its electrochemical performance. The electrical contact resistance affects interfacial ohmic losses, whereas the GDL porosity influences reactant transport and consequently the concentration overpotential at high current densities. The relationship between these quantities and cell performance has been widely established in the literature [21]. Previous models have demonstrated the capability to predict these interactions. However, their high computational cost limits their application to a relatively small number of operating and assembly conditions [8]. The objective of the present work is to combine the ESM with a Design of Experiments (DoE) to systematically explore the design space and quantify the main and interaction effects of all factors on several responses (Figure 3).
Figure 3.
Workflow of the present study.
2. Materials and Methods
2.1. Parameters Affected by the Mechanical State of the Stack
Mechanical compression affects several parameters that are directly linked to PEMFC operation, and these have been implemented in the ESM to establish a connection between the mechanical state after assembly and the electrochemical phenomena during operation.
The first parameter is the electrical contact resistance, which is restricted to the GDL–BPP interface, as it is the most influential [21]. It is governed by the actual contact area created under clamping and thermal loading. As contact pressure increases, surface asperities deform, the real contact area grows, and the interfacial resistance falls. If over-compressed, local fibre damage or binder creep in the GDL can reverse this trend and cause a slight re-increase in resistance. Instead of using GDL-specific empirical laws, the general analytical expression developed by Marcelli et al. was adopted [20]:
where L0 GDL is the initial GDL thickness (µm), P is the pressure applied to the GDL (MPa) and Rc is the resulting electrical contact resistance (mΩ·cm2). Although the Microporous Layer (MPL) was not included as an explicit factor in the thickness-based model, in the present study, it is also applied to the MPL-coated GDLs (SIGRACET® 36BB and 22BB, SGL Carbon SE, Wiesbaden, Germany; H23C7, Freudenberg Performance Materials SE & Co. KG, Weinheim, Germany). This approximation leads to a systematic overestimation, as the presence of the MPL increases the real contact area with the BPP, thereby reducing the electrical contact resistance, with the effect becoming more pronounced at higher compression levels [20]. Consequently, Equation (2) is expected to overestimate the contact resistance of the coated GDLs. The impact of this assumption on the conclusions of the present study is limited by the characteristics of the investigated component set. The three MPL-coated GDLs are also the thickest materials considered and therefore exhibit the lowest contact resistance predicted by the thickness-based model. Accounting explicitly for the MPL would further reduce their contact resistance, increasing the separation from the uncoated GDLs rather than altering the overall ranking. Accordingly, the results for the coated GDLs should be interpreted as providing reliable trend information and factor ranking.
Finally, since the GDL porosity reduction increases tortuosity, impedes reactant transport, alters capillary behaviour, and modifies liquid-water pathways, all of which can precipitate additional mass-transport losses at higher current densities, it is implemented in the model [15]:
where Aw is the areal weight of the GDL sample (57 g/m2 for SIGRACET® 36AA (SGL Carbon SE, Wiesbaden, Germany), 103 g/m2 for 36BB, 86 g/m2 for TGP-H060 (Toray Industries, Inc., Tokyo, Japan), 134 g/m2 for H23C7, and 70 g/m2 for the 22BB [15,22]), ρf is the fibre density, (1.8 g/cm3 [23]), and LGDL is the GDL thickness during the compression.
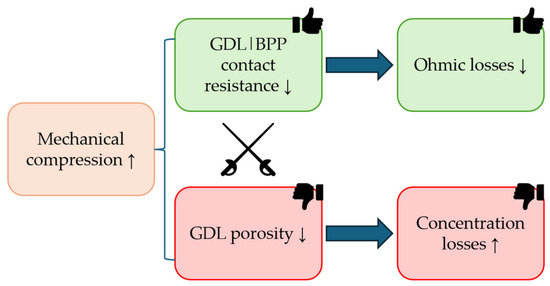
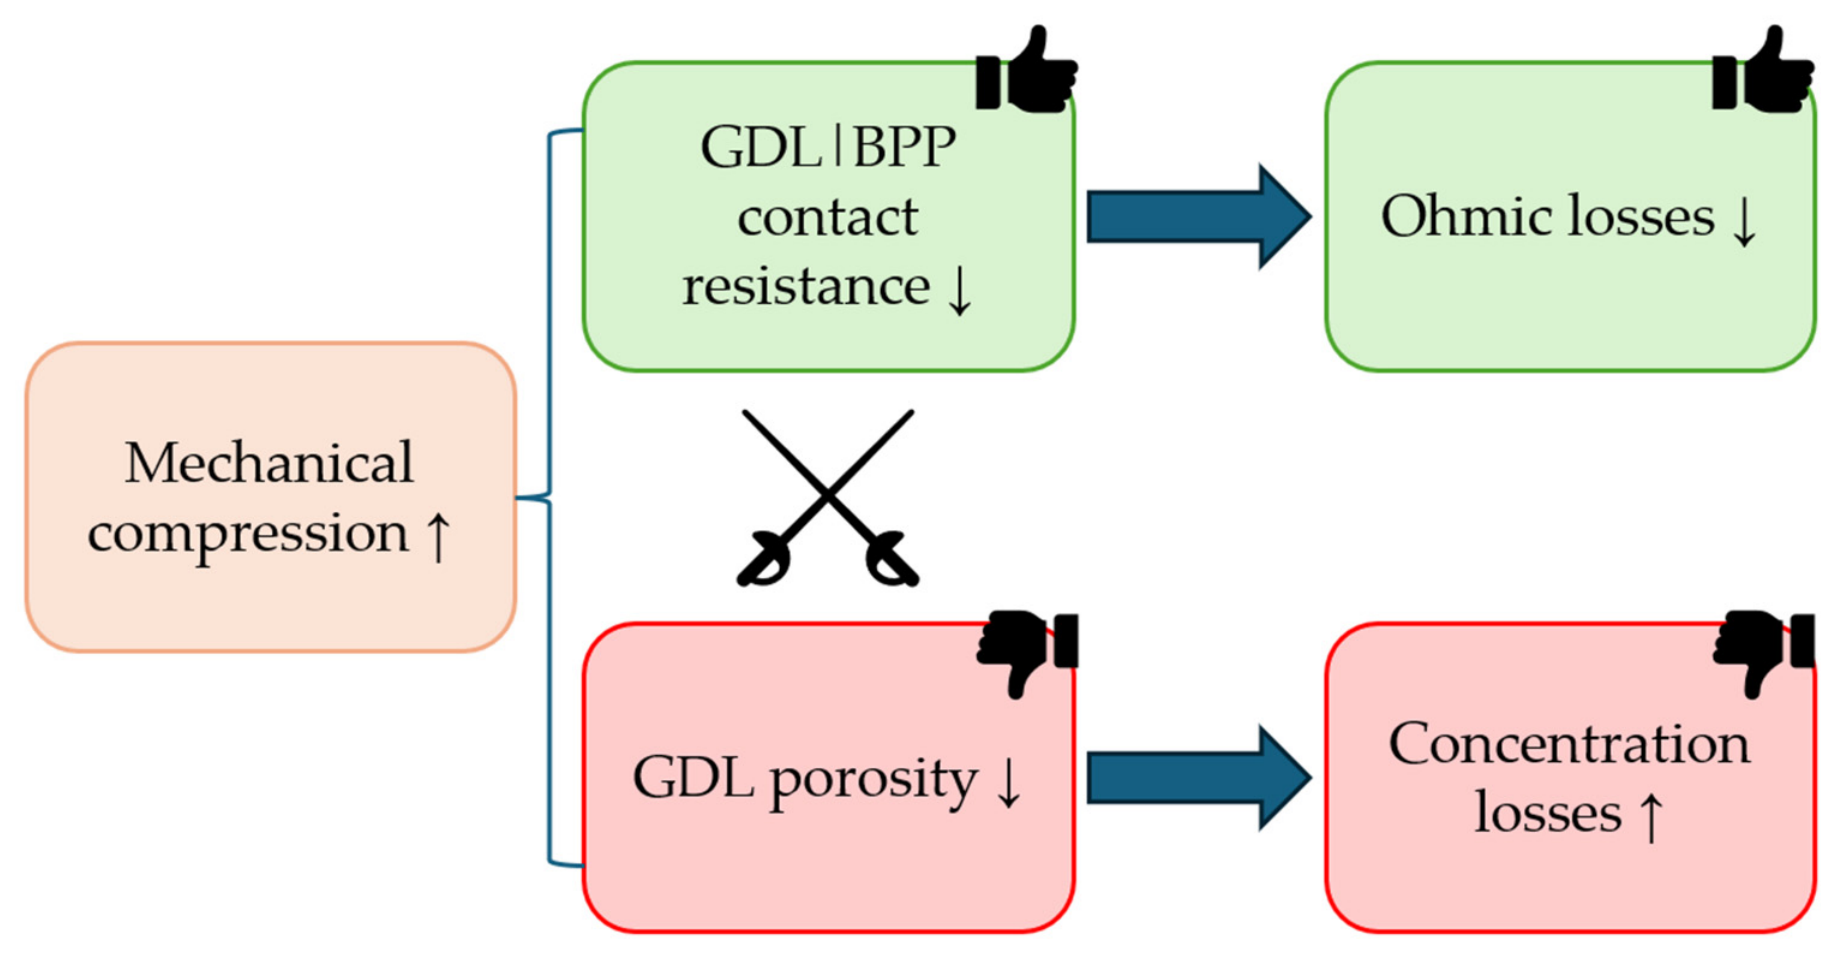
Taken together, the two responses introduced above describe the two competing routes by which the assembled mechanical state acts on cell operation. A higher compression enlarges the real area of contact at the GDL-BPP interface and therefore lowers the interfacial contribution to the ohmic overpotential, which is the dominant loss at intermediate current density. The same compression, however, reduces the pore volume of the GDL and raises its tortuosity, hindering reactant transport and the removal of liquid water, and therefore increasing the concentration overpotential that dominates at high current density. Since the two effects act in opposite senses, a compression window exists in which the combined losses are minimised. Its position depends on the component set and on the operating conditions, which is precisely what the screening presented in the following sections is designed to explore. This reasoning is summarised in Figure 4, which separates the quantities computed here from the performance consequences reported in the literature [13,21].
Figure 4.
Relationship between the mechanical responses computed by the ESM in this work and the corresponding loss mechanisms in a PEMFC.
2.2. Exploitation of the Equivalent Stiffness Model Through the Design of Experiments Method
Due to the simplifications assumed and the low computational cost, the ESM developed in the previous work allows for setting many inputs for any simulation [14]. Thermal loading is represented by prescribing a uniform temperature to each branch of the stack. The ambient temperature, representing the far-field environmental boundary condition, and the internal temperature, representing the active area and thus the thermal state established by the heat generated during the electrochemical reaction, are defined as operating conditions. The temperatures of the remaining branches are obtained between these two values following the approach proposed by Lin et al. [9,10]. The GDL and the PEM belong to the internal branch and therefore remain at the active-area temperature, whereas the bolts and terminal components are associated with the coldest branch and approach, without reaching the ambient temperature (see Table 1).
Table 1.
Component temperatures derived from the thermal conditions.
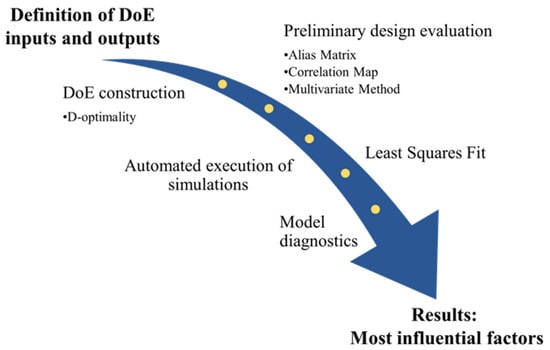
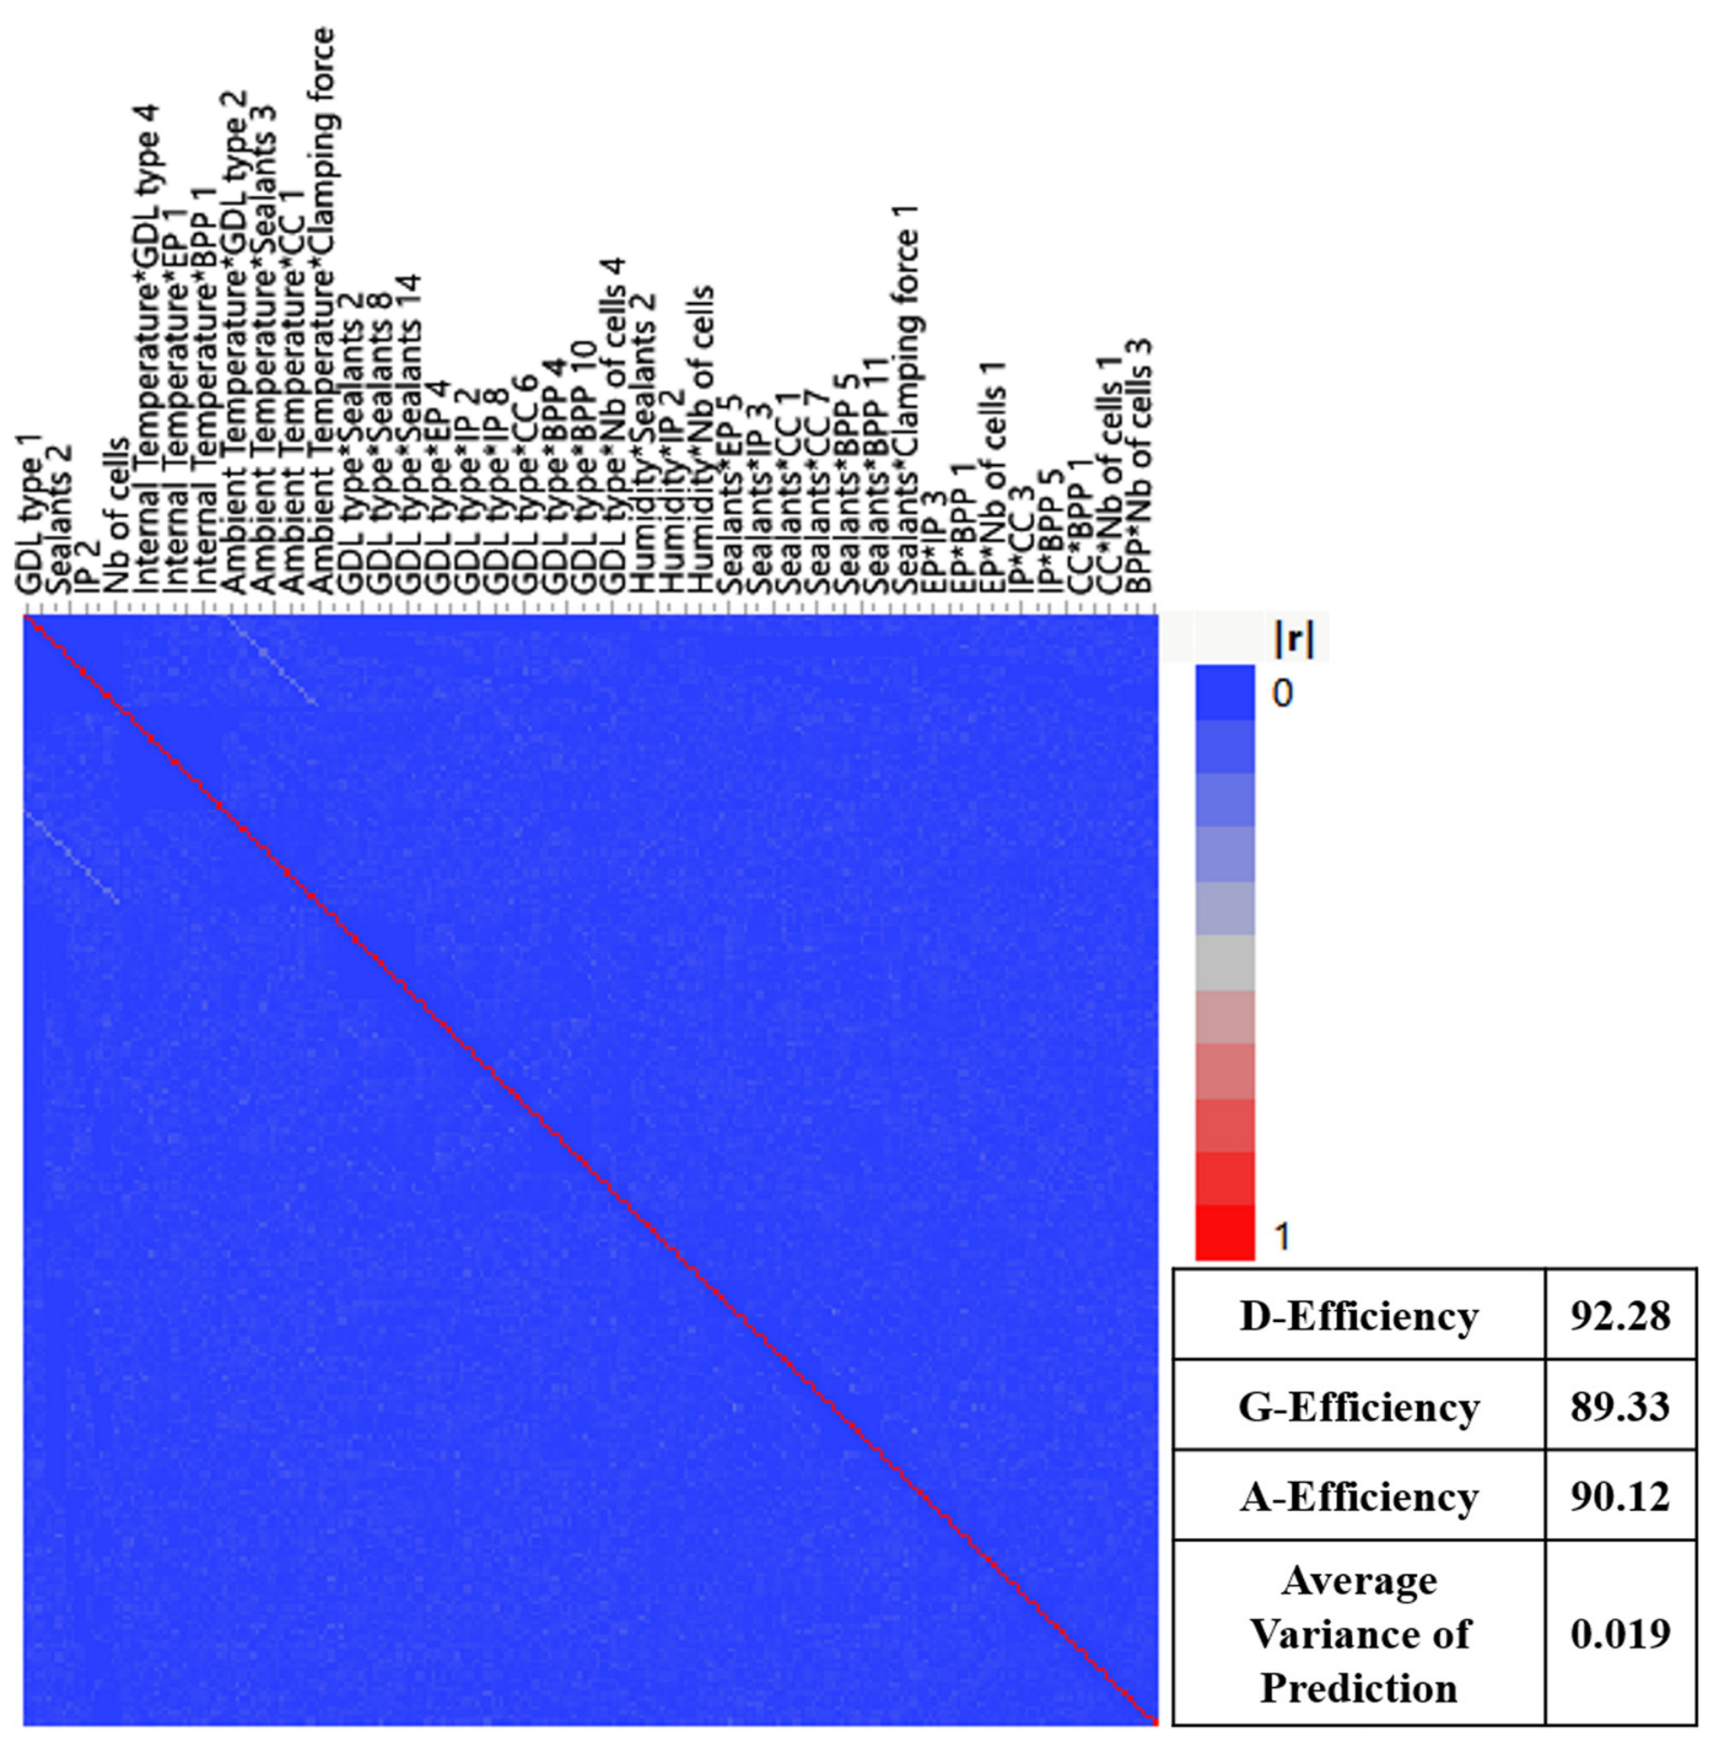
Phenomena associated with water freezing within the porous media and the temperature-dependent behaviour of polymeric components below their glass transition temperature are instead relevant to prolonged subzero shutdown conditions and cold-start transients. It is possible to select the thermal and humidity conditions of the system, the clamping force and several materials for almost all of the stack’s components (see Figure 2). The number of inputs leads to many possible stack configurations, and the amount of information that can be obtained at each run is very high. For this reason, adopting a DoE methodology is particularly suitable, as it enables a structured exploration of the design space and facilitates the identification of statistically significant factors and interactions for the system. In this section, the DoE approach is exploited to investigate several different responses, such as the internal force acting on the MEA and the external one applied to the sealants, the effective porosity of the GDLs, and the interfacial contact resistance between GDLs and BPPs. For this aim, the analysis was purposefully organised into three least-squares fits: Assembly Conditions (AC), Operating Conditions (OC), and the difference Δ = OC-AC, to align statistical modelling with the ESM simulation and underlying physics: AC isolates preload-driven mechanics, OC adds thermo-mechanical loads, and Δ removes baseline offsets to quantify operating-induced change (see Section 2.3). The software used to construct the DoE is JMP® 18.2 (JMP Statistical Discovery LLC, Cary, NC, USA). Furthermore, an additional MATLAB® R2025b (The MathWorks, Inc., Natick, MA, USA) script has been implemented in the original ESM code to automatically perform many simulations by varying the inputs according to the experimental plan. The generic workflow of the process is reported in Figure 5 and described below.
Figure 5.
Workflow of the DoE process.
The DoE’s main factors coincide with the ESM’s inputs, except that the thermal conditions input of the ESM has been divided into the “Internal Temperature” (temperature of the active area) and the “Ambient Temperature” factors for the DoE. Material-related factors were modelled as nominal categorical variables, since their levels represent distinct material types without a natural ordering, and the other factors were defined as continuous variables [24] (“Factors in Designed Experiments”). Table 2 summarises the inputs of the model.
Table 2.
Summary of the ESM inputs and DoE factors [14].
A preliminary design evaluation was performed, using the Alias Matrix to quantify how unmodeled terms (e.g., higher-order interactions) might bias targeted effects through correlation with the model space [24] (“Alias matrix”), a colour map on correlations to reveal near-dependencies that inflate the standard errors of estimates [24] (“Color Map on Correlations”), and D-, A-, and G-efficiencies to compare the design to a theoretically optimal orthogonal one [24] (“Design Efficiency”). The Multivariate Method was used exclusively for the multi-response DoE (see Section 2.3) to identify and preliminarily avoid redundant responses that follow the same physics [24] (“Correlations and Multivariate Techniques”). The D-optimality criterion was chosen for the design since it is suitable for experiments focusing on estimating effects or testing for significance [24] (“Optimality Criteria”). Although the software suggested a minimum number of runs sufficient to achieve model identifiability, a larger custom design was adopted. This choice was motivated by the low computational cost of the ESM, which allowed for a more extensive exploration of the design space, leading to higher stability of the estimates, reduced risk of aliasing, and more robust statistical diagnostics. A generalised regression model [24] (“Generalized Regression Models”) was carried out using the LASSO estimation method [24] (“Estimation Method Options”) and the KFold cross-validation method [24] (“Validation Method Options”) to preliminarily evaluate the most influential interactions of the factors to add to the main least-square fit. Once this latter is performed, the summary of fit report provides RMSE, R2, adjusted R2, Mean of Response, observations, AICc and BIC, helpful to validate the fitting [24] (“Summary of fit”). Analysis of Variance (ANOVA) [24] (“Analysis of Variance”) and partial η2 effect size [24] (“Effect Tests”) were thought appropriate to rank the factors’ influence. For categorical factors and their combinations, LSMeans Tukey HSD provided marginal means adjusted for the whole model and controlled the familywise error rate across all pairwise level comparisons [24] (“Effect Details”). Slices (simple-effects analyses) decomposed categorical variables’ interactions by testing level differences within fixed levels of the partner factor, which is essential when material choices interact [24] (“Effect Details”). Collinearity was monitored with Variance Inflation Factors (VIFs) [24] (“Parameter Estimates”). Model adequacy was checked via diagnostic plots [24] (“Row Diagnostics”): Actual vs. Predicted to reveal global bias or missing structure, Residuals vs. Predicted to detect nonlinearity and heteroscedasticity, studentized residuals to flag outliers, and normal Q–Q to assess approximate normality of errors. A Box–Cox response transformation was profiled to stabilise variance and improve normality [24] (“Boxcox Y Transformation”). The qualitative effect ranking was expected to remain stable after the transformation, serving as a robustness check rather than a means to change conclusions. Finally, interaction plots [24] (“Interaction Plots”) and the profilers [24] (“Profilers”) translated the fitted models into engineering insight: non-parallel lines in interaction plots provide immediate visual evidence of effect modification among materials or between materials and loads, while profiler traces with confidence bands quantify local trade-offs, curvature, and uncertainty, ensuring that statistical findings map directly to physically actionable design choices. The obtained results are reported in the Supplementary Material and interpreted in detail in the following sections.
2.3. Multi-Response DoE
2.3.1. Preliminary Design Evaluation
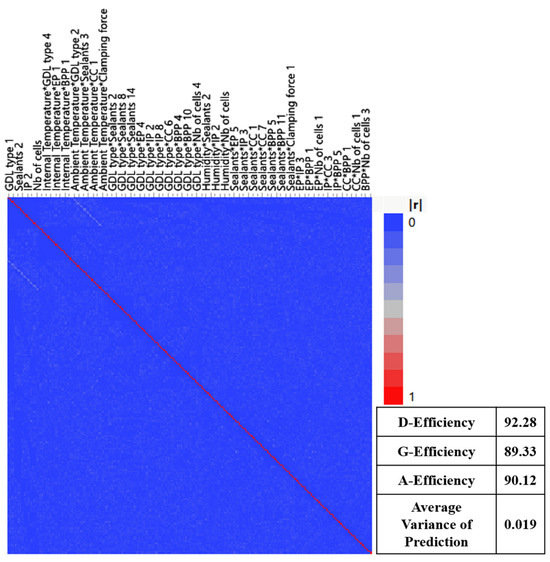
As anticipated, a preliminary evaluation of the DoE was carried out to assess its statistical adequacy before running the simulations, with particular attention to the alias matrix to ensure that the estimable effects were not unduly confounded with higher-order terms, the correlation structure of the design matrix examined through a colour map to identify potential collinearity, and the D-, G-, and A-efficiency indices, which quantify, respectively, the joint precision of the coefficient estimates, the worst-case predictive variance across the design space, and the average variance of the estimated effects (see Figure 6).
Figure 6.
Design evaluation results (The symbol * denotes interactions between factors. Thus, A*B denotes the interaction between factors A and B).
These checks confirmed that the proposed structure was well-balanced for the intended models and suitable for the reliable interpretation of factor influences.
2.3.2. Multivariate Method
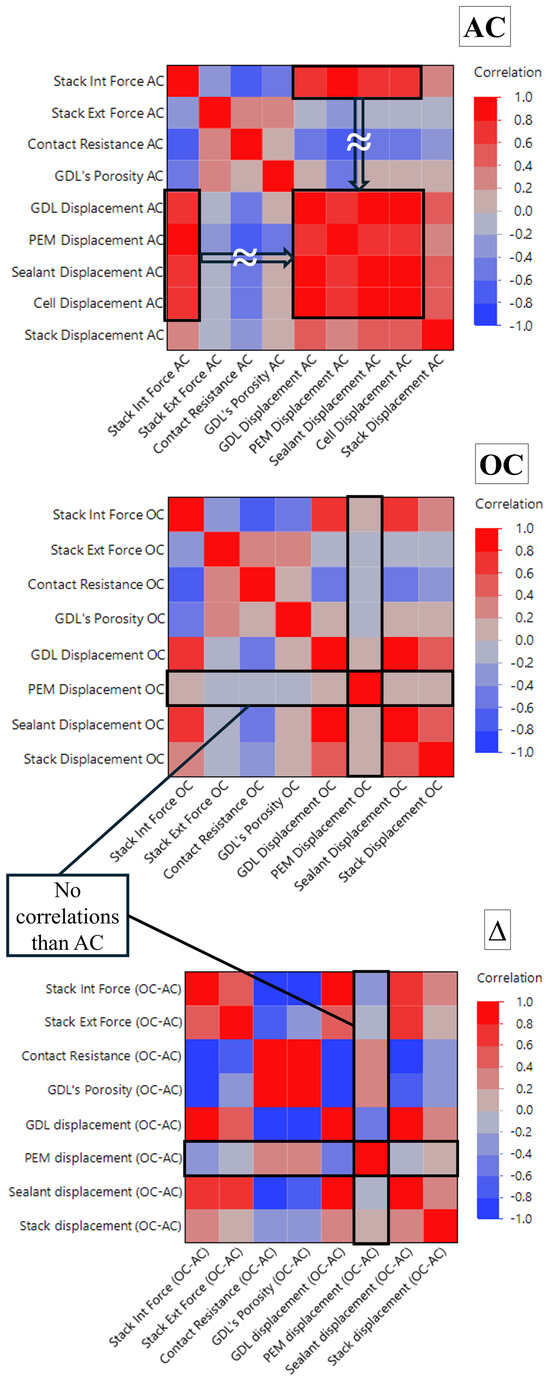
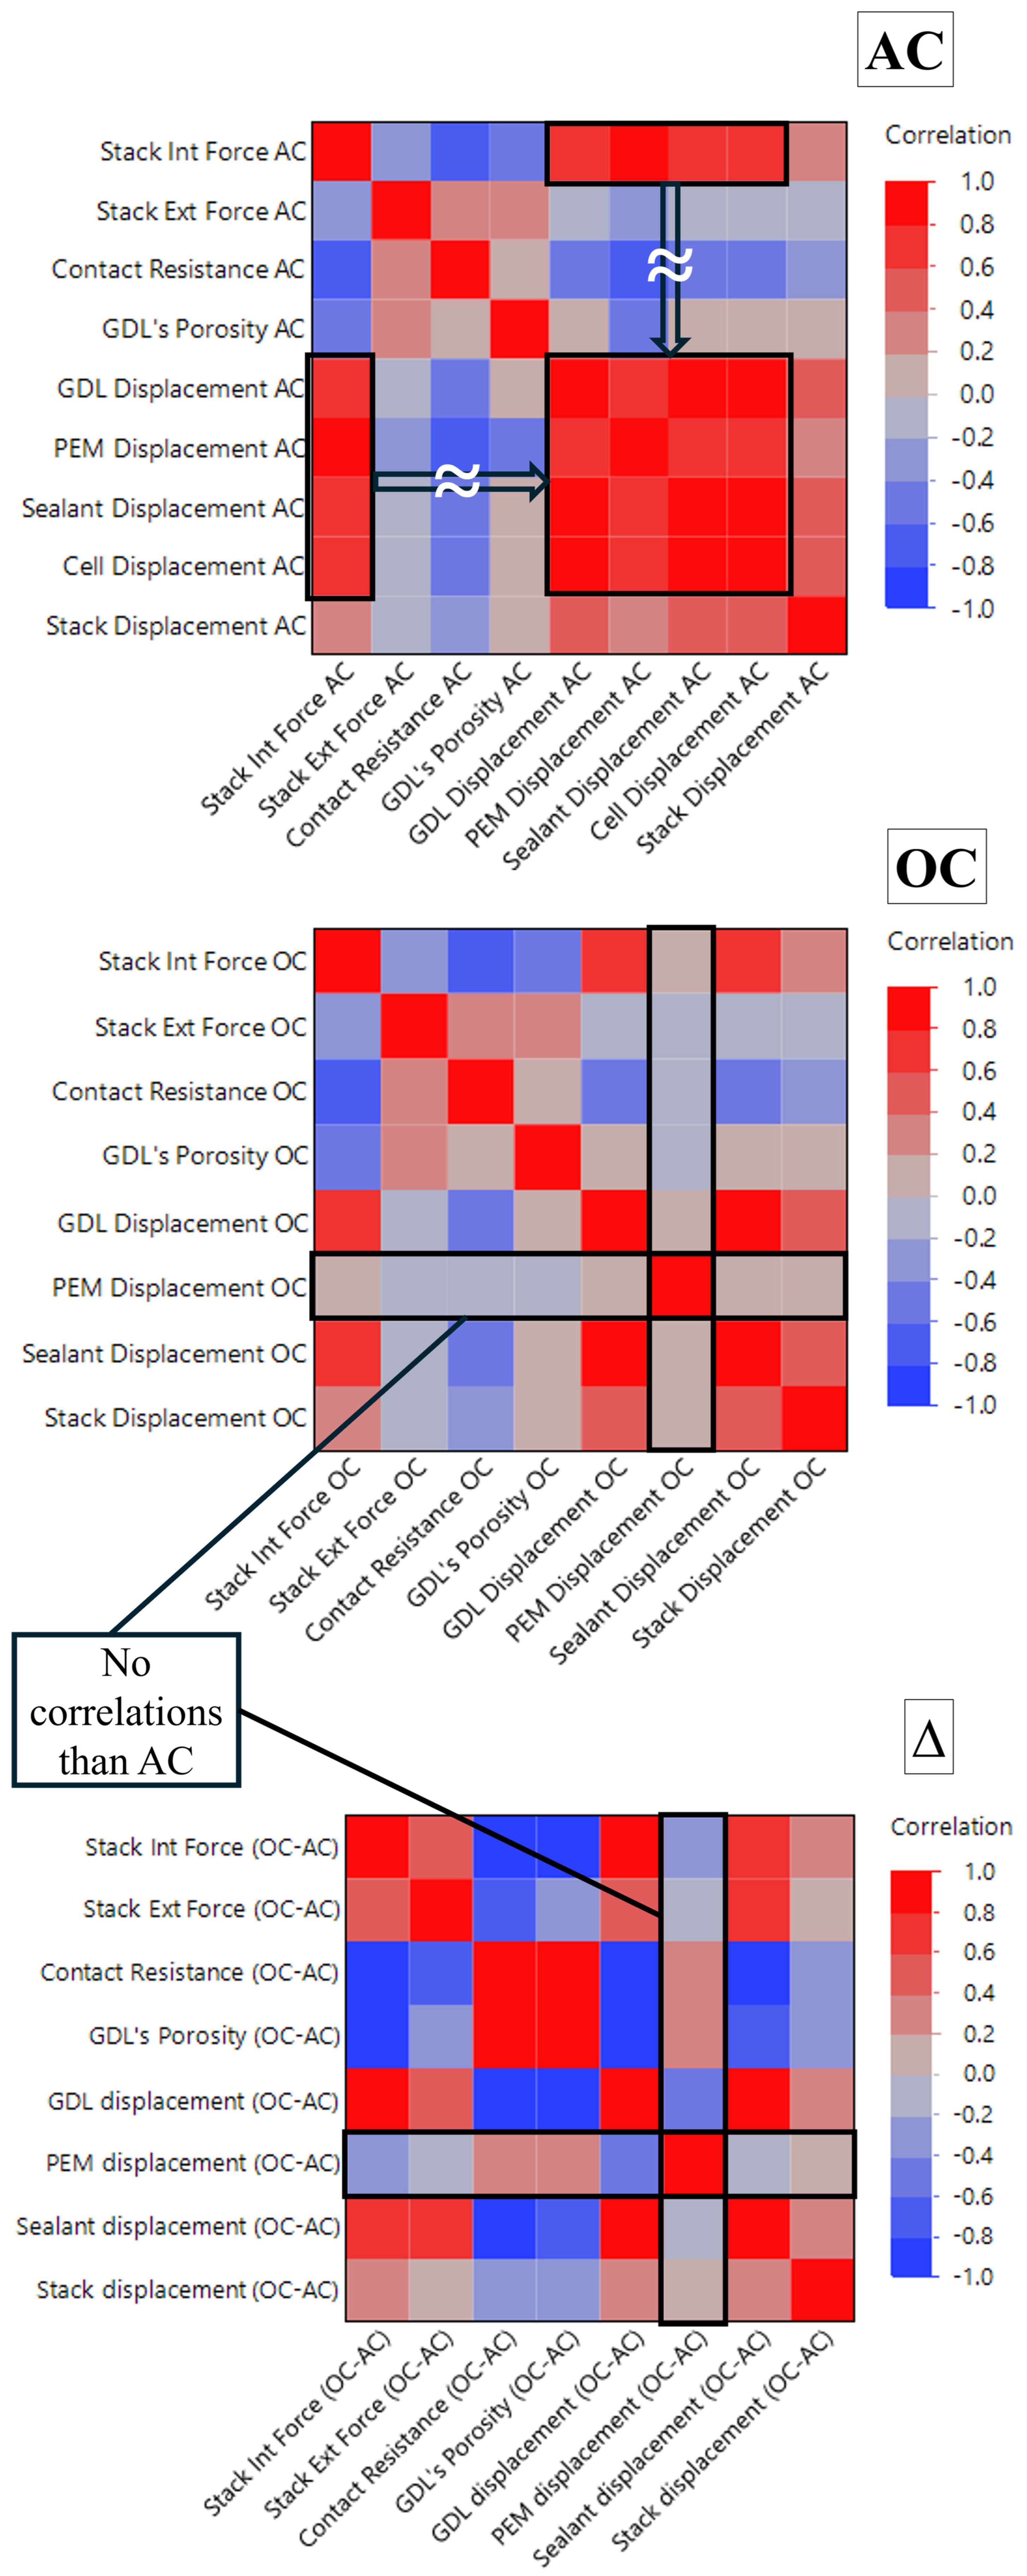
As reported in Figure 2, the ESM simulation allows the calculation of several outputs. Furthermore, Section 2.1 describes the implementation of the electrical contact resistance at the GDL-BPP interface and the GDL porosity. The developed ESM allows for sequentially simulating the clamping process and operating conditions. Consequently, the outputs are affected by these two different system states. As anticipated, the analysis is divided into three individual fits, AC, OC, and ∆, respectively, to properly distinguish the physics occurring in the simulation. A Multivariate Method is performed to screen the responses that follow the same physics. Table 3 reports the evaluated responses and Figure 7 reports the colour map on correlations of the responses obtained for the three individual fits.
Table 3.
Evaluated responses.
Figure 7.
Colour maps on correlations of the responses. AC = Assembly Conditions; OC = Operating Conditions; Δ = OC-AC. PEM displacement included only in OC and Δ regimes.
The results revealed that under AC, a compact compression–displacement mechanism dominated the response space, with local displacements moving nearly in lockstep and contact resistance and GDL porosity varying inversely with internal load. In contrast, under OC, a second, essentially thermal mechanism emerged in which PEM displacement decoupled from the compression block and responded primarily to thermo-mechanical mismatch. In the Δ analysis, these relationships were sharpened, with increases in internal force associated with decreases in contact resistance and porosity and displacement changes aligning along a single axis of additional compaction. At the same time, PEM retained a distinct operating trend. For this reason, the analysis advanced a multi-response fit that jointly models internal force, external force, contact resistance, and GDL porosity across AC, OC, and Δ, because these variables span the principal engineering trade-offs, while avoiding the redundancy inherent in the highly collinear local displacements. At the same time, modelling stack displacement and PEM displacement in dedicated univariate fits for the OC-involved cases maintains interpretability without injecting additional collinearity into the joint analysis.
2.3.3. DoE Construction and Simulations
On this basis, the design was then constructed using a D-optimal approach, which is particularly appropriate for experimental spaces with mixed categorical and continuous factors and an irregular candidate set. The number of runs was increased to 1000 to enhance efficiency and stabilise effect estimation, taking advantage of the negligible computational cost of the simulations.
2.3.4. Preliminary Generalised Regression
Generalised regressions with the LASSO estimation method and the KFold cross-validation method are performed to identify the most influential interactions to include in the main least-square fit. Concerning the multi-response fit, the results showed that the cross interactions between the GDL type, sealant material, clamping force, and the quadratic term of this latter impact the responses. Consequently, these factors are implemented, along with the inputs of the ESM as main effects, in all of the multiple-response least-square fits. The low influence of the number of cells factor on the responses could be due to the assumptions of the current version of the ESM, where every single stack cell experiences the same mechanical state. In contrast, the stack displacement is highly impacted by the number of cells factor, its quadratic term, and interactions with the other most influential factors. For OC and ∆ fits, the assembly factors remain the most influential, but, in contrast, thermal conditions, membrane humidity, and the BPP material, along with their respective interactions and quadratic terms, also play an essential role. While all of the main effects are included in each fit, only the most influential interactions and quadratic terms are included in the main least-square fits to avoid collinearity, respecting the hierarchy without excluding specific levels of the included factors. The included two-way interactions are reported in Section 3.
3. Results
Following the preliminary analyses, least-squares fits were estimated and assessed in depth using multiple diagnostics and summary metrics to ensure robust and reliable inferences, as detailed in Section 2.2. The heatmaps below illustrate the most influential DoE factors based on η2 (effect size), represented by a colour gradient. Although the colours reflect the magnitude of each factor’s effect, the tables do not list the factors in order of importance. The results of the LSMeans Tukey HSD tests are also reported below. The levels are ranked vertically from top to bottom for the most influential nominal variables according to their relative effect. Levels that appear on the same line do not differ significantly in their impact. The analyses of internal and external forces, electrical contact resistance, and GDL porosity were undertaken considering the same factors throughout.
3.1. Assembly Conditions (AC)
The AC models were fitted first and, in line with the screening by generalised regression, the four responses exhibited a broadly consistent pattern in which GDL type, sealant material and clamping force are the most influential factors, followed by their two-way interactions and the quadratic term in clamping force. In contrast, the material choice of stack terminal components (EP, IP, CC) and of the BPP and the number of cells had no discernible effect. The precise ordering of main effects and interactions differed slightly across the four responses (see Table 4).
Table 4.
Heatmap of the most influential factors for the multi-response fit of the AC regime, ranked by η2 (effect size). Note that the symbol * denotes interactions between factors. Thus, A*B denotes the interaction between factors A and B.
Pairwise comparisons based on LSMeans with Tukey’s HSD enabled levelwise ranking of the nominal factors, revealing pronounced differences among GDL types and sealant materials across the AC responses (see Table 5).
Table 5.
Ranking of nominal variable levels based on LSMeans Tukey HSD test for the AC regime. Levels on the same row are not significantly different. GDL levels: 1 = 36AA; 2 = 36BB; 3 = H060; 4 = H23C7; 5 = 22BB; Sealant material levels: 1 = EPDM; 2 = ACM; 3 = NBR; 4 = FKM; 5 = VMQ.
As expected, the levelwise ranking of the factors for internal versus external force is inverted. For sealants, the ordering for internal force is ACM (most significant response), VMQ, EPDM, FKM and NBR (smallest response), while the order is inverted for all of the other parameters, with NBR and FKM exerting similar effects on GDL porosity. For GDL type, the ordering for internal force (reversed for external force) is H23C7, 36BB, H060, 22BB and 36AA, whereas for contact resistance it is H060, 22BB, 36AA, 36BB, and H23C7. For GDL porosity, it is 36AA, 22BB, 36BB, H060 and H23C7.
3.2. Operating Conditions (OC)
The corresponding operating factors and interactions were added to the OC fits, and the top three drivers remained unchanged in the overall ranking (see Table 6).
Table 6.
Heatmap of the most influential factors for the multi-response fit of the OC regime, ranked by η2 (effect size). Note that the symbol * denotes interactions between factors.
However, the statistical contribution of the BPP material (particularly for internal force and contact resistance) and the number of cells increased, which is consistent with differences in thermal expansion. Operating factors (thermal conditions and PEM humidity) attained significance comparable to AC interactions (material choices with clamping). At the same time, external force is driven predominantly by the AC factors and their interactions, followed by the BPP material, and only thereafter by the OC factors. Table 7 reports the LSMeans Tukey HSD results to rank the nominal variables’ levels for the OC regime.
Table 7.
Ranking of nominal variable levels based on LSMeans Tukey HSD test for the OC regime. Levels on the same row are not significantly different. GDL levels: 1 = 36AA; 2 = 36BB; 3 = H060; 4 = H23C7; 5 = 22BB. Sealant material levels: 1 = EPDM; 2 = ACM; 3 = NBR; 4 = FKM; 5 = VMQ. BPP material levels: 1 = Graphite; 2 = Stainless Steel; 3 = Titanium; 4 = Aluminium.
The BPP material levels ranking is reported. Generally, the levelwise ordering of the GDL types and sealant materials is stable relative to AC. However, certain materials exhibited comparable effects (e.g., GDL types 36BB and H23C7 for external force, and 36AA and 22BB for contact resistance).
3.3. Δ Regime
When the OC effects were isolated in the Δ fits, the ranking changed markedly (see Table 8).
Table 8.
Heatmap of the most influential factors for the multi-response fit of the Δ regime, ranked by η2 (effect size). Note that the symbol * denotes interactions between factors.
The BPP material emerged as the leading factor, and the contributions of the remaining materials and operating factors became similar in magnitude, with broadly consistent rankings across internal force, contact resistance and GDL porosity, although sealant choice is slightly more influential for the latter. For external force, the choice of sealant material outweighed the GDL type. The levelwise ranking is reported in Table 9.
Table 9.
Ranking of nominal variable levels based on LSMeans Tukey HSD test for the Δ regime. Levels on the same row are not significantly different. GDL levels: 1 = 36AA; 2 = 36BB; 3 = H060; 4 = H23C7; 5 = 22BB. Sealant material levels: 1 = EPDM; 2 = ACM; 3 = NBR; 4 = FKM; 5 = VMQ. BPP material levels: 1 = Graphite; 2 = Stainless Steel; 3 = Titanium; 4 = Aluminium. EP material levels: 1 = Aluminium; 2 = Stainless Steel; 3 = Composite. IP material levels: 1 = Polymeric; 2 = Epoxylite; 3 = POM.
For the GDL type, the levelwise ranking differed from the previous fits, and the sealant ranking shifted only for contact resistance. Pairs of sealant materials (EPDM with VMQ and NBR with FKM) displayed mutually similar effects. In contrast, the four BPP materials are clearly distinct, increasing internal and external forces and decreasing contact resistance and GDL porosity in aluminium, stainless steel, titanium and graphite.
3.4. Stack Displacement
Regarding stack displacement, owing to the simplification currently adopted in the ESM, this is the only response affected by the number of cells, which is the most influential factor under both AC and OC, followed by clamping force, the GDL and sealant materials, their interactions, and the BPP material. Upon inclusion of OC, thermal conditions and humidity are significant for stack displacement but less so than the assembly factors. In the Δ fit, ambient temperature became the dominant driver, followed by the number of cells and internal temperature, with assembly factors and humidity remaining significant but to a lesser extent. The terminal components are non-significant (see Table 10).
Table 10.
Heatmap of the most influential factors for the stack displacement fit of the three regimes, ranked by η2 (effect size). “/” = no implemented factor/interaction. Note that the symbol * denotes interactions between factors.
The levels ranking of the GDL type and sealant materials does not change from the AC to the OC regime. The most influential GDL types are 36AA, 22BB, 36BB, H060 and H23C7, while the sealant materials are ranked as ACM, VMQ, EPDM, NBR and FKM. These factors are insignificant for the Δ regime (see Table 11).
Table 11.
Ranking of nominal variable levels based on LSMeans Tukey HSD test for the stack displacement. Levels on the same row are not significantly different. GDL levels: 1 = 36AA; 2 = 36BB; 3 = H060; 4 = H23C7; 5 = 22BB. Sealant material levels: 1 = EPDM; 2 = ACM; 3 = NBR; 4 = FKM; 5 = VMQ. BPP material levels: 1 = Graphite; 2 = Stainless Steel; 3 = Titanium; 4 = Aluminium.
3.5. PEM Displacement
Finally, consistent with the multivariate screening, PEM displacement responded differently once OC were introduced (see Table 12), being governed primarily by humidity and internal temperature, followed by clamping force, sealant and GDL types, with neither the terminal components nor the number of cells contributing meaningfully. In the Δ fit, the ranking is similar, except that the material choices are negligible.
Table 12.
Heatmap of the most influential factors for the PEM displacement fits, ranked by η2 (effect size). Note that the symbol * denotes interactions between factors.
Concerning the PEM displacement response, the GDL type and sealant material choice are significant only for the OC regime, and the levels ranking is reported in Table 13.
Table 13.
Ranking of nominal variable levels based on LSMeans Tukey HSD test for the PEM displacement. Levels on the same row are not significantly different. GDL levels: 1 = 36AA; 2 = 36BB; 3 = H060; 4 = H23C7; 5 = 22BB. Sealant material levels: 1 = EPDM; 2 = ACM; 3 = NBR; 4 = FKM; 5 = VMQ. BPP material levels: 1 = Graphite; 2 = Stainless Steel; 3 = Titanium; 4 = Aluminium.
Collectively, these analyses delineate, for each response, the relative impact of every factor and its levels.
4. Discussion
In this study, an ESM incorporating the nonlinear behaviour of MEA components and sealants was extended calculating GDL-BPP contact resistance and GDL porosity variations. The low computational cost of the ESM enabled the exploration of a large design space through a DoE methodology. This allowed a comprehensive assessment of the relative influence of stack design and operating parameters. The multivariate analysis highlighted that several responses are governed by common physical mechanisms, enabling the definition of a reduced yet representative set of outputs for the multi-response analyses. Then, multi-response DoE analyses across AC, OC and operating-induced change Δ regimes showed that, under AC, the preload imposed by the bolts is the primary driver of the internal force, whereas the external force is governed almost entirely by the sealant material. When OC are introduced, the BPP material becomes the leading factor. This effect is particularly evident in the Δ regime, where the baseline preload is removed. The different thermal expansion coefficients of the candidate plates redistribute the load between the internal and external branches during heating. These findings underline the importance of considering thermo-mechanical interactions when evaluating PEMFC stack behaviour under realistic operating conditions.
Under OC and Δ the membrane acquires a second source of strain that no other component has, hygroscopic swelling set by the membrane humidity, which dominates its deformation. The PEM is thin relative to a branch compliance governed by the GDL and the sealants, so swelling produces a large membrane strain but only a modest perturbation of the force balance. The negligible influence of the number of cells on the per-cell responses follows directly from the present assumption that every cell experiences the same mechanical state, while the stack displacement, being cumulative, remains strongly dependent on it.
The reported responses are computed under the assumption that every cell of the stack experiences the same mechanical state and that the contact pressure is uniform across the active area. This assumption operates at two scales. At the cell scale, the through-plane compression becomes more nearly uniform when the ribs and channels of the BPP are narrow and the plate compliance is limited [34]. At the stack scale, the three-dimensional analysis of Carral and Mélé [35] shows that the distributions of the compression ratio and of the contact pressure, which are strongly non-uniform for stacks of few cells, stabilise for stacks of five cells and above. The number of cells explored here ranges from 10 to 50, so the assumption is applied within the regime in which it is supported by those results.
The negligible influence of the terminal components, and, in particular, for the EP material, is conditional on the assumption of a formulation that distributes the load identically to every cell; the stiffness of the EP cannot act on the per-cell responses. Once EP compliance and bolt-induced deflection are introduced, the EP material is expected to become influential, acting primarily on the spatial distribution of the contact pressure and on the cells located at the extremities of the stack rather than on its mean value.
Relaxing the uniform pressure assumption is the principal development envisaged for the framework, and each of its components has already been demonstrated within an equivalent stiffness formulation. Zhang et al. [12] combined an ESM with an equivalent beam model to predict the non-uniform contact pressure distribution induced by EP deflection under belt clamping.
The analytical descriptions of EP deflection reported by Carral and Mélé and the experimental deflection measurements of Carral et al. [35] offer the corresponding route for bolt-clamped stacks, and Fly et al. [11] have shown that manufacturing tolerances and assembly errors can be introduced as distributed component thicknesses and stiffnesses, resolving the cell-to-cell variation in contact pressure.
Because all of these formulations remain analytical, they can be incorporated without compromising the computational cost that makes the present screening possible. A non-uniform contact module combining them, able to quantify local pressure variations and to resolve the effect of cell position along the stack, is under development.
The iterative scheme of the present model is also directly extensible to unilateral contact between the MEA and the sealants in the presence of a manufacturing gap, so that the two load branches may engage at different load levels.
Beyond identifying the most influential design parameters, the proposed methodology provides quantitative rankings of material choices and operating factors, offering practical guidance for stack design. For a given application, such as minimising the mechanical changes expected over a specified ambient temperature range, the relevant response is first identified and the corresponding effect sizes are then used to select the influential design factors. The levelwise groupings identify statistically equivalent levels, while significant interactions indicate factors that must be specified jointly. This procedure reduces the design space to a limited number of candidate configurations without requiring further parametric exploration.
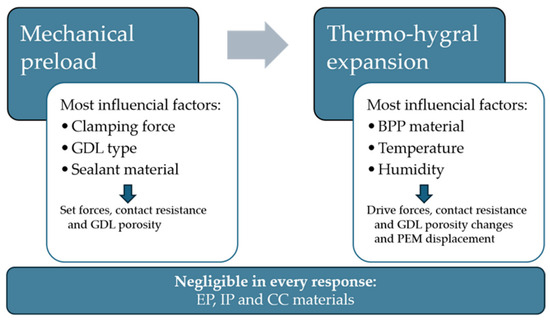
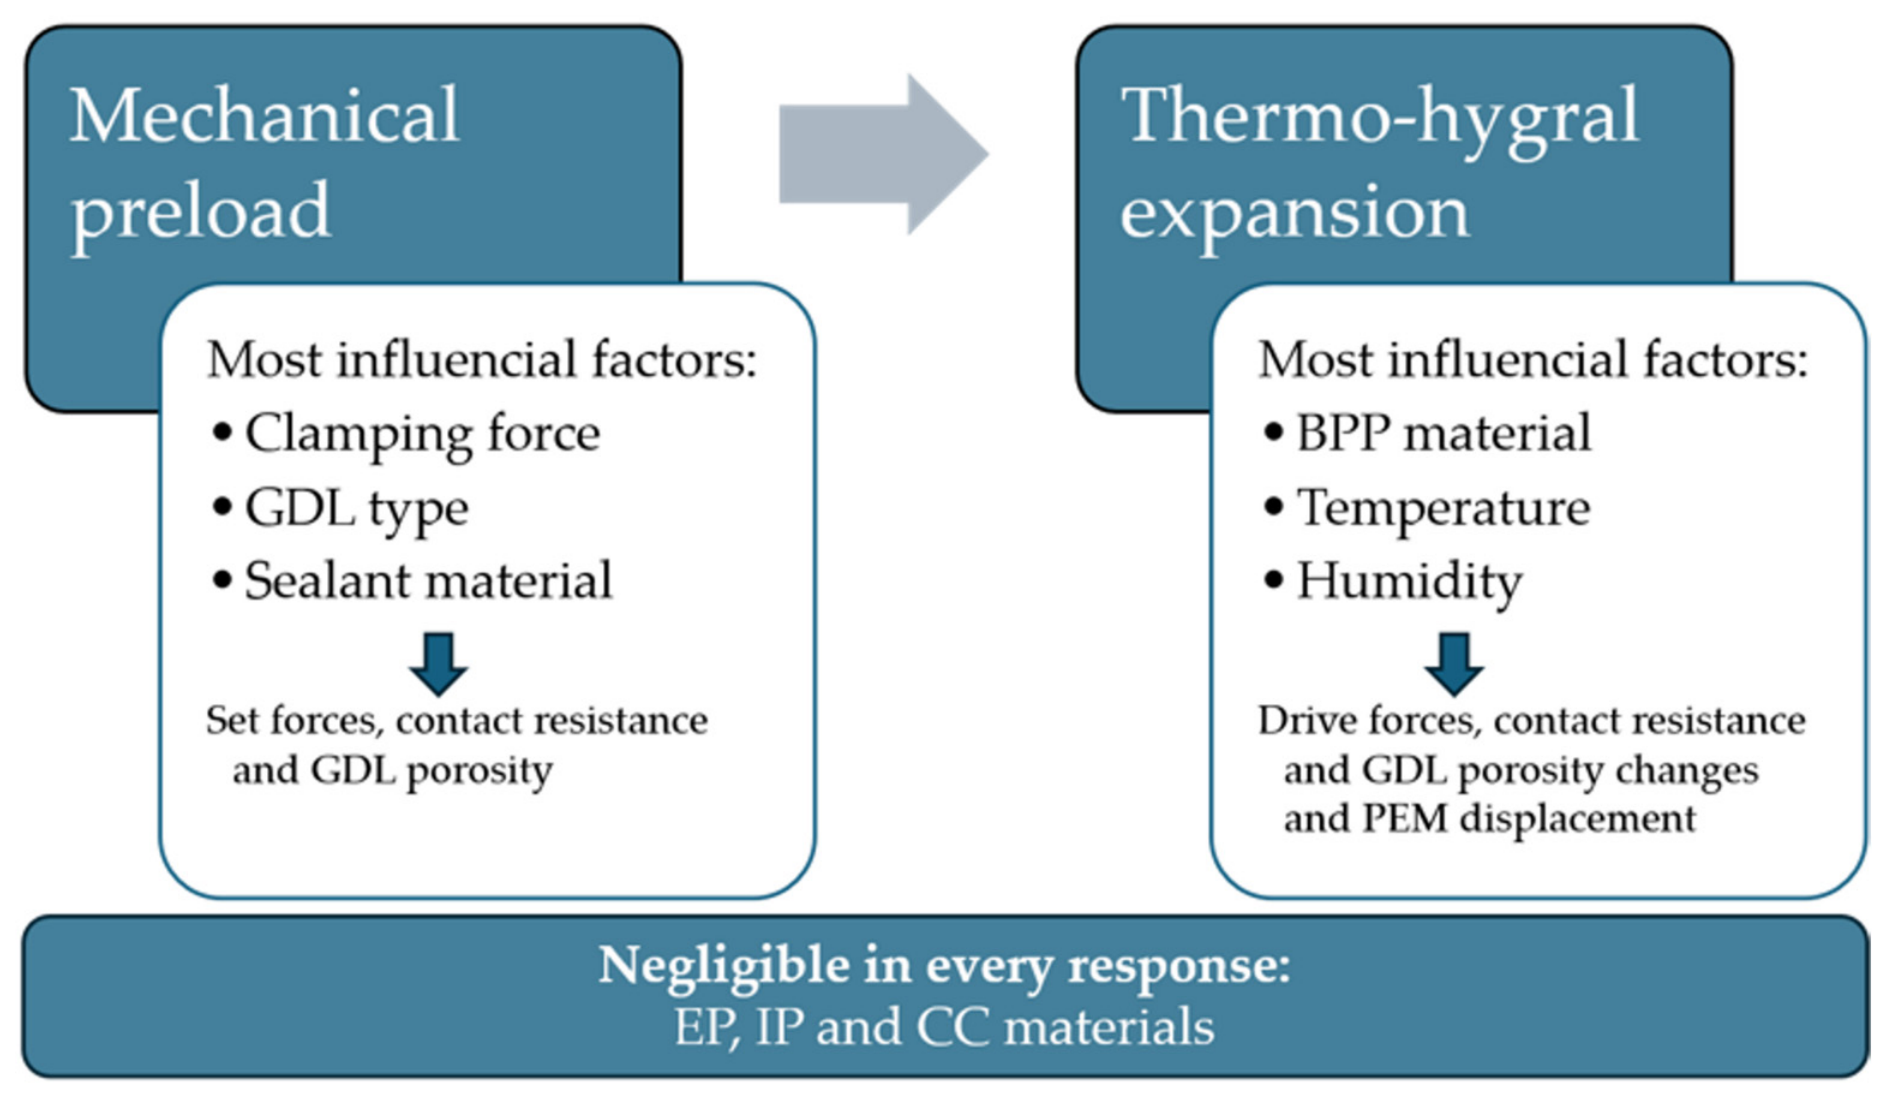
Together, these results provide a coherent route for selecting materials and defining safe and effective clamping loads. They also allow their performance implications to be anticipated before full electrochemical characterisation or more computationally intensive multiphysics simulations. In practice, the screening indicates that GDL and sealant selection, together with the clamping load, should be fixed first, as they govern the assembled mechanical state, whereas the BPP material and the thermo-hygrometric set-point become decisive once the stack is brought to operating conditions. Figure 8 summarises the common pattern underlying all of the screened responses. Each response reflects the competition between the mechanical preload mechanism that sets the as-built state (clamping force, GDL type, sealant material) and a thermo-hygral expansion mechanism that drives the operating-induced change (temperature and its effect on the BPP thermal expansion and humidity). The materials of the terminal components (EP, IP and CC) are negligible for every response.
Figure 8.
The common pattern underlying all of the screened responses.
Current limitations suggest clear avenues for refinement, including cell-wise heterogeneity, additional contact pathways and broader validation under transient conditions. Spatial temperature gradients associated with cooling architectures are not considered in the present formulation. Since the stiffness distribution governing contact pressure is primarily determined by through-plane thermal expansion mismatch, such gradients affect mainly the local pressure distribution rather than its average value. Their incorporation requires a dedicated non-uniform contact formulation, and realistic internal temperature fields [36] are therefore considered beyond the scope of the present study and addressed in dedicated investigations.
The operating temperature is not only a determinant of performance but also a lever for durability management, since the temperature at which a cell performs best has been shown to depend on its state of health and to migrate as it degrades [37].
Degradation prediction for PEMFCs increasingly relies on data-driven approaches and on transformer architectures in particular [38], which are trained on operating time series and carry no representation of the assembled mechanical state. Since it is the assembly that fixes the initial contact resistance and porosity from which any degradation trajectory departs, an efficient physics-based model able to resolve these quantities for untested configurations is complementary to such approaches rather than an alternative to them.
The feasibility of coupling equivalent stiffness formulations with electrochemical performance has already been demonstrated by Ahmad et al. [13], who validated a spring-equivalent compression model against experimental polarisation measurements on a four-cell stack. Building on this evidence, future work will extend the present framework towards a fully coupled electrochemical–mechanical model, in which the interaction between mechanical deformation and electrochemical behaviour is consistently resolved.
The low computational cost of the ESM also makes it well-suited to uncertainty propagation, representing a natural extension of the present screening. The constitutive parameters adopted in the model are subject to the experimental uncertainties reported in their original sources, while the material properties used in the porosity calculation (the GDL areal weight and fibre density) are treated here as fixed nominal values. Since the porosity is obtained through Equation (3), and the fibre density is common to all GDL types and enters multiplicatively, the ranking of the GDL types by porosity depends only on the ratio of areal weight to compressed thickness and is therefore exactly invariant to the value adopted for fibre density. Only the absolute level of the response is affected. The areal weight is type-specific, but the values used span 57 to 134 g/m2, against datasheet tolerances of the order of a few per cent, so the ranking is likewise robust to that source of uncertainty.
Fly et al. [11] showed that a stack-level equivalent stiffness formulation can propagate normally distributed parameter variations at negligible computational cost. Extending this approach to the constitutive models and material data adopted here, and assessing the robustness of the factor rankings to these uncertainties, is planned as future work.
Even so, the proposed methodology offers a practical, computationally efficient basis for design screening, sensitivity analysis, process specification and model-based optimisation of PEMFC stacks.
Supplementary Materials
The following supporting information can be downloaded at: https://www.mdpi.com/article/10.3390/hydrogen7030119/s1. File S1: Correlation matrix of the evaluated responses; File S2: Complete least-squares regression output for the multi-response fit of the AC regime (internal force, external force, GDL–BPP contact resistance and GDL porosity); File S3: Corresponding output for the stack displacement fit of the AC regime; File S4: Corresponding output for the multi-response fit of the OC regime; File S5: Corresponding output for the PEM displacement fit of the OC regime; File S6: Corresponding output for the stack displacement fit of the OC regime; File S7: Corresponding output for the multi-response fit of the Δ regime; File S8: Corresponding output for the PEM displacement fit of the Δ regime; File S9: Corresponding output for the stack displacement fit of the Δ regime.
Author Contributions
Conceptualization, L.M., D.C. (Dominique Chamoret), X.F., Y.M. and D.C. (Denis Candusso); methodology, L.M., D.C. (Dominique Chamoret), X.F., Y.M. and D.C. (Denis Candusso); software, L.M., D.C. (Dominique Chamoret), X.F., Y.M. and D.C. (Denis Candusso); validation, L.M., D.C. (Dominique Chamoret), X.F., Y.M. and D.C. (Denis Candusso); formal analysis, L.M., D.C. (Dominique Chamoret), X.F., Y.M. and D.C. (Denis Candusso); investigation, L.M., D.C. (Dominique Chamoret), X.F., Y.M. and D.C. (Denis Candusso); resources, D.C. (Dominique Chamoret), X.F., Y.M. and D.C. (Denis Candusso); data curation, L.M., D.C. (Dominique Chamoret), X.F., Y.M. and D.C. (Denis Candusso); writing—original draft preparation, L.M.; writing—review and editing, L.M., D.C. (Dominique Chamoret), X.F., Y.M. and D.C. (Denis Candusso); visualisation, L.M., D.C. (Dominique Chamoret), X.F., Y.M. and D.C. (Denis Candusso); supervision, D.C. (Dominique Chamoret), X.F., Y.M. and D.C. (Denis Candusso); project administration, D.C. (Dominique Chamoret), X.F., Y.M. and D.C. (Denis Candusso); funding acquisition, D.C. (Dominique Chamoret), X.F., Y.M. and D.C. (Denis Candusso) All authors have read and agreed to the published version of the manuscript.
Funding
This research was funded by French National Research Agency (ANR), grant number ANR-23-CE05-0010-02.
Data Availability Statement
The data presented in this study are available on request from the corresponding author.
Acknowledgments
Université Paris-Saclay is gratefully acknowledged for funding Luca Marcelli’s PhD thesis. During the preparation of this manuscript, the authors used ChatGPT 5.6 (OpenAI, San Francisco, CA, USA) for the purposes of spell-checking and grammar correction. The authors have reviewed and edited the output and take full responsibility for the content of this publication.
Conflicts of Interest
The authors declare no conflicts of interest. The funders had no role in the design of the study; in the collection, analyses, or interpretation of data; in the writing of the manuscript; or in the decision to publish the results.
Abbreviations
The following abbreviations are used in this manuscript:
| PEMFC | Proton Exchange Membrane Fuel Cell |
| PEM | Proton Exchange Membrane |
| GDL | Gas Diffusion Layer |
| MEA | Membrane Electrode Assembly |
| BPP | Bipolar Plate |
| IP | Insulator Plate |
| CC | Current Collector |
| EP | End Plate |
| ESM | Equivalent Stiffness Model |
| MPL | Microporous Layer |
| EPDM | Ethylene Propylene Diene Terpolymer |
| ACM | Alkyl Acrylate Copolymer |
| NBR | Nitrile-Butadiene Rubber |
| FKM | Fluoroelastomer |
| VMQ | Vinyl Methyl Silicone |
| POM | Polyoxymethylene |
| DoE | Design of Experiments |
| AC | Assembly Conditions |
| OC | Operating Conditions |
| Δ | Isolated OC (Δ = OC-AC) |
| RMSE | Root Mean Square Error |
| VIF | Variance Inflation Factor |
| ANOVA | Analysis of Variance |
| LSMeans | Least-Squares Means |
| HSD | (Tukey’s) Honestly Significant Difference |
| R2 | Coefficient of Determination |
| AICc | Corrected Akaike Information Criterion |
| BIC | Bayesian Information Criterion |
| LASSO | Least Absolute Shrinkage and Selection Operator |
References
- Bernardi, D.M. Water-Balance Calculations for Solid-Polymer-Electrolyte Fuel Cells. J. Electrochem. Soc. 1990, 137, 3344. [Google Scholar] [CrossRef] [Scilit]
- Bernardi, D.M.; Verbrugge, M.W. A Mathematical Model of the Solid-Polymer-Electrolyte Fuel Cell. J. Electrochem. Soc. 1992, 139, 2477. [Google Scholar] [CrossRef] [Scilit]
- Springer, T.E.; Zawodzinski, T.A.; Gottesfeld, S. Polymer Electrolyte Fuel Cell Model. J. Electrochem. Soc. 1991, 138, 2334–2342. [Google Scholar] [CrossRef] [Scilit]
- Fuller, T.F.; Newman, J. Water and Thermal Management in Solid-Polymer-Electrolyte Fuel Cells. J. Electrochem. Soc. 1993, 140, 1218. [Google Scholar] [CrossRef] [Scilit]
- Zhao, X.; Zhou, Y.; Wang, L.; Pan, B.; Wang, R.; Wang, L. Classification, Summarization and Perspective on Modeling Techniques for Polymer Electrolyte Membrane Fuel Cell. Int. J. Hydrogen Energy 2023, 48, 21864–21885. [Google Scholar] [CrossRef] [Scilit]
- Weber, A.Z.; Newman, J. A Theoretical Study of Membrane Constraint in Polymer-Electrolyte Fuel Cells. Aiche J. 2004, 50, 3215–3226. [Google Scholar] [CrossRef] [Scilit]
- Mishra, V.; Yang, F.; Pitchumani, R. Measurement and Prediction of Electrical Contact Resistance Between Gas Diffusion Layers and Bipolar Plate for Applications to PEM Fuel Cells. J. Fuel Cell Sci. Technol. 2004, 1, 2–9. [Google Scholar] [CrossRef] [Scilit]
- Marcelli, L.; Chamoret, D.; François, X.; Meyer, Y.; Candusso, D. Mechanical Models and Simulations of PEMFCs: A Comprehensive Review. Int. J. Hydrogen Energy 2025, 136, 1086–1111. [Google Scholar] [CrossRef] [Scilit]
- Lin, P.; Zhou, P.; Zhou, P.; Wu, C. A High Efficient Assembly Technique for Large PEMFC Stacks: Part I. Theory. J. Power Sources 2009, 194, 381–390. [Google Scholar] [CrossRef] [Scilit]
- Lin, P.; Zhou, P.; Zhou, P.; Wu, C. A High Efficient Assembly Technique for Large Proton Exchange Membrane Fuel Cell Stacks: Part II. Applications. J. Power Sources 2010, 195, 1383–1392. [Google Scholar] [CrossRef] [Scilit]
- Fly, A.; Chen, R.; Wang, X.-D. Equivalent Stiffness Model of a Proton Exchange Membrane Fuel Cell Stack Including Hygrothermal Effects and Dimensional Tolerances. J. Electrochem. Energy Convers. Storage 2018, 15, 031002. [Google Scholar] [CrossRef] [Scilit]
- Zhang, Z.; Zhang, J.; Hu, S.; Zhang, T. An Effective Equivalent Stiffness Model Combined with Equivalent Beam Model to Predict the Contact Pressure Distribution for a Large PEM Fuel Cell Stack. Int. J. Hydrogen Energy 2023, 48, 11431–11441. [Google Scholar] [CrossRef] [Scilit]
- Ahmad, M.; Harrison, R.; Harrison, R.W.; Harrison, R.; Meredith, J.O.; Bindel, A.; Todd, B. Validation of a Fuel Cell Compression Spring Equivalent Model Using Polarisation Data. Int. J. Hydrogen Energy 2017, 42, 8109–8118. [Google Scholar] [CrossRef] [Scilit]
- Marcelli, L.; Chamoret, D.; François, X.; Meyer, Y.; Candusso, D. A Multiphysics Equivalent Stiffness Model of a PEMFC Integrating the Nonlinear Mechanical Behaviour of Cell Components. Int. J. Hydrogen Energy 2026, 247, 155831. [Google Scholar] [CrossRef] [Scilit]
- Carral, C.; Mele, P. Modeling the Original and Cyclic Compression Behavior of Non-Woven Gas Diffusion Layers for Fuel Cells. Int. J. Hydrogen Energy 2022, 47, 23348–23359. [Google Scholar] [CrossRef] [Scilit]
- Kusoglu, A.; Tang, Y.; Santare, M.H.; Karlsson, A.M.; Cleghorn, S.; Johnson, W.B. Stress-Strain Behavior of Perfluorosulfonic Acid Membranes at Various Temperatures and Humidities: Experiments and Phenomenological Modeling. J. Fuel Cell Sci. Technol. 2009, 6, 011012. [Google Scholar] [CrossRef] [Scilit]
- Cheon, K.-M.; Akpudo, U.E.; Kareem, A.B.; Nwabufo, O.C.; Jeon, H.-R.; Hur, J.-W. An FEA-Assisted Decision-Making Framework for PEMFC Gasket Material Selection. Energies 2022, 15, 2580. [Google Scholar] [CrossRef] [Scilit]
- Ouerghemmi, M.; Carral, C.; Mele, P. Understanding the Influence of MEA Interfaces Properties on PEMFC Mechanical Behavior through Numerical Analysis. Int. J. Hydrogen Energy 2024, 69, 242–251. [Google Scholar] [CrossRef] [Scilit]
- Liu, B.; Wei, M.Y.; Zhang, W.; Wu, C. Effect of Impact Acceleration on Clamping Force Design of Fuel Cell Stack. J. Power Sources 2016, 303, 118–125. [Google Scholar] [CrossRef] [Scilit]
- Marcelli, L.; Chamoret, D.; Mancini, E.; François, X.; Meyer, Y.; Candusso, D. Contact Pressure in the Proton Exchange Membrane Fuel Cell: Development of Analytical Models Based on Experimental Investigation and a Posteriori Design of Experiments. J. Power Sources 2024, 617, 235158. [Google Scholar] [CrossRef] [Scilit]
- Khetabi, E.M.; Bouziane, K.; Zamel, N.; François, X.; Meyer, Y.; Candusso, D. Effects of Mechanical Compression on the Performance of Polymer Electrolyte Fuel Cells and Analysis through In-Situ Characterisation Techniques—A Review. J. Power Sources 2019, 424, 8–26. [Google Scholar] [CrossRef] [Scilit]
- Sigracet 22BB. Available online: https://en.er-des.com/product-page/sigracet-22-bb (accessed on 4 August 2026).
- Carral, C.; Mélé, P. A Constitutive Law to Predict the Compression of Gas Diffusion Layers. Int. J. Hydrogen Energy 2018, 43, 19721–19729. [Google Scholar] [CrossRef] [Scilit]
- JMP Statistics Knowledge Portal. Available online: https://www.jmp.com/en/statistics-knowledge-portal (accessed on 24 August 2025).
- EPDM Data Sheet. Available online: https://www.kugelpompel.at/img/cms/Datenbl%C3%A4tter%20Gummi/Data%20sheet%20Rubber%20ball%20EPDM%20V1-02.pdf (accessed on 21 July 2025).
- Engineering Toolbox. Available online: https://www.engineeringtoolbox.com/ (accessed on 21 July 2025).
- NBR Data Sheet. Available online: https://www.kugelpompel.at/img/cms/Datenbl%C3%A4tter%20Gummi/Data%20sheet%20Rubber%20ball%20NBR%20V1-02.pdf (accessed on 21 July 2025).
- FKM Data Sheet. Available online: https://www.kugelpompel.at/img/cms/Datenbl%C3%A4tter%20Gummi/Datenblatt%20Gummikugel%20FPM%20V1-01.pdf (accessed on 21 July 2025).
- VMQ Data Sheet. Available online: https://www.kugelpompel.at/img/cms/Datenbl%C3%A4tter%20Gummi/Data%20sheet%20Silicon%20ball%20V1-02.pdf (accessed on 21 July 2025).
- Wu, C.W.; Zhang, W.; Han, X.; Zhang, Y.X.; Ma, G.J. A Systematic Review for Structure Optimization and Clamping Load Design of Large Proton Exchange Membrane Fuel Cell Stack. J. Power Sources 2020, 476, 228724. [Google Scholar] [CrossRef] [Scilit]
- Jiang, W.; Zhang, K.; Huang, X.; Cai, Z.; Zheng, J.; Kai, Y.; Zheng, B.; Song, K. Influence of Clamping Pressure on Contact Pressure Uniformity and Electrical Output Performance of Proton Exchange Membrane Fuel Cell. Appl. Energy 2024, 353, 122021. [Google Scholar] [CrossRef] [Scilit]
- Qiu, Y.; Wu, P.; Miao, T.; Liang, J.; Jiao, K.; Li, T.; Lin, J.; Zhang, J. An Intelligent Approach for Contact Pressure Optimization of PEM Fuel Cell Gas Diffusion Layers. Appl. Sci. 2020, 10, 4194. [Google Scholar] [CrossRef] [Scilit]
- Jose, A.; Bekal, S.; Shanubhogue, U.D.; Gurukrishna, K. Development and Analysis of Current Collectors for Proton Exchange Membrane Fuel Cells. Adv. Sci. Technol. Res. J. 2024, 18, 331–340. [Google Scholar] [CrossRef] [Scilit] [PubMed]
- Le Carre, T.; Blachot, J.-F.; Poirot-Crouvezier, J.-P.; Laurencin, J. Mechanical response of carbon paper gas diffusion layer under patterned compression. Int. J. Hydrogen Energy 2023, 50, 234–247. [Google Scholar] [CrossRef] [Scilit]
- Carral, C.; Mélé, P. A Numerical Analysis of PEMFC Stack Assembly through a 3D Finite Element Model. Int. J. Hydrogen Energy 2014, 39, 4516–4530. [Google Scholar] [CrossRef] [Scilit]
- Song, K.; Hou, T.; Jiang, J.; Grigoriev, S.A.; Fan, F.; Qin, J.; Wang, Z.; Sun, C. Thermal Management of Liquid-Cooled Proton Exchange Membrane Fuel Cell: A Review. J. Power Sources 2025, 648, 237227. [Google Scholar] [CrossRef] [Scilit]
- Tang, X.; Yang, M.; Shi, L.; Hou, Z.; Xu, S.; Sun, C. Adaptive State-of-Health Temperature Sensitivity Characteristics for Durability Improvement of PEM Fuel Cells. Chem. Eng. J. 2024, 491, 151951. [Google Scholar] [CrossRef] [Scilit]
- Meng, X.; Mei, J.; Tang, X.; Jiang, J.; Sun, C.; Song, K. The Degradation Prediction of Proton Exchange Membrane Fuel Cell Performance Based on a Transformer Model. Energies 2024, 17, 3050. [Google Scholar] [CrossRef] [Scilit]

Disclaimer/Publisher’s Note: The statements, opinions and data contained in all publications are solely those of the individual author(s) and contributor(s) and not of MDPI and/or the editor(s). MDPI and/or the editor(s) disclaim responsibility for any injury to people or property resulting from any ideas, methods, instructions or products referred to in the content. |
© 2026 by the authors. Licensee MDPI, Basel, Switzerland. This article is an open access article distributed under the terms and conditions of the Creative Commons Attribution (CC BY) license.