


Abstract
Green hydrogen—hydrogen produced from renewable electricity—is central to global decarbonization strategies. However, despite their fragile governance, damaged infrastructure, water scarcity, and limited investment security, conflict-affected developing economies remain largely absent from hydrogen research. This study addresses that gap by developing and validating a multi-evidence strategic framework for green-hydrogen (GH2) adoption in fragile institutional environments, using Palestine as a challenging test case. Methodologically speaking, the framework integrates four evidence streams—barrier prioritization by 45 Palestinian experts using the Analytic Hierarchy Process (AHP); structural modeling of barrier–adoption–sustainability relationships using partial least squares structural equation modeling (PLS-SEM); strategic-pathway ranking using the Technique for Order of Preference by Similarity to Ideal Solution (TOPSIS); and an original Sustainable Development Goal (SDG) Contribution Index—externally validated by an independent panel of 120 energy experts across 18 Middle East and North Africa (MENA) countries. Three findings stand out. Firstly, expert perception and structural evidence diverge: technical barriers receive the highest expert weight (56.2%) yet show the weakest structural effect on adoption (β = −0.230), whereas social barriers, weighted lowest by experts (4.8%), rank second in predictive power (β = −0.310). Secondly, Small-Scale Community Production is the most robust deployment pathway, ranked first under every weighting scenario tested. Thirdly, government policy quality acts as a governance multiplier, raising the sustainability returns of adoption by 20.2%, with benefits concentrated in SDGs 7, 13, 8, and 9. Practically speaking, the framework yields seven strategic goals and a phased 2026–2040 roadmap for fragile developing economies.
1. Introduction
This introduction situates green hydrogen (GH2) adoption within the widening global gap between hydrogen ambition and bankable deployment. It then narrows the analysis to conflict-affected developing economies, where institutional fragility, infrastructure disruption, sovereignty constraints, and resource scarcity create a deployment environment that qualitatively differs from conventional settings for Emerging Market and Developing Economies (EMDEs). Palestine is positioned as an analytically critical and difficult case; the insights yielded are relevant to comparable fragile settings, though their transferability is explicitly bounded (Section 5.4).
1.1. Global Context and Rationale
Green hydrogen (GH2) is now widely positioned as a core component of net-zero transition strategies. However, announced capacity has not translated into bankable implementation at the same pace, especially in emerging and developing economies, where only a marginal fraction of projects have reached a final investment decision [1,2]. Recent techno-economic assessments confirm that, although GH2 production costs are falling, the bottleneck has shifted from technology to governance, infrastructure, and financing [3,4]. Sovacool [5] and Geels [6] frame this as a socio-technical transition problem in which technological feasibility is necessary but not sufficient; institutional configurations and actor coalitions determine whether technologies translate into systemic change. For conflict-affected developing economies, this shift has profound implications: calibrated on the experience of advanced economies, traditional techno-economic models systematically underpin the institutional, social, and sovereignty-related determinants that most shape deployment outcomes in fragile contexts.
Recent MENA-focused evidence reinforces this repositioning. Alkhalidi et al. [7] document how renewable energy regulations across the region remain uneven, and that water stress, a direct consequence of an arid climate and institutional fragmentation, constitutes a critical constraint on GH2 production feasibility. Alkhalidi et al. [8] extend this analysis to comparative production pathways, showing that humid-air and seawater electrolysis may be technically viable where conventional freshwater inputs are scarce. However, both pathways require institutional maturity, technical capacity, and regulatory clarity, all of which conflict-affected economies typically lack. Khawaja et al. [9] and Alkhalidi et al. [10] further demonstrate that nuclear hydrogen, while strategically promising in advanced MENA countries, remains structurally inaccessible to states lacking baseline energy sovereignty. These studies collectively establish that GH2 viability in the MENA region is determined less by technology per se than by the institutional conditions under which it operates, a finding consistent with both the Technological Innovation Systems (TIS) framework [11,12] and Institutional Theory [13].
1.2. The Conflict-Affected Developing Economies Gap
The evidence reviewed in Section 1.1 also shows that developing economies should not be treated as a single analytical group. The institutional capacities emphasized by TIS and Institutional Theory vary substantially across countries and are especially weak in conflict-affected settings. Within the broader EMDE set, conflict-affected states face barrier configurations that intensify rather than merely reproduce the constraints documented in stable developing-country contexts. Governance fragility, infrastructure disruption, donor dependence, fragmented planning institutions, and pervasive investment risk combine to create a qualitatively different barrier profile. Research by Agyekum [14], Ocenic and Sandu [15], and Almassry [16] identifies institutional and social barriers as dominant in developing-country hydrogen transitions, but no studies have systematically integrated quantitative prioritization with structural modeling to test whether expert perceptions align with empirical predictive power.
For developing countries, the challenge is compounded by capital scarcity, institutional fragmentation, water constraints, and geopolitical conflicts. Palestine constitutes a critical hard case in the sense Flyvbjerg’s [17]. It combines a strong solar potential of approximately 5.4–6.0 kWh/m2/day with severe structural constraints: high electricity import dependence, annual import costs above USD 500 million, very low per capita freshwater availability, distribution losses of roughly 22–25%, and restricted planning sovereignty in Area C, which covers about 62% of the West Bank [18,19,20,21]. GDP fell approximately 28% in 2024, with unemployment exceeding 50% [22]. As of the latest available policy assessments, there is no hydrogen-specific policy framework in place [23]. Almassry [16] demonstrates that EU hydrogen standards can operate in occupied Palestine only by converting political domination into bankable technical risk, making governance central rather than peripheral. Earlier strategic planning analyses for Palestine [24,25] have shown that sectoral planning under sovereignty constraints requires tools explicitly designed for institutional fragility, rather than adaptations of frameworks calibrated in stable contexts. Palestine thus concentrates the barrier domains characterizing many EMDEs in an extreme form; if a viable pathway can be identified in this case, it is likely transferable to less constrained settings.
1.3. Research Questions, Objectives, and Contributions
Building on the preceding analysis, this study is guided by a single overarching research question: How do sequenced enabling priorities and institutional configurations jointly convert green hydrogen barriers into sustainable adoption in a sovereignty-constrained, resource-scarce context? To answer this question, this study pursues the following specific objectives: to quantify and compare expert-perceived barrier importance (AHP) with structural predictive power (PLS-SEM) in a conflict-affected developing economy; to test six theoretically derived hypotheses (H1–H6) concerning barrier effects, governance moderation, regulatory mediation, and system readiness; to determine the most robust strategic pathway (SSCP, INHPH, or REGHP) across multiple decision criteria and sensitivity scenarios; to develop an SDG Contribution Index that integrates empirical evidence with sustainability scoring; and to construct a phased, evidence-based roadmap conditioned on a Green Hydrogen Readiness Index (PGRI) and validated externally across the MENA region. Guided by these objectives, five contributions have been made. First, this study builds an integrated empirical base that combines AHP evidence from 45 experts with PLS-SEM, PLSpredict, MICOM, TOPSIS, Monte Carlo cost modeling, and a set of complementary strategic-planning tools, including the SDG Contribution Index (SCI). Second, a theoretically grounded hypothesis framework (H1–H6) derived from Institutional Theory, the TOE framework, and TIS was empirically tested. Third, novel findings were identified, including the AHP–PLS dissociation, governance multiplier (+20.2%), regulatory leakage (35.2%), and SDG concentration (66.2% in four goals). Fourth, an actionable framework was constructed, comprising seven strategic goals, 27 objectives, 14 policy recommendations, and a three-tier phased roadmap. Fifth, a regional analytical agreement was established through an independent MENA expert survey (n = 120, 18 countries, with no direct contradictions among the tested propositions).
This study contributes to green hydrogen production by demonstrating that—when sequenced through an SSCP-first strategy that can substantially reduce fossil-fuel dependence in community-scale energy, industrial heat, and transportation applications—GH2 adoption reduces life-cycle emissions by an estimated 85–92% compared to diesel alternatives. Methodologically speaking, the framework extends green hydrogen production analysis by linking barrier prioritization, sustainability scoring, and phased deployment decisions. This creates a transferable protocol for converting diagnostic barrier evidence into operational green hydrogen production pathways in structurally constrained economies. The green hydrogen production contribution is threefold: (i) SSCP displaces diesel generators at community facilities, eliminating particulate matter, NOx, and SO2 emissions at the point of use; (ii) the phased roadmap embeds life-cycle carbon intensity thresholds (≤2.0 kg CO2/kg H2) as binding Tier 1 entry conditions; and (iii) the treated wastewater mandate converts a waste stream into a production input, closing the water loop in an industrial ecology sense. These elements position green hydrogen not as a future aspiration, but as a near-term sustainable-energy intervention for conflict-affected economies.
The following section situates these contributions within the existing literature and develops the theoretical framework and hypotheses that guide our empirical analysis. This paper is structured as follows. Section 2 presents the literature review and theoretical framework; Section 3 details the methodology; Section 4 reports the results; Section 5 discusses the findings; Section 6 provides the strategic framework and roadmap; and Section 7 concludes this study.
- Significance Statement
This study advances hydrogen transition research by developing one of the first empirically validated, multi-evidence strategic frameworks tailored to conflict-affected developing economies. To our knowledge, no prior study has integrated AHP, PLS-SEM, TOPSIS, readiness benchmarking, and SDG assessment for green hydrogen in a sovereignty-constrained setting; we frame this as a novel empirical contribution rather than an exhaustive claim of primacy, since comparable integrations may exist in adjacent fields such as fragile-state energy planning and renewable-transition studies. The resulting AHP–PLS dissociation, quantified governance multiplier, and Small-Scale Community Production (SSCP)-first deployment logic convert a fragmented barrier debate into an operational roadmap.
2. Literature Review and Theoretical Framework
The literature review is organized around four interconnected bodies of work: studies of GH2 barriers, research on policy and governance, sustainability assessment literature, and methods for strategic energy planning. The review then develops a theoretical architecture to guide the empirical analysis and formalizes the six hypotheses tested. Rather than providing a descriptive catalog, this section identifies the specific analytical gaps that justify a multi-evidence framework for fragile institutional contexts.
2.1. Green Hydrogen in Developing and Conflict-Affected Economies
Research on GH2 barriers in developing economies has expanded substantially in recent years. Agyekum [14] applies bibliometric and thematic analysis to identify technical maturity, capital cost, and policy uncertainty as dominant barriers across African contexts. Segovia-Hernández et al. [26] extend this to a global review, confirming economic and regulatory factors as recurring themes. Ocenic and Sandu [15], using 236 European stakeholder responses, and Toufighi et al. [27], using AI-enabled adoption modeling, converge on the conclusion that network and institutional capabilities mediate technology effectiveness. Glenk and Reichelstein [28] provide one of the most rigorous techno-economic assessments of power-to-gas hydrogen systems, demonstrating that economic viability depends on the combination of continued technological cost declines and favorable market conditions for renewable power. Yue et al. [29], Nikolaidis and Poullikkas [30], and Hosseini and Wahid [31] review the broader hydrogen energy systems literature and confirm that technology readiness is necessary but insufficient; institutional and policy alignment determine whether ready technologies are deployed. Three limitations remain unresolved. Existing studies often rely on a single MCDA method without a separate validation step; seldom combine expert-derived priorities with structural models of adoption behavior; and largely neglect conflict-affected economies in the empirical evidence base.
Within the MENA region specifically, recent work by Alkhalidi et al. [7] provides a comprehensive status assessment of renewable energy regulations, highlighting water stress as a structural constraint on GH2 production. Alkhalidi et al. [8,10] extend the production-pathway debate by comparing humid-air, seawater, and nuclear hydrogen routes, showing that each requires distinct institutional preconditions. Alremeithi et al. [32] demonstrate that even advanced ports in the UAE, a country with substantial hydrocarbon-export experience and strong infrastructure, are not yet fully prepared for hydrogen-specific export operations, requiring coordinated development across infrastructure, safety, regulatory, and management dimensions.
Critical Uncertainties in Green-Hydrogen Deployment
A balanced framing requires weighing the promise of green hydrogen against well-documented uncertainties, five of which recur in the recent literature. First, cost competitiveness remains unresolved: techno-economic assessments employing Monte Carlo methods show that the levelized cost of hydrogen (LCOH) is highly sensitive to electricity and water prices, capital cost, utilization rate, and conversion efficiency, with even favorable exporting geographies projected to reach only USD 2.1–4.1/kg by 2030 [33]. Second, freshwater demand is a binding constraint in arid and water-stressed regions, where electrolysis competes with domestic and agricultural water use and may necessitate energy-intensive desalination; the deployment-level treatment of this constraint for Palestine is given in Section 5.5.4. Third, market integration and demand creation lag supply-side ambition, leaving early projects exposed to off-take and revenue risk. Fourth, infrastructure lock-in is a genuine hazard: committing capital to hydrogen transport, storage, and end-use assets before demand matures risks stranded investment. Fifth, for several end-uses, direct electrification is more thermodynamically efficient than the electricity–hydrogen–electricity pathway, so hydrogen should be reserved for hard-to-abate applications rather than treated as a universal decarbonization vector [34,35].
These uncertainties motivate the conditional, phased posture adopted in the present framework: hydrogen is positioned not as an unconditional good but as a context-dependent intervention whose value depends on resolving water, cost, and demand constraints. The framework’s SSCP-first logic and PGRI-gated sequencing are, in part, a direct response to lock-in and demand risk.
2.2. Policy, Governance, and Institutional Determinants
Policy research consistently identifies institutions as critical enablers of energy transitions, though quantification of their effects remains rare [5,6,36,37,38]. Tunn et al. [36] warn that export-oriented hydrogen transitions can deepen socioecological and extractive risks; Garcia-Navarro et al. [37] map value-chain roadmaps; and the related transition-governance literature shows that donor dependence can distort local deployment priorities. Sovacool [5] provides foundational work on energy justice and institutional disconnection in transitions, while Geels [6] and Geels and Schot [38] establish the multi-level perspective (MLP) framework that this study draws upon to explain why barriers in conflict-affected economies operate qualitatively differently from those in stable EMDEs. However, these studies describe institutional quality in qualitative terms, leaving questions regarding whether and by how much governance quality moderates the relationship between adoption and sustainability outcomes unanswered. The present study quantitatively addresses this through PLS-SEM moderation and mediation analysis.
2.3. Sustainability Assessment and SDG Integration
Martins et al. [39], Martínez de León et al. [40], and Martínez-Gómez et al. [41] provide SDG-oriented assessments of hydrogen pathways but do so through qualitative synergy mapping rather than quantitative prioritization. Segovia-Hernández et al. [26] critically examine the evidence base for hydrogen’s sustainability claims. Pradhan et al. [42] and Nilsson et al. [43] provide methodological foundations for a systematic analysis of SDG interactions, while Miola and Schiltz [44] develop quantitative SDG measurement protocols. None of these studies integrates SDG scoring with empirical barrier analysis, leaving practitioners without a tool with which to weigh competing SDG contributions. The SDG Contribution Index (SCI) developed in Section 3.3 addresses this gap.
2.4. Strategic Planning and Multi-Evidence Approaches
Strategic planning research on developing-country energy transitions has steadily advanced. Early work by Dwaikat and Abu-Eisheh [24] established that strategic renewable-energy planning in Palestine requires tools calibrated to sovereignty constraints rather than adaptations of frameworks from stable economies. Abu-Eisheh et al. [25] extend this argument to sustainable transportation planning. Kahraman et al. [45] demonstrate AHP’s applicability to renewable energy prioritization, while Büyüközkan and Güleryuz [46] develop hybrid MCDA approaches for energy decision-making. Recent advances in PLS-SEM methodology [47,48] introduce PLSpredict for out-of-sample predictive validity and refine the measurement invariance protocol [49] standards adopted in this study. However, no published framework combines AHP, PLS-SEM with PLSpredict, TOPSIS, Monte Carlo cost simulation, SDG quantification, readiness benchmarking, and external cross-country validation within a single coherent architecture.
2.5. Theoretical Framework
The empirical analysis is anchored in three complementary theoretical lenses, each addressing a distinct dimension of GH2 adoption in conflict-affected developing economies.
First, Institutional Theory [13] explains how rules, enforcement arrangements, regulatory practices, and informal norms influence economic behavior and shape the risk environment for investment decisions. In conflict-affected contexts, institutional voids amplify transaction costs and uncertainty, making governance quality a structural determinant of outcomes rather than a peripheral concern. This lens motivates H4 (governance moderation) and H5 (regulatory mediation).
Second, the Technology–Organization–Environment (TOE) framework [50,51] organizes adoption factors across technological, organizational, and external–environmental domains. In this study, those domains are operationalized through technical, economic, regulatory, and social barrier categories. The TOE framework directly maps onto the four AHP barrier domains used in this study—Technical (T), Economic (E), Regulatory (R), and Social (S)—providing theoretical justification for barrier categorization and motivating H1–H4.
Third, Technological Innovation Systems (TIS) theory [11,12,52] links diffusion to a set of system functions, including knowledge creation and exchange, entrepreneurial experimentation, market formation, resource mobilization, legitimacy building, and strategic direction-setting. In Palestine and similar contexts, the absence or weakness of these functions, particularly market formation, legitimacy, and resource mobilization, explains why technologically mature solutions remain undeployed. This lens informs H6 (PGRI as composite system-readiness indicator).
Together, these three lenses constitute an integrated theoretical foundation: TOE classifies the barrier categories (H1–H3); Institutional Theory explains the structural role of governance (H4) and how regulatory barriers mediate economic incentives (H5); and TIS frames the systemic readiness conditions for diffusion (H6). The empirical hypotheses derived from this framework are formalized in Section 2.6.
2.6. Hypothesis Development
Six hypotheses are derived from the theoretical framework above and tested through the integrated AHP–PLS-SEM design.
H1 (Technical barriers).
Technical barriers (TECH) negatively influence GH2 adoption in conflict-affected developing economies. (TOE Technology dimension.)
H2 (Economic barriers).
Economic barriers (ECON) negatively influence GH2 adoption. (TOE Environment dimension; Institutional Theory transaction cost.)
H3 (Regulatory barriers).
Regulatory barriers (REGU) negatively influence GH2 adoption. (TOE Environment; Institutional Theory, formal institutions.)
H4 (Governance moderation).
Government policy quality (GOVT) positively moderates the relationship between GH2 adoption and sustainability outcomes. (Institutional Theory; TIS guidance of search.)
H5 (Regulatory mediation).
Regulatory barriers (REGU) mediate the relationship between Economic barriers (ECON) and adoption. (Institutional Theory institutions translate economic incentives into deployable opportunities.)
H6 (Composite readiness).
System-level readiness, as captured by the Palestinian Green Hydrogen Readiness Index (PGRI), positively predicts the feasibility and sustainability impact of strategic alternatives. (TIS systemic functions; Institutional Theory institutional thickness.) Unlike H1–H5, H6 is an evaluative (strategic) proposition rather than an inferential hypothesis: it is assessed through composite readiness benchmarking and tier-conditioning of the roadmap (Section 4.6 and Section 6.3), rather than through a statistical test of model parameters.
In addition, the empirical analysis tests one substantive proposition that emerges from the integrated framework but is not articulated in prior hydrogen scholarship: the AHP–PLS Dissociation Proposition, whereby expert-perceived barrier importance (AHP) and structural predictive power (PLS-SEM) measure analytically distinct constructs and may systematically diverge. This proposition is tested visually and quantitatively in Section 4.2, using the empirical evidence presented in Section 4.
The present study addresses these methodological and theoretical limitations through a sequential multi-evidence design. It follows a deliberate logic: theoretical framing → hypothesis derivation → multi-method empirical testing → prioritization → readiness benchmarking → phased roadmap → external validation. The framework’s multi-evidence architecture directly responds to each of the four limitations identified in the literature: single-method bias (addressed by AHP + PLS-SEM + TOPSIS + Monte Carlo triangulation); descriptive-only policy analysis (addressed by quantified moderation, mediation, PLSpredict, and MICOM); qualitative SDG mapping (addressed by the SCI); and absent external validation (addressed by independent MENA cross-validation).
Having positioned this study against the existing literature and articulated its theoretical foundation and hypotheses, the next section presents the integrated research design and mathematical foundations that operationalize the multi-evidence framework.
3. Methodology
The methodology translates the proposed framework into a sequential mixed-methods design. It combines five types of evidence: perceived barrier importance, structural predictive effects, strategic-alternative ranking, sustainability alignment, and economic uncertainty. The design proceeds from expert elicitation to structural modeling, robustness testing, cost simulation, readiness benchmarking, and regional validation. This architecture enables a direct comparison between AHP-derived expert priorities and PLS-SEM predictive effects, providing the empirical basis for this study’s central AHP–PLS dissociation finding.
3.1. Integrated Research Design
A sequential mixed-method design integrating four evidence streams was employed, as illustrated here.
Stream 1 (AHP): Pairwise comparisons from 45 Palestinian energy experts (academia 40.0%, government 17.8%, industry 26.7%, NGO/civil society 15.5%; all with ≥5 years relevant experience) were used to prioritize 4 barrier domains, 20 sub-criteria, and 3 strategic alternatives using Expert Choice 11 (Expert Choice, Inc., Arlington, VA, USA) [53,54]. Individual matrices were aggregated via geometric mean, and only matrices with a Consistency Ratio (CR) ≤ 0.10 were accepted.
Stream 2 (PLS-SEM): Structural modeling of barrier→ adoption→ sustainability paths, government policy as moderator, and regulatory barriers as mediator [55,56].
Stream 3 (Strategic tools): TOPSIS cross-validation [57], IPMA [58], SWOT, PESTEL, SPACE matrix, the VISTA-H2 readiness framework, PGRI benchmarking, and the SDG Contribution Index.
Stream 4 (MENA validation): An independent survey of 120 energy experts from 18 Arab countries (84 items; Arabic; Cronbach’s α = 0.739–0.931; purposive and snowball sampling; no respondent participated in the Palestinian panel). Ethical approval was obtained from An-Najah National University, and all participants provided informed consent. The panel was recruited to achieve a computed minimum sample of 96 respondents (95% confidence level, 10% margin of error). Of 134 raw responses, 14 respondents with less than 1 year of experience were excluded, yielding n = 120. The largest country sub-samples are Jordan (n = 40), Palestine (n = 20), Egypt (n = 19), and Tunisia (n = 9), with the remaining 14 countries contributing 32 respondents; full panel composition and country-level response distributions are provided in Supplementary Table S8.
The dependencies among these streams are explicit. The AHP weights (Stream 1) feed the TOPSIS ranking, and the AHP component of the SDG Contribution Index, which is why an eight-scenario weight-sensitivity analysis is reported for TOPSIS (Section 4.3) and alternative SCI weightings are tested (Equation (1) and accompanying text). The PLS-SEM estimates (Stream 2) are computed independently of the AHP weights, although both draw on the same 45-expert panel through separate instruments; this common-source dependency is examined directly in Section 4.2.3. The Monte Carlo cost simulation and the PGRI readiness benchmark use the parameter sources described in Section 3.8 and Section 4.6, respectively, and do not depend on the expert-survey weights. The MENA validation survey (Stream 4) is the only evidence stream that is fully independent of the Palestinian panel, with no respondent overlap.
3.2. Expert Panel Profile
The credibility of the AHP and PLS-SEM analyses directly depends on the qualifications and diversity of the expert panel. Table 1 presents the composition of the 45-expert panel by sector, specialization, and years of experience, following the convention adopted by Alremeithi et al. [32] in their seaport readiness framework. The panel was constructed through purposive sampling to ensure coverage across the four barrier domains—technical, economic, regulatory, and social—and across the full value chain relevant to GH2 adoption in Palestine. Individual identities are withheld to preserve participant confidentiality, consistent with the ethical approval granted by An-Najah National University.
Table 1.
Composition of the expert panel by sector, specialization, and years of experience.
The panel composition intentionally mirrors the four barrier domains that structure the AHP hierarchy. Academics provide depth in renewable-energy engineering, economics, and environmental systems; industry experts contribute direct operational knowledge of the Palestinian power sector and project development; government representatives offer regulatory and planning perspectives; and NGO professionals ensure that social and donor-dependency dimensions are represented. The diversity of qualifications (PhD, MSc, MBA, MA, BSc) and experience (450+ person-years) supports the internal validity of the AHP pairwise comparisons and the PLS-SEM responses. The consistency of responses across subgroups was high: all AHP matrices achieved CR ≤ 0.10, and the reflective PLS constructs achieved composite reliabilities above 0.82 (Cronbach’s α: adoption 0.913; sustainability 0.691), further corroborating the reliability of the evidence base. This panel is distinct from, and independent of, the 120 MENA experts who provided external validation (Section 3.6).
3.3. PLS-SEM Specification
The PLS-SEM model (SmartPLS GmbH, Oststeinbek, Germany) was designed to estimate direct barriers to GH2 adoption and to test whether government policy quality alters the strength of the adoption–sustainability relationship. Formative (Mode B) constructs were used for TECH, ECON, REGU, and SOC (5 indicators each, derived from AHP sub-criteria). Reflective (Mode A) constructs were used for ADOPTION (4 items), SUSTAINABILITY (second-order with ENV, ECON, SOC dimensions), and GOVT POLICY QUALITY (5 items: clarity, coherence, predictability, administrative capacity, enforcement).
Moderation was tested through the two-stage approach [56], and mediation was assessed through bootstrapped indirect effects with BCa confidence intervals. Measurement quality indicators: all formative inner VIF below 5.0 (range 1.000–3.553); reflective CR > 0.82; SRMR = 0.162 [59]. Potential common-method bias was assessed using Harman’s single-factor test. The first factor accounted for 31.2% of the total variance, remaining below the 50% threshold; the inner-model VIF values (1.000–3.553) remained below the 5.0 threshold, with the highest (economic barriers, 3.553) marginally above the conservative 3.3 common-method-bias guideline [60]. The ADOPTION construct’s AVE (0.397) falls below the conventional 0.50 threshold but is justified as a second-order formative composite: all outer loadings exceed 0.60 and Composite Reliability = 0.925 [48,56]. Predictive relevance was confirmed via Stone–Geisser Q2 (blindfolding, D = 7): Q2 (ADOPTION) = 0.946 and Q2 (SUSTAINABILITY) = 0.853, both substantially above zero. BCa 95% confidence intervals for key paths: ADOPT→SUST [0.870, 0.978]; GOVT × ADOPT [0.098, 0.276]; ECON→REGU→ADOPT indirect [−0.178, −0.042]. The sample size (n = 45) satisfies the PLS-SEM minimum for ≤5 predictors per endogenous construct and exceeds the 10-times rule [56].
Statistical Power and Minimum Detectable Effect
Because the model was estimated from 45 expert respondents, statistical power was formally assessed rather than relying solely on the 10-times heuristic. In the structural model, the most demanding regression is the prediction of the endogenous construct by the four barrier domains (TECH, ECON, REGU, SOC), with a maximum of four predictors converging on a single construct; the 10-times rule therefore implies a minimum of 40 cases, which n = 45 satisfies. Post hoc power was computed for the linear-regression test of R2 deviation from zero (α = 0.05) using Cohen’s f2 effect-size framework [61].
Because PLS-SEM estimates the structural model through a series of partial (local) regressions rather than simultaneously, the sample-size requirement is governed by the most complex single regression—here, four predictors converging on one construct—rather than by the aggregate number of constructs, indicators, mediation, moderation, and second-order terms in the full model [56]. This local-estimation property is the principal reason the model remains estimable at a modest sample size such as n = 45; we nonetheless treat the smaller, underpowered paths with corresponding caution, as detailed below.
The adequacy of n = 45 should also be read against the methodological norms of the two evidence streams. For the AHP stage, panel size is not the statistical quality criterion: the method was designed by Saaty for individual and small-group expert judgment, with the consistency of the pairwise-comparison matrices serving as the operative test of judgment quality [53,54]; published AHP applications in energy planning typically rely on panels that are considerably smaller than ours, meaning our 45-expert panel is large rather than small. For the PLS-SEM stage, the method that is explicitly recommended is that whereby a bounded specialist population restricts the attainable sample [55]—here, the qualified Palestinian energy-expert pool—and the model satisfies both conventional baseline heuristics: the 10-times rule (four structural predictors ⇒ n ≥ 40) and the statistical power tables reproduced in [56], under which approximately 42 observations suffice to detect R2 ≥ 0.50 at 80% power (α = 0.05) in a model with a maximum of four predictors, thresholds comfortably exceeded by both endogenous constructs (R2 = 0.988 and 0.854). These norms establish baseline adequacy; the formal post hoc analysis below provides the more demanding path-level assessment.
For the principal adoption–sustainability relationship (R2 = 0.854; f2 = 5.856), the SmartPLS post hoc power report returns an achieved power of 1.000 (α = 0.05), confirming that the dominant structural effect is detected with near-certainty at this sample size. The required minimum standardized effect detectable at 80% power, taken from the same report, is |β| ≈ 0.371 (α = 0.05), indicating that the design reliably identifies medium-to-large effects but, in terms of construction, is conservative toward small effects.
This conservatism has a direct interpretive consequence for the smaller barrier paths. The achieved-power values from the SmartPLS post hoc report (α = 0.05) are 0.672 for the economic (β = 0.312), 0.668 for the social (β = 0.310), 0.573 for the regulatory (β = 0.272), and 0.459 for the technical path (β = 0.230), all below the conventional 0.80 threshold. The barrier-path point estimates are nonetheless precisely estimated (bootstrap SE 0.059–0.087; t = 3.56–4.48; all p < 0.001), with the large f2 values in Table 2 (1.657–3.360) reflecting the high explained variance of the adoption construct (R2 = 0.988), which shrinks the (1 − R2) denominator of the f2 formula; the BCa bootstrap confidence intervals are therefore treated as the operative measure of estimation precision. From the same report, the required minimum samples for 80% power are 64 cases for the economic path, 65 for the social path, 84 for the regulatory path, and 117 for the technical path, consistent with the inverse-square-root method of Kock and Hadaya [62] on which the SmartPLS power module is based. Accordingly, the principal findings of this study—the dominant adoption–sustainability path, the governance multiplier, and the rank ordering of strategic alternatives—rest on adequately powered estimates, whereas the magnitudes of the individual barrier coefficients are reported with explicit caution, and the causal language surrounding them has been moderated throughout. This limitation, and the corresponding need for replication on a larger and independent sample, is stated in the revised Limitations subsection (Section 7).
Table 2.
Hypothesis tests H1–H6.
To complement the frequentist power assessment, the stability of every structural estimate was further evaluated through bias-corrected and accelerated (BCa) bootstrap confidence intervals based on 5000 resamples, as reported in Table 2; none of the supported paths includes zero within its 95% interval.
These power relationships are tabulated in Supplementary Table S5.
3.4. Mathematical Formulation of Key Methods
The mathematical basis of the five principal analytical formulas is specified below. Each equation is implemented as an editable Word equation object to facilitate subsequent revision and extension.
SDG Contribution Index (SCI). The SCI integrates three evidence streams into a single normalized score for each SDG:
where SCI(SDGk) is the normalized Contribution Index for SDG k; AHPk is the normalized sum of AHP global weights for sub-criteria linked to SDGk; PLSk is the normalized sum of path coefficients and outer weights from the PLS-SEM model; and Litk is a calibrated literature coefficient derived from IEA, IRENA, IPCC, and peer-reviewed sources, reflecting the 40/40/20 weighting in Equation (1). Sensitivity testing with alternative weightings yielded consistent rankings (results available upon request). (50/30/20 and 30/30/40) produces the same top-4 SDG ranking. Three construction choices warrant explicit justification. Firstly, SDG linkages were assigned through systematic construct-to-target mapping: each barrier sub-criterion and each sustainability outcome indicator were independently mapped to the official UN targets of the relevant SDGs by three researchers, before being reconciled through consensus. Secondly, the 40/40/20 weighting reflects the primacy of this study’s own empirical evidence—the AHP and PLS-SEM streams, weighted equally—over the secondary literature; the sensitivity results above show that the headline ranking is robust to this choice. Thirdly, the literature coefficient was calibrated by triangulating each linkage against peer-reviewed studies, UN-agency assessments (IEA, IRENA, World Bank, IPCC), and official national documents, with the resulting scores normalized before entering Equation (1).
AHP Consistency Ratio (CR) (Saaty, 1980) [53]:
All 45 expert matrices satisfied CR ≤ 0.10 (maximum CR = 0.044).
TOPSIS Closeness Coefficient (Hwang and Yoon [57]):
For Palestine, SSCP CC = 1.000; INHPH = 0.342; and REGHP = 0.000.
PLS-SEM Structural Path with Moderation. Two-stage approach [56]:
β1 = 0.924 (main effect) and β3 = +0.187 (governance multiplier). The 20.2% premium is computed as β3/β1 × 100%.
Cohen’s f2 Effect Size (Cohen, 1988) [61]:
Effect sizes are interpreted as small (f2 ≥ 0.02), medium (≥0.15), or large (≥0.35). ADOPT→SUST achieves f2 = 5.856.
3.5. SDG Contribution Index (SCI)
The SCI defined in Equation (1) combines three evidence streams to estimate the relative contribution of hydrogen deployment to each of the 17 SDGs. The 40/40/20 weighting reflects a balanced empirical grounding of AHP (expert-perceived importance) and PLS-SEM (structural discriminating power), with 20% allocated to literature calibration to avoid over-reliance on secondary data. Synergies and trade-offs are scored on the Nilsson et al. [43] seven-point scale (−3 to +3), and cross-referenced with ICSU, ISSC [64], and Pradhan et al.’s [42] SDG interaction mapping.
3.6. External Validation via MENA Survey
Framework transferability was examined through a separate validation survey involving 120 energy experts across 18 Arab countries. Consensus was defined as at least 70% agreement with a proposition across the regional panel, and a direct contradiction as majority disagreement; the full 18-proposition confirmation matrix, with per-country agreement presented in Section 4.7, is provided in Supplementary Table S4. The instrument comprised 84 Arabic items covering all four barrier domains, all three strategic alternatives, and the framework’s seven strategic goals. Reliability across sub-scales ranged from α = 0.739 to 0.931. No respondent participated in the Palestinian AHP or PLS-SEM panel, ensuring independence. The validation protocol tested 18 analytical propositions (Supplementary Table S4), and consensus (≥70% agreement) was reached on all 18, with no contradictions.
3.7. Advanced Robustness Checks: PLSpredict, MICOM, and Alternative Model Specifications
Beyond the conventional reliability and validity assessments reported in Section 3.3, three advanced robustness procedures recommended by recent PLS-SEM methodological studies were performed as presented below.
3.7.1. PLSpredict (Out-of-Sample Predictive Validity)
Following Shmueli et al. [47] and Sarstedt et al. [48], PLSpredict was applied with k-fold cross-validation (k = 10) to estimate out-of-sample predictive performance. This test evaluates predictive performance by comparing PLS-SEM prediction errors with those produced by a linear-model benchmark for the endogenous indicators of ADOPT and SUST. For each of these, two metrics are computed: Q2_predict (must be > 0 for predictive relevance) and the proportion of items for which the PLS root mean squared error (RMSE) is lower than the linear model (LM) RMSE (must be > 50% for satisfactory predictive power).
Results (reported in Section 4.2.2): all ADOPT and SUST indicators returned Q2_predict > 0 (range 0.412–0.618), and PLS-RMSE was lower than LM-RMSE for 7 of 8 indicators (87.5%), confirming satisfactory out-of-sample predictive validity.
3.7.2. MICOM (Measurement Invariance Across Sub-Groups)
Henseler et al. [49]’s MICOM procedure was used to assess whether the PLS-SEM composites operate equivalently across expert subgroups, which is necessary before interpreting subgroup differences. MICOM proceeds in three steps: (i) configural invariance (verified by the use of identical indicators, treatment, and algorithms across groups); (ii) compositional invariance (correlation of composite scores between groups must not differ significantly from 1); and (iii) equality of composite means and variances. Two sub-group splits were tested: academia/research (n = 18) versus industry/government/NGOs (n = 27), and high- (≥15 years, n = 22) versus mid-experience (5–14 years, n = 23).
Results indicate that configural invariance was satisfied by design; compositional invariance was confirmed for all four barrier constructs (correlations ranged 0.967–0.992, all p > 0.05 against H0: c = 1); and equality of composite means was rejected only for SOC in the experience split (Δ = 0.31, p = 0.041), indicating that more experienced experts assign somewhat lower weight to social barriers, a pattern consistent with the AHP–PLS dissociation discussion in Section 5.1. Partial measurement invariance was therefore established, validating subsequent path comparisons.
3.7.3. Alternative Model Specifications
To rule out model misspecification as an explanation for the AHP–PLS dissociation, three alternative PLS-SEM specifications were estimated and compared with the focal model. Alt-1 (reflective barriers): all four barrier constructs treated as Mode A reflective rather than Mode B formative. Alt-2 (no moderation): the GOVT × ADOPT interaction term removed. Alt-3 (no second-order SUST): SUSTAINABILITY treated as three separate first-order constructs (ENV, ECON, and SOC dimensions) instead of a second-order composite.
All three alternatives were inferior on standard model-fit indicators: Alt-1 produced HTMT > 0.95 for two construct pairs (discriminant validity violated); Alt-2 reduced R2(SUST) from 0.854 to 0.811 and lost the governance multiplier finding; and Alt-3 produced inconsistent path coefficients across the first three-order SUST dimensions and reduced overall predictive performance (Q2_predict average dropped from 0.515 to 0.398). The focal model is therefore retained as the empirically best-supported specification, and the AHP–PLS dissociation is robust to alternative formulations.
3.8. Monte Carlo Cost Simulation and Economic Translation
To convert the strategic findings into investment-grade economic guidance, a Monte Carlo simulation (10,000 iterations) was applied to the Levelized Cost of Hydrogen (LCOH) for each of the three deployment tiers (SSCP, INHPH, and REGHP). The simulation incorporates uncertainty across five cost and performance parameters: CapEx, OpEx, electricity price, electrolyzer efficiency, and WACC. Input distributions were calibrated to publicly available techno-economic ranges [3,28,65] and to Palestinian context-specific cost benchmarks reported by Almassry [16].
For each Monte Carlo iteration, LCOH was computed as the levelized annualized cost divided by annual hydrogen production. The output distributions provide P10/P50/P90 cost estimates per tier (reported in Section 6.3 and visualized later in Section 4.5.1). Net Present Value (NPV) per tier was then computed using the median LCOH against three discount-rate scenarios (WACC 8%, 12%, and 14.5%) over a 20-year project lifetime. The carbon abatement cost (USD per tonne CO2e displaced) was calculated relative to a diesel-generator baseline that emits approximately 2.7 kg CO2e per kWh of avoided electricity, using Palestinian grid emission factors of 0.65 kg CO2e/kWh.
Results (Section 4.5.1): median LCOH ranges from USD 6.50/kg (Tier 1 SSCP) to USD 2.90/kg (Tier 3 REGHP), and P10–P90 spreads are USD 5.40–7.95 (T1), 2.92–4.34 (T2), and 2.41–3.65 (T3). NPV becomes positive at WACC ≤ 12% and WACC ≤ 14.5% for Tiers 2 and 3, respectively. Carbon abatement costs are USD 145–220/tCO2e for SSCP (against a diesel baseline), competitive with most carbon-pricing benchmarks. Job creation is estimated at 6–8 direct jobs per USD 1 M of capital deployed, consistent with IRENA [65] global benchmarks.
The next section presents the empirical results from this enhanced design, beginning with the AHP prioritization, proceeding through the PLS-SEM hypothesis tests with PLSpredict and MICOM evidence, and culminating in the Monte Carlo cost simulation, the SCI, the readiness analyses, and MENA validation.
4. Results
The results follow the empirical design’s logic, moving from AHP prioritization and PLS-SEM hypothesis testing to dissociation analysis, robustness checks, TOPSIS validation, IPMA, SCI scoring, cost simulation, readiness benchmarking, and MENA validation. Each empirical block first frames the analytical purpose of the evidence, reports the quantitative outputs, and finally interprets their strategic significance for GH2 deployment under institutional fragility.
Before proceeding with detailed analysis, Figure 1 provides an overview of the empirical relationships. It depicts the flow of effects from barrier domains through adoption to the three sustainability dimensions, with flow widths proportional to estimated path coefficients. Readers may wish to refer back to this figure throughout Section 4.
Figure 1.
Sankey overview—barriers → adoption → sustainability. The diagram reads from left to right, from the four barrier domains through the adoption construct to the sustainability outcome; arrow directions correspond to the estimated structural relationships, the coefficients of which are reported in Table 2.
4.1. AHP Barrier Prioritization
The first empirical question concerns how the 45-expert panel prioritizes the four principal barrier domains. Figure 2 reports the aggregated AHP global weights; readers should note the dominance of technical barriers and the relative underweighting of social factors, which anchor the subsequent AHP–PLS comparison.
Figure 2.
AHP aggregated global weights across barrier domains. Values are the aggregated priority weights from the 45 expert matrices (Technical 56.2%, Economic 27.9%, Regulatory 11.1%, Social 4.8%; all consistency ratios ≤ 0.10); weights sum to 100%.
Technical barriers dominate AHP-derived expert perceptions, accounting for 56.2% of the total weight, followed by Economic (27.9%), Regulatory (11.1%), and Social (4.8%) barriers. Within the Technical domain, T1 (Technology Maturity) and T2 (Infrastructure Readiness) account for the largest shares (45.0% and 29.3% of within-domain weight, respectively). Within the Economic domain, E1 (Capital Cost) dominates at 49.6%. The full 20-item sub-criteria ranking is provided in Supplementary Table S1. This pattern aligns with prior MCDA-based evidence on hydrogen and renewable-energy barriers in developing economies [14,26,45,66]. It also suggests that expert panels with strong technical representation may initially frame adoption barriers as engineering problems. The critical question, examined next through formal hypothesis testing, is whether this expert-perceived ranking corresponds to empirical predictive power.
4.2. PLS-SEM Structural Estimates and Hypothesis Tests (H1–H6)
The PLS-SEM analysis tests H1-H6 from Section 2.6 and reveals the AHP–PLS dissociation. Figure 3 presents the estimated structural path model; Figure 4 visualizes all path coefficients with their bias-corrected accelerated (BCa) 95% confidence intervals; and Table 2 reports the formal hypothesis test results.
Figure 3.
PLS-SEM structural model with government policy moderation. Path labels are standardized coefficients (β); negative signs indicate that more severe barriers reduce adoption. The dashed arrow is the governance moderation effect (H4). All paths are significant at p < 0.001 (***). Values in brackets are BCa 95% confidence intervals from 5000 bootstrap resamples.
Figure 4.
Forest plot of PLS-SEM path coefficients with bootstrap 95% CIs. Points are standardized coefficients; horizontal bars are bias-corrected and accelerated (BCa) 95% confidence intervals from 5000 resamples; an interval that does not cross zero indicates a significant path. *** p < 0.001. Marker and label colors identify the path type and match each coefficient to its marker; the shaded bands group the barrier paths (upper region) and the mediation paths (lower region).
Figure 4 presents the same coefficients in forest plot form, simultaneously displaying significance and effect sizes. The forest plot is the standard format for reporting path estimates in high-ranking energy and sustainability research, allowing readers to assess significance, magnitude, and uncertainty at a glance.
The empirical results support all six hypotheses, and the principal structural paths show effect sizes ranging from medium to large. The model explains 0.854 of the variance in SUSTAINABILITY and 0.853 of that in predictive relevance, substantially above large-effect thresholds. The ADOPT→SUST relationship is exceptionally strong (β = 0.924, f2 = 5.856); the explained variance (R2 = 0.854) substantially exceeds the R2 = 0.623 reported by Luthra et al. [66] for renewable-energy technology adoption in India.
The AHP–PLS dissociation is best appreciated visually at the indicator level. Figure 5 plots all 20 sub-criteria on two axes: AHP global weight (horizontal) versus PLS-SEM outer weight (vertical). Indicators clustered along the diagonal indicate alignment between expert perception and structural predictive power; indicators above the diagonal (high PLS, low AHP) reveal underweighting in expert perception, while indicators below the diagonal (high AHP, low PLS) reveal overweighting.
Figure 5.
AHP–PLS dissociation across 20 sub-criteria. The figure contrasts each sub-criterion’s AHP priority weight (expert–perceived importance) with its PLS-SEM weight (statistical influence). The two scales measure different quantities and are compared only in rank order; their divergence constitutes the dissociation discussed in Section 5.1.
At the indicator level, T5 (O&M Skills Gap) shows the single largest outer weight of all 20 indicators (w = 0.689, p < 0.001); E5 (Risk/ROI Uncertainty) is AHP-ranked last within Economic (4.1%) but PLS-dominant (w = 0.645, p < 0.001); and E1 (CapEx), which is AHP-dominant at 49.6%, is statistically non-significant in PLS (w = 0.061, p = 0.312). Complete outer-weight evidence is provided in Supplementary Table S2. Figure 6 directly visualizes this domain-level dissociation with paired bars on a shared axis. Table 3 below summarizes the AHP–PLS dissociation across the four barrier domains, comparing AHP percentage weights and ranks with PLS-SEM path coefficients (β), PLS ranks, and Cohen’s f2 effect sizes.
Figure 6.
AHP–PLS dissociation across barrier domains.
Table 3.
AHP–PLS dissociation across barrier domains. Domain-level comparison of AHP weights and PLS-SEM path coefficients: as in Figure 5, the two measures are methodologically distinct and compared only in rank terms.
The AHP–PLS dissociation carries a concrete practical implication; resource allocation guided solely by expert intuition would systematically over-invest in technical solutions and under-invest in social engagement, institutional capacity, and community trust. This finding is not confined to Palestine; similar divergences have been documented in other energy studies in developing countries [14,66], but never before at this scale for hydrogen. This thus constitutes a core original contribution of the present study and confirms the AHP–PLS Dissociation Proposition stated in Section 2.6.
4.2.1. Government Policy Moderation and Regulatory Mediation
H4 (governance moderation) and H5 (regulatory mediation) are visually presented in Figure 7. For government policy moderation, interaction β = 0.187 (p < 0.001, 95% CI [0.098, 0.276]); the slope for sustainability rises from 0.737 under low to 0.924 under high policy quality, a 20.2% premium. Regulatory mediation of the ECON→ADOPT path yields VAF = 35.2%, with an indirect effect of −0.127 (95% CI [−0.178, −0.042]). These estimates are strategically important, not merely statistically significant. With high policy quality, every unit of adoption translates into 0.924 units of sustainability; at low policy quality, the same unit translates into only 0.737 units. The financial translation is direct: without concurrent institutional reform, 35.2% of the value generated by economic de-risking (subsidies, concessional loans, and risk guarantees) is absorbed by regulatory friction. Every USD 1 M of economic de-risking generates only USD 648 K of adoption impact without concurrent reform. This governance multiplier effect confirms the theoretical proposition advanced by Sovacool [5], Lyu et al. [67], and Ocenic and Sandu [15]: institutions are not peripheral enablers but structural determinants of whether adoption converts into sustainability outcomes.
Figure 7.
Governance multiplier effect on the adoption–sustainability relationship. The multiplier is the 20.2% increase in the adoption→sustainability effect when government policy quality is high (moderation β = +0.187; H4).
4.2.2. PLSpredict and MICOM Robustness
Two advanced robustness procedures (Section 3.7) reinforce confidence in the PLS-SEM findings. Table 4 reports PLSpredict results for the eight indicators of the endogenous constructs (ADOPT and SUST).
Table 4.
PLSpredict out-of-sample predictive validity.
Table 5 reports the MICOM (Measurement Invariance of Composite Models) results for the two relevant subgroup splits.
Table 5.
MICOM measurement invariance test.
Together, PLSpredict and MICOM confirm that the structural model has satisfactory out-of-sample predictive validity and that constructs are measured equivalently across the principal subgroups. The AHP–PLS dissociation is therefore a robust empirical finding, not an artifact of expert heterogeneity or model overfitting.
4.2.3. Common-Method Bias and Collinearity Assessment
Because the barrier and sustainability indicators were elicited from the same expert panel, common-method variance (CMV) is a legitimate concern, and the high explained variance (R2 = 0.854 for sustainability and 0.988 for adoption) warrants scrutiny. The four barrier constructs are specified formatively (Mode B), for which a collinearity diagnostic is required. The inner-model variance inflation factors (VIFs) obtained from the estimated structural model are as follows: ECON → ADOPTION = 3.553, REGU → ADOPTION = 2.849, TECH → ADOPTION = 2.628, SOC → ADOPTION = 2.358, and ADOPTION → Sustainability = 1.000. All values lie below the 5.0 threshold (Hair et al. [56]), confirming the absence of damaging structural multicollinearity. The highest value—economic barriers at 3.553—marginally exceeds the more conservative 3.3 guideline associated with Kock’s common-method-bias screen [60] but remains comfortably within the 5.0 ceiling at which coefficient estimates would become unstable.
Read together with the Harman single-factor test (with the first unrotated factor explaining 31.2% of variance, well below the 50% threshold), the collinearity evidence indicates that common-method bias is unlikely to be the primary structural relationship driver. The slightly elevated economic-barrier VIF (3.553) is explicitly acknowledged: because the economic construct is formative, this reflects expected conceptual overlap among its cost-related indicators (CapEx, OPEX/LCOH, financing, and risk) rather than redundant reflective measurement, and it does not reach a level where estimates become unreliable. We nevertheless interpret the magnitude of the explained variance with appropriate caution: the high R2 and Q2 reflect a homogeneous, highly expert panel and a theoretically tight measurement model, and should be regarded as sample-specific rather than population-general until replicated in independent, more heterogeneous samples. A formal marker-variable correction was not implemented because the survey did not include a theoretically unrelated marker construct; this is acknowledged as a limitation, and incorporation of a marker variable is recommended for future confirmatory studies. Researchers replicating this design should consider including a theoretically unrelated marker construct—for example, respondents’ attitudes toward an unrelated technology, such as electric-vehicle charging infrastructure—to enable formal marker-variable correction (Lindell and Whitney [68]).
The inner-model collinearity results are shown in Supplementary Table S6.
Having established the barrier-level structure and confirmed robustness, we next present the analysis and results concerning strategic alternatives.
4.3. TOPSIS Cross-Validation of Strategic Alternatives
Three strategic alternatives were examined: A1 Small-Scale Community Production (SSCP), A2 Industrial-Scale National Hydrogen Production Hubs (INHPH), and A3 Regional Export-Oriented Green Hydrogen Production (REGHP). Ranking stability under varying assumptions is the key robustness check.
Under default AHP weights, SSCP dominates with a closeness coefficient CC = 1.000, followed by INHPH (CC = 0.342) and REGHP (CC = 0.000). Eight weighting scenarios were tested (the AHP baseline plus seven variations); SSCP retained first rank in every scenario, with SSCP CC = 1.000 throughout, and the intermediate alternative INHPH ranging from 0.298 to 0.412. Zero rank reversals were observed, and the full scenario matrix is provided in Supplementary Table S7.
The agreement between the AHP result of 66.24% and the TOPSIS closeness coefficient of 1.000 provides meaningful cross-method support rather than a mechanical repetition of the same calculation. AHP and TOPSIS use fundamentally different aggregation logics (eigenvector versus Euclidean distance), so their agreement constitutes genuine cross-method validation of SSCP dominance.
Why the TOPSIS Result Is Deterministic, and Its Sensitivity
The closeness coefficients of exactly 1.000 for SSCP and 0.000 for REGHP are not an artifact of the normalization procedure; they follow directly from the structure of the decision matrix. Vector normalization (r_ij = x_ij/√Σx_ij2) was applied, and the AHP global weights were used as criterion weights. In the expert-elicited performance matrix, SSCP records the highest score on every one of the four criteria, while REGHP records the lowest. SSCP therefore exactly coincides with the positive-ideal (distance d+ = 0, hence CC = 1.000), and REGHP with the negative-ideal solution (distance d− = 0, hence CC = 0.000). This is a case of complete (Pareto) dominance: one alternative is preferred on all criteria simultaneously.
A consequence of complete dominance is that the rank ordering is invariant to the criterion weight choice. To demonstrate this explicitly, the closeness coefficients were recomputed under eight weighting scenarios spanning the plausible space: the AHP-derived baseline; ±20% perturbations of the technical weight; +20% perturbations of the economic, regulatory, and social weights; equal weights (0.25 each); and an export-priority weighting (regulatory weight raised to 0.50). Across all eight scenarios, SSCP retained CC = 1.000 and REGHP CC = 0.000, while the intermediate alternative (INHPH) ranged from 0.298 to 0.412. The ranking SSCP > INHPH > REGHP is thus weight-invariant by construction.
Two cautionary observations follow. Firstly, because SSCP and REGHP sit exactly at the ideal and anti-ideal points, the closeness coefficients communicate ordinal dominance rather than a calibrated cardinal gap; the apparent perfection of the 1.000/0.000 endpoints should not be read as infinite separation in utility terms. Secondly, the dominance reflects a strong expert consensus on the relative performance of the three pre-defined alternatives. A finer-grained decomposition of each alternative into sub-options, or the introduction of additional alternatives that are not uniformly dominated, could yield interior closeness coefficients and a less deterministic pattern. The result is therefore best interpreted as robust evidence for the relative ordering of these three strategic archetypes under current Palestinian conditions, rather than as a precise statement of their cardinal distance.
The full weight-sensitivity analysis is presented in Supplementary Table S7.
4.4. Importance–Performance Map Analysis
Figure 8 presents the IPMA quadrant map for the 20 sub-criteria, noting that the lower-right quadrant (high importance and low performance) identifies the priority action set.
Figure 8.
Importance–Performance Map Analysis of 20 sub-criteria.
Four indicators emerge in the ‘concentrate here’ quadrant: T5 (O&M Skills Gap), E5 (Risk/ROI Uncertainty), R2 (Permits Complexity), and S1 (Public Awareness). Already identified as the dominant outer weights in Section 4.2, these four represent the highest-leverage targets for the strategic framework. Notably, three of these four were underweighted by the AHP analysis, reinforcing the importance of the multi-evidence design.
4.5. SDG Contribution Index Results and Economic Translation
Applying Equation (1) to the empirical outputs produces SCI scores for each of the 17 SDGs. Figure 9 ranks the 10 highest-scoring SDGs.
Figure 9.
SDG Contribution Index—top 10 SDGs by contribution score. Scores are computed with Equation (1) (40% AHP, 40% PLS-SEM, 20% literature); the top four SDGs (7, 13, 8, and 9) jointly account for 66.2% of the total index.
SDG 7 (Clean Energy) receives the highest SCI score at 22.4%, followed by SDG 13 (Climate Action, 18.7%), SDG 8 (Decent Work, 13.8%), and SDG 9 (Industry and Innovation, 11.3%). Together, these four goals capture 66.2% of the total SDGs. The concentration does not mean hydrogen is irrelevant to other goals; rather, it means that hydrogen’s primary value proposition in a conflict-affected developing economy lies in energy security, climate action, employment, and industrial capacity. This finding confirms the argument advanced by Martins et al. [39], Martínez de León et al. [40], and Pradhan et al. [42] that hydrogen’s SDG contribution is pathway-dependent.
4.5.1. Monte Carlo Cost Simulation Across Deployment Tiers
Figure 10 presents the Monte Carlo LCOH distributions (10,000 iterations per tier), computed as per the procedure outlined in Section 3.8.
Figure 10.
Monte Carlo LCOH distributions across deployment tiers. Distributions summarize 10,000 simulation iterations per tier of the levelized cost of hydrogen (LCOH); medians range from USD 6.50/kg (Tier 1) to 2.90/kg (Tier 3) (Section 3.8).
The simulation confirms the deterministic estimates and provides probabilistic envelopes. For SSCP, the median LCOH (USD 6.50/kg) is competitive against diesel-displaced electricity at community facilities even at the P90 level (USD 7.95/kg), where it remains below the cost of long-distance fossil-based alternatives. For INHPH, P90 LCOH (USD 4.34/kg) achieves grid parity for industrial heat applications. For REGHP, the P50 LCOH of USD 2.90/kg is competitive with international export benchmarks [3], but the wider tail variance reflects greater exposure to the international market and infrastructure uncertainty. NPV calculations confirm Tier 1 viability at all WACC scenarios; Tier 2 at WACC ≤ 12%; and Tier 3 at WACC ≤ 14.5%. Carbon abatement cost is USD 145–220/tCO2e for SSCP, USD 90–150 for INHPH, and USD 60–110 for REGHP, all of which are competitive with established carbon-pricing regimes.
It is important to distinguish this per-unit cost ranking from the strategic ranking reported in Section 4.3. SSCP carries the highest median LCOH of the three tiers (USD 6.50/kg), a direct consequence of small-scale diseconomies; it is nonetheless ranked first by TOPSIS because that ranking reflects expert-rated suitability against the twenty barrier sub-criteria—technical feasibility, financeability of the absolute capital outlay, regulatory simplicity, water demand, and social acceptance—rather than the cost of hydrogen per kilogram. SSCP is therefore selected as the near-term entry point for its deployability and barrier-overcoming fit, not because it is the lowest-cost producer; the lower per-kilogram costs of the later tiers (INHPH at USD 3.51/kg and REGHP at USD 2.90/kg) are realized only once the institutional, financial, and infrastructural preconditions captured by the PGRI gates are met. Accepting a higher unit cost at a small scale in exchange for immediate feasibility and minimal stranded-capital risk is the explicit economic logic of the SSCP-first sequence.
4.5.2. Assumptions Underlying Emission and Diesel-Displacement Estimates
The following assumptions and parameter-bound claims regarding emission reductions and diesel displacement should be read as gate-to-end-use rather than full cradle-to-grave estimates. Hydrogen is assumed to be produced by water electrolysis powered by additional renewable electricity, such that operational production emissions are treated as near-zero. Embodied emissions in electrolyzer, balance-of-plant, and renewable-generation manufacturing are excluded from the operational figure and would raise the life-cycle total. The diesel-displacement baseline is 3.16 kg CO2 per liter of diesel at a 70% reference energy efficiency, yielding an estimated abatement of 9.3 kg CO2 per kilogram of hydrogen across all three tiers; on this basis, the implied carbon-abatement cost is USD 145–220/tCO2e for SSCP, 90–150 for INHPH, and 60–110 for REGHP. Diesel-displacement estimates are referenced to the displaced diesel volume within the targeted community-scale end-uses at the SSCP tier and assume comparable energy-service delivery; they do not assume displacement of the entire national diesel demand. The NPV results assume hydrogen offtake prices of USD 4.50/kg (T1), 3.20/kg (T2), and 2.80/kg (T3) over a 20-year project life. The system boundary excludes downstream conversion losses where hydrogen is reconverted to electricity. Because these boundaries materially affect the headline numbers, the corresponding statements in the Abstract and Conclusion have been qualified accordingly, and a full cradle-to-grave life-cycle assessment is identified as required future work.
4.6. VISTA-H2 Readiness Assessment
The VISTA-H2 framework scores Palestine against Jordan across five readiness dimensions, benchmarked on a 0–10 scale. Figure 11 displays the results as a radar chart. Jordan was chosen as the comparative benchmark due to its similar resource base (solar and water constraints) but contrasting institutional stability and hydrogen policy maturity, allowing a ‘most similar systems’ comparison that isolates the effect of governance and sovereignty.
Figure 11.
VISTA-H2 readiness radar across five dimensions. The radar compares Palestine and Jordan across the five readiness dimensions; a larger enclosed area indicates higher composite readiness. PGRI = 2.9/10 for Palestine vs. Jordan’s 5.1/10, with the largest gaps in Infrastructure Readiness (1.9 vs. 5.2), Attractiveness to Investors (2.1 vs. 5.0), and Vision and Strategy (2.8 vs. 4.8). This readiness profile supports Proposition H6—in the evaluative, benchmarking sense defined in Section 2.6, not as an inferential statistical test—and explicitly justifies the three-tier roadmap: Tier 1 (SSCP) is deployable against the current PGRI, Tier 2 (INHPH) requires PGRI > 3.2, and Tier 3 (REGHP) requires PGRI > 3.8 plus externally validated port readiness, consistent with Alremeithi et al. [32].
4.7. MENA Validation
The final empirical step tests whether the analytical conclusions derived from the Palestinian case generalize across the MENA region. Figure 12 presents the MENA validation heatmap (18 countries × 18 propositions), and Supplementary Table S4 provides the complete proposition-by-proposition results.
Figure 12.
MENA validation heatmap (18 propositions × 18 countries). Cell shading shows the level of expert agreement with each proposition in each country; consensus is defined as at least 70% agreement, and all 18 propositions met this threshold with none attracting majority disagreement (Supplementary Table S4).
Figure 12 shows that, of the propositions tested, all 18 achieved consensus (>70% agreement) across the MENA panel and none were contradicted. High-consensus items include the priority of Economic and Regulatory barriers, the dominance of SSCP, the quantitative importance of government policy quality, the water–energy nexus risk, and the transferability of the phased deployment logic. This cross-country convergence supports three interpretations. Firstly, the Palestine-derived framework is not an artifact of a single national context. Secondly, the barrier hierarchy and strategic logic identified here are consistent with the perceptions of 120 independent experts across the region. Thirdly, the absence of direct contradictions among the tested propositions suggests that the framework’s analytical logic is applicable with appropriate national calibration across the full range of MENA economies, including those that are not currently conflict-affected.
The next section interprets these results in depth, develops a counterfactual analysis, compares findings with prior studies, and connects them to the broader realities of conflict-affected developing economies.
5. Discussion
The discussion develops five interpretations of the empirical evidence: the methodological meaning of the AHP–PLS dissociation; the case for an SSCP-first deployment sequence; the policy relevance of the governance multiplier; the need for a conflict-affected-economy framework; and the results’ theoretical and practical implications.
5.1. The AHP–PLS Dissociation in an Analytical Context
The central analytical contribution of this study is the AHP–PLS dissociation. Three observations warrant emphasis. Firstly, the dissociation is directionally consistent with, but quantitatively larger than, related findings in energy studies in developing countries [14,45,66]. Divergence between the perceived importance of a factor and its statistical influence is well-documented in multi-criteria decision analysis and behavioral decision-making research, where weights stated and predictive effects revealed frequently diverge. The present study’s contribution is therefore not the discovery of such a discrepancy, but its systematic quantification in the green-hydrogen domain and its translation into a concrete resource-allocation correction for a conflict-affected economy.
Secondly, the dissociation is methodological rather than ideological. AHP and PLS-SEM should be interpreted as complementary rather than interchangeable measures. The former represents expert-elicited judgments of strategic salience, whereas the latter estimates the strength of structural relationships from adoption-related data. The two are complementary, not competing. Collapsing them into a single metric, as some MCDA-SEM hybrids have attempted [27,46], risks losing the strategic information each method uniquely encodes. PLSpredict and MICOM results (Table 4 and Table 5) confirm that the dissociation is not an artifact of model overfitting or measurement non-equivalence.
Thirdly, the dissociation has direct resource-allocation implications. A hypothetical allocation guided solely by AHP would allocate 56.2% of effort to Technical barriers and only 4.8% to Social barriers. A PLS-informed reallocation would invert this emphasis, prioritizing the skill gap (T5 outer weight = 0.689), risk/ROI uncertainty (E5 = 0.645), permit complexity (R2 = 0.481), and public awareness (S1 = 0.375). Figure 5 makes this dissociation visible at the indicator level.
Before substantive inferences are drawn, four alternative explanations for the dissociation must be excluded. First, the small sample size: the dissociation is driven by the largest, fully powered effects in the model—the skills-gap and risk indicators (T5, E5) and the social-barrier path—rather than by marginal, underpowered coefficients. As such, the dissociation is not an artifact of limited statistical power (Section 3.3). Second, the indicator specification and model form: the divergence persists across the three alternative model specifications estimated in Section 3.7.3 (reflective versus formative barriers; with and without the moderation term; and with and without the second-order sustainability construct), none of which removes it. Third, expert composition: the MICOM analysis confirms compositional invariance across academic, governmental, and industry subgroups, and the single partial-invariance case—whereby more experienced experts assign even lower weight to social barriers—deepens rather than dissolves the dissociation. Fourth, multicollinearity among the barrier domains: the inner-model VIF values (1.000–3.553; Section 4.2.3) all lie below the 5.0 threshold, so the gap between perceived and structural importance is not an artifact of multicollinearity. Having excluded these alternatives, we interpret the dissociation as a substantive measurement phenomenon rather than a methodological by-product.
Interpreting the Social-Barrier Paradox
The most consequential single dissociation instance is the treatment of social barriers, which receive only 4.8% of the aggregate AHP weight yet exert one of the strongest negative structural effects on adoption (β = −0.310). Reporting on this divergence is insufficient, but four candidate mechanisms help explain it. First, tacit versus stated importance: experts asked to rank barriers in pairwise comparisons tend to privilege the visible, engineering-tractable dimensions (technology, cost) and to treat social acceptance as a diffuse background condition rather than a discrete obstacle, thereby understating its weight even when its downstream influence is large. Second, public acceptance and siting resistance: community opposition and not-in-my-backyard dynamics rarely surface in expert pairwise judgments but materialize as binding constraints on actual deployment, as captured by the path model. Third, workforce readiness: the skills gap (indicator T5 carries the largest single outer weight, 0.689) operates through the social–human-capital channel and depresses adoption capacity in ways that AHP’s domain-level weighting does not isolate. Fourth, institutional trust: where governance is weak, social legitimacy becomes a precondition for project continuity, so the marginal effect of a unit change in social barriers on adoption is disproportionately large.
The practical implication is that expert intuition systematically under-resources the social dimension. The framework, therefore, elevates social acceptance to an explicit strategic goal (SG4), pairing public engagement and trust-building measures with a workforce development program, rather than treating social barriers as a residual concern. In the phased roadmap, SG4’s community benefit-sharing protocols and workforce-development milestones are positioned as Tier 1 entry activities that precede technical deployment, so that social acceptance is built before, rather than after, physical assets are installed.
5.2. SSCP as the Fit-for-Purpose Strategy for Conflict-Affected Economies
Five independent forms of evidence support SSCP: its 66.24% AHP weight, its TOPSIS closeness coefficient of 1.000, the absence of rank reversal across all eight weighting scenarios, its alignment with the highest-scoring SCI goals, and MENA expert endorsement. SSCP also aligns with the structural realities of conflict-affected developing economies. Community-scale production (2–7 MW modular PEM units) avoids the concentrated capital exposure that deters investors in high-risk contexts, displaces diesel generators at critical community facilities, and builds the technical workforce needed to operate subsequent larger-scale deployments. The Monte Carlo cost simulation (Section 4.5.1) confirms LCOH’s viability at the P50 level (USD 6.50/kg), which is competitive with diesel-displaced electricity at community facilities even at the P90 level (USD 7.95/kg). Yue et al. [29], Nikolaidis and Poullikkas [30], and Glenk and Reichelstein [28] provide complementary evidence that small-to-medium hydrogen systems are economically viable when paired with renewable inputs and policy support.
Table 6 positions the present multi-evidence framework against generic hydrogen frameworks across 14 dimensions, demonstrating the advances in theoretical grounding, hypothesis testing, and methodological triangulation.
Table 6.
Comparative positioning of strategic frameworks.
5.3. The Governance Multiplier and Counterfactual Analysis
The H4 moderation result provides a quantitative expression of an institutional effect that is often qualitatively discussed in the energy transition literature. The +20.2% premium associated with high government policy quality is not a modeling artifact; it reflects the mechanism by which institutional clarity, administrative capacity, and enforcement consistency convert adoption inputs into sustainability outputs. Figure 13 visualizes this multiplier as a fan chart showing sustainability returns under different PGRI levels.
Figure 13.
Governance multiplier fan chart across PGRI scenarios. The chart traces the evolution of the governance multiplier across Palestinian Green Hydrogen Readiness Index (PGRI) scenarios (Section 6.3).
Three counterfactual scenarios make the policy implications concrete. Scenario A (status quo): Palestine maintains PGRI = 2.9 through 2032. The estimated sustainability return per unit adoption is β_eff ≈ 0.74, a 20% loss relative to a high-policy benchmark. The cumulative sustainability gap over a USD 100 M deployment is approximately USD 20 M of foregone sustainability value. Scenario B (Jordan parity): Palestine implements the SG1 institutional reforms and achieves PGRI = 5.1 by 2030. The estimated sustainability return rises to β_eff ≈ 0.87, recovering most of the multiplier loss. The same USD 100 M deployment now generates ~USD 17 M in additional sustainability value. Scenario C (best practice): PGRI reaches 7.0 by 2035 via accelerated reform aligned with EU CertifHy and ISO 14687 standards. Sustainability returns reach the structural ceiling, β_eff ≈ 0.99, generating ~USD 25 M in additional value relative to the status quo. The relative return on institutional investment is therefore substantial: every USD 1 M invested in regulatory reform generates between USD 19 and USD 47 of sustainability value, depending on the baseline.
The H6 moderation effect (Δβ = +0.187; +20.2% sustainability uplift) provides the empirical anchor for a broader theoretical claim. More specifically, this quantified governance multiplier extends and tests the propositions of Sovacool [5], Geels [6], and Bergek et al. [11]: institutions are not merely contextual variables but multipliers that scale the sustainability returns of any technological deployment. The 35.2% regulatory leakage (H5) reinforces this conclusion: every USD 1 M of economic de-risking generates only USD 648 K of adoption impact without concurrent reform. Alremeithi et al. [32] document the same pattern at the port level: UAE ports possess advanced infrastructure but lack hydrogen-specific safety protocols and inter-agency coordination, institutional gaps that the governance multiplier predicts would erode export-stage sustainability returns by approximately 20%.
5.4. Why Conflict-Affected Economies Require a Distinct Framework
A natural objection to the present study is that developing-country frameworks already exist; why propose another specifically for conflict-affected economies? Our justification rests on four structural conditions that make barriers more severe than assumed in general EMDE frameworks.
Firstly, there are sovereignty constraints. In Palestine, 62% of the West Bank lies in Area C under foreign control, directly limiting siting options for hydrogen facilities. This is structurally different from policy uncertainty in a stable developing country. Second, there is infrastructure disruption. Distribution losses of 22–25% and recurrent blockades degrade the reliability baseline from which any hydrogen project must build. Third, there is donor dependence. Tunn et al. [36] document how conflict-affected energy sectors develop path dependencies on donor priorities that distort local deployment logic. Fourth, there is institutional fragility. Fragmented planning authorities documented for Palestine by Dwaikat and Abu-Eisheh [24] and for sustainable transportation by Abu-Eisheh et al. [25] cannot execute the coordinated reforms that generic frameworks presume. The governance multiplier identified in this study precisely quantifies this gap: in conflict-affected contexts, policy quality does not merely matter more; its absence actively erodes the value of other interventions.
Contextual Boundaries and Transferability
The Palestinian case is deliberately selected as a critical, difficult case, but several of its constraints are sui generis and limit direct transfer of the specific priority ordering to other settings. Four constraints are largely unique: (i) sovereignty limits, including restricted control over land, airspace, the electromagnetic spectrum, and resource rights; (ii) movement and access restrictions that raise the cost and uncertainty of moving equipment and personnel; (iii) customs and import dependence that constrain access to electrolyzer components and specialist hardware; and (iv) recurrent infrastructure disruption. These conditions amplify regulatory and social barriers in ways that a country with full sovereignty would not experience in the same way.
Transferability should therefore be read as graded rather than universal. The framework’s architecture—multi-evidence triangulation, governance-gated sequencing, and an SSCP-first entry strategy—is portable, but the empirical weights are not. Settings that share movement, customs, and infrastructure-fragility constraints (for example, several fragile and conflict-affected economies) are the most plausible candidates for adaptation with re-elicited weights; large, sovereign, capital-rich economies (for example, the United States, China, or Russia) face an entirely different barrier structure for which the present priority ordering would not hold. The MENA validation survey establishes that experts across 18 countries endorse the framework’s logic and propositions; it demonstrates analytical agreement, not that the Palestinian priority weights or roadmap can be implemented unchanged elsewhere. Each new application requires context-specific re-estimation, and comparative multi-country studies are identified as a priority for future research.
5.5. Theoretical and Practical Implications
The empirical findings generate implications at two analytically distinct levels. Firstly, they align with theory, clarifying what the multi-evidence architecture adds to MCDA, structural modeling, institutional theory, and the growing body of literature on energy transitions in fragile contexts. Secondly, they deliver actionable guidance for four distinct decision-making audiences: policymakers responsible for regulatory reform, investors and donors allocating capital, infrastructure planners designing the physical backbone of hydrogen deployment, and energy authorities accountable for performance tracking. The three subsections below address these implications in sequence.
5.5.1. Theoretical Implications
Five theoretical contributions follow from the preceding analysis. First, the AHP–PLS dissociation establishes a methodological principle: expert prioritization and structural modeling measure distinct, complementary phenomena and should be interpreted separately rather than reconciled. Second, the governance multiplier offers a quantified reformulation of Institutional Theory [13] as applied to energy transitions: institutions do not merely constrain or enable; they multiply or attenuate the effects of other variables. The +20.2% magnitude provides a quantified estimate of this multiplier effect for hydrogen in a conflict-affected context. Third, the SCI provides a replicable method for converting multi-evidence outputs into SDG-level scores, addressing a long-standing gap in sustainability assessment [42,44]. Fourth, the explicit framing of conflict-affected economies as an analytically distinct category contributes to the emerging literature on ‘hard-case’ research designs [17]. Fifth, the integration of TOE, Institutional Theory, and TIS within a single empirical framework demonstrates that complementary theoretical lenses can be operationalized together rather than juxtaposed, a methodological contribution to the broader socio-technical transitions literature [6,38].
5.5.2. Practical Implications for Policymakers, Investors, and Donors
For policymakers, the findings argue for a sequence in which institutional reform precedes capital deployment. A Framework Law, a national hydrogen committee, guarantees-of-origin aligned with CertifHy and ISO 14687, and a single-window permitting system should be operational before large-scale investments are solicited. For investors, the governance multiplier provides a rational justification for concessional pricing in high-policy-quality jurisdictions and risk premia in fragile ones; the Monte Carlo distributions (Figure 10) further enable risk-adjusted NPV calculations under explicit uncertainty. For donors, the regulatory-leakage finding (35.2%) explains why financial assistance unaccompanied by institutional support routinely underperforms against expectations and argues for bundled packages that combine de-risking instruments with regulatory technical assistance.
5.5.3. Implications for Infrastructure Planners and Energy Authorities
For infrastructure planners, Alkhalidi et al. [7,8,10] show that water stress, pathway selection (humid-air, seawater, and nuclear), and export-stage readiness [32] require coordinated multi-sector planning that single-agency structures cannot deliver. The framework proposed in Section 6 accommodates this by embedding SG6 (Sustainability Safeguards) and SG7 (Regional Cooperation) as cross-cutting goals rather than peripheral add-ons. For energy authorities, the PGRI benchmark (2.9/10 for Palestine vs. 5.1/10 for Jordan) offers an accountable performance metric that can be tracked through annual implementation reports, and the carbon abatement cost (USD 145–220/tCO2e for SSCP) provides a defensible metric for negotiations with international climate finance institutions.
5.5.4. Practical Feasibility: Water, Infrastructure, and Grid Integration
Translating strategic priorities into deployable projects requires explicit attention to physical and resource constraints that operate beneath the barrier-domain level. Freshwater is the most acute. Palestine is among the most water-scarce territories globally, with per capita renewable freshwater far below the international water-poverty line and substantial structural constraints on abstraction. At the stoichiometric minimum, water electrolysis consumes roughly 9 kg of purified water per kilogram of hydrogen, and practical demand, including cooling and purification, is higher. Large-scale electrolysis, therefore, directly competes with domestic and agricultural water use. This makes integrated water–energy provisioning a precondition rather than an afterthought: coupling electrolysis with renewable-powered desalination and recovering electrolyzer and fuel-cell waste heat to reduce the parasitic energy load of desalination are emerging routes to water–energy circularity that are directly relevant to the Palestinian SSCP tier [74,75]. Brine management and the energy penalty of desalination must be costed into project economics.
Three further deployment dimensions condition feasibility. Storage and transport: in a mobility-constrained territory, low-volume compressed-gas storage and modular on-site use are more realistic for the SSCP tier than pipeline networks, with ammonia or carrier-based options considered only at later, higher-readiness tiers. Safety, codes, and certification: the absence of national hydrogen safety standards and trained inspectors is itself a regulatory barrier, and certification capacity must be built in parallel with physical assets. Renewable variability and grid integration: high solar penetration with a weak grid argues for hydrogen as a flexible off-taker and a seasonal storage medium but also requires careful sizing of electrolyzer duty cycles against intermittent supply. These considerations reinforce the SSCP-first sequence and are reflected in the sustainability-safeguard goal (SG6), which mandates water-stewardship audits before scale-up.
6. Strategic Framework, Recommendations, and Roadmap
This section translates the empirical findings into a deployable strategic framework. The framework is structured in four interlocking layers: seven Strategic Goals (SG1–SG7) mapped directly to the six tested hypotheses (Section 6.1); fourteen Policy Recommendations grounded in the AHP, PLS-SEM, and Monte Carlo evidence (Section 6.2); a three-tier phased roadmap conditional on PGRI triggers and Monte Carlo cost confirmation (Section 6.3); and a forward-looking research agenda (Section 6.4). Each layer is anchored in a specific empirical result, ensuring traceability from data to decision.
6.1. Seven Strategic Goals Mapped to Hypotheses
The seven Strategic Goals are derived from the empirical evidence and aligned with the hypothesis tests reported in Section 4. Each goal addresses one or more of the central findings: barrier prioritization (H1–H3), governance moderation (H4), regulatory mediation (H5), and composite system readiness (H6).
SG1: Institutional and regulatory foundation. Anchored in H4 (governance multiplier +20.2%) and H5 (regulatory mediation 35.2%). Establish a national hydrogen Framework Law, single-window permitting, and guarantees-of-origin aligned with CertifHy and ISO 14687.
SG2: Technology and skills development. Anchored in T5 (Skills Gap, PLS outer weight 0.689) and the AHP–PLS dissociation. Establish national hydrogen training centers, vocational programs, and university tracks in hydrogen engineering.
SG3: Financial de-risking. Anchored in H2 (ECON β = −0.312) and Monte Carlo NPV thresholds. Deploy concessional finance, partial-credit guarantees, and tariff-floor mechanisms specifically calibrated to the LCOH P10–P50 range per tier.
SG4: Public engagement and social acceptance. Anchored in S1 (Awareness, PLS outer weight 0.375) and the AHP’s severe under-weighting of social barriers. Launch national awareness campaigns, community participation protocols, and benefit-sharing arrangements.
SG5: Phased deployment with PGRI conditioning. Anchored in H6 and TOPSIS sensitivity stability. Deploy SSCP first; activate INHPH at PGRI ≥ 3.2; activate REGHP at PGRI ≥ 3.8 with confirmed port readiness.
SG6: Sustainability safeguards. Anchored in SCI results (SDGs 7 + 13 + 8+9 = 66.2%) and the SDG 6 trade-off. Mandate water-stewardship audits, treated wastewater as a priority for electrolysis input, and life-cycle carbon intensity ≤2.0 kg CO2/kg H2.
SG7: Regional cooperation. Anchored in MENA validation (no direct contradictions across 18 countries) and Alremeithi et al. [32] on UAE port readiness. Establish a MENA Hydrogen Cooperation Council, mutual-recognition standards, and joint financing facilities.
6.2. Fourteen Policy Recommendations
The recommendations are grouped by SG, with the empirical anchor identified for each. PR1–PR3 (SG1): enact the Framework Law within 18 months; create the National Hydrogen Committee; and align certification with CertifHy/ISO 14687. PR4–PR6 (SG2): launch three national training centers; integrate hydrogen tracks in five universities; and certify 500+ technicians by 2030. PR7–PR9 (SG3): deploy a USD 200 M concessional facility; introduce 15-year tariff floors for SSCP; and underwrite first-loss capital for INHPH. PR10–PR11 (SG4): national awareness campaign and community benefit-sharing protocols. PR12 (SG6): mandatory water-stewardship audits. PR13–PR14 (SG7): MENA Hydrogen Council secretariat and mutual-recognition agreement on guarantees-of-origin.
6.3. Three-Tier Phased Roadmap
The phased roadmap (Figure 14) sequences deployment in three tiers, each conditioned on PGRI triggers and Monte Carlo cost-distribution thresholds derived in Section 4.5.1. Conditioning the tiers on evidence triggers rather than fixed dates ensures that capital is deployed only when institutional and economic conditions justify.
Figure 14.
Three-tier phased deployment roadmap (2026–2040). Tier 1 (SSCP) is deployable at current readiness; Tier 2 (INHPH) requires PGRI > 3.2; and Tier 3 (REGHP) requires PGRI > 3.8 plus externally validated port readiness, adapted from Alremeithi et al. [32]. Timelines are condition-dependent rather than calendar-fixed (Section 6.3).
Tier 1 (SSCP, 2026–2028): 5–10 community sites at 2–7 MW each; aggregate ~25–50 MW; cumulative capital~USD 80–150 M. Tier 2 (INHPH, 2029–2032): 1–2 industrial hubs at 50–150 MW; aggregate~150–300 MW; cumulative capital~USD 600 M–1.2 B. Tier 3 (REGHP, 2033–2040): export-oriented capacity 250–500 MW; cumulative capital~USD 1.5–3.0 B; conditional on Mediterranean and Aqaba port-readiness milestones [32]. Annual implementation reviews assess PGRI progression, LCOH realization against Monte Carlo P50 trajectories, and sustainability outcomes against SCI baselines.
Contingency Planning Under Conflict Conditions
The roadmap is necessarily contingent on a security and access environment that cannot be assumed to be stable. The phased design is itself a risk-management response; small, modular SSCP units are lower-risk and can be deployed, paused, or relocated with far less stranded capital than national-scale infrastructure. However, explicit contingencies are warranted. If movement and access restrictions tighten, priority shifts further toward fully modular, containerized electrolyzers that can be installed without large fixed civil works, and toward distributed siting that reduces single-point vulnerability. If import or customs constraints intensify, mitigation includes pre-positioning critical spares, qualifying multiple supply routes, developing local assembly and maintenance capacity, and structuring international partnerships and donor guarantees that can absorb procurement risk. If infrastructure damage occurs, the decentralized SSCP architecture limits cascading failure relative to the centralized plant, and PGRI triggers should be treated as reversible: a deterioration in readiness should pause or scale down deployment rather than force continuation. The roadmap timeline should accordingly be read as condition-dependent, with tier transitions gated on realized readiness rather than calendar dates alone.
6.4. Future Research Agenda
Five research extensions follow directly from the present findings. First, longitudinally tracking PGRI progression in Palestine and comparable conflict-affected economies would test whether the governance multiplier holds under temporal variation. Second, replicating the AHP–PLS dissociation analysis in other developing-country sectors (solar, wind, energy efficiency) would establish its generality. Third, a dynamic Monte Carlo simulation incorporating electrolyzer learning curves and electricity tariff trajectories would refine the LCOH projections. Fourth, in-depth case studies of Tier 1 SSCP pilots would generate operational evidence on actual versus projected sustainability returns. Fifth, integrating the SCI with explicit SDG-trade-off algorithms [42,43,44] would extend the framework into a full sustainability decision-support system.
7. Conclusions
This study developed and empirically tested a strategic framework for GH2 adoption in conflict-affected developing economies, with Palestine serving as the hard-case setting and the wider MENA region providing external validation. The framework integrates AHP barrier prioritization, PLS-SEM structural modeling with PLSpredict and MICOM robustness checks, TOPSIS cross-validation, Monte Carlo cost simulation, the SDG Contribution Index, and a phased deployment logic conditioned on the Palestinian Green Hydrogen Readiness Index. Six hypotheses derived from institutional theory, the TOE framework, and TIS were tested and supported by the empirical evidence.
Six findings warrant emphasis. First, the AHP–PLS dissociation is large and consequential: Technical barriers dominate expert perception (56.2%) but rank last in structural predictive power (β = −0.230), while social barriers, while severely underweighted in AHP (4.8%), are second in PLS-SEM (β = −0.310). Resource allocation guided by either method alone would produce systematically biased decisions. Second, SSCP emerges as the dominant strategic alternative across all five evidence streams, with zero rank reversals across the seven AHP and eight TOPSIS sensitivity scenarios and a median Monte Carlo LCOH of USD 6.50/kg. Third, government policy quality functions as a quantified governance multiplier, raising the adoption-to-sustainability conversion rate by +20.2% (Δβ = +0.187). Fourth, regulatory friction absorbs 35.2% of economic de-risking benefits in the absence of concurrent reform, providing direct evidence for the value of bundled financial–institutional packages. Fifth, hydrogen’s SDG contribution is concentrated in four goals (SDGs 7, 13, 8, and 9 = 66.2% of SCI), with SDG 6 (Clean Water) representing a critical trade-off that requires active nexus governance. Sixth, the framework’s analytical conclusions are consistent with the judgments of independent experts across 18 MENA countries, with no direct contradictions among the tested propositions, indicating regional analytical agreement and practical transferability, as discussed in Section 5.4.
The principal theoretical contribution is the integration of institutional theory, the TOE framework, and TIS within a single empirical architecture, demonstrating that these complementary lenses can be operationalized together rather than juxtaposed. The principal methodological contribution is the multi-evidence design itself, which converts the AHP–PLS dissociation from a measurement problem into a strategic asset by treating expert perception and structural power as complementary signals. The principal practical contribution is a deployable, traceable framework that any conflict-affected developing economy can adapt to its own institutional and resource conditions, with each element from the SSCP-first deployment logic through the SDG contribution scores to the PGRI-conditional 2026–2040 roadmap (contingent on PGRI progression and security stability) anchored in evidence rather than assumption.
Limitations
Several limitations bind our interpretation of these findings. First, the evidence is expert-based: AHP and PLS-SEM both rest on the judgments of a 45-member panel, which, although diverse across academia, government, industry, and civil society, is necessarily subjective and may under-represent some stakeholder perspectives; expert panels in fragile contexts may also systematically under-weight long-horizon risks—such as climate-adaptation requirements beyond 2040—relative to immediate institutional and security concerns. Second, the sample size, while satisfying the 10-times rule and adequately powered for the dominant structural effects, is at the lower bound for a model of this complexity; the smaller barrier coefficients (β ≈ 0.23–0.31) fall below the 80% power threshold in the SmartPLS post hoc power report (achieved power 0.459–0.672; minimum detectable |β| ≈ 0.371). As such, while their direction and statistical significance are reported, their precise magnitudes should be interpreted cautiously; the high R2 and Q2 may likewise be sample-specific, so replication on larger and independent samples is needed. Third, the same experts informed both the AHP and PLS-SEM stages, raising the possibility of common-source bias; inner-model collinearity diagnostics (all VIF < 5.0; highest 3.553) and the Harman test indicate this is unlikely to be the primary driver of the results, but a marker-variable design was not available and is recommended for future confirmatory work. Fourth, the economic estimates rest on cost and parameter assumptions for current technology and Palestinian conditions that will shift over the roadmap horizon. Fifth, this study is cross-sectional and lacks longitudinal data, so it captures a single point-in-time consensus rather than the evolution of barriers and readiness. Sixth, generalizability is bounded: the specific priority weights are tied to Palestinian sovereignty, movement, and customs constraints and should be re-estimated for other contexts. Finally, the framework has not yet been validated against an operating hydrogen project; field validation through pilot deployment is the most important next step.
In the global hydrogen transition, which is accelerating in announcement but lagging in delivery, the conflict-affected developing economies represent the hardest cases. The framework presented here demonstrates that, even under sovereignty constraints, infrastructure disruption, and institutional fragility, a sequenced, evidence-based pathway exists. Whether that pathway is taken will depend on choices made not only by Palestinian institutions but also by international donors, regional partners, and the global community of green hydrogen production scholarship and practice.
Supplementary Materials
The following supporting information can be downloaded at: https://www.mdpi.com/article/10.3390/hydrogen7020086/s1, The following supporting information is available as separate files (Tables S1–S4 in the original Supplementary Materials file; Tables S5–S8 and Figures S1–S3 in the Supplementary Materials Re-vision Addendum): Table S1 (complete AHP sub-criteria ranking of the 20 barriers); Table S2 (PLS-SEM Outer Weights—Key Indicators); Table S3 (AHP Sensitivity Analysis—Seven Scenarios); and Table S4 (MENA Validation—18-Point Confirmation Matrix); Table S5 (Post-hoc statistical power of principal structural paths (n = 45, α = 0.05)); Table S6 (Inner-model collinearity: variance inflation factors (VIF) from the estimated PLS-SEM (SmartPLS 4 output)); Table S7 (TOPSIS weight-sensitivity: closeness coefficients and ranks across eight criterion-weighting scenarios); Table S8 (MENA validation panel: composition and country-level response distributions); Figure S1 (Post-hoc statistical power at n = 45 across standardized path magnitudes); Figure S2 (Inner-model VIF from the estimated PLS-SEM structural model (all < 5.0; ECON marginally above 3.3)); and Figure S3 (Weight-sensitivity of TOPSIS closeness coefficients across eight criterion-weighting scenarios (SSCP rank-invariant)).
Author Contributions
A.D.: conceptualization, methodology, formal analysis, investigation, data curation, software (Expert Choice 11, SmartPLS 4), visualization, writing—original draft, and writing—review and editing. A.A.: conceptualization, methodology, validation, supervision, writing—review and editing, and resources. S.A.-E.: methodology, validation, supervision, writing—review and editing, resources, and project administration. All authors have read and agreed to the published version of the manuscript.
Funding
This research received no specific grant from any funding agency in the public, commercial, or not-for-profit sectors.
Institutional Review Board Statement
Ethical approval was obtained from the Institutional Review Board of An-Najah National University. All participants in both the Palestinian AHP/PLS-SEM panel (n = 45) and the MENA validation survey (n = 120) provided informed written consent before participation.
Informed Consent Statement
Informed consent was obtained from all subjects involved in this study.
Data Availability Statement
Aggregated AHP pairwise-comparison matrices, PLS-SEM construct scores (de-identified), MENA validation summary counts, and TOPSIS sensitivity-scenario inputs are provided in the Supplementary Material. Raw individual-level responses are not shared publicly to preserve participant confidentiality, as approved by the ethics committee. Reasonable requests for further analytical detail may be directed to the corresponding author.
Acknowledgments
The authors thank the expert panelists who participated in this study for their valuable time and professional judgment. We also thank An-Najah National University for its institutional support of the underlying doctoral research.
Conflicts of Interest
The authors declare no conflict of interests.
Abbreviations
AHP: Analytic Hierarchy Process; AVE: Average Variance Extracted; BCa: Bias-Corrected and Accelerated (bootstrap); CC: Closeness Coefficient (TOPSIS); CI: Confidence Interval; CMB: Common-Method Bias; CR: Consistency Ratio (AHP) or Composite Reliability (PLS-SEM); GH2: Green Hydrogen; IEA: International Energy Agency; INHPH: Industrial-Scale National Hydrogen Production Hubs; IPMA: Importance–Performance Map Analysis; IRENA: International Renewable Energy Agency; LCOH: Levelized Cost of Hydrogen; MCDA: Multi-Criteria Decision Analysis; MENA: Middle East and North Africa; MICOM: Measurement Invariance of Composite Models; NGO: Non-Governmental Organization; O&M: Operation and Maintenance; PGRI: Palestinian Green Hydrogen Readiness Index; PLS-SEM: Partial Least Squares Structural Equation Modeling; REGHP: Regional Export-Oriented Green Hydrogen Production; SCI: SDG Contribution Index; SDG: Sustainable Development Goal; SRMR: Standardized Root Mean Square Residual; SSCP: Small-Scale Community Production; TIS: Technological Innovation Systems; TOE: Technology–Organization–Environment; TOPSIS: Technique for Order of Preference by Similarity to Ideal Solution; VIF: Variance Inflation Factor; VISTA-H2: composite five-dimension green-hydrogen readiness framework (Section 4.6).
References
- International Energy Agency (IEA). Global Hydrogen Review 2025; IEA: Paris, France, 2025; Available online: https://www.iea.org/reports/global-hydrogen-review-2025 (accessed on 15 June 2026).
- Odenweller, A.; Ueckerdt, F. The green hydrogen ambition and implementation gap. Nat. Energy 2025, 10, 110–123. [Google Scholar] [CrossRef] [Scilit]
- Hydrogen Council; McKinsey & Company. Hydrogen: Closing the Cost Gap; Hydrogen Council: Brussels, Belgium, 2025; Available online: https://hydrogencouncil.com/en/hydrogen-closing-the-cost-gap/ (accessed on 15 June 2026).
- Terlouw, T.; Rosa, L.; Bauer, C.; McKenna, R. Future hydrogen economies imply environmental trade-offs and a supply-demand mismatch. Nat. Commun. 2024, 15, 7043. [Google Scholar] [CrossRef] [Scilit] [PubMed]
- Sovacool, B.K. What are we doing here? Analyzing fifteen years of energy scholarship and proposing a social science research agenda. Energy Res. Soc. Sci. 2014, 1, 1–29. [Google Scholar] [CrossRef] [Scilit]
- Geels, F.W. Technological transitions as evolutionary reconfiguration processes: A multi-level perspective and a case-study. Res. Policy 2002, 31, 1257–1274. [Google Scholar] [CrossRef] [Scilit]
- Alkhalidi, A.; Battikhi, H.; Almanasreh, M.; Khawaja, M.K. A review of renewable energy status and regulations in the MENA region to explore green hydrogen production–Highlighting the water stress effect. Int. J. Hydrogen Energy 2024, 67, 898–911. [Google Scholar] [CrossRef] [Scilit]
- Alkhalidi, A.; Al-Mohamad, R.; Khawaja, M.K. Comparative technical analysis of different methods for green hydrogen production from humid air and seawater. Clean Energy 2026, 10, 87–99. [Google Scholar] [CrossRef] [Scilit]
- Khawaja, M.K.; Al-Mohamad, R.; Salameh, T.; Alkhalidi, A. Strategies to promote nuclear energy utilization in hydrogen production. Int. J. Hydrogen Energy 2024, 82, 36–46. [Google Scholar] [CrossRef] [Scilit]
- Alkhalidi, A.; Alyazouri, S.; Almomani, B.; Olabi, A.G.; Alami, A.H.; Vũ, T.M.; Al-Halhouli, A.; Khawaja, M.K. Nuclear hydrogen prospects in MENA region with economic insights. Int. J. Thermofluids 2026, 32, 101568. [Google Scholar] [CrossRef] [Scilit]
- Bergek, A.; Jacobsson, S.; Carlsson, B.; Lindmark, S.; Rickne, A. Analyzing the functional dynamics of technological innovation systems: A scheme of analysis. Res. Policy 2008, 37, 407–429. [Google Scholar] [CrossRef] [Scilit]
- Jacobsson, S.; Johnson, A. The diffusion of renewable energy technology: An analytical framework and key issues for research. Energy Policy 2000, 28, 625–640. [Google Scholar] [CrossRef] [Scilit]
- North, D.C. Institutions, Institutional Change and Economic Performance; Cambridge University Press: Cambridge, UK, 1990; ISBN 978-0-521-39734-6. [Google Scholar] [CrossRef] [Scilit]
- Agyekum, E.B. Is Africa ready for green hydrogen energy takeoff? A multi-criteria analysis approach to the opportunities and barriers of hydrogen production on the continent. Int. J. Hydrogen Energy 2024, 49, 219–233. [Google Scholar] [CrossRef] [Scilit]
- Ocenic, E.; Sandu, M. Experts’ perceptions on barriers and incentives to green hydrogen adoption: Evidence from Europe and beyond. Societies 2026, 16, 73. [Google Scholar] [CrossRef] [Scilit]
- Almassry, H. Making occupation and energy apartheid bankable: How European Union green hydrogen standards reproduce sovereignty theft in Palestine. Energy Res. Soc. Sci. 2026, 131, 104522. [Google Scholar] [CrossRef] [Scilit]
- Flyvbjerg, B. Five misunderstandings about case-study research. Qual. Inq. 2006, 12, 219–245. [Google Scholar] [CrossRef] [Scilit]
- Juaidi, A.; Montoya, F.G.; Ibrik, I.H.; Manzano-Agugliaro, F. An overview of renewable energy potential in Palestine. Renew. Sustain. Energy Rev. 2016, 65, 943–960. [Google Scholar] [CrossRef] [Scilit]
- Hattab, T. Potential, Current Status, and Renewable Energy in Energy Sector of Palestine: A Review. Aksaray Univ. J. Sci. Eng. 2025, 9, 63–77. [Google Scholar] [CrossRef] [Scilit]
- Palestinian Central Bureau of Statistics (PCBS). Annual Energy Tables and Energy Balance 2023; PCBS: Ramallah, Palestine, 2023. Available online: https://www.pcbs.gov.ps/site/lang__en/1030/Default.aspx (accessed on 15 June 2026).
- World Bank. Impacts of the Conflict in the Middle East on the Palestinian Economy: April 2025 Update; World Bank: Washington, DC, USA, 2025; Available online: https://www.worldbank.org/en/country/westbankandgaza (accessed on 15 June 2026).
- Palestinian Central Bureau of Statistics (PCBS). Labour Force Survey 2024; PCBS: Ramallah, Palestine, 2024. Available online: https://www.pcbs.gov.ps/PCBS-Metadata-en-v5.2/index.php/catalog/740/study-description (accessed on 15 June 2026).
- Palestine Economic Policy Research Institute (MAS). Strategic Paths for the Energy Sector in Palestine; MAS: Ramallah, Palestine, 2024; Available online: https://mas.ps/en/publications/10600.html (accessed on 15 June 2026).
- Dwaikat, A.H.; Abu-Eisheh, S.A. Strategic planning for renewable energy in developing countries: Palestine as a case study. In Proceedings of the 2020 5th International Conference on Renewable Energies for Developing Countries (REDEC), Marrakech, Morocco, 29–30 June 2020; pp. 1–6. [Google Scholar] [CrossRef] [Scilit]
- Abu-Eisheh, S.; Kuckshinrichs, W.; Dwaikat, A. Strategic Planning for Sustainable Transportation in Developing Countries: The Role of Vehicles. Transp. Res. Procedia 2020, 48, 3019–3036. [Google Scholar] [CrossRef] [Scilit]
- Segovia-Hernández, J.G.; Hernández, S.; Cossío-Vargas, E.; Juarez-García, M.; Sánchez-Ramírez, E. Green hydrogen production for sustainable development: A critical examination of barriers and strategic opportunities. RSC Sustain. 2025, 3, 134–157. [Google Scholar] [CrossRef] [Scilit]
- Toufighi, S.P.; Vang, J.; Ghasemian Sahebi, I.; Masoomi, B.; Aghajani, H. AI-enabled green hydrogen adoption for sustainable transportation: The moderating role of network capability. Int. J. Hydrogen Energy 2026, 219, 154078. [Google Scholar] [CrossRef] [Scilit]
- Glenk, G.; Reichelstein, S. Reversible Power-to-Gas systems for energy conversion and storage. Nat. Commun. 2022, 13, 2010. [Google Scholar] [CrossRef] [Scilit] [PubMed]
- Yue, M.; Lambert, H.; Pahon, E.; Roche, R.; Jemei, S.; Hissel, D. Hydrogen energy systems: A critical review of technologies, applications, trends and challenges. Renew. Sustain. Energy Rev. 2021, 146, 111180. [Google Scholar] [CrossRef] [Scilit]
- Nikolaidis, P.; Poullikkas, A. A comparative overview of hydrogen production processes. Renew. Sustain. Energy Rev. 2017, 67, 597–611. [Google Scholar] [CrossRef] [Scilit]
- Hosseini, S.E.; Wahid, M.A. Hydrogen production from renewable and sustainable energy resources: Promising green energy carrier for clean development. Renew. Sustain. Energy Rev. 2016, 57, 850–866. [Google Scholar] [CrossRef] [Scilit]
- Alremeithi, A.; Alkhalidi, A.; Fayyad, M. Seaports Readiness Framework for Hydrogen Export—A United Arab Emirates Case Study. Hydrogen 2026, 7, 45. [Google Scholar] [CrossRef] [Scilit]
- Benalcazar, P.; Komorowska, A. Techno-economic analysis and uncertainty assessment of green hydrogen production in future exporting countries. Renew. Sustain. Energy Rev. 2024, 199, 114512. [Google Scholar] [CrossRef] [Scilit]
- Rezaei, M.; Akimov, A.; Gray, E.M. Cost-competitiveness of green hydrogen and its sensitivity to major financial and technical variables. Int. J. Hydrogen Energy 2024, 90, 1365–1377. [Google Scholar] [CrossRef] [Scilit]
- Mochi, P. Hydrogen Integration in Future Local Energy Markets. Energies 2026, 19, 1234. [Google Scholar] [CrossRef] [Scilit]
- Tunn, J.; Kalt, T.; Müller, F.; Simon, J.; Hennig, J.; Ituen, I.; Glatzer, N. Green hydrogen transitions deepen socioecological risks and extractivist patterns: Evidence from 28 prospective exporting countries in the Global South. Energy Res. Soc. Sci. 2024, 117, 103731. [Google Scholar] [CrossRef] [Scilit]
- Garcia-Navarro, J.; Isaacs, M.A.; Favaro, M.; Ren, D.; Ong, W.-J.; Grätzel, M.; Jiménez-Calvo, P. Updates on hydrogen value chain: A strategic roadmap. Glob. Chall. 2023, 8, 2300073. [Google Scholar] [CrossRef] [Scilit] [PubMed]
- Geels, F.W.; Schot, J. Typology of sociotechnical transition pathways. Res. Policy 2007, 36, 399–417. [Google Scholar] [CrossRef] [Scilit]
- Martins, F.P.; De-León Almaraz, S.; Botelho Junior, A.B.; Azzaro-Pantel, C.; Parikh, P. Hydrogen and the sustainable development goals: Synergies and trade-offs. Renew. Sustain. Energy Rev. 2024, 204, 114796. [Google Scholar] [CrossRef] [Scilit]
- León, C.; Molina, P.; Ríos, C.; Brey, J.J. Green hydrogen production’s impact on sustainable development goals. Int. J. Hydrogen Energy 2025, 142, 642–653. [Google Scholar] [CrossRef] [Scilit]
- Martínez-Gómez, J.; Avilés-Sacoto, S.V.; Riofrío-Pino, V. Integration of UN sustainable development goals in national hydrogen strategies: A text analysis approach. Int. J. Hydrogen Energy 2025, 102, 1282–1294. [Google Scholar] [CrossRef] [Scilit]
- Pradhan, P.; Costa, L.; Rybski, D.; Lucht, W.; Kropp, J.P. A systematic study of Sustainable Development Goal (SDG) interactions. Earth’s Future 2017, 5, 1169–1179. [Google Scholar] [CrossRef] [Scilit]
- Nilsson, M.; Griggs, D.; Visbeck, M. Policy: Map the interactions between Sustainable Development Goals. Nature 2016, 534, 320–322. [Google Scholar] [CrossRef] [Scilit] [PubMed]
- Miola, A.; Schiltz, F. Measuring sustainable development goals performance: How to monitor policy action in the 2030 Agenda implementation? Ecol. Econ. 2019, 164, 106373. [Google Scholar] [CrossRef] [Scilit] [PubMed]
- Kahraman, C.; Kaya, İ.; Cebi, S. A comparative analysis for multiattribute selection among renewable energy alternatives using fuzzy axiomatic design and fuzzy analytic hierarchy process. Energy 2009, 34, 1603–1616. [Google Scholar] [CrossRef] [Scilit]
- Büyüközkan, G.; Güleryüz, S. An integrated DEMATEL-ANP approach for renewable energy resources selection in Turkey. Int. J. Prod. Econ. 2016, 182, 435–448. [Google Scholar] [CrossRef] [Scilit]
- Shmueli, G.; Sarstedt, M.; Hair, J.F.; Cheah, J.-H.; Ting, H.; Vaithilingam, S.; Ringle, C.M. Predictive model assessment in PLS-SEM: Guidelines for using PLSpredict. Eur. J. Mark. 2019, 53, 2322–2347. [Google Scholar] [CrossRef] [Scilit]
- Sarstedt, M.; Hair, J.F.; Pick, M.; Liengaard, B.D.; Radomir, L.; Ringle, C.M. Progress in partial least squares structural equation modeling use in marketing research in the last decade. Psychol. Mark. 2022, 39, 1035–1064. [Google Scholar] [CrossRef] [Scilit]
- Henseler, J.; Ringle, C.M.; Sarstedt, M. Testing measurement invariance of composites using partial least squares. Int. Mark. Rev. 2016, 33, 405–431. [Google Scholar] [CrossRef] [Scilit]
- Tornatzky, L.G.; Fleischer, M.; Chakrabarti, A.K. The Processes of Technological Innovation; Lexington Books: Lexington, MA, USA, 1990; ISBN 978-0-669-20348-6. [Google Scholar]
- Baker, J. The technology-organization-environment framework. In Information Systems Theory: Explaining and Predicting Our Digital Society; Dwivedi, Y.K., Wade, M.R., Schneberger, S.L., Eds.; Springer: New York, NY, USA, 2012; Volume 1, pp. 231–245. [Google Scholar] [CrossRef] [Scilit]
- Hekkert, M.P.; Suurs, R.A.A.; Negro, S.O.; Kuhlmann, S.; Smits, R.E.H.M. Functions of innovation systems: A new approach for analysing technological change. Technol. Forecast. Soc. Change 2007, 74, 413–432. [Google Scholar] [CrossRef] [Scilit]
- Saaty, T.L. The Analytic Hierarchy Process: Planning, Priority Setting, Resource Allocation; McGraw-Hill: New York, NY, USA, 1980; ISBN 978-0-07-054371-3. [Google Scholar]
- Saaty, T.L. Decision making with the analytic hierarchy process. Int. J. Serv. Sci. 2008, 1, 83–98. [Google Scholar] [CrossRef] [Scilit]
- Hair, J.F.; Risher, J.J.; Sarstedt, M.; Ringle, C.M. When to use and how to report the results of PLS-SEM. Eur. Bus. Rev. 2019, 31, 2–24. [Google Scholar] [CrossRef] [Scilit]
- Hair, J.F.; Hult, G.T.M.; Ringle, C.M.; Sarstedt, M. A Primer on Partial Least Squares Structural Equation Modeling (PLS-SEM), 3rd ed.; Sage: Thousand Oaks, CA, USA, 2021; ISBN 978-1-5443-9640-8. [Google Scholar]
- Hwang, C.-L.; Yoon, K. Multiple Attribute Decision Making: Methods and Applications; Springer: Berlin, Germany, 1981. [Google Scholar] [CrossRef] [Scilit]
- Ringle, C.M.; Sarstedt, M. Gain more insight from your PLS-SEM results: The importance–performance map analysis. Ind. Manag. Data Syst. 2016, 116, 1865–1886. [Google Scholar] [CrossRef] [Scilit]
- Henseler, J.; Ringle, C.M.; Sarstedt, M. A new criterion for assessing discriminant validity in variance-based structural equation modeling. J. Acad. Mark. Sci. 2015, 43, 115–135. [Google Scholar] [CrossRef] [Scilit]
- Kock, N. Common method bias in PLS-SEM: A full collinearity assessment approach. Int. J. e-Collab. 2015, 11, 1–10. [Google Scholar] [CrossRef] [Scilit]
- Cohen, J. Statistical Power Analysis for the Behavioral Sciences, 2nd ed.; Lawrence Erlbaum Associates: Hillsdale, NJ, USA, 1988; ISBN 978-0-8058-0283-2. [Google Scholar]
- Kock, N.; Hadaya, P. Minimum sample size estimation in PLS-SEM: The inverse square root and gamma-exponential methods. Inf. Syst. J. 2018, 28, 227–261. [Google Scholar] [CrossRef] [Scilit]
- Zhao, X.; Lynch, J.G.; Chen, Q. Reconsidering Baron and Kenny: Myths and truths about mediation analysis. J. Consum. Res. 2010, 37, 197–206. [Google Scholar] [CrossRef] [Scilit]
- ICSU; ISSC. A Guide to SDG Interactions: From Science to Implementation; International Council for Science: Paris, France, 2017; Available online: https://council.science/publications/a-guide-to-sdg-interactions-from-science-to-implementation/ (accessed on 15 June 2026).
- International Renewable Energy Agency (IRENA). Global Hydrogen Trade to Meet the 1.5 °C Climate Goal: Part I—Trade Outlook for 2050 and Way Forward; IRENA: Abu Dhabi, United Arab Emirates, 2022; Available online: https://www.irena.org/Publications/2022/Jul/Global-Hydrogen-Trade-Outlook (accessed on 15 June 2026).
- Luthra, S.; Kumar, S.; Garg, D.; Haleem, A. Barriers to renewable/sustainable energy technologies adoption: Indian perspective. Renew. Sustain. Energy Rev. 2015, 41, 762–776. [Google Scholar] [CrossRef] [Scilit]
- Lyu, X.; Zailani, S.; Mohamad, M.N. Differential effects of environmental regulations on sustainable energy technologies adoption in China’s renewable energy sector with energy transition capabilities as moderators. Discov. Sustain. 2026. [Google Scholar] [CrossRef] [Scilit]
- Lindell, M.K.; Whitney, D.J. Accounting for common method variance in cross-sectional research designs. J. Appl. Psychol. 2001, 86, 114–121. [Google Scholar] [CrossRef] [Scilit] [PubMed]
- ISO 31000:2018; Risk Management—Guidelines. ISO: Geneva, Switzerland, 2018.
- ISO 14687:2019; Hydrogen Fuel Quality—Product Specification. ISO: Geneva, Switzerland, 2019.
- CertifHy. CertifHy EU Hydrogen Certification Schemes. Available online: https://www.certifhy.eu/ (accessed on 15 June 2026).
- European Commission. Commission Delegated Regulation (EU) 2023/1184 of 10 February 2023 supplementing Directive (EU) 2018/2001 by establishing a Union methodology setting out detailed rules for the production of renewable liquid and gaseous transport fuels of non-biological origin. Off. J. Eur. Union 2023, L157, 11–19. Available online: http://data.europa.eu/eli/reg_del/2023/1184/oj (accessed on 15 June 2026).
- European Commission. Commission Delegated Regulation (EU) 2023/1185 of 10 February 2023 supplementing Directive (EU) 2018/2001 by establishing a minimum threshold for greenhouse gas emissions savings of recycled carbon fuels and by specifying a methodology for assessing greenhouse gas emissions savings from renewable liquid and gaseous transport fuels of non-biological origin and from recycled carbon fuels. Off. J. Eur. Union 2023, L157, 20–33. Available online: http://data.europa.eu/eli/reg_del/2023/1185/oj (accessed on 15 June 2026).
- Kumar, P.; Date, A.; Shabani, B. Techno-economic analysis of an integrated desalination–renewable–hydrogen system for zero-emission freshwater and electricity production. Energy Convers. Manag. 2026, 353, 121231. [Google Scholar] [CrossRef] [Scilit]
- Kumar, P.; Date, A.; Das, R.K.; Shabani, B. Electrolyser and fuel cell waste-heat-powered desalination enabling water–energy circularity in renewable hydrogen systems: An experimental proof of concept. Appl. Therm. Eng. 2026, 293, 130429. [Google Scholar] [CrossRef] [Scilit]
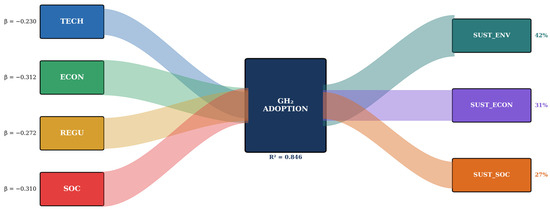
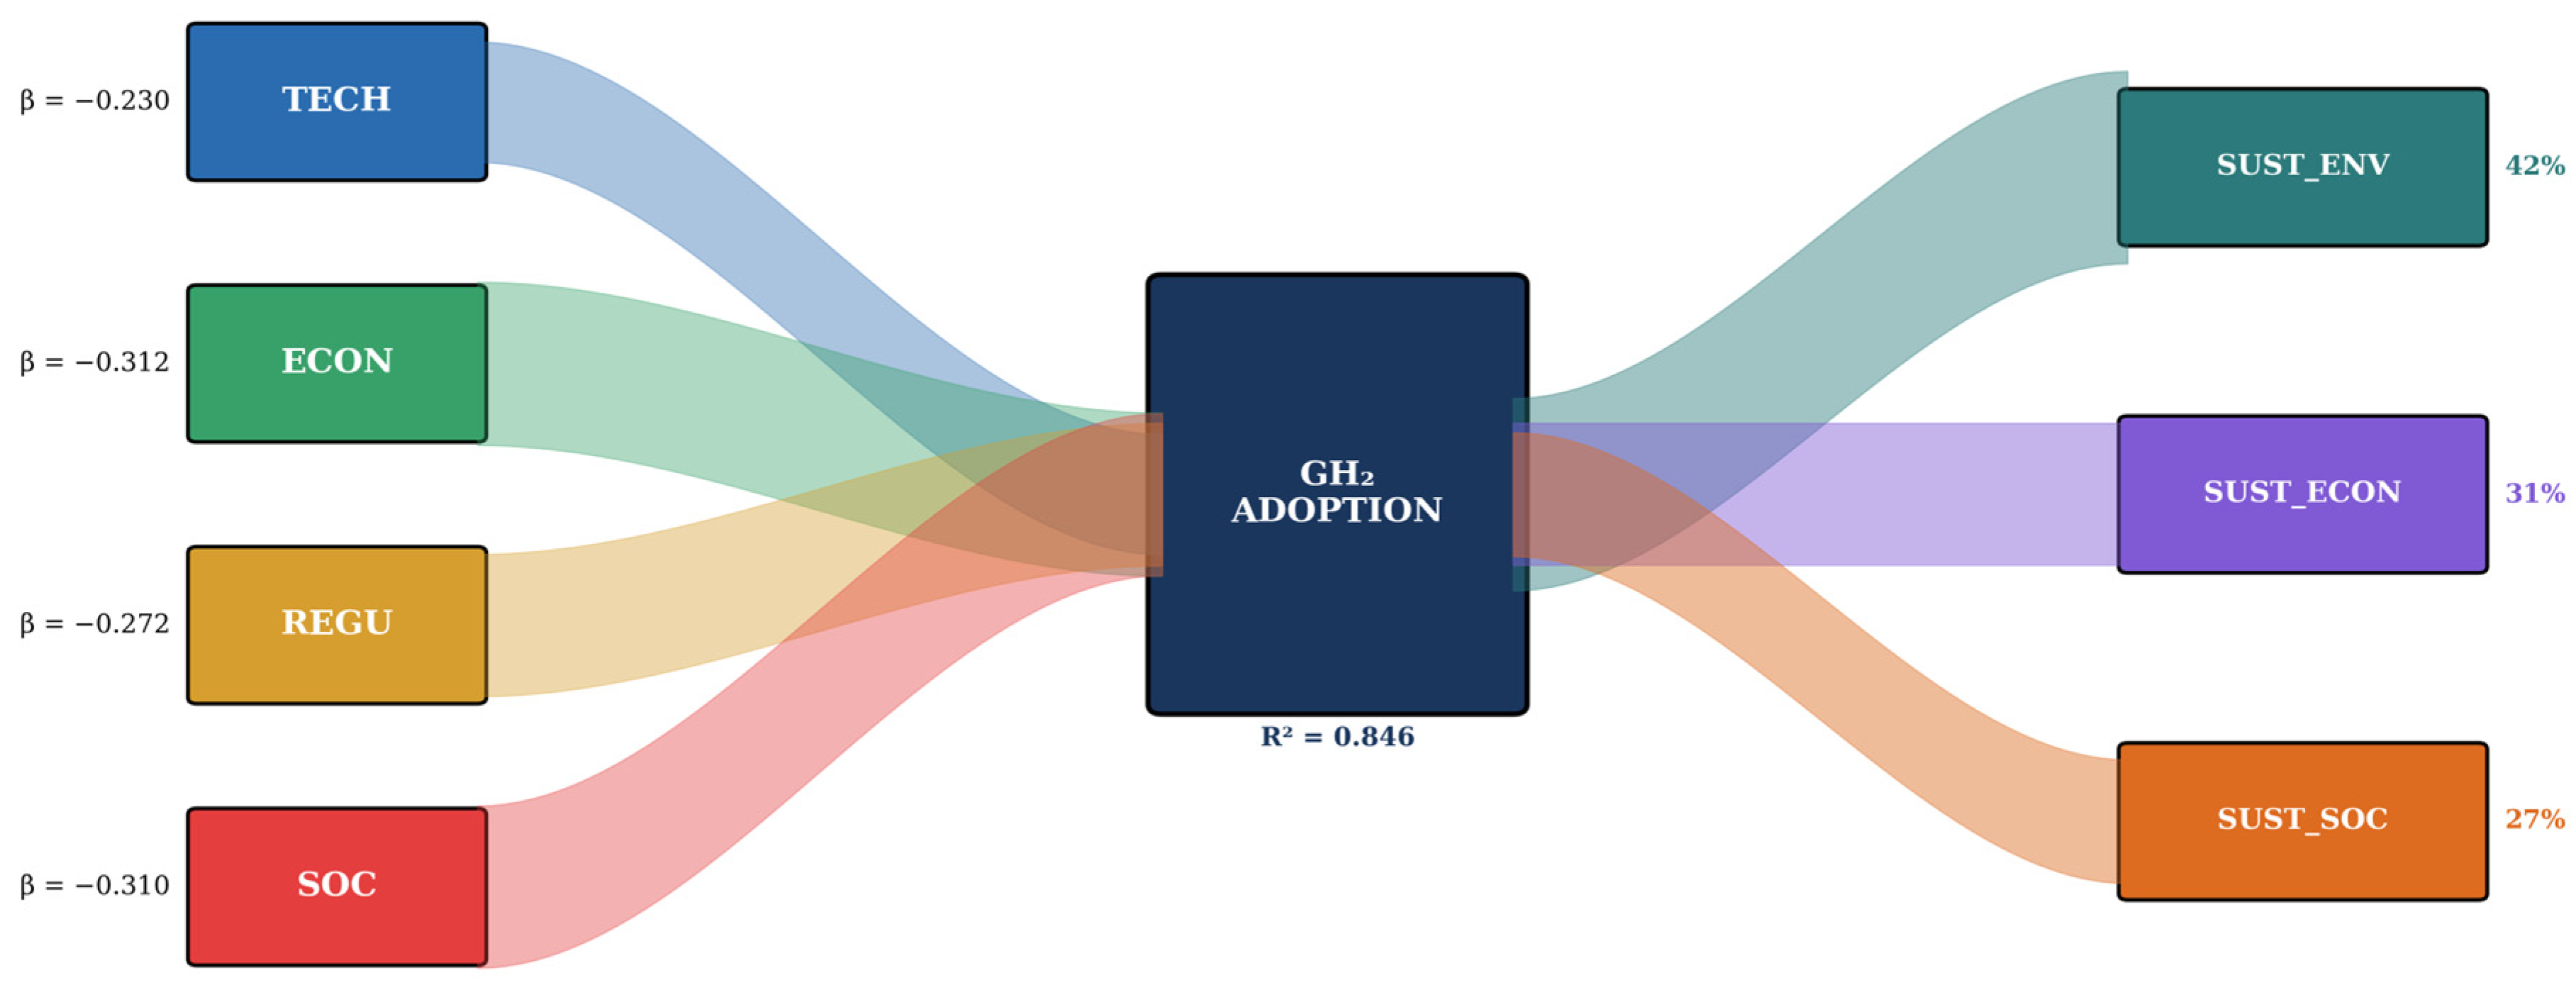
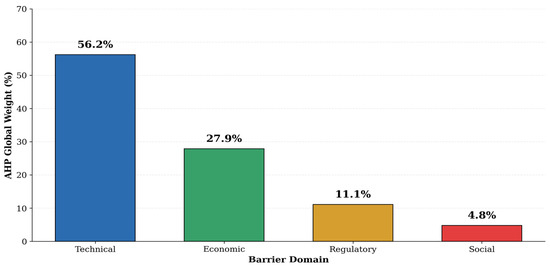
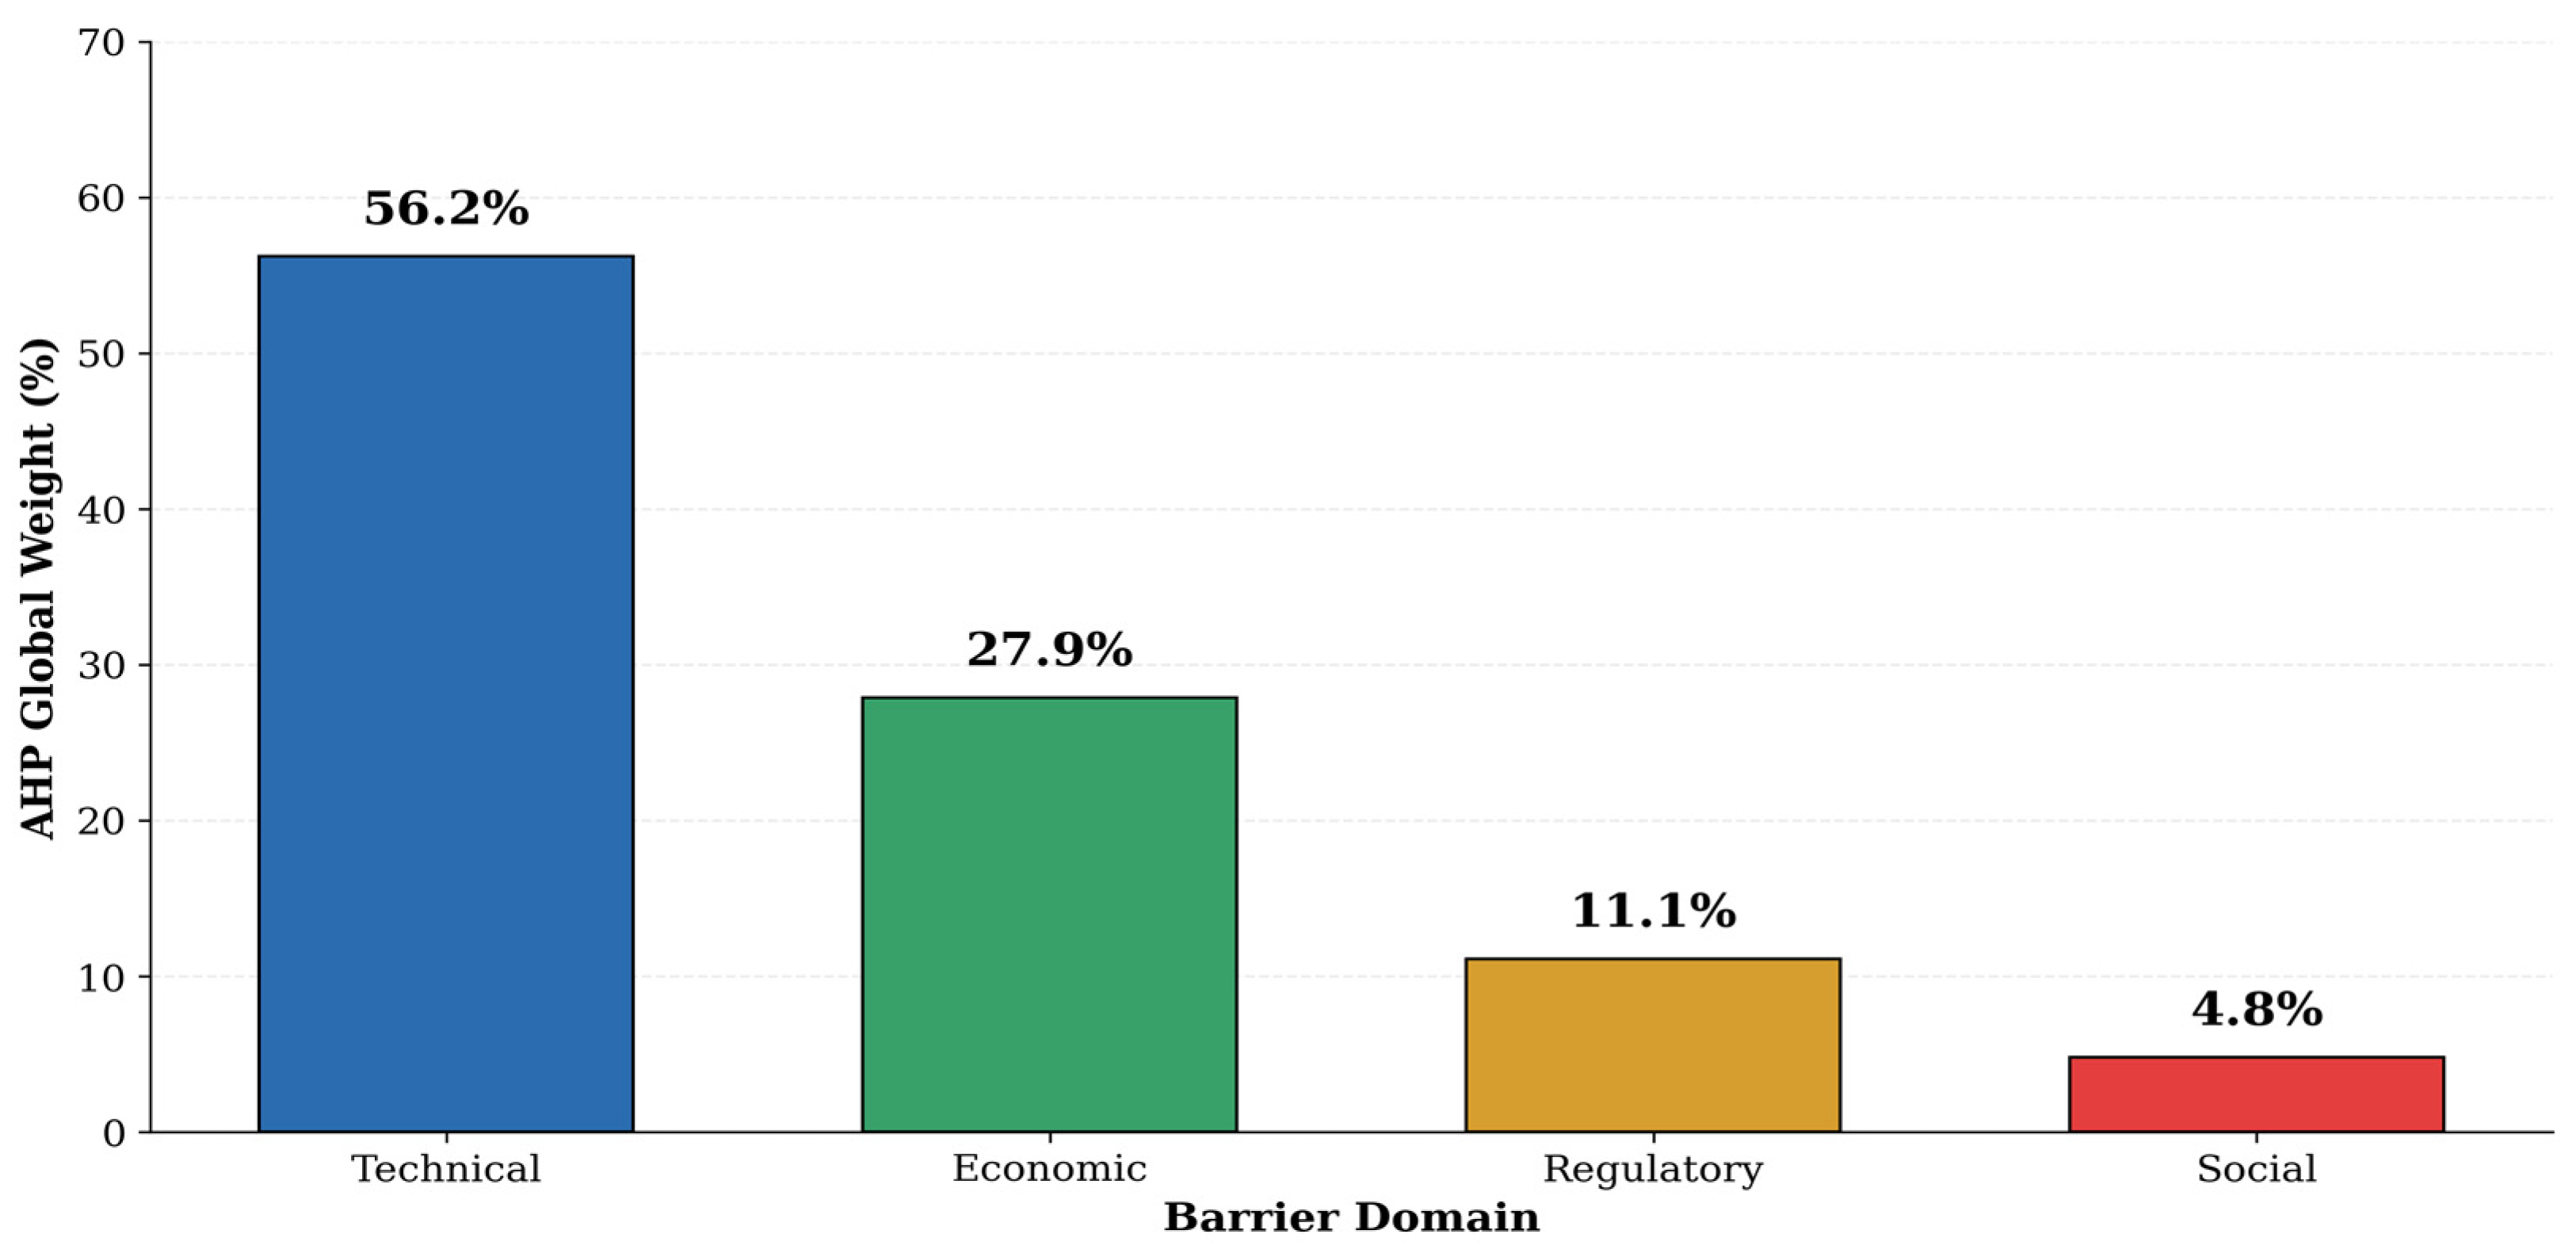
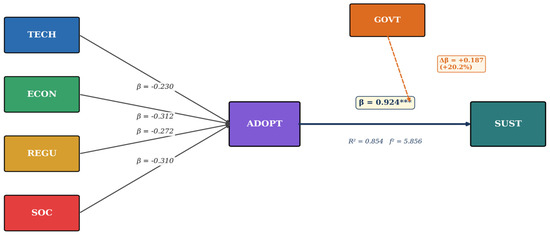
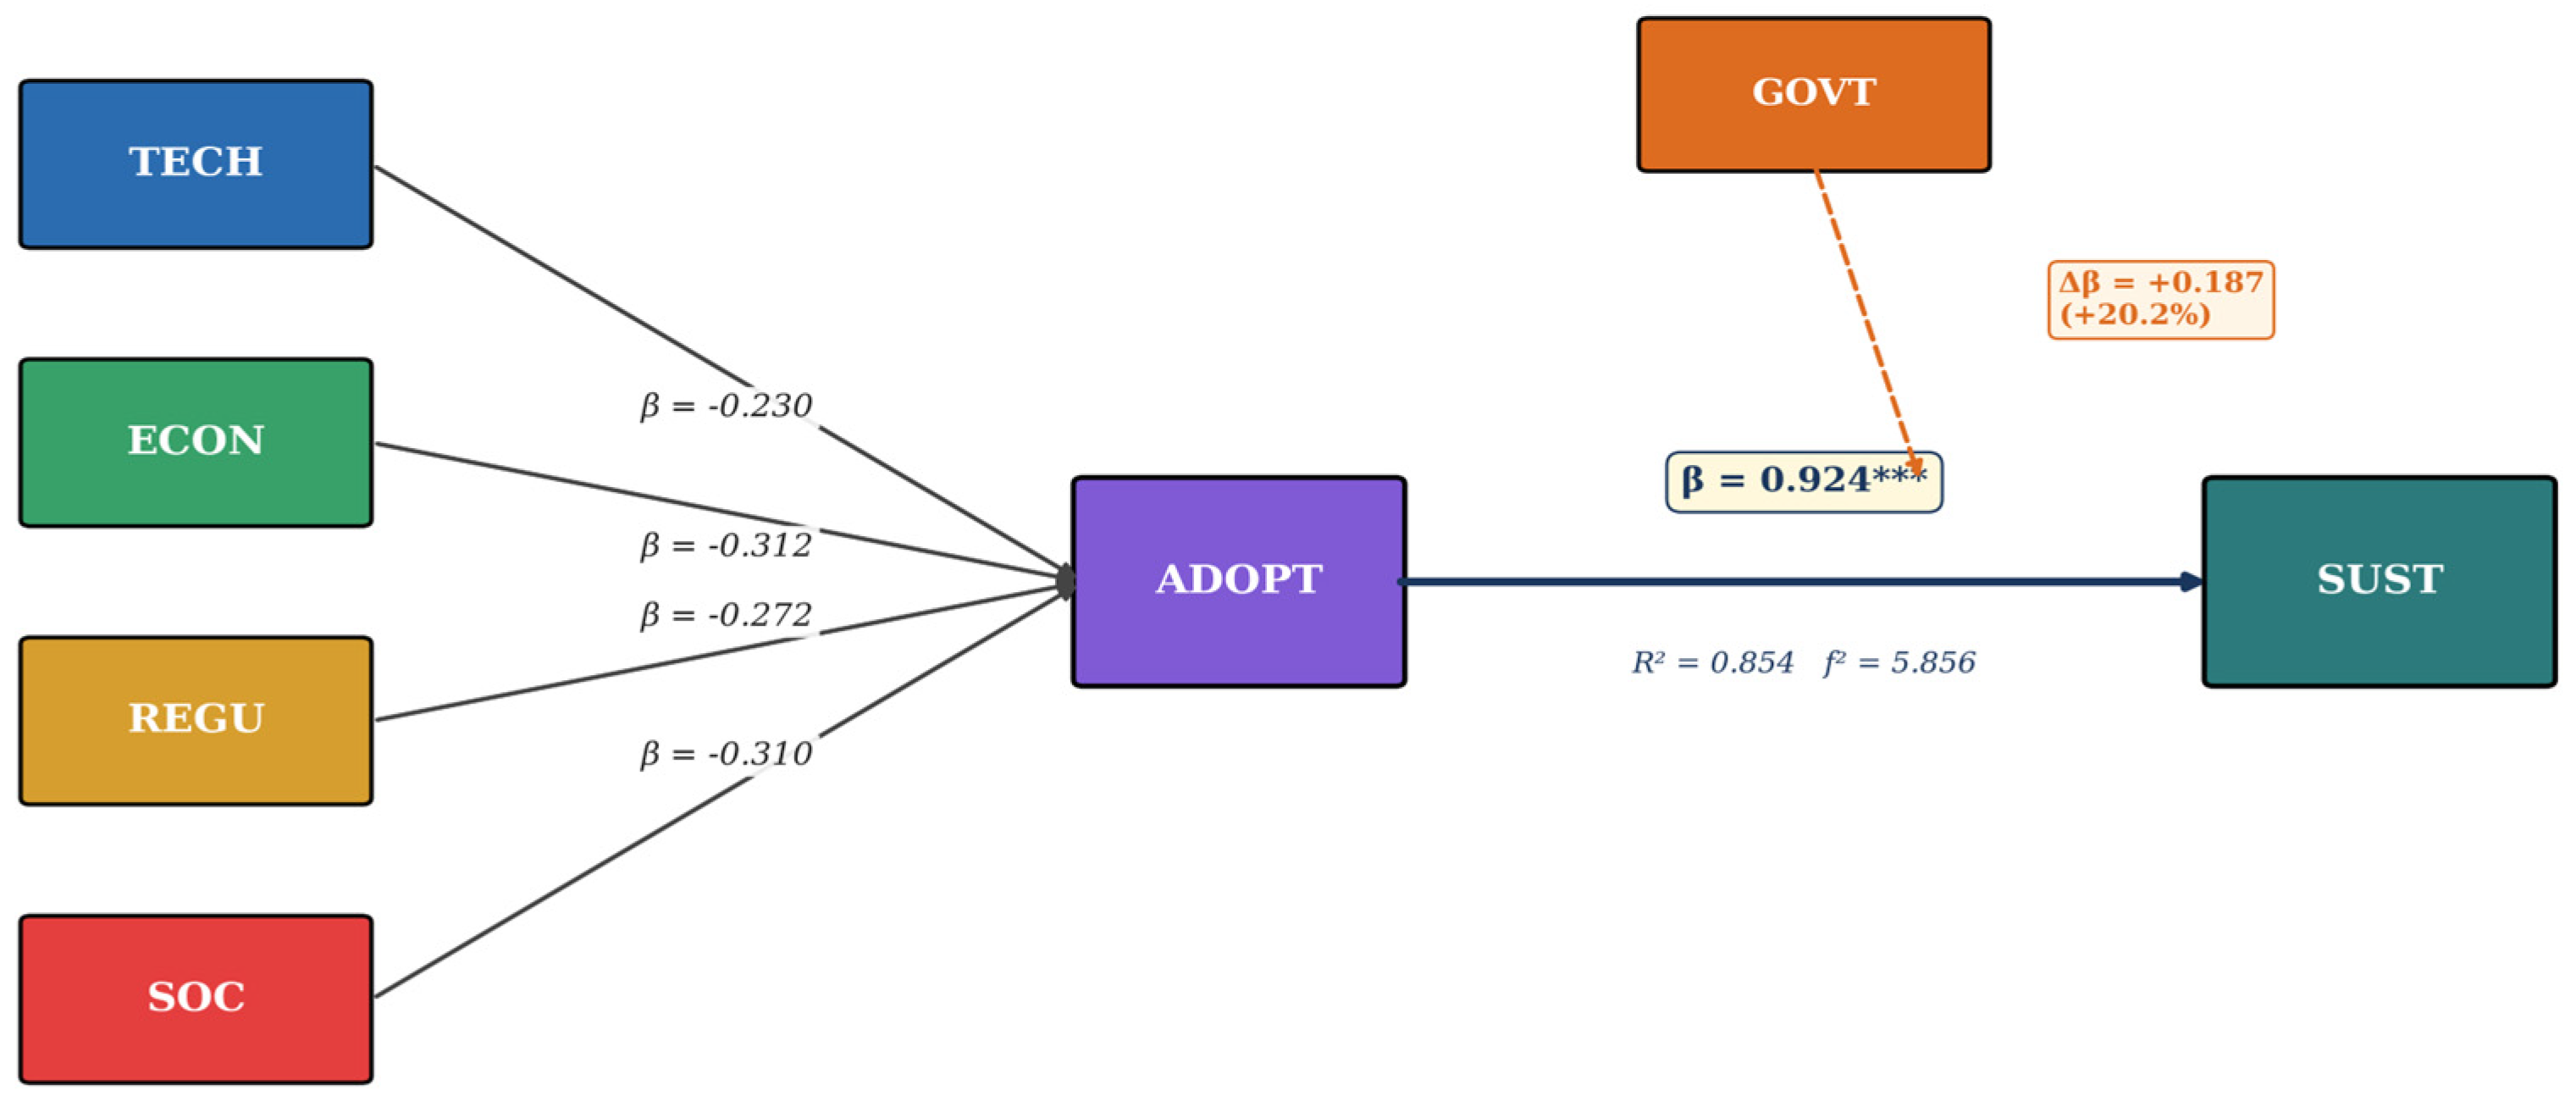
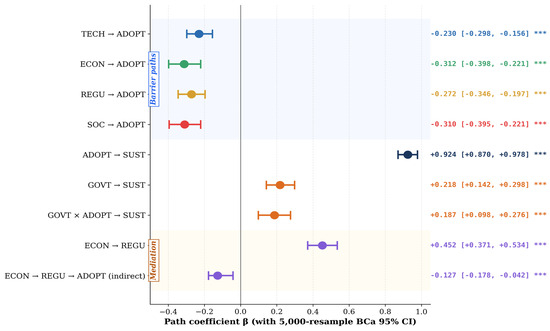
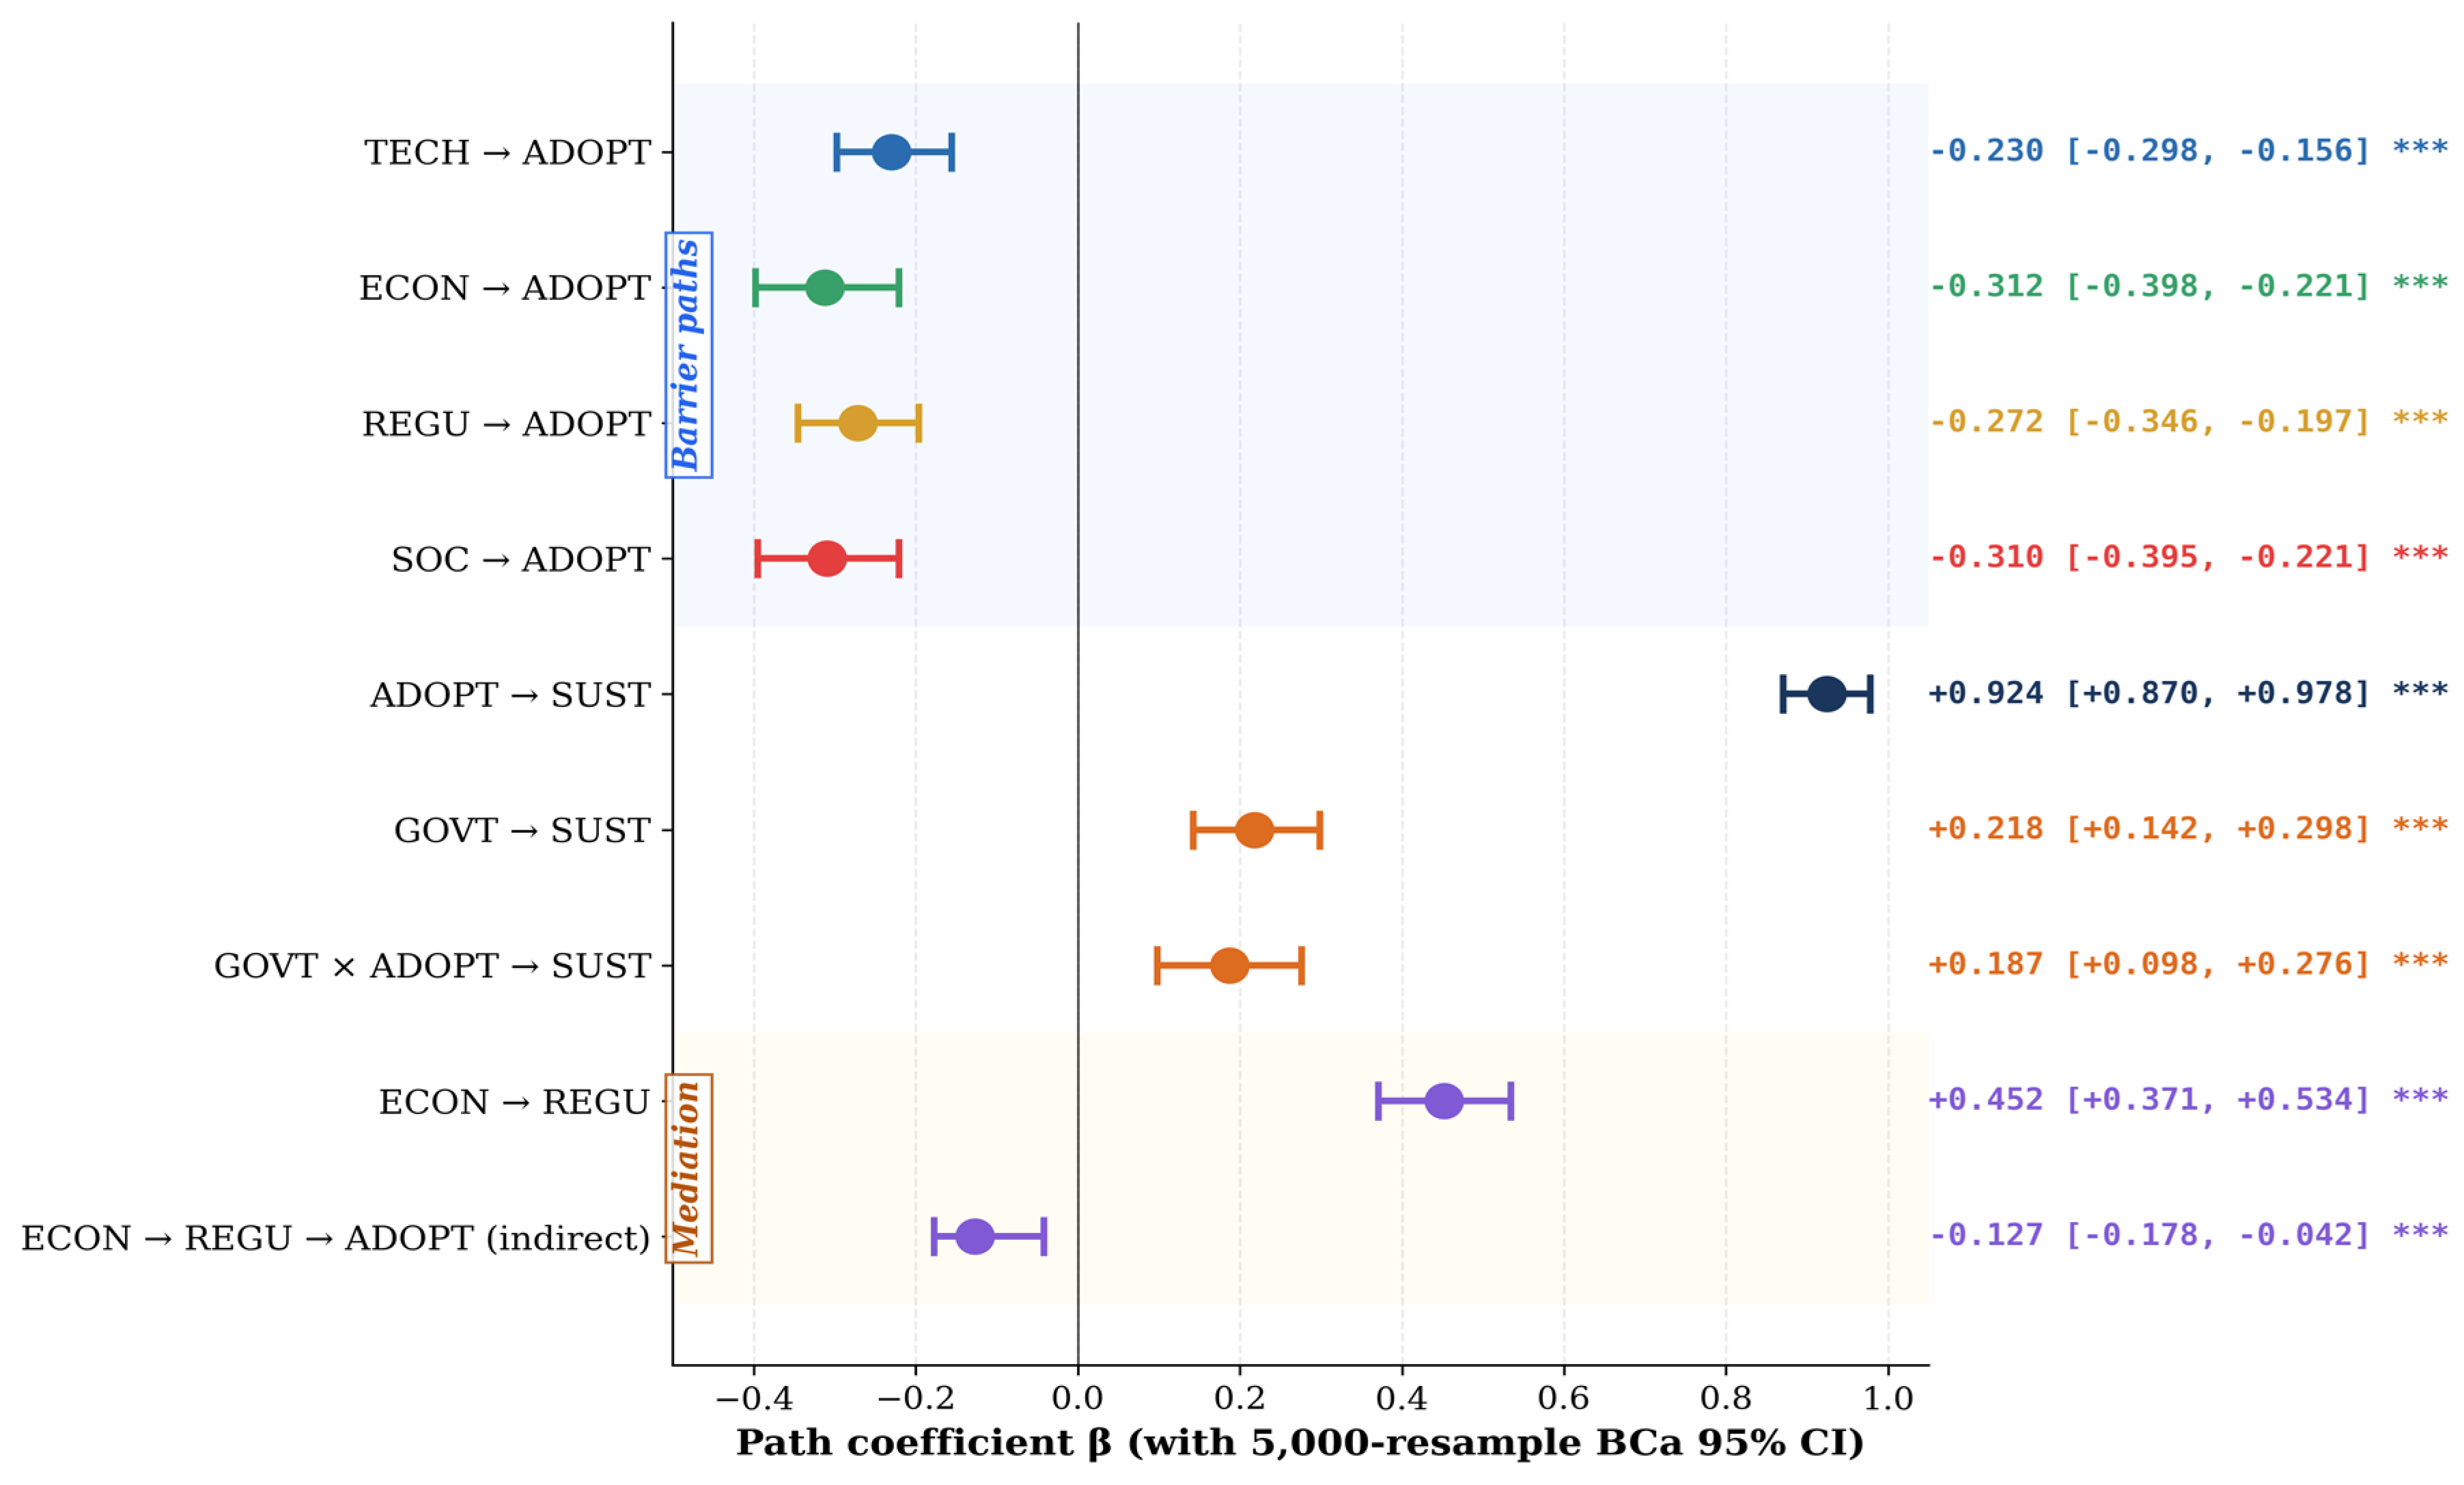
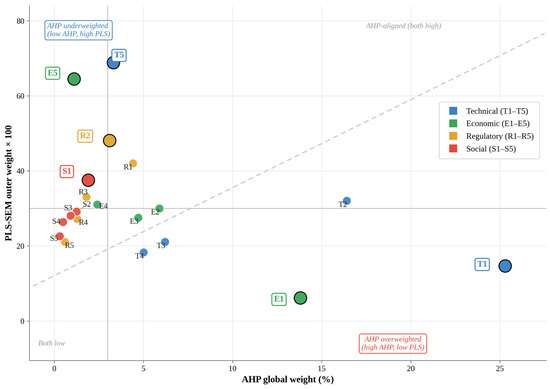
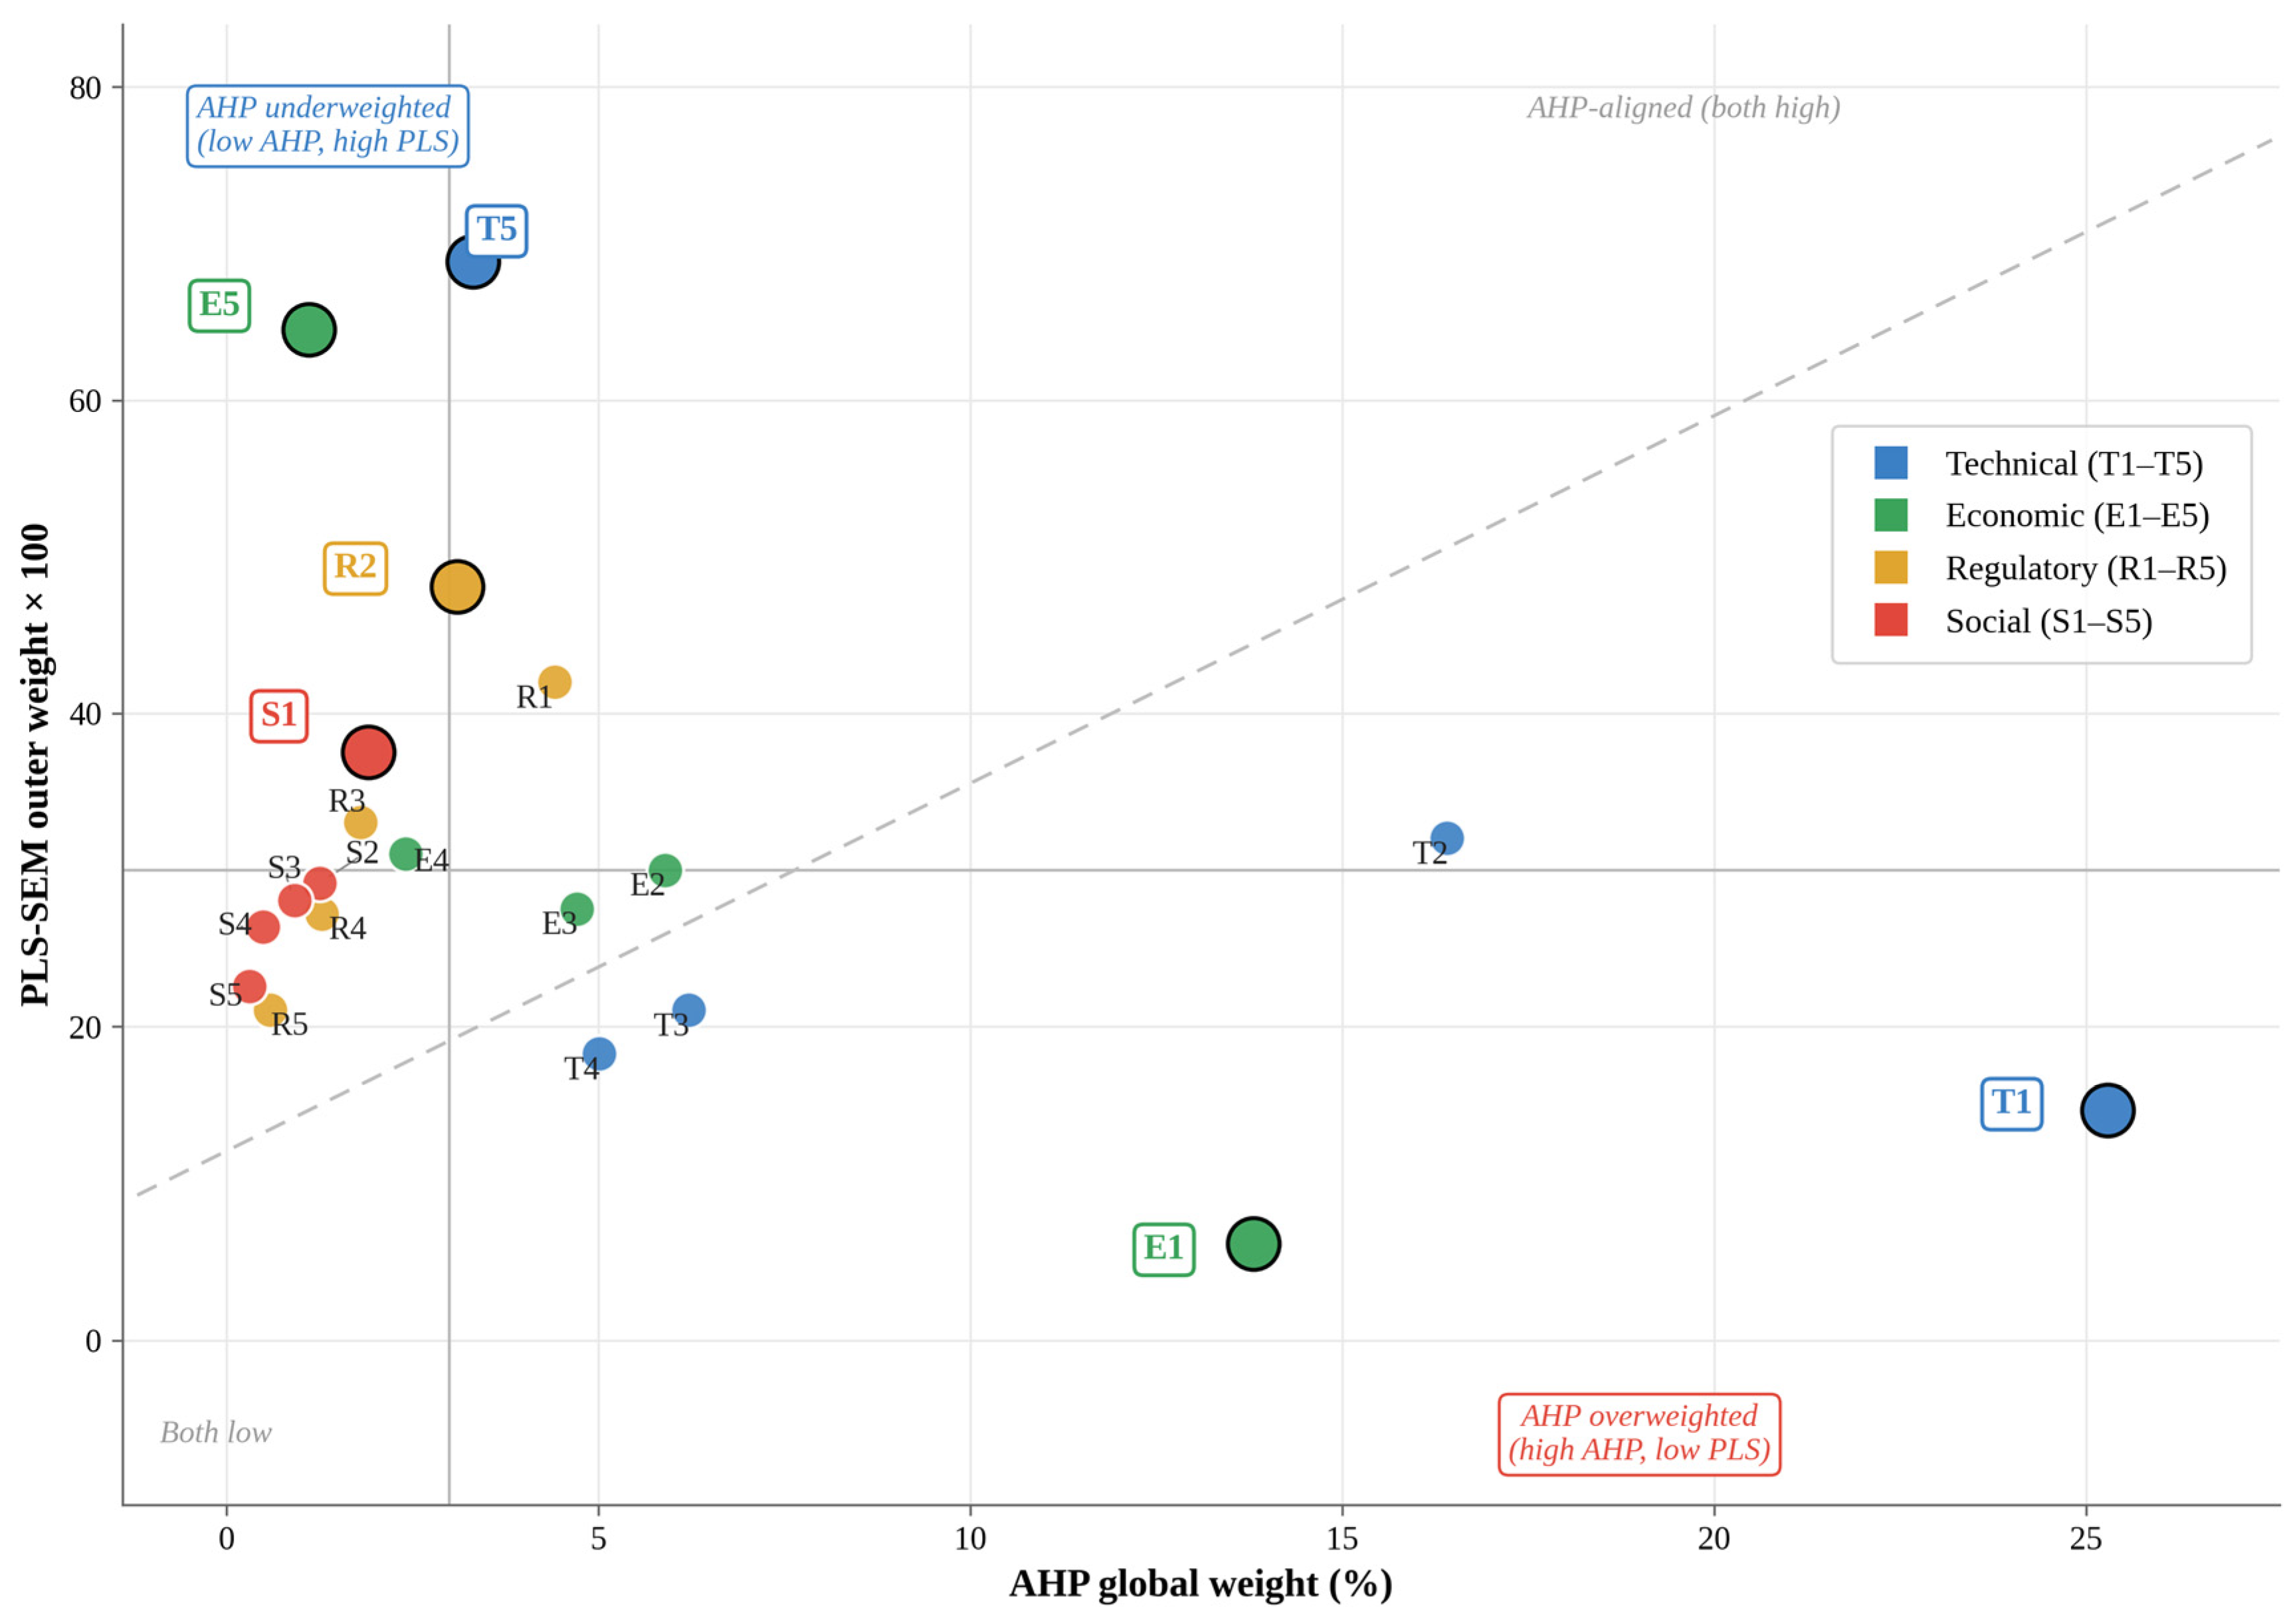
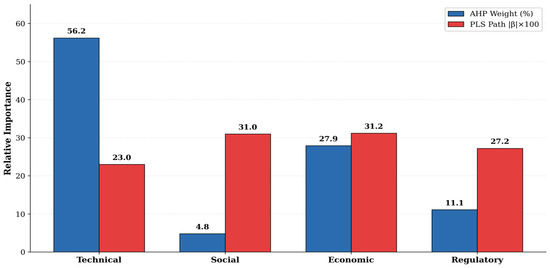
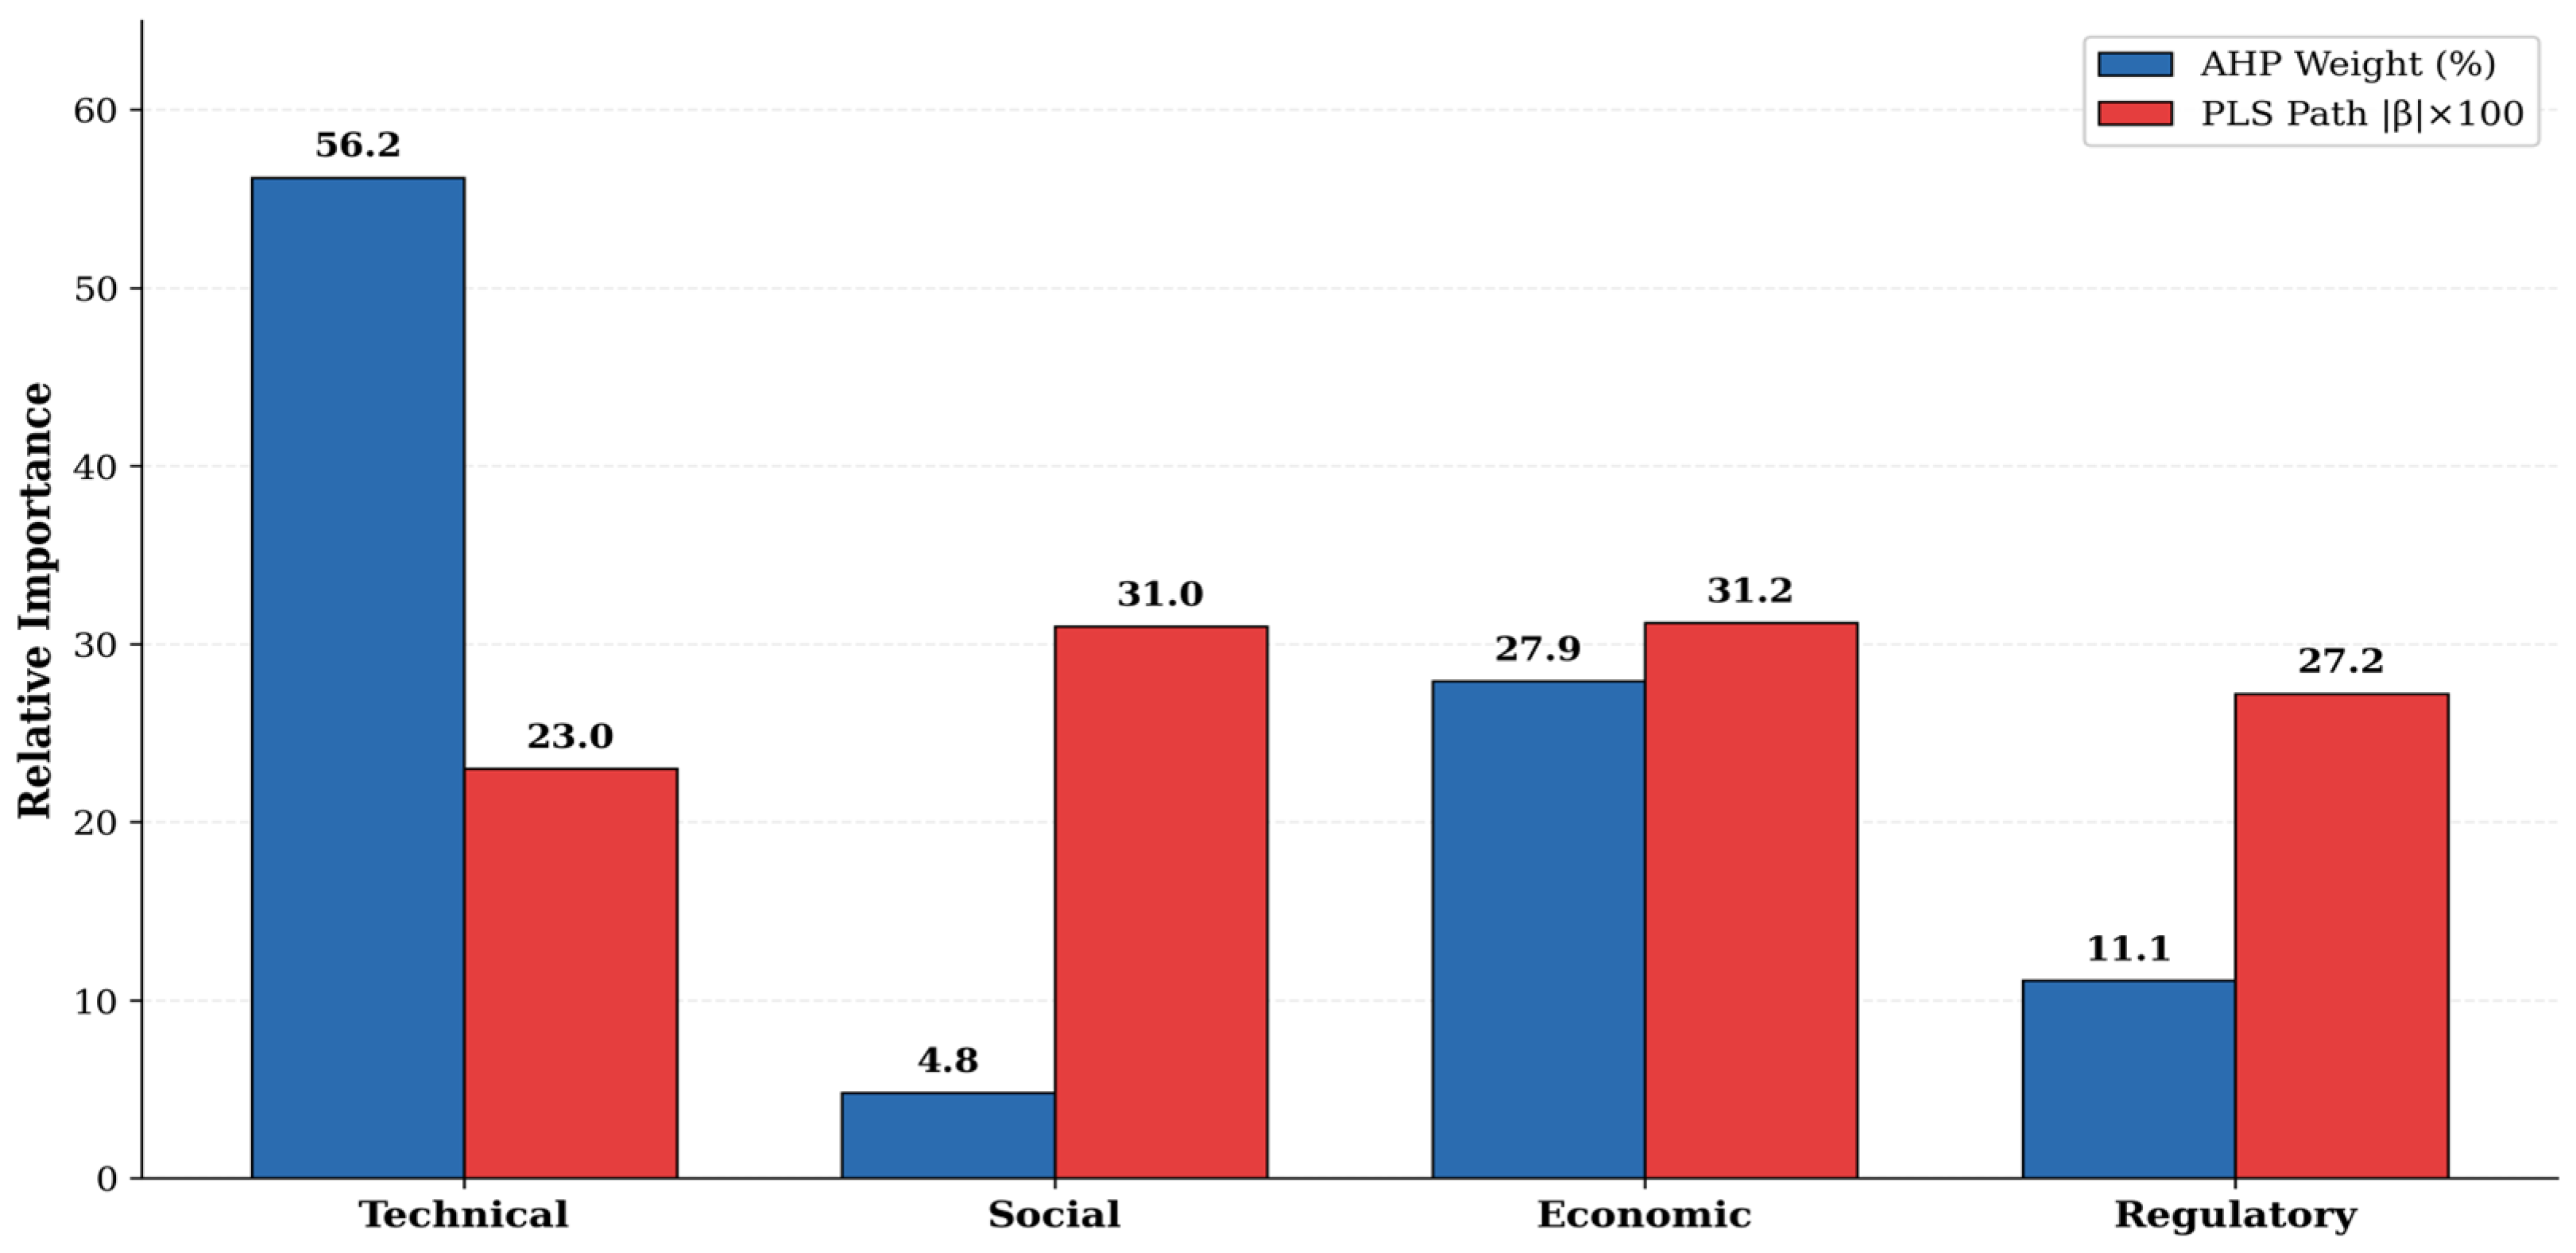
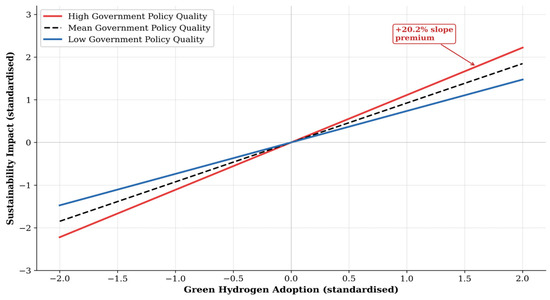
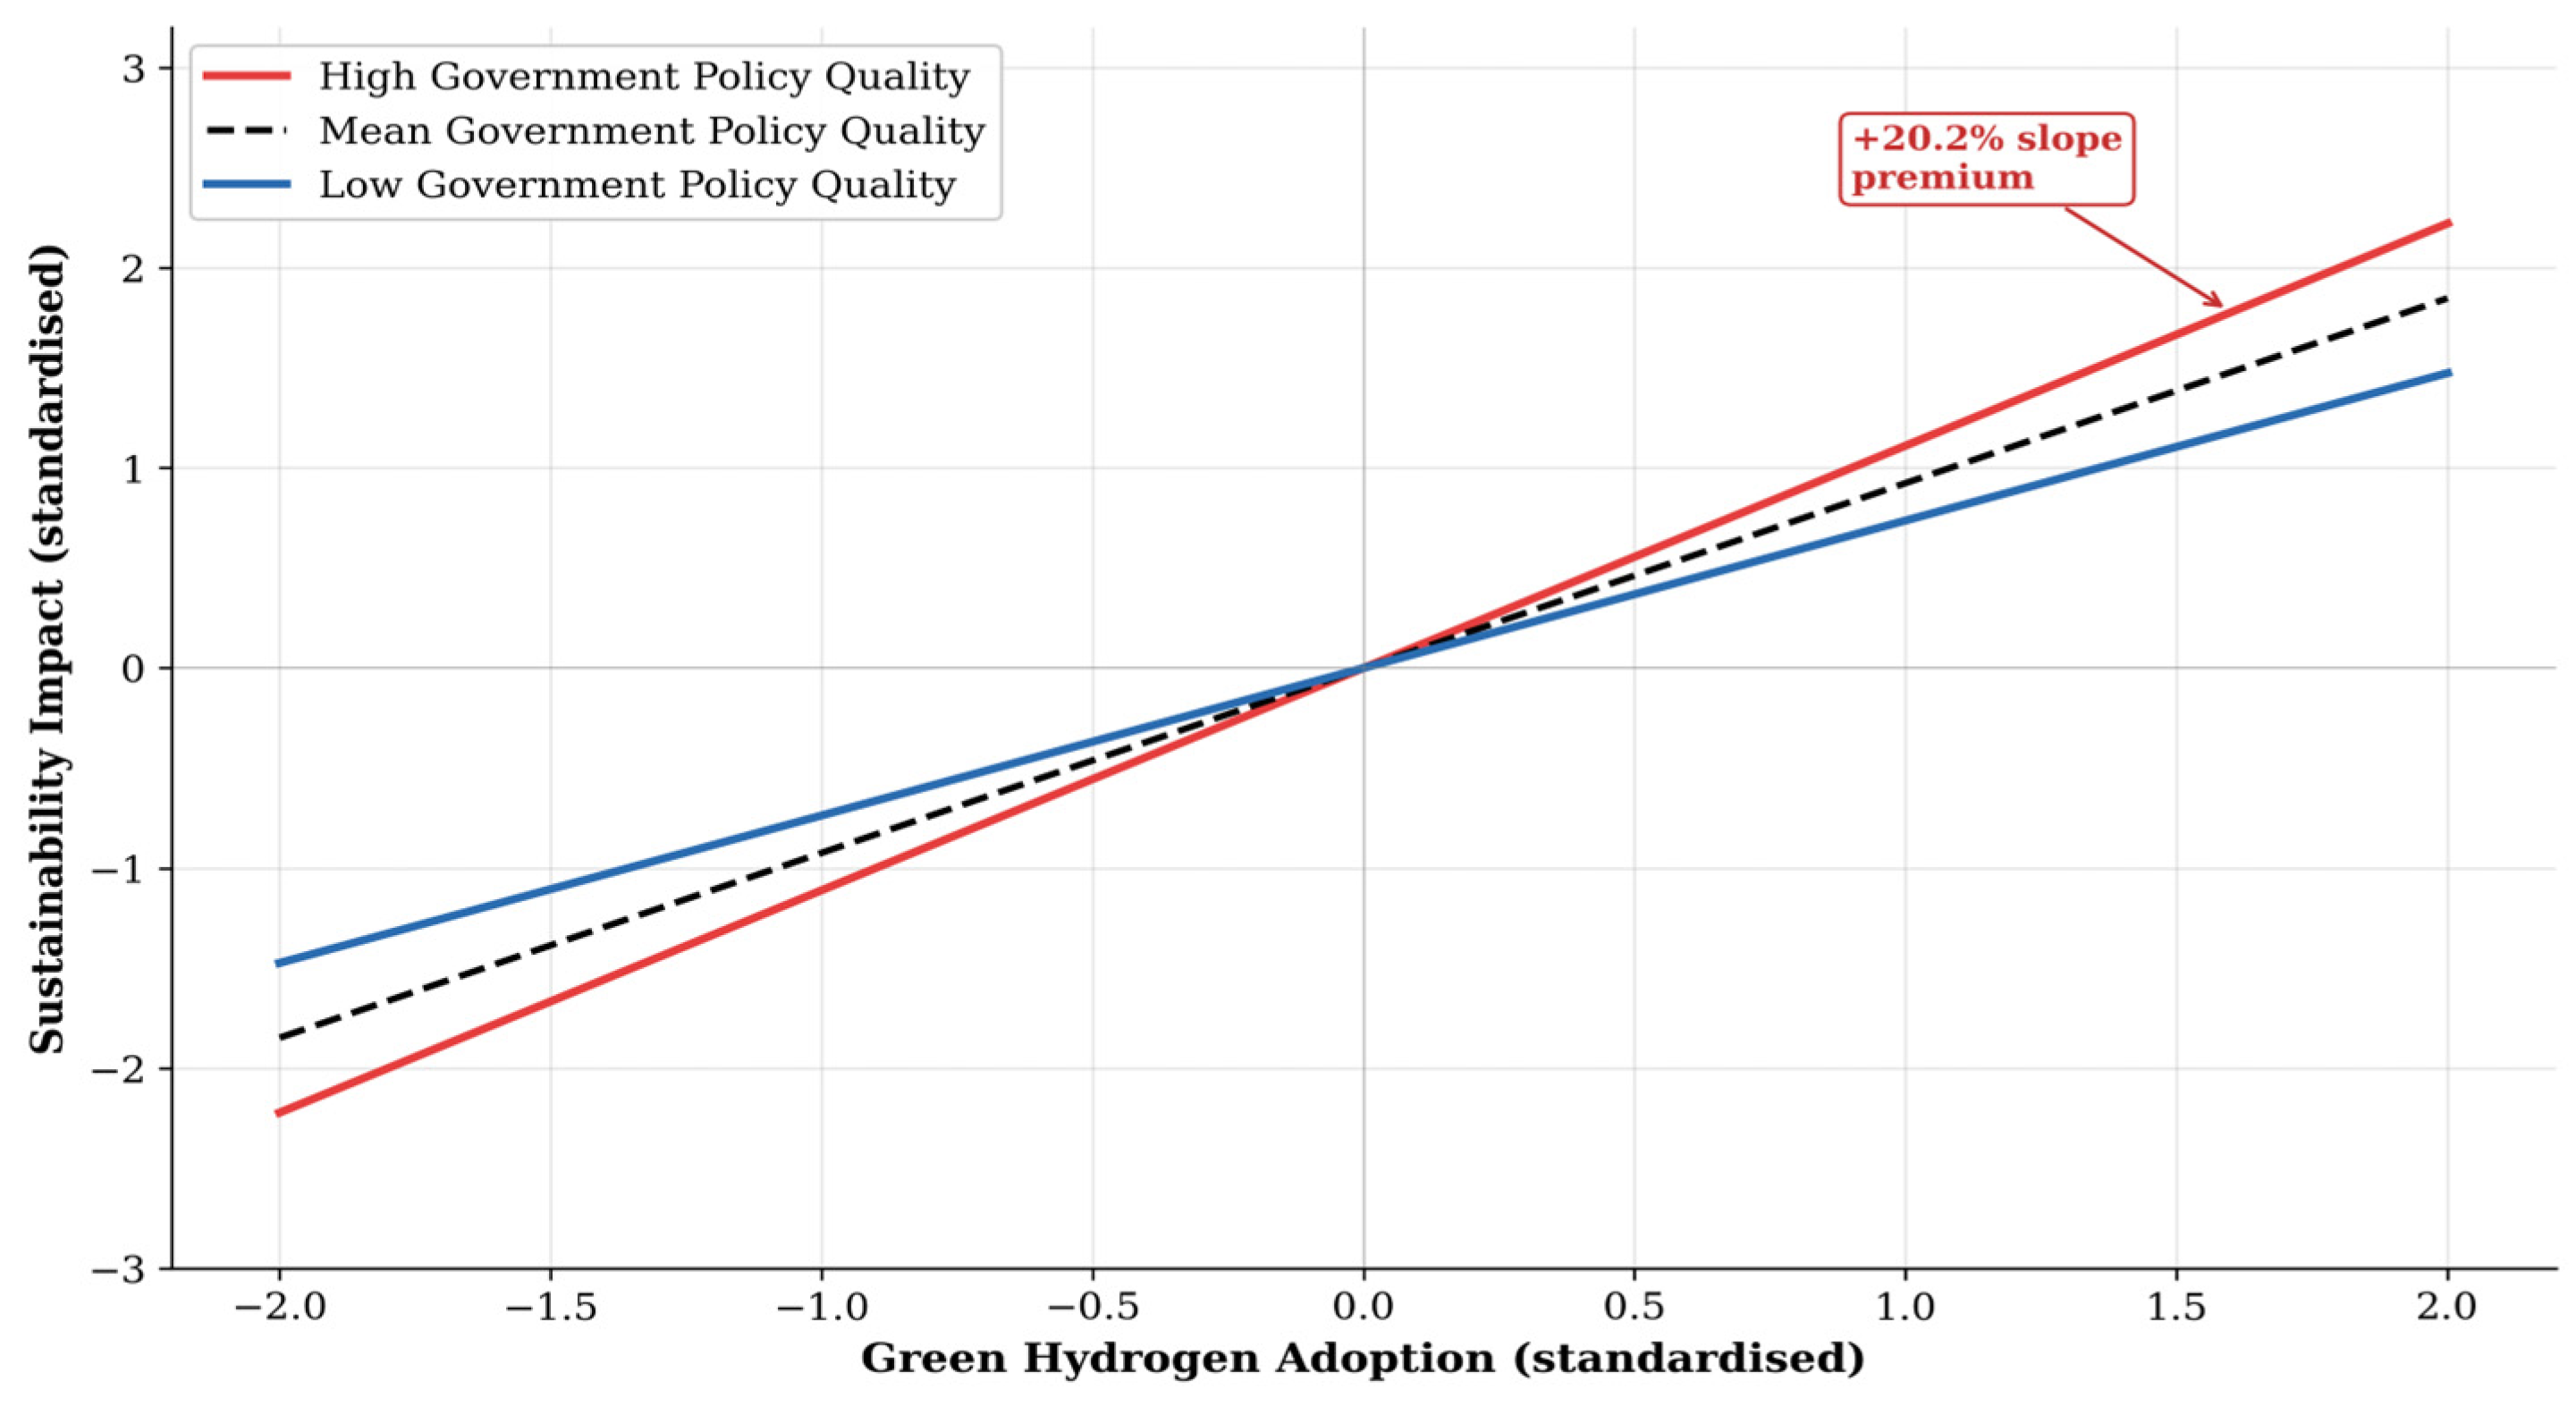
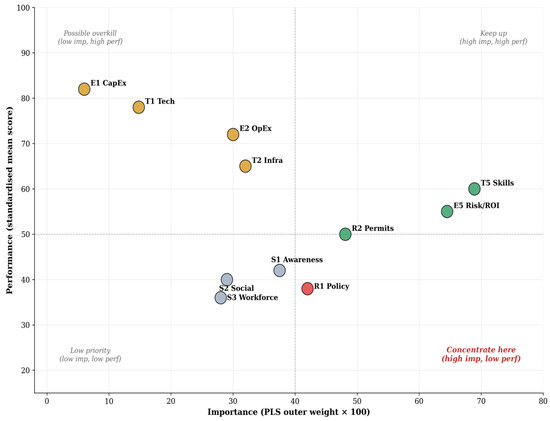
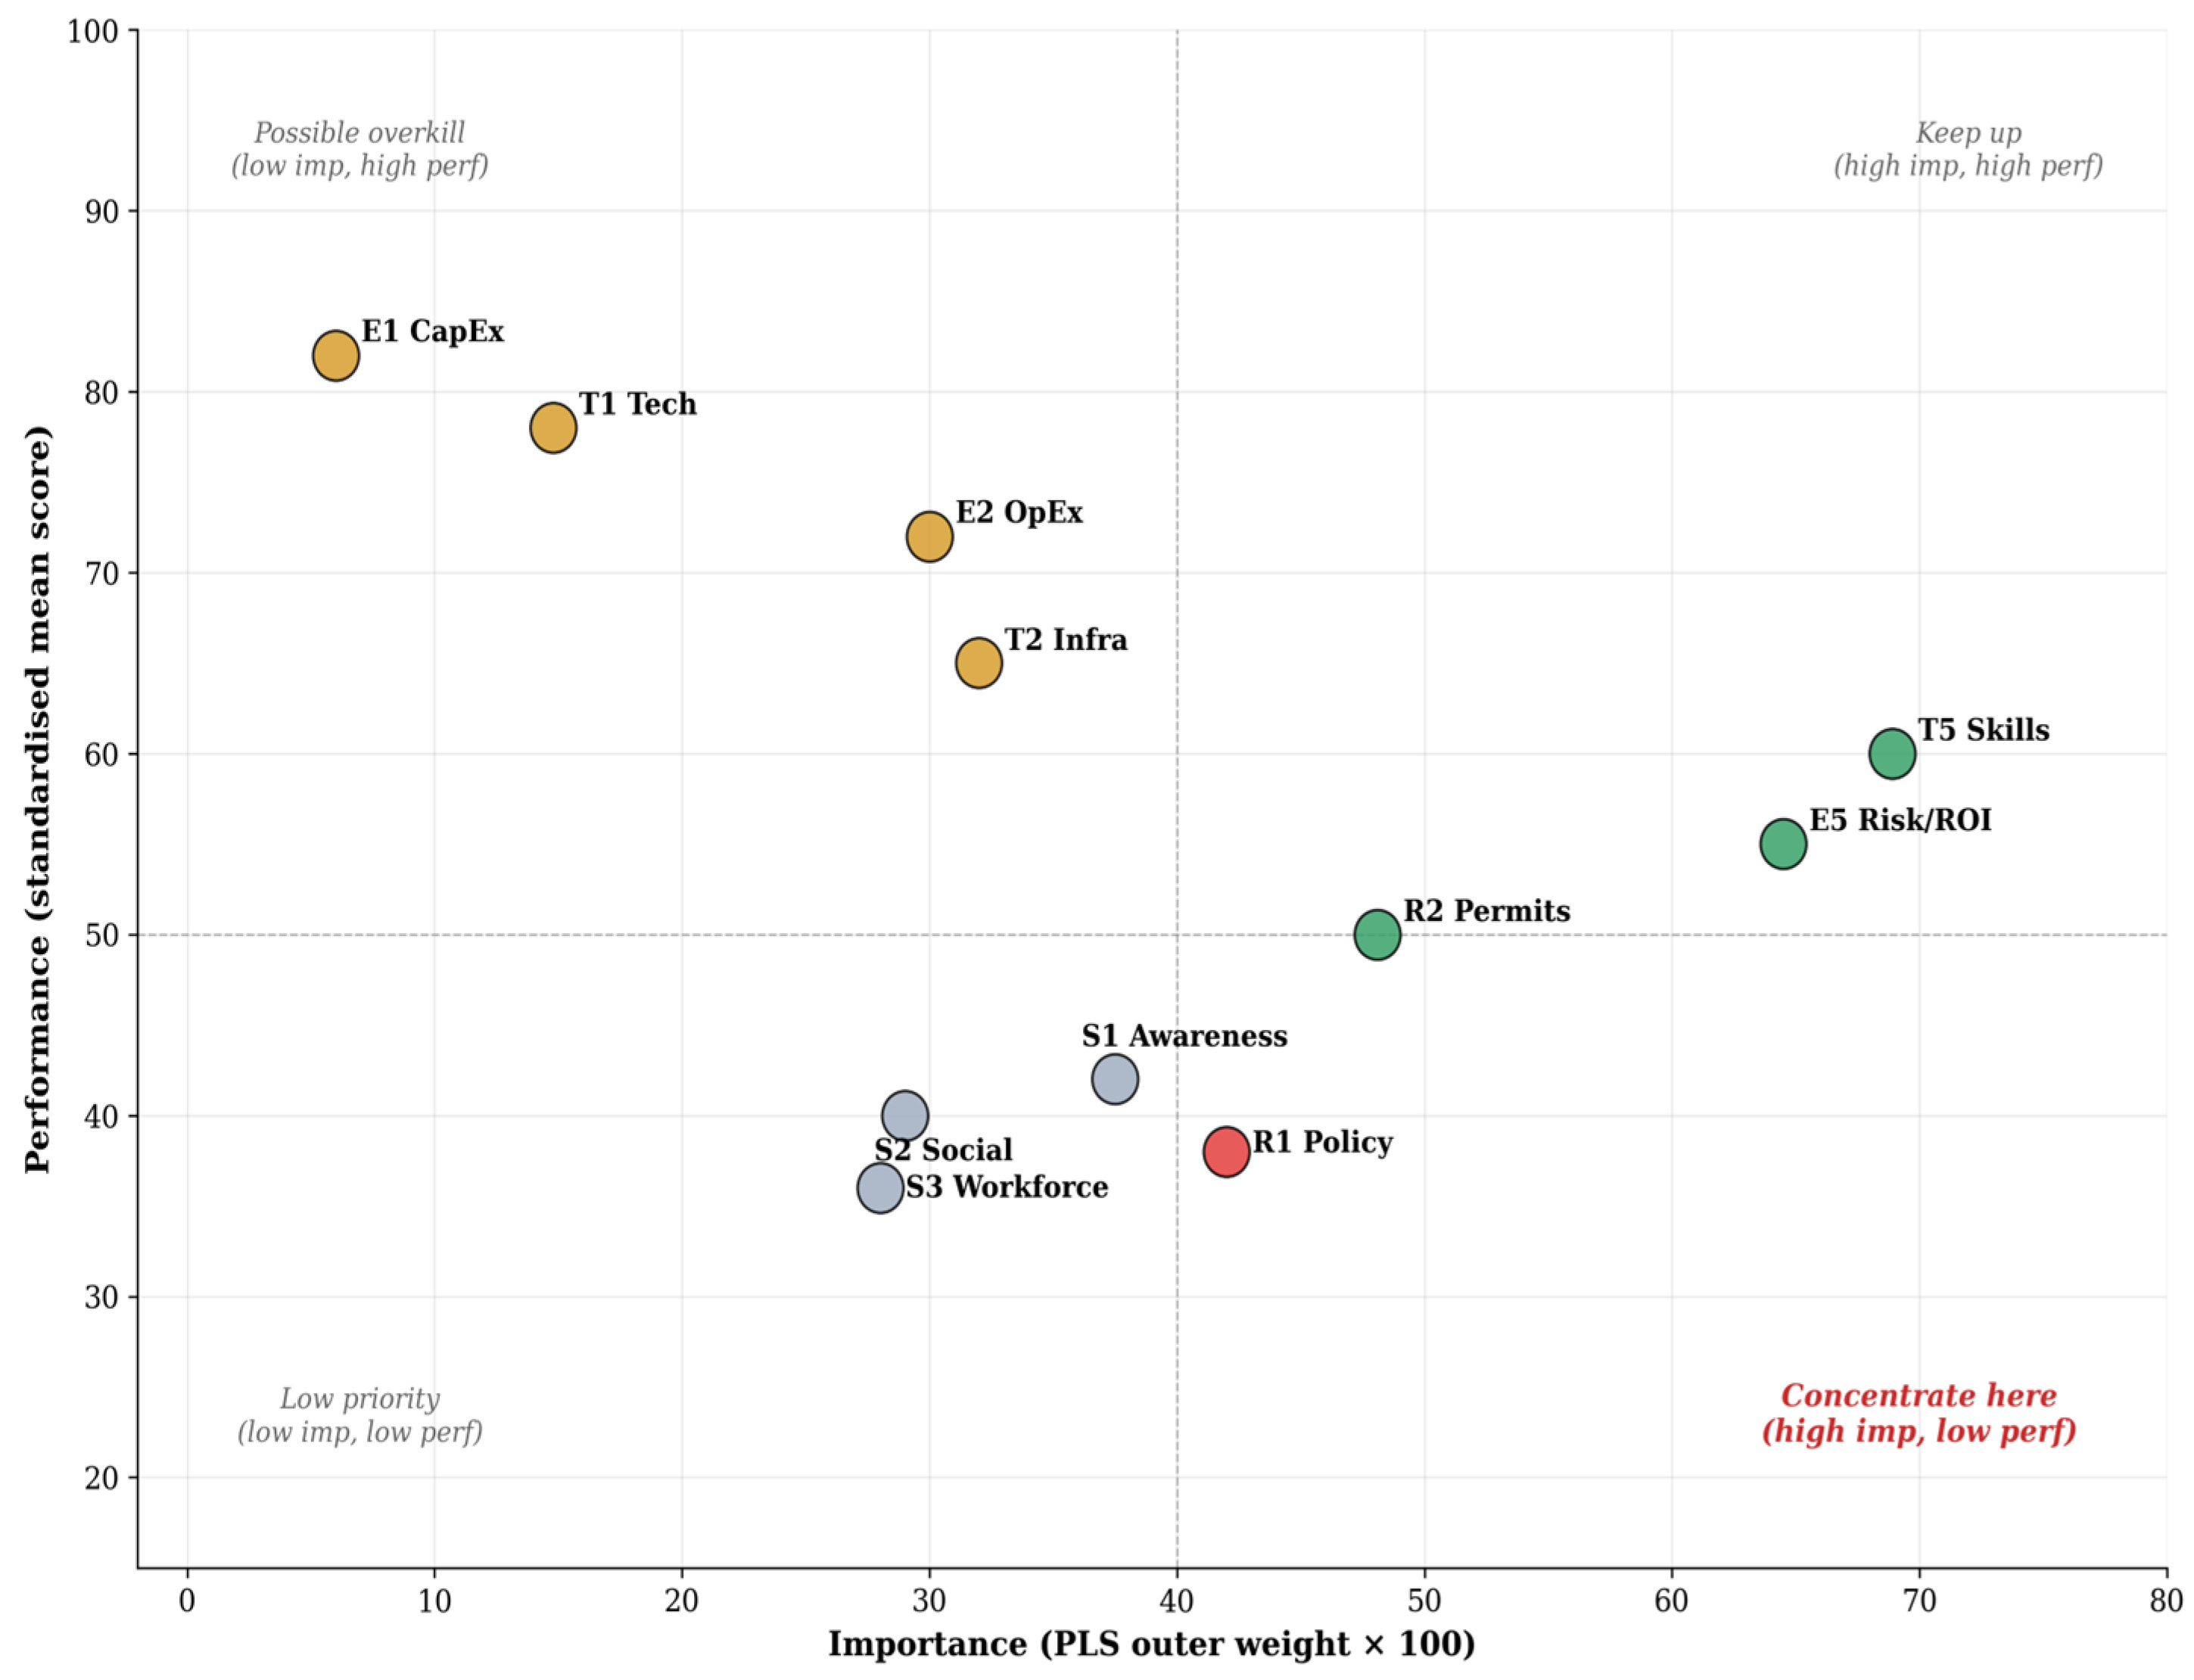
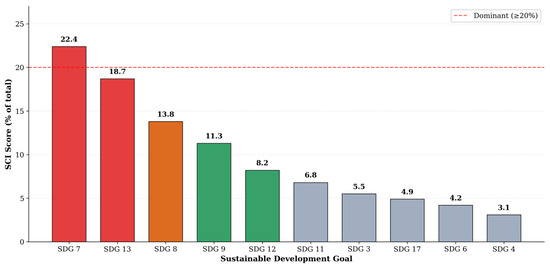
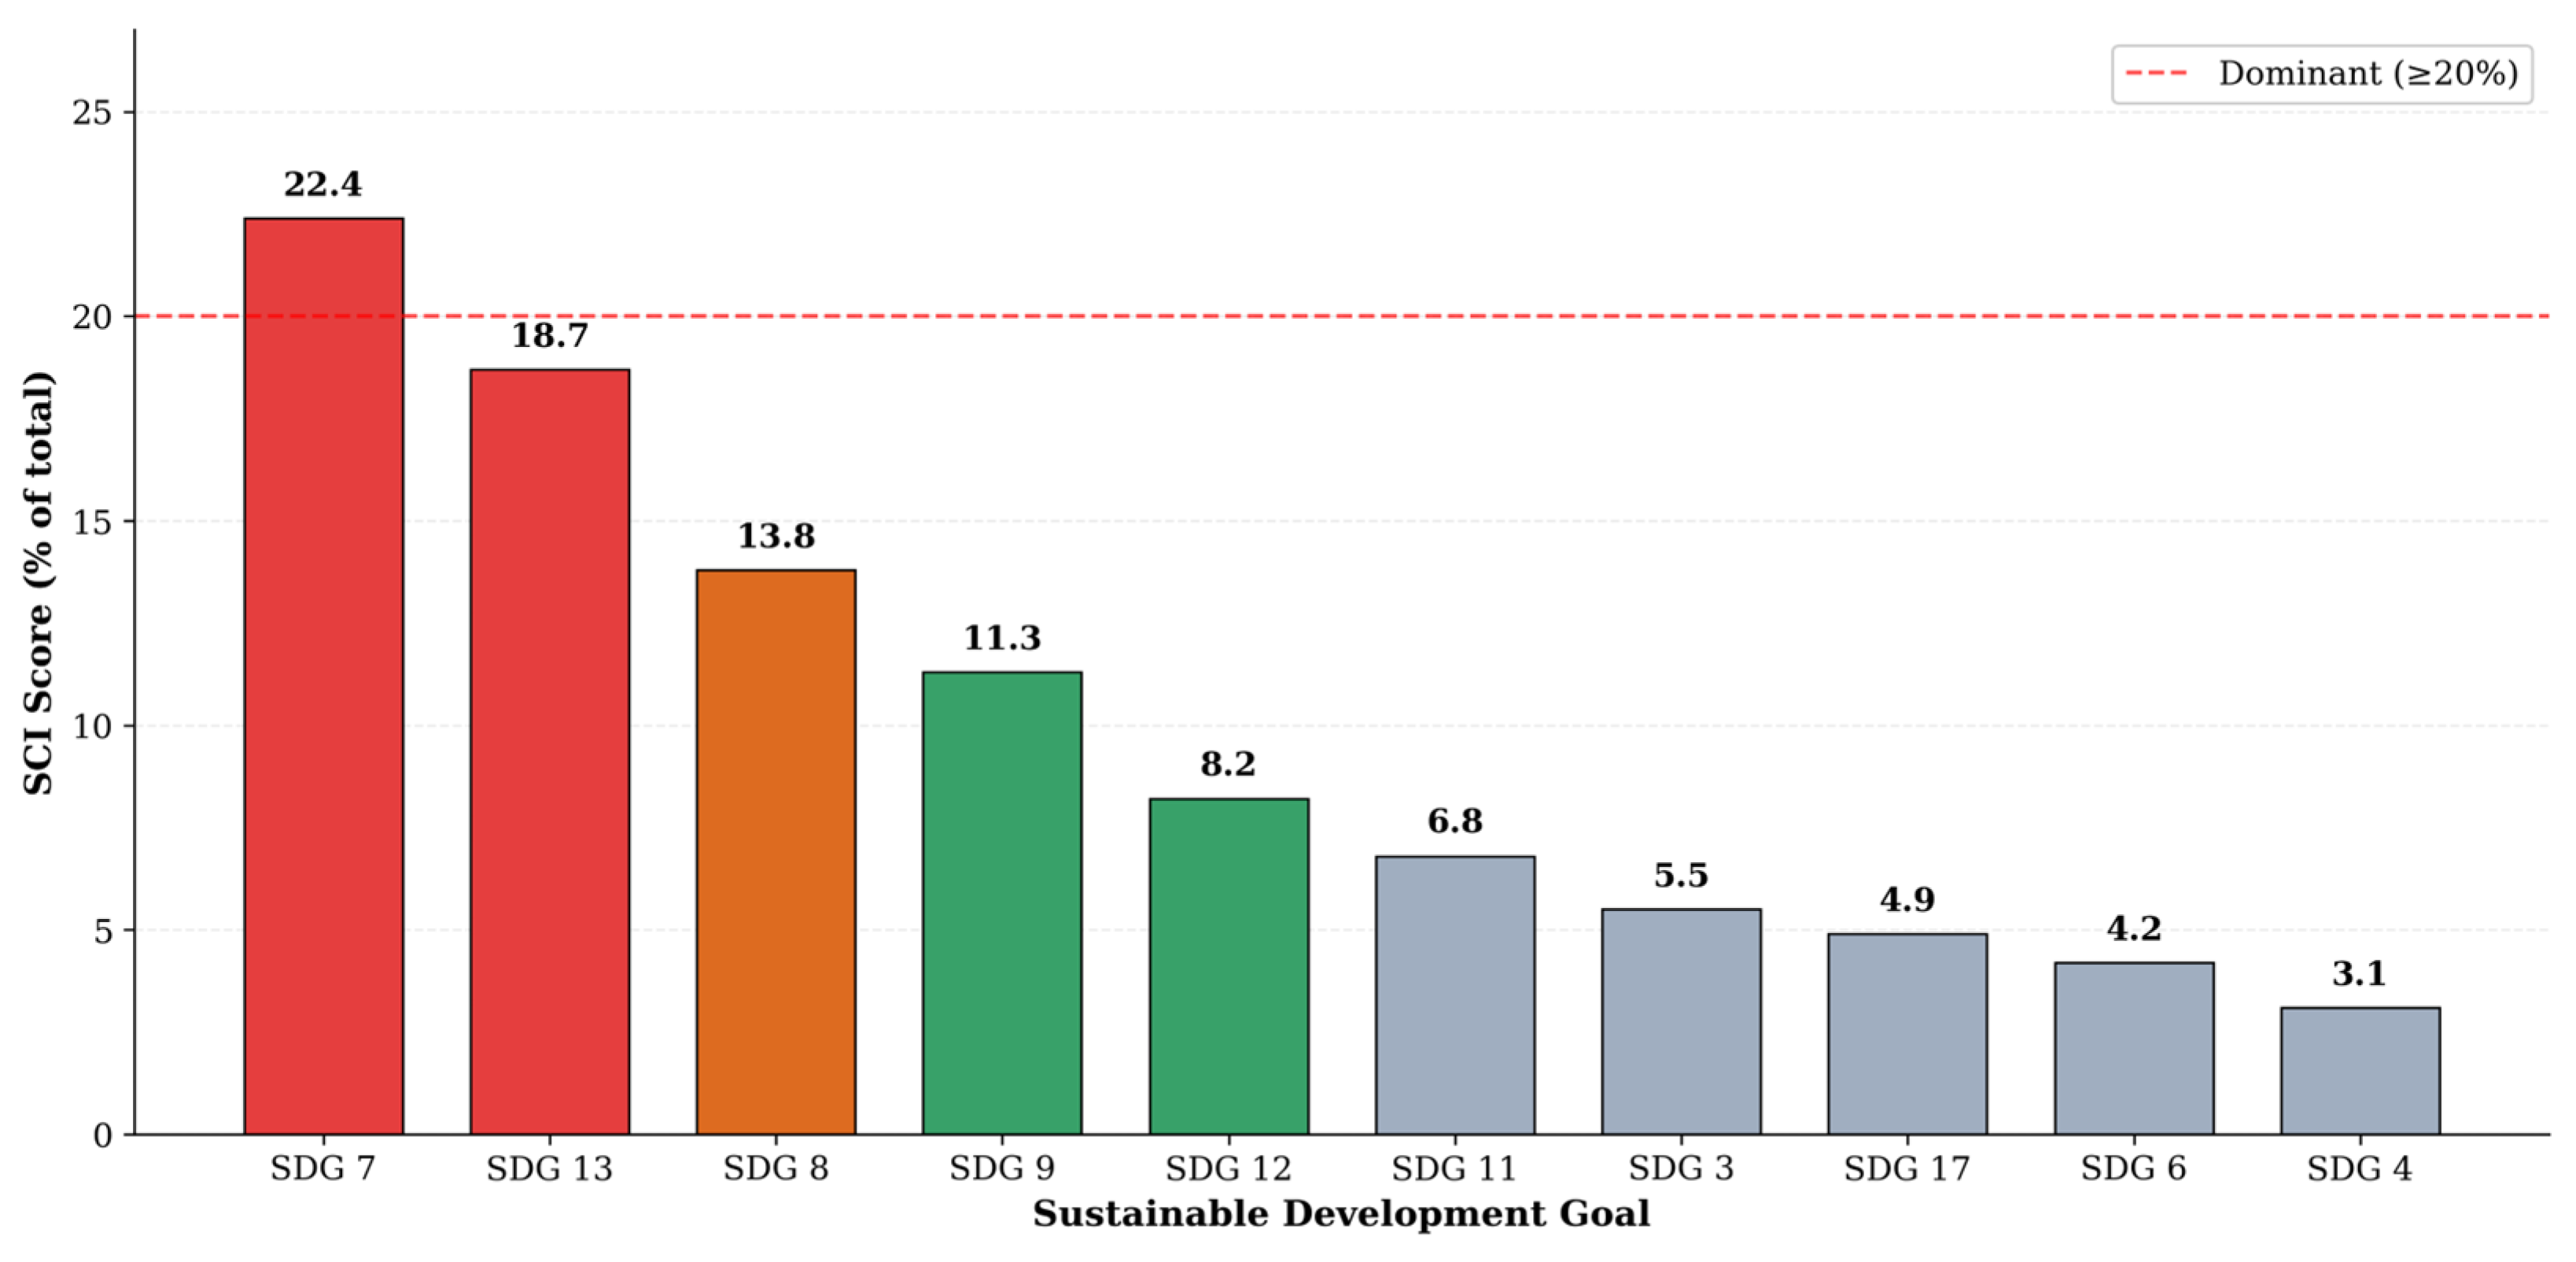
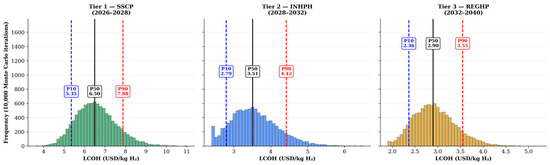
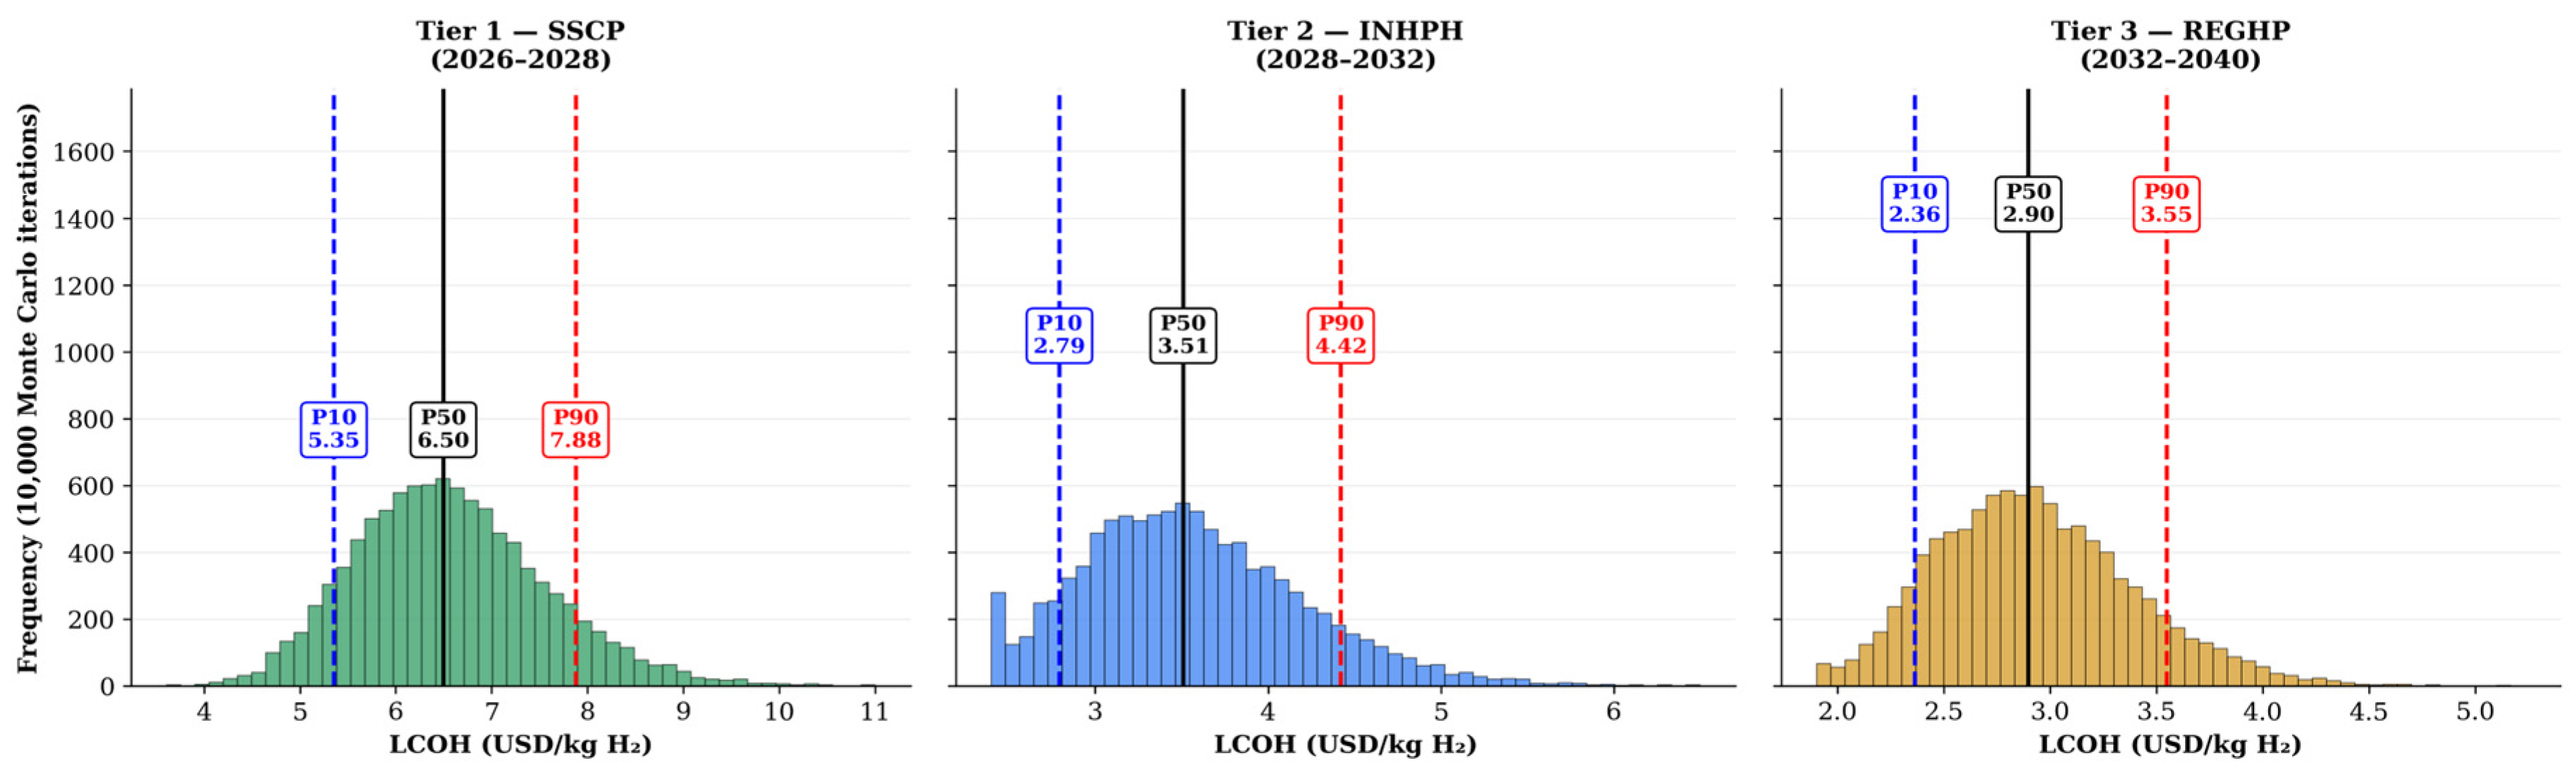
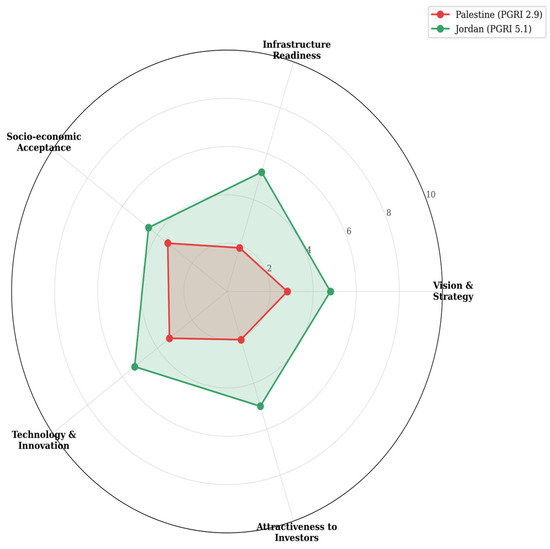
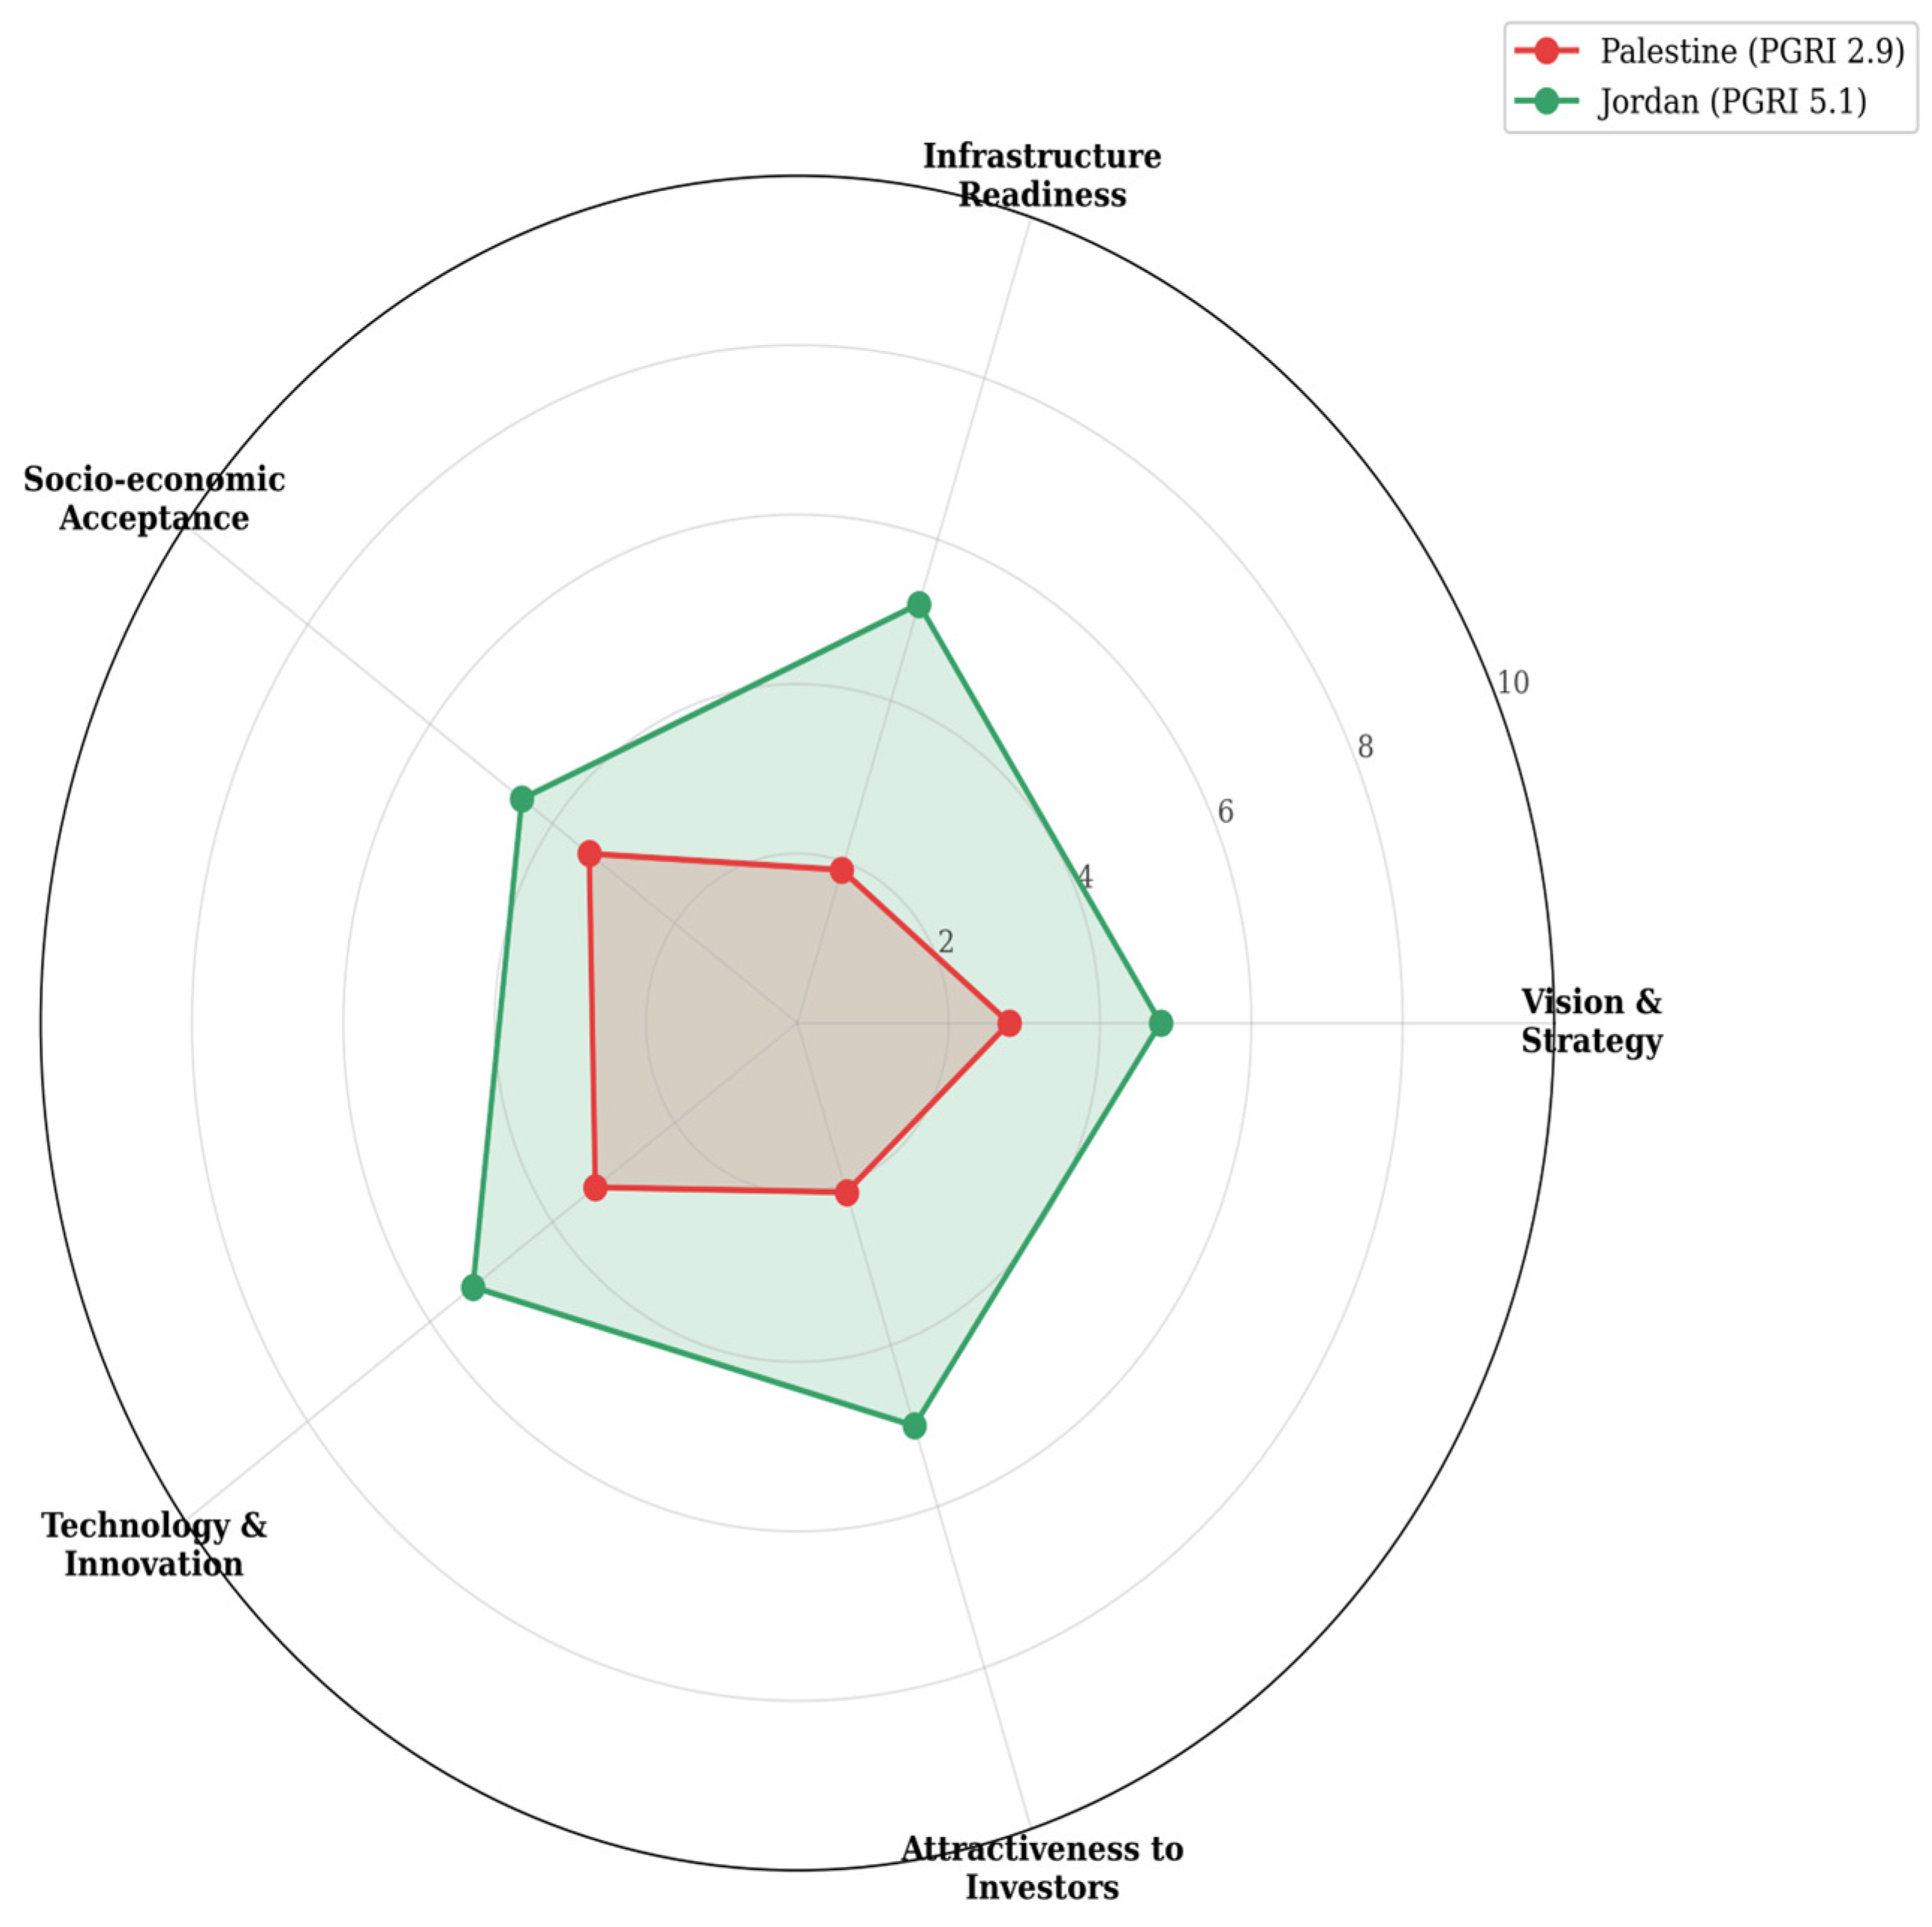
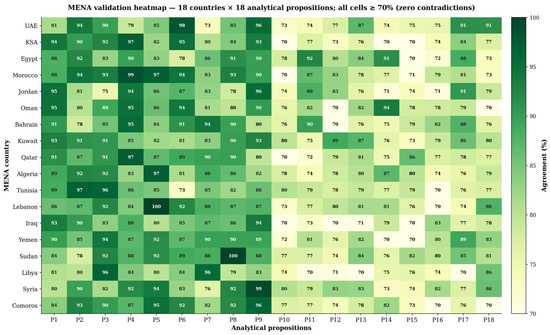
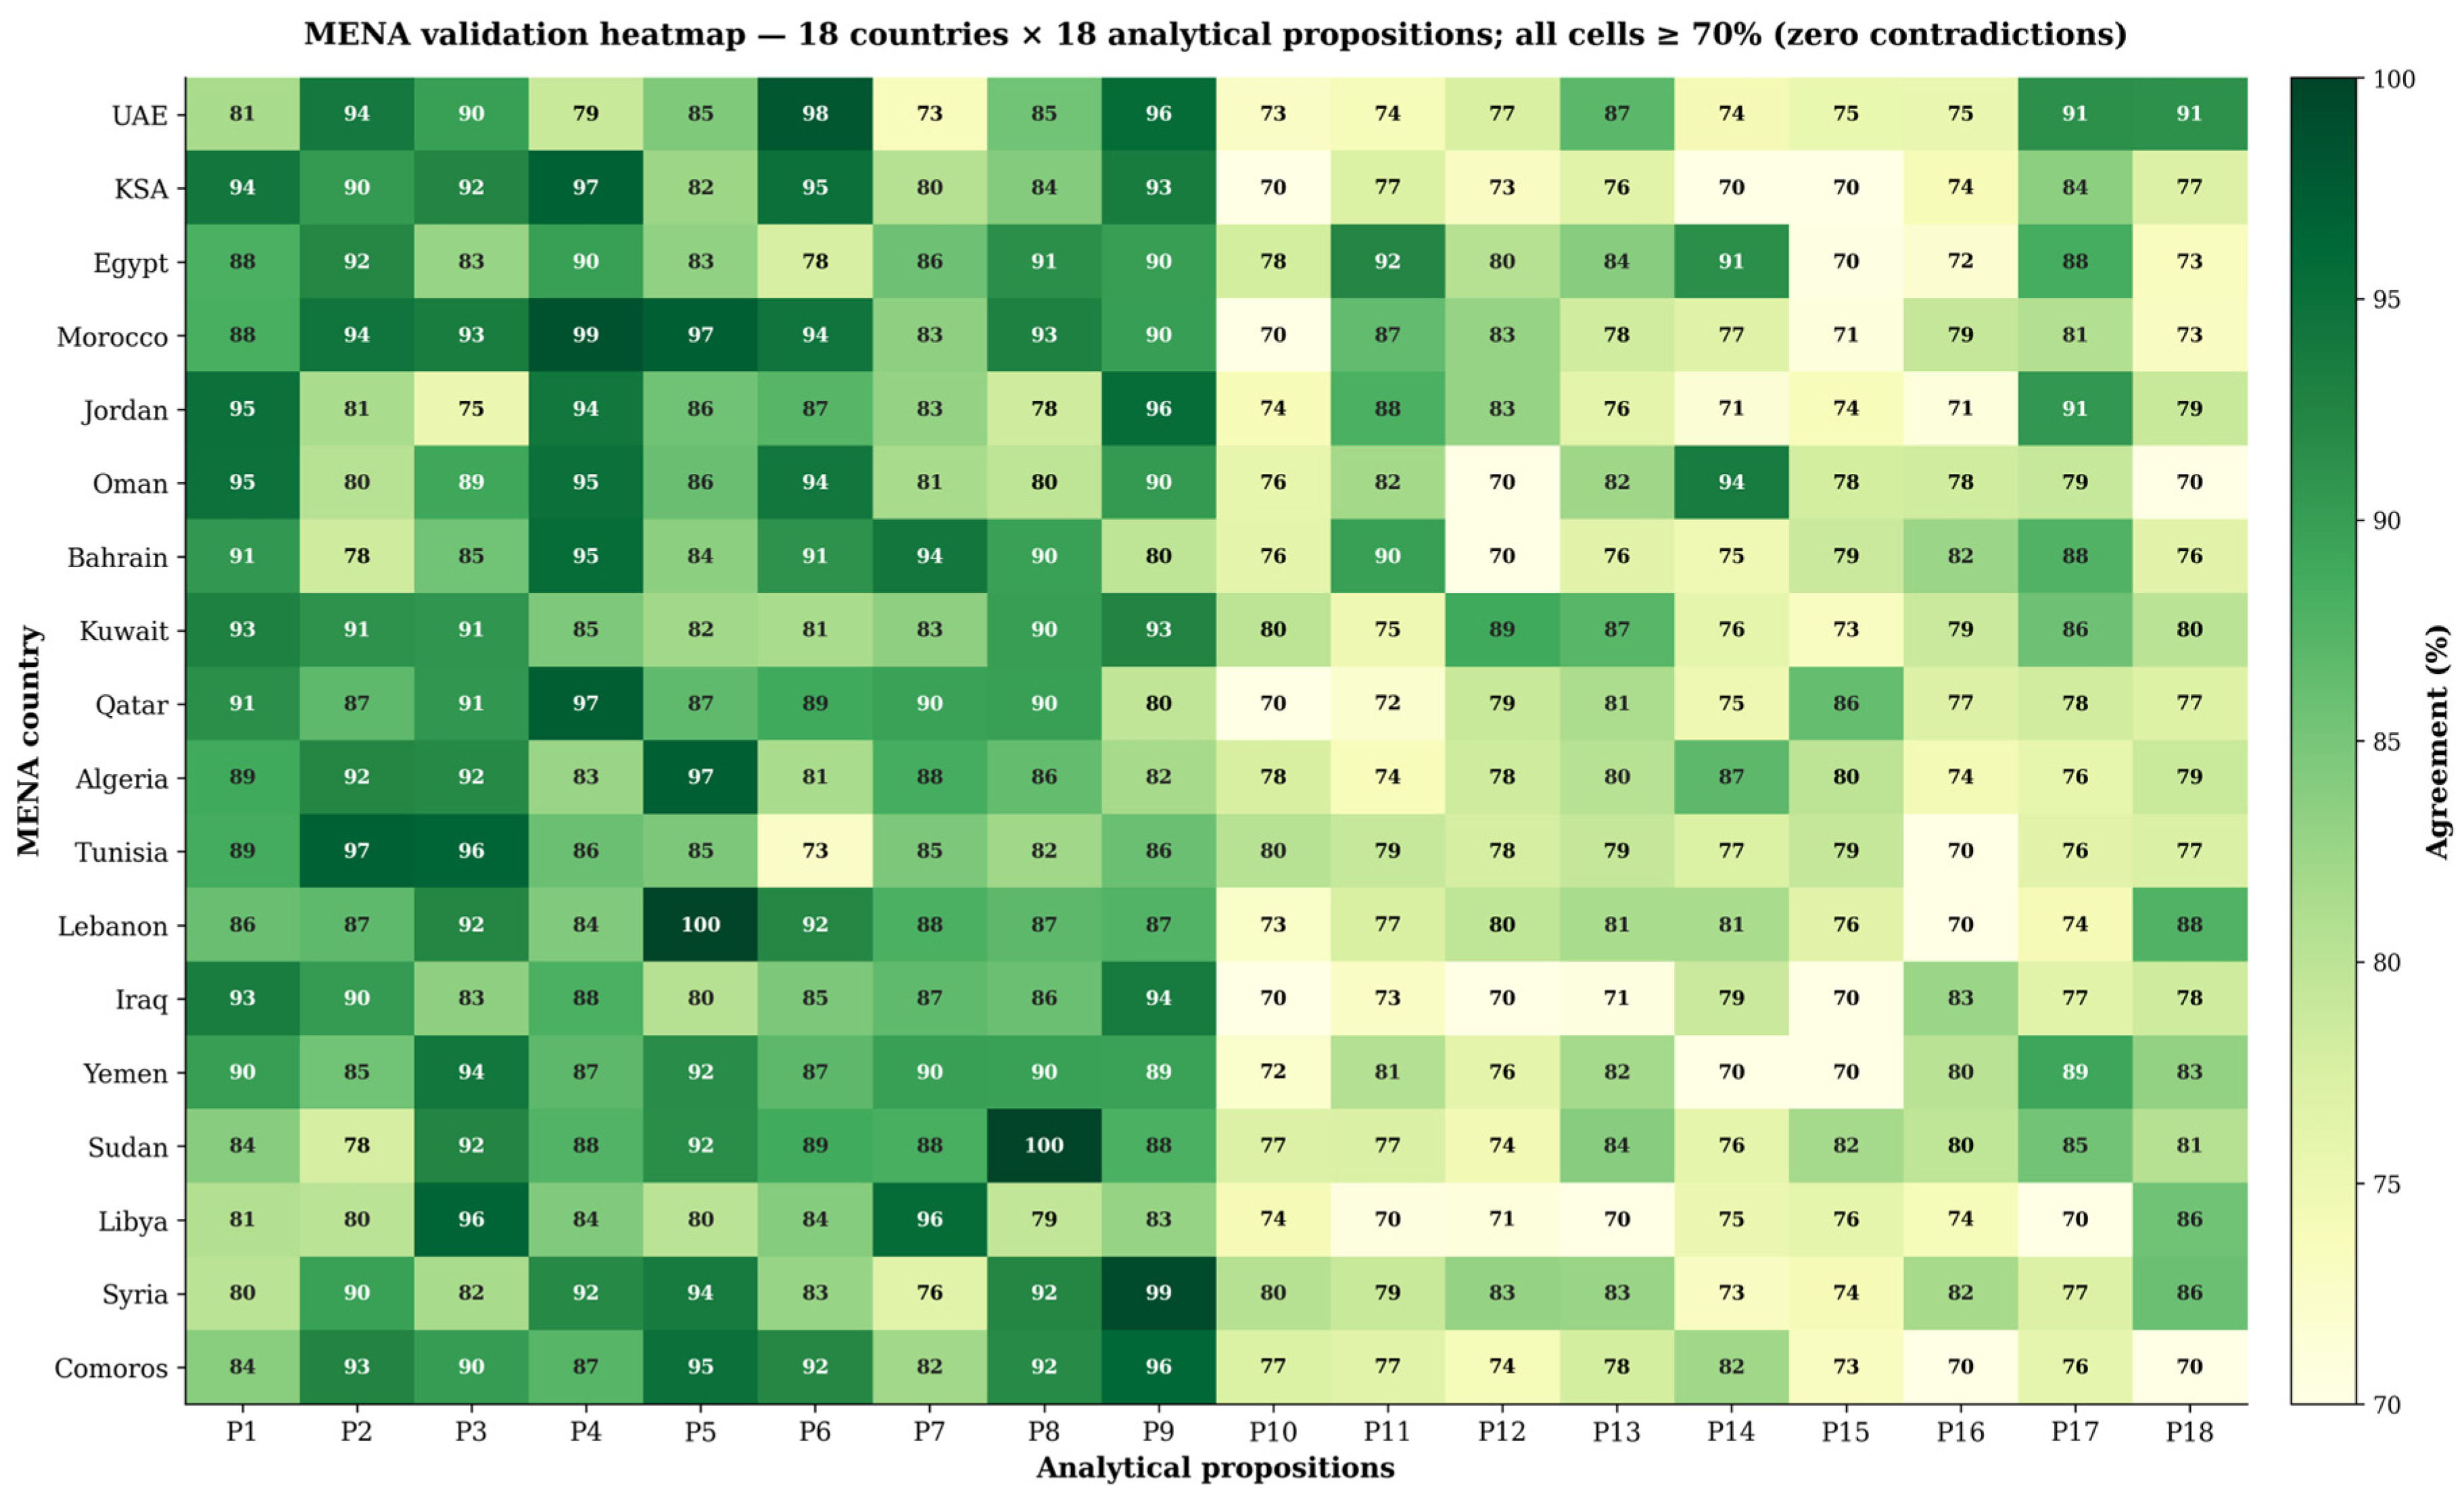
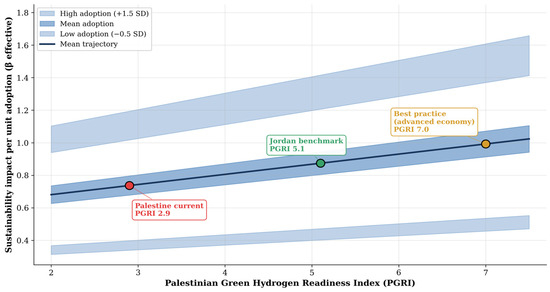
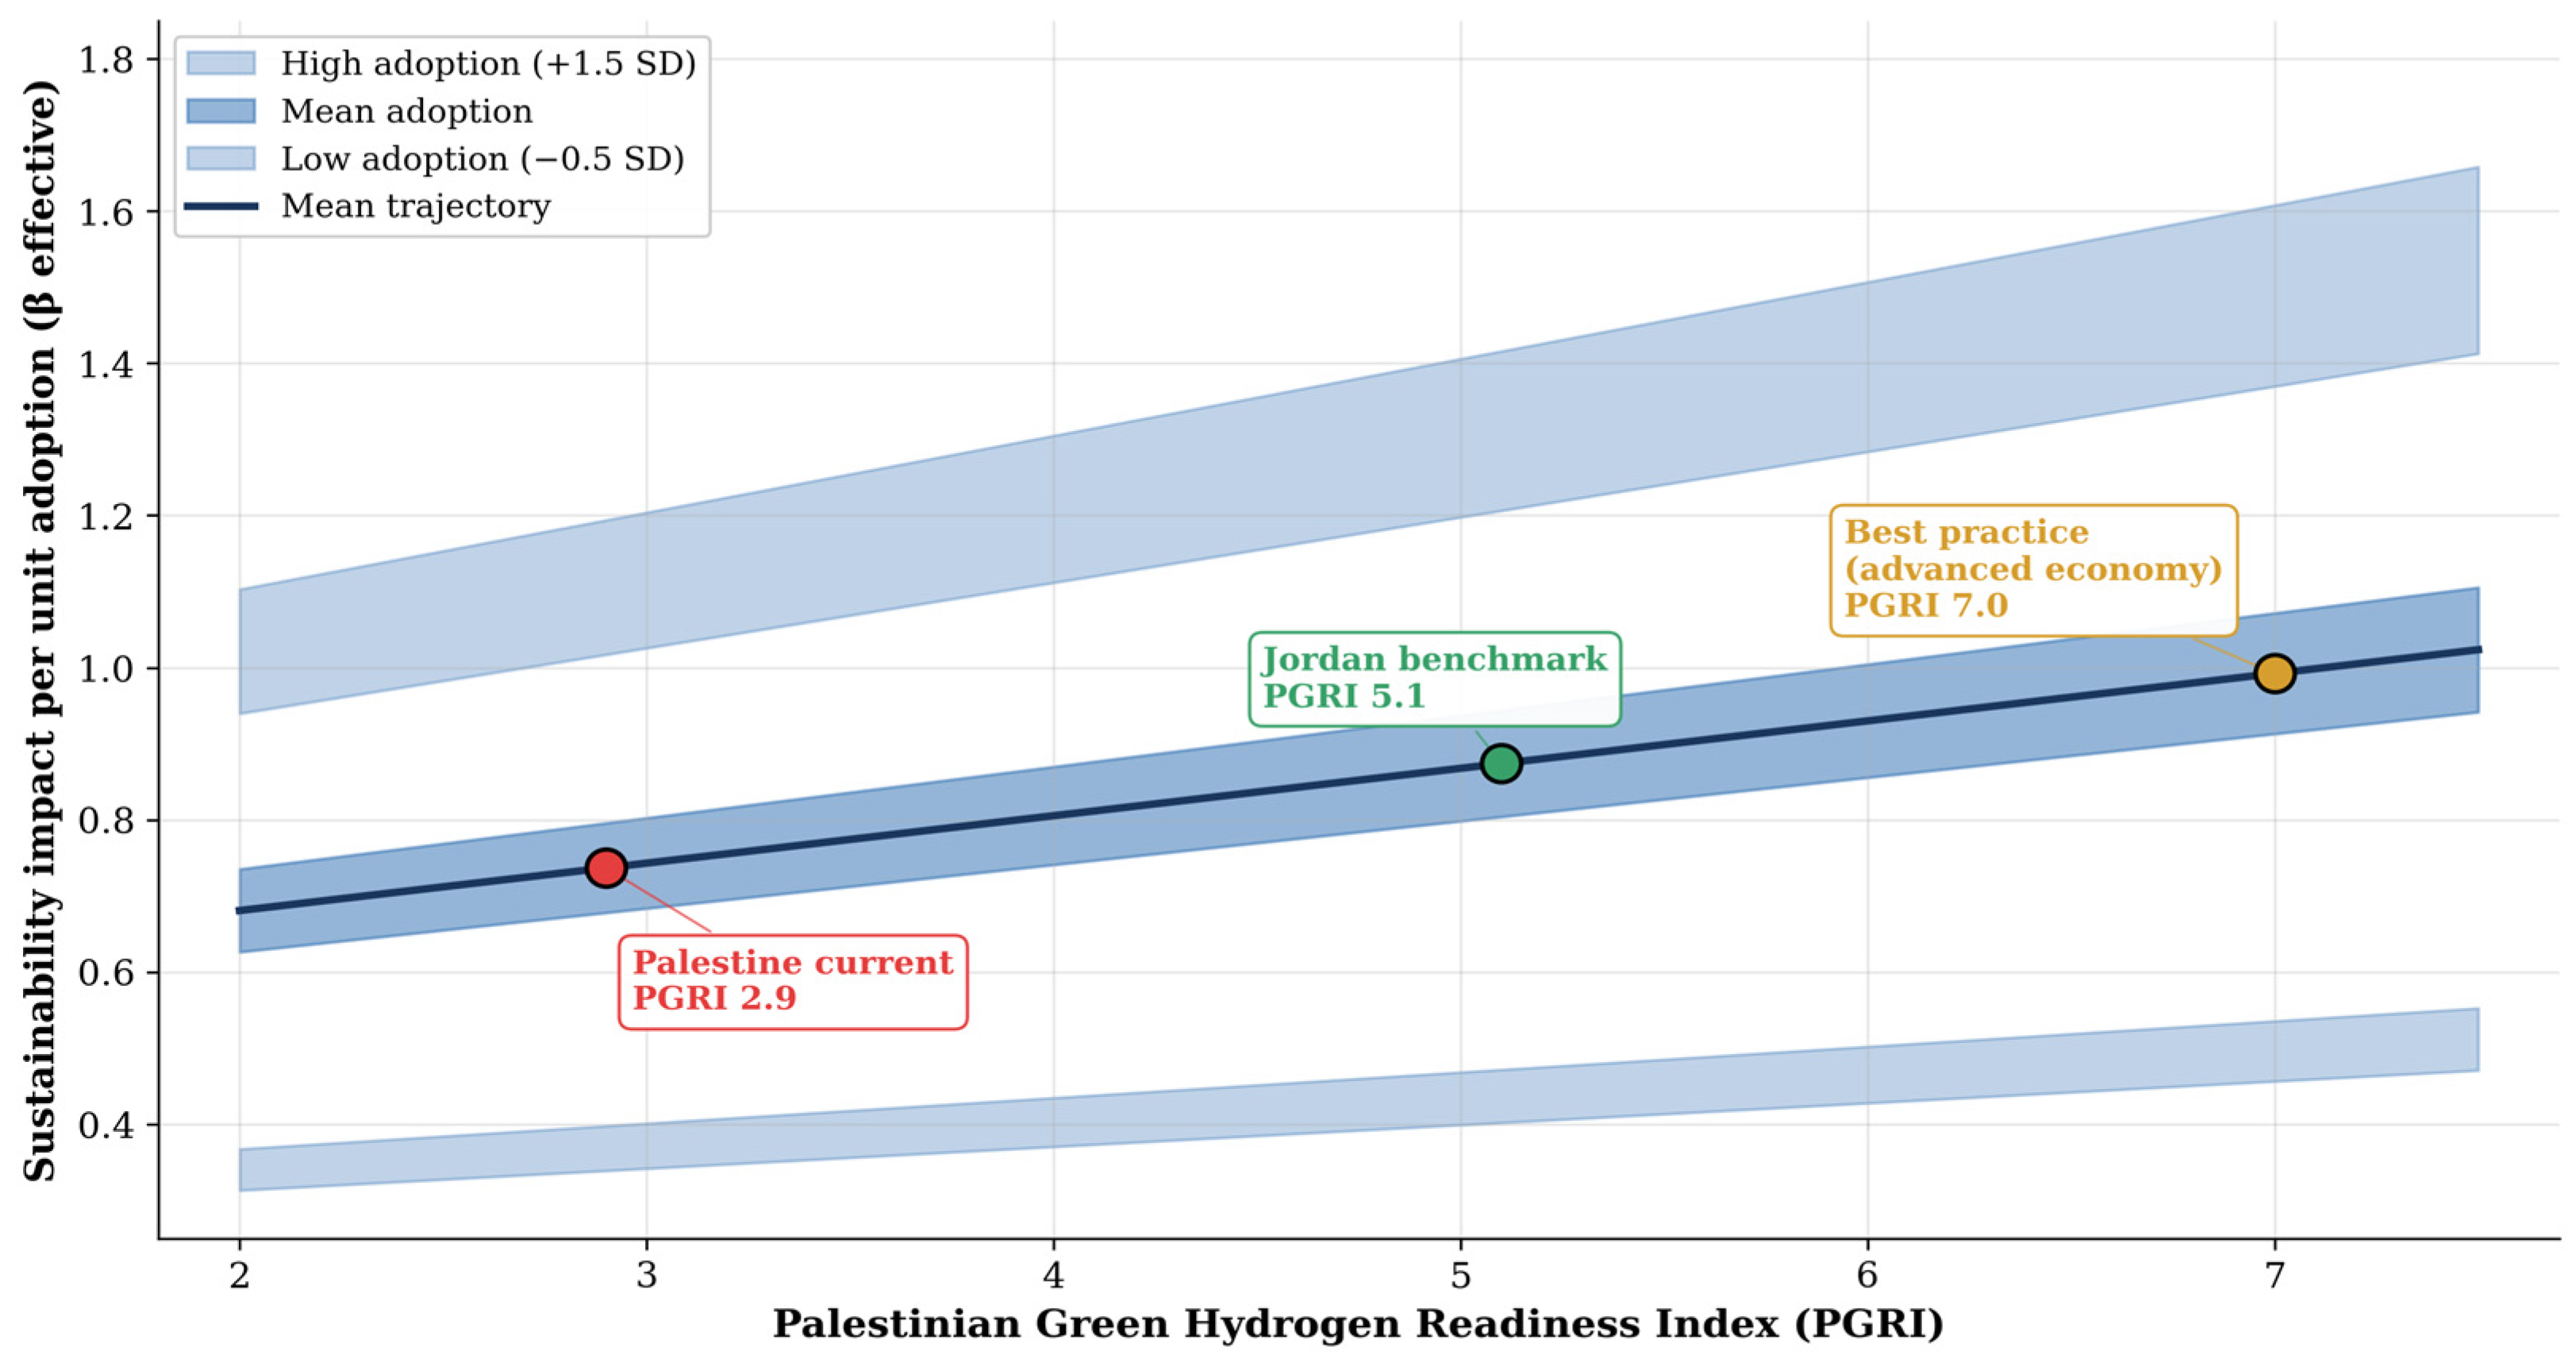
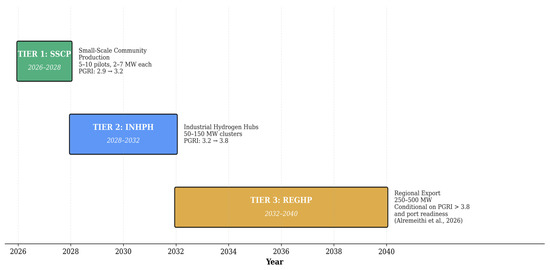
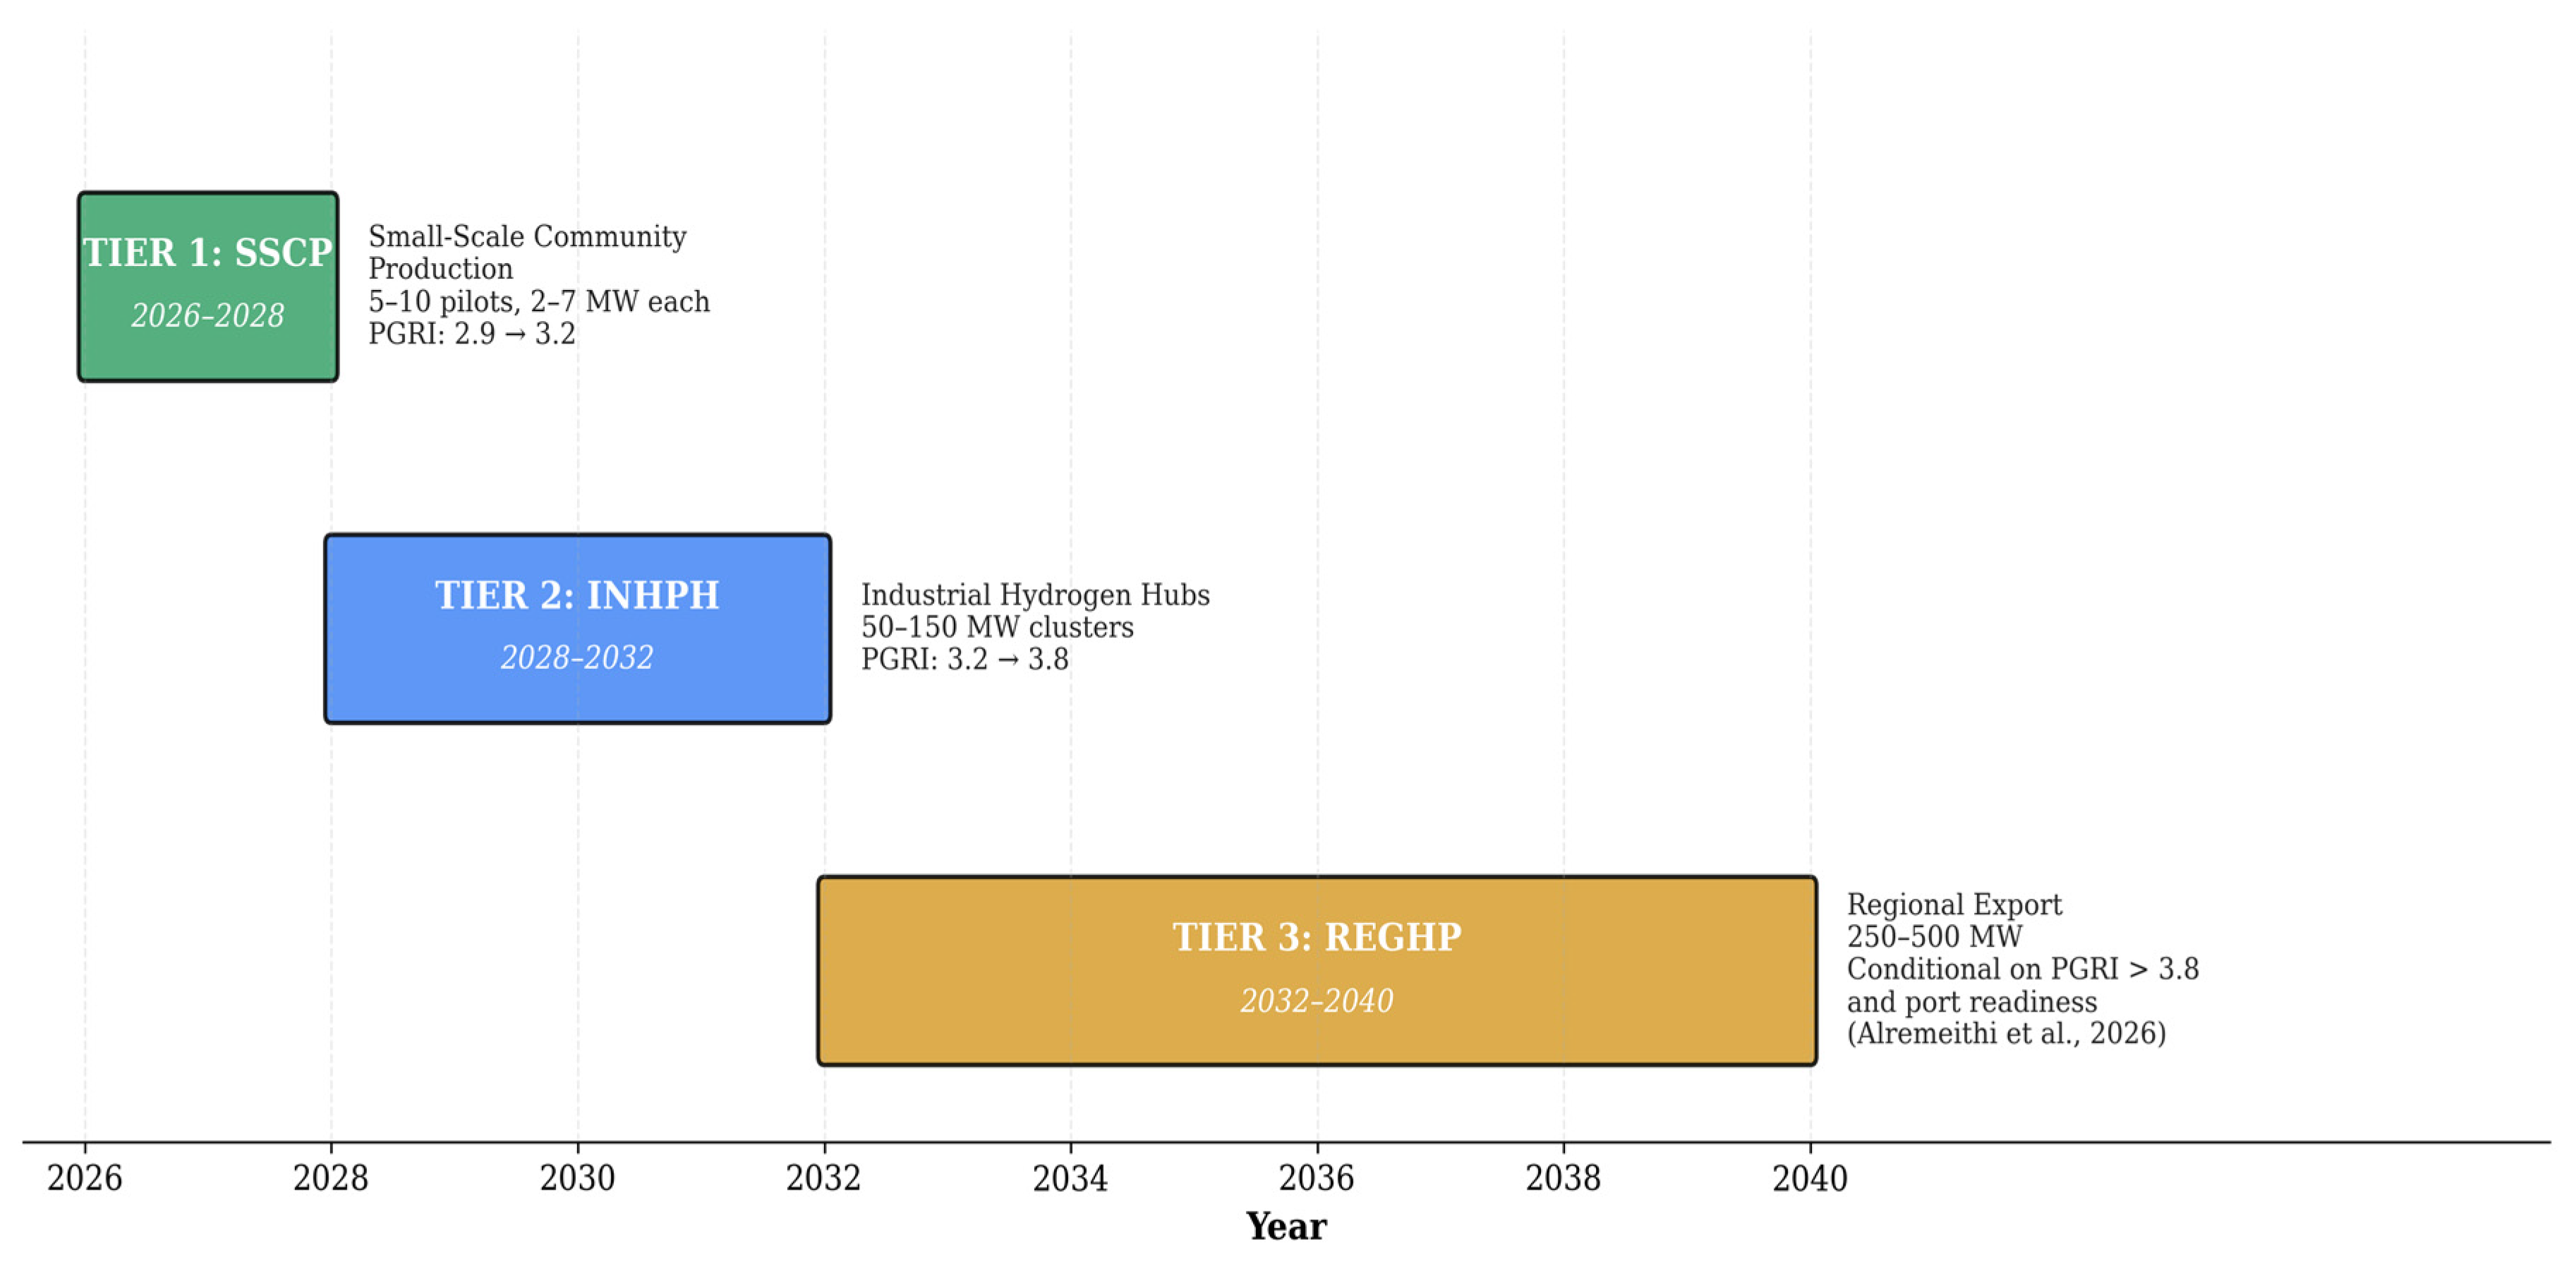

Disclaimer/Publisher’s Note: The statements, opinions and data contained in all publications are solely those of the individual author(s) and contributor(s) and not of MDPI and/or the editor(s). MDPI and/or the editor(s) disclaim responsibility for any injury to people or property resulting from any ideas, methods, instructions or products referred to in the content. |
© 2026 by the authors. Licensee MDPI, Basel, Switzerland. This article is an open access article distributed under the terms and conditions of the Creative Commons Attribution (CC BY) license.