


Abstract
To improve the sluggish low-temperature hydrogen storage kinetics of RE-Mg-based alloys, Bi2O3 is introduced into CeMg11Ni as a functional dopant for microstructural regulation, and CeMg11Ni + x wt.% Bi2O3 (x = 0, 3, 5, 7, 10) composites are fabricated through planetary ball milling. Multiple characterization methods including XRD, SEM and TEM were used to explore the effects of Bi2O3 on the microstructure and hydrogen storage properties. Bi2O3 maintains stable phase during cycling and does not participate in reversible hydrogen storage reactions. It cooperates with in situ formed CeH2 nanocrystals to construct high-density interfacial defects. The 5 wt.% Bi2O3-doped alloy exhibits the optimal balance between exposed catalytic sites and open hydrogen diffusion channels, achieving complete dehydrogenation within 144 s at 633 K, a reduced dehydrogenation activation energy of 63.89 kJ mol−1, and an 84.7% hydrogen absorption ratio within 5 min at 423 K. Bi2O3 has a weak effect on the thermodynamic properties of the alloy, with only a slight enthalpy change of less than 1 kJ/mol within the experimental error range. Bi2O3 enhances hydrogen storage reactions through a synergistic “active sites–diffusion channels” mechanism, in which oxygen vacancies promote H2 dissociation and heterogeneous interfaces facilitate hydrogen diffusion, thereby reducing the reaction energy barrier.
1. Introduction
Driven by the global “carbon neutrality” strategy, environmental and energy security issues caused by fossil energy consumption remain urgent to be solved. As a zero-carbon secondary energy, hydrogen energy has become the core carrier for building a new zero-carbon energy system due to its high energy density, diverse sources and wide application scenarios [1]. Hydrogen storage is a critical limiting stage in the application of hydrogen energy. Solid-state hydrogen storage has higher hydrogen storage density, higher safety and lower cost than high-pressure gaseous and low-temperature liquid hydrogen storage, and it has become an important development path for the future hydrogen energy supply chain [2,3].
Among various solid-state hydrogen storage materials, Mg-based alloys have become the most promising system for industrialization due to their high theoretical hydrogen storage capacity of 7.6 wt.% (far exceeding the U.S. Department of Energy core target of 5.5 wt.% for on-board hydrogen storage [4]), as well as abundant Mg reserves, low cost and environmental friendliness. However, the commercial application of pure Mg and traditional Mg-based hydrogen storage alloys is still restricted by two core bottlenecks. First, the thermodynamic performance is poor. Mg forms strong ionic Mg-H bonds with H, resulting in strong thermal stability. The initial dehydrogenation temperature of pure Mg exceeds 573 K [5], which is much higher than the operating temperature range of on-board hydrogen storage. Second, the kinetic performance is poor. A dense MgO inert passivation layer is easily formed on alloy surface, which significantly increases hydrogen molecule dissociation energy barrier. In addition, the bulk diffusion rate of H atoms at room temperature is slow, making the hydrogen absorption and desorption rates difficult to meet practical applications [6,7]. Catalyst doping can effectively reduce the reaction energy barriers of H2 dissociation and H atom diffusion in Mg-based alloys [8,9]. Zhang et al. [10] demonstrated that Mg70La25Ce5 + 5 wt.% Ti can achieve 90% hydrogenation within 20 min at 523 K and release 3.93 wt.% H2 within 40 min, and its initial dehydrogenation temperature is significantly reduced. Jin et al. [11] introduced a TiH2/ZrCl4 synergistic catalyst into MgH2, achieving approximately 90% dehydrogenation within 10 min at 573 K, with a hydrogen release capacity of 6.2 wt.%. Sun et al. [12] showed that doping a Mg-La-Ce alloy with 5 wt.% Ti particles reduced its initial dehydrogenation temperature from 598 K to 538 K, lowered the activation energy from 156 kJ/mol to 89 kJ/mol, and the alloy also achieved 90% hydrogen absorption within 20 min at 523 K.
Catalyst doping has become a key means to improve the hydrogen storage properties of Mg-based alloys. According to the catalytic mechanism and material types, the current mainstream metal-based catalysts can be mainly divided into three categories: transition metal oxides, transition metal fluorides and rare earth (RE) oxides.
Transition metal oxides such as Nb2O5 [13,14], V2O5 [15,16], TiO2 [17,18] and ZrO2 [19] are the most widely studied oxide catalytic systems at present. Their catalytic mechanisms can be divided into two types. One type is represented by reducible oxides such as Nb2O5 and V2O5, which can be stepwise reduced to low-valent oxides or even nanoscale metallic elements by strongly reducing H2 or MgH2. The in situ formed nanophases have ultra-high specific surface area and abundant surface defects, providing high-density active sites for hydrogen molecule dissociation. They can also construct heterogeneous interfaces with Mg/MgH2 and promote the interfacial diffusion and bulk transport of hydrogen atoms through the hydrogen spillover effect [20,21]. Chen et al. [22] found that compounding Nb2O5 with MgH2 reduced the peak dehydrogenation temperature of MgH2 from 673 K to approximately 523 K, enabling rapid hydrogen absorption at room temperature. The other type is represented by non-reducible oxides such as TiO2 and ZrO2, which are difficult to be reduced during hydrogen absorption and desorption processes and mainly exert catalytic effects through surface-generated oxygen vacancies and low-valent metal ions [23,24]. Ren et al. [25] compounded oxygen vacancy-rich TiO2 two-dimensional nanosheets with MgH2, achieving a dehydrogenation rate of 2.116 wt.%/min for MgH2 that originally did not release hydrogen at 573 K, and the capacity retention rate reached 98.5% after 100 cycles. However, reducible oxides are prone to phase evolution during hydrogen absorption and desorption cycles, leading to insufficient long-term cycling stability; non-reducible oxides have a limited number of intrinsic active sites, and their modification effect on hydrogen storage kinetics still has considerable room for improvement.
Transition metal fluorides such as TiF3 [26], NbF5 [27,28], ZnF2 [29] and ZrF4 [30] are among the most excellent catalytic systems for Mg-based hydrogen storage. Their core modification mechanisms include three aspects. First, the surface etching effect: F− destroys the dense MgO passivation layer on the surface of Mg-based alloys to expose highly active Mg surfaces, significantly reducing the hydrogen molecule dissociation energy barrier. Second, in situ catalytic modification: active catalytic phases and stable MgF2 phases are formed in situ, providing dissociation sites, inhibiting grain agglomeration and weakening Mg-H bonds. Third, construction of heterogeneous interface diffusion channels: the interface formed by MgF2 and Mg/MgH2 can reduce the hydrogen atom diffusion energy barrier and accelerate the hydrogen absorption and desorption reaction rates [31,32]. Yong et al. [33] added TiF3 to Mg85Ni10Y5, shortening the dehydrogenation time of the alloy at 573 K from several hours to 10–20 min, increasing the rate by 5–10 times, and reducing the initial dehydrogenation temperature from 573 K to approximately 453 K. However, fluoride ions cause corrosion to ball milling equipment and testing equipment, which severely restricts their large-scale industrial application.
RE oxides such as CeO2 [34,35] and La2O3 [36] are also typical catalyst types. Their mechanisms for improving the hydrogen storage properties mainly include four parts. First, reduction-induced generation of oxygen vacancies and valence changes, constructing high-activity sites for hydrogen dissociation. Second, interfacial charge transfer weakens Mg–H bonds and optimizes thermodynamic performance. Third, grain boundary dispersion inhibits grain agglomeration and sintering, improving cycle life. Fourth, the construction of multiple heterogeneous interfaces to build high-speed hydrogen diffusion channels and enhance hydrogen absorption and desorption kinetics [37,38]. Yu et al. [39] compounded Ni@CeO2 core–shell catalyst with MgH2, reducing the onset dehydrogenation temperature by 87 K and the dehydrogenation activation energy by 85.1 kJ/mol. However, the raw material cost of RE oxides is relatively high. If they are additionally doped into RE-Mg-based alloys as catalytic modifiers, it will further increase the overall preparation cost of the materials, which is contrary to the core demand of low-cost industrialization of Mg-based hydrogen storage alloys.
Developing new catalytic systems with low-cost, high-activity and high-stability is an important research direction for Mg-based hydrogen storage. Except for Al2O3, there is a lack of systematic research and reports on the catalytic effects of p-block main group metal oxides. Catalyst research to date has largely concentrated on a range of transition metals, such as Ni, Co, Ti, Nb, V, Mo and their compounds [40]. The main mechanism of Al2O3 is physical dispersion and structural support, which can effectively inhibit grain agglomeration and sintering of MgH2 during hydrogen absorption and desorption cycles [41,42]. Leick et al. [43] uniformly coated Al2O3 on the surface of Mg(BH4)2 through atomic layer deposition (ALD), which inhibited the production of by-product B2H6, improved the cycle stability, and reduced the initial dehydrogenation temperature by 125 K. Previously reported oxide catalysts and oxide-supported catalysts for Mg-based hydrogen storage systems have mainly focused on MgH2 matrices or oxide-supported metal nanoparticles, whereas this work introduces Bi2O3 into a rare earth Mg-based CeMg11Ni alloy system. Unlike Al2O3, which mainly acts as a dispersive and structural-stabilizing additive, Bi2O3 possesses abundant intrinsic oxygen vacancies and high oxygen ion mobility, making it a typical oxide with a high defect concentration [44,45,46]. More importantly, Bi2O3 remains stable during hydrogen absorption/desorption cycling and exhibits a synergistic effect with the in situ formed CeH2 nanocrystals in the CeMg11Ni matrix. The oxygen vacancies in Bi2O3 significantly reduce the dehydrogenation activation energy of MgH2 through multiple effects, including activating hydrogen molecules, providing hydrogen diffusion channels, and regulating electron transfer [47,48,49]. Meanwhile, the interfaces among Bi2O3, CeH2, Mg/MgH2, and Mg2Ni/Mg2NiH4 provide fast pathways for hydrogen diffusion and promote interfacial electron transfer, thereby reducing the dehydrogenation activation energy and accelerating the hydrogen storage kinetics. Although Bi2O3 has excellent catalytic modification potential, there is no research report on Bi2O3 doping modification in RE-Mg-based hydrogen storage alloys with both high capacity and excellent intrinsic properties. Its doping amount optimization, phase evolution law, microscopic distribution characteristics, and regulation mechanism on the hydrogen storage thermodynamics and kinetics of the alloy are still unknown.
Based on this, this paper selects Bi2O3 as the catalyst and CeMg11Ni as the matrix to systematically investigate the modification effects of Bi2O3 with different doping amounts (3–10 wt.%) on the microstructure, hydrogen storage thermodynamics and kinetics of the alloy. The catalytic mechanism is revealed by combining multi-scale microscopic characterization and kinetic model fitting. This paper applies the p-block main group metal oxide Bi2O3 to the CeMg11Ni alloy system, providing experimental basis and theoretical support for the development of new catalyst systems for Mg-based hydrogen storage materials.
2. Materials and Methods
2.1. Sample Preparation
Ce, Mg and Ni (purity ≥ 99.5%) were weighed according to the atomic ratio of CeMg11Ni and placed in a vacuum induction melting furnace. To offset the volatilization loss of Ce and Mg during melting, 5% and 8% of the theoretical mass were reserved as margins for batching, respectively, and 0.04 MPa of high-purity helium was charged as a protective gas. After melting, the alloy melt was poured into a water-cooled copper mold to obtain an ingot, which was repeatedly melted 3 times to ensure compositional uniformity. After removing the surface oxide scale of the ingot, it was mechanically crushed in an argon-protected glove box and sieved through a 200-mesh standard sieve to obtain as-cast alloy powders with a particle size of less than 75 μm.
In the glove box, 5 g of as-cast CeMg11Ni alloy powders were weighed, and Bi2O3 powders with a particle size range of 100–500 nm and a purity of ≥99.8% were added according to the ratios of 3, 5, 7, and 10 wt.%, respectively. The mixed powders were milled using a planetary ball mill of QM-3SP2 (Nanjing Nanda Instrument Co., Ltd., Nanjing, China) for 5 h at 350 r/min with a ball-to-powder ratio of 40:1, using a milling vial and milling balls both made of stainless steel. The ball milling jar was sealed and filled with high-purity argon for protection, and it was operated in an intermittent mode of “30 min ball milling + 30 min shutdown” to prevent cold welding of the powders caused by excessive temperature. After ball milling, CeMg11Ni alloy powders with different Bi2O3 doping contents were obtained. For convenience of expression, the alloy powders with Bi2O3 doping contents of 0, 3, 5, 7 and 10 wt.% were labeled as Bi0, Bi3, Bi5, Bi7 and Bi10, respectively. The undoped Bi0 sample was prepared using exactly the same ball milling process as the doped groups to eliminate the influence of the ball milling process itself on the microstructure and hydrogen storage performances of the sample.
2.2. Microstructure and Phase Characterization
Phase composition analysis: A D8 Advance X-ray diffractometer (XRD, Bruker AXS GmbH, Östliche Rheinbrückenstraße 49, Karlsruhe, Germany) was used to test the phase of the powder samples before and after hydrogen absorption and desorption, with Cu target Kα radiation (tube voltage 40 kV, tube current 40 mA, scanning speed 2°/min, step size 0.02°) and scanning range 10–90°. Jade 6 (Materials Data Inc., Livermore, CA, USA) software was used for phase retrieval and analysis of XRD patterns to analyze the phase composition and structural changes in the alloy.
Morphology and element distribution analysis: A Quanta400 scanning electron microscope (SEM, FEI Company, Podnikatelská 6, Brno, Czech Republic) was used to observe the microstructure of the alloy powder before and after activation, and the supporting energy dispersive spectrometer (EDS) was used for surface scanning analysis to characterize the distribution state of each element in the alloy.
Microstructure analysis: A Tecnai G2 F30 transmission electron microscope (TEM, FEI Company, Podnikatelská 6, Brno, Czech Republic) was used to characterize the microstructure of the alloy before and after hydrogenation and dehydrogenation. High-resolution transmission electron microscopy (HRTEM) images and selected area electron diffraction (SAED) patterns were obtained to analyze the crystallite size, interplanar spacing and amorphization degree of the alloy. The supporting EDS was used to analyze the element distribution at the microscale.
2.3. Hydrogen Storage Performance Test
An MH-PCT hydrogen storage performance tester (China GRINM Group Corporation Limited, No. 2, Xinjiekouwai Street, Xicheng District, Beijing, China) was used to systematically test the activation performance, hydrogen storage kinetics and thermodynamics of the samples under 99.999% high-purity hydrogen atmosphere. Strict air tightness testing of the equipment pipelines was carried out before the test.
About 0.5 g alloy powders were weighed for the test, and were heated to 633 K under vacuum for activation treatment: the initial hydrogen pressure for activation hydrogenation was 3.5 MPa, and the activation hydrogenation curve was recorded. After the sample was saturated with hydrogen, it was evacuated to 1 × 10⁻⁴ MPa for activation dehydrogenation test, and the activation dehydrogenation curve was recorded. The hydrogen absorption and desorption cycles were repeated until the hydrogenation and dehydrogenation rates of two adjacent cycles were the same, which was judged that as the sample being completely activated.
After full activation, isothermal hydrogen storage kinetic curves were measured at different temperatures: initial hydrogen pressure for absorption was 3.5 MPa, test temperatures were 323, 373, 423, 473, 523, 553, 573, 593, 613 and 633 K, initial hydrogen pressure for desorption was 1 × 10⁻⁴ MPa, and test temperatures were 523, 553, 573, 593, 613 and 633 K. The hydrogenation and dehydrogenation fractions were analyzed, and the dehydrogenation activation energy was calculated using the Johnson–Mehl–Avrami–Kolmogorov (JMAK) model and the Arrhenius equation. PCT curves were measured at 593, 613 and 633 K using the stepwise isochoric method. Hydrogen was charged stepwise until 3.5 MPa for absorption PCT curves and was released stepwise until 0.003 MPa for desorption PCT curves. According to the equilibrium hydrogen pressure, the enthalpy change (ΔH) and entropy change (ΔS) of hydrogen storage reactions were calculated by fitting the Van’t Hoff equation.
All experimental data are presented with error bars to show experimental uncertainty. The original instrumental error is 2%. Through error propagation calculation, the relative errors of hydrogen absorption/desorption fraction, JMAK data and dehydrogenation activation energy are determined as 4%, and the relative error of hydrogen absorption/desorption enthalpy is 3%.
3. Results and Discussion
3.1. Phase Composition and Microstructure
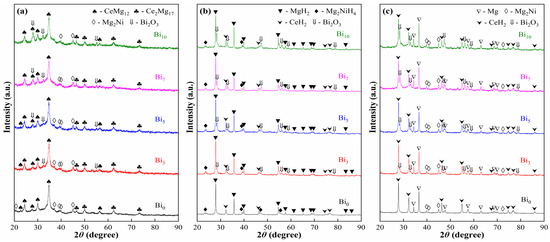
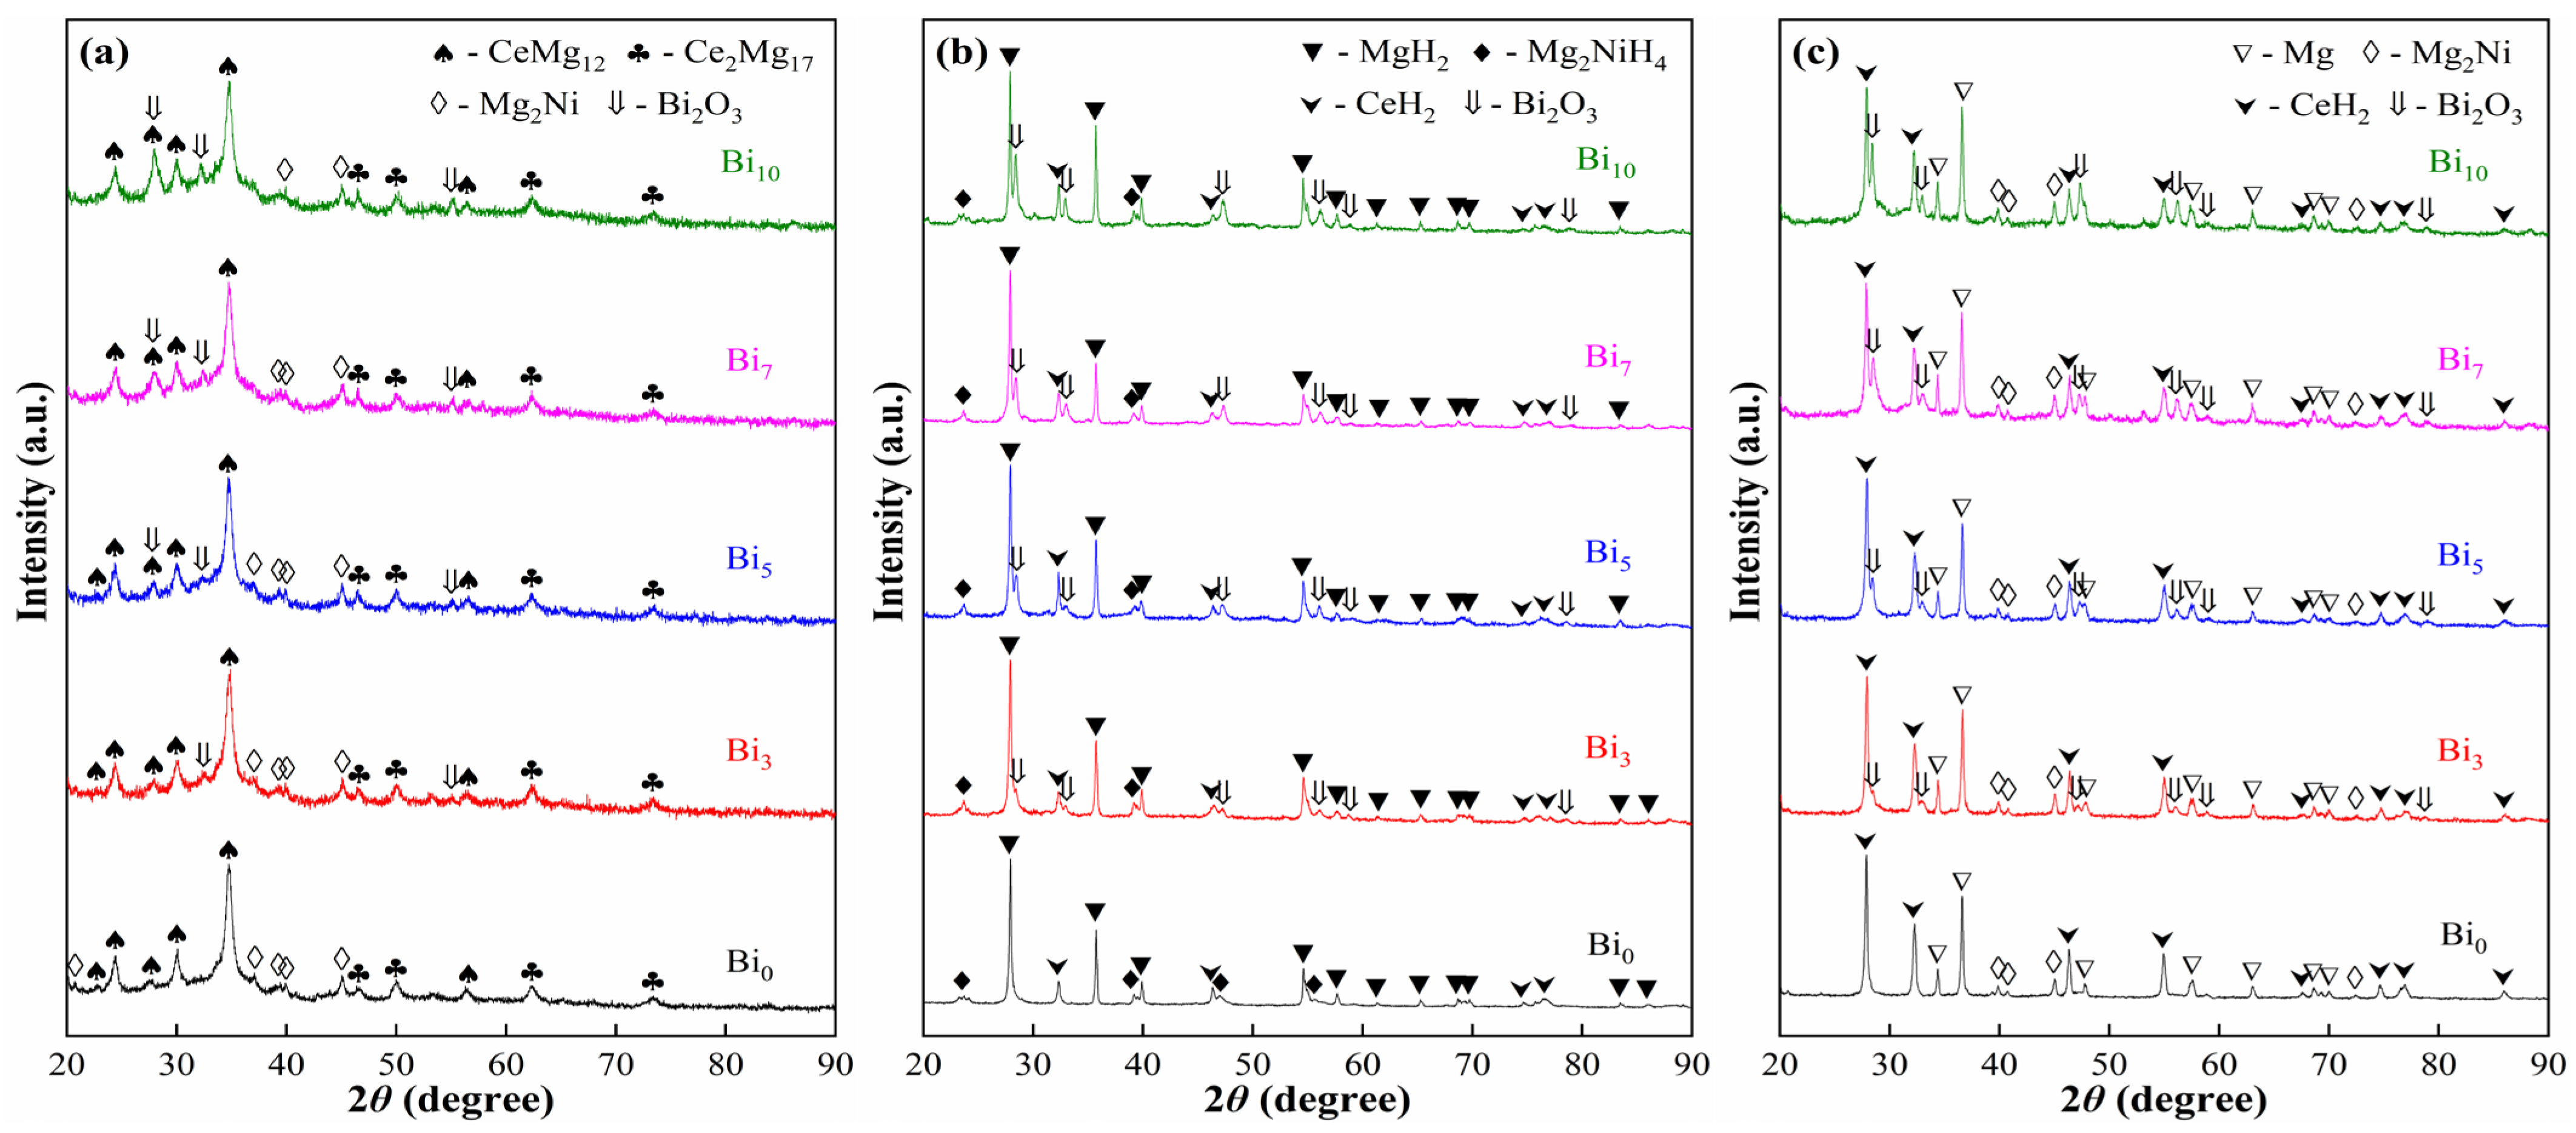
Figure 1 shows the XRD patterns of CeMg11Ni + x wt.% Bi2O3 (x = 0, 3, 5, 7, 10) alloys before and after hydrogenation and dehydrogenation. The XRD patterns in Figure 1b,c were recorded after saturated hydrogen absorption and complete hydrogen desorption at 633 K, followed by cooling to room temperature. It reveals that the diffraction peaks of the as-milled alloys are obviously broadened, indicating that the alloys have formed an amorphous–nanocrystalline structure during the milling process. There is no significant change in the diffraction peaks after Bi2O3 addition, indicating that the doping amount of Bi2O3 has no obvious effect on the amorphization degree of the alloys. After hydrogenation and dehydrogenation, the diffraction peaks of the XRD patterns are obviously narrowed, indicating that the hydrogen absorption and desorption reactions are conducive to the recrystallization of the amorphous phase in the alloys. With the increase in Bi2O3 doping content, the intensity of its corresponding diffraction peaks gradually increases.
Figure 1.
XRD patterns of CeMg11Ni + x wt.% Bi2O3 (x = 0, 3, 5, 7, 10) alloys before and after hydrogenation and dehydrogenation: (a) before hydrogenation, (b) after hydrogenation, (c) after dehydrogenation.
The main phase of the as-milled alloy (before hydrogenation) is CeMg12, and the secondary phases are Ce2Mg17, Mg2Ni and Bi2O3. After hydrogen absorption, the main phase of the alloy is MgH2, and the secondary phases are Mg2NiH4, CeH2 and Bi2O3, indicating that the reaction occurred during the first hydrogen absorption process was CeMg12 + Ce2Mg17 + Mg2Ni + 34H2 = 29MgH2 + Mg2NiH4 + 3CeH2, and Bi2O3, as a catalyst, does not directly participate in the reaction. After hydrogen desorption, the main phase of the alloy is Mg, and the secondary phases are Mg2Ni, CeH2 and Bi2O3, indicating that during the dehydrogenation process, CeH2 and Bi2O3, as catalysts, do not directly participate in the reaction, and the hydrogen desorption reaction was 2MgH2 + Mg2NiH4 = 2Mg + Mg2Ni + 4H2. The decomposition temperature of CeH2 is above 1100 K, which is much higher than the highest test temperature of 633 K in this experiment, so it does not decompose during dehydrogenation. From the above reactions, it can be judged that the direct reversible reactions of the alloy during the hydrogen absorption and desorption process are the same as those without Bi2O3, namely Mg + H2 = MgH2 and Mg2Ni + 2H2 = Mg2NiH4. During the reaction, CeH2 and Bi2O3 do not directly participate in the reaction but exist stably in the form of catalysts. The intrinsic oxygen vacancies of Bi2O3 provide high-activity sites for H2 dissociation, and CeH2 forms multiple heterogeneous interfaces with Bi2O3. The two realize catalysis through the synergistic effect of “active sites–diffusion channels” rather than directly participating in the hydrogen storage reaction. The superior performance of metal oxides in Mg-based hydrogen storage catalysis largely stems from the prevalence of oxygen vacancies which alter the coordination and electronic structure of surface metal ions, thus significantly influencing catalytic activity [50].
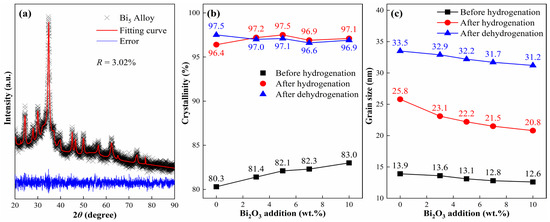
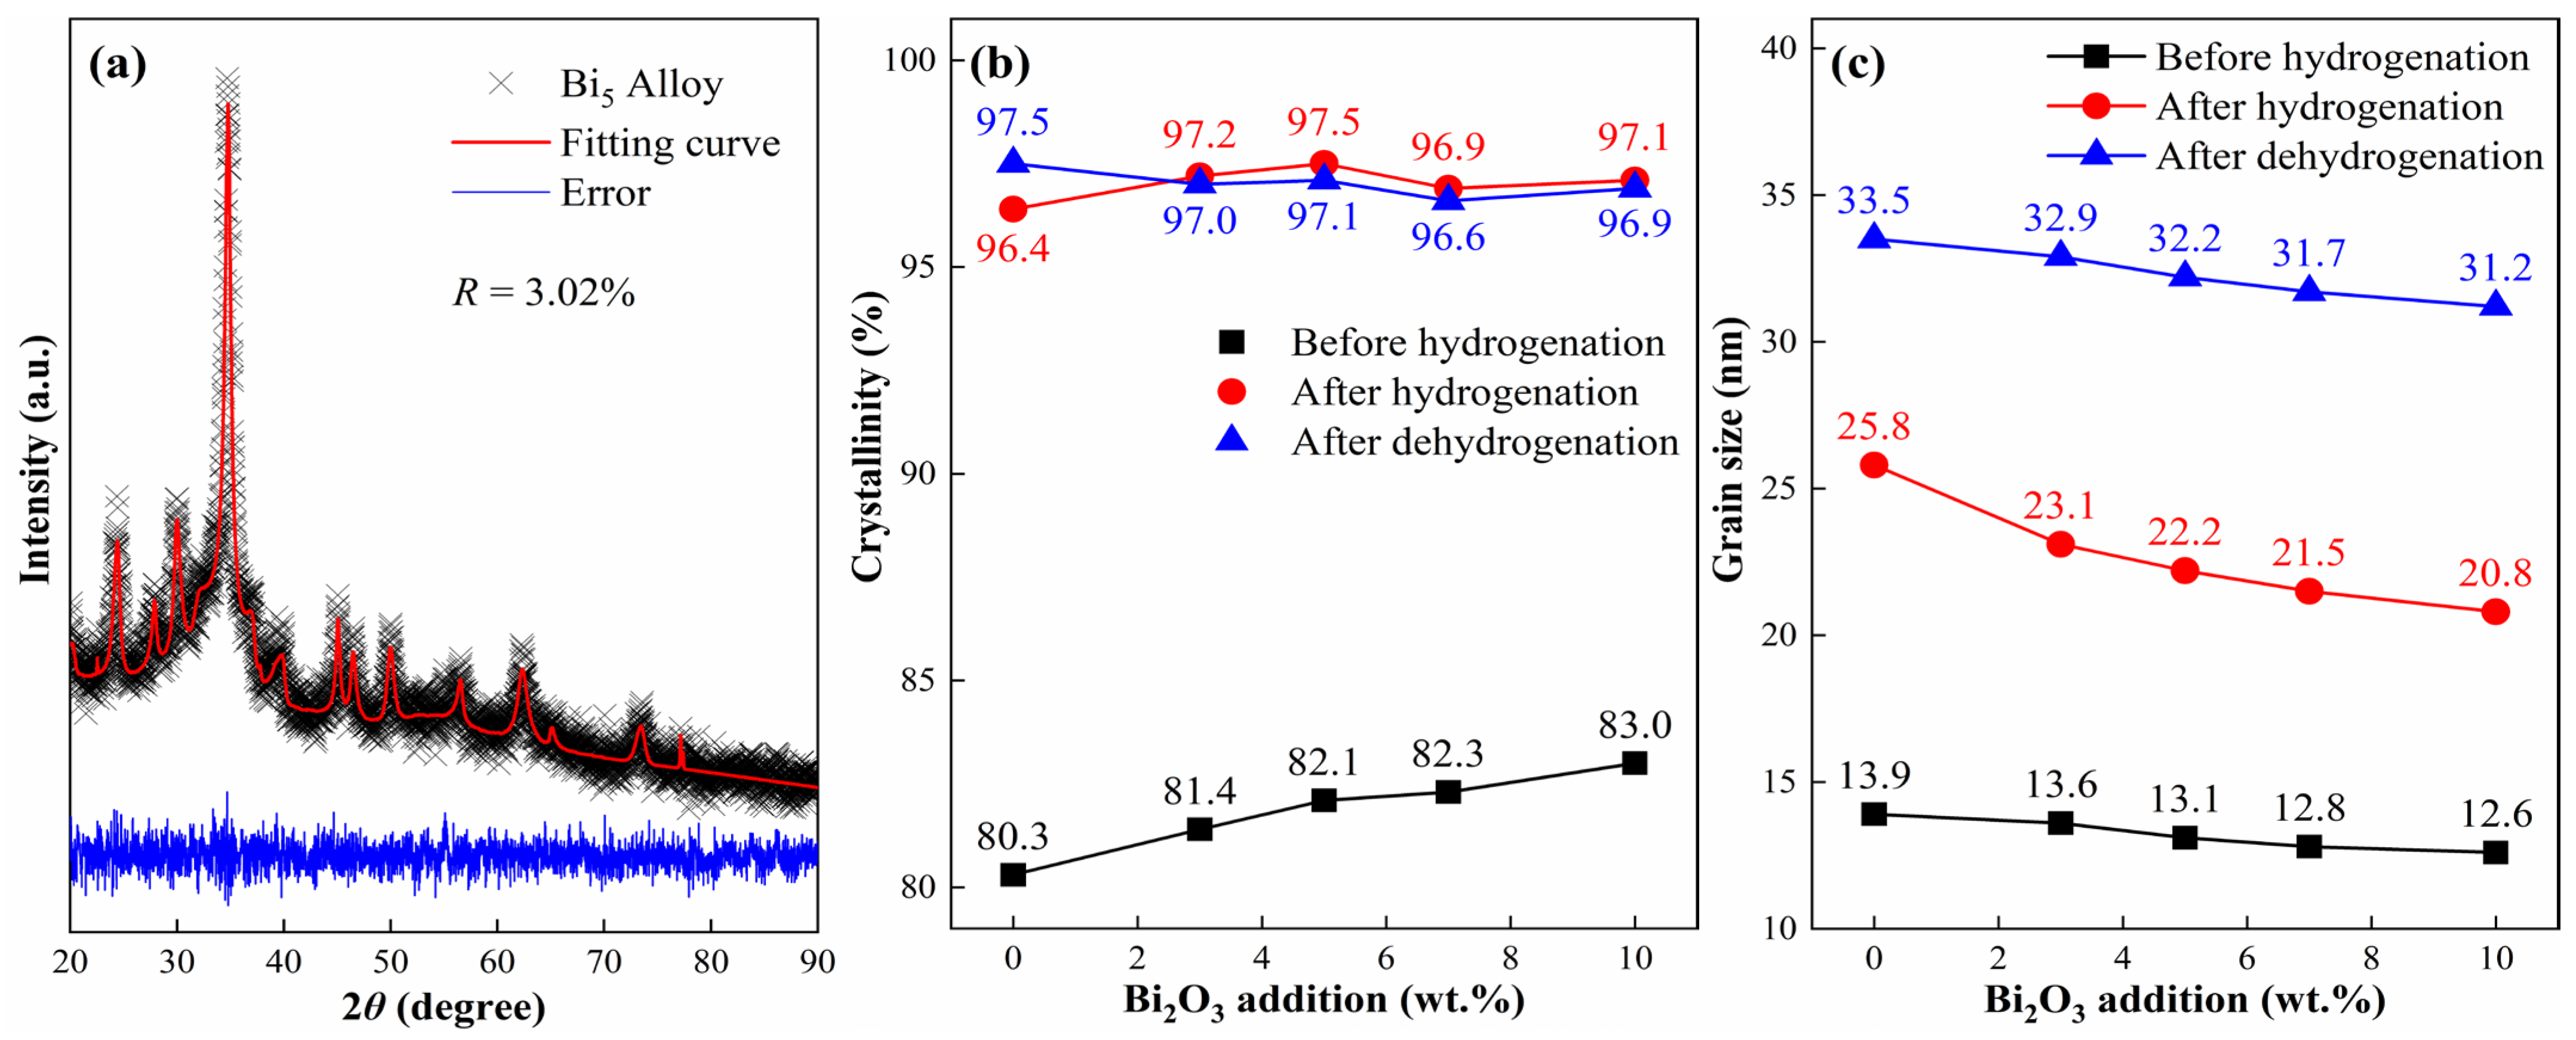
Figure 2 displays the crystallinity and average grain size of CeMg11Ni alloys with different Bi2O3 contents, derived from XRD pattern fitting. Before hydrogenation, the alloy exhibits a mixed amorphous–nanocrystalline state, with relatively low crystallinity. The addition of Bi2O3 slightly increases the crystallinity of the as-milled alloy, which is attributed to the introduction of stable Bi2O3 nanocrystals during ball milling. After activation, the crystallinity of all alloys rises significantly, exceeding 96%, which confirms that hydrogen absorption and desorption cycling effectively promotes recrystallization of the amorphous phase, although a small amount of amorphous phase still remains. Regarding grain size, the as-milled alloy has an average grain size of 13.9 nm, and Bi2O3 doping leads to a slight refinement of the grains. Upon activation, the average grain size increases notably due to recrystallization during activation progress. For both hydrogenated and dehydrogenated states, the grain size gradually decreases with increasing Bi2O3 content, demonstrating that Bi2O3 can suppress grain growth during hydrogenation and dehydrogenation cycling. The refined grains generate abundant crystalline phases and grain boundaries, which act as favorable diffusion pathways for hydrogen atoms inside alloy particles. In addition, the grain size of hydrogenated alloys is slightly larger than that of dehydrogenated ones, which is closely related to the volume expansion accompanying hydride formation [51].
Figure 2.
Fitting result of the XRD curves of alloys: (a) fitting result of the XRD curves of Bi5 alloy, (b) crystallinity of alloys, (c) average grain size of alloys.
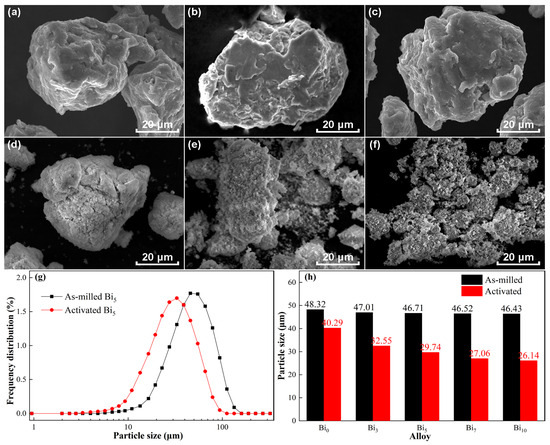
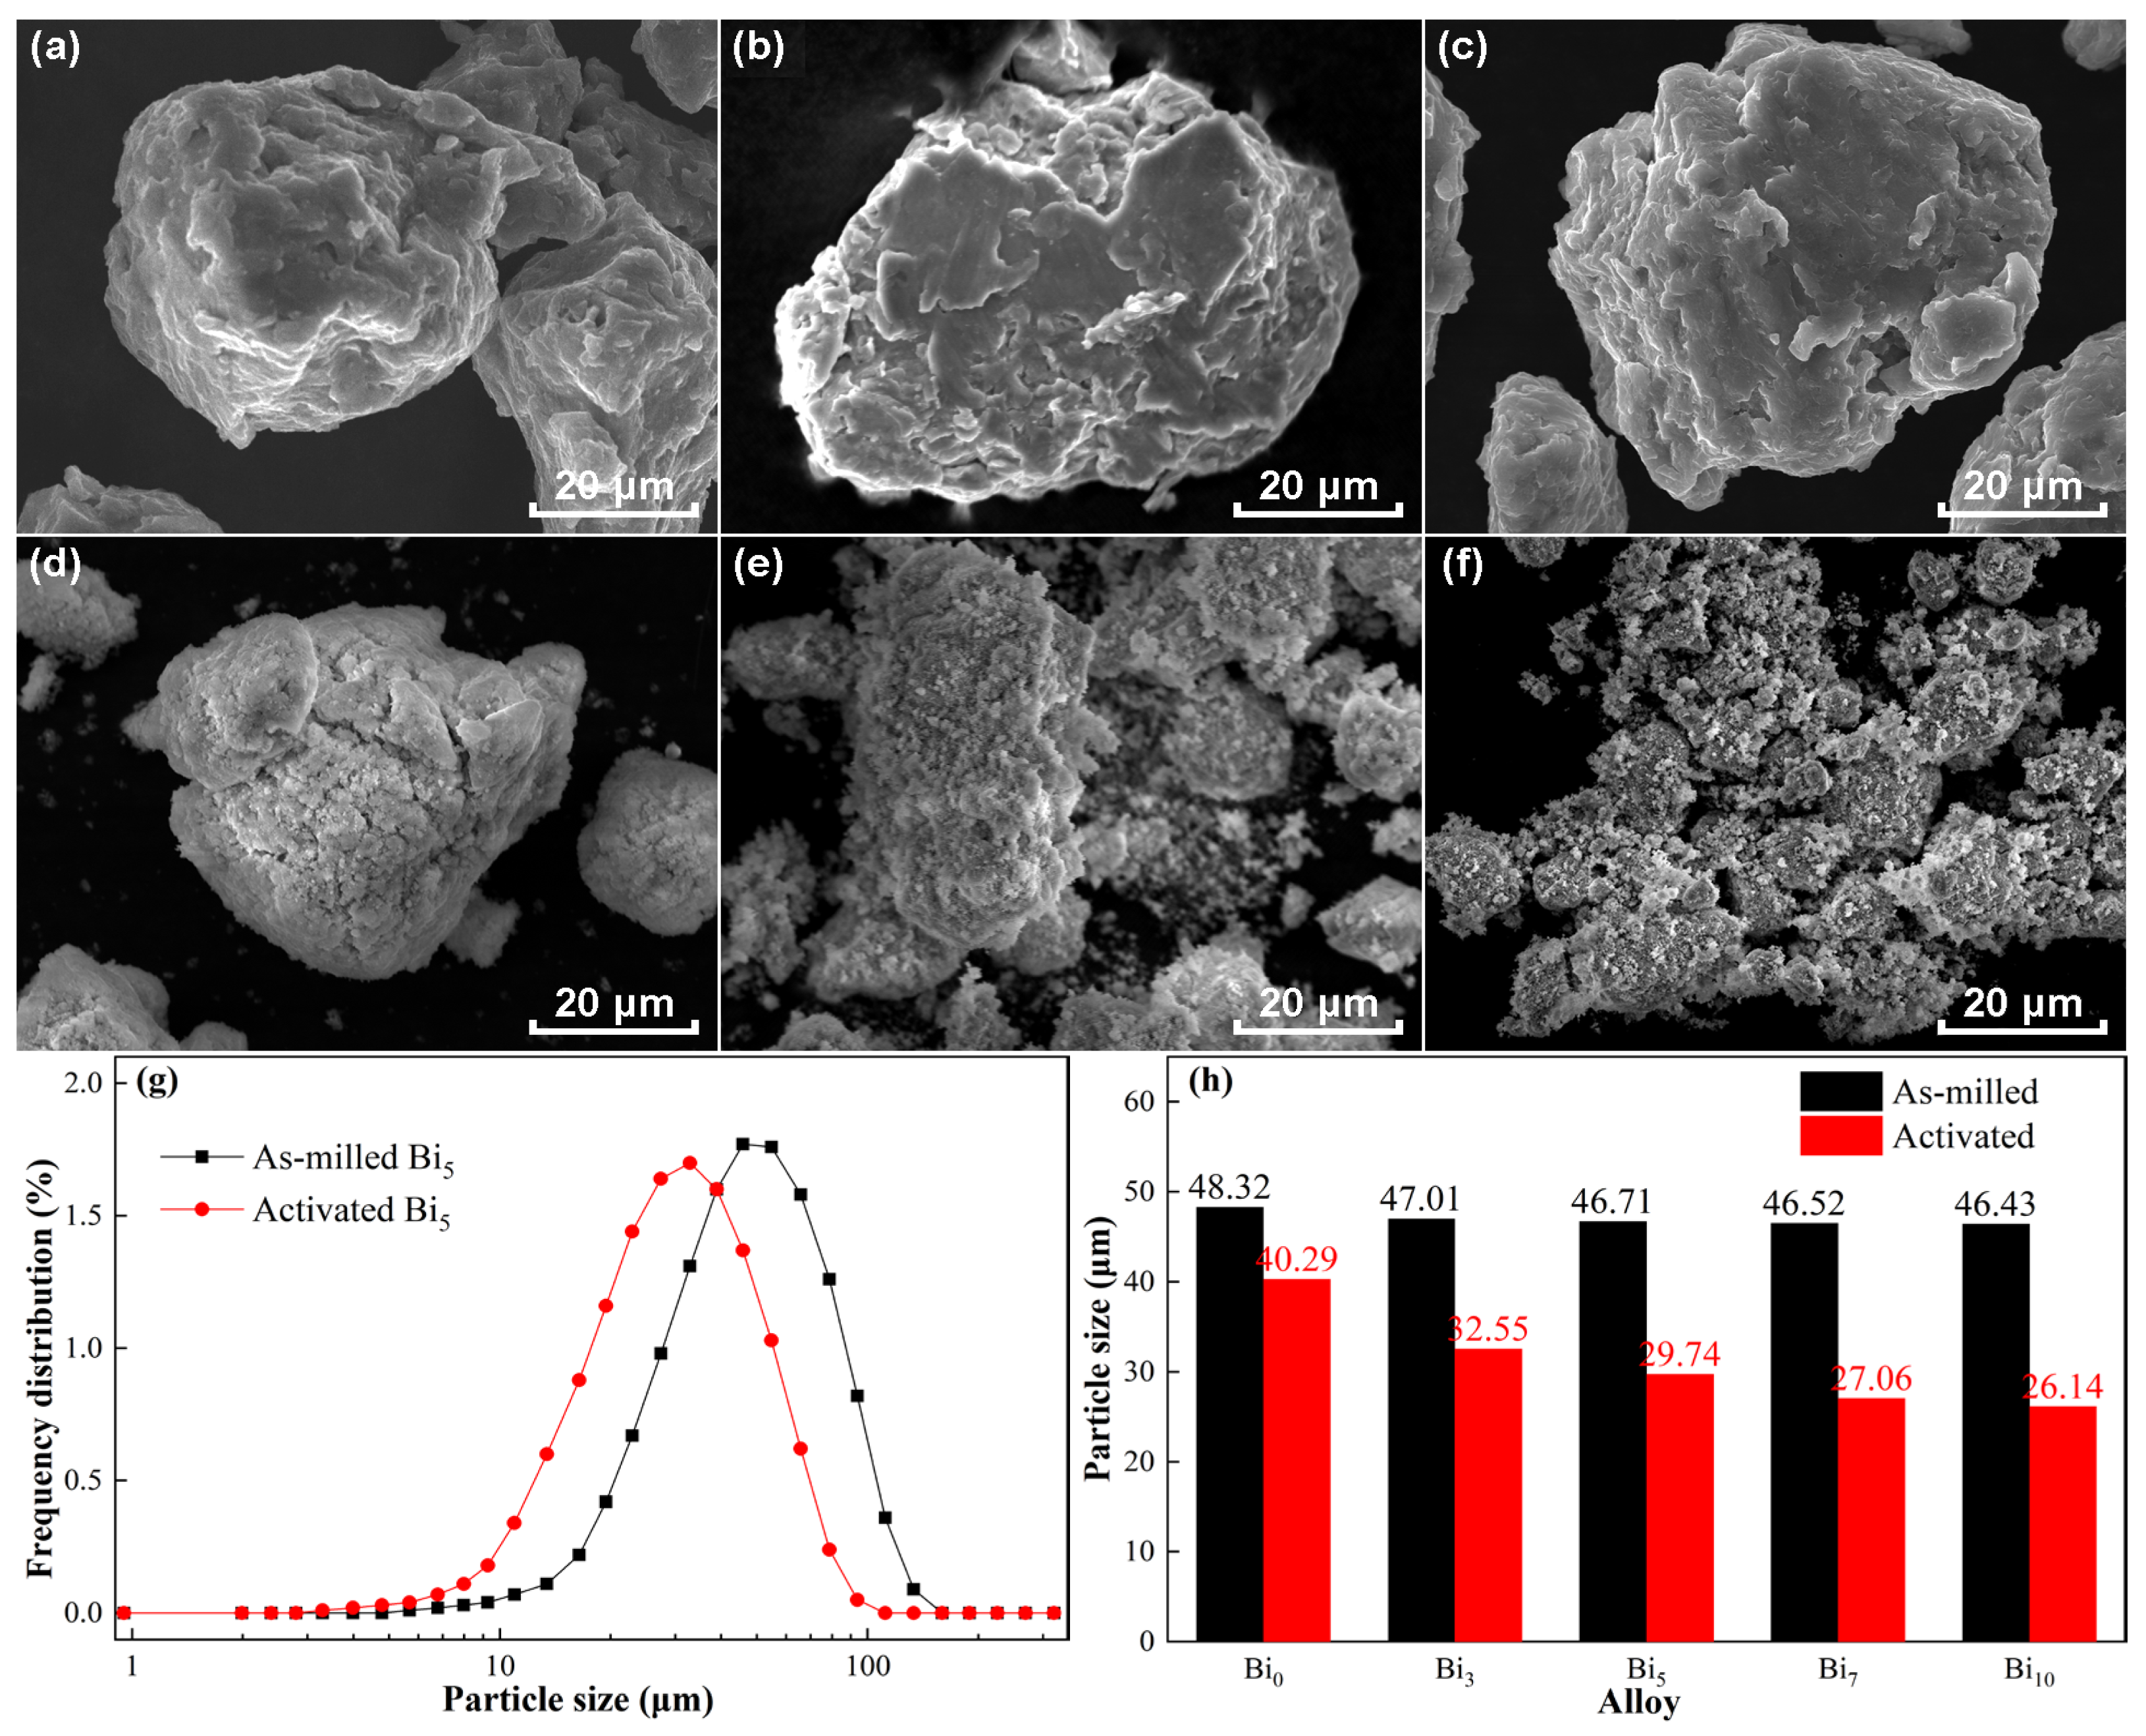
Figure 3 shows the SEM images and particle size distribution of experimental alloys before and after activation. After ball milling, the surfaces of all alloy particles are relatively round, without obvious edges and corners or cracks, as shown in Figure 3a–c. The alloy powder can be activated after multiple hydrogenation and dehydrogenation cycles. It can be seen that a large number of cracks and even pulverization appear on the surface of activated alloys, especially after Bi2O3 addition, the pulverization phenomenon of the alloy is more obvious. The cracking and pulverization of the alloy are mainly caused by the stress accumulation during activation: H atoms enter the lattice when absorbing hydrogen, which leads to volume expansion, and H atoms desorb during dehydrogenation leading to lattice contraction. Repeated lattice expansion and contraction lead to continuous accumulation of internal stress. When the accumulation reaches a certain level, it causes lattice fracture, and a large number of lattice fractures form cracks or even pulverization on the macroscopic scale.
Figure 3.
SEM images and particle size distribution of experimental alloys before and after activation: (a) Bi0, (b) Bi5, (c) Bi10 before activation; (d) Bi0, (e) Bi5, (f) Bi10 after activation; (g) particle size distribution curves of Bi5 alloy; (h) median particle size of alloys.
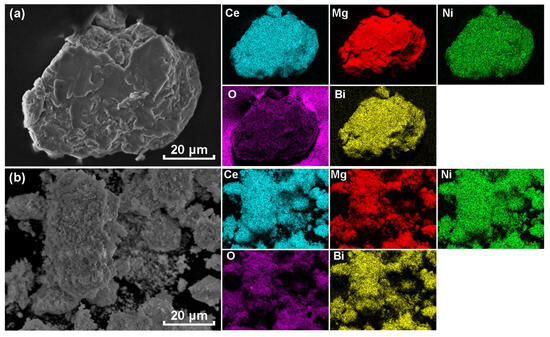
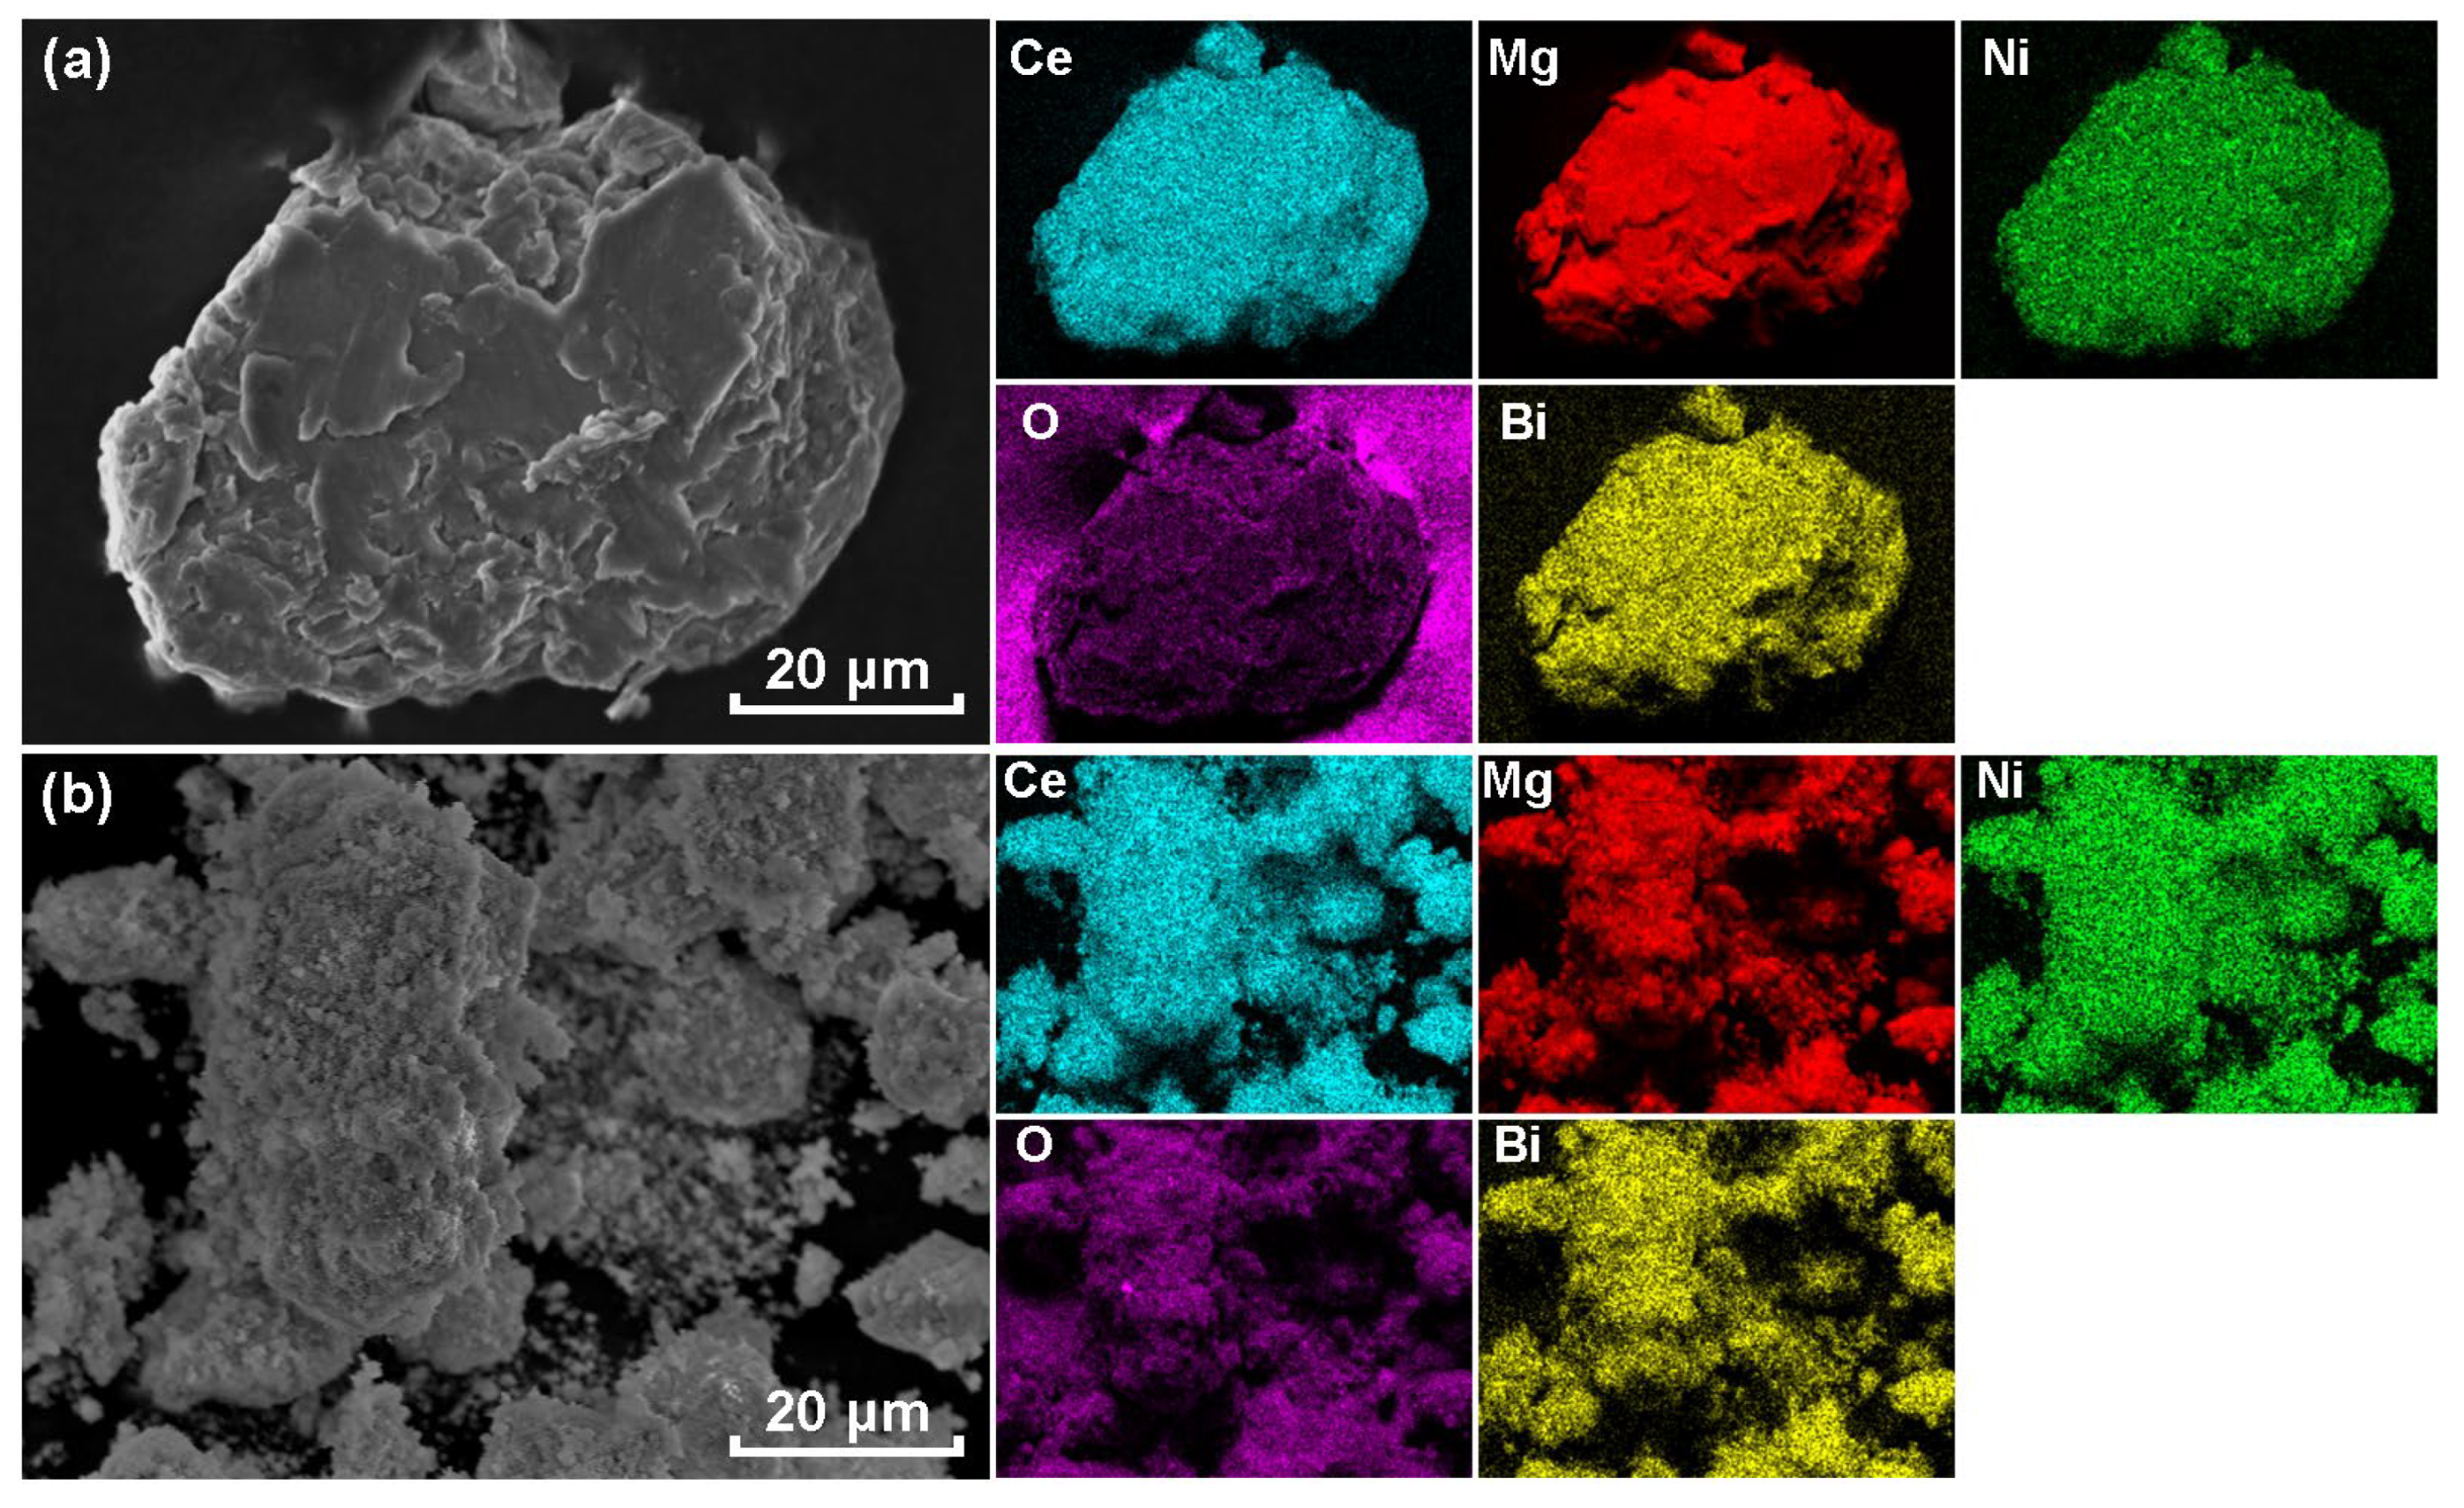
The addition of Bi2O3 slightly reduces the average particle size of the alloy after ball milling. After activation, the alloys doped with Bi2O3 exhibit markedly aggravated cracking and pulverization, accompanied by a significant decrease in average particle size. This phenomenon is attributed to the surface modification of CeMg11Ni alloy by Bi2O3. During the ball milling process, Bi2O3 embeds into the surface of CeMg11Ni, causing a large number of defects such as grain and phase boundaries on the alloy surface. These positions are more prone to stress accumulation and prone to fracture during ball milling. During the activation process, cracks are more likely to appear at these positions, making the alloy particles easier to break into fine powders. These grain and phase boundaries are not only sites for stress accumulation, but also provide fast channels for the bulk diffusion of H atoms, improving the kinetic performance of hydrogen storage reactions. The EDS equipped with SEM is used to perform surface scanning analysis on the alloy particles to characterize the distribution state of Bi element, and the results are shown in Figure 4. No obvious bright spots appear in the figure, which indicates the uniform distribution of all elements, that is, the added Bi2O3 is uniformly coated on the alloy surface without agglomeration.
Figure 4.
SEM elemental mapping images of CeMg11Ni + 5 wt.% Bi2O3 alloy before and after activation: (a) before activation, (b) after activation.
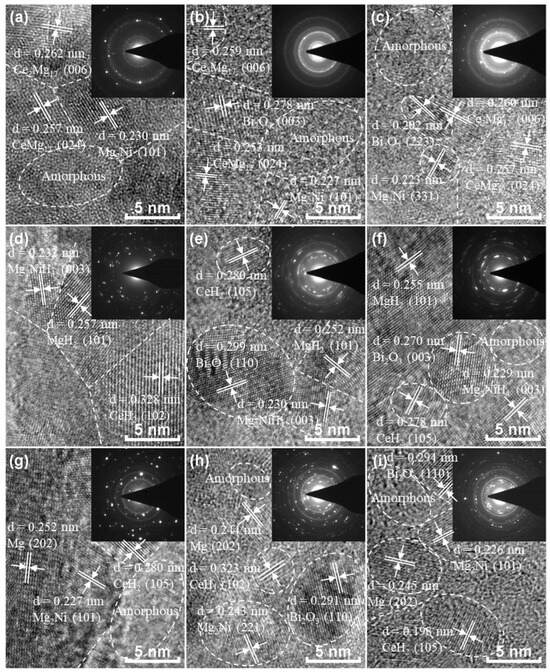
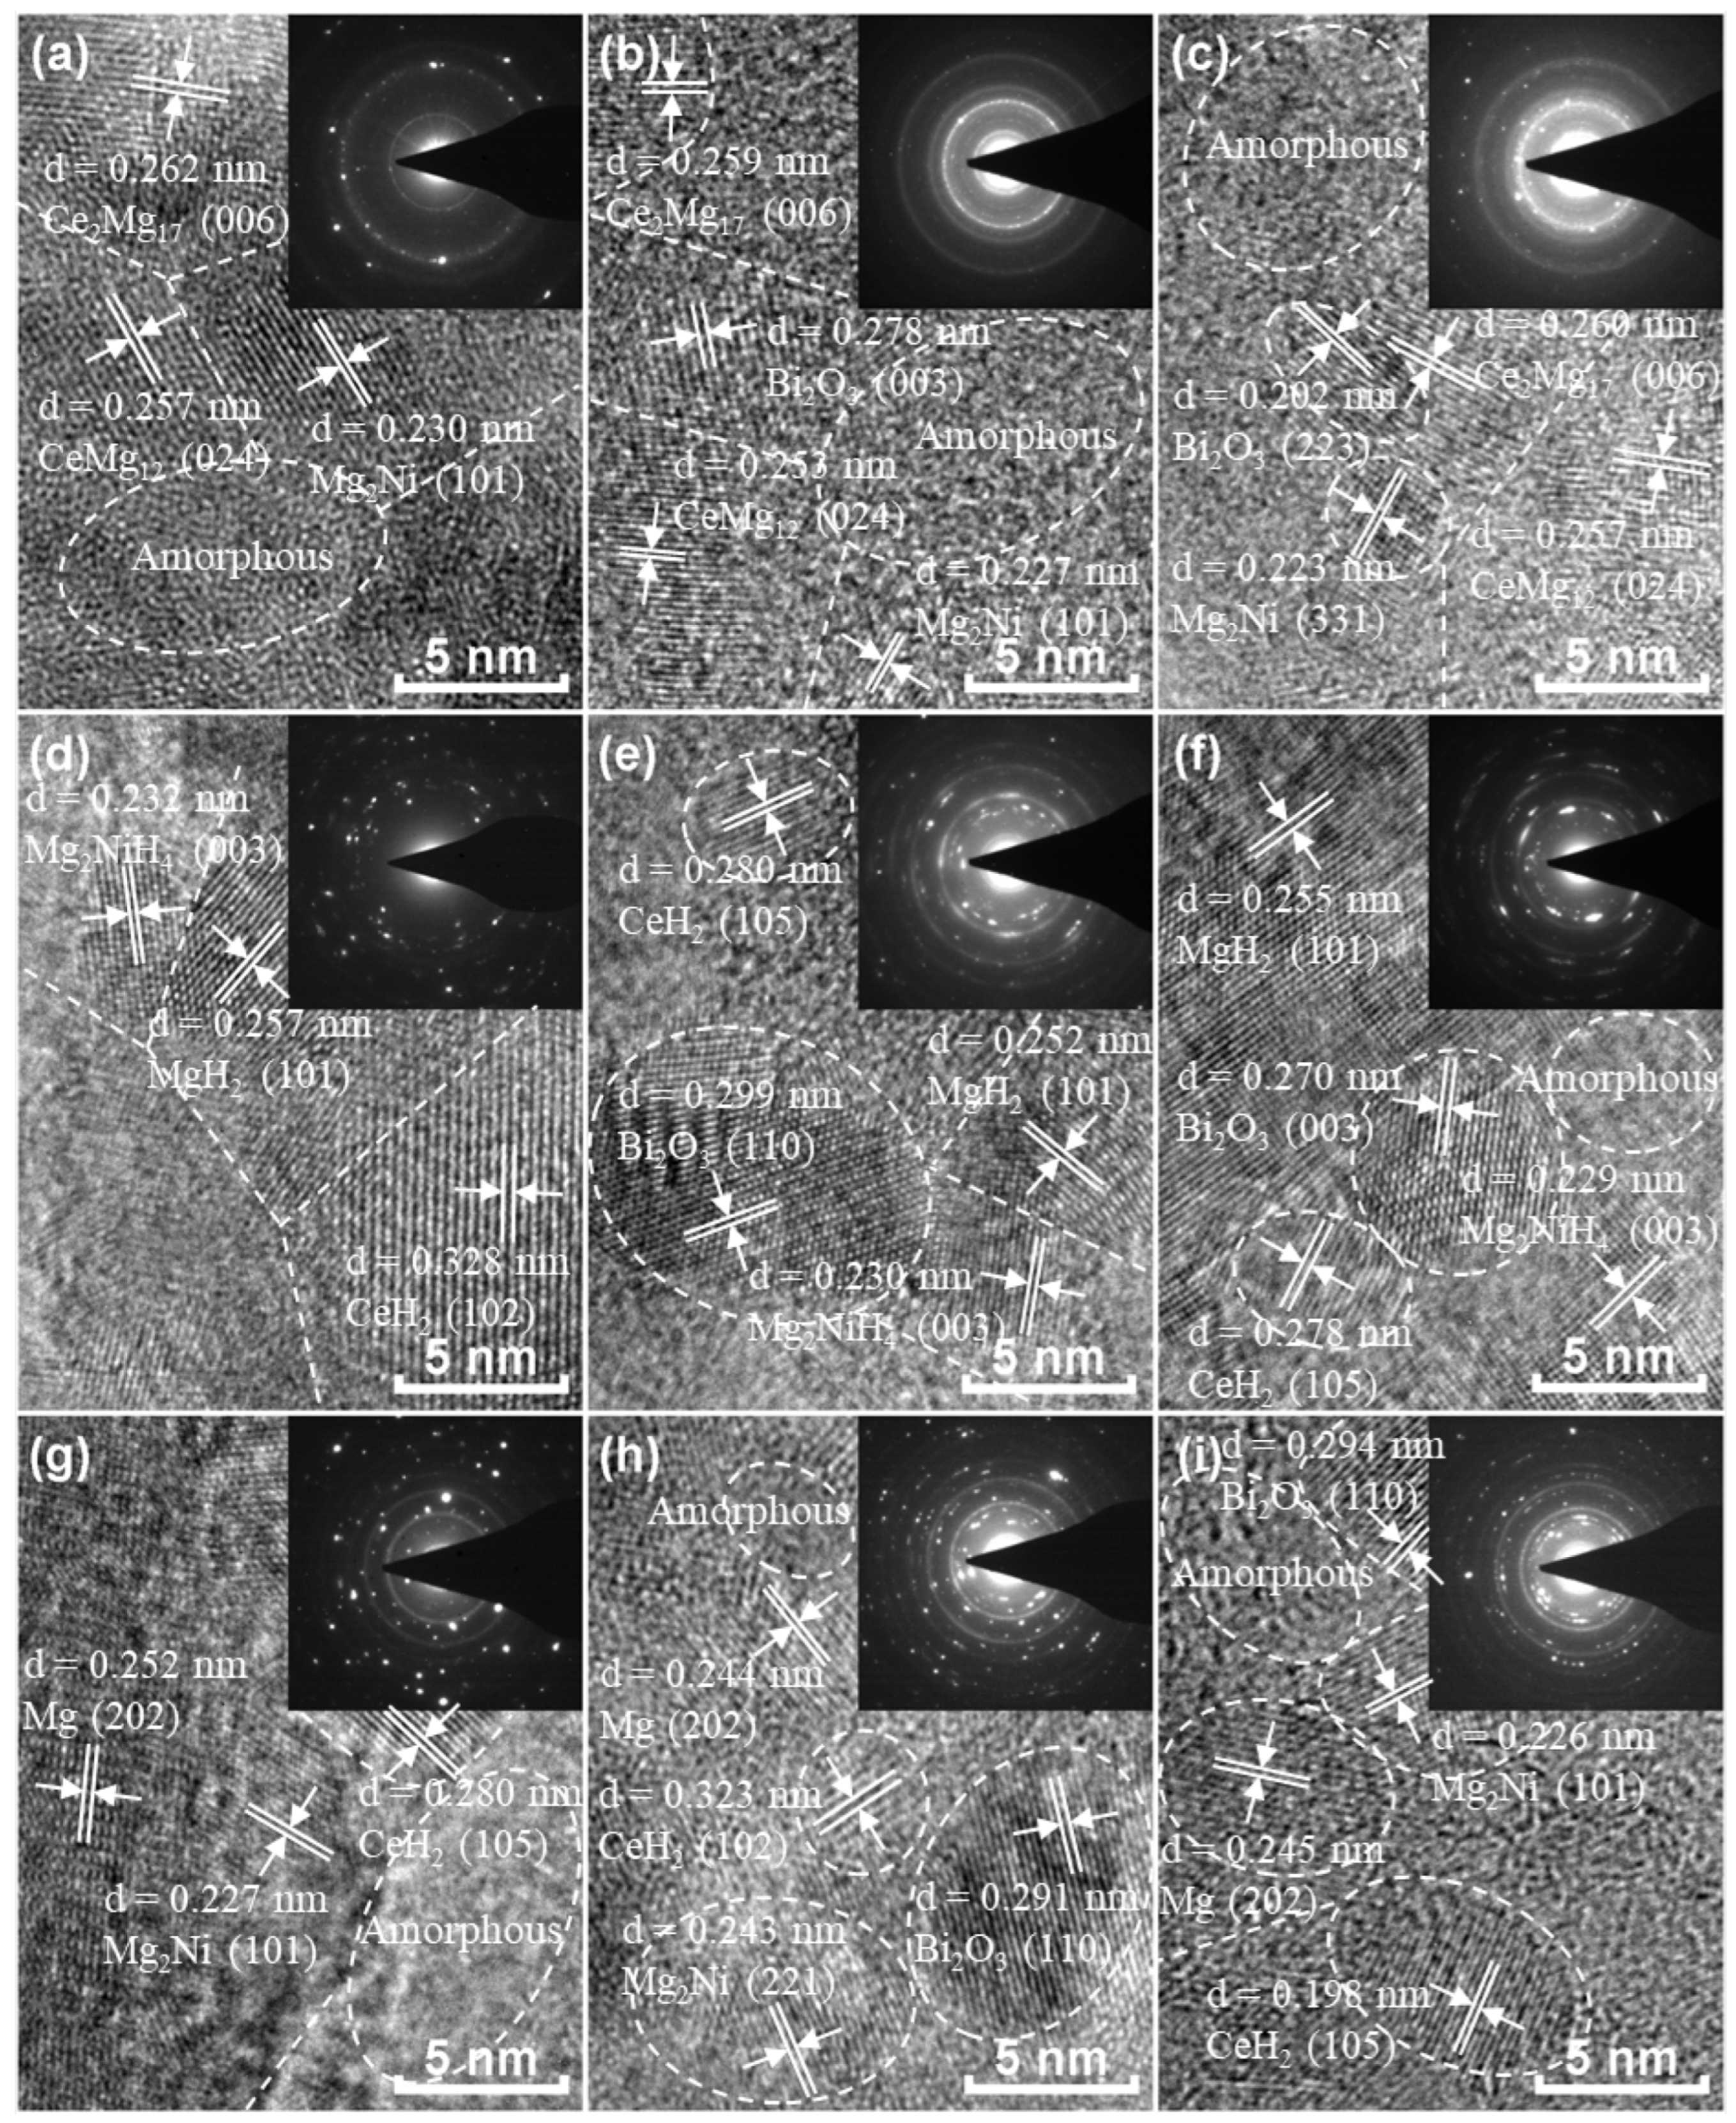
Figure 5 shows the HRTEM and SAED images of CeMg11Ni + x wt.% Bi2O3 (x = 0, 5, 10) alloys before and after hydrogenation and dehydrogenation. Before hydrogen absorption, lots of amorphous and nanocrystalline phases can be found in the alloy, indicating that the as-milled alloy has an amorphous–nanocrystalline structure. By analyzing the interplanar spacing of each phase, the phases of the alloy can be inferred. The Bi0 alloy contains CeMg12, Ce2Mg17 and Mg2Ni phases. After adding Bi2O3, the alloy contains not only the phases above, but also the Bi2O3 phase. After hydrogenation and dehydrogenation, the alloy still maintains an amorphous–nanocrystalline structure. From the TEM images after hydrogenation and dehydrogenation, not only the Mg/MgH2 and Mg2Ni/Mg2NiH4 phases that directly participate in the reversible reactions can be observed, but also the stable nanocrystals of CeH2 and Bi2O3, which is consistent with the analysis of Figure 1. Through comparing with the images before hydrogen absorption, it can be found that although the alloy after hydrogenation and dehydrogenation is still an amorphous–nanocrystalline structure, the proportion of amorphous phase is reduced significantly, meaning that the hydriding and dehydriding reactions promote the recrystallization of amorphous phase, but some amorphous phase will still remain, which is also confirmed by the SAED rings. A large number of crystal defects of grain boundaries, phase boundaries and dislocations can be found in the HRTEM images. As typical heterogeneous interfaces, grain boundaries and phase boundaries can effectively reduce the reaction activation energy. On the one hand, they offer numerous active nucleation sites for hydride during hydrogenation and dehydrogenation. On the other hand, these interfacial structures greatly shorten the migration distance of hydrogen atoms and accelerate hydrogen diffusion. The defects provide lots of nucleation sites for the hydriding and dehydriding reactions and fast channels for hydrogen diffusion, which improves the hydrogen storage kinetics of the alloy.
Figure 5.
HRTEM and SAED images of CeMg11Ni + x wt.% Bi2O3 (x = 0, 5, 10) alloys before and after hydrogen absorption and desorption: (a) Bi0, (b) Bi5, (c) Bi10 before hydrogen absorption; (d) Bi0, (e) Bi5, (f) Bi10 after hydrogen absorption; (g) Bi0, (h) Bi5, (i) Bi10 after hydrogen desorption.
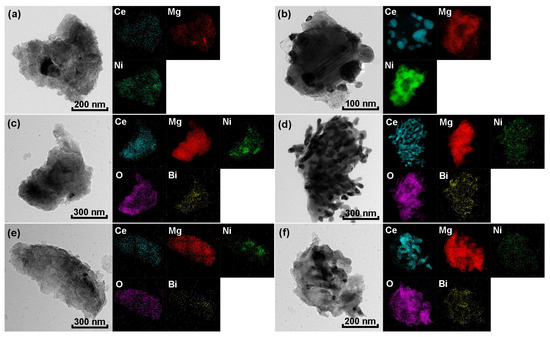
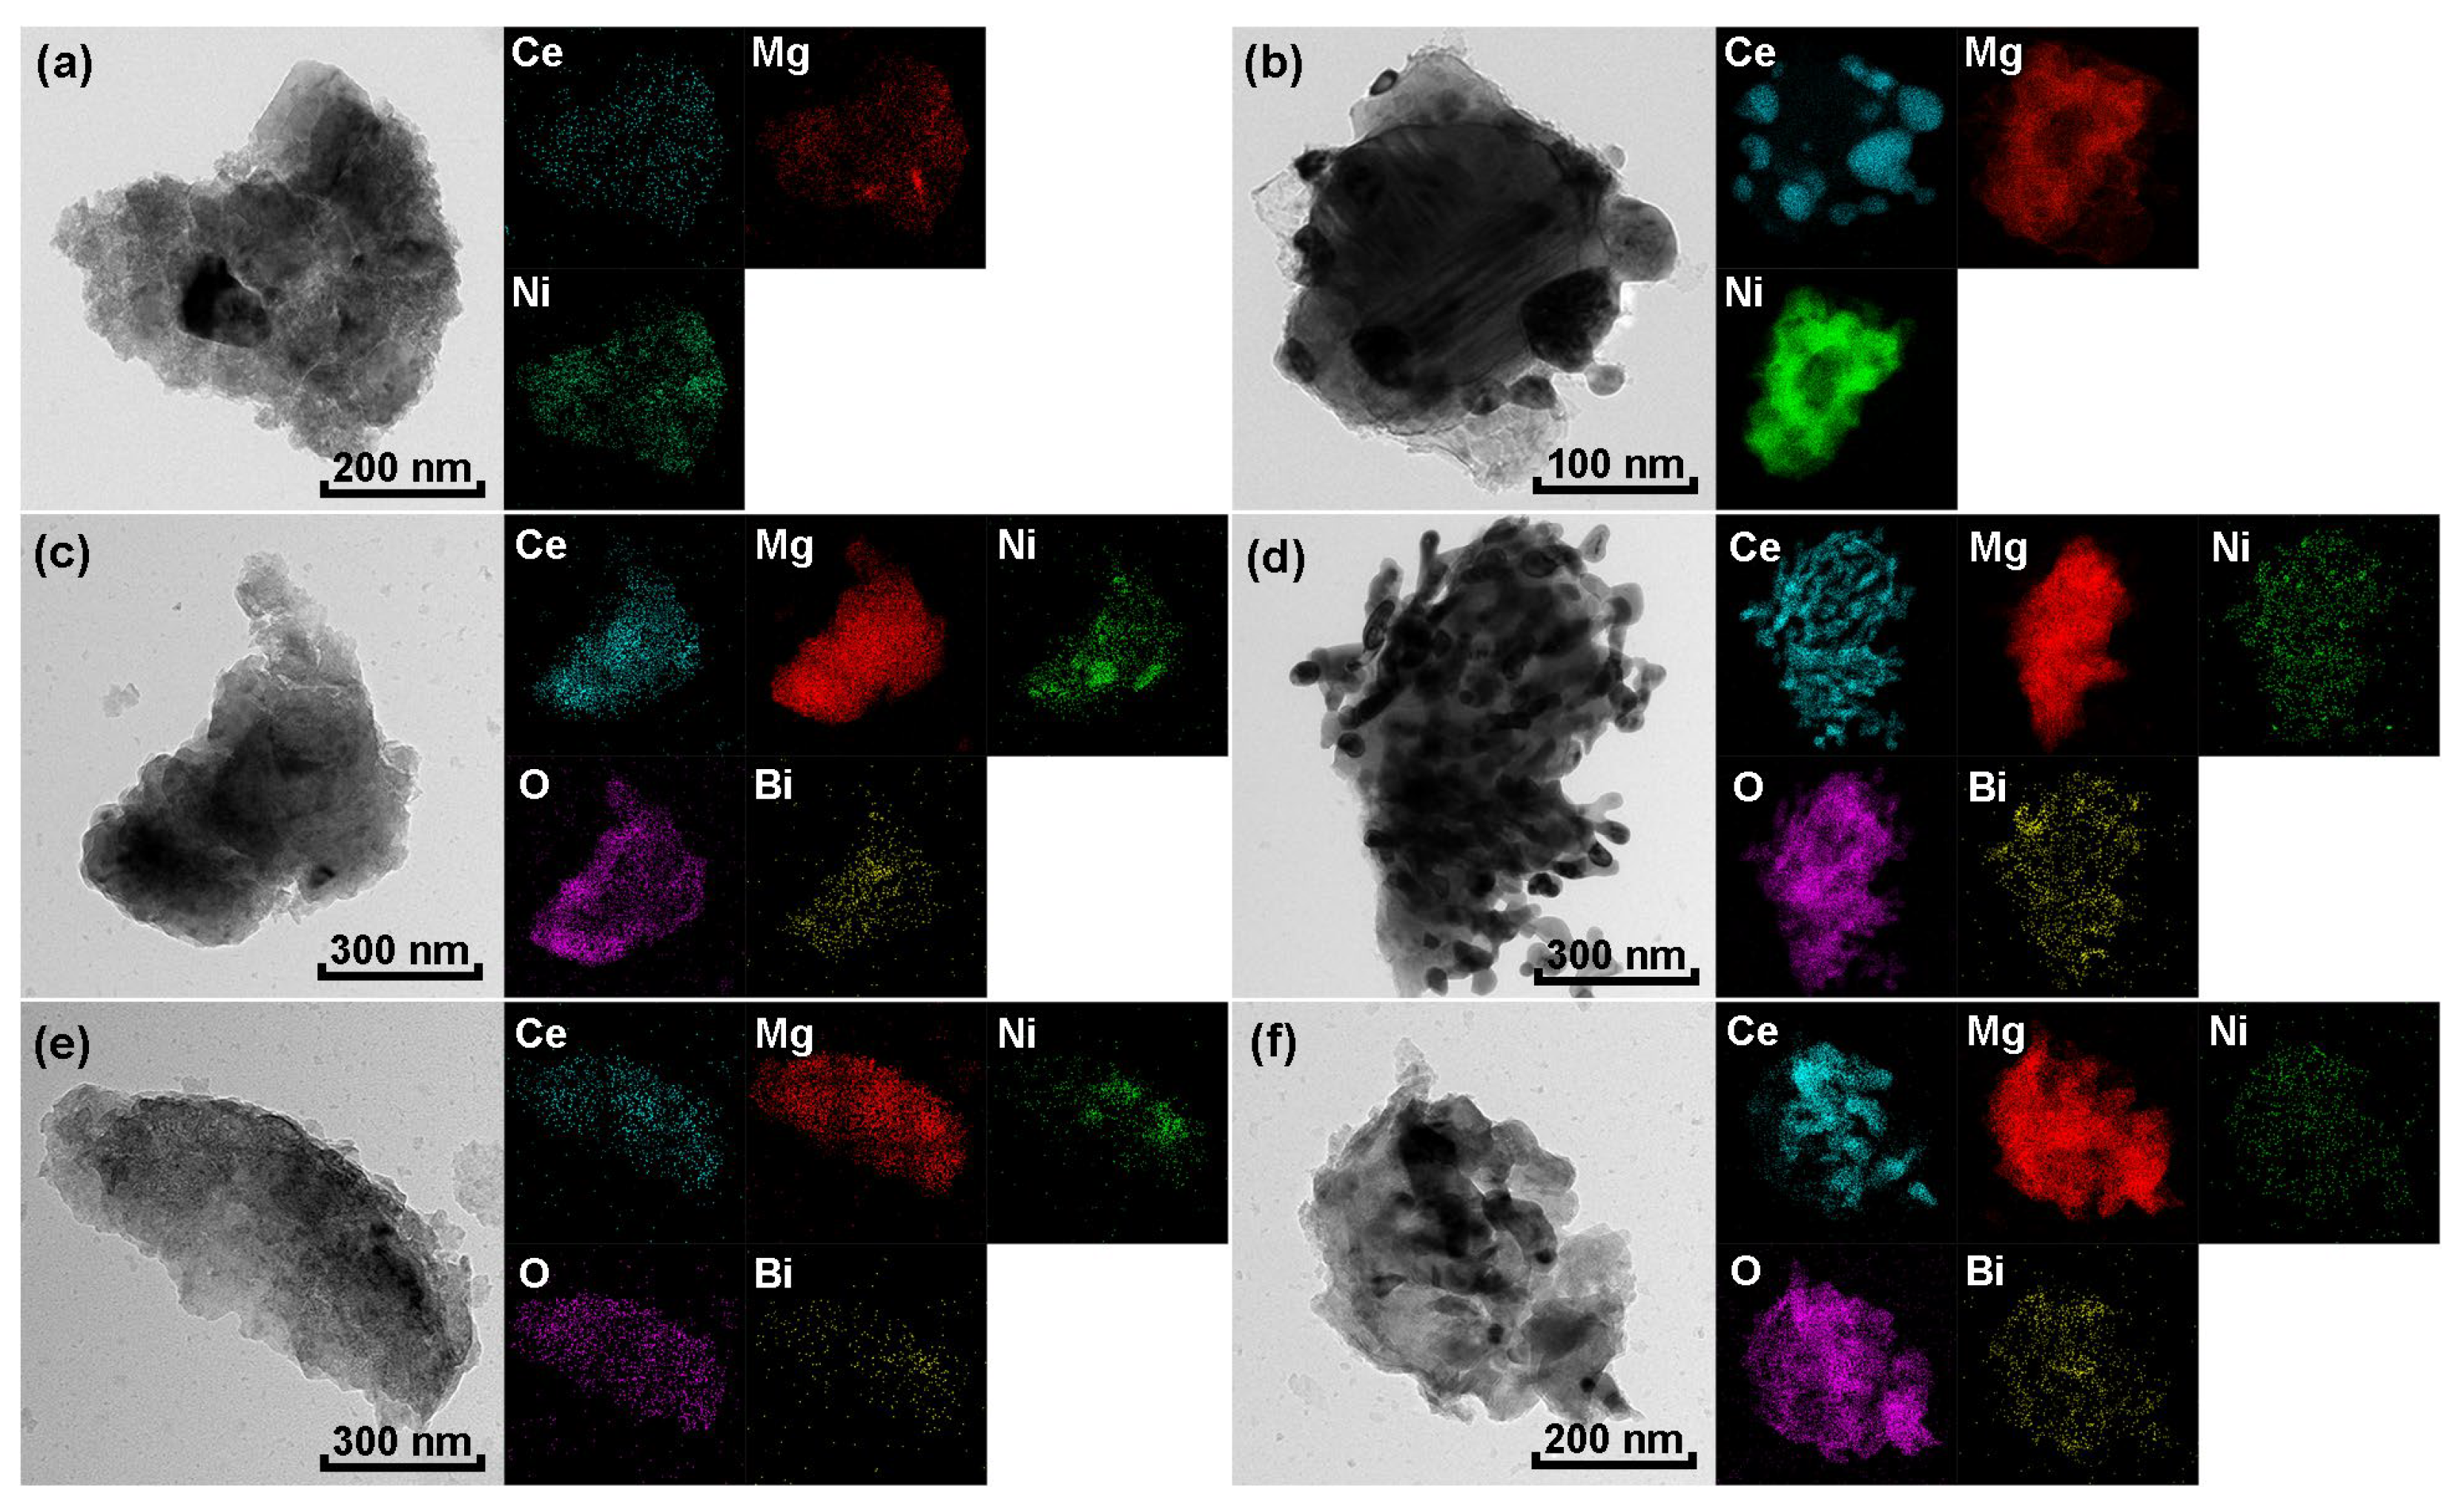
To study the distribution of each element in the alloy, surface scanning is performed on the samples before and after activation with the EDS equipped with TEM, as Figure 6 shows. Before activation, all elements are uniformly distributed, indicating that no segregation occurs during milling process, and the added Bi2O3 is also uniformly distributed. However, many obvious black spots appear on the TEM images after activation. Combined with the element distribution maps, they can be judged as CeH2 with sizes mostly below 100 nm, indicating that a large number of CeH2 nanocrystalline phases is formed in situ inside the alloy during the hydrogen absorption and desorption process. From the black dots in the TEM image, it can be observed that the crystallite sizes are all below 100 nm. It can be seen from Figure 6b that the grain sizes are relatively large, yet the largest grain size is also below 70 nm. Bi and O elements are also relatively uniformly distributed in the alloy, indicating that Bi2O3 is always uniformly distributed in the alloy during the hydrogen absorption and desorption process. The in situ formed CeH2 nanocrystals and the Bi2O3 introduced by ball milling create a large number of grain and phase boundaries in the alloy, providing numerous nucleation sites and hydrogen diffusion channels for the hydrogen absorption and desorption reactions.
Figure 6.
TEM elemental mapping images of CeMg11Ni + x wt.% Bi2O3 (x = 0, 5, 10) alloys before and after activation: (a) Bi0, (c) Bi5, (e) Bi10 before activation; (b) Bi0, (d) Bi5, (f) Bi10 after activation.
In summary, XRD, SEM and TEM characterization results confirm that Bi2O3 maintains phase stability and uniform element distribution during the hydrogenation and dehydrogenation cycles, and can construct high-density grain boundary and phase boundary defects together with the in situ formed CeH2 nanocrystals. Among them, the intrinsic oxygen vacancies of Bi2O3 provide high-density chemical active sites for H2 dissociation, and the multiple heterogeneous interfaces act as efficient physical diffusion channels for hydrogen atom transport. The synergistic effect of chemical activity and structural advantages formed by the two is the core microscopic basis of Bi2O3 catalytic modification, providing a dual foundation of activity and transport capacity for hydrogen storage reactions.
3.2. Activation and Hydrogen Storage Capacity
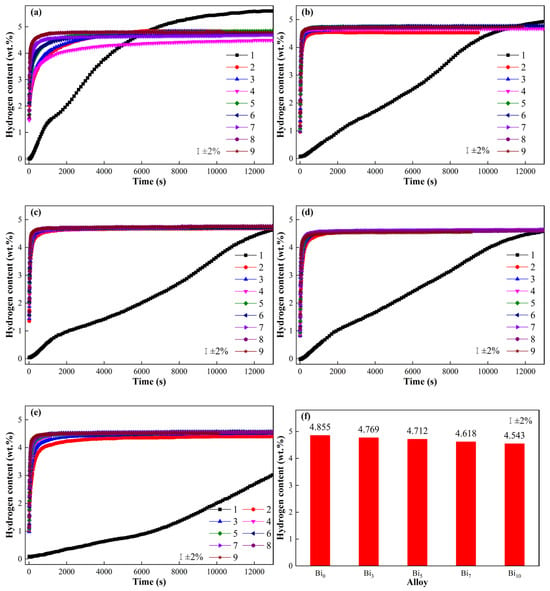
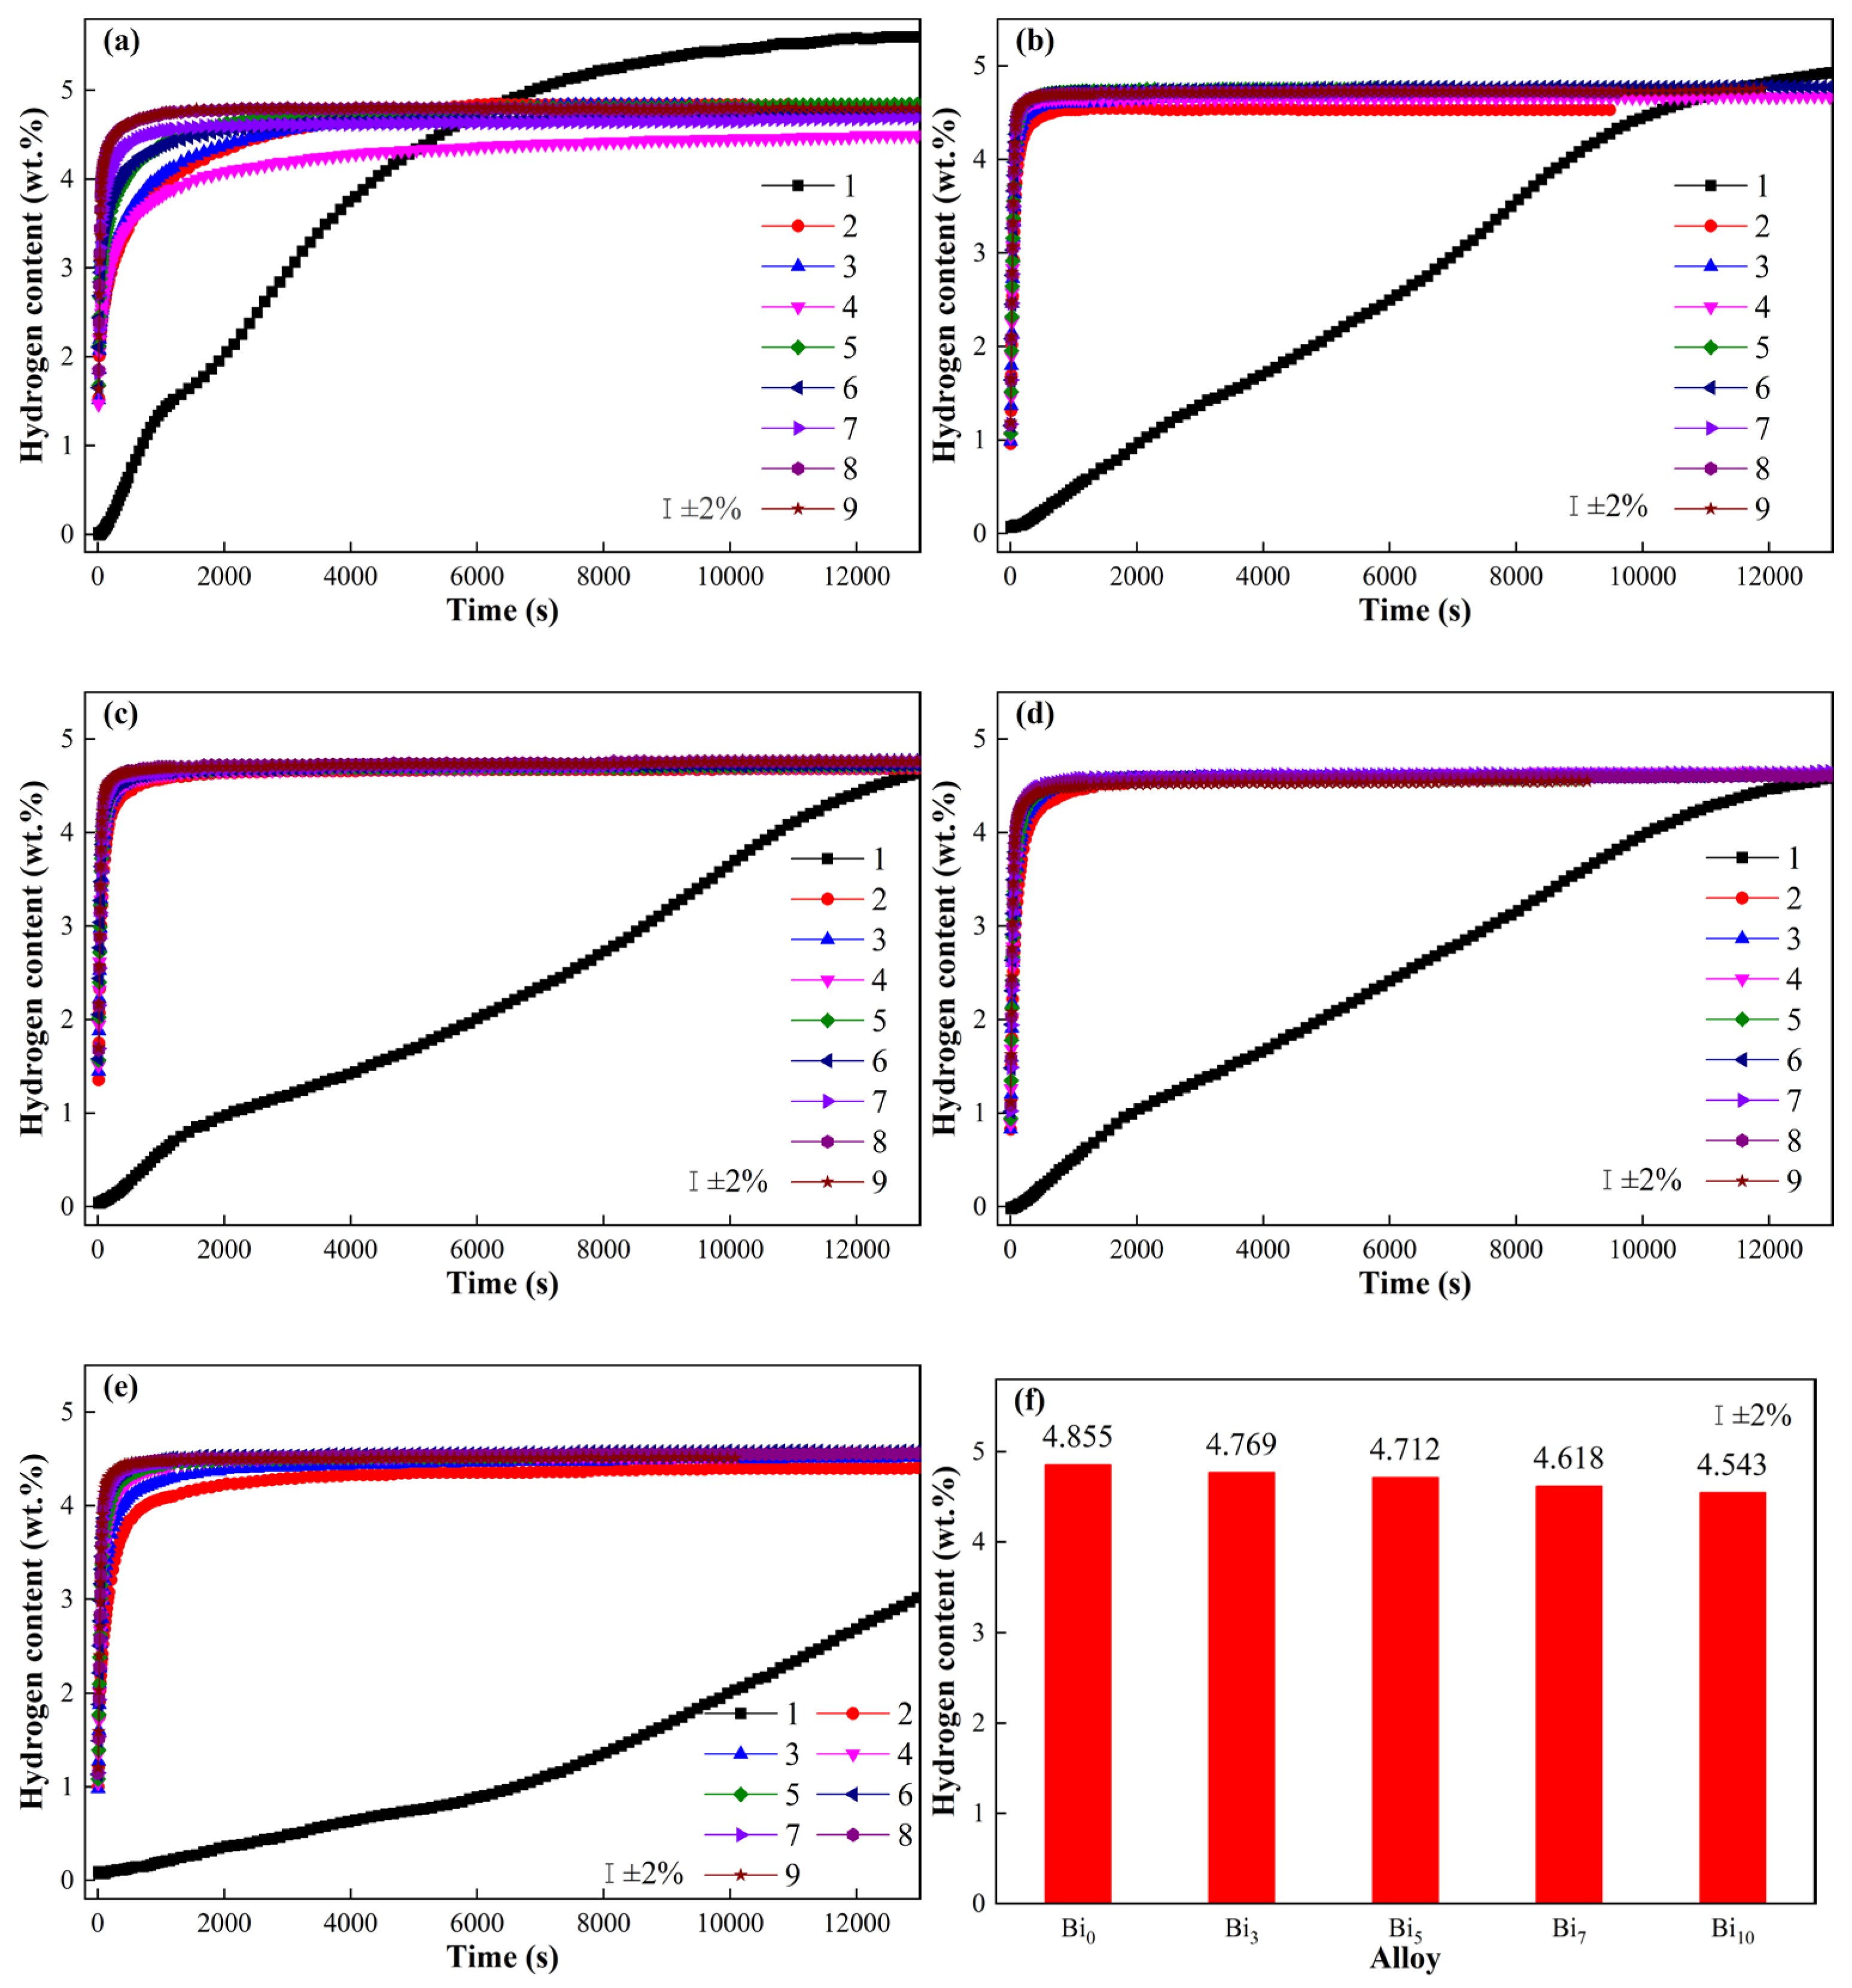
Figure 7 presents the activation curves of hydrogen absorption of CeMg11Ni + x wt.% Bi2O3 (x = 0, 3, 5, 7, 10) alloys measured at 633 K. The time taken for the alloy to reach saturated hydrogen absorption in the first cycle is considerably longer than that in subsequent cycles, which can be ascribed to the surface oxide layer formed prior to the initial hydrogenation process. Even under inert gas protection, Mg-based alloys inevitably develop a 3–4 nm thick surface oxide layer during sample preparation [52]. The introduction of Bi2O3 further prolongs the duration of the first hydrogen absorption, since a composite layer consisting of MgO and Bi2O3 is formed on the particle surface. During the initial hydrogenation, H atoms dissociated from H2 on the alloy surface must penetrate this composite oxide barrier before diffusing into the alloy matrix, which markedly suppresses the hydrogen absorption rate [53]. After the first hydrogen absorption cycle, the surface oxide layer is disrupted, leading to a prominent increase in the hydrogen absorption rate in the following cycles.
Figure 7.
Activation hydrogen absorption curves of CeMg11Ni + x wt.% Bi2O3 (x = 0, 3, 5, 7, 10) alloys: (a) Bi0, (b) Bi3, (c) Bi5, (d) Bi7, (e) Bi10; and (f) saturated hydrogen absorption capacity.
Compared with the first hydrogen absorption, the hydrogen absorption capacity in subsequent cycles is significantly reduced, which is mainly due to the formation of non-decomposable CeH2 during the first hydrogen absorption of the alloy. The first hydrogen absorption capacities of CeMg11Ni + x wt.% Bi2O3 (x = 0, 3, 5, 7, 10) alloys are 5.508, 5.327, 5.212, 5.096 and 4.943 wt.%, respectively. After activation, the saturated hydrogen absorption capacities are 4.855, 4.769, 4.712, 4.618 and 4.543 wt.%, respectively. With the increase in Bi2O3 doping content, the hydrogen absorption capacity of the alloy decreases continuously. In addition to the dilution effect caused by the inactive catalyst, excessive Bi2O3 may also lead to partial coverage of the active phase surface, thickening of the interfacial layer and obstruction of hydrogen diffusion pathways, which collectively affect the hydrogen storage capacity. Although excessive Bi2O3 may reduce hydrogen storage capacity due to dilution effects and partial coverage of active phases, an appropriate amount of Bi2O3 can significantly improve hydrogen absorption/desorption kinetics, activation behavior, and interfacial structure. Therefore, the role of Bi2O3 is to optimize the balance between hydrogen storage capacity and kinetic performance. Although the hydrogen absorption capacity in subsequent cycles is reduced compared with the first one, the hydrogen absorption rate is significantly improved, especially in the initial stage. After activation, all alloys can reach over 92% of the saturated hydrogen absorption capacity within 5 min. However, after the rapid hydrogen absorption in the initial stage, the hydrogen absorption rate decreases sharply, and it takes a long time to reach saturated hydrogen absorption, which is due to the formation of a new hydride layer. At the beginning, H atoms react rapidly with Mg (or Mg2Ni) and form a MgH2 (or Mg2NiH4) coating layer, which hinders H from diffusing further into the alloy interior, slowing down the hydrogen absorption rate of the alloy and thus requiring a long time for absorbing hydrogen completely.
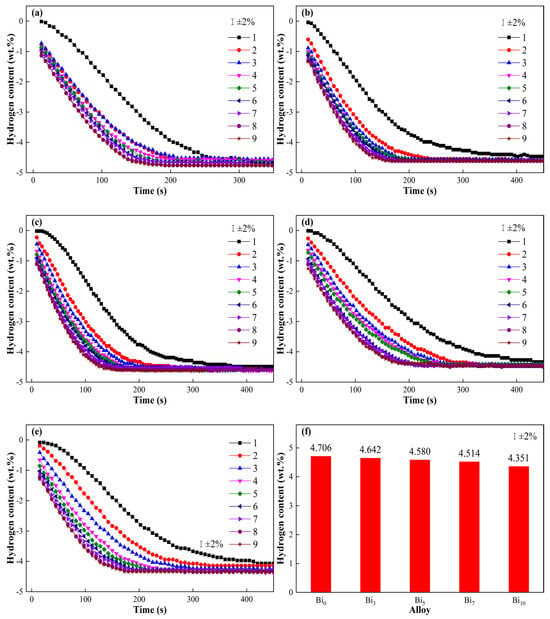
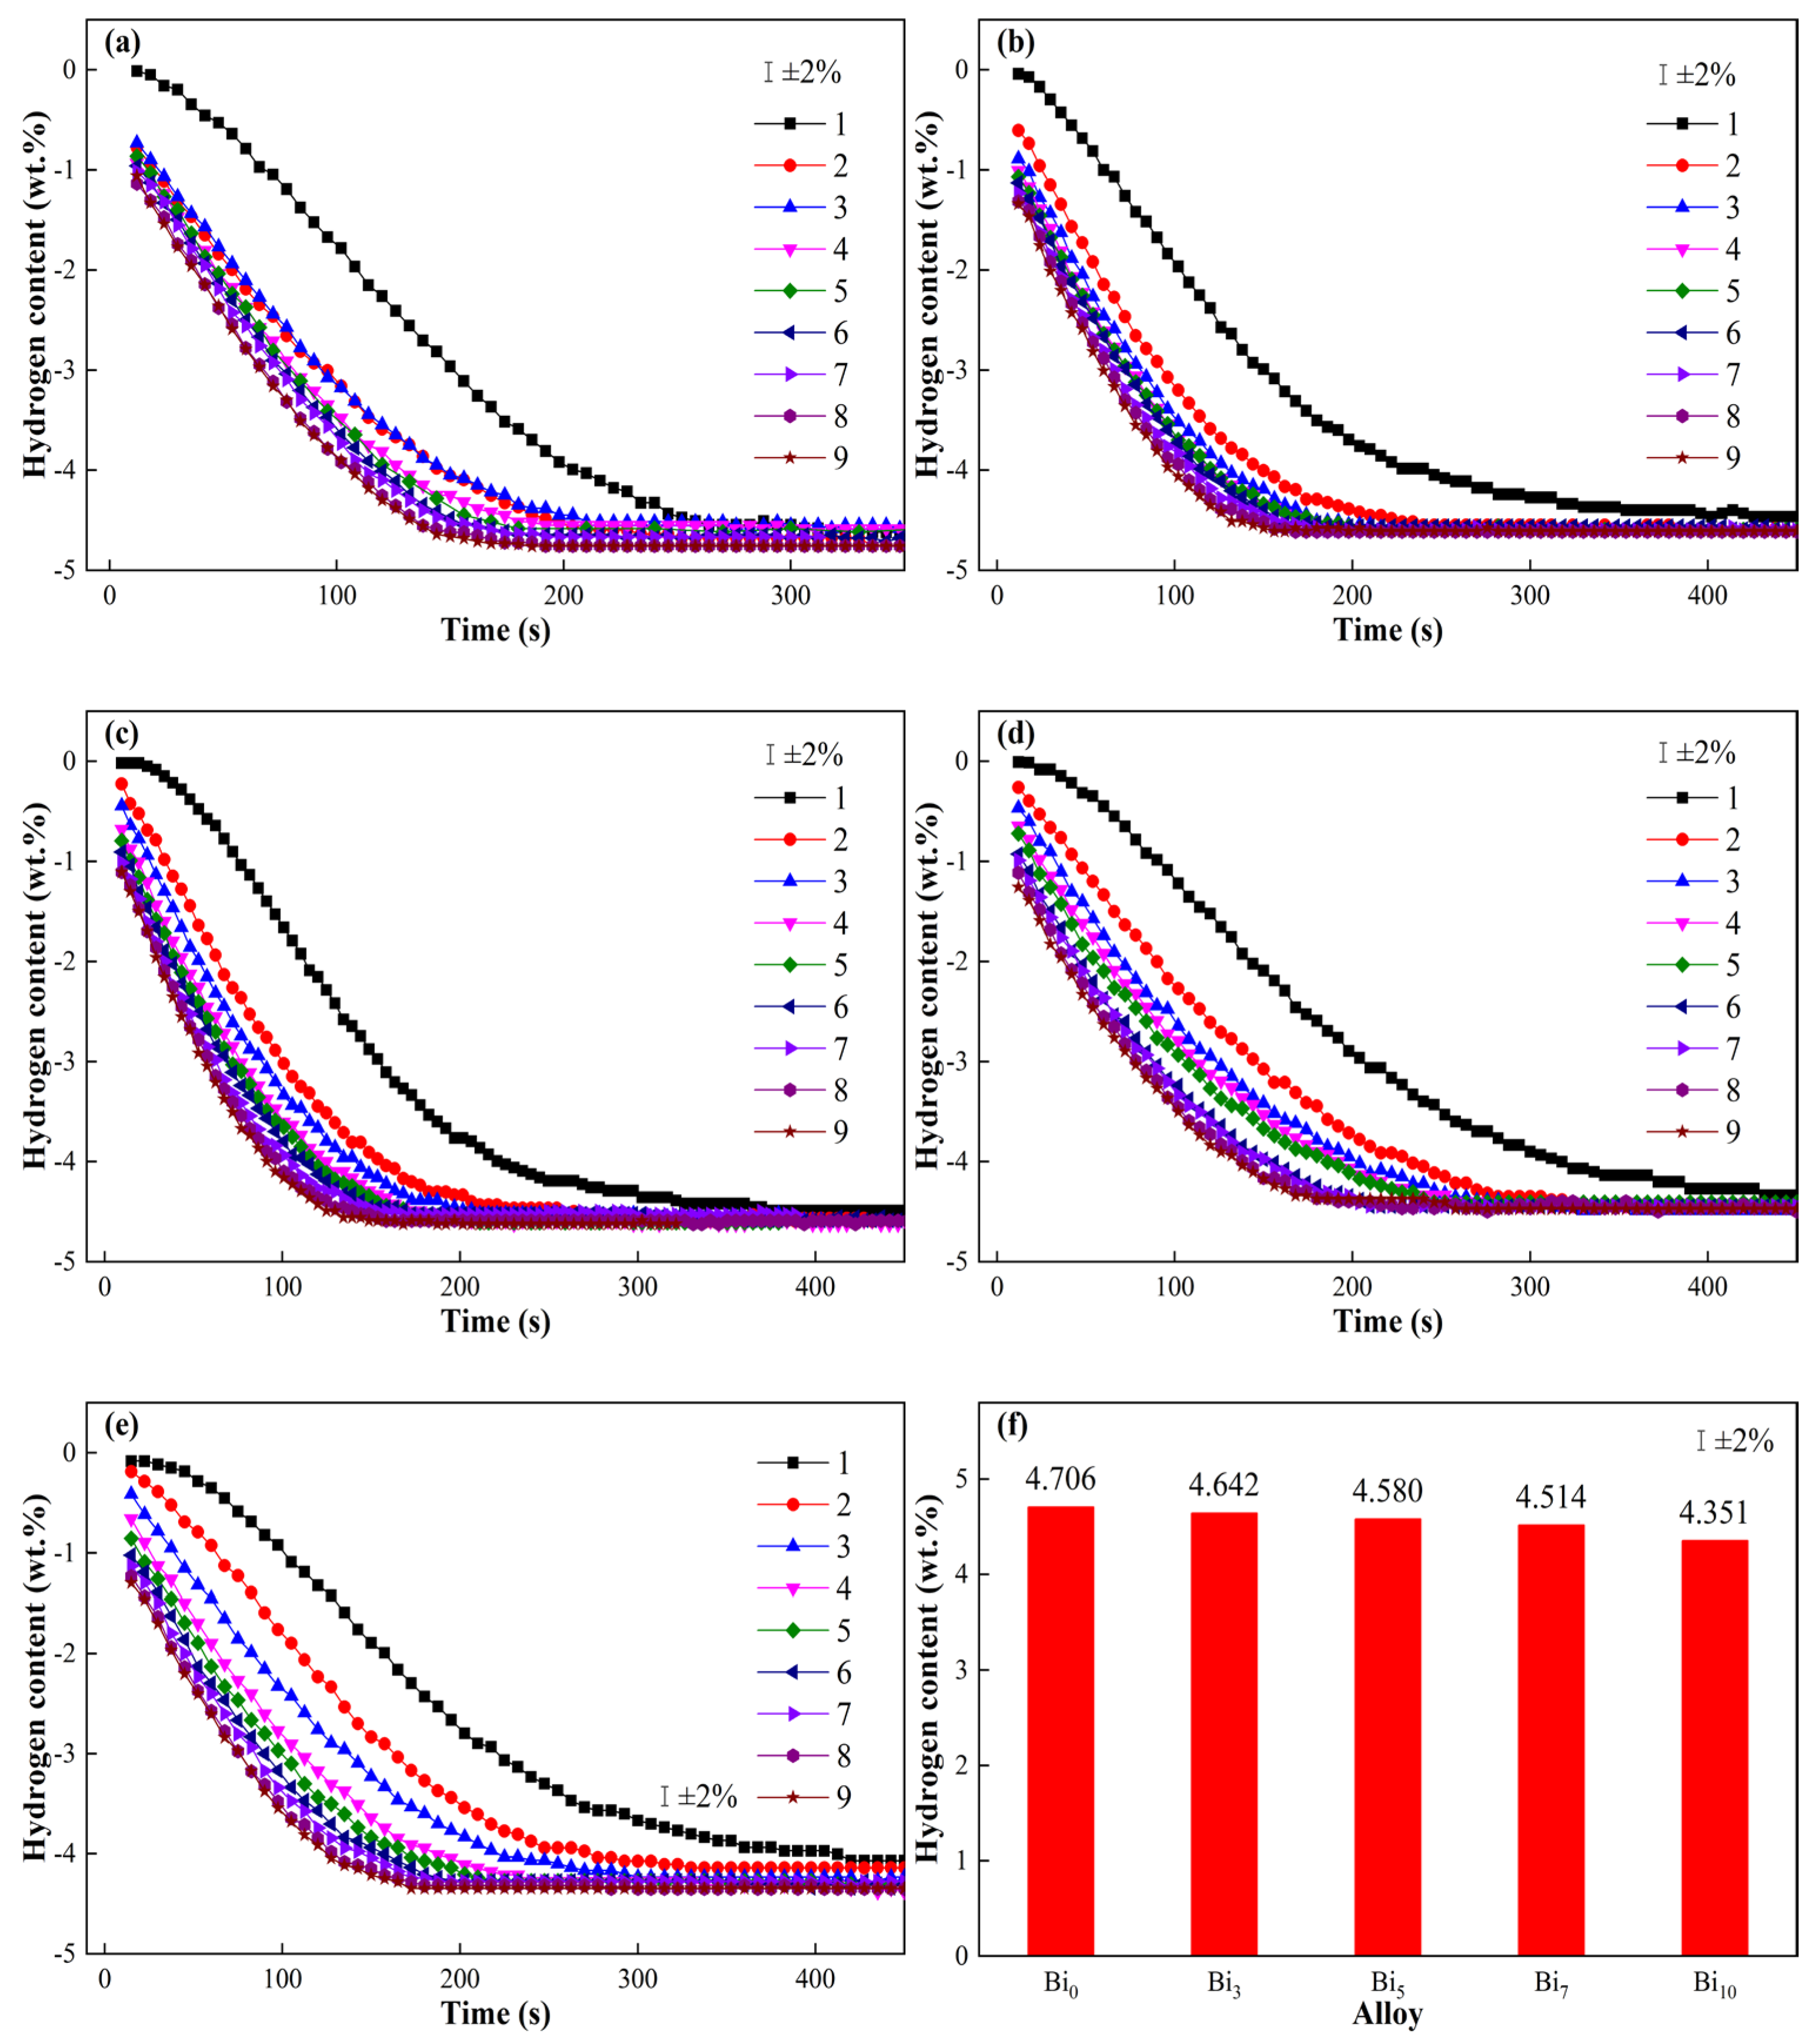
Figure 8 shows the activation curves of hydrogen desorption of CeMg11Ni + x wt.% Bi2O3 (x = 0, 3, 5, 7, 10) alloys at 633 K. The first hydrogen desorption of the alloy takes a longer time than the subsequent cycles. With cycle times increasing, the hydrogen desorption rate gradually accelerates. After nine cycles, the hydrogen desorption curves of the alloy basically coincide, indicating complete activation of the alloy. The number of cycles required for full activation of this material is within the normal range [54,55,56]. Its activation performance is superior to those materials that demand extensive cycling, such as the MgH2-Ti3AlCN composite, which needs up to 40 cycles to achieve complete activation [57]. With the addition of Bi2O3 doping, the maximum hydrogen desorption capacity of the alloy gradually decreases, which is 4.706, 4.642, 4.580, 4.514 and 4.351 wt.%, respectively. The hydrogen desorption rate of the alloy after activation is significantly improved. At 633 K, the time for desorbing hydrogen completely is 192, 156, 144, 210 and 282 s, respectively. Moreover, with the addition of Bi2O3, the hydrogen desorption rate first increases and then decreases, indicating that adding Bi2O3 helps improve the hydrogen desorption rate of the alloy, but adding too much Bi2O3 hinders the hydrogen desorption instead. This is because an excessively thick Bi2O3 coating layer is formed, which hinders the permeation of H on alloy surface.
Figure 8.
Activation hydrogen desorption curves of CeMg11Ni + x wt.% Bi2O3 (x = 0, 3, 5, 7, 10) alloys: (a) Bi0, (b) Bi3, (c) Bi5, (d) Bi7, (e) Bi10; and (f) maximal hydrogen desorption capacity.
3.3. Hydrogen Storage Kinetics
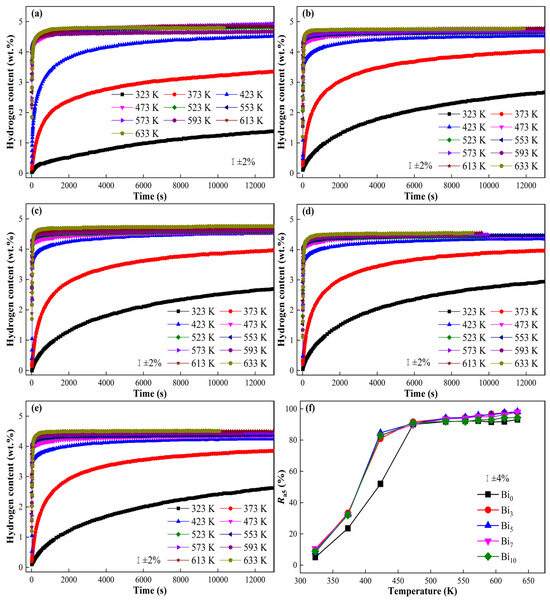
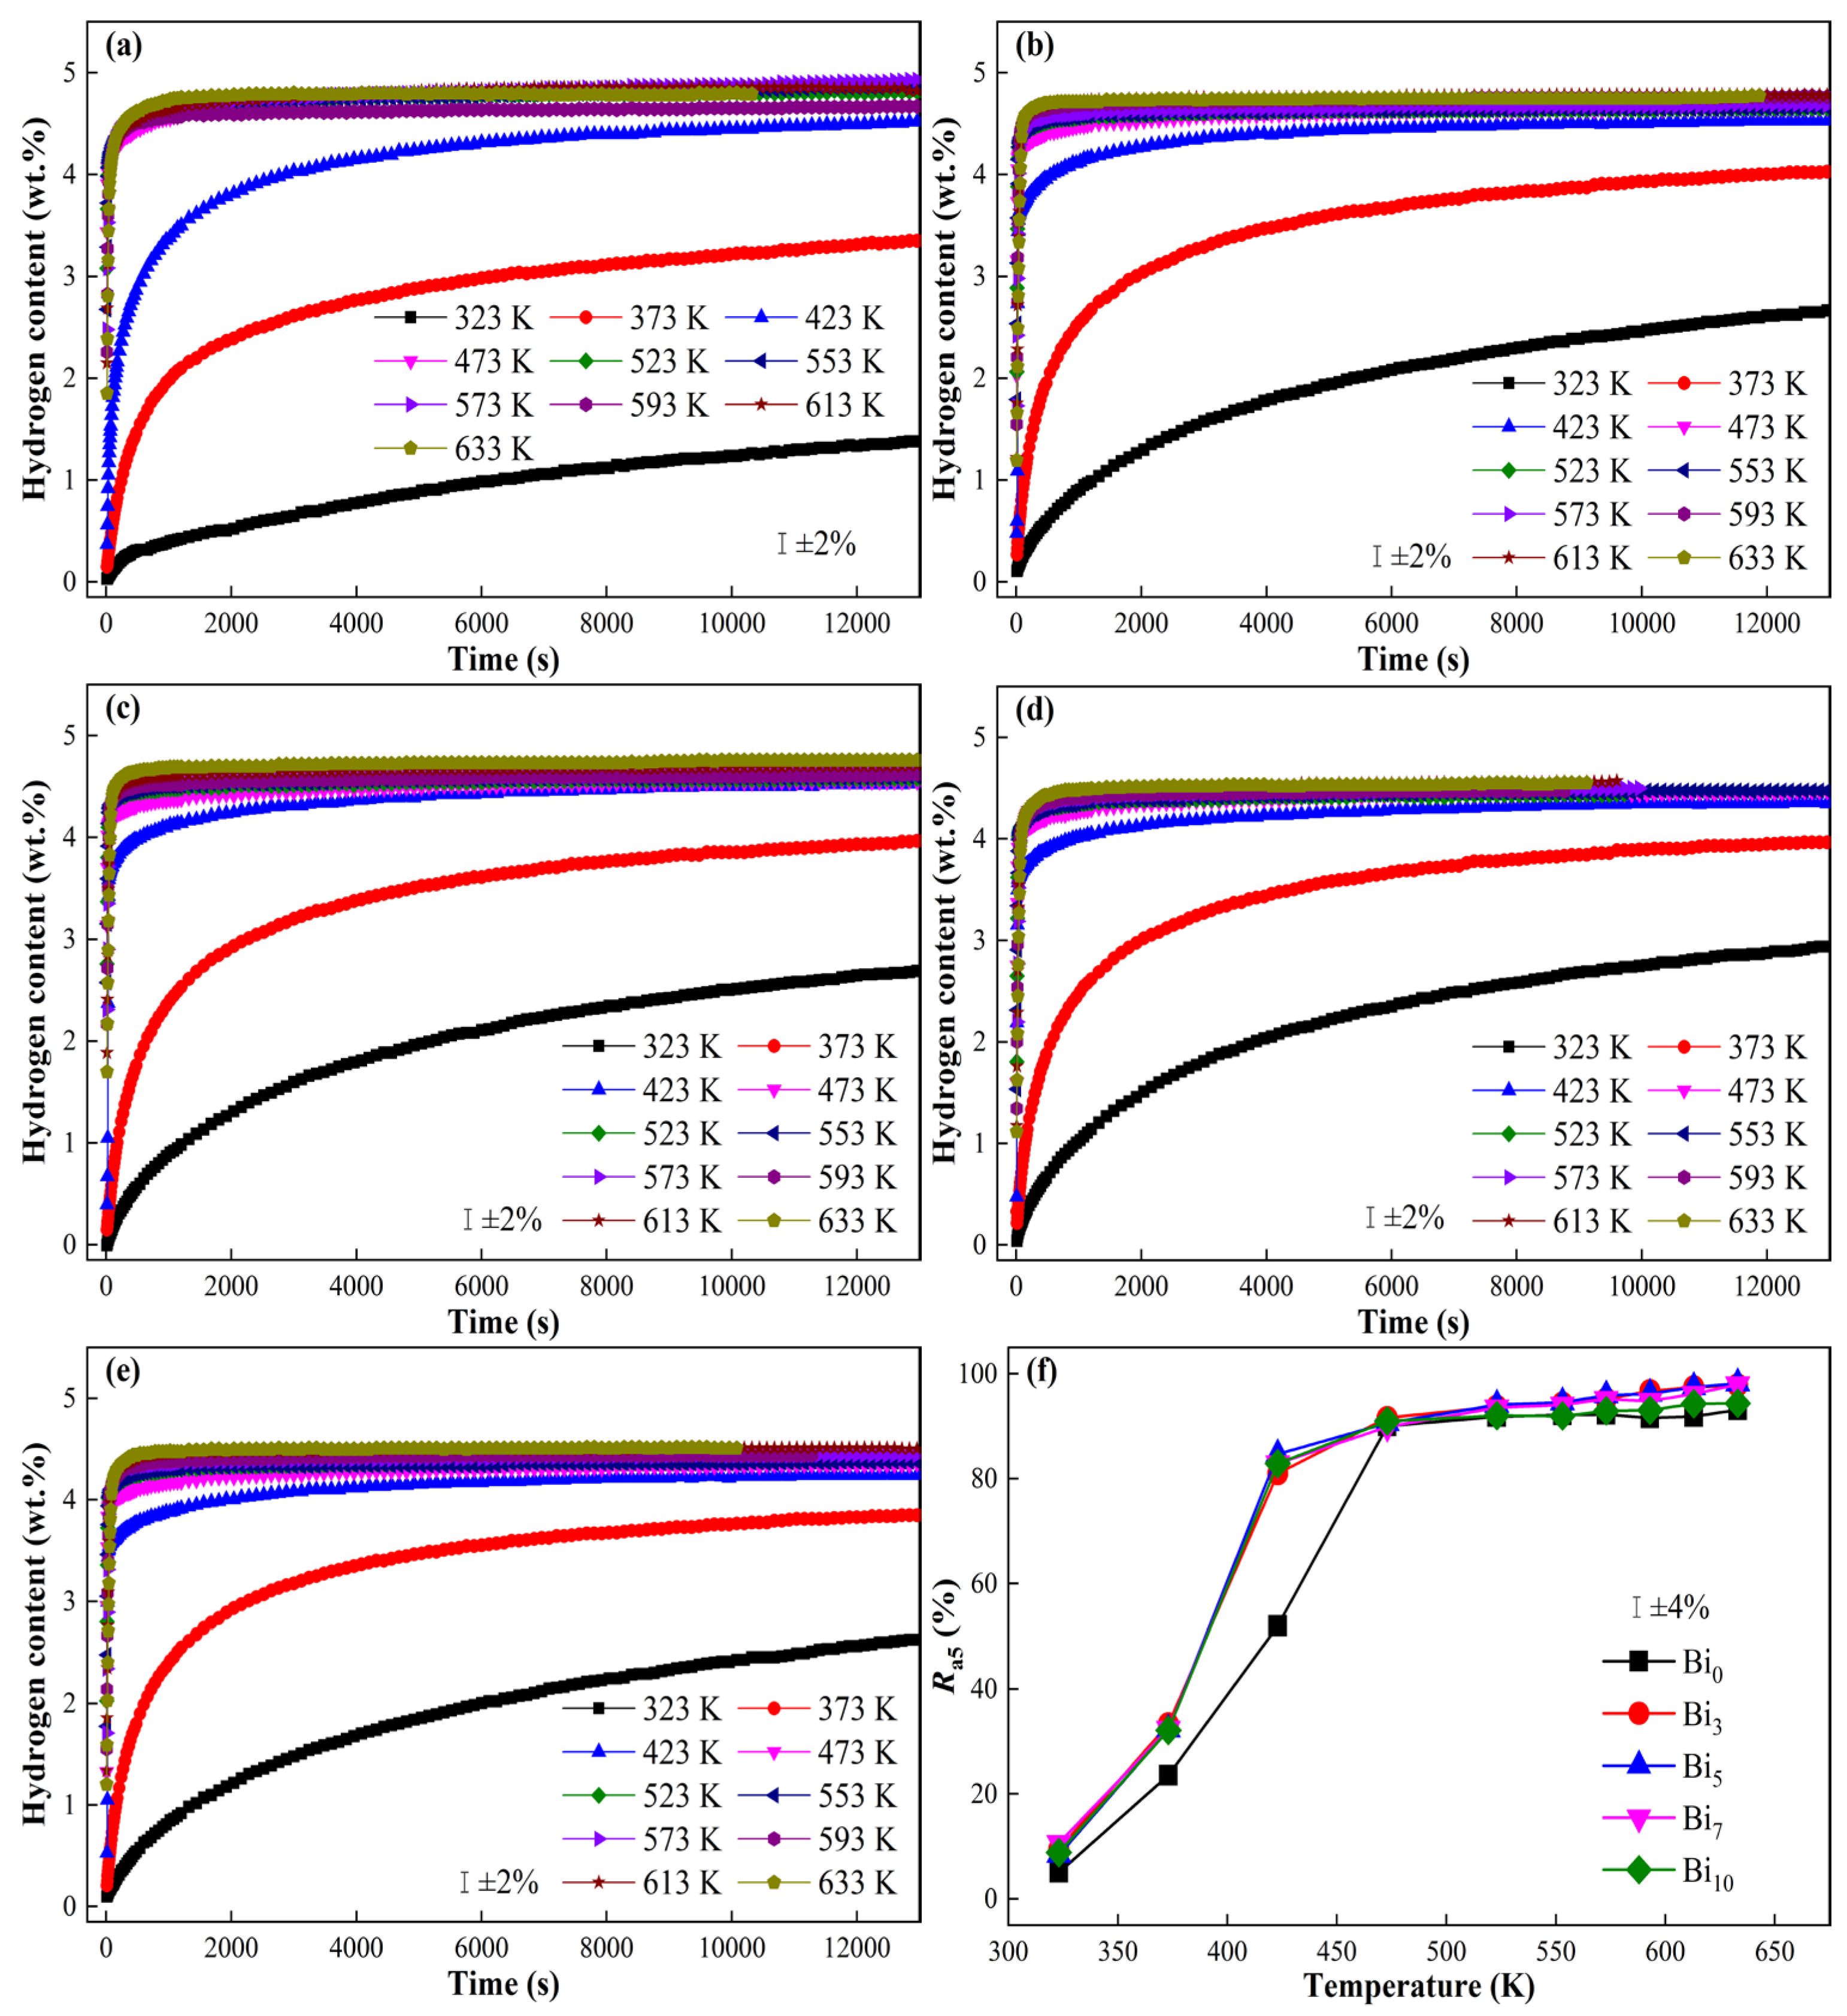
To study the effect of Bi2O3 doping on the hydrogen absorption kinetics of CeMg11Ni, the hydriding curves of the activated CeMg11Ni + x wt.% Bi2O3 (x = 0, 3, 5, 7, 10) alloys are tested at different temperatures, as shown in Figure 9. At higher temperatures, there is an obvious inflection point region on the hydriding curves, but with the decrease in temperature, the inflection point region becomes larger and less obvious, which is related to the hydride on the alloy surface. At high temperatures, hydrogen reacts rapidly on the alloy surface to form a metal hydride layer, which slows down the H diffusion into the alloy interior and causes the hydrogen absorption rate to decrease rapidly. Under such conditions, hydrogen diffusion through the metal hydride layer acts as the rate-limiting step for hydrogenation. With the decrease in temperature, the reaction rate between hydrogen and the alloy gradually slows down, and it is difficult to form a hydride layer quickly. Nevertheless, the bulk diffusion rate of hydrogen atoms within the alloy is less temperature-dependent, resulting in the hydriding reaction rate gradually becoming the rate-limiting step of the hydrogen absorption process.
Figure 9.
Isothermal hydrogen absorption curves of CeMg11Ni + x wt.% Bi2O3 (x = 0, 3, 5, 7, 10) alloys at different temperatures: (a) Bi0, (b) Bi3, (c) Bi5, (d) Bi7, (e) Bi10; and (f) hydrogen absorption fraction at 5 min.
To quantitatively characterize the hydrogen absorption kinetics of the alloy, the 5 min hydrogen absorption fraction (Ra5) is defined as:
where C5 represents the hydrogen absorption capacity in 5 min, and Cmax corresponds to the saturated hydrogen absorption capacity at that temperature. The variation curves of Ra5 values of different alloys with temperature are obtained and plotted in Figure 9f. As shown in the figure, the Ra5 values of all alloys rise monotonically with increasing temperature. Notably, when the temperature reaches 473 K or higher, the Ra5 values of different samples exhibit negligible discrepancies, suggesting that temperature dominates the hydrogen absorption kinetics in this temperature range. In contrast, below 473 K, the Ra5 values of Bi2O3-doped alloys are markedly superior to those of the undoped Bi0 sample. Specifically, at 423 K, the Ra5 of Bi5 alloy reaches 84.7%, whereas that of the pristine Bi0 alloy is only 52.0%, demonstrating that Bi2O3 doping effectively enhances the low-temperature hydrogen absorption kinetics. The underlying mechanism lies in the fact that the dissociation energy barrier of H2 becomes the dominant rate-limiting step of the hydrogenation reaction at low temperatures. The intrinsic oxygen vacancies in Bi2O3 effectively lower the dissociation barrier of H2 and provide abundant active sites for hydrogen absorption, thereby mitigating the kinetic inhibition caused by low temperatures.
Ra5 = C5/Cmax × 100%
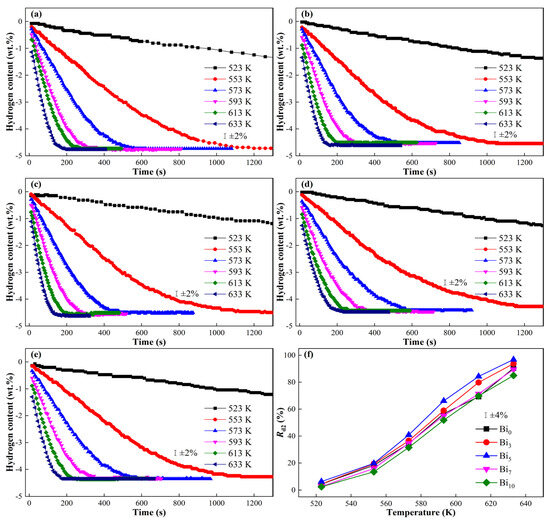
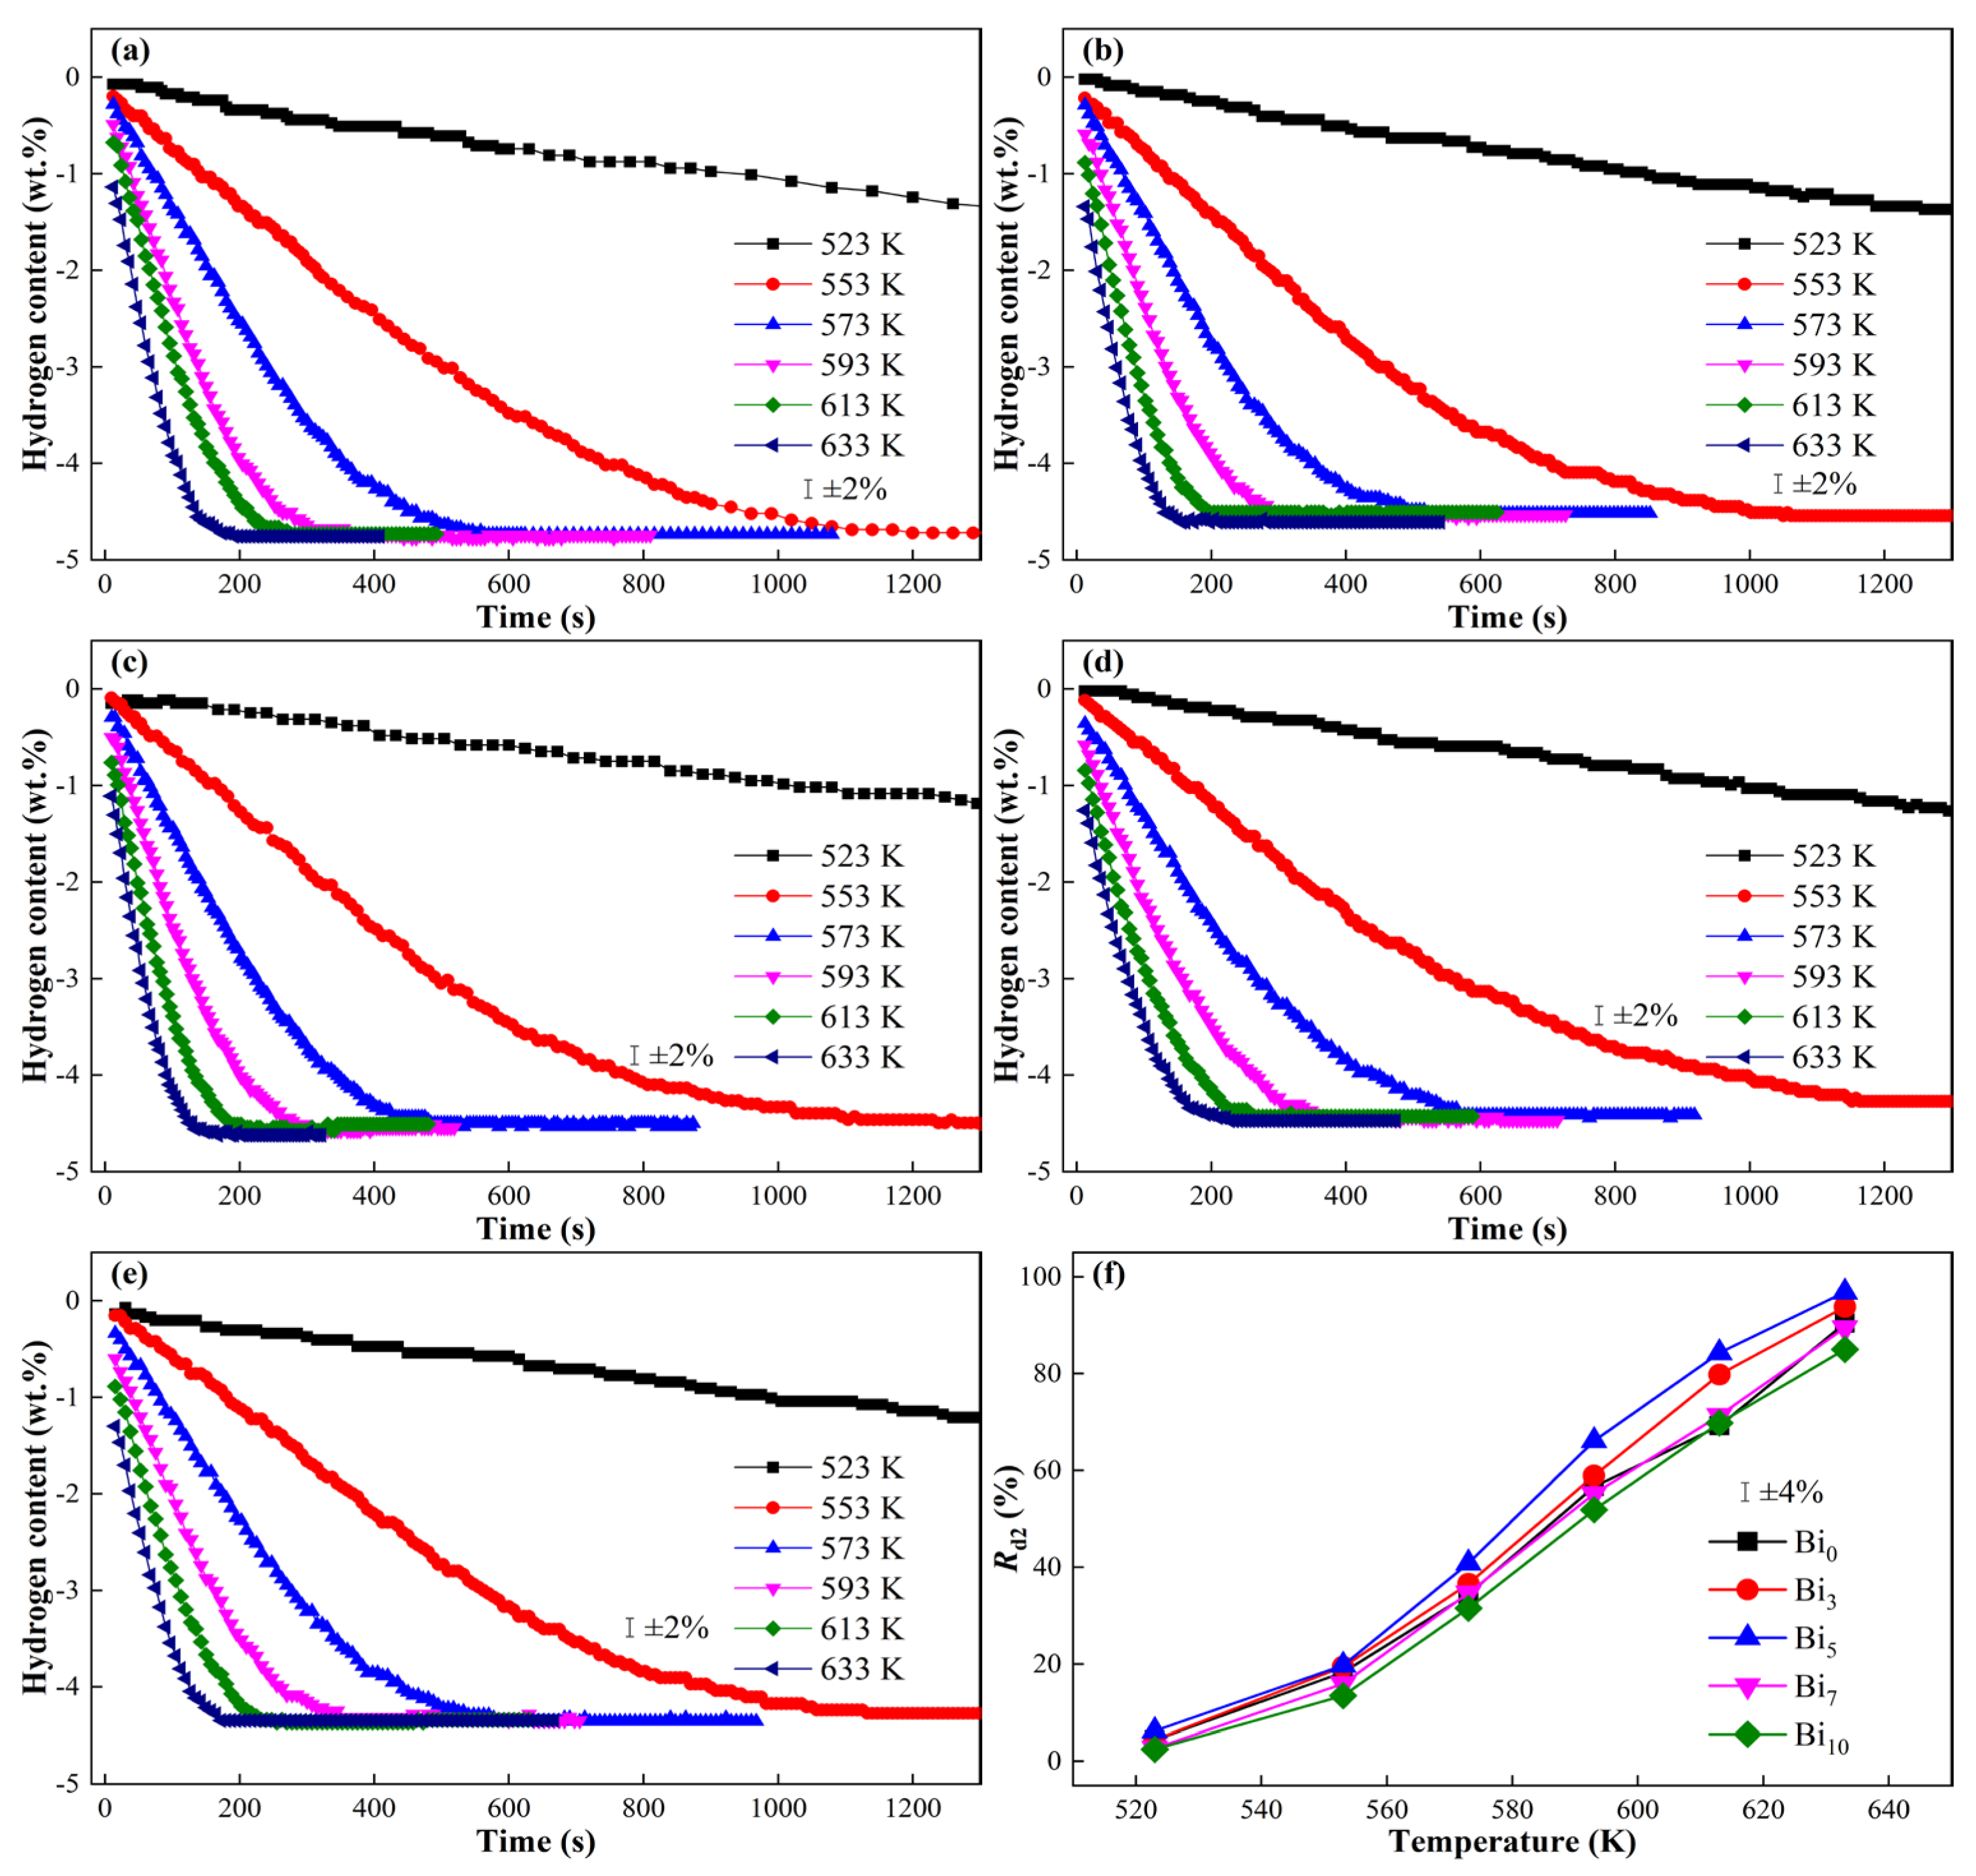
To elucidate the influence of varying Bi2O3 doping levels on the dehydrogenation kinetics of alloys, isothermal dehydrogenation profiles of all samples are measured across a temperature range of 523–633 K, as depicted in Figure 10. The dehydrogenation rate of all alloys exhibits a monotonic downward trend with the temperature decreasing. This temperature-dependent behavior arises from the endothermic nature of the dehydrogenation reaction: lower temperatures reduce the thermal energy available to break Mg-H bonds and suppress the kinetic activity of reactants, thereby hindering the forward progression of the hydrogen release process.
Figure 10.
Isothermal hydrogen desorption curves of CeMg11Ni + x wt.% Bi2O3 (x = 0, 3, 5, 7, 10) alloys at different temperatures: (a) Bi0, (b) Bi3, (c) Bi5, (d) Bi7, (e) Bi10; and (f) hydrogen desorption fraction at 2 min.
For quantitative assessment of the dehydrogenation kinetics, the 2 min hydrogen desorption fraction (Rd2) is defined as:
where D2 represents the hydrogen desorption capacity in 2 min, and Dmax corresponds to the maximum dehydrogenation capacity at that temperature. The variation trend of Rd2 values of different alloys with temperature is obtained, as shown in Figure 10f. As temperature rises, the Rd2 values of all alloys increase monotonically and the dehydrogenation process accelerates progressively, confirming that temperature exerts a dominant control over the dehydrogenation kinetics. At a given temperature, the Rd2 value first increases and then decreases with rising Bi2O3 doping content. This indicates that moderate Bi2O3 doping effectively enhances the dehydrogenation rate, while excessive doping deteriorates the kinetic performance, a phenomenon attributed to the formation of an overly thick Bi2O3 coating layer that impedes hydrogen permeation at the alloy surface.
Rd2 = D2/Dmax × 100%
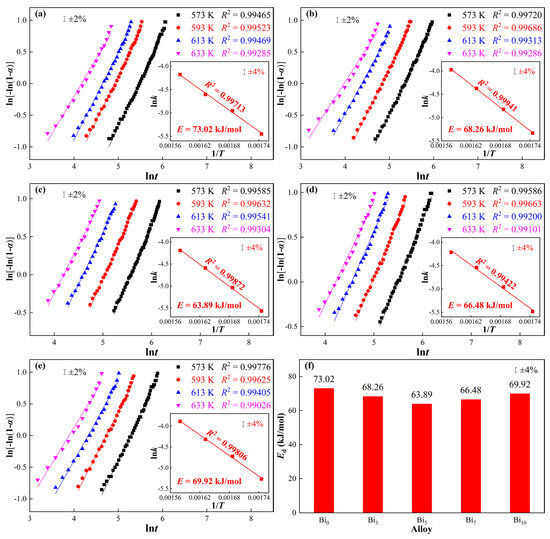
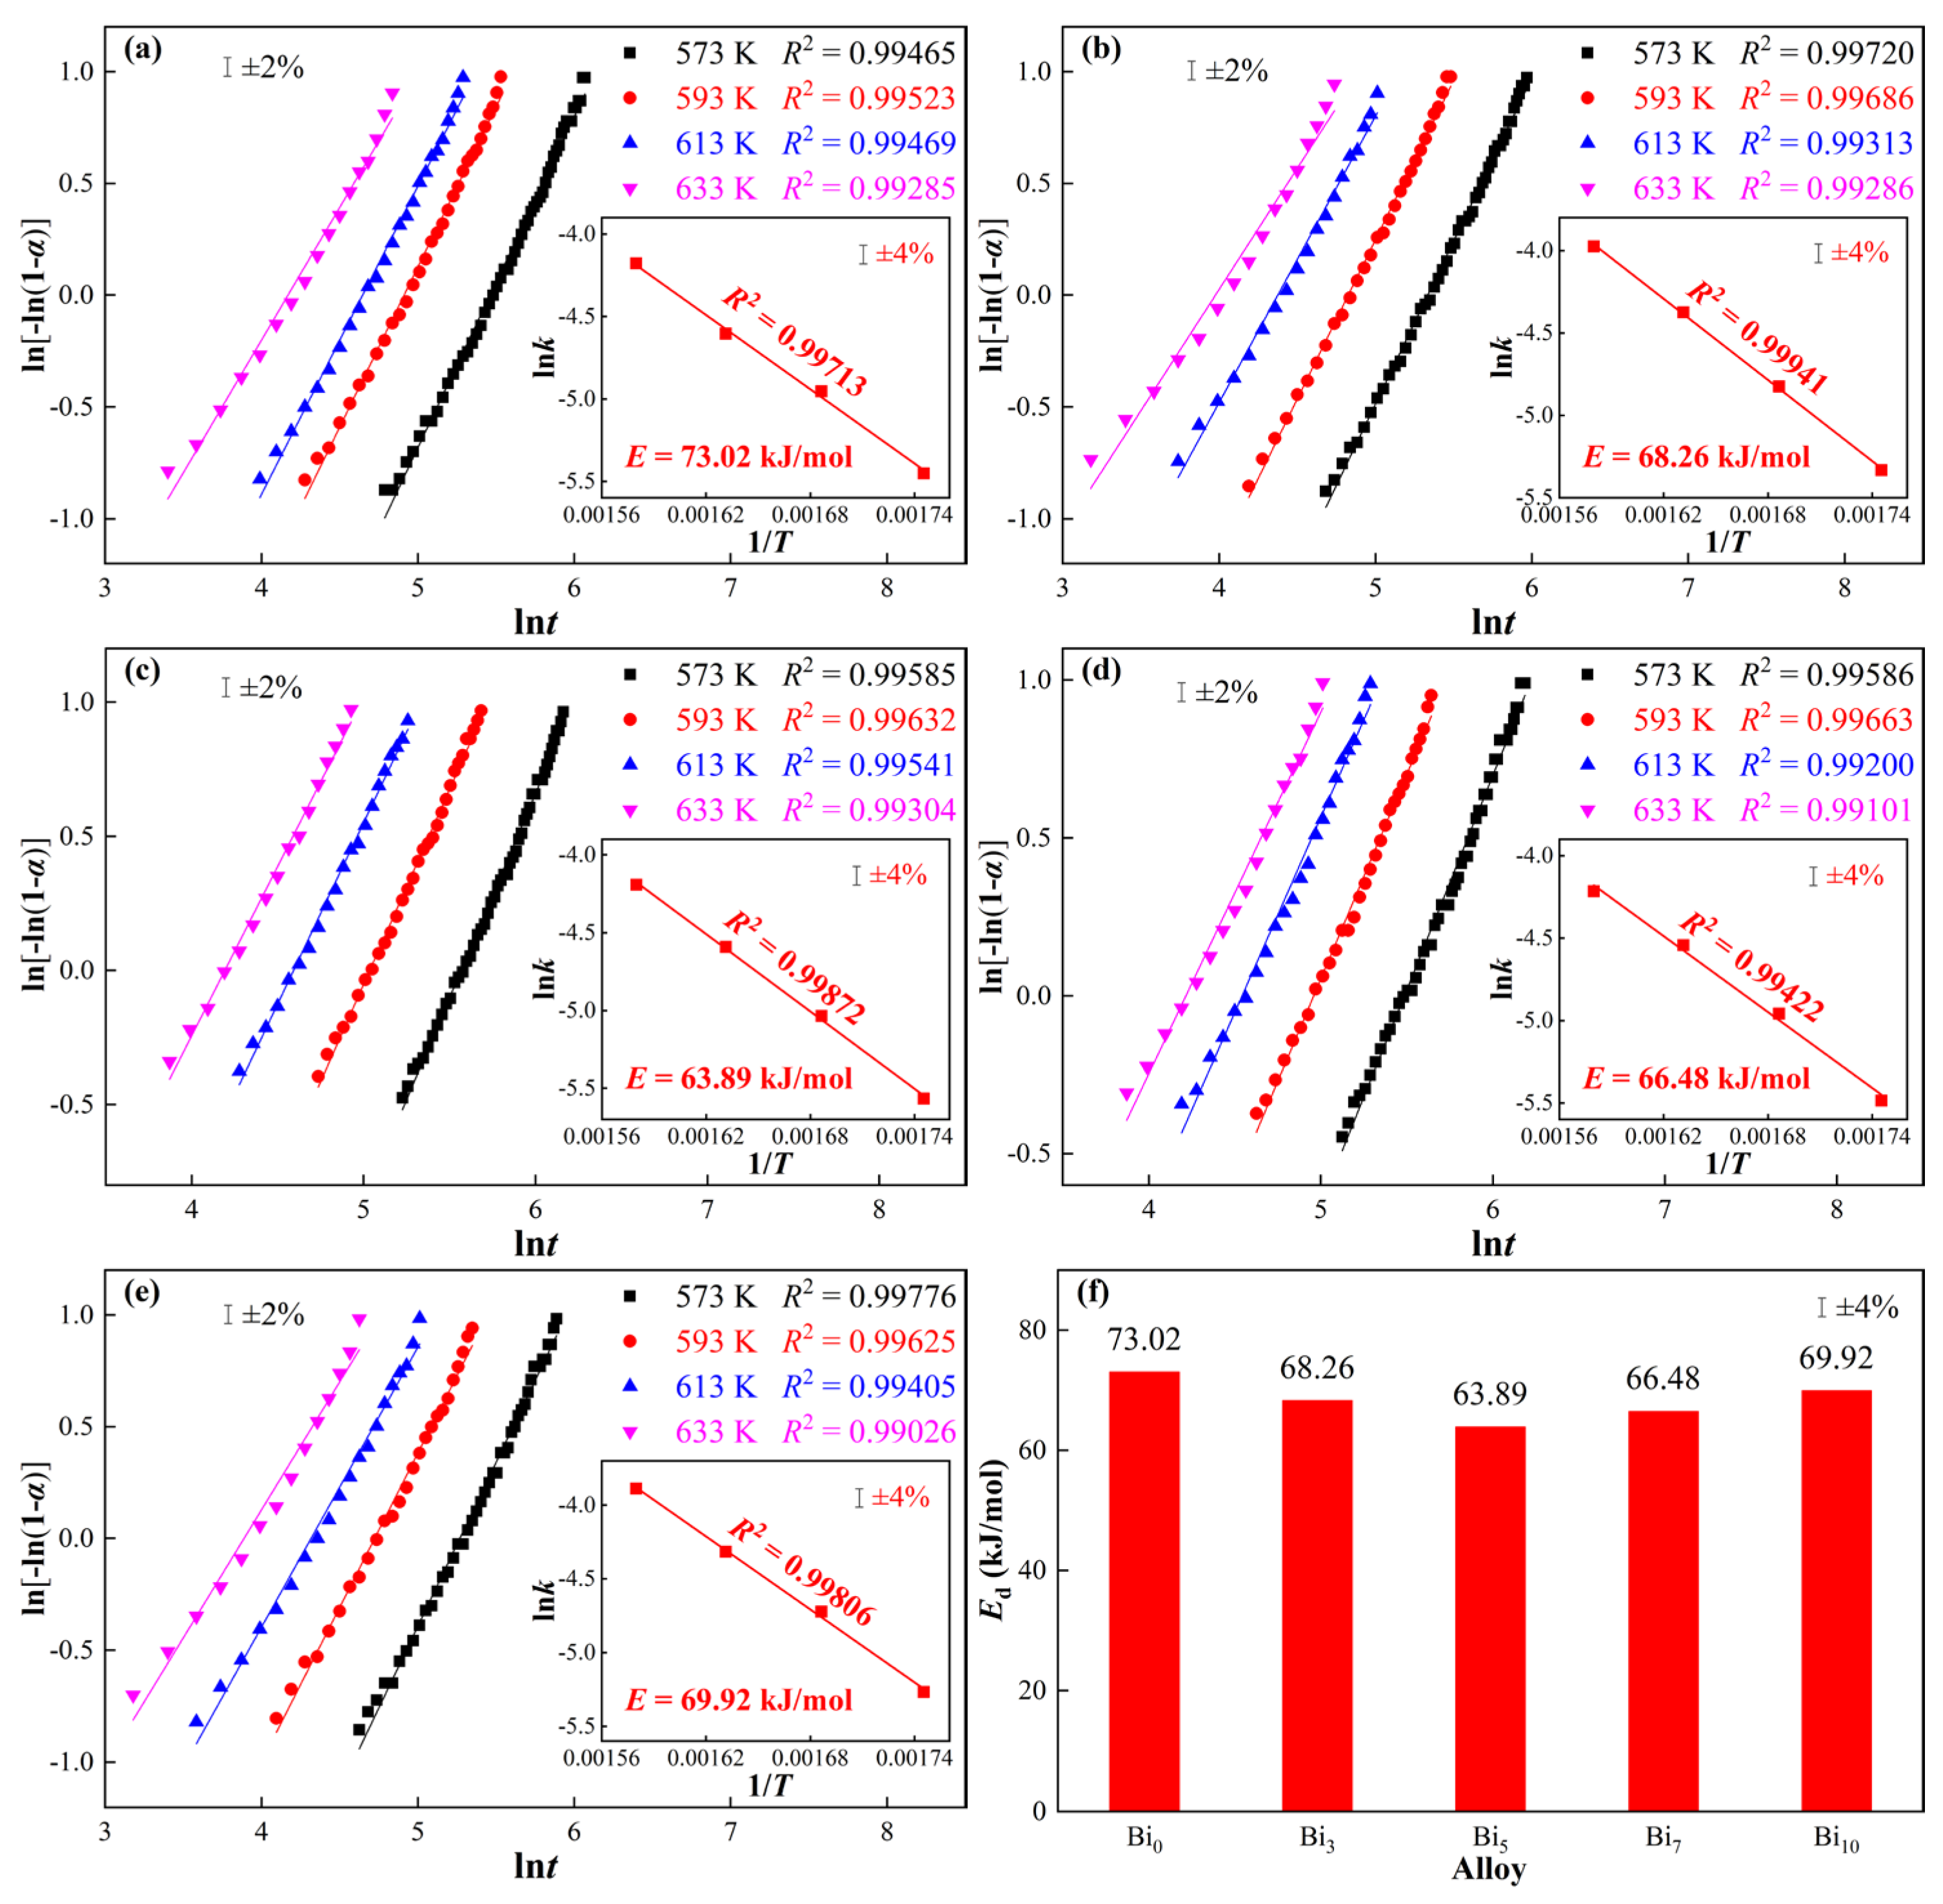
The overall energy barrier that must be overcome for a gas–solid reaction to proceed is typically characterized by the apparent activation energy. Therefore, the apparent activation energy can be regarded as the minimum energy value required for a gas–solid reaction to occur in a system. To deeply study the mechanism of the effect of Bi2O3 on the dehydrogenation kinetics of the alloy, the apparent activation energy of the dehydrogenation reaction, i.e., the dehydrogenation activation energy (Ea), is calculated through the Arrhenius method. The hydrogen desorption reaction of Mg-based alloys conforms to a nucleation and growth model, and this kind of reaction can be modeled by the JMAK theory [58], expressed as:
where α denotes the dehydrogenation reaction fraction at time t, k represents the reaction rate constant, and η is the Avrami exponent that governs the nucleation and growth mechanism of the reaction. Using the isothermal dehydrogenation data presented in Figure 10, linear regression is performed by plotting ln[−ln(1 − α)] versus lnt to generate the JMAK fitting curves, as illustrated in Figure 11. The k value at each temperature can be derived from the slope (η) and intercept (ηlnk) of these linear fits.
ln[−ln(1 − α)] = ηlnk + ηlnt
Figure 11.
JMAK fitting lines of CeMg11Ni + x wt.% Bi2O3 (x = 0, 3, 5, 7, 10) alloys: (a) Bi0, (b) Bi3, (c) Bi5, (d) Bi7, (e) Bi10; and (f) hydrogen desorption activation energy.
The relationship between the reaction rate constant k and temperature follows the Arrhenius equation [58] expressed as:
where A is the pre-exponential factor, Ea is the dehydrogenation activation energy, R is the gas constant, and T is the temperature. With the data above, the Arrhenius plots of lnk versus 1/T are constructed, which can be linearly fitted as the insets of Figure 11 show. The Ea value for each alloy can be determined from the slopes of the Arrhenius fitting lines, and the results are summarized in Figure 11f. The Ea values for Bi0, Bi3, Bi5, Bi7, and Bi10 alloys are 73.02, 68.26, 63.89, 66.48, and 69.92 kJ/mol, respectively. All of the Ea values are smaller than that of 82.14 kJ/mol of the MgH2 catalyzed by hollow Bi2Ti2O7 bimetallic oxide spheres [40].
lnk = lnA − Ea/(RT)
The Ea values exhibit a valley-shaped trend with increasing Bi2O3 content, which is in agreement with the variation in Rd2 values. This confirms that moderate Bi2O3 doping effectively lowers the dehydrogenation activation energy, while excessive doping leads to elevated Ea and deteriorates kinetics, a phenomenon closely associated with the thickness of the surface Bi2O3 coating. At low doping levels, Bi2O3 disperses uniformly across the alloy surface with fully exposed intrinsic oxygen vacancies, and synergizes efficiently with the grain boundary and phase boundary diffusion channels formed by in situ generated CeH2. This synergistic effect significantly reduces the overall energy barrier for hydrogen dissociation and diffusion, and thus enhances the dehydrogenation kinetics. In contrast, excessive Bi2O3 loading results in the formation of an overly thick surface layer that not only masks most of the oxygen vacancy active sites but also blocks the hydrogen diffusion pathways established by CeH2 and Bi2O3, just as reported by Pospísl et al. [59]. These two detrimental effects collectively impede hydrogen permeation at the alloy surface and consequently degrades the dehydrogenation performance.
3.4. Hydrogen Storage Thermodynamics
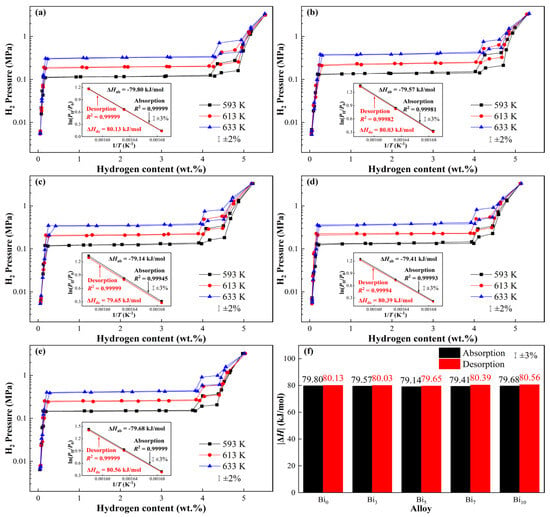
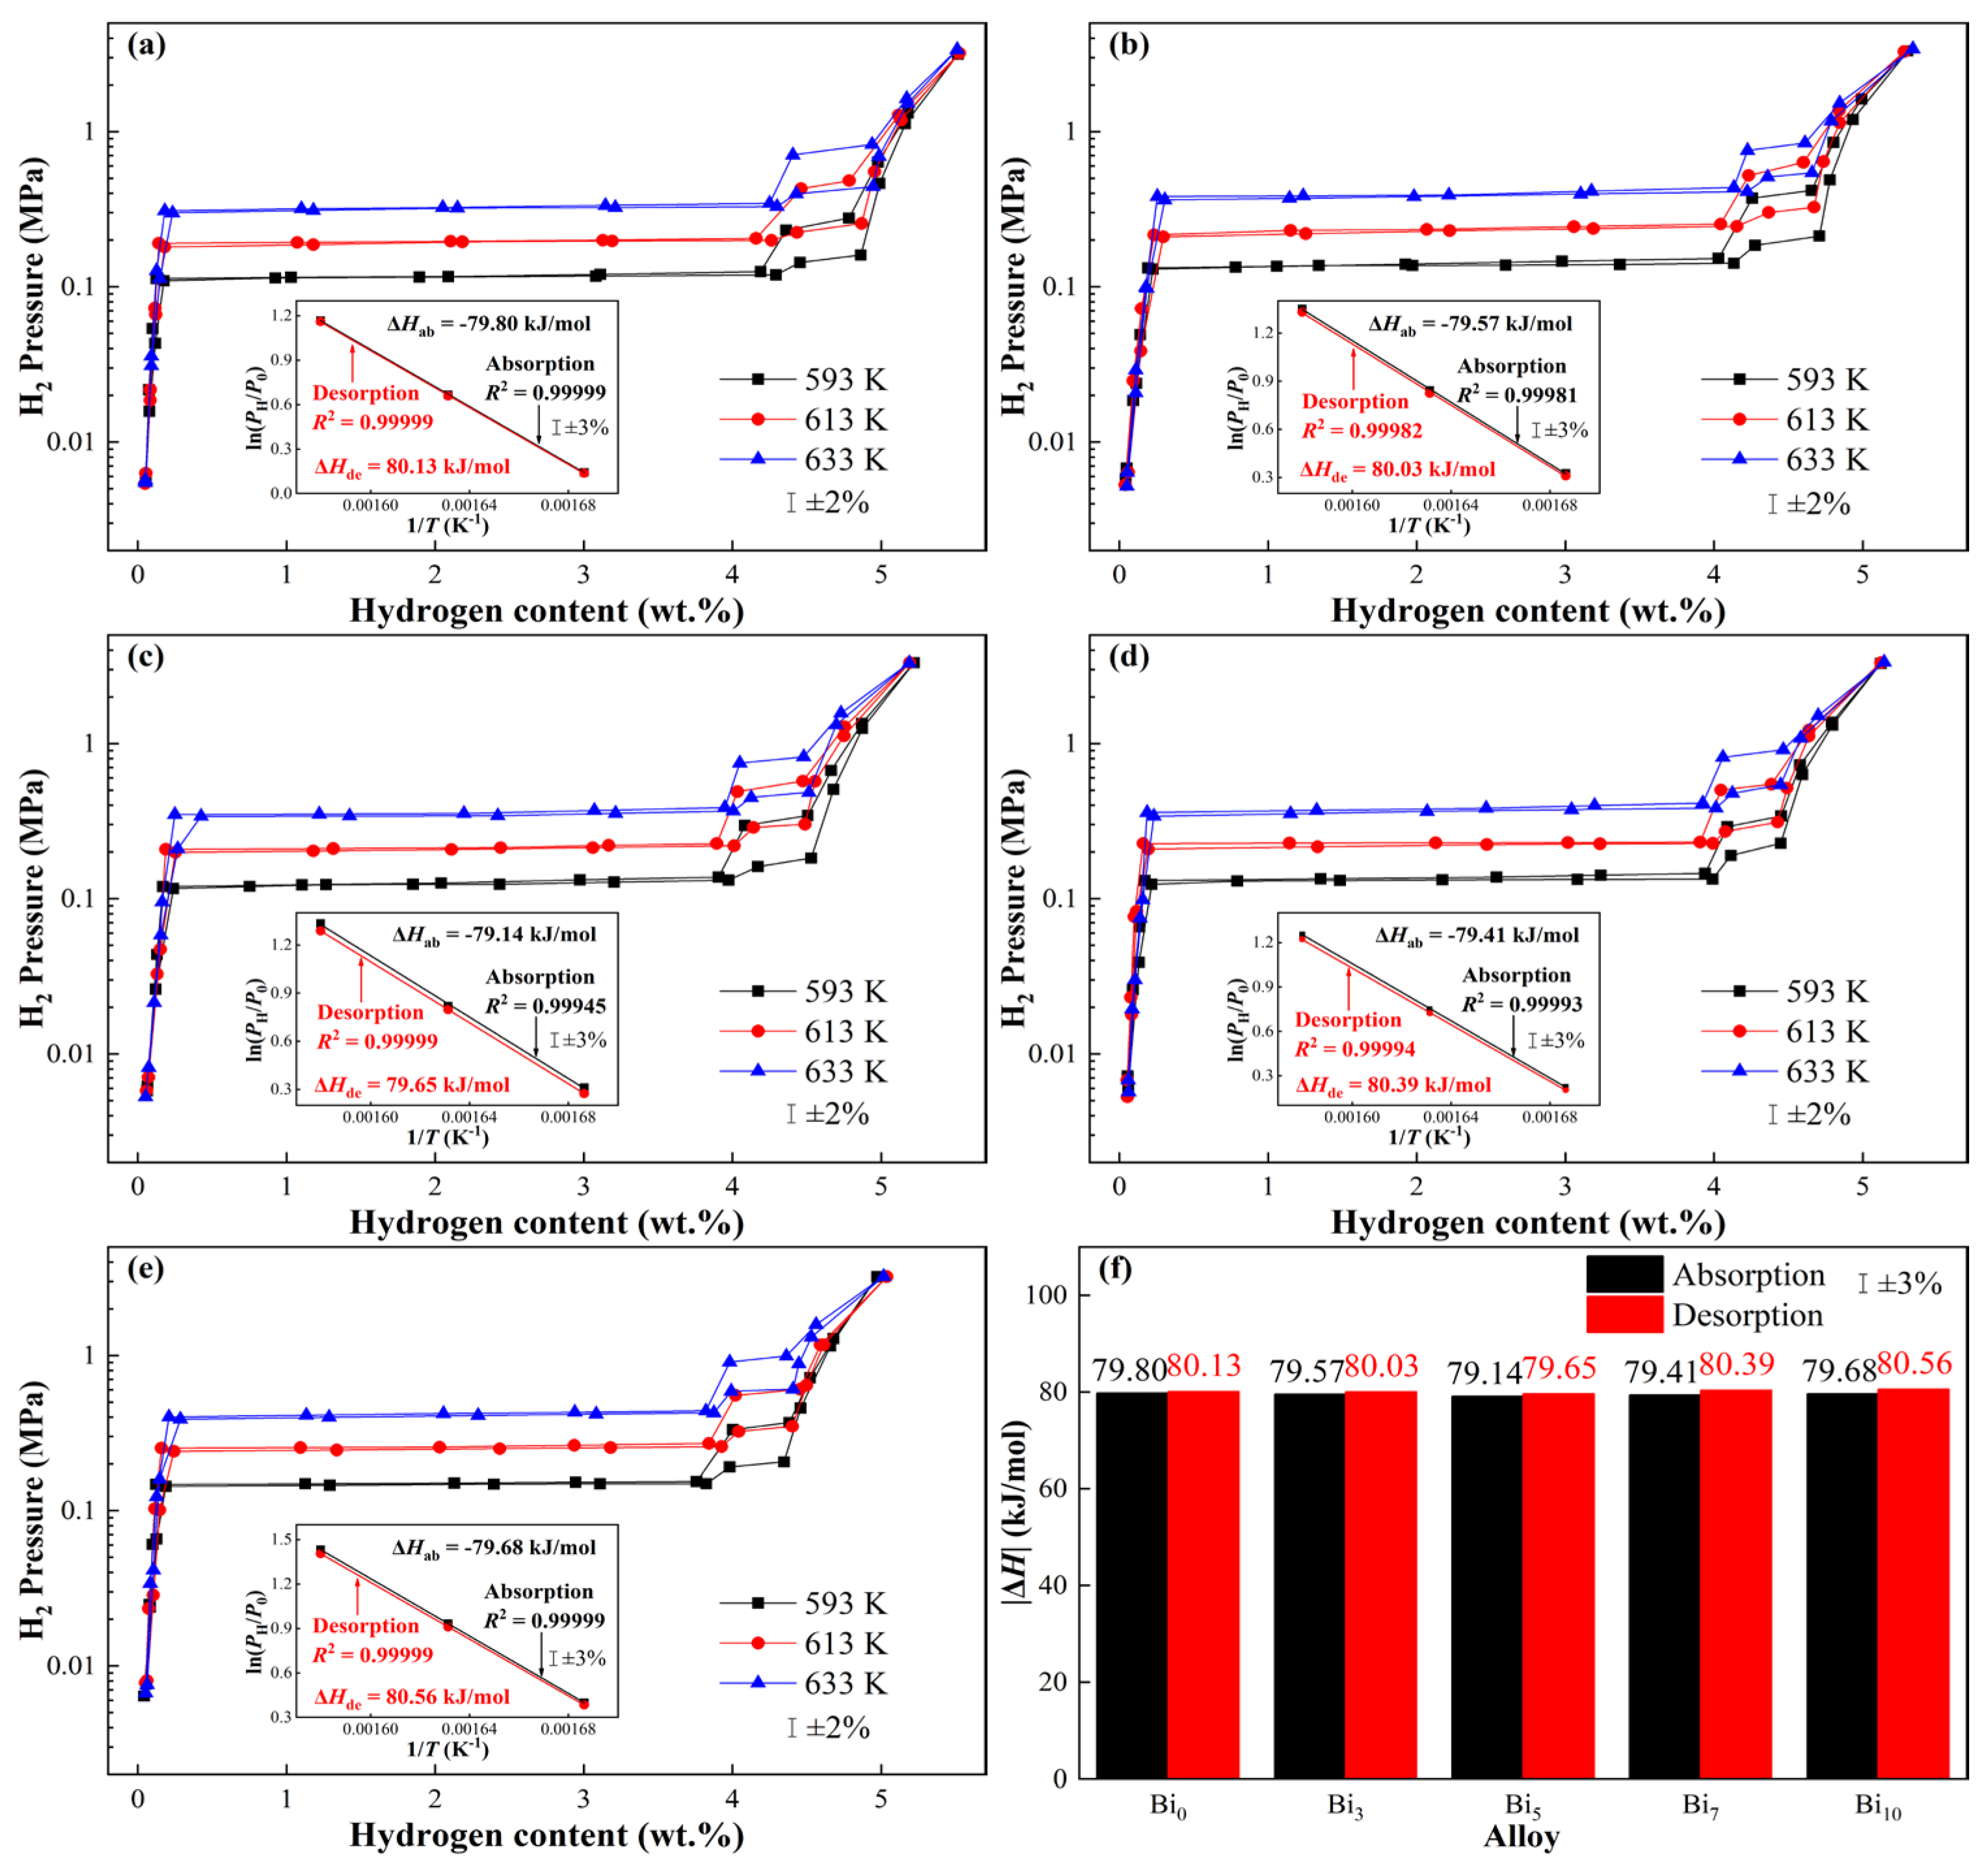
Figure 12 shows the PCT curves of CeMg11Ni + x wt.% Bi2O3 (x = 0, 3, 5, 7, 10) alloys, tested at 593, 613 and 633 K, respectively. Each PCT curve has two plateaus, where the longer and lower plateau corresponds to the reaction Mg + H2 = MgH2, and the shorter and higher plateau corresponds to the reaction Mg2Ni + H2 = Mg2NiH4. The hydrogenation and dehydrogenation hysteresis observed in the range of 4–5 wt.% is mainly related to the Mg2Ni/Mg2NiH4 phase transformations. In this range, the hydride layer is relatively thick and the resistance to hydrogen diffusion increases. Meanwhile, the stable Bi2O3 phase and in situ formed CeH2 introduce abundant heterogeneous interfaces and defect structures. These structures can facilitate hydrogen diffusion, but they may also induce local strain and interfacial energy differences during hydrogen absorption and desorption. Therefore, this hysteresis reflects the combined effects of phase transformation barriers, stress accumulation, hydride-layer diffusion resistance and heterogeneous interfaces. Given that Mg is the dominant phase in the alloy, the equilibrium pressure corresponding to the longer and lower plateau is taken as the system equilibrium pressure for calculating the hydrogen absorption and desorption thermodynamic parameters. The plateau pressures are detailed in Table 1. Van’t Hoff plots are constructed with 1/T as the horizontal axis and ln(PH/P0) as the vertical axis, which exhibit clear linear correlations as illustrated in the insets of Figure 12. Linear regression analysis is conducted on these data points to generate the corresponding Van’t Hoff fitting lines, and the enthalpy changes (ΔH) for both the hydrogenation and dehydrogenation processes are derived from the slopes of these linear fits, with the results presented in Figure 12f.
Figure 12.
PCT curves and Van’t Hoff fitting lines of CeMg11Ni + x wt.% Bi2O3 (x = 0, 3, 5, 7, 10) alloys: (a) Bi0, (b) Bi3, (c) Bi5, (d) Bi7, (e) Bi10; and (f) enthalpy changes of hydrogen absorption and desorption.
Table 1.
PCT plateau pressures of different samples at various temperatures.
The pristine Bi0 alloy exhibits a hydrogenation enthalpy change of −79.80 kJ/mol and a dehydrogenation enthalpy change of 80.13 kJ/mol. The absolute values of both hydrogenation and dehydrogenation enthalpies show a trend of initial decrease followed by subsequent increase with increasing Bi2O3 doping content. The minimum absolute enthalpy changes are achieved at the optimal doping level of 5 wt.% Bi2O3, where the dehydrogenation enthalpy change in Bi5 is reduced to 79.65 kJ/mol. The dehydrogenation enthalpy change in this work is smaller than that of 100.2 kJ/mol of La1.5Ce1.5Mg92Ni4.5Cu0.5 reported by Xu et al. [60]. Within the error range of 3% for dehydrogenation enthalpy change, Bi2O3 doping has no significant effect on the thermodynamic properties of the system. This corresponds to a mere 0.48 kJ/mol decrease compared to the undoped Bi0 sample, representing a variation amplitude of less than 1 kJ/mol. This is because the oxygen vacancies of Bi2O3 only act on the H2 dissociation stage, and the newly formed grain and phase boundaries only act on the hydrogen atom diffusion stage. No component can form chemical bonds with Mg/MgH2, and thus cannot change the inherent strength of the Mg-H bond. Therefore, they can only regulate the kinetic process and have no significant effect on the thermodynamic performance.
4. Conclusions
In the present investigation, CeMg11Ni alloy is used as the matrix, and composite alloys doped with 3–10 wt.% Bi2O3 are prepared. With multi-scale characterizations and hydrogen storage performance tests, the regulation laws of Bi2O3 on the alloy are systematically investigated, and its catalytic mechanism is clarified. The primary findings of this research are presented below:
- Ball milling yields an amorphous–nanocrystalline CeMg11Ni alloy, and Bi2O3 doping hardly changes its amorphization degree. Both Bi2O3 and in situ generated CeH2 maintain stable phases during cycling, acting as structural modifiers rather than hydrogen storage phases. They create abundant grain and phase boundaries, laying a structural foundation for catalytic enhancement.
- Increasing Bi2O3 content gradually reduces the hydrogen storage capacity. Together with MgO, Bi2O3 forms a passivation layer and delays the initial activation. Bi2O3 mainly improves the hydrogen storage kinetics: 5 wt.% is the optimal dosage, which lowers the dehydrogenation activation energy to 63.89 kJ/mol and shortens the total dehydrogenation time at 633 K to 144 s. It barely affects thermodynamics, with enthalpy variations below 1 kJ/mol and no obvious improvement on thermal stability.
- Bi2O3 improves the hydrogen storage performance via synergistic effects. Oxygen vacancies in Bi2O3 accelerate H2 dissociation, while grain/phase boundaries serve as rapid hydrogen diffusion paths. Excess Bi2O3 forms a thick coating that covers active sites and blocks diffusion channels, thus deteriorating the catalytic effect.
Author Contributions
W.Z.: conceptualization, methodology, validation, writing—original draft preparation, and funding acquisition; Z.Z. and X.L.: investigation, validation, and data curation; A.D.: supervision and funding acquisition; H.W.: project administration; Y.Z.: conceptualization, supervision, and writing—review and editing. All authors have read and agreed to the published version of the manuscript.
Funding
This research and APC were funded by Natural Science Foundation of Ningxia (2024AAC03074) and Climbing Program of Helanshan Laboratory (HLS-2025-PDJH-009).
Data Availability Statement
The original contributions presented in the study are included in the article; further inquiries can be directed to the corresponding author.
Acknowledgments
The authors acknowledge the Natural Science Foundation of Ningxia and Climbing Program of Helanshan Laboratory for the financial support necessary to carry out this research.
Conflicts of Interest
The authors declare no conflicts of interest.
Abbreviations
The following abbreviations are used in this manuscript:
| RE | Rare Earth |
| ALD | Atomic Layer Deposition |
| XRD | X-Ray Diffractometer |
| SEM | Scanning Electron Microscope |
| EDS | Energy Dispersive Spectrometer |
| TEM | Transmission Electron Microscope |
| HRTEM | High-Resolution Transmission Electron Microscopy |
| SAED | Selected Area Electron Diffraction |
| JMAK | Johnson–Mehl–Avrami–Kolmogorov |
| Ra5 | 5 min Hydrogen Absorption Fraction |
| C5 | Hydrogen Absorption Capacity in 5 Minutes |
| Cmax | Saturated Hydrogen Absorption Capacity |
| Rd2 | 2 min Hydrogen Desorption Fraction |
| D2 | Hydrogen Desorption Capacity in 2 Minutes |
| Dmax | Maximum Dehydrogenation Capacity |
| Ea | Dehydrogenation Activation Energy |
| PH | Equilibrium Hydrogen Pressure |
| P0 | Standard Pressure |
References
- Le, P.-A.; Dinh Trung, V.; Long Nguyen, P.; Phung, T.V.B.; Natsuki, J.; Natsuki, T. The Current Status of Hydrogen Energy: An Overview. RSC Adv. 2023, 13, 28262–28287. [Google Scholar] [CrossRef] [Scilit] [PubMed]
- Gu, Y.; Pan, D.; Yang, N.; Wang, X. Research on Storage and Transportation Cost Control and Technological Breakthroughs from the Perspective of Global Hydrogen Energy Development. J. Sustain. Built Environ. 2025, 2, 33–38. [Google Scholar] [CrossRef] [Scilit]
- Xu, Y.; Zhou, Y.; Li, Y.; Ding, Z. Research Progress and Application Prospects of Solid-State Hydrogen Storage Technology. Molecules 2024, 29, 1767. [Google Scholar] [CrossRef] [Scilit] [PubMed]
- Ledwaba, K.; Karimzadeh, S.; Jen, T.-C. Enhancement in the Hydrogen Storage Capability of Borophene through Yttrium Doping: A Theoretical Study. J. Energy Storage 2022, 55, 105500. [Google Scholar] [CrossRef] [Scilit]
- Mehr, A.S.; Phillips, A.D.; Brandon, M.P.; Pryce, M.T.; Carton, J.G. Recent Challenges and Development of Technical and Technoeconomic Aspects for Hydrogen Storage, Insights at Different Scales; A State of Art Review. Int. J. Hydrogen Energy 2024, 70, 786–815. [Google Scholar] [CrossRef] [Scilit]
- Wang, H.; Li, J.; Wei, X.; Zheng, Y.; Yang, S.; Lu, Y.; Ding, Z.; Luo, Q.; Li, Q.; Pan, F. Thermodynamic and Kinetic Regulation for Mg-Based Hydrogen Storage Materials: Challenges, Strategies, and Perspectives. Adv. Funct. Mater. 2024, 34, 2406639. [Google Scholar] [CrossRef] [Scilit]
- Zhang, J.; Liu, M.; Qi, J.; Lei, N.; Guo, S.; Li, J.; Xiao, X.; Ouyang, L. Advanced Mg-Based Materials for Energy Storage: Fundamental, Progresses, Challenges and Perspectives. Prog. Mater. Sci. 2025, 148, 101381. [Google Scholar] [CrossRef] [Scilit]
- Yadav, Y.K.; Shaz, M.A.; Yadav, T.P. Al–Cu–Fe–Ni–Ti High Entropy Alloy Nanoparticles as New Catalyst for Hydrogen Sorption in MgH2. Int. J. Hydrogen Energy 2025, 137, 1137–1147. [Google Scholar] [CrossRef] [Scilit]
- Verma, S.K.; Abu Shaz, M.; Yadav, T.P. Introducing 2D Layered WS2 and MoS2 as an Active Catalyst to Enhance the Hydrogen Storage Properties of MgH2. Int. J. Hydrogen Energy 2024, 87, 1035–1046. [Google Scholar] [CrossRef] [Scilit]
- Zhang, R.-L.; Li, J.-B.; Lu, H.; Nie, K.-Y.; Li, H.-Y.; Zhang, E.-N.; Qiang, Z.-H.; Liu, B.-Y.; Chen, Y.-A.; Pan, F.-S. Synergistic enhancement of hydrogen storage thermodynamic and kinetic performances in Mg–La–Ce alloys via Ti particle doping. Rare Met. 2025, 44, 10837–10850. [Google Scholar] [CrossRef] [Scilit]
- Sui, J.-Y.; Jiang, W.; Si, N.; Wang, Z.; Cao, Z. Hydrogen Storage Kinetics of TiH2/ZrCl4 Catalyst Based on MgH2. Int. J. Hydrogen Energy 2025, 134, 10–17. [Google Scholar] [CrossRef] [Scilit]
- Sun, B.; Li, X.; Zhang, G.; Zhou, Y.; Yao, Y.; Ni, S.; Xue, K. Investigation on the Effect of Al Addition on Hydrogen Storage Properties of Mg85Ni15-xAlx Alloy. Int. J. Hydrogen Energy 2025, 170, 151249. [Google Scholar] [CrossRef] [Scilit]
- Kajiwara, K.; Sugime, H.; Noda, S.; Hanada, N. Fast and Stable Hydrogen Storage in the Porous Composite of MgH2 with Nb2O5 Catalyst and Carbon Nanotube. J. Alloys Compd. 2022, 893, 162206. [Google Scholar] [CrossRef] [Scilit]
- Zhang, X.; Zhang, X.; Zhang, L.; Huang, Z.; Yang, L.; Gao, M.; Gu, C.; Sun, W.; Pan, H.; Liu, Y. Nb2O5 Nanostructures as Precursors of Cycling Catalysts for Hydrogen Storage in MgH2. ACS Appl. Nano Mater. 2023, 6, 14527–14539. [Google Scholar] [CrossRef] [Scilit]
- Yang, J.; Shi, W.; Liu, R.; Tan, Y.; Fan, Y.; Qing, P.; Liu, H.; Guo, J.; Lan, Z. MXene-Supported V2O5 Nanocatalysts: Boosting Hydrogen Storage Efficiency in MgH2 through Synergistic Catalysis. J. Energy Storage 2025, 130, 117474. [Google Scholar] [CrossRef] [Scilit]
- Ren, L.; Li, Y.; Li, Z.; Lin, X.; Lu, C.; Ding, W.; Zou, J. Boosting Hydrogen Storage Performance of MgH2 by Oxygen Vacancy-Rich H-V2O5 Nanosheet as an Excited H-Pump. Nano-Micro Lett. 2024, 16, 160. [Google Scholar] [CrossRef] [Scilit] [PubMed]
- Zhang, Y.; Zhang, W.; Wei, X.; Yuan, Z.; Gao, J.; Guo, S.; Ren, H. Catalytic Effects of TiO2 on Hydrogen Storage Thermodynamics and Kinetics of the As-Milled Mg-Based Alloy. Mater. Charact. 2021, 176, 111118. [Google Scholar] [CrossRef] [Scilit]
- Shao, Y.; Gao, H.; Tang, Q.; Liu, Y.; Liu, J.; Zhu, Y.; Zhang, J.; Li, L.; Hu, X.; Ba, Z. Ultra-Fine TiO2 Nanoparticles Supported on Three-Dimensionally Ordered Macroporous Structure for Improving the Hydrogen Storage Performance of MgH2. Appl. Surf. Sci. 2022, 585, 152561. [Google Scholar] [CrossRef] [Scilit]
- Tome, K.C.; Xi, S.; Fu, Y.; Lu, C.; Lu, N.; Guan, M.; Zhou, S.; Yu, H. Remarkable Catalytic Effect of Ni and ZrO2 Nanoparticles on the Hydrogen Sorption Properties of MgH2. Int. J. Hydrogen Energy 2022, 47, 4716–4724. [Google Scholar] [CrossRef] [Scilit]
- Friedrichs, O.; Martínez-Martínez, D.; Guilera, G.; Sánchez López, J.C.; Fernández, A. In Situ Energy-Dispersive XAS and XRD Study of the Superior Hydrogen Storage System MgH2/Nb2O5. J. Phys. Chem. C 2007, 111, 10700–10706. [Google Scholar] [CrossRef] [Scilit]
- Pukazhselvan, D.; Çaha, I.; IV Holz, L.; Deepak, F.L.; Kristensen, P.K.; Checchetto, R.; Blaabjerg, F.; Fagg, D.P. Catalytically Driven Hydrogen Storage in Magnesium Hydride through Its Chemical Interaction with the Additive Vanadium Pentoxide. Int. J. Hydrogen Energy 2024, 59, 755–763. [Google Scholar] [CrossRef] [Scilit]
- Chen, Y.; Shao, Y.; Liu, Y.; Gao, H.; Tang, Q.; Zhu, Y.; Zhang, J.; Wang, J.; Li, L.; Hu, X. Catalysis Derived from Three-Dimensionally Ordered Macroporous Nb2O5 towards the Hydrogen Storage Performance of Magnesium Hydride. Fuel 2024, 364, 131025. [Google Scholar] [CrossRef] [Scilit]
- Song, W.; Ma, W.; He, S.; Chen, W.; Shen, J.; Sun, D.; Wei, Q.; Yu, X. TiO2@C Catalyzed Hydrogen Storage Performance of Mg-Ni-Y Alloy with LPSO and Ternary Eutectic Structure. J. Magnes. Alloys 2024, 12, 767–778. [Google Scholar] [CrossRef] [Scilit]
- Lu, H.; Li, J.; Lu, Y.; Chen, Y.; Xie, T.; Zhou, X.; Li, Q.; Pan, F. ZrO2@Nb2CTx Composite as the Efficient Catalyst for Mg/MgH2 Based Reversible Hydrogen Storage Material. Int. J. Hydrogen Energy 2022, 47, 38282–38294. [Google Scholar] [CrossRef] [Scilit]
- Ren, L.; Zhu, W.; Li, Y.; Lin, X.; Xu, H.; Sun, F.; Lu, C.; Zou, J. Oxygen Vacancy-Rich 2D TiO2 Nanosheets: A Bridge Toward High Stability and Rapid Hydrogen Storage Kinetics of Nano-Confined MgH2. Nano-Micro Lett. 2022, 14, 144. [Google Scholar] [CrossRef] [Scilit] [PubMed]
- Sun, W.; Zhang, X.; Li, J.; Cao, Z.; Feng, D.; Peng, J.; Qi, Y.; Zhao, D.; Zhang, Y. Catalytic Effect of TiF3 on Hydrogenation and Dehydrogenation of Mg-Based Hydrogen Storage Alloy Prepared by Milling. J. Phys. Chem. Solids 2025, 201, 112626. [Google Scholar] [CrossRef] [Scilit]
- Xia, T.; Hu, F.; Duan, Y.; Li, Y.; Zhao, X.; Zhu, J.; Li, R. Effect of NbF5 on Hydrogen Absorption and Desorption Properties of PrMg12/Ni Alloy. Int. J. Hydrogen Energy 2024, 89, 215–223. [Google Scholar] [CrossRef] [Scilit]
- Lv, Y.; Zhang, B.; Huang, H.; Liu, B.; Lv, W.; Yuan, J.; Xia, G.; Yu, X.; Sun, D.; Wu, Y. Niobium Fluoride-Modified Hydrogen Evolution Reaction of Magnesium Borohydride Diammoniate. J. Mater. Sci. Technol. 2023, 156, 197–205. [Google Scholar] [CrossRef] [Scilit]
- Yao, J.; Yong, H.; Zhao, Y.; Sun, C.; Xu, X.; Liu, B.; Zhao, D.; Hu, J.; Zhang, Y. Study on in Situ Modification Mechanism of Mg-Ce-Y Based Hydrogen Storage Alloy by ZnF2. Mater. Charact. 2023, 202, 113027. [Google Scholar] [CrossRef] [Scilit]
- Xi, S.; Wang, X.; Tome, K.C.; Zhang, T.; Han, Z.; Gao, M.; Zhou, S.; Yu, H. Hydrogen Release: In-Situ Calorimetry Studies of NaBH4+2MgH2 Doped by ZrF4. Int. J. Hydrogen Energy 2021, 46, 922–929. [Google Scholar] [CrossRef] [Scilit]
- Zhu, Y.; Ma, W.; Chai, X.; Gu, Y.; Wu, W.; Chen, H.; Zhang, T. Advances in Catalysts for Magnesium-Based Hydrogen Storage Materials. Research 2025, 22, 1036. [Google Scholar] [CrossRef] [Scilit]
- Lang, C.; Yao, X. Enhancing Hydrogen Storage Performance of Magnesium-Based Materials: A Review on Nanostructuring and Catalytic Modification. J. Magnes. Alloys 2025, 13, 510–538. [Google Scholar] [CrossRef] [Scilit]
- Yong, H.; Chen, Y.; Ji, Y.; Wang, S.; Ma, J.; Liu, B.; Hu, J.; Zhang, Y. In-Situ Influence of TiF3 Catalyst on the Hydrogen Storage Behavior of Mg-Ni-Y Based Alloy. J. Energy Storage 2024, 77, 110022. [Google Scholar] [CrossRef] [Scilit]
- Yuan, Z.; Sui, Y.; Zhai, T.; Yin, Y.; Luo, L.; Feng, D. Influence of CeO2 Nanoparticles on Microstructure and Hydrogen Storage Performance of Mg-Ni-Zn Alloy. Mater. Charact. 2021, 178, 111248. [Google Scholar] [CrossRef] [Scilit]
- Liu, J.; Tang, Q.; Zhu, Y.; Liu, Y.; Zhang, J.; Ba, Z.; Hu, X.; Li, L. Assisting Ni Catalysis by CeO2 with Oxygen Vacancy to Optimize the Hydrogen Storage Properties of MgH2. J. Mater. Sci. Technol. 2023, 159, 62–71. [Google Scholar] [CrossRef] [Scilit]
- Zhang, Y.; Wei, X.; Zhang, W.; Yuan, Z.; Gao, J.; Ren, H. Catalytic Effect Comparison of TiO2 and La2O3 on Hydrogen Storage Thermodynamics and Kinetics of the As-Milled La-Sm-Mg-Ni-Based Alloy. J. Magnes. Alloys 2021, 9, 2063–2077. [Google Scholar] [CrossRef] [Scilit]
- Wang, S.; Jin, C.; Zheng, H.; Che, H.; Wang, L.; Zhao, Y.; Liu, H.; Wang, X.; Yan, M. Improving Hydrogen Storage Performance of MgH2 by LaNi0.8Co0.2O3 Synthesized via Sol-Gel Technique. Int. J. Hydrogen Energy 2026, 206, 153385. [Google Scholar] [CrossRef] [Scilit]
- Pukazhselvan, D.; Çaha, I.; Jakka, S.K.; Graça, V.C.D.; Holz, L.I.V.; Soares, M.J.; Kovalevsky, A.V.; Deepak, F.L.; Fagg, D.P. Catalysis of Ceria Incorporated Magnesium Hydride: A Follow up Study. Int. J. Hydrogen Energy 2022, 47, 28978–28992. [Google Scholar] [CrossRef] [Scilit]
- Yu, Z.; Zhang, W.; Zhang, Y.; Fu, Y.; Cheng, Y.; Guo, S.; Li, Y.; Han, S. Remarkable Kinetics of Novel Ni@CeO2–MgH2 Hydrogen Storage Composite. Int. J. Hydrogen Energy 2022, 47, 35352–35364. [Google Scholar] [CrossRef] [Scilit]
- Yang, X.; Wang, X.; Liu, R.; Liu, Y.; Li, Z.; Cui, W.; Qi, F.; Yang, Y.; Chen, J.; Pan, H. Enhancing Hydrogen Storage Performance of MgH2 with Hollow Bi2Ti2O7 Catalyst: Synergistic Effects of Bi2Mg3 Alloy Phase and Ti Polyvalency. J. Magnes. Alloys 2025, 13, 6154–6166. [Google Scholar] [CrossRef] [Scilit]
- Jubair, A.; Rahman, M.A.; Khan, M.M.R.; Rahman, M.W. Catalytic Role of Binary Oxides (CuO and Al2O3) on Hydrogen Storage in MgH2. Environ. Prog. Sustain. Energy 2023, 42, e13940. [Google Scholar] [CrossRef] [Scilit]
- Bu, F.; Wang, Z.; Wajid, A.; Zhai, R.; Liu, T.; Li, Y.; Ji, X.; Liu, X.; Ding, S.; Cheng, Y.; et al. Solid–State Hydrogen Storage Materials with Excellent Selective Hydrogen Adsorption in the Presence of Alkanes, Oxygen, and Carbon Dioxide by Atomic Layer Amorphous Al2O3 Encapsulation. Nano-Micro Lett. 2025, 18, 78. [Google Scholar] [CrossRef] [Scilit] [PubMed]
- Leick, N.; Strange, N.A.; Schneemann, A.; Stavila, V.; Gross, K.; Washton, N.; Settle, A.; Martinez, M.B.; Gennett, T.; Christensen, S.T. Al2O3 Atomic Layer Deposition on Nanostructured γ-Mg(BH4)2 for H2 Storage. ACS Appl. Energy Mater. 2021, 4, 1150–1162. [Google Scholar] [CrossRef] [Scilit]
- Huang, R.Z.; Wei, Y.Y.; Gao, T.F.; Li, C.M.; Jiang, C.H. Structure and Electronic Properties of δ-Bi2O3 Tuned by Vacancy and Doping: A First-Principles Study. Ceram. Int. 2021, 47, 205–213. [Google Scholar] [CrossRef] [Scilit]
- Sanna, S.; Esposito, V.; Andreasen, J.W.; Hjelm, J.; Zhang, W.; Kasama, T.; Simonsen, S.B.; Christensen, M.; Linderoth, S.; Pryds, N. Enhancement of the Chemical Stability in Confined δ-Bi2O3. Nat. Mater. 2015, 14, 500–504. [Google Scholar] [CrossRef] [Scilit] [PubMed]
- Gandhi, A.C.; Cheng, C.-L.; Wu, S.Y. Structural and Enhanced Optical Properties of Stabilized γ–Bi2O3 Nanoparticles: Effect of Oxygen Ion Vacancies. Nanomaterials 2020, 10, 1023. [Google Scholar] [CrossRef] [Scilit] [PubMed]
- Wang, Y.; Xia, Y.; Xu, E.; Xiang, C.; Qing, X.; Yang, Z.; Xu, F.; Sun, L.; Chua, Y.S.; Zou, Y. Graphene Oxide Supported Oxygen Vacancy-Rich Co3O4 and Ni Nanoparticle for Boosting the Hydrogen Storage Properties of MgH2. J. Magnes. Alloys 2026, 14, 101634. [Google Scholar] [CrossRef] [Scilit]
- Wang, H.; Sun, J.; Shang, H. Breaking Kinetic and Thermodynamic Barriers: CeO2-Ni-rGO Synergistic Catalysis for Comprehensively Enhanced Hydrogen Storage Performance of MgH2. J. Alloys Compd. 2026, 1052, 186167. [Google Scholar] [CrossRef] [Scilit]
- Gao, H.; Song, M.; Zhao, B.; Liu, J.; Shi, R.; Liu, Y.; Hu, X.; Zhu, Y. Assisting Molybdenum Trioxide Catalysis by Engineering Oxygen Vacancy for Enhancing Hydrogen Storage Performance of Magnesium Hydride. J. Colloid Interface Sci. 2025, 678, 343–352. [Google Scholar] [CrossRef] [Scilit] [PubMed]
- Rathi, B.; Agarwal, S.; Shrivastava, K.; Kumar, M.; Jain, A. Recent Advances in Designing Metal Oxide-Based Catalysts to Enhance the Sorption Kinetics of Magnesium Hydride. Int. J. Hydrogen Energy 2024, 53, 131–162. [Google Scholar] [CrossRef] [Scilit]
- Jiang, H.; Ding, Z.; Li, Y.; Lin, G.; Li, S.; Du, W.; Chen, Y.; Shaw, L.L.; Pan, F. Hierarchical Interface Engineering for Advanced Magnesium-Based Hydrogen Storage: Synergistic Effects of Structural Design and Compositional Modification. Chem. Sci. 2025, 16, 7610–7636. [Google Scholar] [CrossRef] [Scilit] [PubMed]
- Surrey, A.; Schultz, L.; Rellinghaus, B. Electron Beam Induced Dehydrogenation of MgH2 Studied by VEELS. Adv. Struct. Chem. Imaging 2016, 2, 7. [Google Scholar] [CrossRef] [Scilit]
- Chen, X.; Zou, W.; Lin, Q.; Li, R.; Xia, G.; Yu, X. The Effect of Oxygen Coverages on Hydrogenation of Mg (0001) Surface. Appl. Surf. Sci. 2019, 487, 510–518. [Google Scholar] [CrossRef] [Scilit]
- Wang, X.; Liu, M.; Tian, T.; Liu, F.; Wang, J.; Li, J.; Liu, G. Fibrous V/Nb Bimetallic Oxides with Remarkable Catalytic Effect on Hydrogen Storage Properties of MgH2. Int. J. Hydrogen Energy 2025, 97, 1168–1176. [Google Scholar] [CrossRef] [Scilit]
- Liu, J.; Meng, Y.; Zhang, Z.; Zhang, F. Synergistic Catalytic Effects of Yb2O3@C, Gd2O3@C, and CeO2@C on Mg–La–Ni Alloys’ Hydrogen Storage Properties. Langmuir 2025, 41, 31114–31123. [Google Scholar] [CrossRef] [Scilit] [PubMed]
- Yong, H.; Wei, X.; Zhang, K.; Wang, S.; Zhao, D.; Hu, J.; Zhang, Y. Characterization of Microstructure, Hydrogen Storage Kinetics and Thermodynamics of Ball-Milled Mg90Y1.5Ce1.5Ni7 Alloy. Int. J. Hydrogen Energy 2021, 46, 17802–17813. [Google Scholar] [CrossRef] [Scilit]
- Duan, X.-Q.; Li, G.-X.; Zhang, W.-H.; Luo, H.; Tang, H.-M.; Xu, L.; Sheng, P.; Wang, X.-H.; Huang, X.-T.; Huang, C.-K.; et al. Ti3AlCN MAX for Tailoring MgH2 Hydrogen Storage Material: From Performance to Mechanism. Rare Met. 2023, 42, 1923–1934. [Google Scholar] [CrossRef] [Scilit]
- Lyu, J.; Kudiiarov, V.; Lider, A. Experimentally Observed Nucleation and Growth Behavior of Mg/MgH2 during De/Hydrogenation of MgH2/Mg: A Review. Materials 2022, 15, 8004. [Google Scholar] [CrossRef] [Scilit] [PubMed]
- Pospísil, M. Physico-Chemical Properties of CuO−Bi2O3 Mixed Oxides and Modification of Their Hydrogen Reduction Reactivity by Ionizing Radiation. J. Therm. Anal. 1995, 44, 133–146. [Google Scholar] [CrossRef] [Scilit]
- Xu, J.; Wang, L.; Xu, Y.; Guo, S.; Zhang, W.; Liu, J.; Li, B.; Sun, H.; Qi, Y.; Zhang, Y.; et al. Enhanced Hydrogen Storage Properties of RE-Mg-Based Alloys by Doping Cu. Int. J. Hydrogen Energy 2025, 177, 151570. [Google Scholar] [CrossRef] [Scilit]

Disclaimer/Publisher’s Note: The statements, opinions and data contained in all publications are solely those of the individual author(s) and contributor(s) and not of MDPI and/or the editor(s). MDPI and/or the editor(s) disclaim responsibility for any injury to people or property resulting from any ideas, methods, instructions or products referred to in the content. |
© 2026 by the authors. Licensee MDPI, Basel, Switzerland. This article is an open access article distributed under the terms and conditions of the Creative Commons Attribution (CC BY) license.