


Abstract
Although austenitic steels have been implemented in direct liquid hydrogen (LH2) contact for decades, detailed microstructural and mechanical studies are still rare at a temperature of 20 K and inexistent for long-term exposure in LH2. Therefore, austenitic stainless-steel parts, which were in direct contact with LH2, from a container for LH2 transport from the company Linde GmbH that has been in service for over 30 years, was chosen as a material model system for this investigation. In the present work, the possible influence of cryogenic gaseous and liquid H2 (GH2 and LH2) on the micro- and macroscopic as well as mechanical properties of the container was investigated. Monitoring the properties after long-term GH2 and LH2-exposed material assesses the durability and the failure characteristics of these austenitic steels. A mean content of 2.5 ppm H was detected in the container walls after the long-term exposure. The microhardness of the long-term GH2 and LH2 are similar to an H2 non-exposed sample. Based on the SEM investigations, no microstructural change could be detected in the material after long-term H2 exposure and the residual tensile properties are still similar to those of ‘fresh’ non-exposed material. The hydrogen embrittlement (HE) occurred in the container material only after additional thermal H-charging, where the ductility reduced to about 50% at 200 K.
1. Introduction
Stainless steel (SS) is commonly used due to its excellent corrosion resistance [1,2], mechanical properties [3,4,5], and performance at cryogenic temperatures [6,7,8,9,10]. However, its behavior after long-term service, particularly after decades of use in extreme environments like LH2, is rarely investigated. The LH2 transportation systems, e.g., LH2 containers, must withstand harsh environments such as cryogenic temperature and pressure, which raises concerns about material performance over time. These containers experience significant temperature cycles, from ambient to cryogenic and extended exposure to low temperatures, and were designed for 3 × 10⁵ pressure cycles. Limited data exists on how stainless steels perform in these conditions, particularly in the presence of liquid hydrogen [11]. For decades, several attempts have been made to establish the storage of hydrogen in the liquid phase. So far, the studies for liquid hydrogen storage materials are less available compared to those for gaseous hydrogen storage [12,13,14,15,16,17]. However, companies like Linde GmbH have successfully produced and transported liquid hydrogen for decades now and further optimize processes and materials for transportation [18,19,20]. As hydrogen storage and transport demand grows, further research into the impact of hydrogen on the mechanical properties of stainless steel at extreme temperatures is crucial. The main concern is whether LH2 and GH2 themselves could embrittle or alter the microstructure and the mechanical properties of the material. While the effects of hydrogen on austenitic steels at ambient and medium low temperatures have been well studied [21,22,23,24,25,26], its influence at cryogenic temperatures of 20 K and below is not fully understood [27,28]. One aspect is that the effect of hydrogen, e.g., hydrogen embrittlement, is difficult to observe because the mobility of hydrogen is very slow under these conditions [29]. This research aims to investigate the composition, metallographic features, and mechanical properties of stainless steel after over 30 years of operation under such harsh conditions and after additional short-term high-temperature H2-exposure. A new insight on the behavior is provided for a real long-term H2-exposed material, and not an artificially aged material.
2. Materials and Methods
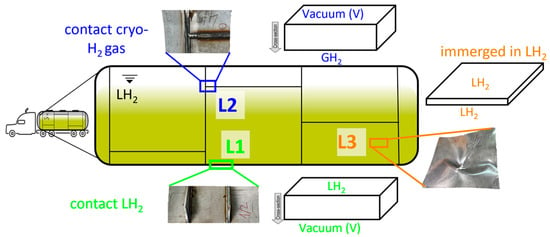
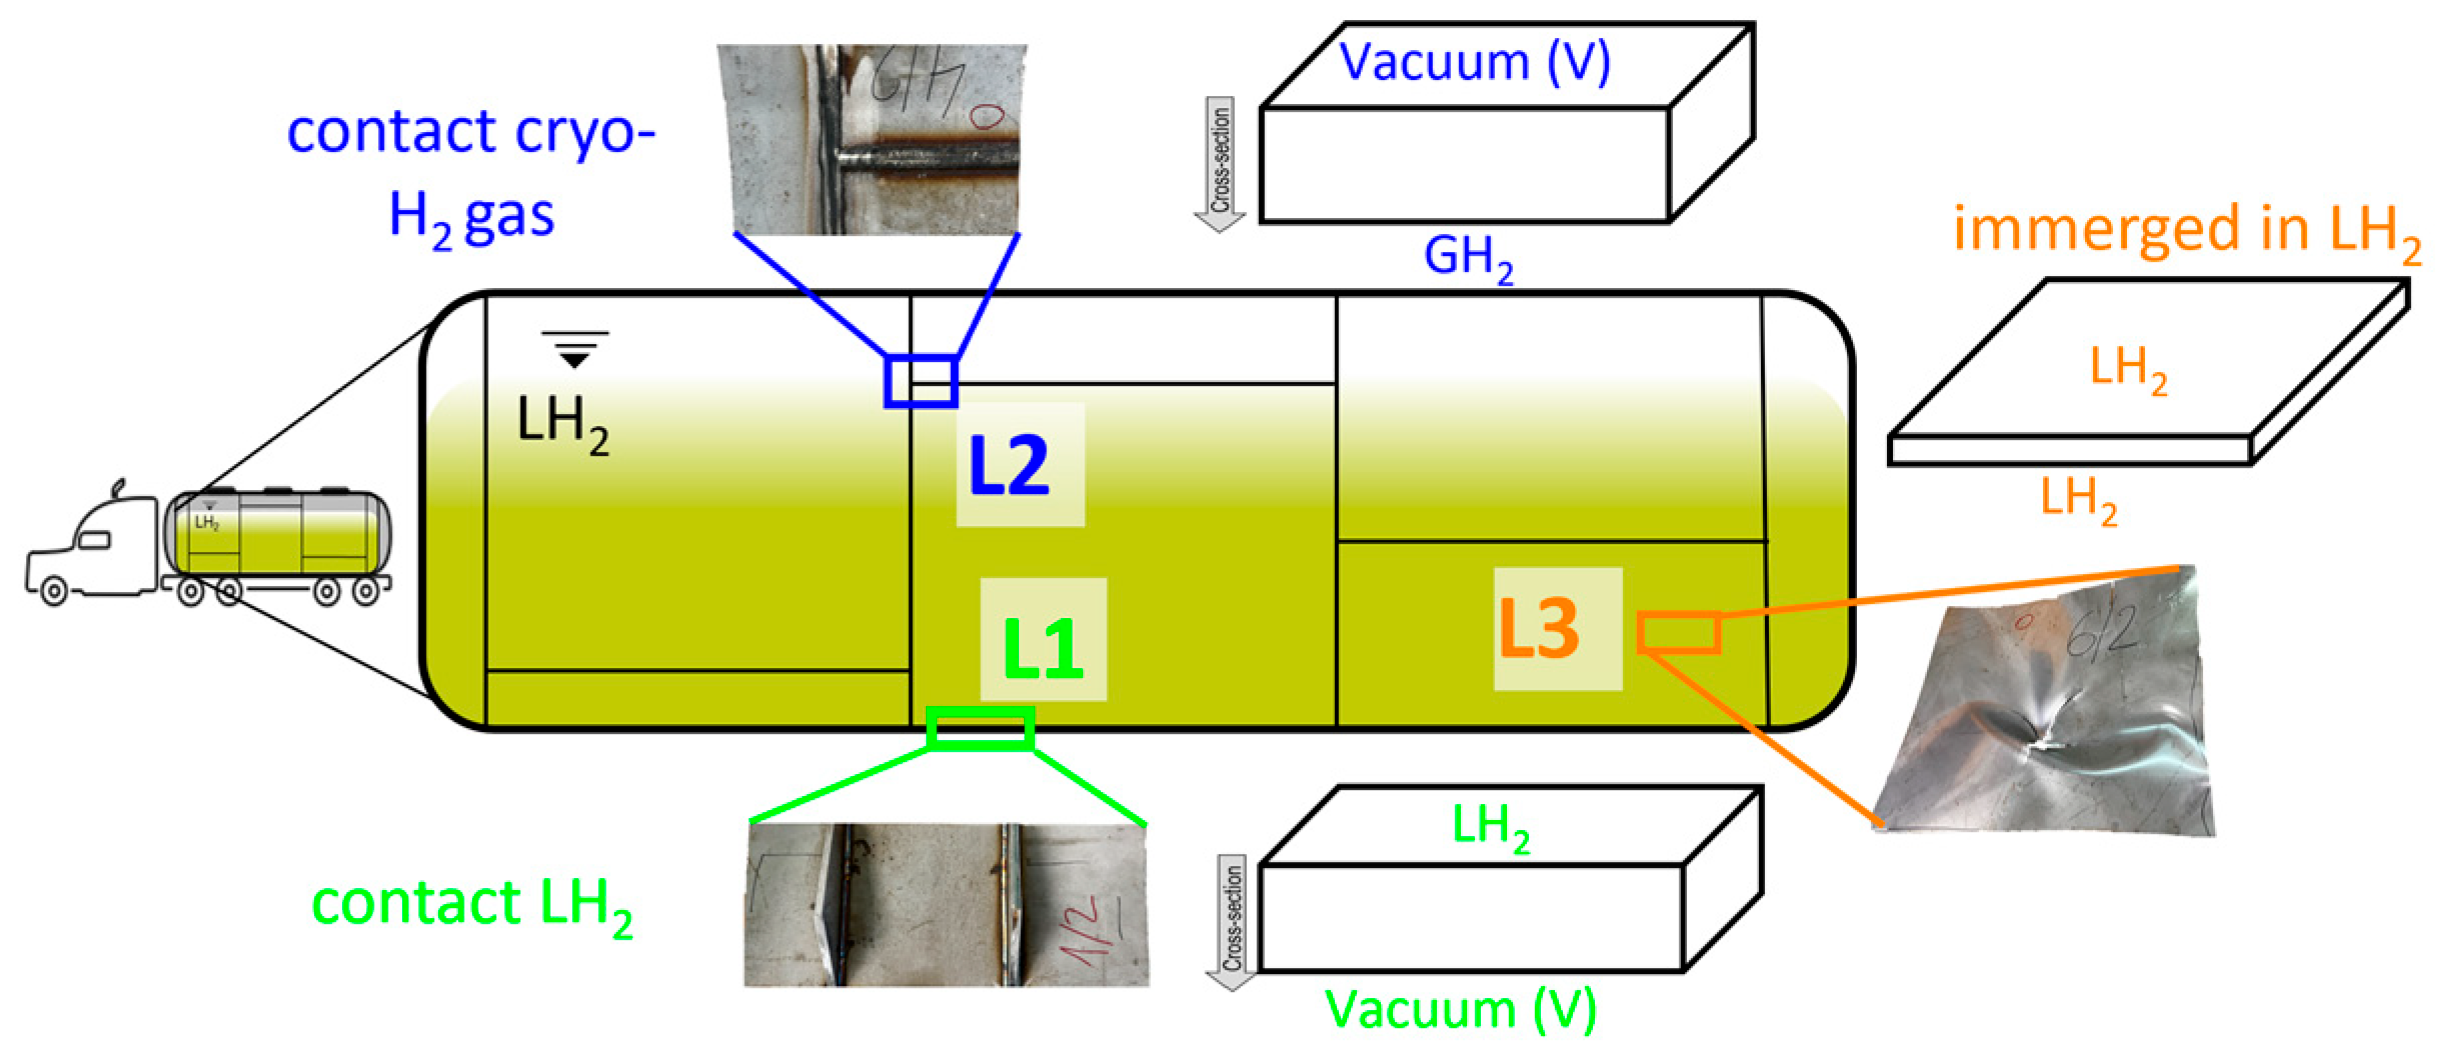
The as-received steel plates provided by Linde GmbH (Pullach,Germany) [30] are shown in the center of Figure 1. The plates were cut from the LH2 inner container of a trailer that have been used for LH2 transportation. The container was in service for over 30 years and was designed for 3 × 10⁵ pressure cycles and 1 × 10⁹ fatigue cycles. Images of the received plates and schematic display of the corresponding location in the real LH2 container are shown in Figure 1. The perpendicular lines in the schematic image indicate that the container was built out of multiple steel plates welded together. Since the container was not permanently filled completely, the chosen three different locations result in three different service conditions: (L1) the bottom of the container, where the steel plate was in direct contact with LH2 on inner side and vacuum on outer side; (L2) the top of the container, where the steel plate was in contact with cryogenic gaseous H2 (GH2) on inner side and vacuum on outer side; as well as (L3) a steel sheet which was fully immerged in LH2 as a baffle plate in order to prevent the LH2 from sloshing movement. The plates L1 and L2 were 10 mm thick and ca. 500 mm long and 400 mm wide. L3 is 3 mm thick and had a length of ca. 600 mm and a width of 600 mm.
Figure 1.
Schematic representation of the LH2 Linde container that was in service for over 30 years. Images of as-received steel plates from Linde GmbH (A. Alekseev). Corresponding locations in the real LH2 container are illustrated with regard to schematics; L1 (green), L2 (blue), and L3 (orange) and are attributed to the following: in contact with LH2, in contact with cryogenic gaseous H2 (GH2), and fully immerged in LH2, respectively.
The trailer was in service in the United States of America and poor information was available on the container material. Therefore, the austenitic steels type needed to be determined. For the overall chemical analysis on specimens of 10 mm × 10 mm × 20 mm of the steel plates Emission Spectrosco-py Analysis (ESA) was used by OBLF, Witten, Germany. Hydrogen concentrations in the specimens were obtained via hot carrier gas extraction using the Elementrac ONH p2 instrument from ELTRA, Haan, Germany. This method quantifies the content of dissolved and/or bounded light elements in the specimen. For hot carrier gas extraction, a specimen with sizes of ca. 3 mm × 3 mm × 5 mm is placed in a graphite crucible and then heated to the liquidus temperature. Nitrogen serves as a carrier gas and transports the hydrogen to a thermal conductivity cell. The change in thermal conductivity is converted to the hydrogen amount with a precision less than 1 ppm (weight ppm is used, unless otherwise mentioned). Six samples were measured for obtaining one concentration value.
In order to investigate the microstructure of the different regions of the steel plates, a Thermo Fisher Scientific (Darmstadt, Germany) Apreo 2 electron scanning microscope (SEM) was used to perform imaging using backscatter electron imaging (SEM-BSE) for cross-sections and using the Everhart–Thornley Detector (EDT) as a standard secondary electron detector for the fractographic analysis. Additional orientation imaging microscopy by electron backscatter diffraction (EBSD) was carried out using an EBSD Detector from Amatek EDAX, Wiesbaden, Deutschland. Mechanical properties were carried out via hardness measurements and tensile testing. An ATM (Mammelzen, Germany) Qness micro indentation hardness tester was used to measure the Vickers microhardness (HV0.1) of the plates cross section. A universal servo-hydraulic testing machine by MTS (Berlin, Germany) 50/25 kN equipped with a cryostat system was used for the tensile tests at the CryoMaK laboratory at Karlsruhe Institute of Technology KIT [31]. Strain until failure was monitored by two extensometers with a gauge length of 20 mm. The tests were done under displacement control of the machine’s cross head at a displacement rate of 0.5 mm/min, which corresponds to a strain rate of 4 × 10⁻⁴ s−1. Four temperature regimes were tested: ambient temperature T~300 K, medium low temperatures of T~200 K, and T~77 K as cooled by liquid nitrogen, and a low temperature of T~20 K as cooled by liquid helium. T~20 K resembles liquid hydrogen temperature and thereby mimics the temperature conditions in the liquid hydrogen-filled container. For all mentioned measurements, specimens were prepared either in the workshop for mechanical testing or in the metallurgy lab via cutting, grinding, and polishing for microstructural investigation.
As a second part of the study, hydrogen gas exposure as thermal pre-charging was performed at high pressure and two different temperatures via hydrogen charging chamber designed and build at KIT, in the CryoMaK test facilities [31]. Prior to charging, the chamber first was purged for one minute with constant flow of H2 gas of 99,999 purity. Then, the pressure was increased to 100 bar and released three times to minimize the amount of contaminants present inside the chamber, before feeling and sealing. During the exposure period, the pressure of 200 bar and temperature of 300 K or 573 K were kept steady and no significant changes were observed. The effect of an additional thermal H-charging of the specimens obtained from the plates on hydrogen uptake and the resulting mechanical behavior was studied.
3. Results and Discussion
3.1. Chemical Analysis, Hydrogen Content, and Microhardness of the As-Reveived State
Table 1 shows the chemical composition of the as-received three different steel plates (L1, L2 and L3) in wt.%, based on the ESA measurements. The as-received state refers to the material provided by Linde GmbH. The chemical composition analysis indicates that the base material is austenitic stainless steel AISI 304 (EN 1.4301) for L1 and L2. The chemical composition of plate L3 corresponds to low carbon content austenitic stainless steel AISI 304L (EN 1.4307) [11,32].
Table 1.
Average chemical composition of the LH2 containers steel plates obtained by ESA and * hot carrier gas extraction.
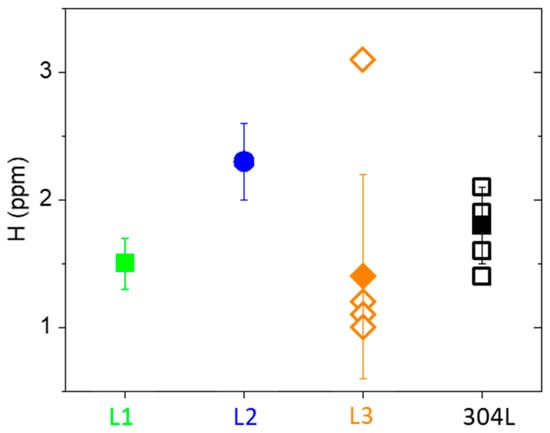
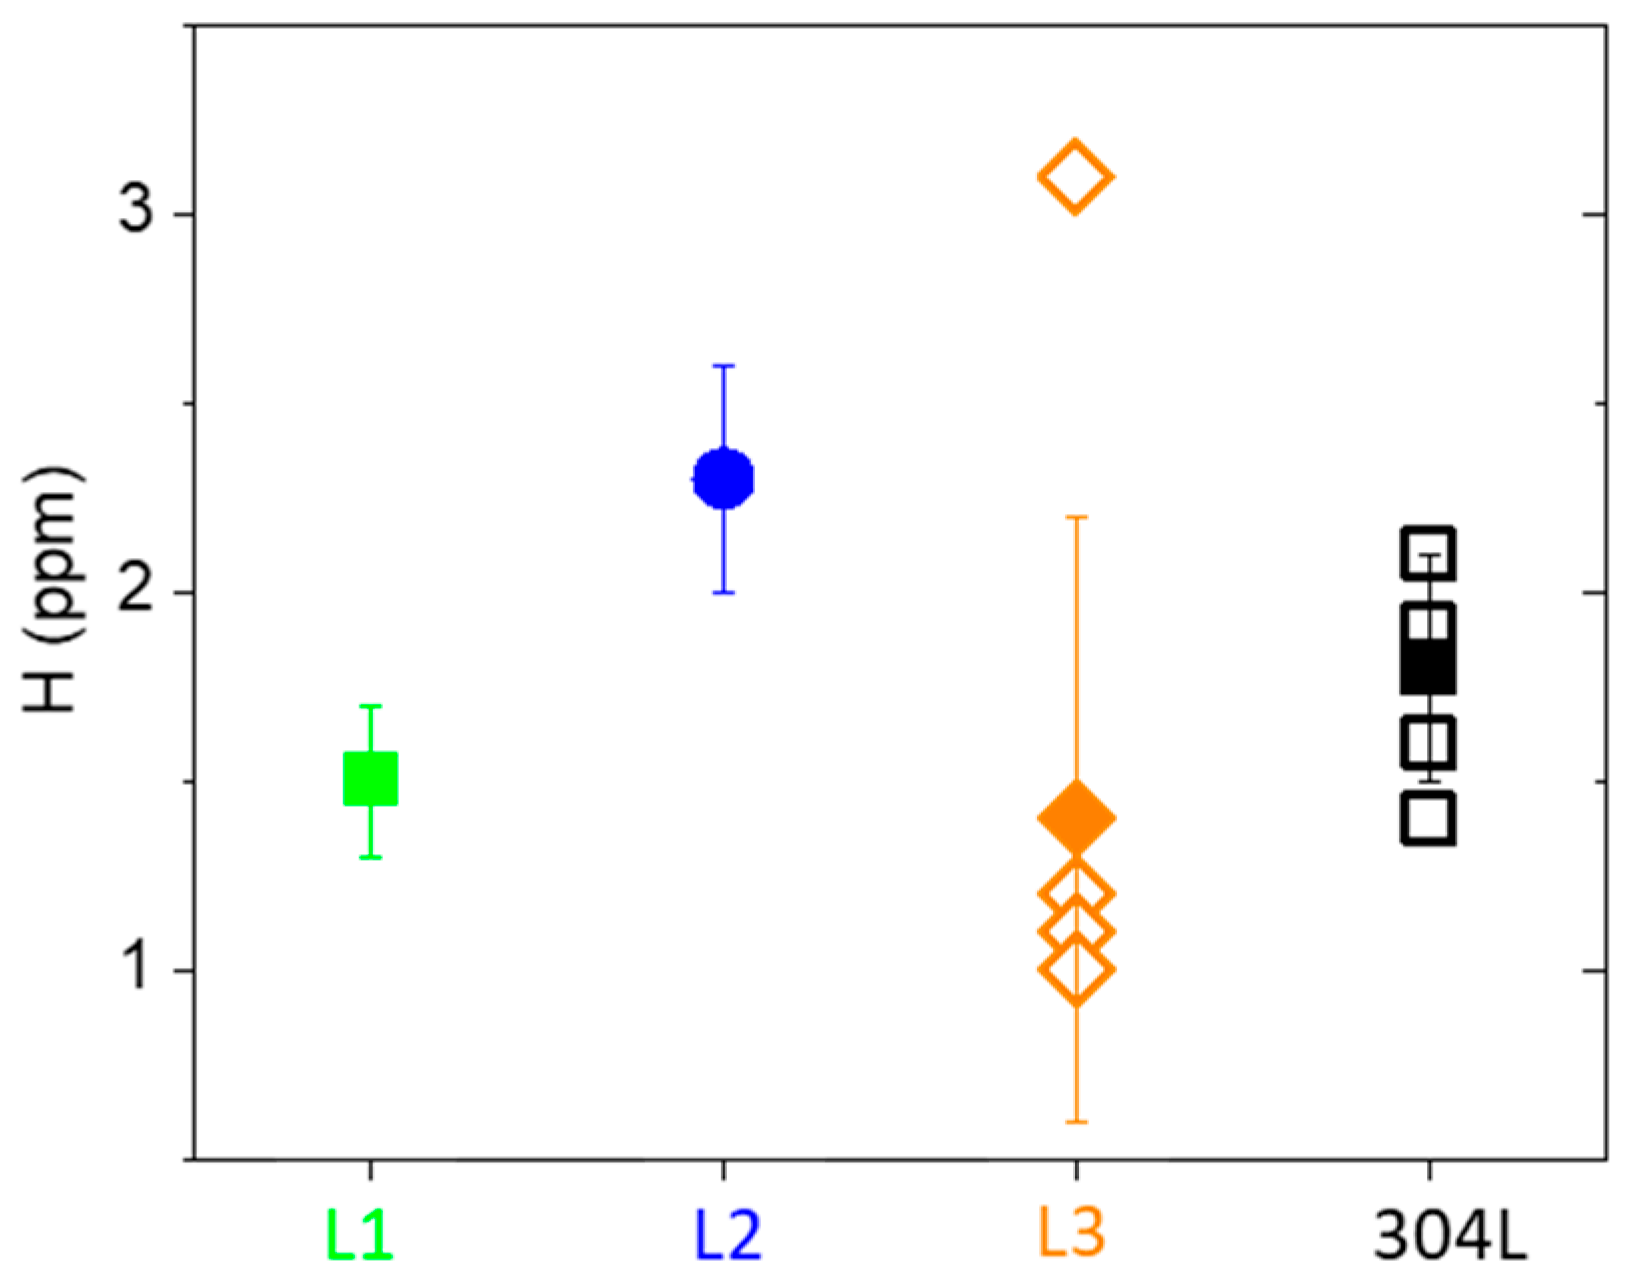
The average hydrogen content of as-received plates L1, L2, and L3 were measured by hot carrier gas extraction. The results are shown in Figure 2. On average, the specimen of plate L1 has lower hydrogen content (1.5 ppm) compared to L2 (2.4 ppm). The hydrogen content in L3 is close to L1, emphasizing that both samples that were directly in contact with LH2 exhibit less residual H than L2, which was in contact with cryogenic GH2. This might indicate that the gaseous state of hydrogen is required for the absorption into the material. Generally, 1 to 3 ppm hydrogen content could be present in the material immediately after production, this content varies depending on the manufacturing conditions for SS [27].
Figure 2.
Average hydrogen content of the as-received LH2 container plates L1, L2, and L3 and ‘fresh’-304L.
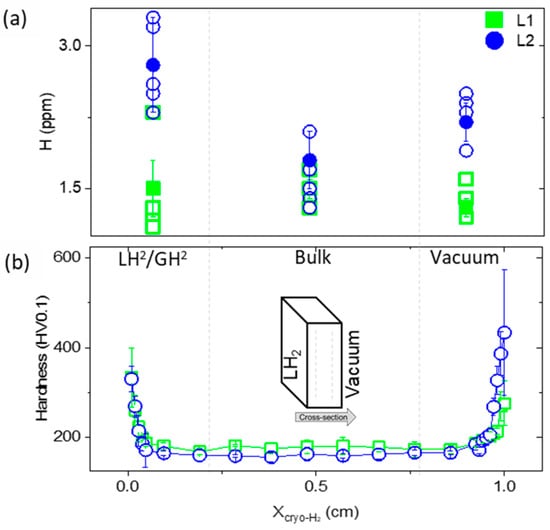
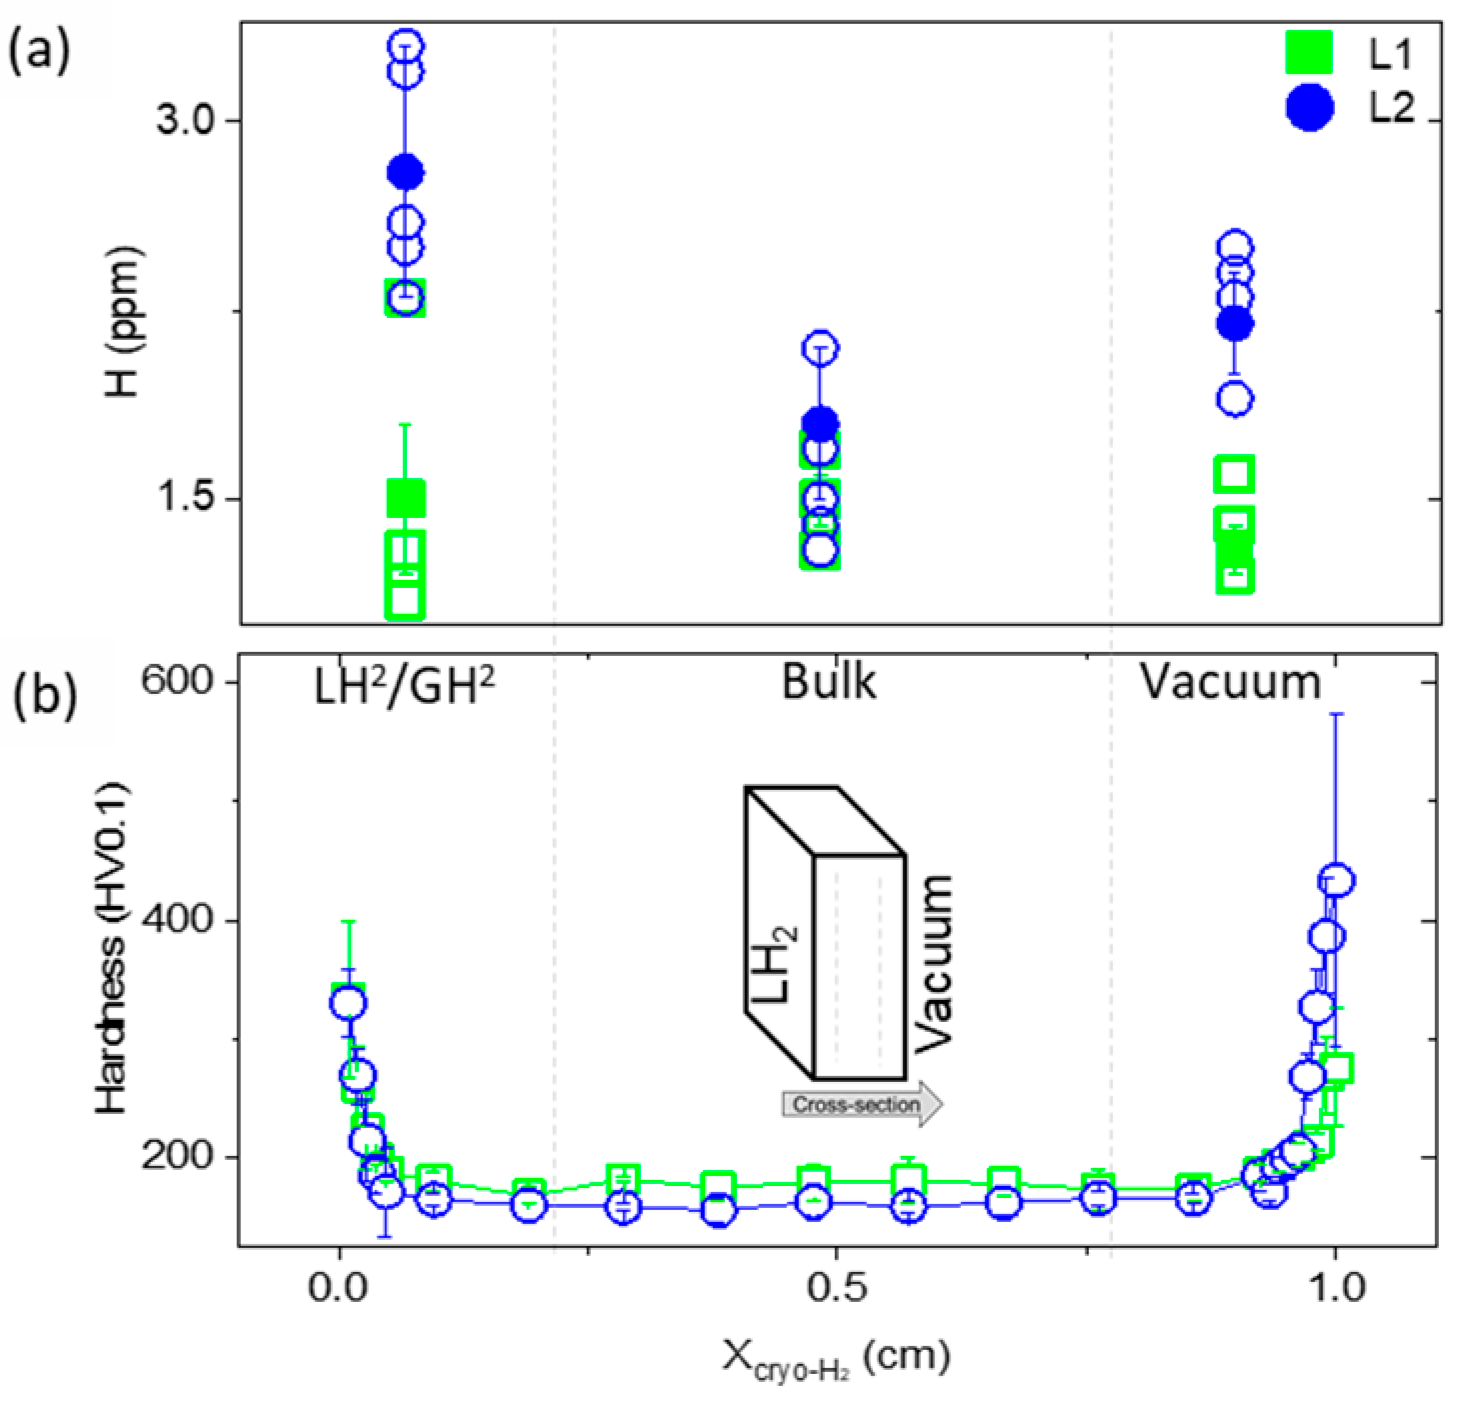
As a verification, a ‘fresh’ (not hydrogen-pre-charged, not mechanically loaded, and not in long-term usage) 304L specimen was measured. The hydrogen content was found to be 1.7 ppm, which in the general range. The content is similar to the hydrogen content in plate L1, L2, and L3. Based on these results, it cannot be concluded whether the H content is related to the exposure over the years or due to the manufacturing of the container, even though this happened more than 30 years ago. Since the container walls were in contact with H2 only from one side, the hydrogen content was measured in L1 and L2 along the cross-section of the as-received steel plates at these two different positions, as illustrated in Figure 3a as a function of the sample thickness in cm. The measured hydrogen content in L1 over the cross-section from the LH2 interface to the vacuum interface is represented by green square symbols and shows no significant variation. For L2 (blue circles) the hydrogen content is marginally lower in the bulk compared to the interfaces. At the GH2 interface the content is slightly higher compared to the vacuum interface. One outlier for L1 and L2 at the cryogenic side was measured with comparatively high hydrogen content of 2.3 ppm and 3.9 ppm in L1 and L2, respectively. This is most likely due to random located pores or voids near surface that were in contact with LH2 and GH2 and served as a hydrogen traps [33]. For L1 no gradient over the cross-section was detected within the measurement resolution and uncertainties since error bars overlap and, thus, the differences are not significant. For L2, a slight gradient over the cross-section was detected within the measurement resolution and uncertainties. This suggests the possibility of H uptake due to the long-term exposure, since in some measurements the amount of H2 was higher than the expected content from the manufacturing. In case of the L2 position at cryogenic temperatures, hydrogen gas can physically adsorb onto the steel surface. A hydrogen penetrating into the bulk metal is less probable. This adsorbed hydrogen can later desorb or penetrate into the metal if temperature increases [34]. At 20 K (L1), hydrogen diffusivity in steel is extremely low, close to negligible. So, despite full contact with liquid hydrogen, very little hydrogen is expected to enter the bulk of the 304 stainless steel. Uptake is mostly limited to surface interactions or pre-existing traps, e.g., dislocations or grain boundaries, vacancy clusters, or cold traps as well as defects from prior mechanical processing and stresses [35].
Figure 3.
(a) Hydrogen content variation over the cross-section of the as-received Linde LH2 container’s wall plates L1, L2. Single measurement is represented by open symbols, whereas the mean value is represented by solid symbols. (b) Average micro-hardness along the cross-section of L1 and L2, depicted as open symbols.
Figure 3b shows the distribution of the micro-hardness along the cross-section from the cryo-H2 interface toward the vacuum interface for the as-received L1 and L2 material. The average micro-hardness was higher at the interfaces, decreased rapidly, and reached saturation hardness values in bulk for both L1 and L2. It is important to note that the width of the zone in which the hardness rapidly decreases is thin and similar at both interfaces, H2 and vacuum, on this scale. The width of this zone is approximately 300 μm. The higher micro-hardness at the interfaces compared to the inner part were found at both plate sides and on both container locations L1 and L2. Therefore, it is evident that it has no relation to the H2 long-term exposure. The reason behind this higher micro-hardness at the interfaces is most likely the manufacturing route, which will be discussed in the microstructural investigation in Section 3.2. The average micro-hardness values in the bulk of specimen L1 with 178 ± 11 (HV0.1) and specimen L2 with 165 ± 8 (HV0.1) are similar to the micro-hardness of specimen L3 of 183 ± 13, and they meet the literature values reported for 304 SS [36]. The micro-hardness of the ‘fresh’ 304L specimen was found to be 270 ± 16 (HV0.1). This value is significantly higher than the measured micro-hardness in the bulk of the as-received LH2 container but fits the hardness values of the interface regions in L1 and L2; see Figure 3b.
3.2. Microstructural Characterization of the As-Received State
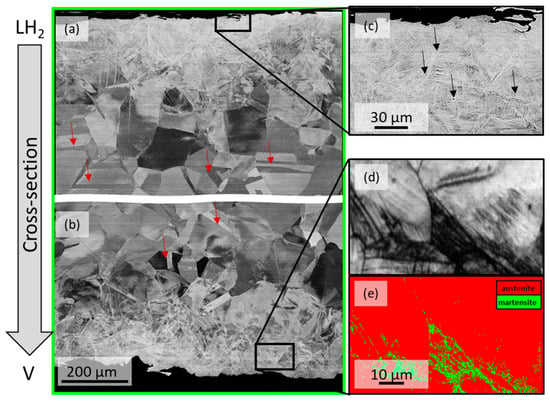
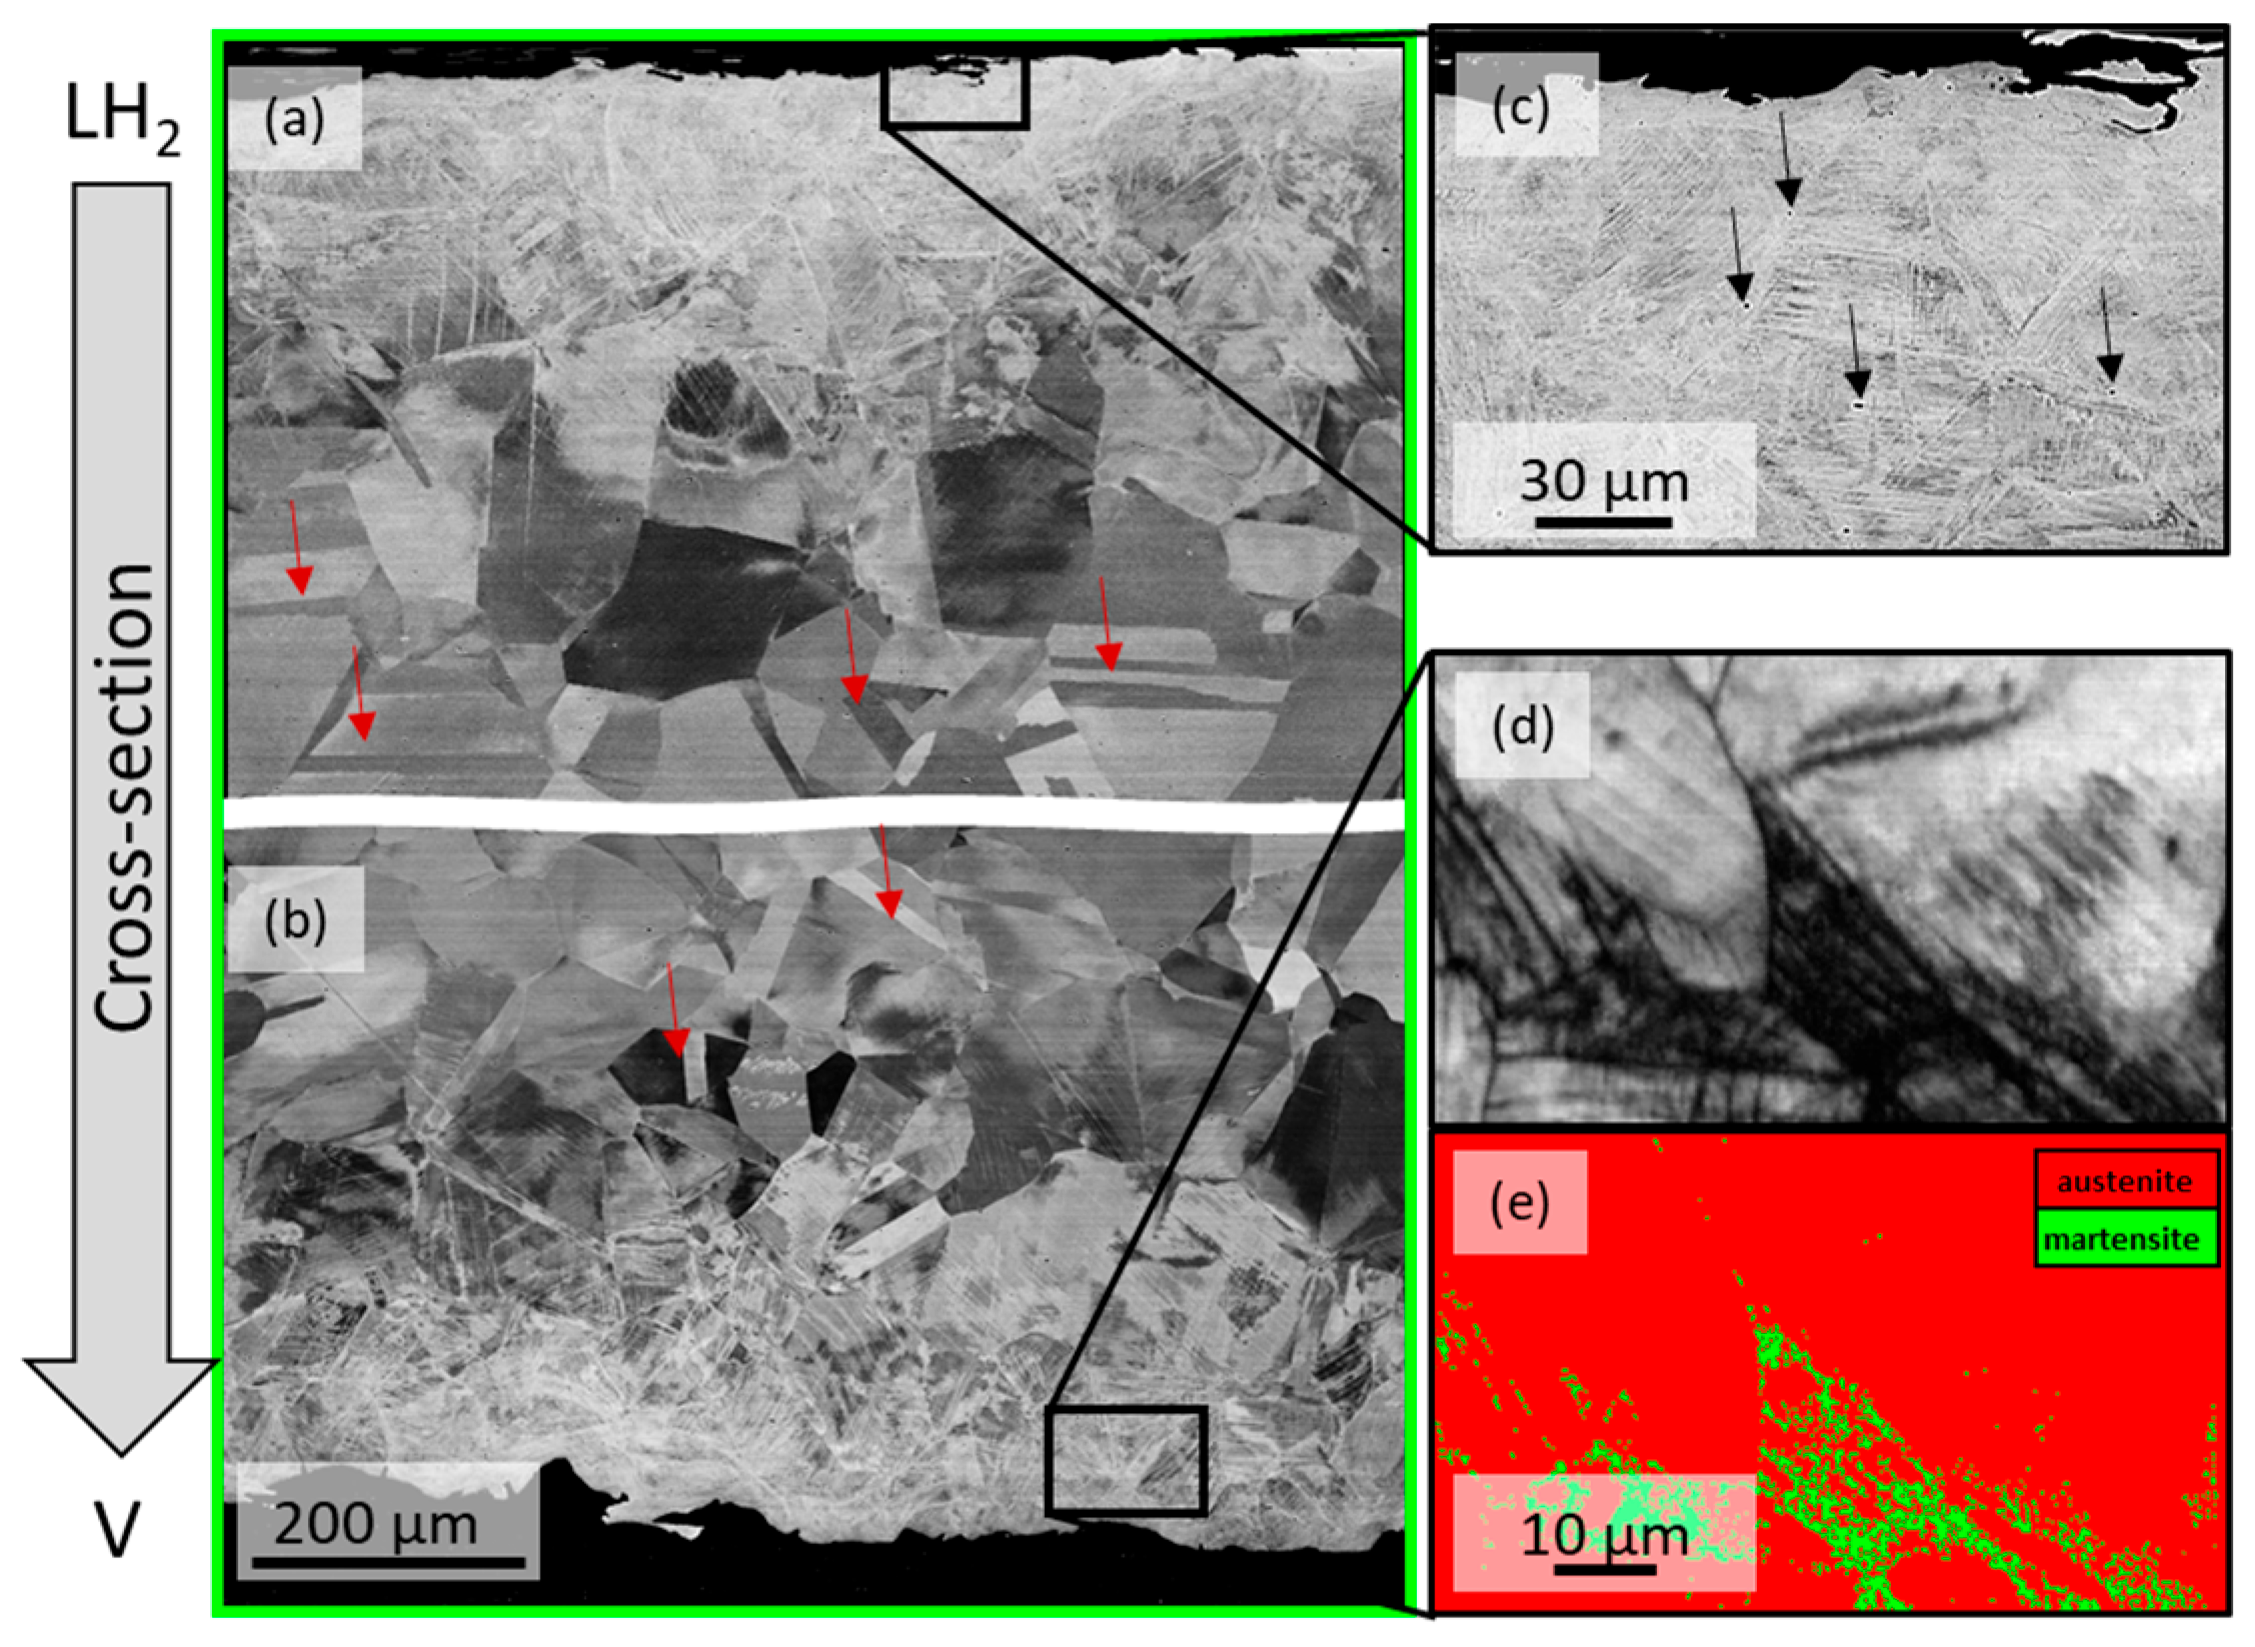
Figure 4a,b show SEM-BSE images of the as-received L1 over the cross-section, from the LH2 interface to the V interface. The bulk region microstructure resembles the lower part of Figure 4a and the upper part of Figure 4b. Pores marked with black arrows in Figure 4c were found along the complete cross section and their content is enriched close to the interfaces. A deformed near-surface region was detected close to both interfaces of the steel plates. As can be seen in the EBSD images in Figure 4d,e, martensite was spotted in the deformed region, indicated by the green color in the color-coded phase map. Martensite tends to form at the grain boundaries, as can be seen by comparing Figure 4d,e, which represent the same sample region. It shows evidence of strain-induced martensite that occurs in low stacking fault austenitic steels due to rolling processes, for instance [5,37,38]. The average width of the deformed regions was found to be 240 ± 30 µm and 250 ± 40 µm for LH2 and V interfaces, respectively. This width corresponds to the 300 µm width of the zone in which the hardness rapidly decreases, see Figure 3b. Rough surfaces were observed on both interfaces towards LH2 and V. The investigation of the bulk region revealed a coarse grain austenitic microstructure with an average grain size of 107 ± 20 µm. Annealing twins marked by red arrows in Figure 4a,b, martensite were detected occasionally.
Figure 4.
SEM-BSE mode images in orientation contrast from the cross sections of L1 (a,b) liquid H2 (LH2) and vacuum interface (V), respectively. Red arrows mark annealing twins. (c) Magnified region of very top LH2 interface of L1. Black arrows mark pores. (d) EBSD image quality map from the near surface cross-sections of L1. (e) Corresponding color-coded phase map of the same region. Red and green colored areas correspond to austenite and martensite, respectively.
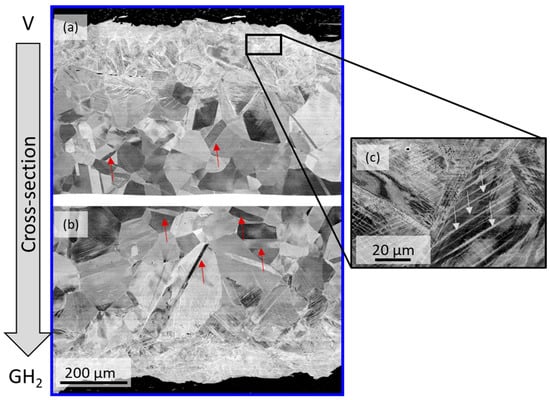
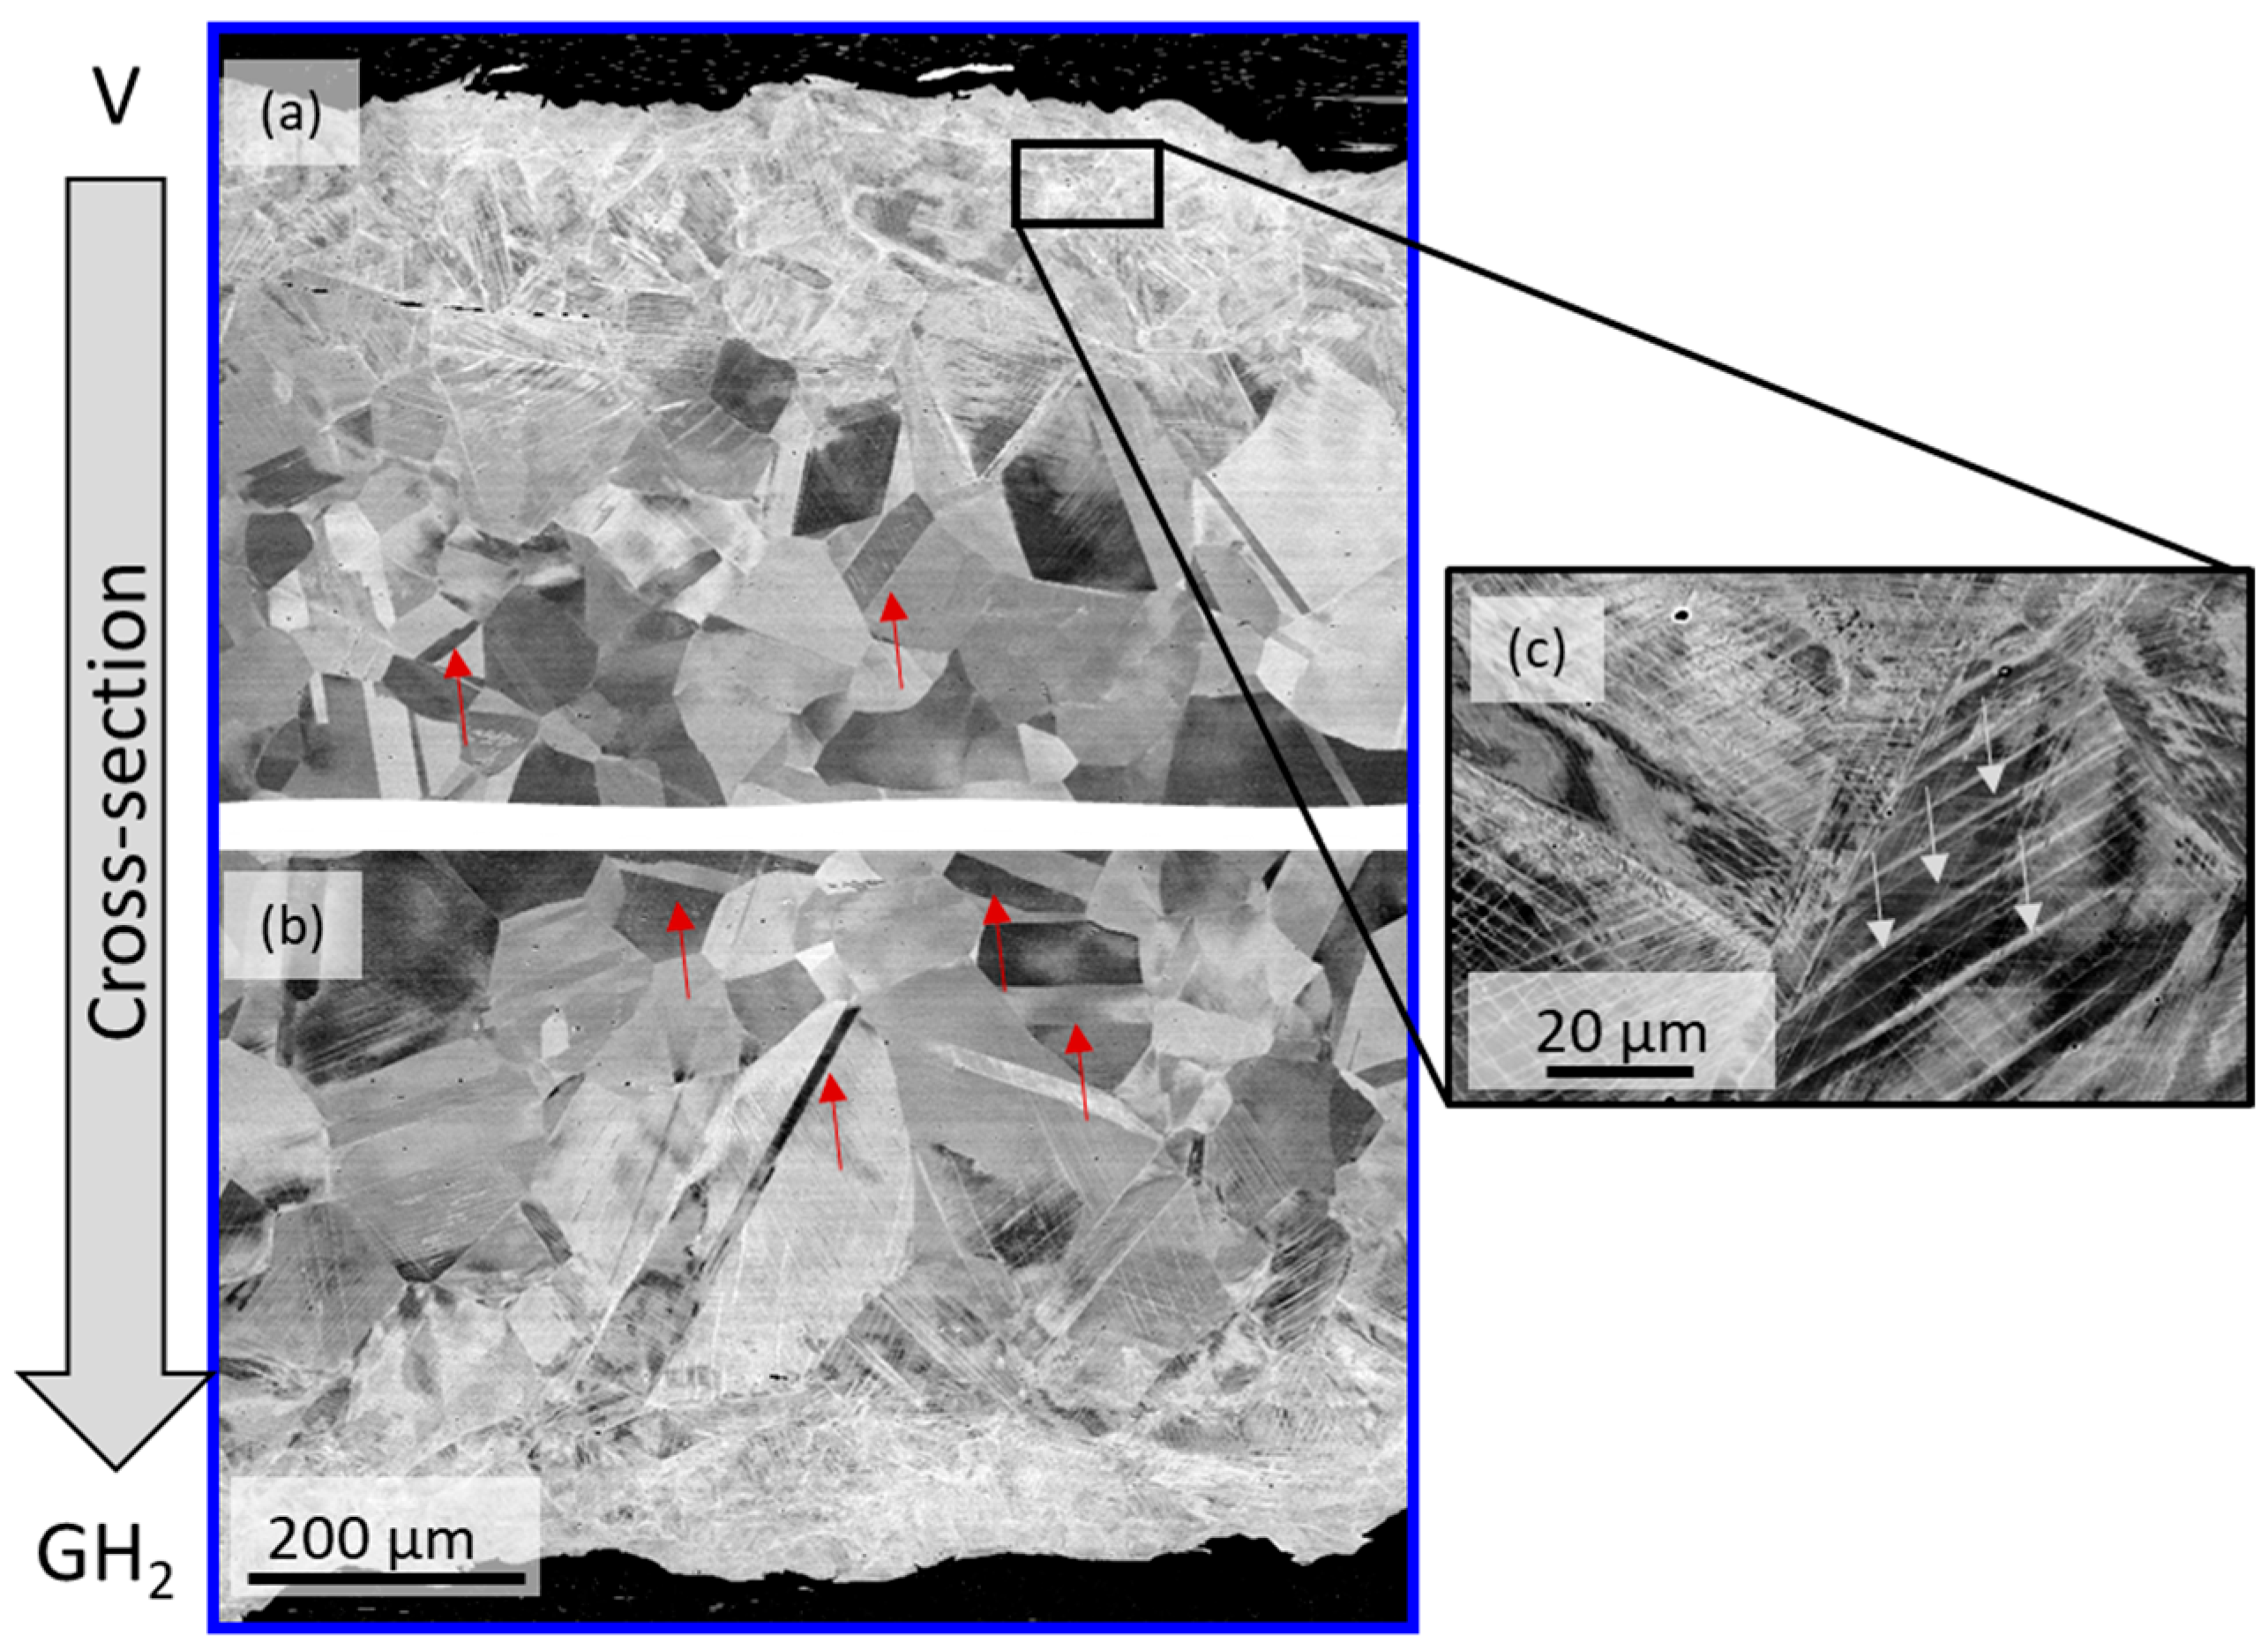
The discussed microstructural features of L1 for the cross-section are similar for L2, comparing Figure 4a,b to Figure 5a,b. Figure 5a and Figure 5b show the part of the L2 specimen close to the GH2 and V interface, respectively. The highly deformed near-surface area of the GH2 interface (upper part in Figure 5a) magnified in Figure 5c shows lens-shaped features that are exemplarily marked by grey arrows. These features highlight deformation bands [38] caused by intense localized plastic deformation. The average width of the deformed regions was found to be approximately 232 ± 60 µm and 216 ± 20 µm for the GH2 and the V interface, respectively. An average grain size of 110 ± 30 µm was measured in the bulk region. The measured widths as well as the grain sizes of L2 are similar to L1, when taking the deviations into account (see, Figure 6a,b).
Figure 5.
SEM-BSE mode images in orientation contrast from the cross-sections of L2 (a,b) cryogenic GH2 and vacuum (V) interface, respectively. Red arrows exemplarily mark annealing twins. (c) Magnified region of top GH2 interface of L2. Grey arrows exemplarily mark deformation bands.
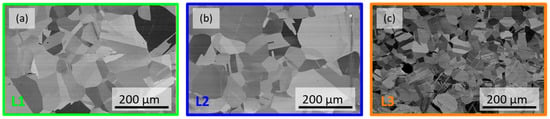
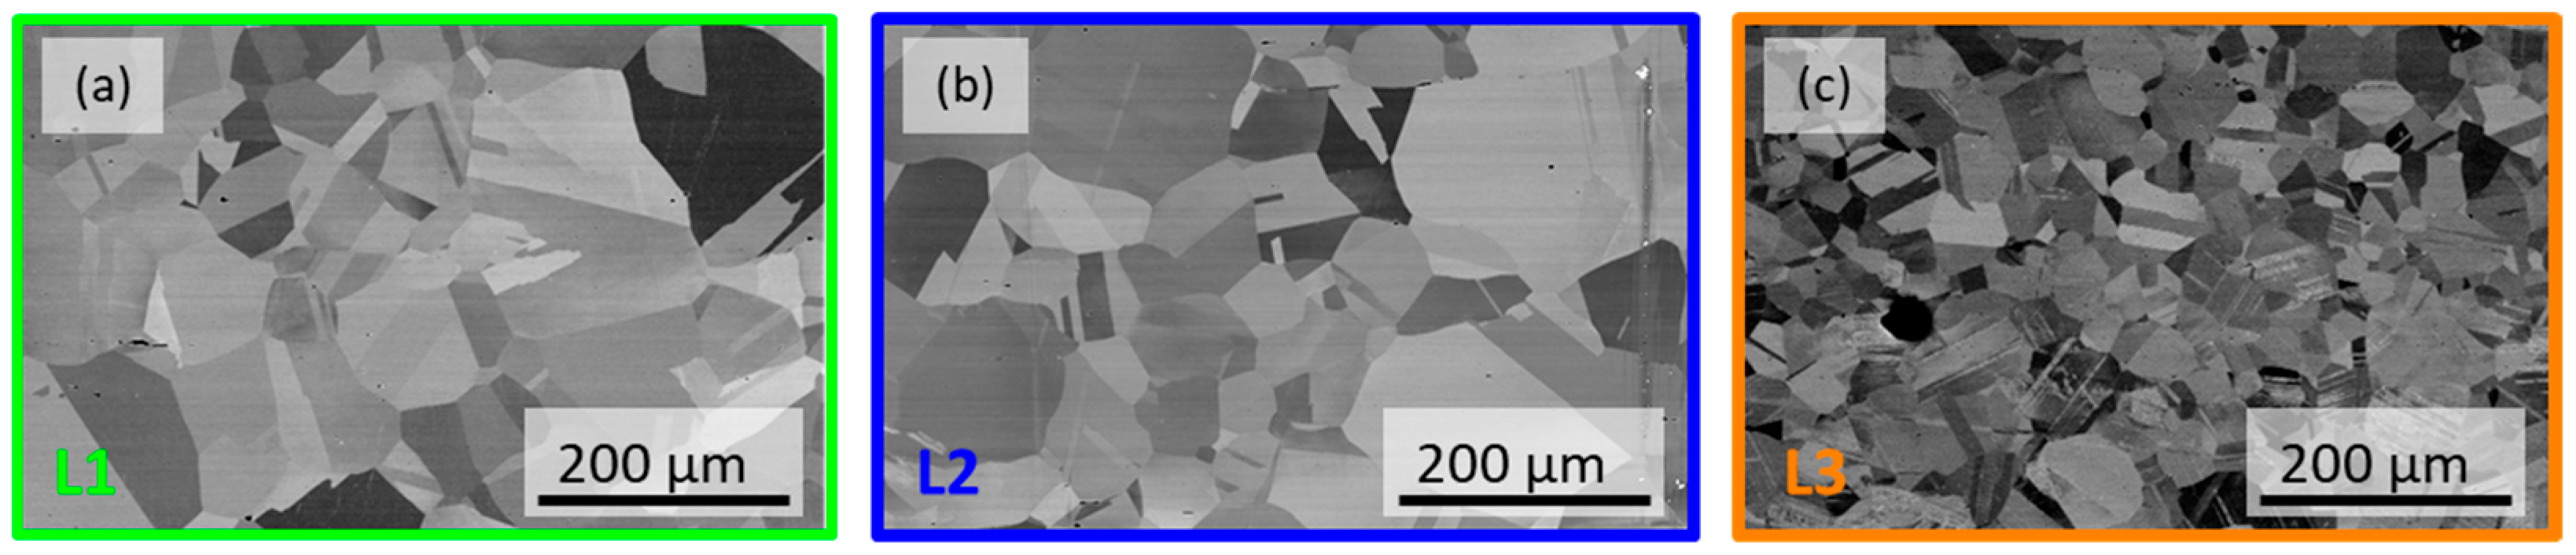
Figure 6.
SEM-BSE mode images in orientation contrast of the as-received material comparing the microstructure of the different positions (a) L1, (b) L2, and (c) L3.
Figure 6c presents the microstructure of L3, which was from the container plate being fully immerged in LH2 from both plate sides. The less thick L3 steel plate exhibits austenitic microstructure with smaller grains compared to L1 and L2. An average grain size of 39 ± 5 μm was measured. Annealing twins and martensite are present in the microstructure. The latter occurs more often in L3 than L1 and L2. No deformed region near the surface nor a flat surface were found, which is most likely due to a different manufacturing route.
In conclusion, the as-received microstructural features were observed at both cryo-H2 and the vacuum interface and since the morphology of the interfaces are similar for L1 and L2, it seems that long-term LH2 and GH2 exposure did not alter the microstructure of the container, on this length scale. The highly deformed near-surface microstructure is a consequence of deep rolling treatment of the container steel plates L1 and L2. The obtained microstructural features in the deformed region are consistent with reports that have introduced twinning, deformation bands, and martensite as well as an increase in dislocation density by deep rolling of 304 austenitic stainless steel [38,39]. In addition, considering the rough surface and the micro-hardness measurements it is most likely that the plates were not only deep rolled but also subjected to a surface treatment, for instance shot peening. Shot peening is known to be used, e.g., in the automotive, aircraft, and chemical industry [40,41]. Although martensite is prone to H2, the advantages of that mechanical surface treatment seem to outweigh. The beneficial effects include: compressive residual stress profiles, strain hardening in near surface regions, higher yield resistance against fatigue loading, corrosion, or wear resistance in samples containing negligible amount of hydrogen [37,38,39,40]. The main concern whether LH2 and GH2 itself could alter the microstructure is ruled out since the presented microstructural features within Section 3.2 are most likely attributed to the manufacturing route of the plates. Nevertheless, it has to be pointed out that at rough surfaces, as it is the case for the surfaces of the container plates, capillary effects might occur at microscopic levels, especially at fissures, oxides, pores, or grain boundaries on stainless steel 304. This phenomenon leads to the localized accumulation of hydrogen. While capillary effect is well-studied in general low-temperature physics [42], specific studies on hydrogen show that hydrogen molecules readily condense in nanoscale confinements, such as porous materials, under cryogenic conditions [43]. By analogy, similar effects might be expected on stainless steel surfaces with rough microstructural features. This potentially influences the uptake behavior, as described in Section 3.1 regarding the H concentration within the material.
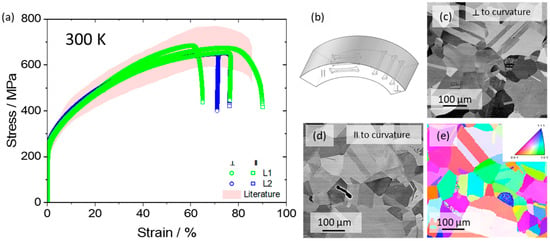
To possess a similar H concentration in L1 and L2 (see Figure 3a) as well as to avoid the strongly deformed microstructure (Figure 4a,b as well as Figure 5a,b) on the mechanical behavior, the samples for the mechanical tests (2 mm × 2.4 mm cross-section and a gauge length of 20 mm) were taken from the middle part of the steel plates. Moreover, direction dependent tensile samples oriented with respect to the steel plates curvature (parallel and perpendicular) were produced, as depicted in Figure 7b.
Figure 7.
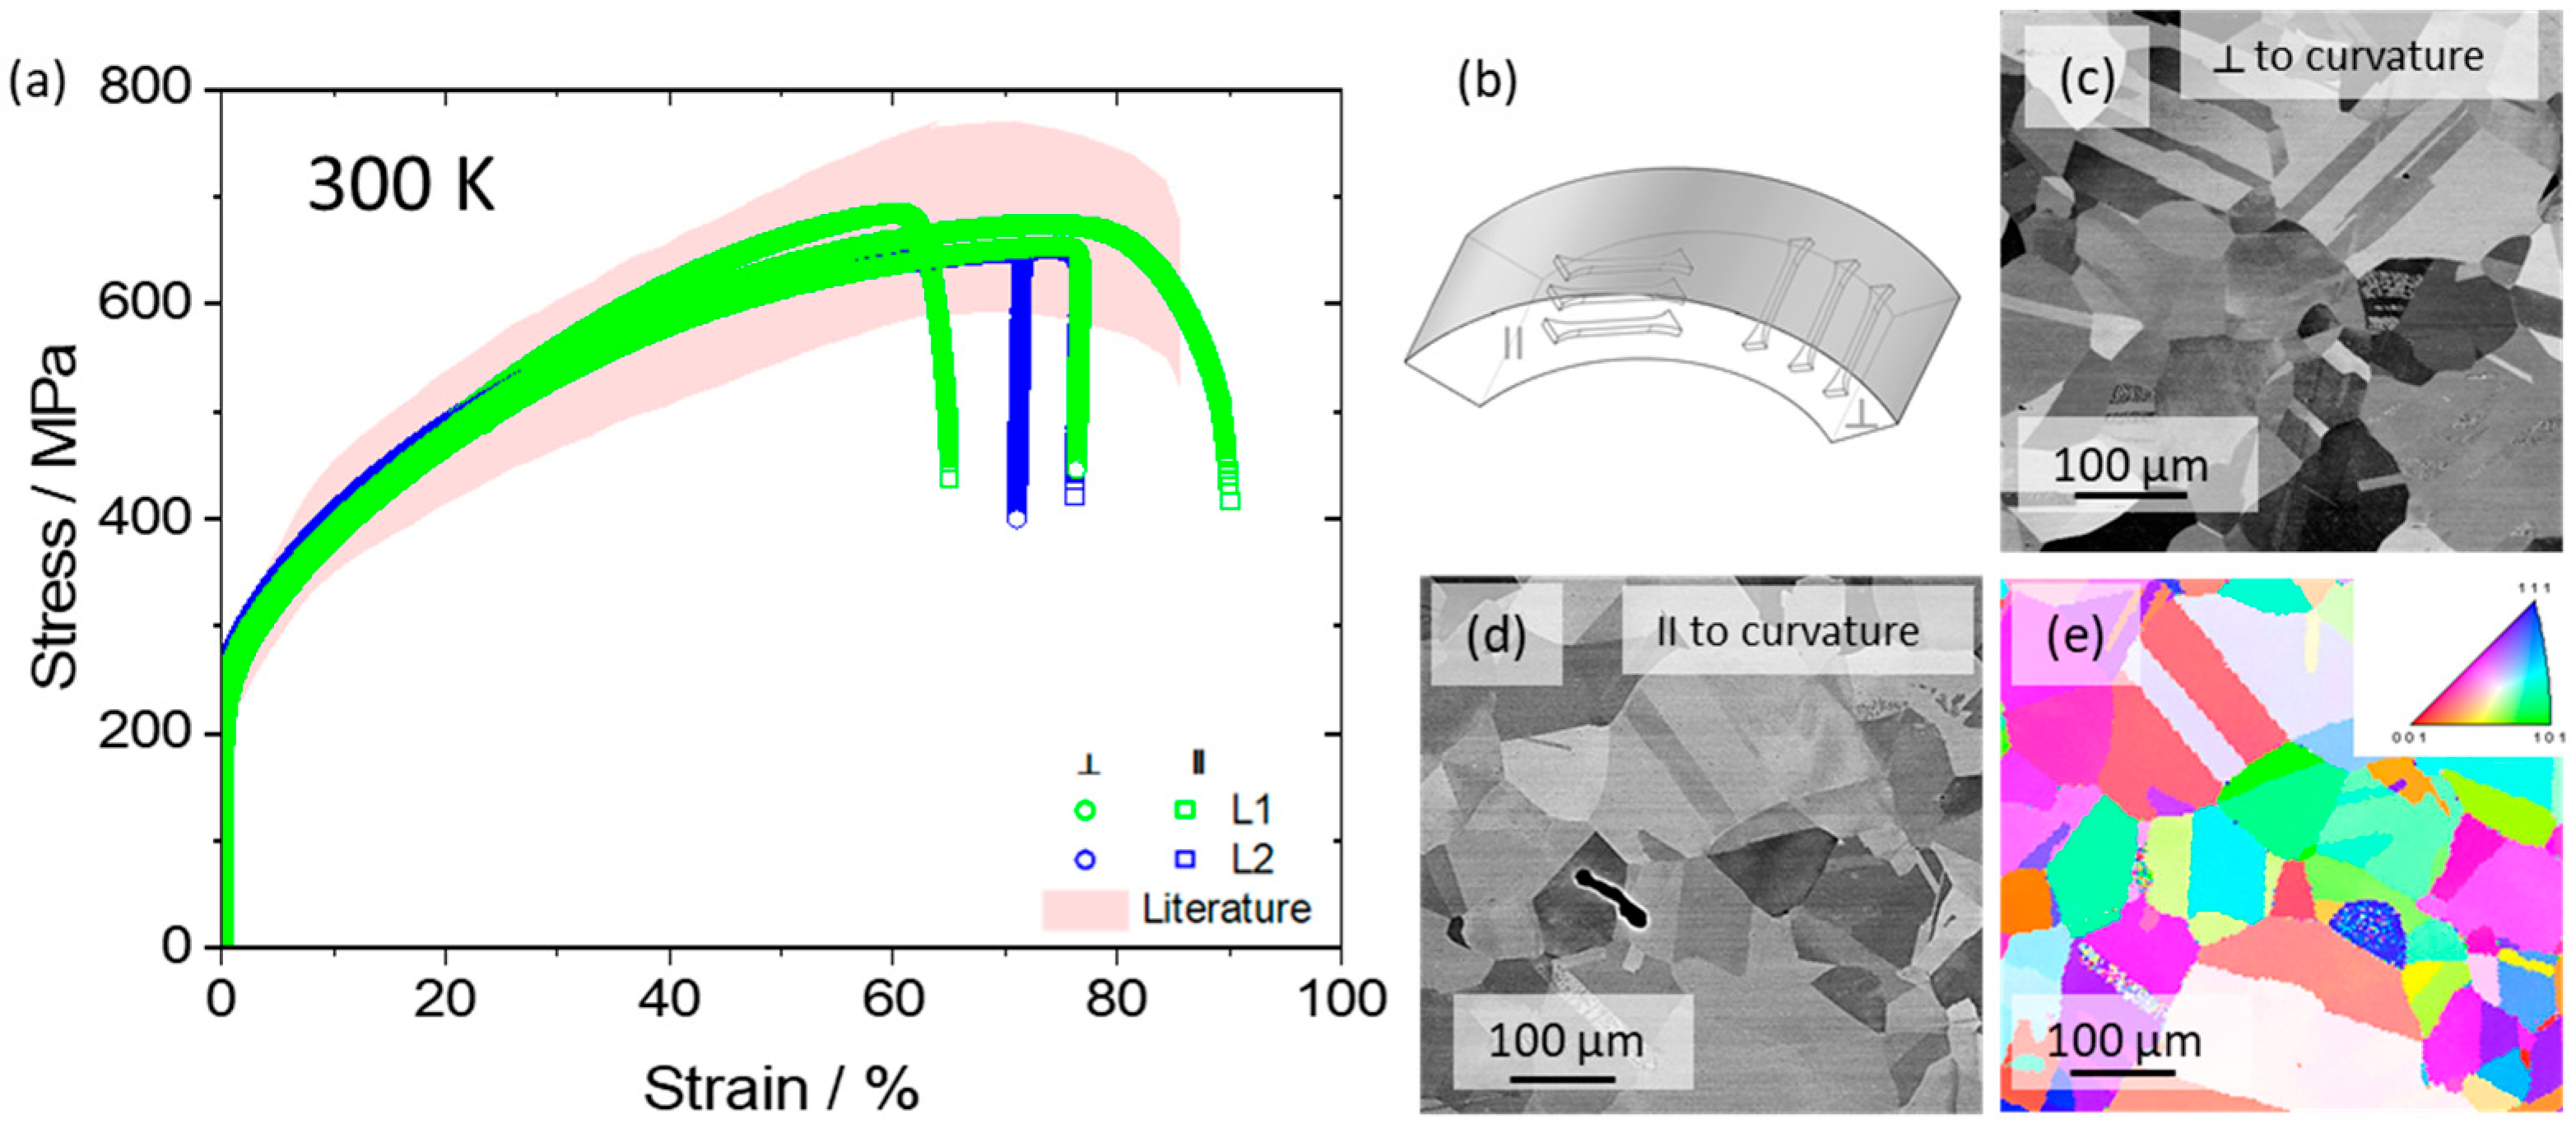
(a) Stress–strain curves of L1 and L2 perpendicular (⊥) and parallel (II) to curvature at 300 K shown by green and blue, circle and square symbols, respectively. The imposed initial strain rate in the experiments is ≈ 4 × 10⁻⁴ s−1. The red shaded area represents a results compilation from the literature [6,7,8,10,27]. (b) Schematic sample orientation with respect to the container curvature. SEM-BSE mode images in orientation contrast of L1 cross-sections (c) perpendicular and (d) parallel to curvature prior to testing. (e) EBES color-coded Inverse Pole Figure (IPF) Map of the SEM image (d).
3.3. Mechanical Properties After Long-Term GH2 and LH2 Exposure
The stress–strain curves of the perpendicular (open circles) and parallel (open square) direction-oriented samples from plates L1 and L2 obtained under uniaxial tension and tested at 300 K, are presented in Figure 7a. The material exhibits an initial 0.2% offset yield strength of 240 (±6) MPa for the parallel (II) direction and 225 (±20) MPa for the perpendicular (⊥) direction with respect to the container’s curvature. The stress–strain curve exhibits quasi-linear strain-hardening effect. The ultimate tensile strengths are 684 (±20) MPa and 654 (±10) MPa for II and ⊥, respectively. Within the tensile testing scatter, no significant direction dependency was found with respect to the container’s curvature. This is supported by the obtained microstructure, shown in Figure 7c,d, and the EBSD color-coded inverse pole figure (IPF) map of Figure 7e, exhibiting random oriented coarse grains, annealing twins, and occasional martensite. This microstructure is equivalent to the bulk cross-section microstructure in Section 3.2 since this is the region where the samples were prepared. The grain size is equal in both parallel and perpendicular direction and reveals random distribution of grain orientation (Figure 7e). The microstructure is identical for both location L1 and L2. No distinct texture was observed and, hence, the tensile properties are also independent on the container curvature. Furthermore, the tensile test behavior of L1 is similar to L2 indicating that the long-term exposure of cryogenic GH2 or LH2 have the same impact on the remaining mechanical behavior. In order to assess the impact of long-term H2 exposure, the tensile behavior is compared to results from the literature of ‘fresh’ non-charged samples with similar microstructures, testing parameters, and temperatures [6,7,8,10,27]. Compared to the results from the literature, shown as a red shaded area, the stress–strain curves of the long-term H2 exposed material are located in the middle of the literature band.
As seen in Section 3.1 the H concentration in the long-term usage container walls samples is not significantly different compared to the ‘fresh’ un-charged samples, which means that even after the long-term service in cryogenic hydrogen environment the mechanical behavior tested at 300 K is still similar to the H2 un-exposed material and material without mechanical load history, from the literature. Thus, no degradation of the material could be attributed to the long-term service in cryo-H2.
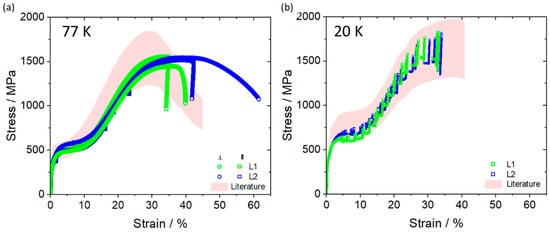
Since the material is subjected to different temperature regimes during service, the mechanical properties at cryogenic temperatures are particularly important. Figure 8 presents the respective results at 77 K and 20 K.
Figure 8.
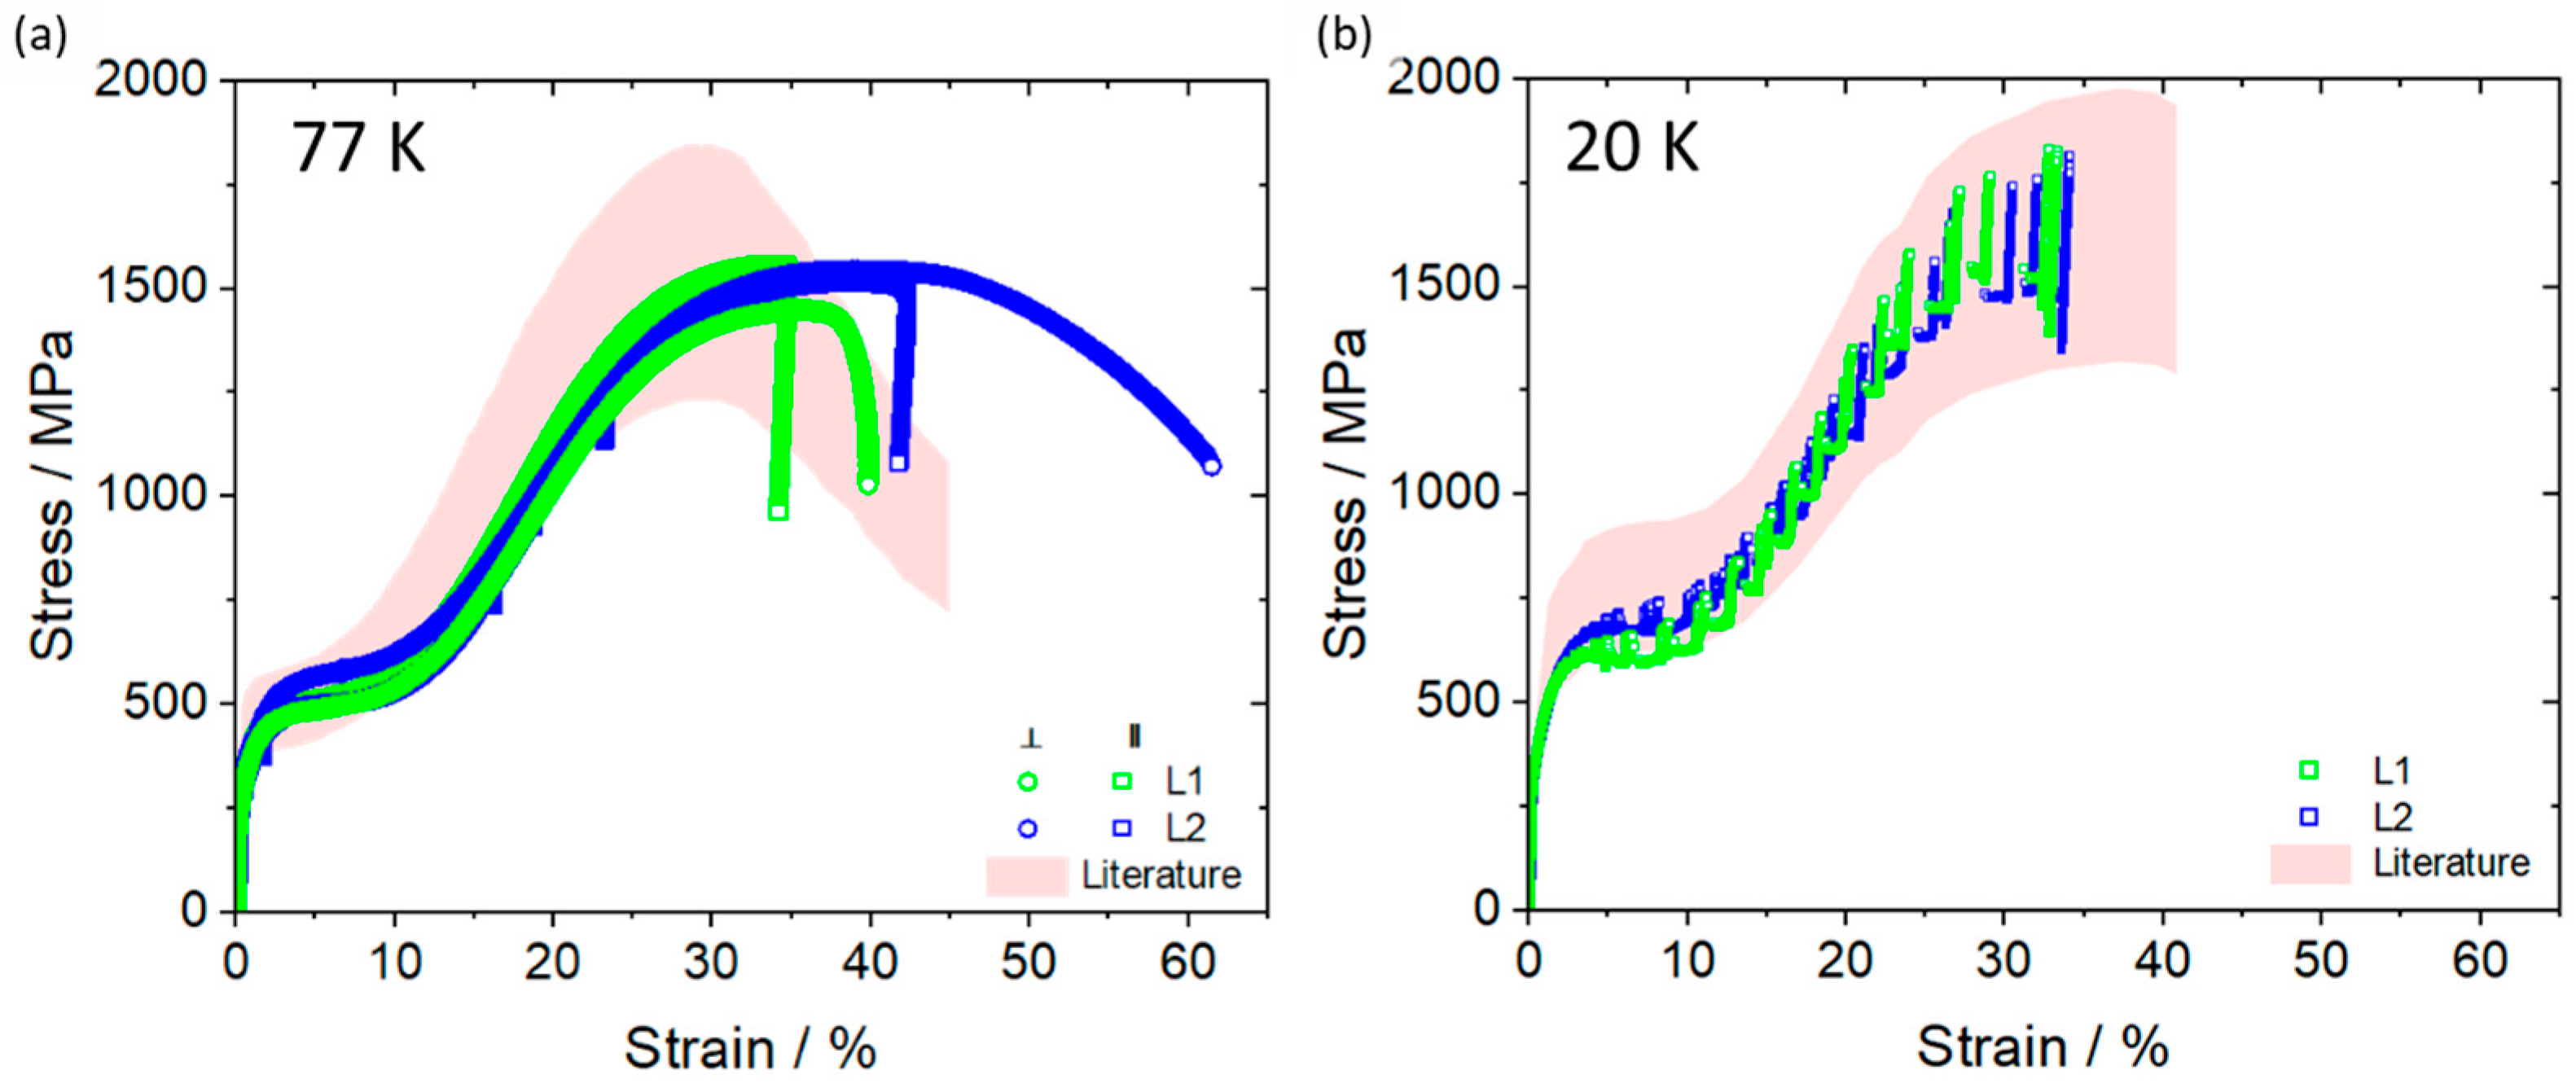
Stress–strain curves of L1 and L2 parallel and perpendicular to the curvature shown by green and blue circle and square symbols, respectively. The imposed initial strain rate in the experiments is ≈ 4 × 10⁻⁴ s−1. The red shaded area represents a results compilation from the literature [8,11,26,38,44]. Testing temperature (a) 77 K and (b) 20 K.
The stress–strain curves of specimens L1 and L2 obtained at 77 K are shown in Figure 8a. At 77 K the initial 0.2% offset yield strength is 288 (±2) MPa and 288 (±20) MPa for II and ⊥, respectively. The stress–strain characteristic displays a sigmoidal shape, with a sudden increase of the strain-hardening rate. In the early stage of tensile deformation ε-martensite forms and leads to the expected yield plateau [4,8,45]. The sharp increase in the stress–strain slope at about 10% strain is due to an increase in the density of deformation twins and α′-martensite resulting in a higher work hardening rate [8]. The ultimate tensile strengths are about and 1537 (±30) MPa and 1469 (±70) MPa for II and ⊥ direction, respectively. In comparison to literature results of ‘fresh’ non-charged material, shown as the light red shaded area, it can be seen that the shape of the stress–strain curves slightly differs, but no relevant degradation or embrittlement was observed at this temperature regime indicating the stability of 304 SS even after 30 years in service.
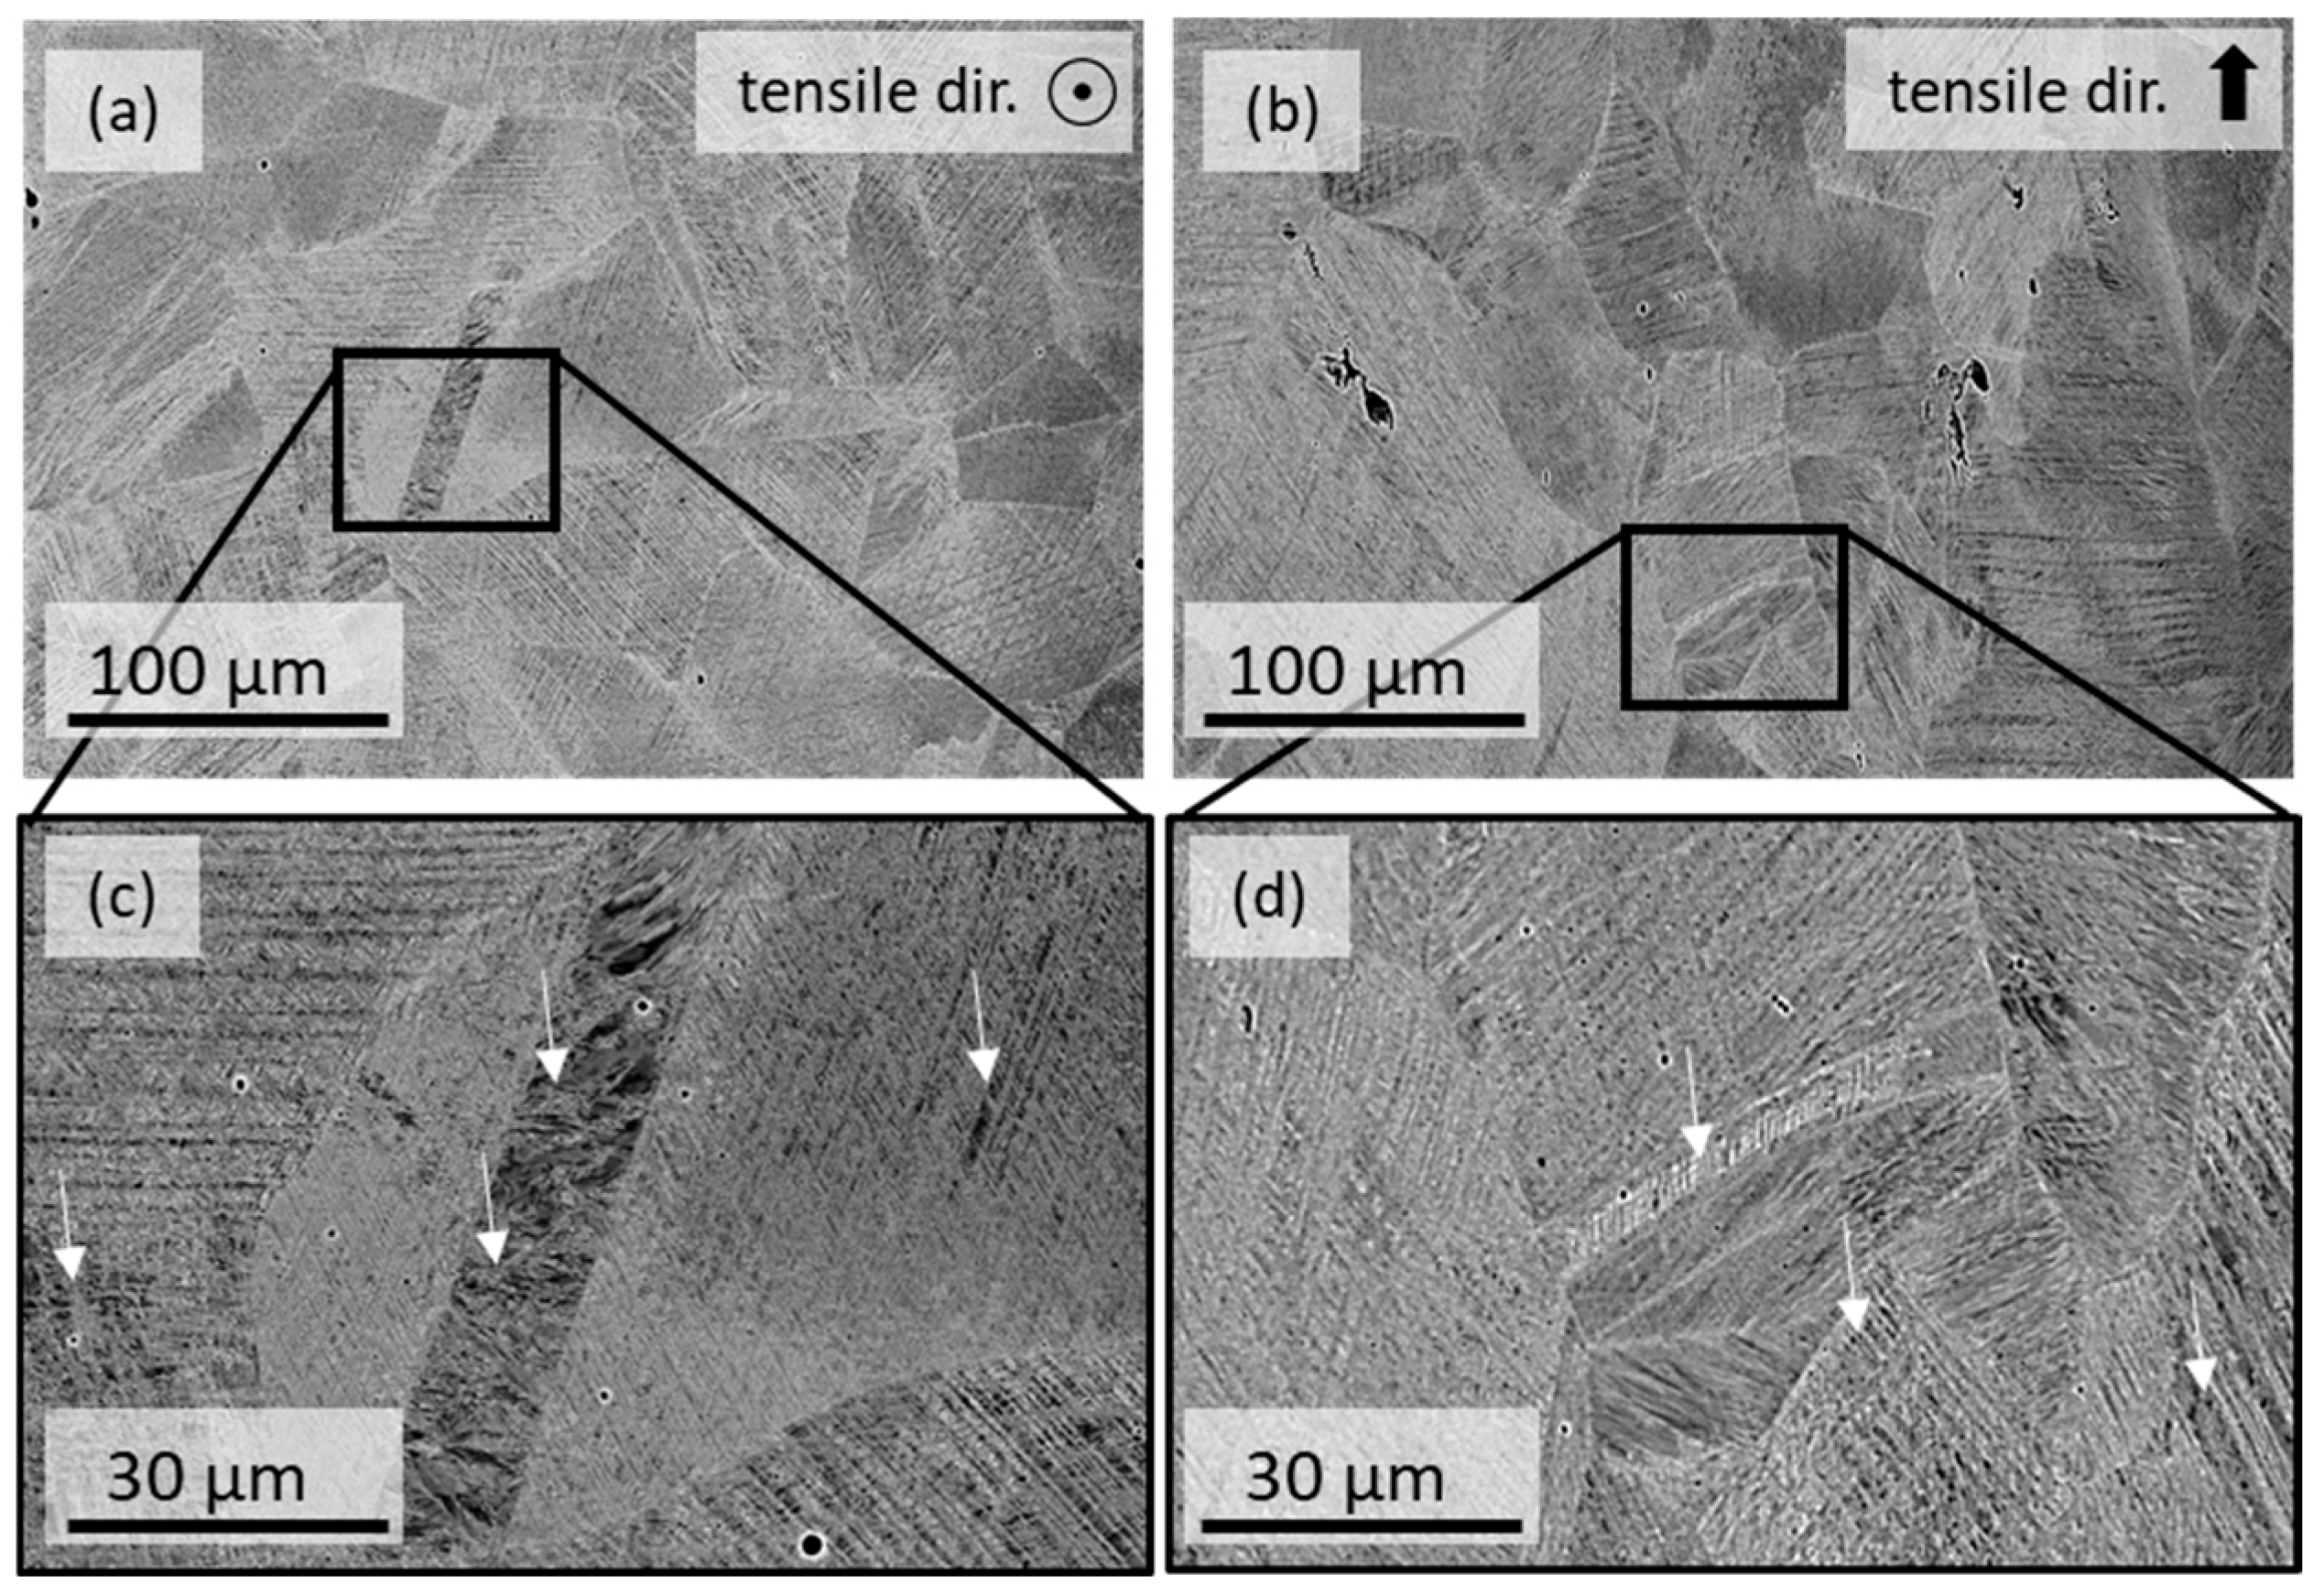
At 20 K the stress–strain curves presented in Figure 8b shift further up and the plastic flow exhibits a discontinuous behavior. The transition between continuous and discontinuous plastic flow is commonly observed in stainless steels at extremely low temperatures below 40 K [8]. It is associated with a change in the dominant type of dislocation motion from screw to edge character, as the latter requires a lower thermal energy for its formation and motion [46]. Comparing results from the literature on ‘fresh’ non-charged material, marked by the red shaded area, to the results in this work provides an overlapping shape. However, the yield strength as well as the yield plateau are located at the lower part of the literature band and the ultimate tensile strength is in the center of the literature band. The microstructure of the tested sample is depicted in Figure 9a and Figure 9b perpendicular and parallel to the tensile direction, respectively. Deformation twinning and martensite were observed within the plasticly deformed region of the sample. The presence of deformation twins is a typical characteristic of fcc metals that exhibit medium to low stacking fault energy, such as 23 mJ/m2 for 304 SS. The deformation twins appear to be in two or even three directions and intersecting each other. Martensite starts preferably to form at intersections or in the regions between the twins, which can be seen in Figure 9c,d. This was also reported in [5,47]. These microstructural and tensile test results indicate once more the absence of degradation and embrittlement that could be attributed to the long-term H2 exposure.
Figure 9.
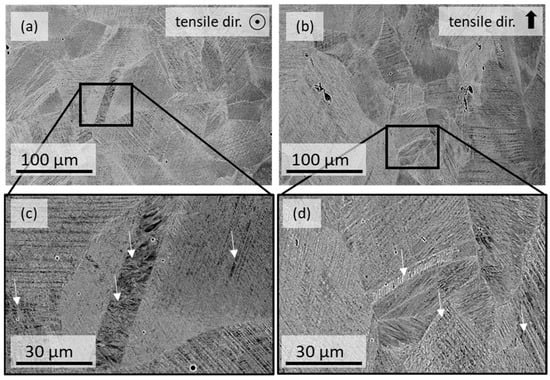
SEM-BSE mode in orientation contrast of the L1 sample after tensile test until fracture at 20 K: (a) cross section perpendicular to tensile direction, (b) cross section parallel to tensile direction, (c,d) magnified area corresponding to the black rectangle in (a,d). Martensite is observed within the twinned regions (white arrow).
3.4. Additional H2 Exposure: Thermal H-Charging at 300 K or 573 K and 200 Bar
3.4.1. H Content After Thermal H-Charging
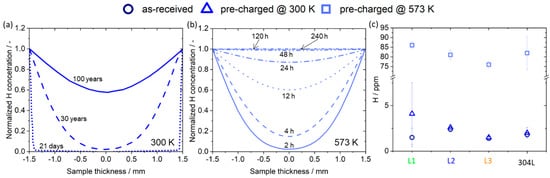
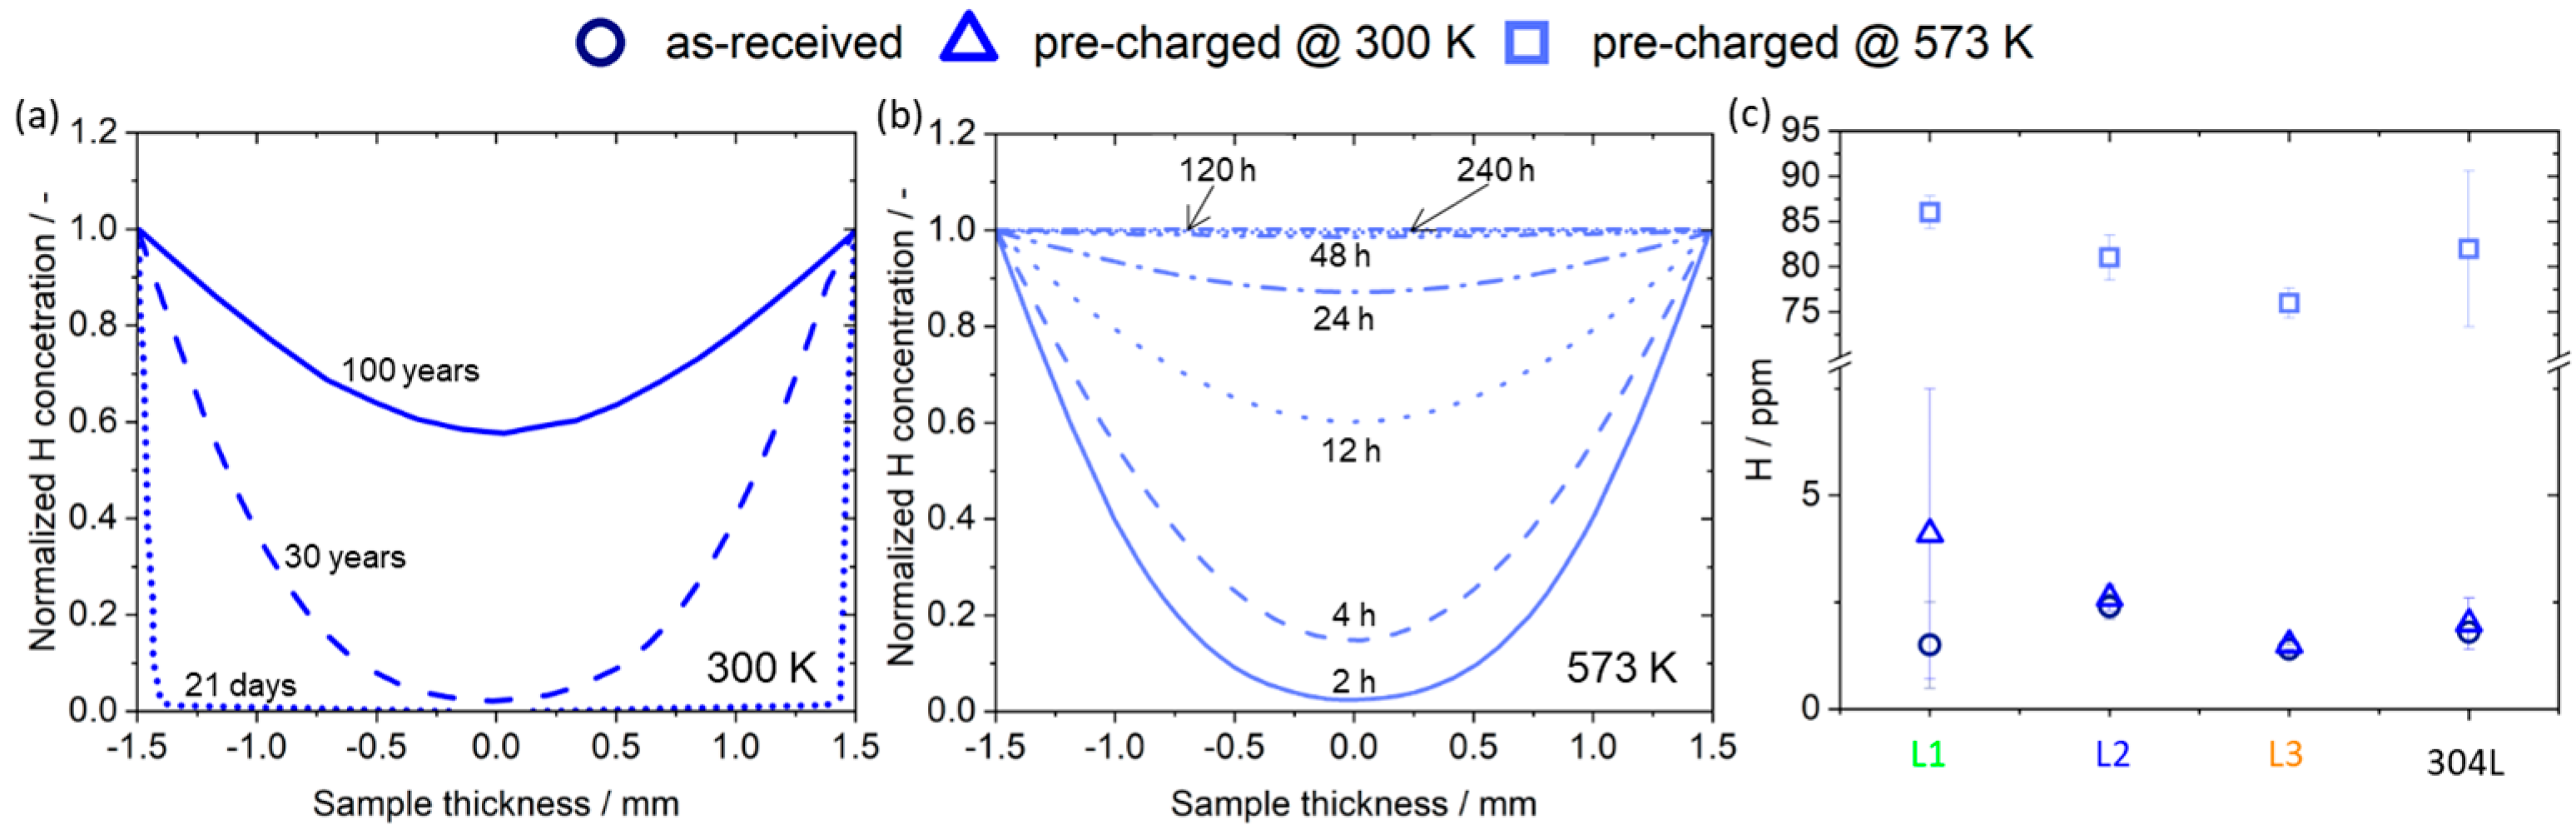
To further investigate the materials resistance to hydrogen embrittlement, specimens were thermally H-charged. Hydrogen uptake could possibly appear for instance in case of container warming during emptying. In order to achieve noticeable hydrogen contents, 300 K was chosen as the charging temperature and 573 K was used to maximize the H uptake and therefore also the effects. The H2 gas pressure was set to 200 bar and a charging duration of 21 days and 10 days at 300 K and 573 K was selected, respectively. Thermal hydrogen charging is recommended for metallic materials with a low hydrogen diffusion coefficient [48]. Elevated temperatures increase the diffusion rate and solubility limits for hydrogen in austenitic stainless steel without significantly affecting the microstructure. Calculation-based diffusion results of austenitic steels are illustrated in Figure 10a and Figure 10b, showing the penetration depth of H at 300 K and 573 K, respectively.
Figure 10.
Calculation-based diffusion results of austenitic steel showing the penetration depth of H as a function of the normalized H concentration after various pre-charging time and temperature of 3 mm thick sheets corresponding to the sample thickness for the pre-charging: (a) 300 K and 21 days, 30 years and 100 years; (b) 573 K and from 2 to 240 h. (c) Average hydrogen content of L1, L2, and L3 and ‘fresh’-304L in the as-received condition (open circles), after H2 exposure at 300 K and 21 days (open triangles), after H2 exposure at 573 K and 240 h (open squares).
The diffusion and solubility coefficients for the respective temperature were taken from Tanabe et al. [49]. The diagrams show the depth that H penetrates into the specimen with a normalized H concentration that ranges between zero for no H existence and one for saturated H. The influence of H2 pressure, which is an important factor alongside with temperature for increasing diffusivity of hydrogen [48] is not integrated in the calculation. Microstructural features, such as defects, are neglected although they play a major role for H solubility and also participate to H transport in steels through dislocation motion [33,50]. However, such calculations are a helpful tool in order to assess the charging parameters. As can be seen in Figure 10a, at 300 K a H2 charging of 21 days leads to H uptake only in the outer surface region (dotted line). This region expands for a H2 exposure of 30 years (dashed line) and 100 years (solid line), but the H content does not reach homogeneous distribution and saturation. This is due to the slow H transport in austenite [51,52]. Nevertheless, as a trade-off between duration and possible visible charging effect, 21 days were selected as exposure time. For 573 K, as depicted in Figure 10b, the H penetration depth increases rapidly with increasing exposure time. The calculation indicates that less than 10 days are needed to reach fully saturation and a homogeneous distribution of H across the austenite steel samples with a thickness of 3 mm. Based on these calculations, the H2 pre-charging at 573 K was set to 10 days. The pre-charged L1, L2, L3, and 304L specimens were stored in liquid nitrogen to prevent the outgassing of H before testing and measuring the H concentration. The latter is shown in Figure 10c as a comparison of the H concentration in ppm H of the as-received material to the pre-charged H concentrations dependent on the short-term H2 exposure time and temperature at a H2 pressure of 200 bar. While the as-received material is presented by open circles, the results after an H2 exposure at 300 K and 21 days and 573 K and 10 days are marked by open triangles and squares, respectively. The measured H content for the specimens being exposed at 300 K is slightly increased compared to the as-received ones. The high off value in L1 specimen indicate that H could have already been trapped in the specimen, which led to an increase in the average value of H content compared to the as-received results. The H2 thermal charging at 573 K, a much higher H content, was determined as seen in Figure 10c.
3.4.2. Mechanical Properties After Thermal H Pre-Charging
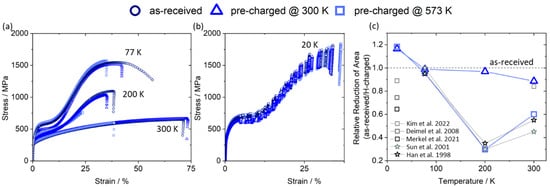
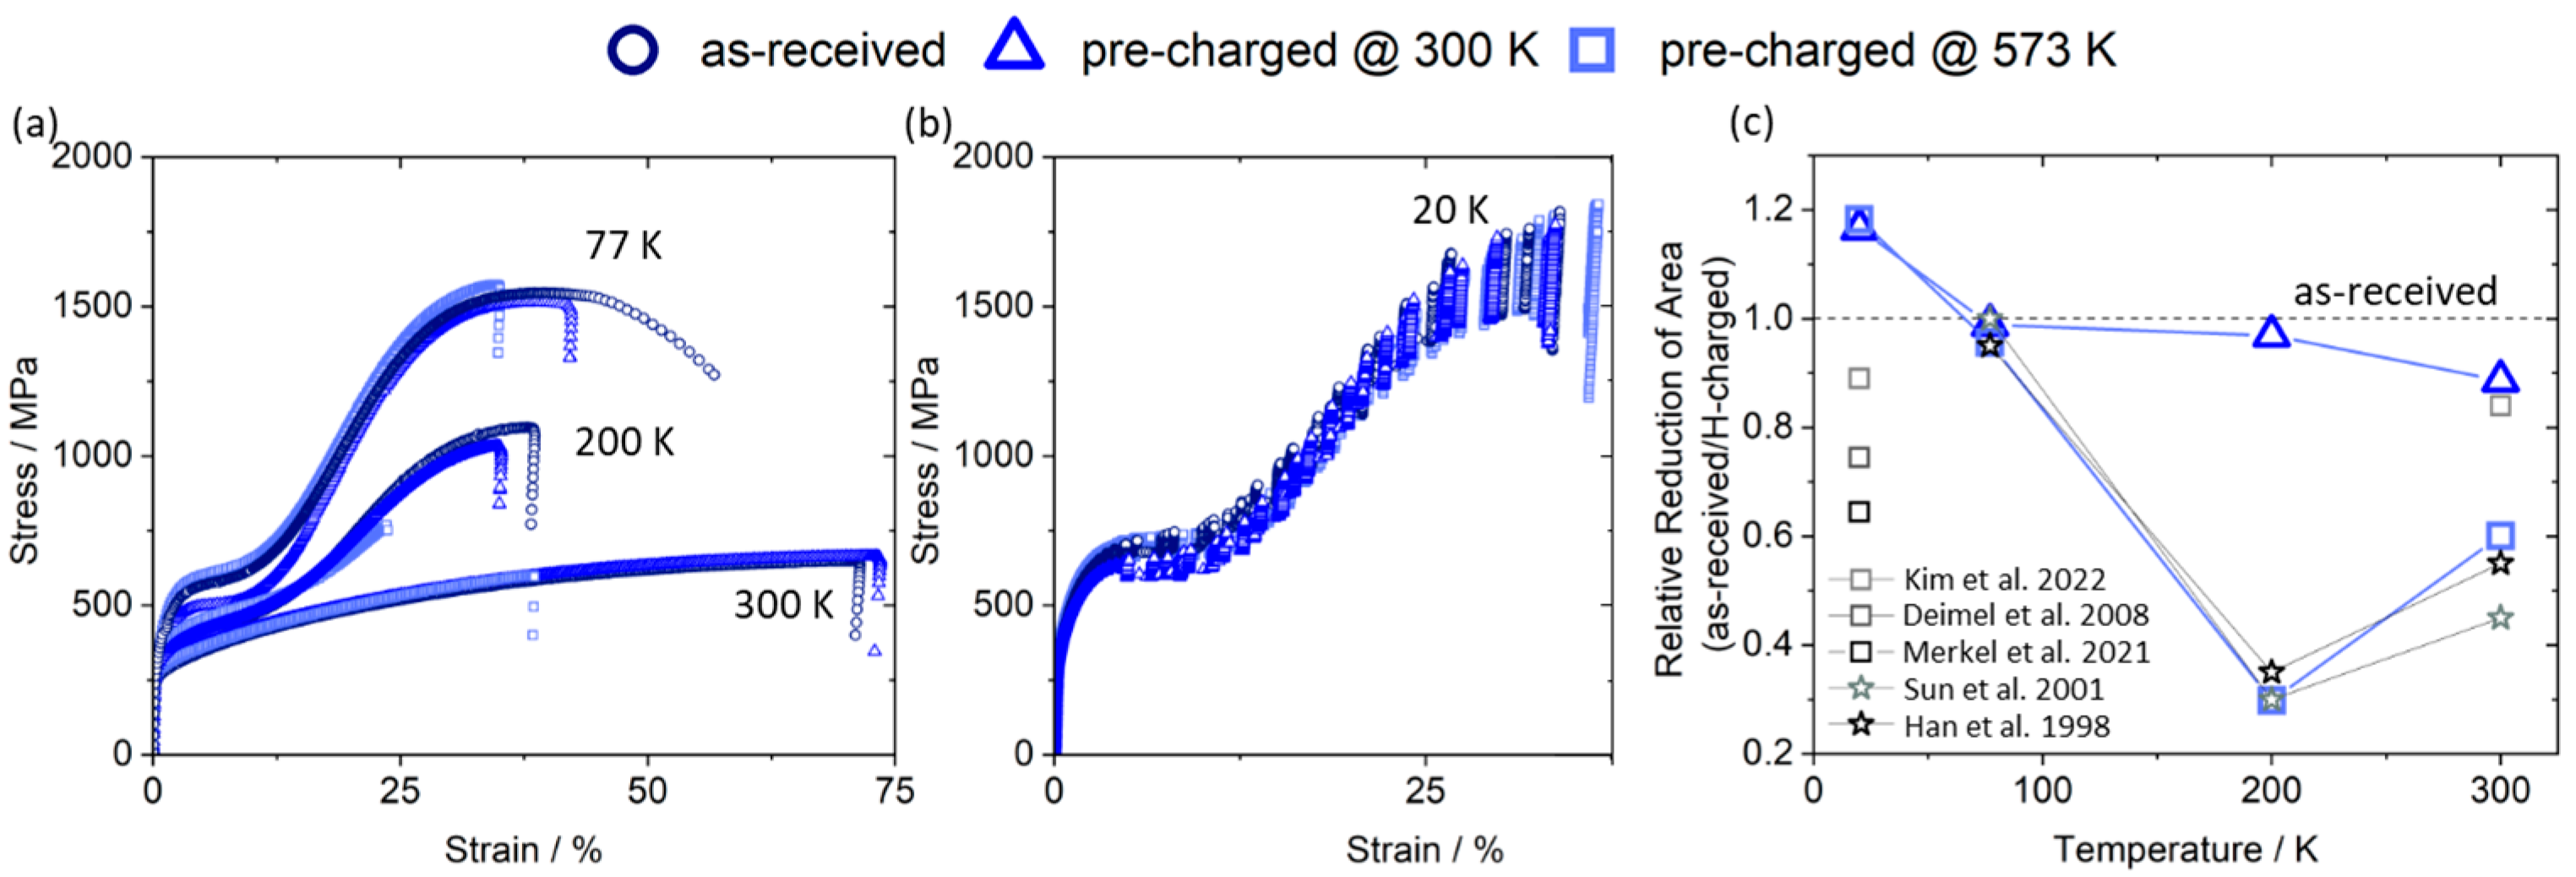
Tensile tests at different temperatures were carried out to determine the effect of hydrogen on the mechanical properties of the container steel plates after the additional thermal H pre-charging. The test parameters were kept the same as for the as-received specimens presented in Section 3.3, in order to make a reliable comparison. Figure 11a,b show the tensile stress–strain curves of as-received (open circles) and pre-charged samples at 300 K (open triangles) and 573 K (light open squares). The results at test temperature of 300 K, 200 K, and 77 K are shown in Figure 11a. Results obtained at 20 K are shown in Figure 11b. As the test temperature decreases, strain-hardening was observed, which is most likely due to active strain-induced α′ martensitic transformation [8].
Figure 11.
Stress–strain curves of L2 as-received, after pre-charging at 300 K for 21 days and pre-charging at 573 K for 10 days presented by open circle, triangle, and square symbols, respectively. The imposed initial strain rate in the experiments was ≈ 4 × 10⁻⁴ s−1. Testing temperature (a) 300 K, 200 K, and 77 K and (b) 20 K. (c) Relative reduction of area (RRA) of the as-received and pre-charged material versus testing temperatures. The symbols are equivalent to (a,b); the greyish symbols refer to results from the literature [26,27,28,53,54].
Both yield strength and ultimate tensile strength increased with decreasing temperature, regardless of H2 exposure. The yield strength and ultimate tensile strength of the as-received material and the pre-charged material at 300 K do not differ significantly. However, the material pre-charged at 573 K containing a high amount of H shows a reduced ultimate tensile strength at the testing temperature of 200 K and 300 K, compared to the as-received material. As seen in Figure 11a, the elongation to failure of the H pre-charged specimens was greatly decreased at 200 K and 300 K, as compared to the as-received material. This indicates the occurrence of HE. However, at 77 K this effect is less pronounced and vanishes completely at 20 K (Figure 11b, note the compressed strain axis). No reduction of the elongation to failure by H pre-charging was observed at this temperature, which means that HE is not dominant at 20 K. The total elongation can be affected by position of the failure and in/out of extensometer gauge length; therefore, the reached ultimate tensile strength and the relative reduction of area (RRA) are better indicators to assess the effect of HE. RRAs as a function of the test temperature range are plotted in Figure 11c. The RRA decreases with increasing temperature for the material pre-charged at 300 K for 21 days, while for the material pre-charged at 573 K and 10 days, the RRA reaches a minimum at around 200 K and then increases with a further increase in temperature. A higher loss in ductility was observed at 200 K and 300 K, which is typical for H2 exposed to austenitic steels [26,54]. The results in this work are consistent with the RRA minimum found in the range of 200–220 K and appear to be independent on the hydrogen charging method [26,54]. An explanation behind the RRA minimum was introduced and discussed by the so called “hydrogen reaction chain” concept [55]. This chain includes various processes: (i) the transport of hydrogen to the crack tip, (ii) physical adsorption, (iii) dissociative chemical adsorption, (iv) hydrogen absorption, (v) the transport of hydrogen to regions of tensile stress, and (vi) hydrogen material interactions, all of which are influenced by temperature. The concept concludes that slow hydrogen transport hinders hydrogen effects at low temperatures while negligible hydrogen trapping, particularly at dislocations, hinders hydrogen effects at high temperatures. Intermediate temperatures allow for interactions between hydrogen and dislocation with a maximum interaction at around 200 K in this case. At 77 K the RRA is near 1, which means that hydrogen influence in terms of embrittlement is neglectable at this temperature. As already discussed for the reduction in elongation, ductility loss was not observed at 20 K. Wada et al. [56] reported even a hydrogen-induced increase in elongation for pre-charged samples tested at 4.2 K. However, the increase in elongation was accompanied by the reduction of the RRA, which is not the case for the pre-charged and at 20 K tested material in this work. Moreover, an RRA ratio higher than one was found at 20 K for both charging parameters. The different H contents of 2.5 ppm H and 81 ppm H result in a similar RRA. This indicates that at 20 K no apparent HE takes place and that the effect caused by the hydrogen amount and separate effects might balance each other. Nevertheless, the few available reported investigations at 20 K from the literature are in contradiction with the results in this work. Merkel et al. [53] reported a RRA of 0.64 while comparing pre-charged 304 SS with 140 ppm H to non-charged material. Deimel et al. [28] obtained an RRA ratio of 0.75 for 304 tested in liquid H2 and He. Whereas, Kim et al. [27] performed tensile tests at 20 K on pre-charged samples with 12 ppm H, which resulted in an RRA of 0.89. The later one is the closest to the results calculated in the present work of 1.16 and 1.18 for the material pre-charged at 300 K for 21 days and for the material pre-charged at 573 K and 10 days, respectively. It has to be pointed out that this comparison to the RRAs reported in the literature needs to be interpreted carefully, since hydrogen concentrations and the hydrogen interaction within the material are influenced by fluctuations in alloy composition, microstructure, and the density of defects [57,58,59]. Hydrogen solubility changes when the alloy composition changes [57]. Diffusivity is also found to be composition dependent and since the permeability is the product of the solubility and diffusivity, and permeability is essentially the same for all stainless steels, the higher the diffusivity the lower the solubility [57]. This is important since the strain-induced martensite exhibits higher diffusivity than the austenite, and acts as a rapid hydrogen transporting path [60,61]. It was concluded in the literature that the transport of hydrogen during the deformation is enhanced via martensite formation rather than by dislocations [23,35,60]. Moreover, dislocations are neither a requirement for hydrogen-assisted fracture in austenitic stainless steels [23] nor substantial for diffusive transport [35]. Considering the fact that the material in the literature was neither exposed to H2 nor experienced mechanical pre-loading prior to testing conditions like the material in this work, which was already used in contact with hydrogen for over 30 years, the actual results of this study are valuable and of interest for engineering and designing trustful liquid hydrogen storage containers and transportation systems. As Merkel et al. [53] postulated, hydrogen can degrade the material even down to 20 K, which could not be confirmed in this work based on the determined RRA ratios and on fractographic analysis, which are presented in the following chapter.
3.4.3. Fractographic Analysis of the Material Pre-Charged at 573 K and Tested
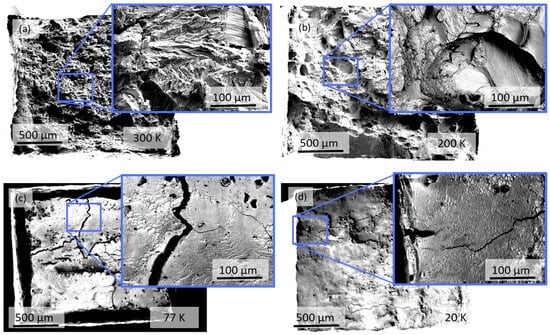
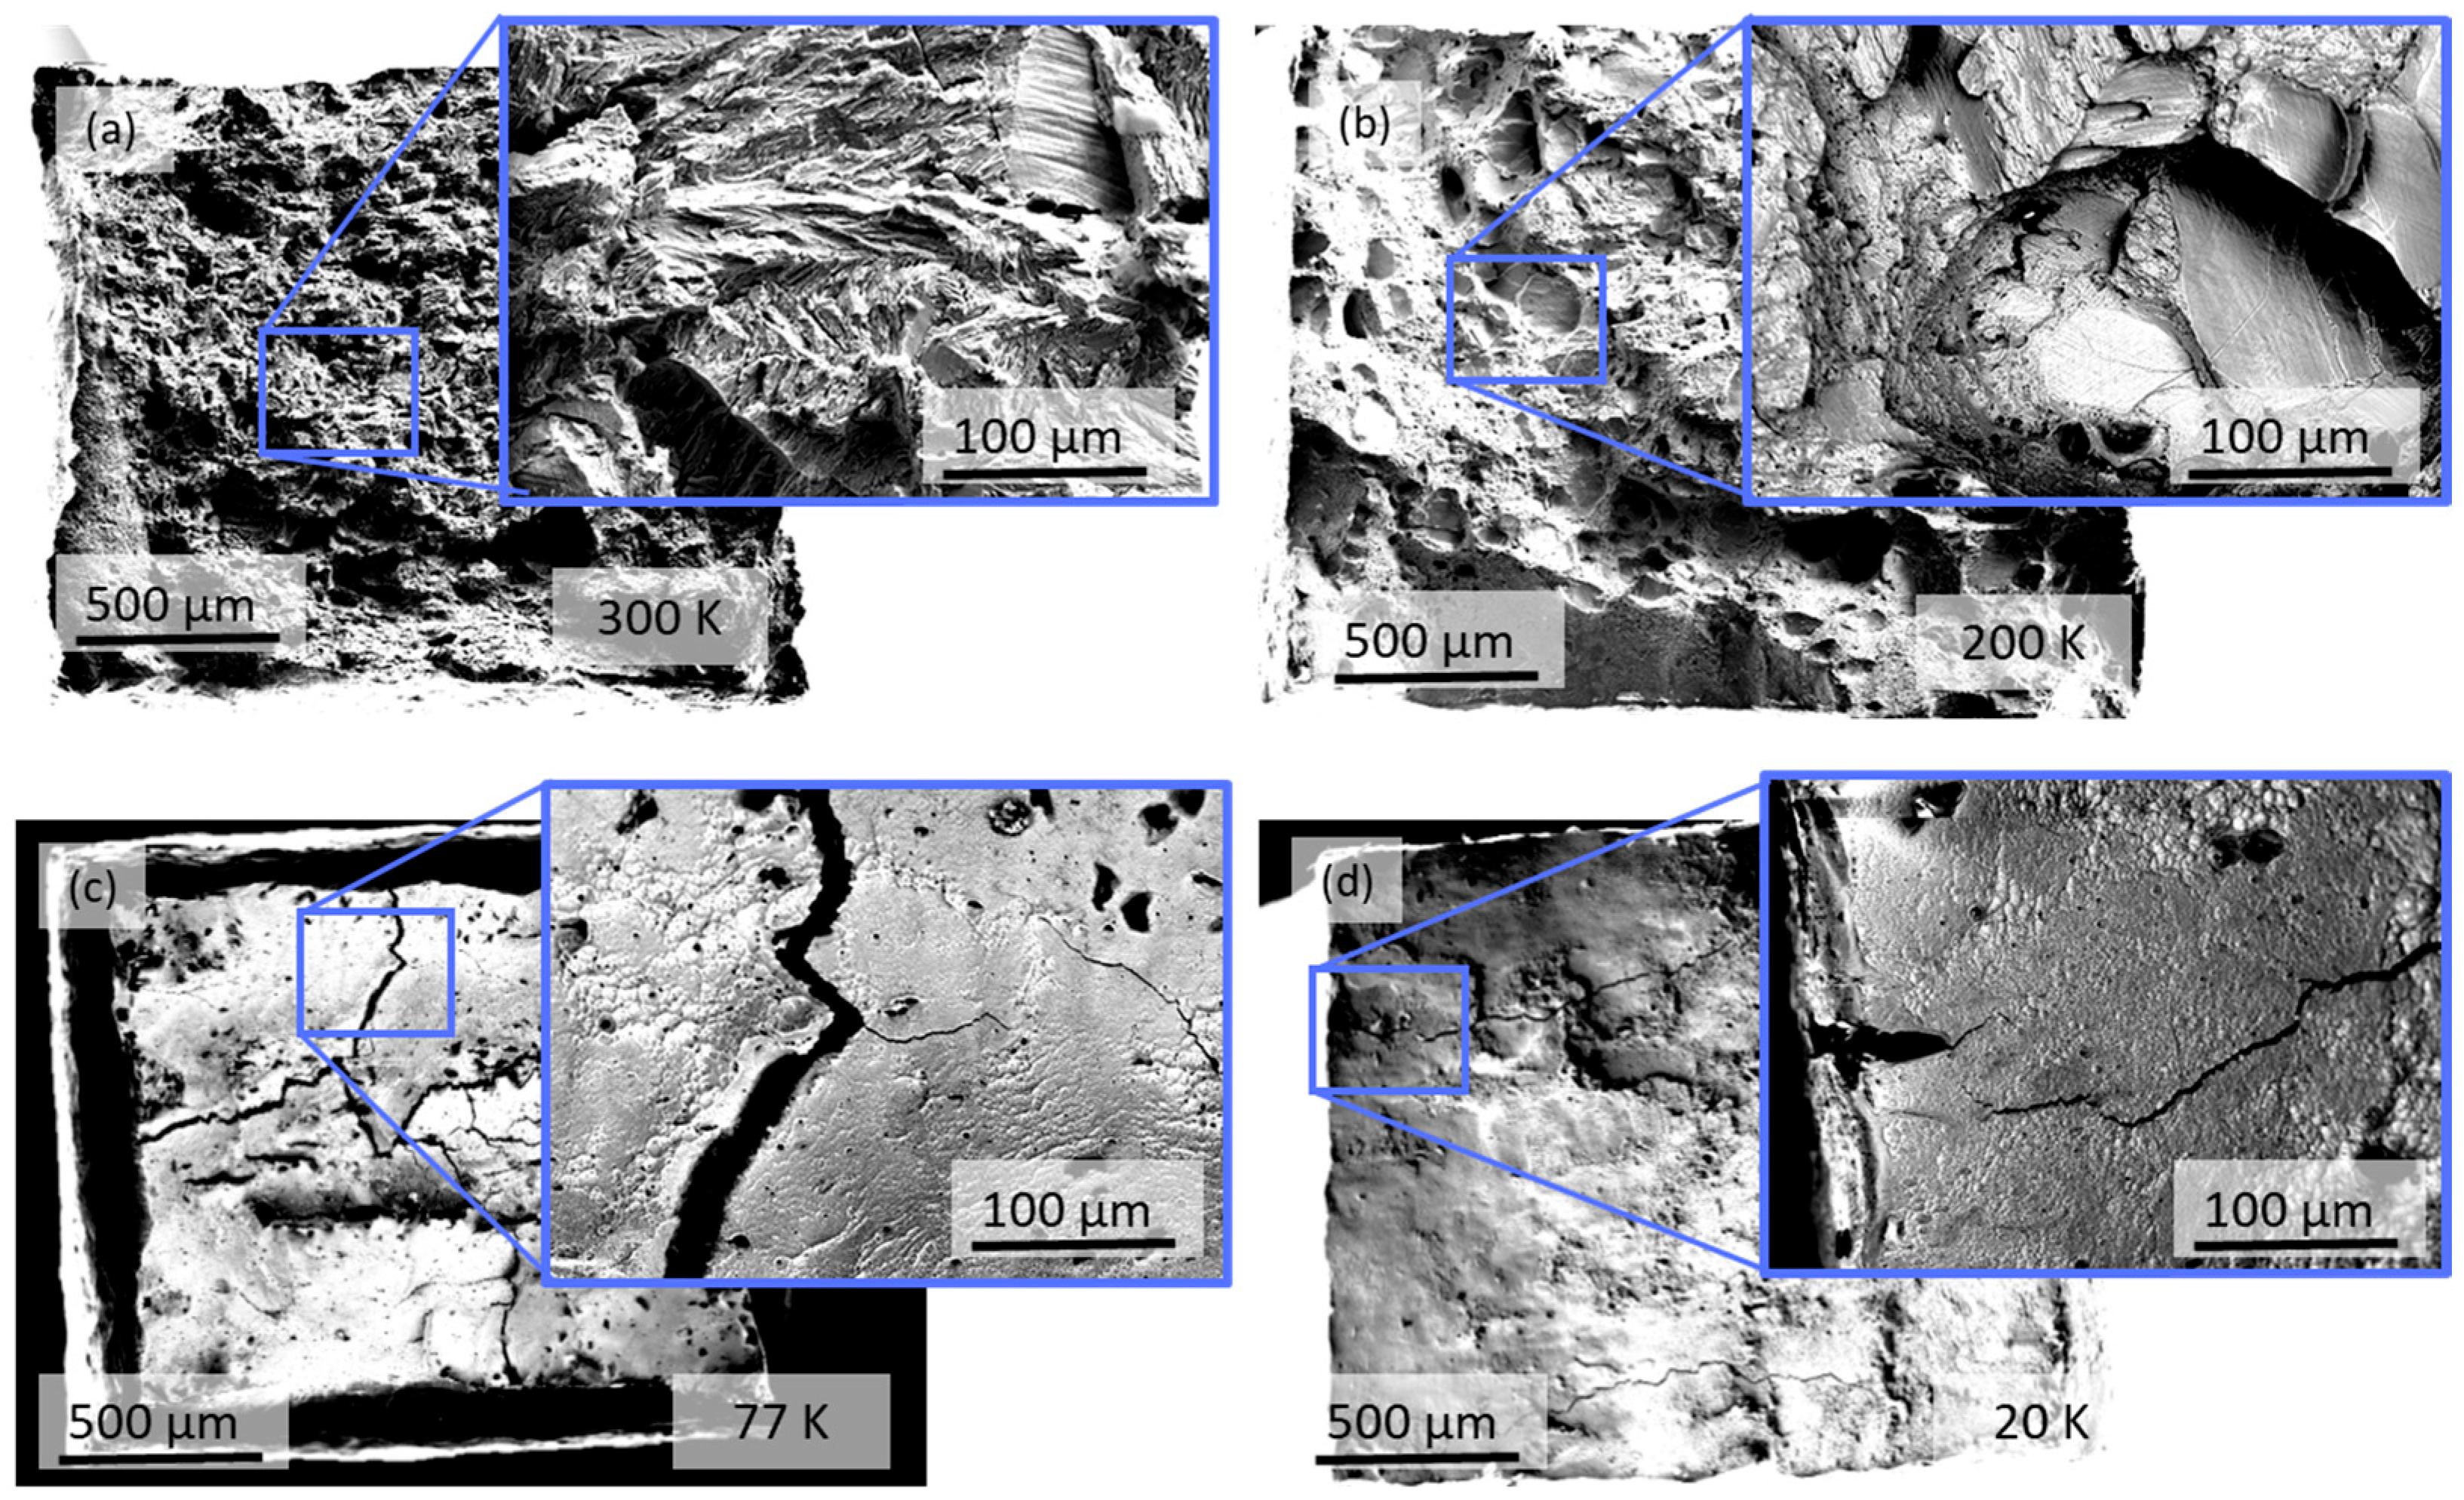
Figure 12 shows the fracture surface morphologies of specimens that were H pre-charged at 573 K for 10 days at 200 bar and tested at different temperatures. At 300 K (Figure 12a), the fracture surface was covered with cleavages signatures and some flat surfaces. This is attributed to transgranular fracture along strain-induced martensite laths and to twin boundary fracture.
Figure 12.
SEM-ETD mode images of the fracture surfaces of pre-charged material (81 ppm H) after tensile testing at (a) 300 K, (b) 200 K, (c) 77 K, (d) 20 K.
Such surfaces are typical for hydrogen-induced brittle fracture mechanisms and are often observed [26,54,56]. As the temperature decreases from 300 K to 200 K, the area of twin boundary fracture (flat surfaces) increases and that of transgranular fracture along strain-induced martensite laths (cleavages signature) decreases. At the fracture surfaces at 77 K and 20 K (Figure 12c,d), dimples and macroscopically large vertical cracks were observed for both temperatures, indicating that cracking is a special fracture mode in the presence of hydrogen at cryogenic temperatures. Merkel et al. [53] also found fracture surfaces showing secondary cracks at 77 K and 20 K, which were absent at the non-charged samples. Fractography in this study is consistent with hydrogen-assisted fracture showing evidence of secondary cracking, which is not present in the as-received state as well as in the pre-charged state with 2.5 ppm H. As a conclusion, the existence of the vertical secondary cracks is not directly linked to a material degradation [56] in terms of reduction of the RRA and mechanical behavior, but to some extent confirms the hydrogen participation to crack formation and propagation.
4. Summary and Conclusions
Within this work, as-received material from a container from the Linde GmbH company was investigated, which was used for over 30 years in contact with cryogenic and liquid H2. Analysis of the material showed SS 304 and SS 304L compositions. The work is divided into two parts; the first part is dedicated to the microstructural analysis of the material and the remaining mechanical properties after long-term cryogenic and liquid H2 exposition. The second part focuses on the effect of an additional thermal pre-charging on the material’s behavior.
The results are as follows:
No significant variation in the H-concentration was found, nor did the H content significantly change in the different steel plates, or over the cross section of L1, which was slightly seen in L2. Furthermore, the obtained H content for the as-received material was similar to the measured amount in ‘fresh’ material.
The microstructural analysis and tensile test results indicate the absence of degradation and embrittlement that could be attributed to the long-term H2 exposure. No significant damage was observed after 30 years in operation, nor were there changes in the microstructure or variation in the tensile behavior compared to ‘fresh’ samples of the same alloy composition and similar testing parameters.
Calculations on the H distribution after 21 days hydrogen exposure at 300 K showed that H is present only in the surface region of the sample. After 30 years, H is expected throughout the bulk but not evenly distributed. Even after 100 years of exposure at 300 K the H concentration is not distributed homogenously. For an exposure temperature of 573 K, less than 10 days are needed to reach full saturation and a homogeneous distribution.
Hydrogen-induced ductility loss described by RRA showed well-described behavior from 300 K to 77 K. A new temperature dependence was observed when decreasing the temperature to 20 K. The determined RRA is independent on the H concentration at 20 K.
Fractography is consistent with hydrogen-assisted fracture showing evidence of secondary cracks, which are not present in the as-received state. The existence of the vertical secondary cracks is not directly linked to a material degradation but confirms hydrogen participation in their formation.
The selection of this stainless steel seems to be a good solution for the requirements of corrosion resistance, temperature, and quasi static mechanical behavior of systems in contact with cryogenic and liquid H2. The results emphasize the recommendation of using austenitic steels, such as 304 stainless steels, for LH2 applications. Nevertheless, further investigation regarding, e.g., fracture toughness and fatigue behavior, need to be performant in order to confirm the use of 304 in H2 environment and dynamic mechanical loading.
Author Contributions
C.S.: Writing—original draft, visualization, investigation, data curation, conceptualization. M.M.: Methodology, writing, data curation. Z.A.: Methodology, calculation, review and editing. E.G.: Methodology, review and editing. A.P.: Writing—review and editing, Supervision. K.-P.W.: Writing—review and editing, Supervision. All authors have read and agreed to the published version of the manuscript.
Funding
The authors gratefully acknowledge the financial support of the project “TransHyDE_FP4” (FKZ 03HY204A) by the German Federal Ministry of Research, Technology and Space (BMFTR) and the project supervision by the project management organization Projektträger Jülich (PtJ).
Data Availability Statement
The raw data supporting the conclusions of this article will be made available by the authors on request.
Acknowledgments
The authors would like to thank A. Alekseev from Linde GmbH for providing the long-term container material. S. Eckerle, V. Tschan, K. Genswein, and M. Nagel for testing and metallographic preparation, and A. Srinivasan and F. Ebling for their discussions.
Conflicts of Interest
The authors declare no conflicts of interest. The funders had no role in the design of the study; in the collection, analyses, or interpretation of data; in the writing of the manuscript; or in the decision to publish the results. The work mainly contains results generated within the project AppLHy! in the Hydrogen Flagship Project TransHyDE. The content of the publication produced in the project is independently of the Federal Ministry of Research, Technology and Space and do not represent their opinion.
References
- Baddoo, N.R. Stainless steel in construction: A review of research, applications, challenges and opportunities. J. Constr. Steel Res. 2008, 64, 1199–1206. [Google Scholar] [CrossRef] [Scilit]
- Sanchez, J.; Fullea, J.; Andrade, C.; Alonso, C. Stress Corrosion Cracking Behavior of Duplex Stainless Steel by Slow Strain Rate Tests. Corrosion 2009, 65, 154–159. [Google Scholar] [CrossRef] [Scilit]
- Sakurai, T.; Umezawa, O.; Ono, Y. Strength and Fracture Toughness of Type 304 and 316 Austenitic Stainless Steels at 4.2 K. IOP Conf. Ser. Mater. Sci. Eng. 2024, 1302, 012002. [Google Scholar] [CrossRef] [Scilit]
- Lee, J.-C.; Noh, Y.; Kim, N.-S.; Park, K.B.; Kim, H.; Cho, H.-H.; Park, H.-K.; Jun, T.-S.; Park, C.-S. Effect of Texture and Temperature on Strain-Induced Martensitic Transformation in 304 Austenitic Stainless Steel. Steel Res. Int. 2023, 94, 2200243. [Google Scholar] [CrossRef] [Scilit]
- Shen, Y.F.; Li, X.X.; Sun, X.; Wang, Y.D.; Zuo, L. Twinning and martensite in a 304 austenitic stainless steel. Mater. Sci. Eng. A 2012, 552, 514–522. [Google Scholar] [CrossRef] [Scilit]
- Park, W.S.; Yoo, S.W.; Kim, M.H.; Lee, J.M. Strain-rate effects on the mechanical behavior of the AISI 300 series of austenitic stainless steel under cryogenic environments. Mater. Des. 2010, 31, 3630–3640. [Google Scholar] [CrossRef] [Scilit]
- Zheng, C.; Hu, L.; Zhen, Q.; Tang, Y.; Wang, Y.; Li, N.; Jiang, H. Low temperature mechanical behavior of fine- and ultrafine-grained 304 austenitic stainless steel fabricated by cryogenic-rolling and annealing. Mater. Charact. 2022, 191, 112084. [Google Scholar] [CrossRef] [Scilit]
- Fernández-Pisón, P.; Rodríguez-Martínez, J.A.; García-Tabarés, E.; Avilés-Santillana, I.; Sgobba, S. Flow and fracture of austenitic stainless steels at cryogenic temperatures. Eng. Fract. Mech. 2021, 258, 108042. [Google Scholar] [CrossRef] [Scilit]
- McRae, D.M.; Walsh, R.P.; Dalder, E.N.C.; Litherland, S.; Trosen, M.; Kuhlmann, D.J. Fatigue and fracture properties of a super-austenitic stainless steel at 295 K and 4 K. AIP Conf. Proc. 2014, 60, 59–66. [Google Scholar] [CrossRef] [Scilit]
- Zheng, C.; Yu, W. Effect of low-temperature on mechanical behavior for an AISI 304 austenitic stainless steel. Mater. Sci. Eng. A 2018, 710, 359–365. [Google Scholar] [CrossRef] [Scilit]
- Sanchez, J.; Galao, O.; Torres, J.; Fullea, J.; Andrade, C.; Garcia, J.C.; Ruesga, J.; Cano, P. 40 years old LNG stainless steel pipeline: Characterization and mechanical behavior. Eng. Fail. Anal. 2017, 79, 876–888. [Google Scholar] [CrossRef] [Scilit]
- Singla, M.K.; Nijhawan, P.; Oberoi, A.S. Hydrogen fuel and fuel cell technology for cleaner future: A review. Env. Sci. Pollut. Res. 2021, 28, 15607–15626. [Google Scholar] [CrossRef] [Scilit]
- Barthelemy, H.; Weber, M.; Barbier, F. Hydrogen storage: Recent improvements and industrial perspectives. Int. J. Hydrogen Energy 2017, 42, 7254–7262. [Google Scholar] [CrossRef] [Scilit]
- Al-Hallaj, S.; Kiszynski, K. Hydrogen Production, Storage and Fuel Cells’, in Hybrid Hydrogen Systems, in Green Energy and Technology; Springer: London, UK, 2011; pp. 31–53. [Google Scholar] [CrossRef] [Scilit]
- Qiu, Y.; Yang, H.; Tong, L.; Wang, L. Research Progress of Cryogenic Materials for Storage and Transportation of Liquid Hydrogen. Metals 2021, 11, 1101. [Google Scholar] [CrossRef] [Scilit]
- American Institute of Aeronautics and Astronautics (Ed.) Guide to Safety of Hydrogen and Hydrogen Systems (ANSI/AIAA G-095A-2017). In 12700 Sunrise Vally Drive; American Institute of Aeronautics and Astronautics, Inc.: Reston, VA, USA, 2017. [Google Scholar] [CrossRef] [Scilit]
- Caskey, G.R., Jr. Hydrogen Compatibility Handbook for Stainless Steels; DP-1643; Savannah River Laboratory: Jackson, SC, USA, 1983; p. 5906050. [Google Scholar] [CrossRef] [Scilit]
- Wolf, C.; Alekseev, A.; Primke, F.; Rehfeldt, S.; Klein, H. Model and Simulation of the Liquid Hydrogen Distribution by Trailer. IOP Conf. Ser. Mater. Sci. Eng. 2025, 1327, 012140. [Google Scholar] [CrossRef] [Scilit]
- Alekseev, A.; Arndt, T.; Haberstroh, C.; Jordan, T.; Lindackers, D.; Palacios Vera, J.S.; Pundt, A.; Saß, P.; Schulz, C.; Weiss, K.P.; et al. Hydrogen Liquefaction, Storage, Transport and Application of liquid Hydrogen; Karlsruher Institut für Technologie (KIT): Karlsruhe, Germany, 2023. [Google Scholar] [CrossRef]
- Wolf, C.; Primke, F.; Alekseev, A.; Rehfeldt, S.; Klein, H. Validation of a Thermodynamic Model for the Liquid Hydrogen Distribution Utilizing Novel Data from an Operational Trailer. Int. J. Hydrogen Energy 2025, 193, 152397. [Google Scholar] [CrossRef] [Scilit]
- San Marchi, C.; Michler, T.; Nibur, K.A.; Somerday, B.P. On the physical differences between tensile testing of type 304 and 316 austenitic stainless steels with internal hydrogen and in external hydrogen. Int. J. Hydrogen Energy 2010, 35, 9736–9745. [Google Scholar] [CrossRef] [Scilit]
- Ronevich, J.; San Marchi, C.; Balch, D.K. Evaluating the Resistance of Austenitic Stainless Steel Welds to Hydrogen Embrittlement. In Proceedings of the ASME 2019 Pressure Vessels & Piping Conference, San Antonio, TX, USA, 14–19 July 2019; p. V06BT06A035. [Google Scholar] [CrossRef] [Scilit]
- Louthan, M.R. Hydrogen Embrittlement of Metals: A Primer for the Failure Analyst. J. Fail. Anal. Preven. 2008, 8, 289–307. [Google Scholar] [CrossRef] [Scilit]
- Imade, M.; Zhang, L.; Wen, M.; Iijima, T.; Fukuyama, S.; Yokogawa, K. Internal Reversible Hydrogen Embrittlement and Hydrogen Gas Embrittlement of Austenitic Stainless Steels Based on Type 316. In Proceedings of the ASME 2009 Pressure Vessels and Piping Conference, Prague, Czech Republic, 26–30 July 2009; pp. 205–213. [Google Scholar] [CrossRef] [Scilit]
- Zhang, H.; Zheng, L.-W.; Wang, T.; Lv, W.-J.; Shi, Q.-X.; Ma, J.-Y.; Luo, Y.; Liang, W.; Hu, J.; Misra, R. Interrelationship between hydrogen and α′-martensite of SUS 304 austenitic stainless steel revealed by tensile tests. Mater. Sci. Eng. A 2022, 831, 142169. [Google Scholar] [CrossRef] [Scilit]
- Sun, D.; Han, G.; Vaodee, S.; Fukuyama, S.; Yokogawa, K. Tensile behavior of type 304 austenitic stainless steels in hydrogen atmosphere at low temperatures. Mater. Sci. Technol. 2001, 17, 302–308. [Google Scholar] [CrossRef] [Scilit]
- Kim, M.-S.; Lee, T.; Son, Y.; Park, J.; Kim, M.; Eun, H.; Park, J.-W.; Kim, Y. Metallic Material Evaluation of Liquid Hydrogen Storage Tank for Marine Application Using a Tensile Cryostat for 20 K and Electrochemical Cell. Processes 2022, 10, 2401. [Google Scholar] [CrossRef] [Scilit]
- Deimel, P.; Sattler, E. Austenitic steels of different composition in liquid and gaseous hydrogen. Corros. Sci. 2008, 50, 1598–1607. [Google Scholar] [CrossRef] [Scilit]
- Grabke, H.J.; Riecke, E. Absorption and Diffusion of Hydrogen in Steels. Mater. Tehnol. 2000, 34, 331–342. [Google Scholar]
- Linde Gases & Applications Are Everywhere. Available online: https://www.linde-gas.com/ (accessed on 6 May 2026).
- Sas, J.; Weiss, K.-P.; Bagrets, N. Cryomak—The Overview of Cryogenic Testing Facilities in Karlsruhe. Acta Metall. Slovaca 2015, 21, 330–338. [Google Scholar] [CrossRef] [Scilit]
- San Marchi, C.; Somerday, B.P. Technical Reference for Hydrogen Compatibility of Materials; No. SAND2012-7321; Sandia National Laboratories: Albuquerque, NM, USA, 2012; p. 1055634. [CrossRef] [Scilit]
- Pundt, A.; Kirchheim, R. Hydrogen in Metals: Microstructural Aspects. Annu. Rev. Mater. Res. 2006, 36, 555–608. [Google Scholar] [CrossRef] [Scilit]
- Chill, F.; Wilfert, S.; Bozyk, L. Cryopumping of hydrogen on stainless steel in the temperature range between 7 and 18 K. J. Vac. Sci. Technol. A 2019, 37, 031601. [Google Scholar] [CrossRef] [Scilit]
- Ladna, B.; Birnbaum, H.K. A study of hydrogen transport during plastic deformation. Acta Metall. 1987, 35, 1775–1778. [Google Scholar] [CrossRef] [Scilit]
- Naghizadeh, M.; Mirzadeh, H. Microstructural Evolutions During Annealing of Plastically Deformed AISI 304 Austenitic Stainless Steel: Martensite Reversion, Grain Refinement, Recrystallization, and Grain Growth. Metall. Mater. Trans. A 2016, 47, 4210–4216. [Google Scholar] [CrossRef] [Scilit]
- Odnobokova, M.; Belyakov, A.; Enikeev, N.; Kaibyshev, R.; Valiev, R.Z. Microstructural Changes and Strengthening of Austenitic Stainless Steels during Rolling at 473 K. Metals 2020, 10, 1614. [Google Scholar] [CrossRef] [Scilit]
- Li, X.; Wei, Y.; Wei, Z.; Zhou, J. Effect of Cold Rolling on Microstructure and Mechanical Properties of AISI 304N Stainless Steel. IOP Conf. Ser. Earth Environ. Sci. 2019, 252, 022027. [Google Scholar] [CrossRef] [Scilit]
- Nikitin, I.; Scholtes, B. Deep rolling of austenitic steel AISI 304 at different temperatures—Near surface microstructures and fatigue. HTM J. Heat Treat. Mater. 2012, 67, 188–194. [Google Scholar] [CrossRef] [Scilit]
- Altenberger, I.; Scholtes, B.; Martin, U.; Oettel, H. Cyclic deformation and near surface microstructures of shot peened or deep rolled austenitic stainless steel AISI 304. Mater. Sci. Eng. A 1999, 264, 1–16. [Google Scholar] [CrossRef] [Scilit]
- Zhao, X.; Gu, K.; Zhang, M.; Weng, Z.; Pan, R.; Liu, B.; Wang, J. Evolution of surface gradient hardening layer of AISI 304 stainless steel induced by cryogenic conventional shot peening. Mater. Sci. Eng. A 2025, 925, 147919. [Google Scholar] [CrossRef] [Scilit]
- Saam, W.F. Wetting, Capillary Condensation and More. J. Low Temp. Phys. 2009, 157, 77–100. [Google Scholar] [CrossRef] [Scilit]
- Xia, Y.; Zhao, M.; Ma, Y.; Liu, X.; Ying, M.; Mei, L. Condensation and phase transition of hydrogen molecules confined in single-walled carbon nanotubes. Phys. Rev. B 2003, 67, 115117. [Google Scholar] [CrossRef] [Scilit]
- Voyer, R.; Weil, L. Tensile and Creep Properties of a High Nitrogen Content 18/10 (AISI 304-L) Stainless Steel at Cryogenic Temperatures. In Advances in Cryogenic Engineering; Timmerhaus, K.D., Ed.; Springer: Boston, MA, USA, 1966; pp. 447–452. [Google Scholar] [CrossRef] [Scilit]
- Morris, J.W.; Chan, J.W.; Mei, Z. The Influence of Deformation-Induced Martensite on the Cryogenic Behavior of 300-series Stainless Steel. In Proceedings of the Fourteenth International Cryogenic Engineering Conference and International Cryogenic Materials Conference, Kiev, Ukraine, 8–12 June 1992; Available online: https://escholarship.org/uc/item/0zx8w8dr (accessed on 6 May 2026).
- Obst, B.; Nyilas, A. Experimental evidence on the dislocation mechanism of serrated yielding in f.c.c. metals and alloys at low temperatures. Mater. Sci. Eng. A 1991, 137, 141–150. [Google Scholar] [CrossRef] [Scilit]
- Mallick, P.; Tewary, N.K.; Ghosh, S.K.; Chattopadhyay, P.P. Microstructure-tensile property correlation in 304 stainless steel after cold deformation and austenite reversion. Mater. Sci. Eng. A 2017, 707, 488–500. [Google Scholar] [CrossRef] [Scilit]
- Gottstein, G. Physical Foundations of Materials Science; Springer: Berlin/Heidelberg, Germany, 2004. [Google Scholar] [CrossRef] [Scilit]
- Tanabe, T.; Yamanishi, Y.; Sawada, K.; Imoto, S. Hydrogen transport in stainless steels. J. Nucl. Mater. 1984, 123, 1568–1572. [Google Scholar] [CrossRef] [Scilit]
- Pundt, A.; Wagner, S. Hydrogen Interactions with Defects in Materials. Chem. Ing. Tech. 2024, 96, 182–191. [Google Scholar] [CrossRef] [Scilit]
- Hirth, J.P. Effects of hydrogen on the properties of iron and steel. Metall. Trans. A 1980, 11, 861–890. [Google Scholar] [CrossRef] [Scilit]
- Owczarek, E.; Zakroczymski, T. Hydrogen transport in a duplex stainless steel. Acta Mater. 2000, 48, 3059–3070. [Google Scholar] [CrossRef] [Scilit]
- Merkel, D.R.; Nickerson, E.K.; Seffens, R.J.; Simmons, K.L.; Marchi, C.S.; Kagay, B.J.; Ronevich, J.A. Effect of Hydrogen on Tensile Properties of 304L Stainless Steel at Cryogenic Temperatures. In Proceedings of the ASME 2021 Pressure Vessels & Piping Conference, Virtual, Online, 13–15 July 2021; p. V004T06A055. [Google Scholar] [CrossRef] [Scilit]
- Han, G.; He, J.; Fukuyama, S.; Yokogawa, K. Effect of strain-induced martensite on hydrogen environment embrittlement of sensitized austenitic stainless steels at low temperatures. Acta Mater. 1998, 46, 4559–4570. [Google Scholar] [CrossRef] [Scilit]
- Michler, T.; Schweizer, F.; Wackermann, K. Review on the Influence of Temperature upon Hydrogen Effects in Structural Alloys. Metals 2021, 11, 423. [Google Scholar] [CrossRef] [Scilit]
- Wada, K.; Komatsu, M.; Ono, Y.; Yamabe, J.; Enoki, H.; Iijima, T. Hydrogen-induced degradation of SUS304 austenitic stainless steel at cryogenic temperatures. Mater. Sci. Eng. A 2025, 927, 147988. [Google Scholar] [CrossRef] [Scilit]
- Marchi, C.; Somerday, B.; Robinson, S. Permeability, solubility and diffusivity of hydrogen isotopes in stainless steels at high gas pressures. Int. J. Hydrogen Energy 2007, 32, 100–116. [Google Scholar] [CrossRef] [Scilit]
- Xiukui, S.; Jian, X.; Yiyi, L. Hydrogen permeation behavior in austenitic stainless steels. Mater. Sci. Eng. A 1989, 114, 179–187. [Google Scholar] [CrossRef] [Scilit]
- Pillot, S.; Coudreuse, L. Hydrogen-induced disbonding and embrittlement of steels used in petrochemical refining. In Gaseous Hydrogen Embrittlement of Materials in Energy Technologies; Elsevier: Amsterdam, The Netherlands, 2012; pp. 51–93. [Google Scholar] [CrossRef] [Scilit]
- Sun, X.; Xu, J.; Li, Y. Hydrogen permeation behavior in metastable austenitic stainless steels 321 and 304. Acta Metall. 1989, 37, 2171–2176. [Google Scholar] [CrossRef] [Scilit]
- Tsong-Pyng, P.; Altstetter, C.J. Effects of deformation on hydrogen permeation in austenitic stainless steels. Acta Metall. 1986, 34, 1771–1781. [Google Scholar] [CrossRef] [Scilit]

Disclaimer/Publisher’s Note: The statements, opinions and data contained in all publications are solely those of the individual author(s) and contributor(s) and not of MDPI and/or the editor(s). MDPI and/or the editor(s) disclaim responsibility for any injury to people or property resulting from any ideas, methods, instructions or products referred to in the content. |
© 2026 by the authors. Licensee MDPI, Basel, Switzerland. This article is an open access article distributed under the terms and conditions of the Creative Commons Attribution (CC BY) license.