


Abstract
Plastic waste poses a major environmental issue because it persists in nature for long durations and recycling facilities are not readily available. The conversion of waste materials into hydrogen creates two beneficial effects that help decrease pollution levels and establish hydrogen as a clean energy source for sustainable low-carbon systems. In this study, an integrated process for plastic-to-hydrogen conversion was developed using Aspen HYSYS v14. The system uses pyrolysis, steam reforming, and the water–gas shift (WGS) reaction, through pseudo-components of polyethylene, polypropylene and polystyrene to model decomposition processes. Following optimization, the hydrogen fraction in the syngas rose from 0.664 to 0.733. At this stage, the process produced roughly 651 kg of hydrogen per hour in steady operation. In addition, char and pyrolysis oil were produced as co-products that can be valorized in circular economy applications The implementation of heat integration achieved an 8% reduction in utility demand that proves that internal energy recovery stands as a vital element for sustainable design. The techno-economic analysis showed that the project would achieve a 39% internal rate of return and payback period of 5.95 years, thus proving its financial stability. The research demonstrates how modern process modeling techniques enable the creation of clean technology systems that address plastic pollution problems while producing low-carbon hydrogen.
1. Introduction
Plastic waste pollution and the growing demand for sustainable energy have emerged as interconnected global challenges. Global plastic production has exceeded 460 million tons per year, nearly doubling in the past two decades, with approximately 79% of discarded plastics accumulating in landfills or oceans [1,2]. The persistence of plastics in the environment contributes to long-term ecological degradation, microplastic contamination, and severe threats to marine and human health [3,4]. Conventional recycling remains limited due to quality loss, contamination, and the inability to treat mixed polymers [5,6]. Consequently, alternative valorization pathways are being investigated to mitigate plastic pollution while extracting useful products.
Hydrogen has gained prominence as a clean energy carrier for decarbonization strategies. When used in fuel cells, hydrogen produces only water as a by-product, making it a sustainable substitute for fossil fuels [7]. However, current large-scale production relies heavily on steam methane reforming, which is carbon-intensive and undermines sustainability goals [8,9]. Alternative pathways, including electrolysis, biomass gasification, and thermochemical cycles are promising but face cost and scalability barriers [10,11,12]. In this context, plastic waste is increasingly viewed as both an environmental burden and a potential resource for sustainable hydrogen production.
Several thermochemical conversion routes for plastics have been studied. Pyrolysis is one of the most widely explored methods, decomposing polymers into gases, oils, and char at elevated temperatures [6]. Catalytic pyrolysis and gasification can enhance hydrogen yields, particularly when combined with steam reforming and water–gas-shift (WGS) reactions [13,14]. Reported studies show that hydrogen concentrations typically increase from about 30–45 mol% for standalone pyrolysis to over 75 mol% when both reforming and WGS are included. These co-products can be valorized as adsorbents, construction additives, or low-grade fuels, contributing to resource recovery and improving the economic attractiveness of the process [15]. During pyrolysis, the thermal decomposition of plastics breaks down long polymer chains into lighter hydrocarbons and carbon-rich residues. The gaseous fraction forms hydrogen and syngas, the condensed fraction becomes pyrolysis oil, and the solid residue—char—can be further processed or activated for use as an adsorbent or filler material.
Recent studies have demonstrated the increasing use of process simulation to evaluate plastic-to-hydrogen systems. Yi et al. used Aspen HYSYS to model the pyrolysis of plastic waste and highlighted the importance of reactor design and operating atmosphere on hydrogen yields [16]. Osman et al. demonstrated a pilot-scale pyrolysis simulation and conducted a techno-economic assessment, showing the potential of integrating modeling with cost evaluation [17]. Similarly, Zein et al. employed simulation to study the dissolution and reprecipitation of polyethylene, validating results against experimental data [18]. These studies underline the value of process modeling in understanding conversion pathways and predicting performance.
Alongside simulation, techno-economic analysis (TEA) and life cycle assessment (LCA) have become essential tools to assess the feasibility and sustainability of waste valorization technologies. Majzoub et al. emphasized that economic analysis helps compare recycling routes under fluctuating feedstock and market conditions [19], while Uekert et al. highlighted the role of LCA in quantifying environmental trade-offs [20]. However, most prior studies addressed either thermochemical conversion, simulation, or economics in isolation, with few adopting an integrated approach.
Global plastic production has continued to increase steadily, exceeding 380 million tons per year, while end-of-life management remains dominated by landfilling and incineration rather than closed-loop recycling [2,6]. In many regions, mixed and contaminated plastic waste streams are unsuitable for mechanical recycling, leading to long-term environmental accumulation, microplastic formation, and loss of material value. These limitations have motivated growing interest in thermochemical conversion routes that can handle heterogeneous plastic waste and recover energy or chemical products.
At the same time, global demand for hydrogen is expanding due to its role in refining, ammonia production, and emerging low-carbon energy systems. Currently, most hydrogen is produced via steam methane reforming (SMR), a mature and cost-effective technology but one that remains heavily dependent on fossil feedstocks and associated carbon dioxide emissions [21]. Alternative hydrogen pathways based on waste-derived feedstocks have therefore attracted increasing attention as potential complements to conventional production routes, particularly where waste management and energy recovery objectives overlap.
Process simulation provides a practical framework for assessing such emerging systems at an early design stage. Steady-state modeling enables the integration of multiple unit operations, energy recovery strategies, and preliminary techno-economic evaluation within a single platform. While simulation studies do not replace detailed experimental or environmental assessments, they play an important role in identifying promising process configurations, highlighting key performance sensitivities, and guiding future experimental and design efforts [22].
Therefore, there is a clear need for studies that combine process simulation, optimization, heat integration, and techno-economic assessment in a single framework to evaluate the viability of hydrogen production from mixed plastic waste. Addressing this gap, the present study models an integrated pyrolysis–steam reforming–WGS process using Aspen HYSYS, incorporating heat recovery for improved efficiency. The objectives were to (i) quantify hydrogen yields and assess overall product distribution (including char and pyrolysis oil), (ii) investigate the effect of key operating parameters through sensitivity analysis, and (iii) conduct a techno-economic assessment under different feedstock cost scenarios. By coupling technical and economic perspectives, this work provides a holistic evaluation of plastic-to-hydrogen conversion and its potential contribution to the circular economy and sustainability goals. Previous studies have investigated plastic waste conversion using process simulation [16,18,23]. However, these works mainly addressed individual process stages or single plastic streams, without linking upstream conversion to downstream upgrading, heat recovery, and economic performance. In contrast, the present study developed a fully integrated pyrolysis–steam reforming–water–gas shift–PSA framework for mixed plastic waste. The model combines process optimization, heat integration, and techno-economic assessment within a single simulation platform, enabling the direct evaluation of trade-offs between hydrogen purity, energy demand, and overall process economics, which have not been comprehensively addressed in earlier simulation-based studies.
2. Methodology
2.1. Simulation Framework
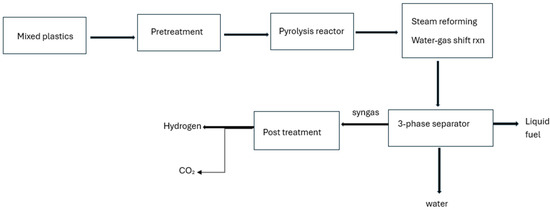
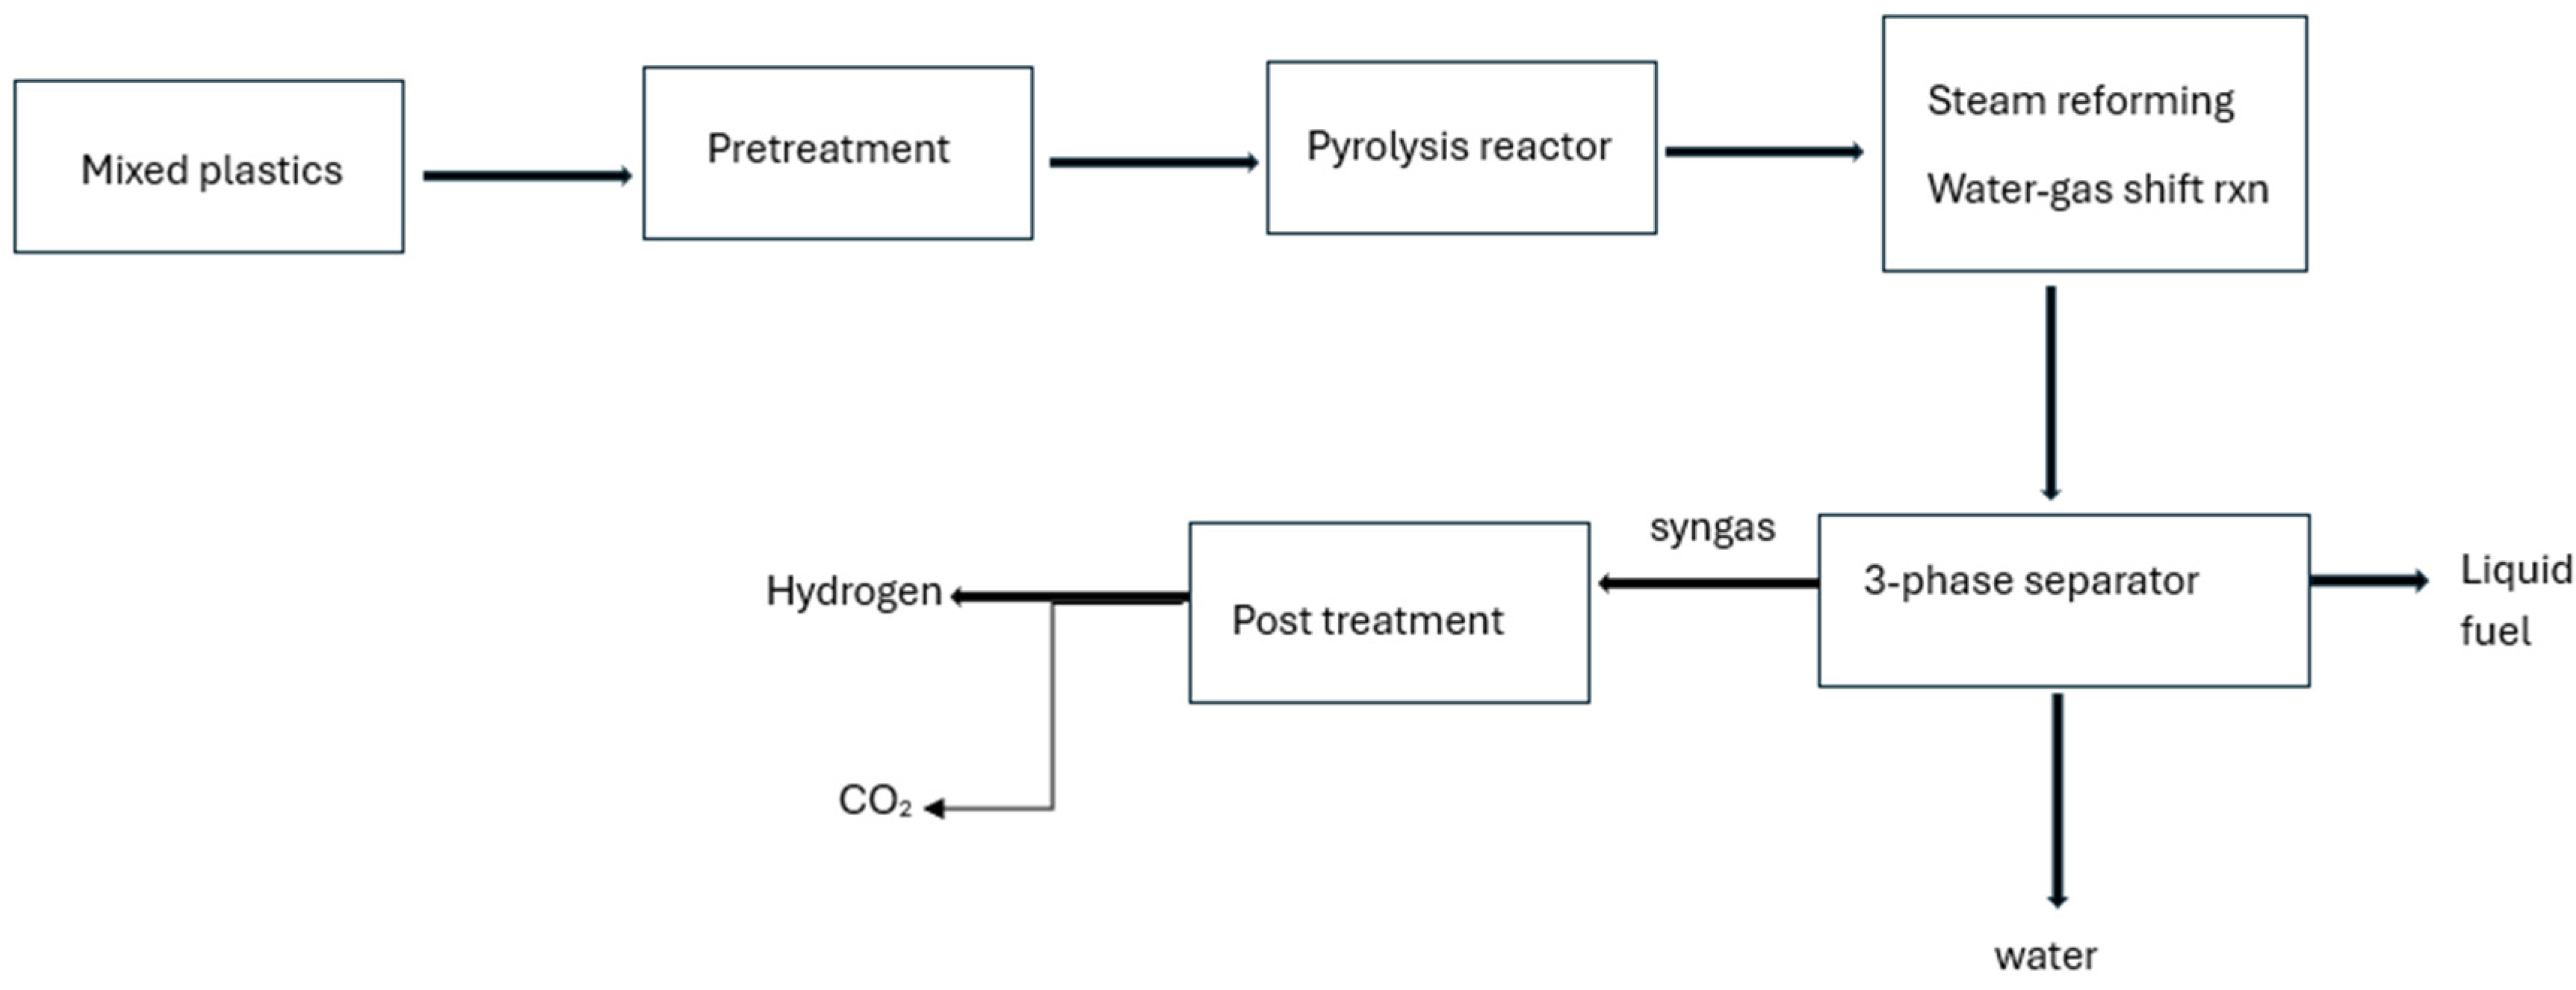
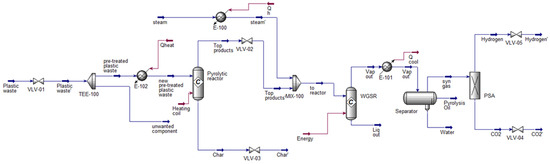
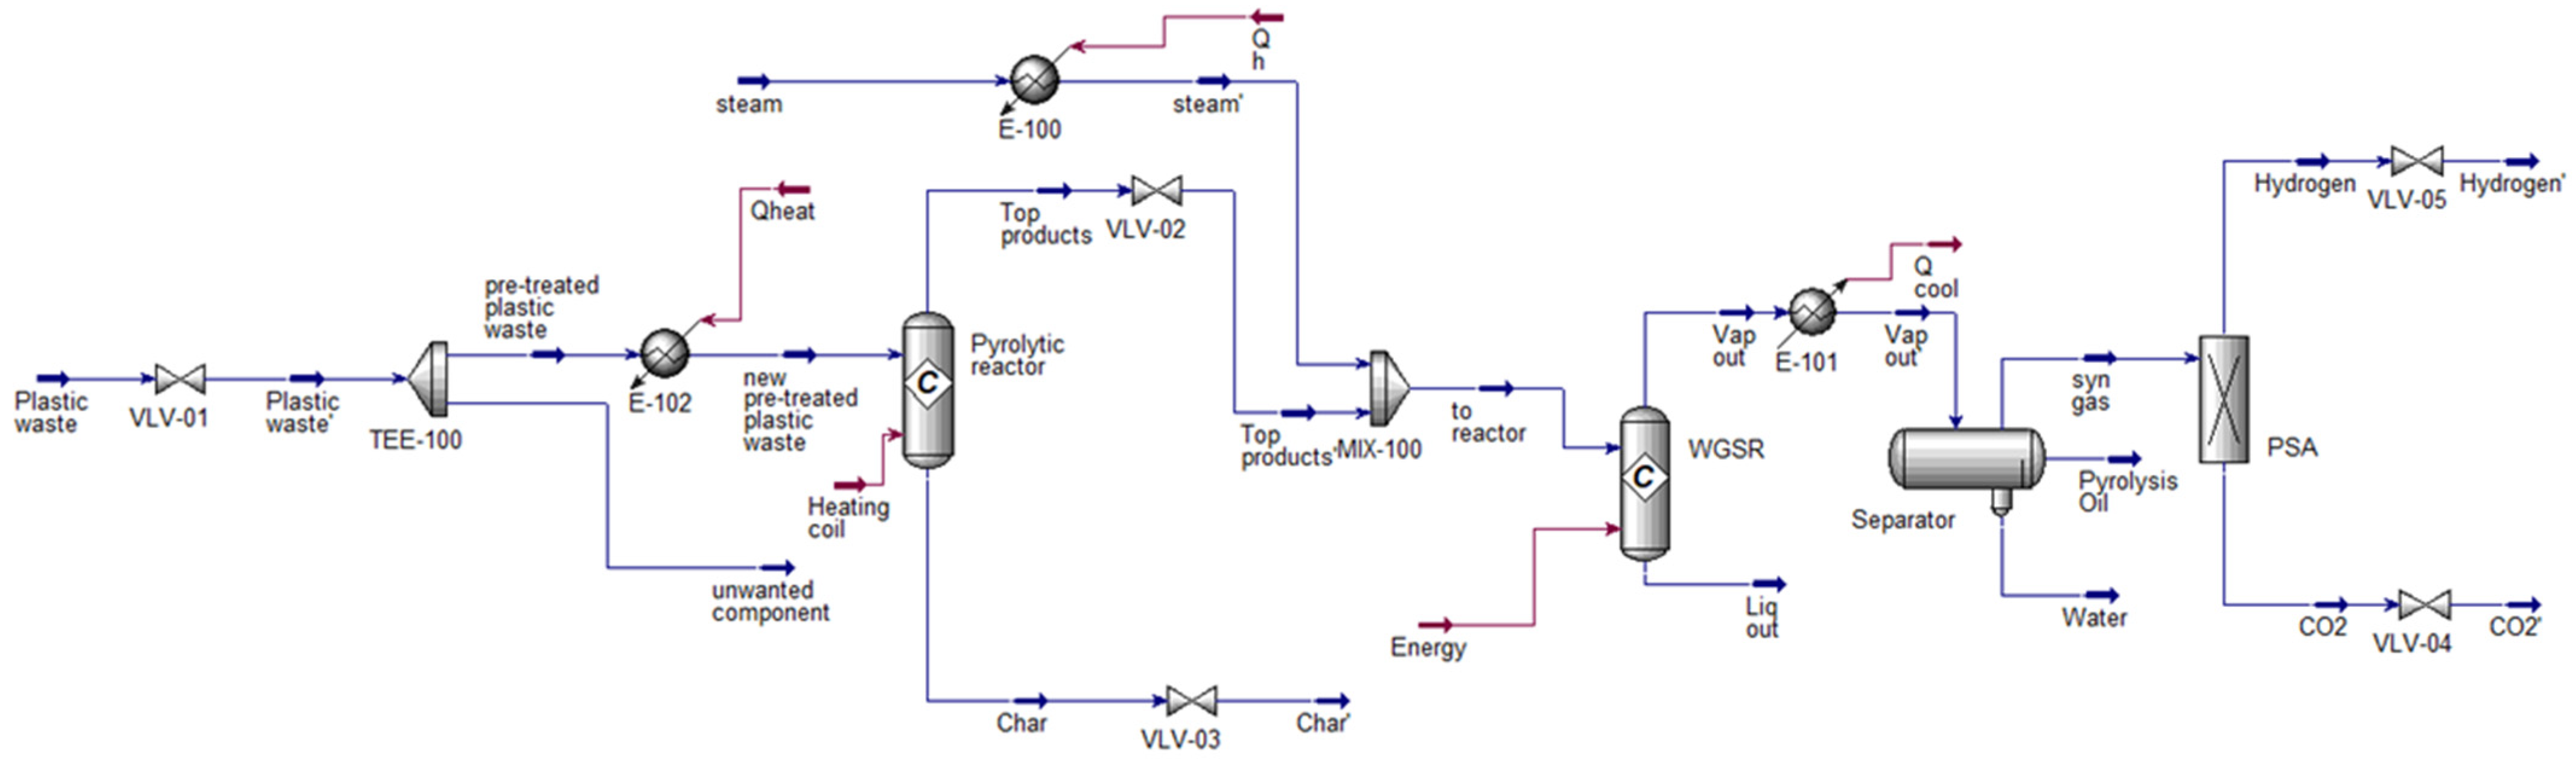
The process was simulated using Aspen HYSYS v14 (AspenTech, Bedford, MA, USA), which is widely employed in chemical and petrochemical process design [16,24]. The Peng–Robinson equation of state was applied to all units due to its suitability for hydrocarbon-rich systems [5]. All simulations were conducted under steady-state conditions with negligible pressure drops across the equipment. The overall process is summarized in the block flow diagram (Figure 1), while the detailed base-case process flow diagram is shown in Figure 2. Unlike previous simulation studies, the present work integrates process optimization, heat integration, and techno-economic analysis within the same Aspen HYSYS framework to ensure consistency between the technical and economic results.
Figure 1.
Block flow diagram of the integrated pyrolysis–reforming–WGS process.
Figure 2.
Process flow diagram of the base-case design prior to optimization. Blue lines represent material streams, while red lines indicate heat/energy streams (Q). Arrows show the direction of mass and energy flow between unit operations.
2.2. Feedstock and Assumptions
The feedstock was designed to represent a typical mixed municipal plastic waste stream, comprising 60% polyethylene (PE), 30% polypropylene (PP), and 10% polystyrene (PS) [2]. The combined composition of the mixed-plastic inlet stream is summarized in Table S1 (SI) and was treated as a single feed mixture in the integrated simulation. Since Aspen HYSYS cannot directly simulate polymers, pseudo-components were created based on the properties of the corresponding monomers—ethylene, propylene, and styrene—following the approach used in earlier studies [17,18]. The detailed pseudo-component properties are provided in the Supplementary Materials (Table S2). A global pyrolytic conversion of 90% was assumed, meaning that 90% of the plastic feed was thermally decomposed into gaseous and liquid products, with the remaining 10% forming solid char [25]. This assumption reflects typical conversion levels reported for mixed plastic pyrolysis under similar temperature ranges. In this work, the term “pyrolysis oil” denotes the condensable hydrocarbon fraction generated during thermal decomposition. Due to limitations in Aspen HYSYS for explicitly modeling polymer pyrolysis kinetics, the pyrolysis step was represented using a simplified conversion-based approach, as discussed later. In the simulation, this stream primarily contained heavier paraffinic and cyclic hydrocarbons such as hexadecane, cyclopropane, and other C12–C20 species. These compounds represent the liquid products that would condense under ambient conditions, aligning with experimentally observed compositions of plastic-derived pyrolysis oils [6,25]. Hydrogen purification was modeled using pressure swing adsorption (PSA), represented in Aspen HYSYS as a component splitter to separate hydrogen from CO2 and other by-products [26]. The pyrolysis stage was modeled using a global conversion approach to enable steady-state system-level analysis in Aspen HYSYS, as the software does not include built-in capabilities for modeling polymer pyrolysis kinetics, residence time effects, or secondary cracking reactions. This simplified approach is commonly adopted in process simulation studies to assess downstream operations, including reforming, separation, heat integration, and economic performance. For mass balance closure, the char stream was represented as elemental carbon; however, it is acknowledged that real plastic-derived char may contain ash and heteroatoms, which are not explicitly considered in the present model.
The modeling approach adopted in this study reflects the objectives of conceptual process assessment rather than detailed reactor-scale analysis. Steady-state simulation was selected to enable consistent mass and energy balance calculations across the integrated pyrolysis, reforming, water–gas shift, and separation units. This approach facilitates a comparison of operating scenarios and the identification of key system-level performance indicators, including hydrogen yield, utility demand, and preliminary economic metrics.
Several simplifying assumptions were therefore required. Reaction kinetics, residence time effects, and detailed tar chemistry were not explicitly modeled, and process units were represented using equilibrium or conversion-based models available in Aspen HYSYS. Although these assumptions limit resolution at the reaction level, they are widely applied in early-stage process studies to evaluate integrated system behavior and feasibility [17,18]. Accordingly, the results should be interpreted as indicative trends suitable for screening and comparison purposes, rather than as definitive operational predictions.
The pyrolysis reactor was modeled using a global conversion approach rather than detailed kinetic equations. This simplified framework does not capture temperature-dependent product selectivity or reaction rates. Consequently, the model is suitable for system-level analysis of integrated process performance and economic evaluation but does not enable the detailed optimization of pyrolysis operating conditions. The reactor temperature was maintained at 333.7 °C based on typical operating ranges reported in the literature for mixed plastic pyrolysis [6,26,27].
2.3. Process Description
The integrated process consisted of three main stages. In the pyrolysis stage, mixed plastics were decomposed at 350–500 °C to generate a vapor stream containing hydrocarbons, hydrogen, and light gases, together with solid char [6]. This was followed by steam reforming and water–gas shift (WGS) reactions, operated at ~700 °C and 1 atm, to increase hydrogen yield [28]. The pyrolytic reactor was implemented in Aspen HYSYS using conversion reactions to represent the thermal decomposition of the mixed plastic feed, with the stoichiometry summarized in Tables S4–S6 (SI). The pyrolytic reactor configuration is shown schematically in Figure S1 (SI), while its detailed operating conditions are listed in Table S3 (SI). Finally, hydrogen separation was modeled using pressure swing adsorption (PSA), represented in Aspen HYSYS as a splitter that separates hydrogen from CO2 and other by-products.
To enhance energy efficiency, heat integration was applied by recovering sensible heat from the hot WGS effluent to preheat the incoming plastic feed, thereby reducing external heating requirements [29]. Steam reforming and WGS reactions were modeled at atmospheric pressure to maintain consistency with the upstream pyrolysis unit and to enable clear system-level mass and energy balance evaluation at the conceptual design stage, rather than to replicate fully optimized industrial operating conditions.
2.4. Optimization Approach
Process optimization focused on separator temperature to enhance hydrogen purity. Sensitivity analysis was performed by varying the separator temperature from 25 °C to 50 °C, as presented in Section 3.2. The pyrolysis reactor temperature was held constant at 333.7 °C, consistent with operating conditions reported for mixed plastic waste pyrolysis [6,25,27].
2.5. Model Validation
To ensure the reliability of the Aspen HYSYS model, the pyrolysis stage was benchmarked against the pilot-scale results reported by Osman et al. [17], who measured gas, oil, and char yields from mixed plastic feedstocks under comparable temperature conditions (350–500 °C). The predicted gas-to-liquid ratio and total conversion in this study agreed within ±8% of their reported values. In addition, the simulated hydrogen content in the gaseous fraction (approximately 40–45 wt%) was consistent with experimental data from the same work. The validation methodology followed the simulation–experiment comparison framework described by Zein et al. [18], confirming that the thermodynamic package and conversion assumptions adopted here are reliable for mixed plastic pyrolysis systems. Model validation was carried out by comparing the predicted overall conversion levels and gas-to-liquid trends with experimental data reported from pilot-scale pyrolysis studies of mixed plastic waste under comparable temperature conditions. Although the validation does not extend to full species-level speciation, the observed agreement supports the suitability of the model for assessing integrated hydrogen production systems at the conceptual design stage. Uncertainties associated with pseudo-component representation are acknowledged as a limitation of the present study.
3. Results and Discussion
3.1. Product Yields
The simulation of a 2000 kg h−1 mixed-plastic feed produced 651.2 kg h−1 of hydrogen, corresponding to 5703 t annually at 99% purity. A feed rate of 2000 kg h−1 was selected to represent a small-scale continuous plant, typical of pilot- or demonstration-level waste-to-hydrogen systems reported in recent studies. This scale allows for reliable heat and mass balance estimation while remaining computationally manageable for process optimization. In addition, 438.9 kg h−1 of char and 9.2 kg h−1 of pyrolysis oil were generated (Table 1). The relatively low oil yield indicates a strong shift toward gaseous products at the selected operating conditions. These results are consistent with earlier reports that higher pyrolysis temperatures favor syngas production over liquid hydrocarbons [6,26].
Table 1.
Final steady-state product yields of hydrogen, char, and pyrolysis oil from the integrated pyrolysis–reforming–WGS–PSA simulation (base-case feed = 2000 kg h−1).
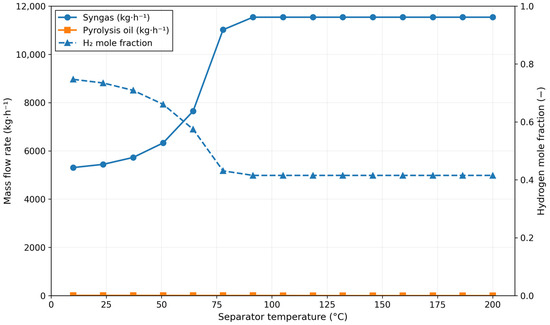
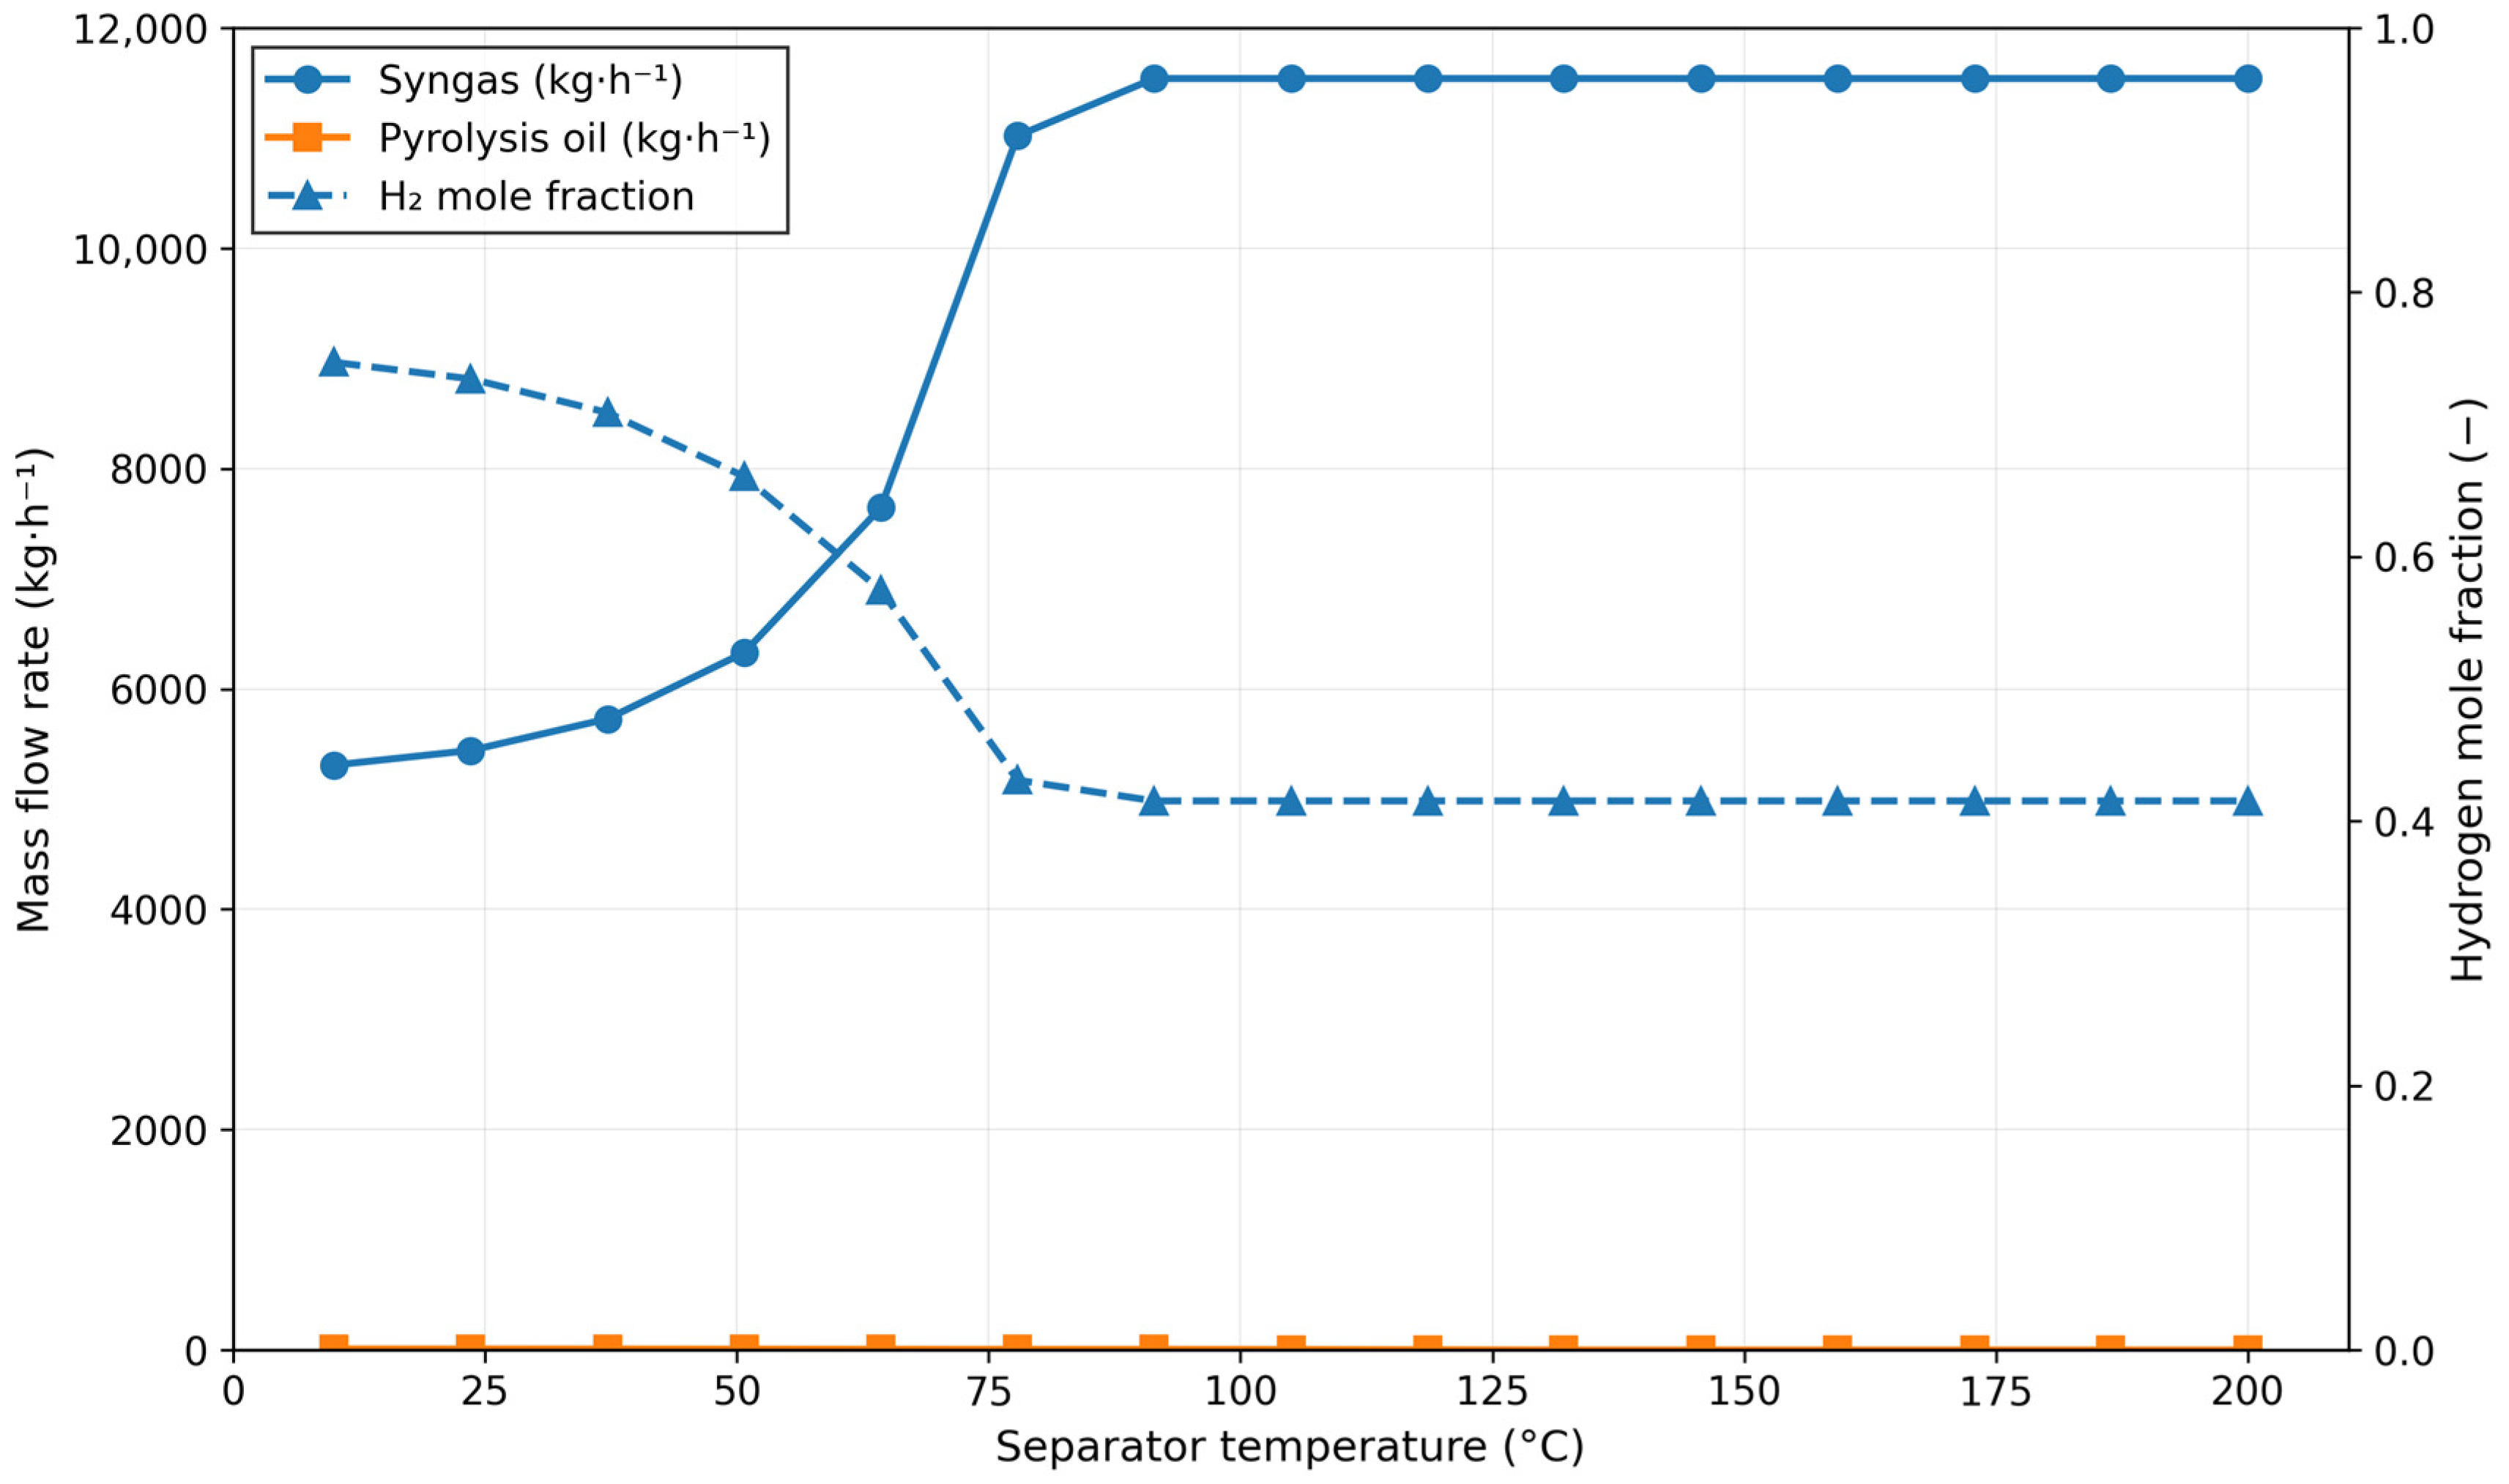
Although the pyrolysis oil appears nearly negligible in Figure 3, the small residual amount reported in Table 1 corresponds to the optimized base-case temperature of around 333 °C. This confirms consistency between the sensitivity analysis and the steady-state simulation results.
Figure 3.
Effect of separator temperature on syngas and pyrolysis-oil mass flow (left axis) and H2 mole fraction (right axis) for a 2000 kg h−1 mixed-plastic feed. Lower separator temperatures promote the condensation of water and heavy hydrocarbons, thereby increasing the hydrogen mole fraction in the vapor phase (e.g., 0.664 → 0.733 when reduced from 50 °C to 25 °C); the complete dataset is given in Table S7 (SI).
Although hydrogen is the main target product, the co-products, char and pyrolysis oil, can enhance process viability through valorization. The solid char, composed mainly of elemental carbon, can be upgraded through activation for use in adsorption, catalysis, or soil conditioning, whereas the liquid oil fraction can serve as a low-grade heating fuel or be further refined into valuable hydrocarbons [6,15,20]. Considering these secondary product markets strengthens the circular economy potential of the process. Although the pyrolysis reactor initially produces a mixture of light hydrocarbons and gases (H2, CO, CO2, CH4, etc.), the downstream reforming, WGS, and PSA units enrich hydrogen to 99% purity. Thus, the hydrogen yield reported in Table 1 represents the purified output of the complete integrated system rather than the raw pyrolysis gas fraction. It should be noted that the reported syngas mass flow includes the contribution of added steam supplied to the reforming and WGS stages; therefore, syngas flow rates exceed the plastic feed rate while maintaining overall mass balance closure.
3.2. Process Optimization
The pyrolysis reactor operated at 333.7 °C, selected based on typical temperature ranges for mixed plastic waste conversion [6,25,27]. As noted in Section 2.2, the conversion-based modeling approach does not account for temperature-dependent reaction kinetics. Therefore, optimization efforts focused on separator temperature, which governs vapor–liquid equilibrium and directly affects hydrogen recovery.
The influence of separator temperature on product composition is illustrated in Figure 3, with the detailed numerical data provided in Table S7 (SI). Lowering the separator temperature from 50 °C to 25 °C increased the hydrogen mole fraction in the gas phase from 0.664 to 0.733, accompanied by a reduction in water content from 0.122 to 0.031 (Table 2). This enhancement results from the increased condensation of water vapor and heavier hydrocarbons at lower temperatures, which concentrates hydrogen in the remaining vapor stream. The dual-axis plot separates composition (right axis) from mass flows (left axis), making the H2 trend clearly visible alongside syngas and oil. Although lower separator temperatures enhance hydrogen purity, they also increase the refrigeration demand, reflecting the trade-off between purity and energy consumption. A complete mass balance derived from Aspen HYSYS outputs is provided in Table S13 (Supplementary Materials). The high syngas flow rates relative to the plastic feed result from the large steam input required for the reforming and water–gas shift reactions.
Table 2.
Syngas composition before and after optimization of separator temperature, showing improvement in hydrogen mole fraction and reduction in water content. The optimization was performed by lowering the separator temperature from 50 °C to 25 °C while maintaining the reactor temperature at 333 °C and 1 atm. The complete dataset across the full temperature range is provided in Table S7 (SI).
3.3. Energy Efficiency and Heat Integration
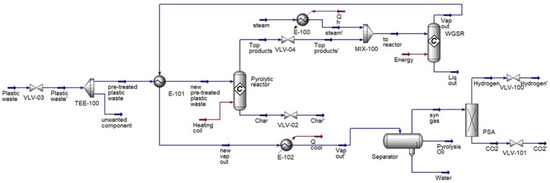
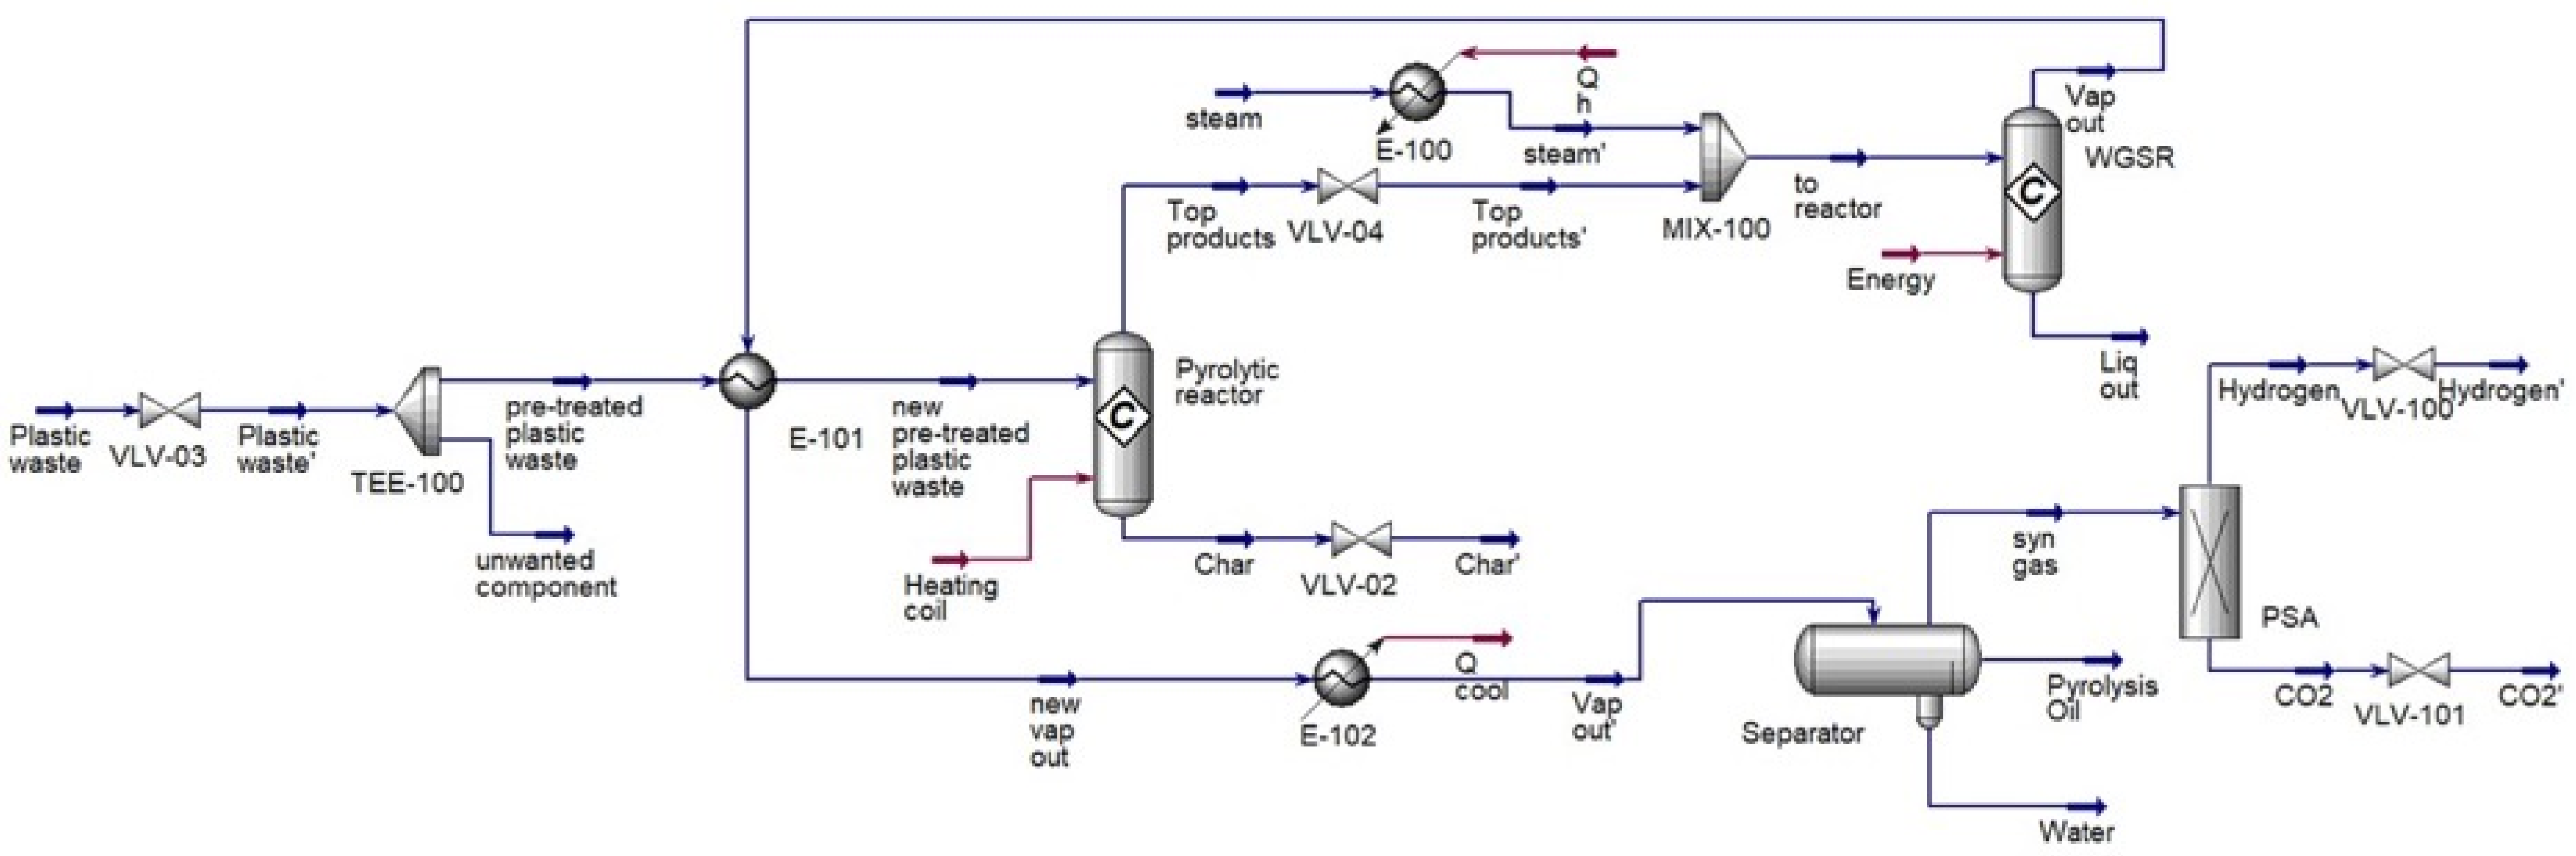
Heat integration was applied by exchanging heat between the hot WGS effluent (~700 °C) and preheating the incoming plastic feed. This reduced the external utility demand from 3.88 × 10⁷ to 3.57 × 10⁷ kJ h−1, corresponding to ~8% savings. The optimized flow diagram incorporating heat recovery is shown in Figure 4. These energy efficiency gains are consistent with similar waste-to-energy integration studies [30] and demonstrate the importance of internal heat recovery for reducing process costs and energy demand.
Figure 4.
Optimized process flow diagram with heat integration. Blue lines represent material streams, while red lines indicate heat/energy streams (Q). Arrows show the direction of mass and energy flow between unit operations.
3.4. Economic Feasibility
The techno-economic analysis followed standard chemical engineering design methods [22,31]. Capital costs were estimated using the factorial method with equipment costs calculated from design correlations and updated to 2024 values (CEPCI = 798.0). Operating costs comprised variable costs (feedstock, utilities, waste treatment) and fixed costs (labor, maintenance, depreciation, overhead). Economic indicators (NPV, IRR, payback period) were calculated assuming a 20-year plant lifetime and 10% discount rate. Detailed breakdowns are provided in Tables S8–S12 (SI). The techno-economic analysis was conducted using operating conditions obtained directly from the optimized and heat-integrated simulation, ensuring that economic indicators reflect realistic process performance rather than standalone assumptions. The techno-economic analysis was performed following established methodologies [22,31]. The evaluation assumed hydrogen to be the sole revenue-generating product, while CO2, char, and pyrolysis oil were treated as by-products without direct economic value. Capital and operating costs were estimated based on standard chemical process design correlations, including purchased equipment cost estimation, installation factors, and indirect expenses. Fixed and variable operating costs covered utilities, maintenance, and labor. Profitability metrics such as net annual profit, payback period, and internal rate of return (IRR) were calculated using simulated production rates and market-based hydrogen prices. The fixed capital investment (FCI) for the process was estimated at USD 3.56 million, with reactors and heat exchangers representing the largest contributions. Detailed breakdowns of ISBL factors, FCI, and equipment costs are provided in the Supplementary Materials (Tables S8–S10).
Utility costs were estimated using 2024 industrial energy benchmarks and standard chemical engineering design correlations. Electricity was valued at 0.10 USD·kWh−1 [32], steam at 15 USD·t−1, and cooling water at 0.05 USD·m−3 [22]. These assumptions are summarized in Table S12 (SM) and were applied in calculating the variable cost component in Table 3. Purchased equipment costs were calculated using design correlations and cost curves from Towler and Sinnott [22], updated to 2024 values using the Chemical Engineering Plant Cost Index (CEPCI = 798.0). The estimated equipment prices for major process units, including reactors, heat exchangers, and separators, are summarized in Table S10 (SM). Operating costs were divided into variable and fixed components using the procedure outlined by Towler and Sinnott [22]. Raw material prices for mixed plastic waste were taken from 2024 waste-management market averages (approximately 0.15 USD·kg−1), while utility prices were based on the assumptions listed in Table S12. Labor, maintenance, supervision, and overhead costs were estimated as standard fractions of the fixed capital investment based on design guidelines [22,31].
Table 3.
Summary of annual production costs for the integrated pyrolysis–reforming–WGS process. Detailed breakdowns of ISBL factors, fixed capital investment, and equipment costs are provided in Tables S8–S10 (SM).
It is important to note that the present techno-economic analysis represents a screening-level evaluation intended to assess preliminary feasibility rather than provide a detailed design-stage cost estimate. Screening studies are commonly used to compare process concepts, identify dominant cost contributors, and evaluate economic sensitivity under defined assumptions [22].
At this stage, uncertainties remain due to the absence of detailed equipment sizing, vendor quotations, and site-specific factors. In particular, hydrogen separation was represented using an idealized PSA model to estimate product purity and flow rate, without the explicit consideration of recovery losses or compression penalties. A subsequent design-stage assessment would therefore be required to refine capital and operating cost estimates using realistic equipment specifications and performance data. Nevertheless, the present analysis provides a useful basis for comparing process configurations and identifying key economic drivers.
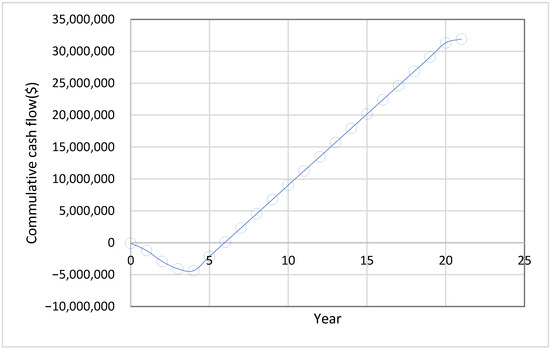
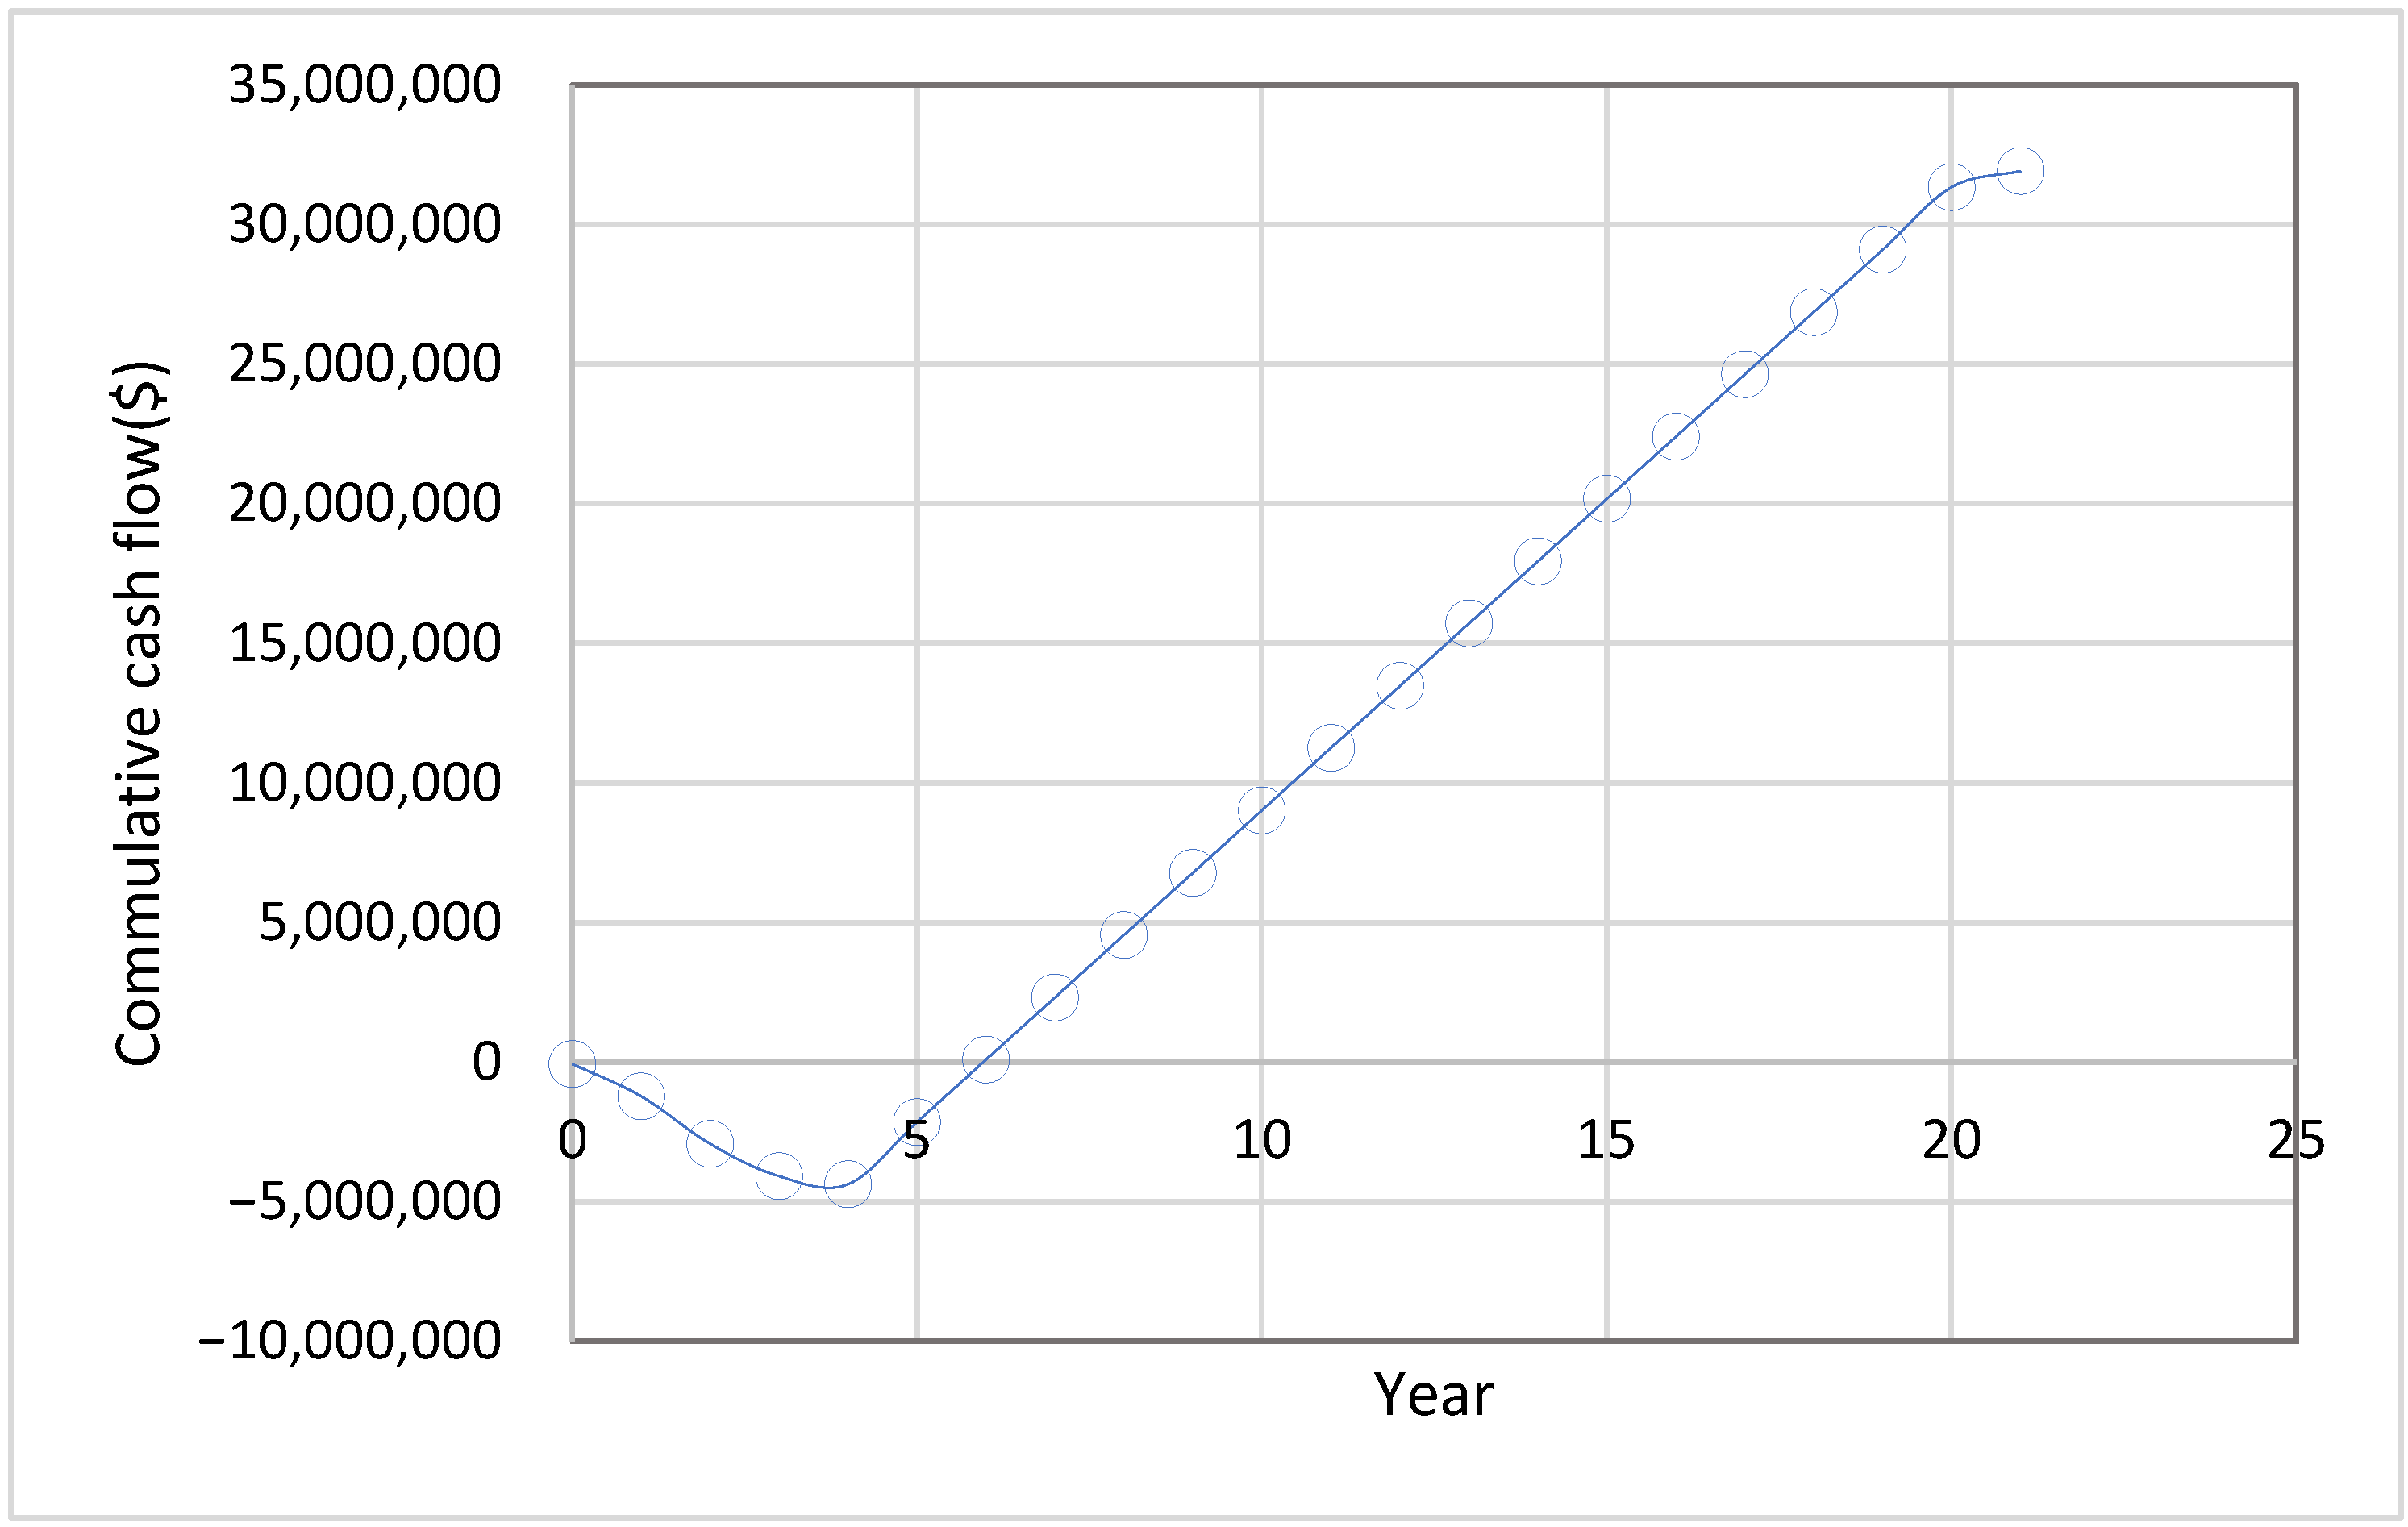
The net present value (NPV) profile of the proposed plant is shown in Figure 5, confirming project profitability over the 20-year operating horizon. Breakeven is achieved at year 6, consistent with the calculated payback period, and the positive slope of the NPV curve thereafter highlights long-term economic robustness.
Figure 5.
NPV profile of the proposed plastic-to-hydrogen process over a 20-year operating lifetime. Breakeven is achieved at year 6, consistent with the calculated payback period.
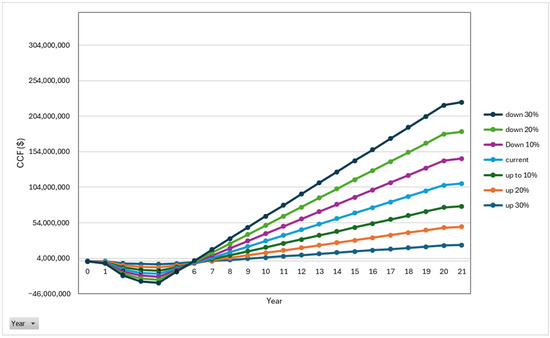
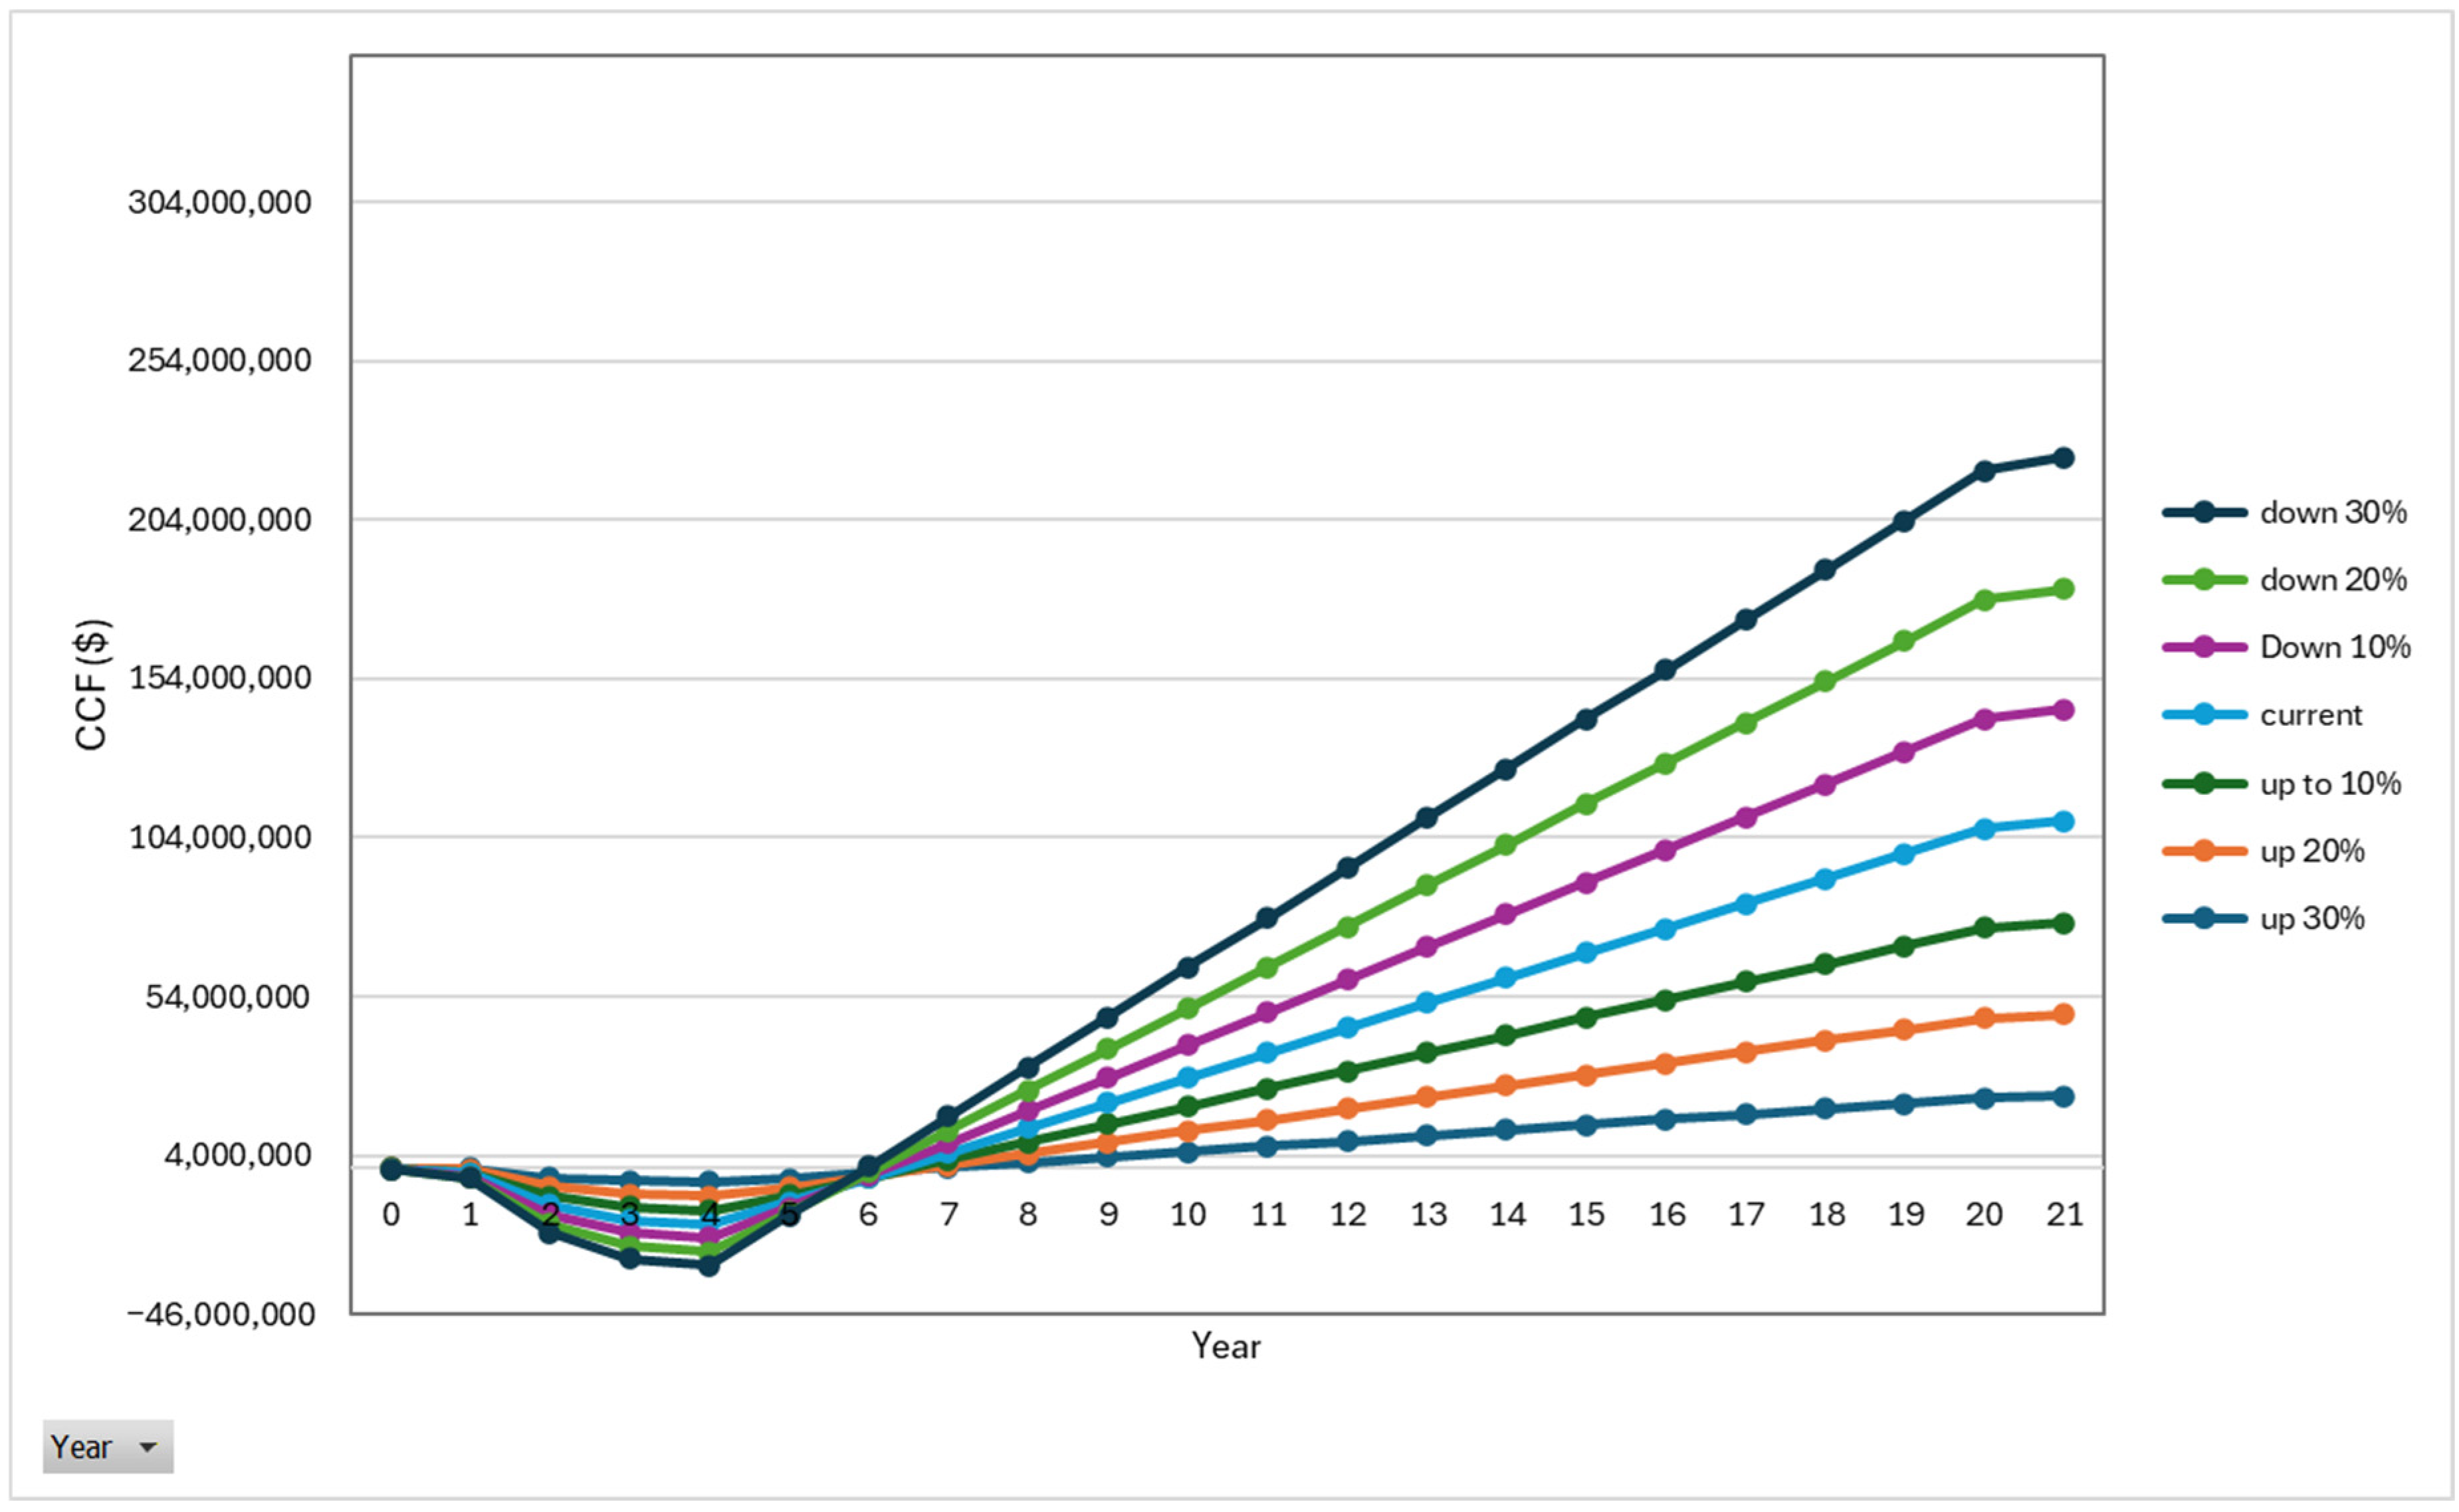
The total annual operating cost was calculated as USD 11.36 million, based mainly on feedstock, utilities, and waste disposal charges. Utility requirements were extracted directly from Aspen HYSYS energy reports, while variable and fixed operating costs are detailed in Table S11 (SM). The summary of annual production costs is given in Table 3, while revenues from hydrogen and pyrolysis oil sales are presented in Table 4. The process achieved a net annual profit of USD 3.92 million, corresponding to a payback period of 5.95 years and an IRR of 39%. This favorable economic performance is driven by the combination of current low-carbon hydrogen market prices (USD 2.94/kg [32]), low-cost waste plastic feedstock (USD 0.15/kg, below typical literature values of USD 0.60/kg [33]), and heat integration benefits. The sensitivity analysis (Figure 6, Table 5) confirms that feedstock cost is the primary economic driver, with IRR ranging from 28% to 50% under ±30% feedstock price variation.
Table 4.
Annual revenues from hydrogen and pyrolysis oil sales, based on simulated product yields and current market prices.
Figure 6.
Sensitivity analysis of cumulative cash flow under ±30% variation in plastic feedstock costs, showing strong dependence of profitability on raw material price.
Table 5.
Sensitivity analysis of profitability under ±30% variation in plastic feedstock cost. Corresponding cash flow trends are shown in Figure 6.
Our hydrogen yield (0.33 kg H2/kg plastic, calculated as 651.2 kg/h ÷ 2000 kg/h from Table 1) is comparable to the literature values for integrated plastic-to-hydrogen systems. Afzal et al. [33] reported 0.29 kg H2/kg for mixed plastic waste gasification–WGS–PSA, while Al-Qadri et al. [23] reported yields in the range of 0.30–0.40 kg/kg for pyrolysis–reforming systems. Our IRR of 39% is higher than that typical renewable energy projects (12–18% [35]), reflecting favorable assumptions including low feedstock cost and current hydrogen premium pricing, as discussed in the sensitivity analysis (Table 5, Figure 6).
Sensitivity analysis of feedstock cost, presented in Table 5 and Figure 6, revealed that profitability is strongly dependent on raw material prices. A 30% reduction in plastic feedstock cost increased the IRR to 50%, whereas a 30% increase reduced it to 28%. Similar cost sensitivities have been reported in recent techno-economic studies on plastic waste conversion and recycling systems, where feedstock and utility prices were identified as dominant economic drivers [19,20].
A techno-economic analysis was carried out at a conceptual design level to assess the preliminary feasibility of the proposed plastic-to-hydrogen system. Capital cost estimates were derived from purchased equipment costs combined with standard installation and indirect cost factors reported in the literature. At this stage, detailed equipment sizing, compressor design, and adsorption kinetics were not explicitly modeled. Hydrogen separation was therefore represented using an ideal PSA block to estimate product purity and flowrate, without accounting for recovery losses, pressure-related energy penalties, or dynamic adsorption behavior. Accordingly, the economic indicators reported here should be interpreted as screening-level estimates, and a detailed design-stage assessment incorporating realistic PSA performance and equipment specifications is required prior to industrial implementation.
4. Conclusions
This study demonstrates that mixed plastic waste functions as an operational hydrogen production material through the combination of pyrolysis with reforming and the WGS reaction. The Aspen HYSYS simulations indicate that hydrogen production reaches its highest levels through proper optimization of reactor temperature and separator operating conditions while heat integration reduces external energy consumption. The system shows positive economic performance under base-case assumptions; however, sensitivity analysis indicates that feedstock expenses play a decisive role in profitability. The proposed approach supports the development of circular economy pathways for hydrogen production from plastic waste. The generation of pyrolysis oil and char offers additional possibilities for energy and material valorization, although these by-products were not assigned direct economic value in the present analysis. The results demonstrate the technical viability and preliminary economic potential of plastic-to-hydrogen conversion, which makes it suitable for circular economy and decarbonization programs. This study focuses on process simulation, optimization, and techno-economic screening. While the proposed system demonstrates how plastic waste conversion can be integrated with hydrogen production within a circular economy context, no life cycle assessment (LCA) or quantitative evaluation of environmental emissions was conducted. Future work should therefore include a dedicated LCA to assess greenhouse gas emissions and environmental performance relative to conventional hydrogen production and plastic waste management routes.
Supplementary Materials
The following supporting information can be downloaded at: https://www.mdpi.com/article/10.3390/hydrogen7010030/s1, Figure S1: Schematic representation of the pyrolytic reactor configuration in Aspen HYSYS; Table S1: Composition of mixed-plastic feed used in Aspen HYSYS simulation; Table S2: Monomer-based pseudo-components defined in Aspen HYSYS; Table S3: Pyrolytic reactor operating conditions; Table S4: Stoichiometric coefficients for polystyrene pyrolysis; Table S5: Stoichiometric coefficients for polyethylene pyrolysis; Table S6: Stoichiometric coefficients for polypropylene pyrolysis; Table S7: Separator temperature case study results; Table S8: Inside-battery-limit (ISBL) cost factors; Table S9: Fixed capital investment breakdown; Table S10: Purchased equipment costs; Table S11: Annual operating costs; Table S12: Utility cost assumptions; Table S13: Overall mass balance.
Author Contributions
S.H.Z. conceived and designed the study, reviewed and edited the manuscript, and contributed to data analysis and interpretation. Y.K.A. designed the study, performed the simulations, contributed to the data analysis and interpretation, and drafted the manuscript. U.A., A.A.S., A.P. and A.A.J. contributed to the data analysis and interpretation. All authors have read and agreed to the published version of the manuscript.
Funding
This research received no external funding.
Informed Consent Statement
This article does not contain any studies with human participants or animals performed by any of the authors.
Data Availability Statement
The authors confirm that the data supporting the findings of this study are available within the article.
Conflicts of Interest
The authors declare no conflicts of interest.
References
- UNEP. Turning Off the Tap: How the World Can End Plastic Pollution and Create a Circular Economy; United Nations Environment Programme: Nairobi, Kenya, 2023; Available online: https://www.unep.org/resources/turning-off-tap (accessed on 17 February 2026).
- Plastics Europe. Plastics—The Facts 2022; Plastics Europe: Brussels, Belgium, 2022; Available online: https://plasticseurope.org/knowledge-hub/plastics-the-facts-2022/ (accessed on 17 February 2026).
- Parker, L. A Whopping 91 Percent of Plastic Isn’t Recycled; National Geographic: Washington, DC, USA, 2018; Available online: https://education.nationalgeographic.org/resource/whopping-91-percent-plastic-isnt-recycled/ (accessed on 17 February 2026).
- Nayanathara Thathsarani Pilapitiya, P.G.C.; Ratnayake, A.S. The world of plastic waste: A review. Clean. Mater. 2024, 11, 100220. [Google Scholar] [CrossRef] [Scilit]
- Sharuddin, S.D.A.; Abnisa, F.; Wan Daud, W.M.A.; Aroua, M.K. A review on pyrolysis of plastic wastes. Energy Convers. Manag. 2016, 115, 308–326. [Google Scholar] [CrossRef] [Scilit]
- Al-Salem, S.M.; Antelava, A.; Constantinou, A.; Manos, G.; Dutta, A. A review on thermal and catalytic pyrolysis of plastic solid waste (PSW). J. Environ. Manag. 2017, 197, 177–198. [Google Scholar] [CrossRef] [Scilit]
- Dincer, I. Green methods for hydrogen production. Int. J. Hydrogen Energy 2012, 37, 1954–1971. [Google Scholar] [CrossRef] [Scilit]
- Ji, M.; Wang, J. Review and comparison of various hydrogen production methods based on costs and life cycle assessment. Int. J. Hydrogen Energy 2021, 46, 38612–38635. [Google Scholar] [CrossRef] [Scilit]
- Office of Energy Efficiency & Renewable Energy. Hydrogen Production: Natural Gas Reforming; U.S. Department of Energy: Washington, DC, USA, 2024. Available online: https://www.energy.gov/eere/fuelcells/hydrogen-production-natural-gas-reforming (accessed on 17 February 2026).
- Balat, H.; Kırtay, E. Hydrogen from biomass—Present scenario and future prospects. Int. J. Hydrogen Energy 2010, 35, 7416–7426. [Google Scholar] [CrossRef] [Scilit]
- Lee, J.E.; Shafiq, I.; Hussain, M.; Lam, S.S.; Rhee, G.H.; Park, Y.-K. A review on integrated thermochemical hydrogen production from water. Int. J. Hydrogen Energy 2022, 47, 4346–4356. [Google Scholar] [CrossRef] [Scilit]
- Younas, M.; Shafique, S.; Hafeez, A.; Javed, F.; Rehman, F. An overview of hydrogen production: Current status, potential, and challenges. Fuel 2022, 316, 123317. [Google Scholar] [CrossRef] [Scilit]
- Irfan, M.; Saleem, R.; Shoukat, B.; Hussain, H.; Shukrullah, S.; Naz, M.Y.; Rahman, S.; Jazem Ghanim, A.A.; Nawalany, G.; Jakubowski, T. Production of combustible fuels and carbon nanotubes from plastic wastes using an in-situ catalytic microwave pyrolysis process. Sci. Rep. 2023, 13, 36254. [Google Scholar] [CrossRef] [Scilit]
- Niu, F.; Wu, Z.; Chen, D.; Huang, Y.; Ordomsky, V.V.; Khodakov, A.Y.; Van Geem, K.M. State-of-the-art and perspectives of hydrogen generation from waste plastics. Chem. Soc. Rev. 2025, 54, 604–631. [Google Scholar] [CrossRef] [Scilit]
- Yu, J.; Sun, L.; Ma, C.; Qiao, Y.; Yao, H. Thermal degradation of PVC: A review. Waste Manag. 2016, 48, 300–314. [Google Scholar] [CrossRef] [Scilit] [PubMed]
- Yi, C.Q.; Bin Bojeng, M.N.; Binti Kamis, S.K.; Mubarak, N.M.; Karri, R.R.; Azri, H. Production of hydrogen using plastic waste via Aspen HYSYS simulation. Sci. Rep. 2024, 14, 55079. [Google Scholar] [CrossRef] [Scilit] [PubMed]
- Osman, M.D.; Selimi, N.E.; Juffri, A.B.; Mubarak, N.M.; Karri, R.R. Pilot scale pyrolysis and simulation of plastic waste into a value-added product: An integrated approach. Chem. Eng. Technol. 2024, 47, 441. [Google Scholar] [CrossRef] [Scilit]
- Zein, S.H.; Hussain, A.A.; Yansaneh, O.Y.; Jalil, A.A. Modelling and simulation of dissolution/reprecipitation technique for LDPE using solvent/non-solvent system. Processes 2022, 10, 2387. [Google Scholar] [CrossRef] [Scilit]
- Majzoub, W.; Al-Rawashdeh, M.; Al-Mohannadi, D.M. Toward building circularity in sustainable plastic waste conversion. ACS Sustain. Chem. Eng. 2024, 12, 383–392. [Google Scholar] [CrossRef] [Scilit]
- Uekert, T.; Singh, A.; DesVeaux, J.S.; Ghosh, T.; Bhatt, A.; Yadav, G.; Afzal, S.; Walzberg, J.; Knauer, K.M.; Nicholson, S.; et al. Technical, economic, and environmental comparison of closed-loop recycling technologies for common plastics. ACS Sustain. Chem. Eng. 2023, 11, 497–509. [Google Scholar] [CrossRef] [Scilit]
- International Energy Agency (IEA). Global Hydrogen Review 2023; IEA: Paris, France, 2023; Available online: https://www.iea.org/reports/global-hydrogen-review-2023 (accessed on 17 February 2026).
- Towler, G.; Sinnott, R. Chemical Engineering Design: Principles, Practice and Economics of Plant and Process Design, 2nd ed.; Elsevier: Oxford, UK, 2020. [Google Scholar]
- Al-Qadri, A.A.; Ahmed, U.; Abdul Jameel, A.G.; Zahid, U.; Usman, M.; Ahmad, N. Simulation and modelling of hydrogen production from waste plastics: Technoeconomic analysis. Polymers 2022, 14, 2056. [Google Scholar] [CrossRef] [Scilit]
- Nekrasov, I.; Tynchenko, V.; Bukhtoyarov, V.; Panfilova, T.; Sokolnikov, A.; Gorodov, A.; Panfilov, I. Simulation of the hydrocracking process to produce diesel fuel in Aspen HYSYS. AIP Conf. Proc. 2023, 2616, 020054. [Google Scholar] [CrossRef] [Scilit]
- Ahmad, I.; Khan, M.I.; Khan, H.; Ishaq, M.; Tariq, R.; Gul, K.; Ahmad, W. Pyrolysis study of polypropylene and polyethylene into premium oil products. Int. J. Green Energy 2014, 12, 663–671. [Google Scholar] [CrossRef] [Scilit]
- Sircar, S. Pressure swing adsorption. Ind. Eng. Chem. Res. 2002, 41, 1389–1392. [Google Scholar] [CrossRef] [Scilit]
- Mastral, J.F.; Berrueco, C.; Ceamanos, J. Modelling of the pyrolysis of high-density polyethylene. J. Anal. Appl. Pyrolysis 2006, 79, 313–322. [Google Scholar] [CrossRef] [Scilit]
- Baraj, E.; Ciahotný, K.; Hlinčík, T. The water gas shift reaction: Catalysts and reaction mechanism. Fuel 2020, 288, 119817. [Google Scholar] [CrossRef] [Scilit]
- Hu, X.; Gholizadeh, M. Biomass pyrolysis: A review of the process development and challenges. J. Energy Chem. 2019, 39, 109–143. [Google Scholar] [CrossRef] [Scilit]
- Mong, G.R.; Chong, C.T.; Chong, W.W.F.; Ng, J.-H.; Ong, H.C.; Ashokkumar, V.; Tran, M.-V.; Karmakar, S.; Goh, B.H.H.; Mohd Yasin, M.F. Progress and challenges in sustainable pyrolysis technology: Reactors, feedstocks and products. Fuel 2022, 324, 124777. [Google Scholar] [CrossRef] [Scilit]
- Coulson, J.M.; Richardson, J.F. Chemical Engineering Design. In Coulson & Richardson’s Chemical Engineering, 3rd ed.; Butterworth-Heinemann: Oxford, UK, 1996; Volume 6. [Google Scholar]
- GlobalPetrolPrices. Petroleum Product and Fuel Price Data: Pyrolysis Oil Index; GlobalPetrolPrices: Atlanta, GA, USA, 2024; Available online: https://www.globalpetrolprices.com/ (accessed on 26 September 2025).
- Afzal, S.; Singh, A.; Nicholson, S.R.; Uekert, T.; DesVeaux, J.S.; Tan, E.C.D.; Dutta, A.; Carpenter, A.C.; Baldwin, R.M.; Beckham, G.T. Techno-economic analysis and life cycle assessment of mixed plastic waste gasification for production of methanol and hydrogen. Green Chem. 2023, 25, 5068–5085. [Google Scholar] [CrossRef] [Scilit]
- Statista. Hydrogen Price Per Kilogram Worldwide in 2024; Statista: Hamburg, Germany, 2024; Available online: https://www.statista.com/statistics/1256279/hydrogworldwide/ (accessed on 26 September 2025).
- Shaikh, A.; Wang, Q.; Han, L.; Feng, Y.; Sharif, Z.; Li, Z.; Cai, H.; Kumar, S. Techno-economic analysis of hydrogen and electricity production by biomass calcium looping gasification. Sustainability 2022, 14, 2189. [Google Scholar] [CrossRef] [Scilit]

Disclaimer/Publisher’s Note: The statements, opinions and data contained in all publications are solely those of the individual author(s) and contributor(s) and not of MDPI and/or the editor(s). MDPI and/or the editor(s) disclaim responsibility for any injury to people or property resulting from any ideas, methods, instructions or products referred to in the content. |
© 2026 by the authors. Licensee MDPI, Basel, Switzerland. This article is an open access article distributed under the terms and conditions of the Creative Commons Attribution (CC BY) license.