


Abstract
Vans (light commercial vehicles) account for only about 11% of the European light-duty vehicle fleet. However, they are mostly used in urban delivery and service operations where frequent stop-and-go driving increases tyre abrasion. Furthermore, their annual mileage is on average more than 70% higher than that of passenger cars. For these reasons, vans are estimated to generate tyre wear emissions that are at least 2.5 times higher than those of passenger cars on a per-vehicle basis, and therefore make a disproportionate contribution to microplastic pollution in cities. The Euro 7 pollutant emission standards introduce, for the first time, regulatory limits on tyre abrasion for passenger car tyres (C1 class) from 2028 and for light-commercial-vehicle tyres (C2 class) from 2030, building on United Nations (UN) tyre testing procedures developed under UN Regulation 117. While two candidate test methods (a real-world method and a laboratory method) have been agreed on for C1 tyres, no equivalent standard exists yet for C2 tyres, and very few experimental data have been published so far. In this study, we adapt the C1 real-world-based method to winter C2 tyres (snow three-peak mountain snowflake, 3PMSF) fitted to vans, and we discuss the practical and regulatory challenges encountered. The resulting abrasion rate and abrasion level indices provide first experimental emission factors for C2 tyres and can inform the ongoing development of regulatory test procedures and limit values for van tyres. We also develop an experimental and analytical framework to relate abrasion measurements to tyre service life (mileage potential).
1. Introduction
Numerous studies highlight the importance of microplastic pollution for all environmental compartments [1,2,3,4]. Microplastics can be found in aquatic, terrestrial, and atmospheric environments, thus affecting the respective ecosystems [2,5,6,7,8]. Most studies estimate that tyres contribute at least 35% to the microplastics unintentionally emitted into the environment [9,10]. In some cases, contributions that exceed 50% have been reported. In cities, hotspots include traffic lights and curves [11]. The tyre particle sizes range from a few μm to a few hundred μm, but nucleation mode particles of a few nm can be found when the tyre temperature increases [10,12,13]. Tyre particles have been shown to have adverse environmental and health effects [14,15]. For humans, of particular concern is the airborne fraction, which contains various chemical species such as volatile organic compounds, polycyclic aromatic hydrocarbons (PAHs) and Zn [16,17,18]. The on-board measurement of airborne tyre particulate matter (PM) has difficulties, because the contributions from other sources (e.g., due to dust resuspension) are high and not easily quantifiable [19,20,21].
A recent analysis estimated that passenger cars emitted 300 kt of microplastics in the year 2025 [22]. The corresponding figure for vans is estimated to be approximately 120 kt. Within road transport, vans (light commercial vehicles) represent about 11% of the light-duty fleet, but vans are driven on average at least 70% more than passenger cars. Vans are predominantly used in urban delivery and service operations where frequent stop-and-go driving increases tyre abrasion [23]. For this reason, tyre wear attributed to vans is estimated to be at least 2.5 times higher compared to passenger cars. Considering also that most of the driven distance is in urban environments, it can be concluded that they contribute significantly to the microplastic pollution in cities. Various parameters affect tyre wear, in addition to the tyre properties and characteristics, such as the road, the vehicle, the driving behaviour and the environment [12,13,24,25,26,27,28].
The number of published studies discussing the abrasion rate of passenger car tyres (typically C1 tyres) has increased in the last five years. One of the reasons is the introduction of tyre abrasion limits in the Euro 7 regulation. The Euro 7 pollutant emission standards [29] introduce, for the first time, regulatory limits on tyre abrasion for passenger car (C1 class) tyres from 2028 and for van (C2 class) tyres from 2030. The limit values should be set by referring to the work of the World Forum for Harmonization of Vehicle Regulations (WP.29), currently focused on the United Nations Economic Commission for Europe (UNECE) Task Force on Tyre Abrasion (TF TA). At the time of testing, the method was part of United Nations (UN) Regulation 117 [30]. There has been a decision to develop a standalone UN Regulation [31]. Although this measure will come into effect only in 2028, the interest in understanding the topic and the influencing parameters has increased.
Abrasion rates for C2 tyres are still scarce, as currently there is no standardised or at least commonly accepted methodology. Many studies are based on default emission factors [32]. However, the experimental data are limited. Tests can be performed by driving on roads or indoor with dedicated drums. Both methods have their advantages and disadvantages [19,33]. During a UNECE meeting in 2013, the Russian Federation reported measured emission factors (at vehicle level) of six tyres of 43–62 mg/km/tyre [34]. A South Korean study in 2020 estimated 224 mg/km/vehicle (based on six tyre models) [35]. A recent study assumed that C2 tyres should have the same emission factor as C1 tyres when normalised to the vehicle weight [36]. They estimated emissions of 29 mg/km/tyre for a 50%-loaded C2 tyre.
The aim of the present study is twofold. First, it aims to assess the feasibility of applying the real-world road convoy method that underpins the Euro 7 tyre abrasion limits for passenger car tyres (C1 class) to C2-class tyres fitted to vans, and to discuss the main practical differences with respect to the C1 implementation. To the authors’ knowledge, there is no such study publicly available at the time of the publication of this paper. Furthermore, there is limited data on abrasion rates of C2 tyres currently in the market. Second, this study aims to develop an experimental and analytical framework to link measured abrasion to tyre service life, by defining simple indices that can be used both to characterise the performance of individual tyre models and to support the development of regulatory test procedures and limit values for C2-class tyres. Such a framework might result in reduced tread depth measurement efforts and related uncertainty.
2. Materials and Methods
2.1. Experimental Procedure
The tests followed the procedure defined in a draft UN Regulation on tyre abrasion for passenger car C1 tyres [31], which is largely based on the convoy method originally introduced as Annex 10 to UN Regulation 117 [30]. Only minor adaptations were required to accommodate the higher mass and different tyre dimensions of vans; these differences from the C1 method are highlighted below.
In brief, two convoys were organised, each comprising four vehicles: three vans equipped with candidate C2 tyres and one passenger car fitted with the snow reference C1 tyres (SRTT17-W). The target vehicle load was 67% of the rated load, corresponding to the tyre load index. Both convoys were driven over the same test route (circuit) and under similar meteorological conditions. The daily distance driven on different roads (circuit) was approximately 500 km. One convoy (#2) ran for 8000 km in total, similarly to what is required in the method established for C1 tyres. Convoy 1 ran for 10,000 km in total, in order to investigate whether wear stabilises at 8000 km or not. The vans and passenger car rotated position in the convoy, as well as the drivers, in order to expose the tyres under the same conditions. The average ambient temperature was 12 °C (convoy 1) and 18 °C (convoy 2). At the time of testing, the values were within the permitted boundaries of the current UN Regulation 117 method (−3 to 20 °C). However, it should be noted that there is a proposal to change the boundaries to −3 to 17 °C in the future [31]. This would result in non-compliance for convoy 2. Convoy 2 fulfilled the second future requirement for temperatures: the temperature was within −7 °C and 22 °C for at least 90% of the test distance.
Convoy 1 consisted of (i) three large identical vans fitted with three-peak mountain snowflake (3PMSF) winter (snow) C2 tyres of 235/65 R16 size with load index LI = 115 and (ii) one reference passenger car fitted with winter reference C1 tyres (SRTT17-W). The second convoy consisted of (i) three medium-sized vans fitted with 205/65 R16 C2 tyres with LI = 107 and (ii) the same passenger car fitted with reference C1 tyres (see Table 1). C2 tyres with LI = 107 have the same load index as some C1 tyres typically used in heavier passenger cars such as Sport Utility Vehicles (SUVs). C2 tyres with LI = 115 are at the high end of the load for vans (3.5 t). Note that the highest LI of C2 tyres is 121; such tyres are fitted to light trucks. The selected tyre sizes were in the top four best-selling sizes [37].
Table 1.
Main settings of the tested convoys. LI = load index.
All vans were loaded using ballast to achieve the target 67% load capacity of the tyres; i.e., the vans of the first convoy weighed 3.26 t, while those of the second weighted 2.61 t. The reference vehicle in both convoys was also loaded to reach 67% of the load capacity of the reference tyres (vehicle weight 1.80 t). The 67% value is defined in the regulation as a representative value of the tyre loading, without reaching the max payload of the vehicles. The load distribution of the reference vehicle was 56% at the front axle and 44% at the rear axle, as prescribed in the C1 regulation for front-wheel-drive vehicles fitted with C1 tyres: 56%/44%, with a tolerance of ±7% (abs.). Achieving the prescribed 56%/44% front–rear load split used for the C1 front-wheel-drive reference vehicle was not feasible for the vans. We therefore adopted a 50%/50% distribution, which better represents typical urban delivery loading, but at the same time complies with the regulation.
The vehicle alignment settings (toe, camber) were set following the regulation target values, although many of them could not be adjusted (camber, rear toe) for the vans (see Appendix A).
Tyre inflation pressures were set to 4.75 bar for the 235/65 R16 tyres of convoy 1, and 3.8 bar for the 205/65 R16 tyres of convoy 2. For both tyre types, 4.75 bar is the max pressure for loaded conditions. For convoy 2, we reduced inflation pressure to 3.8 bar to reflect common practice at a lower payload; the chosen pressure preserved the proportionality between load and inflation pressure used for convoy 1. The inflation pressure of the reference tyres 225/45 R17 XL was 2.9 bar in accordance with the regulation. All tyres were snow (winter) tyres and had the three-peak mountain snowflake (3PMSF) marking on them, indicating that they were designed for severe snow conditions requiring increased traction and stability. The main parameters of the tested tyres can be found in Table 2.
Table 2.
Overview of tested tyres. Unit prices in Euro as indicated by the provider at the time of purchase (year 2025). ‘Mud and Snow’ (M + S) and ‘three-peak mountain snowflake’ (3PMSF) markings, rolling resistance (RR), wet grip (WG) classes and noise emissions (in dB) according to tyre labelling regulation (EU) 2020/740 [38].
The tyres were weighed at the start and at the end of the complete test (10,000 km for convoy 1 and 8000 km for convoy 2) using a precision balance with a resolution of 1 g and 2 g uncertainty. Tyre mass loss was also determined by weighing each wheel (tyre mounted on rim) before and after each 2000 km test segment, using the same balance. Before weighing, tyres and rims were carefully cleaned to remove stones, mud and other debris. The mass loss as calculated from the tyre weighing only or the tyre and the rim assembly was almost identical: the average difference was 0.2% with one standard deviation of 1.4%. The load of the tyres was determined with a scale having accuracy better than 0.5% of the reading. Tread depth was measured at several circumferential positions and across three longitudinal grooves on each tyre using a digital tread depth gauge; the exact measurement locations are described in the Appendix A. Instrumentation for vehicle speed, distance and acceleration was identical to that used in our previous C1-class tyre study [39], allowing direct comparison between the two campaigns.
2.2. Theoretical Background
The abrasion rate (AR) of a tyre set (mg/km) is defined as follows:
where m (g) is the sum of the mass loss of the four tyres set (every 2000 km or at the end of the test after 8000 or 10,000 km) and D (km) is the distance (2000 km, or 8000 or 10,000 km).
AR = 1000 m/D
The abrasion level (AL) of a tyre (mg/km/t) is as follows:
where Q (kg) is the measured total load of the vehicle (which corresponds approximately to the sum of 67% of the load index of the tyres).
AL = 1000 AR/Q
The abrasion rate index (ARI) and abrasion level index (ALI) of the candidate tyres (both unitless) are as follows:
ARI = ARcand/ARref
ALI = ALcand/ALref
The service life (SL) (km) of the tyres (i.e., an indication of how many km they would last under the specific driving and environmental conditions) can be estimated by extrapolating to the minimum required tread depth. We assumed a value of 1.6 mm following the minimum permissible value according to Directive 89/459 [40].
where Ds is the starting distance (0 km), De is the end distance (8000 or 10,000 km), Ts is the start tread depth (mm), and Te is the end tread depth (mm). This was calculated for each of the main grooves (three or four) and not the tyre shoulders. The SL was estimated for each tyre (front right, front left, rear right, rear left) as the minimum value for each groove of the specific tyre. Then the average of the four tyres was calculated to give the SL of the specific tyre. The service life index (SLI) (unitless) was then calculated by dividing the SL of the candidate and the SL of the reference tyres:
SL = Ds + [(Ts − 1.6)/(Ts − Te)] (De − Ds)
SLI = SLcand/SLref
The calculations were repeated using the average SL of the main grooves (instead of the min value), and then the average of the four tyres. The difference will be discussed in the Results Section. Note that the SLI is almost independent of this value as it similarly impacts candidate and reference tyres. In other words, even though the absolute value of the SL will be impacted, the classification of tyres (given by the SLI) will only be slightly affected.
In order to find the relation between service life and abrasion indices, we set up a simplified scheme. We can assume that the tread mass loss Δm (g) can be calculated from the reduction in tread volume ΔV (cm3), taking into account the tread density ρ (g/cm3):
where the volume is calculated from the wheel diameter d (cm), the tyre–road contact width C (cm), the void area ratio v (%) and the tread depth reduction ΔT (mm):
Δm = ρ ΔV
ΔV= π d (ΔT/10) C (1 − v)
More details are described in [41]. Then, ARI (unitless) can be estimated by the following equation (assuming equal distance travelled for candidate and reference vehicles):
ARI = Δmcand/Δmref
Replacing Equations (7) and (8) in Equation (9), ARI is given as
ARI = ρcand dcand ΔTcand Ccand (1 − vcand)/ρref dref ΔTref Cref (1 − vref)
The SL can be approximated by Equation (11), which is an extrapolation of the tread depth reduction ΔT (mm) to the total available tread depth T (mm):
where D is the test distance (km). Then
SL = D T/ΔT
SLI = Tcand ΔTref/Tref ΔTcand
Combining Equations (10) and (12),
SLI = Tcand/Tref ρcand/ρref dcand/dref Ccand/Cref (1 − vcand)/(1 − vref)/ARI
Thus, SLI and ARI are inversely proportional. Most importantly, SLI can be predicted by ARI and tyre characteristics without any tread depth measurement, but only design characteristics of the tyre. Details of the tyre characteristics are given in the Appendix A.
3. Results
This section first verifies that the C2 test campaigns complied with the main requirements of the UN tyre abrasion convoy test method (Section 3.1) and then analyses the wear evolution and the derived indices (Section 3.2). The focus of the subsequent section (Section 3.3) is on how the measured abrasion and service life indicators for C2 tyres compare with those obtained previously for C1 tyres.
3.1. Quality Checks
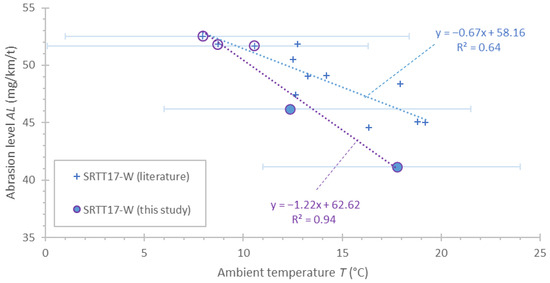
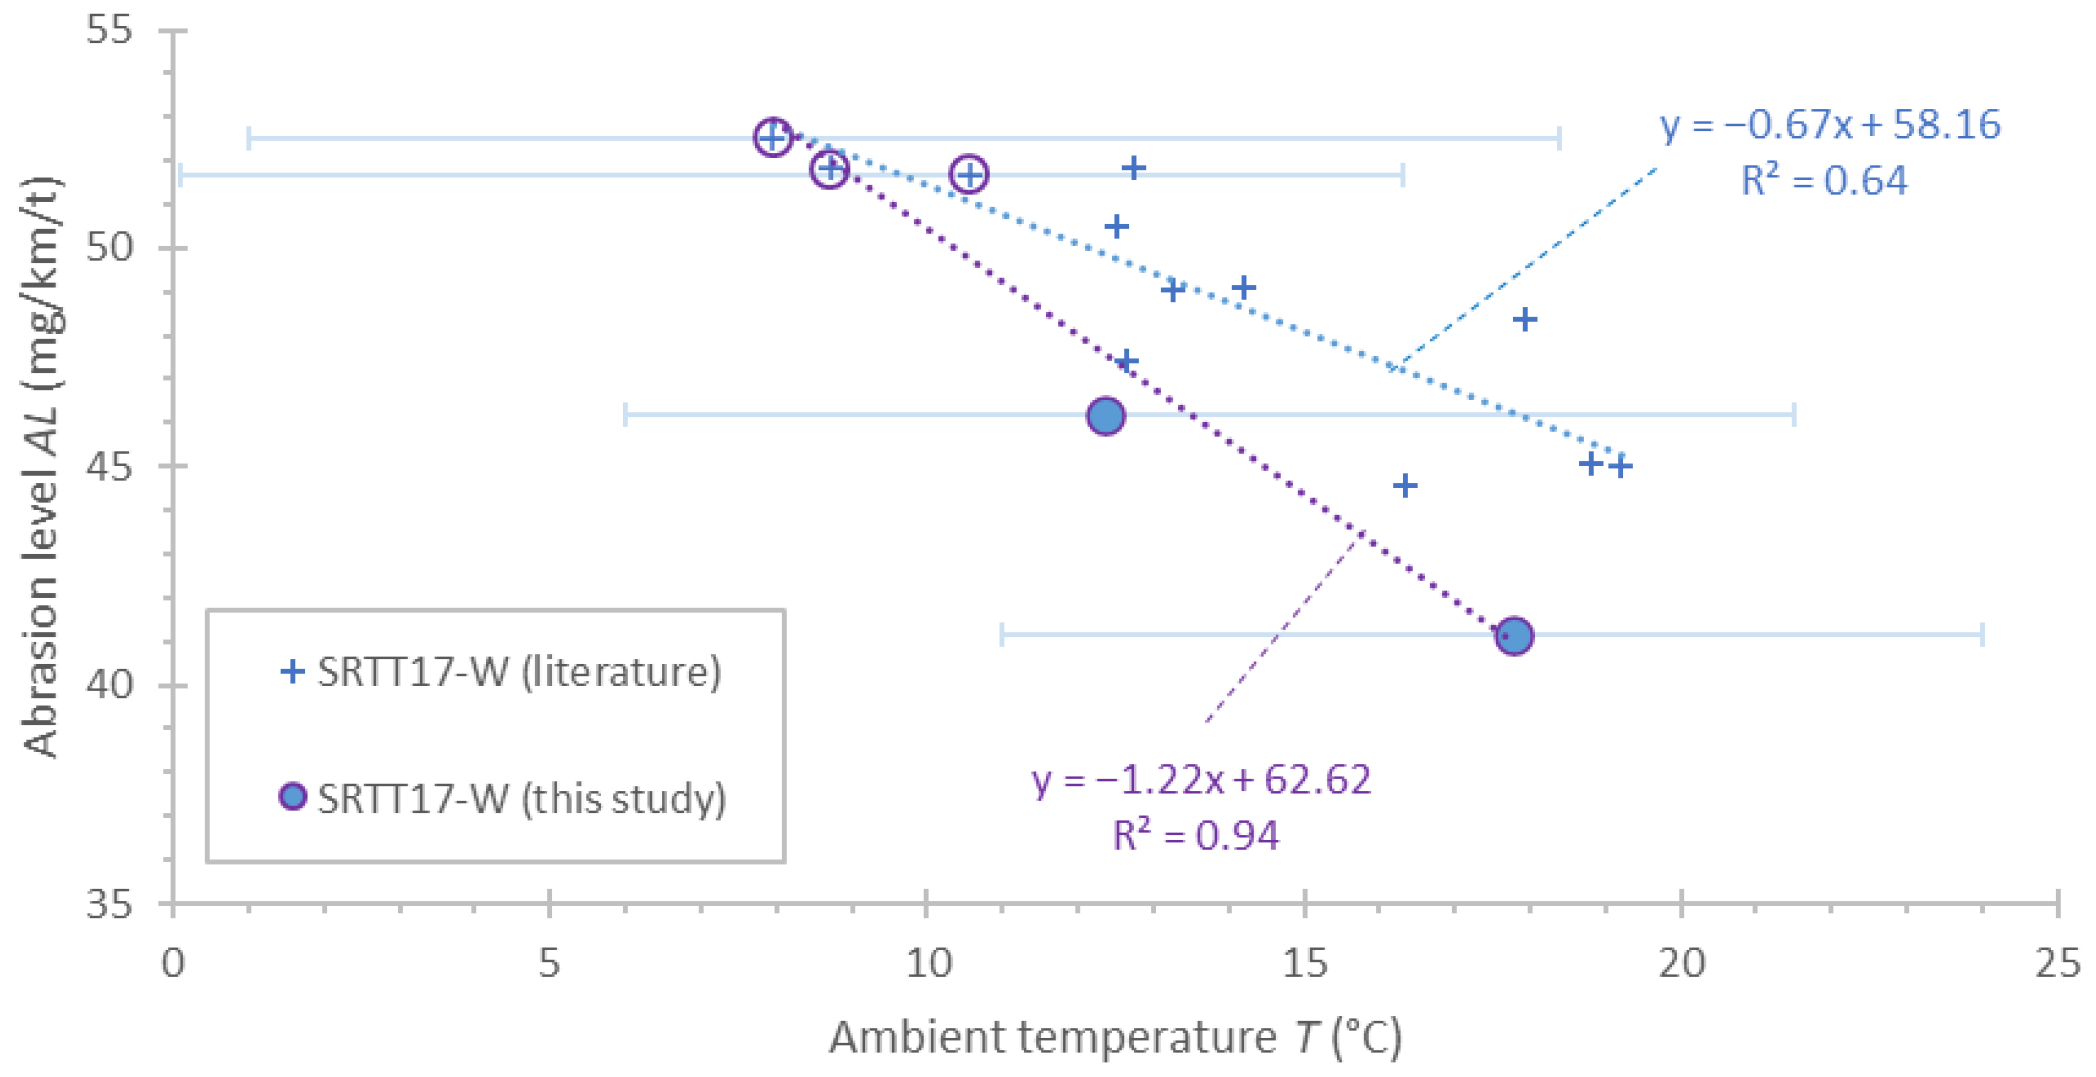
Figure 1 shows the abrasion level of the snow reference tyres as a function of average ambient temperature, combining data from the literature for the same circuit (crosses), our previous C1 tyre campaign (open circles with crosses) [39] and the present C2 campaign (filled circles). All tests were conducted on the same circuit and followed the convoy protocol based on UN Regulation 117 [30]. The previous results, with relatively high scatter, suggest a decrease in abrasion of about 7 mg/km/t for each 10 °C increase in average temperature (see the slope of the equation in Figure 1: −6.7 mg/km/t per 10 °C increase), whereas the combined C1 and C2 data from our two campaigns point to a somewhat stronger dependence, around −12 mg/km/t per 10 °C increase. Possible explanations could be inherent variability of the reference tyres, different temperature distribution over the 8000 km, different rain conditions, or even different driving dynamics that cannot be captured with the indices of the regulation. The abrasion level of the reference tyre in this study was slightly lower than predicted by the literature-based regression but remained well within the regulatory range of 25–75 mg/km/t at 10 °C (our interpolated value was 50 mg/km/t).
Figure 1.
Abrasion level of reference winter tyre from the literature (crosses) and our study (filled circle). The open circles with crosses inside are tests from our previous study with C1 tyres [39].
For each test, the error bars in Figure 1 represent the minimum and maximum ambient temperatures recorded over the full distance. The average temperature over each 500 km circuit remained within ±3.5 °C of the overall test average, and the daily minimum–maximum temperature range was on average 7.5 °C. The current UN Regulation 117 procedure requires the ambient temperature to remain between −7 °C and 25 °C for at least 90% of the test distance; these limits are expected to be tightened to −7 °C to 22 °C in a future amendment. All our tests complied with the current and future requirements. Convoy 2 marginally exceeded the future upper limit (22 °C) over about 3% of the test distance (less than the max 10% allowed). As noted in Section 2, the mean temperatures of convoy 1 (12 °C) and convoy 2 (18 °C) satisfied the range that applied at the time of testing (−3 °C to 20 °C), although convoy 2 would not comply with the proposed future upper limit of 17 °C for average temperature.
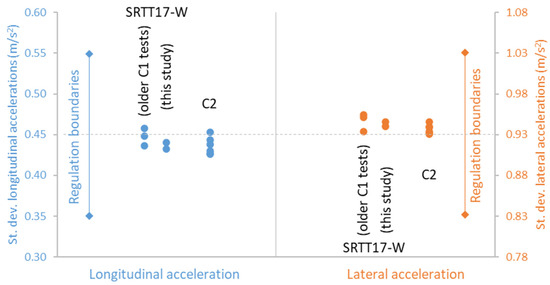
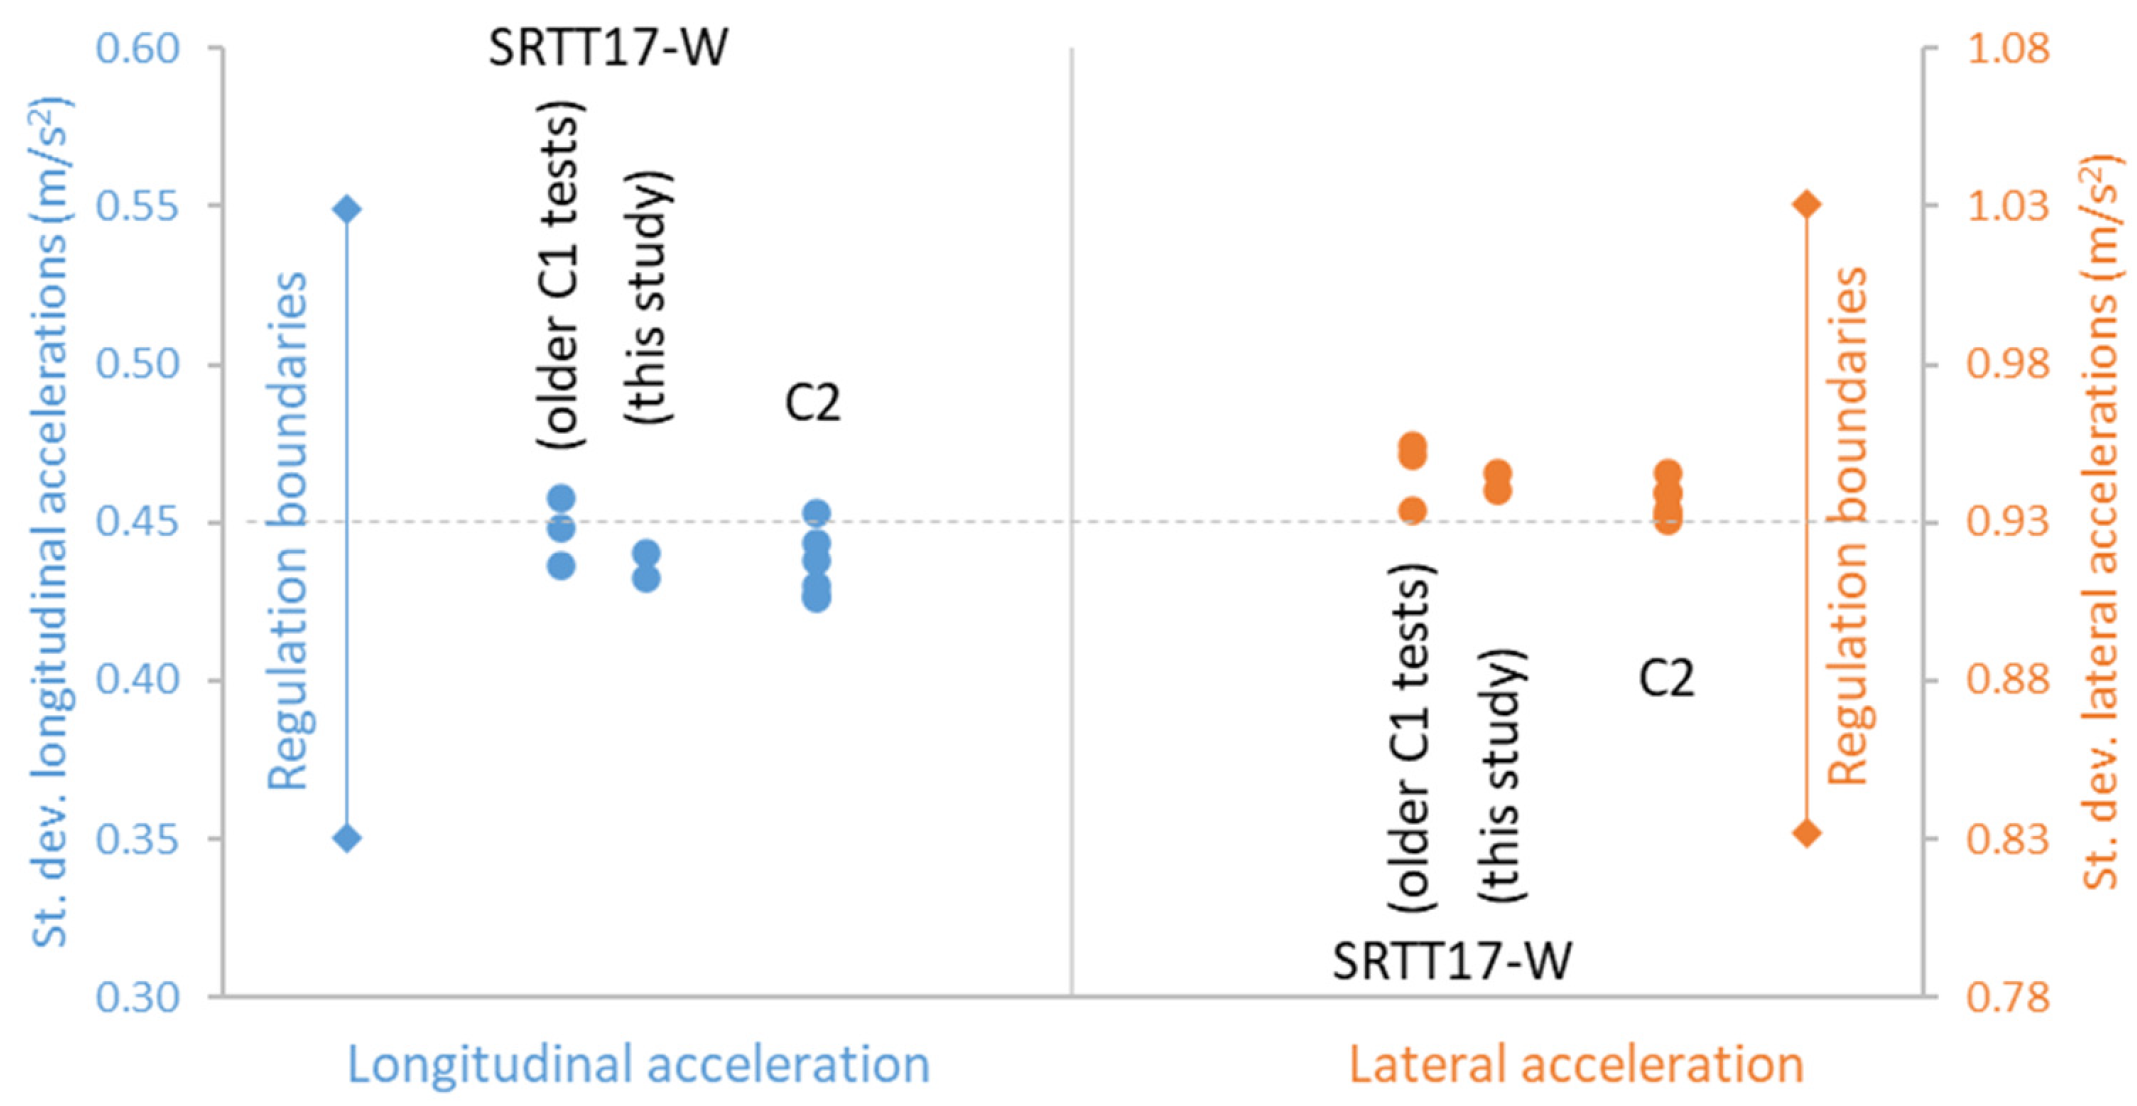
Figure 2 summarises the driving dynamics during the campaign using the standard deviations of longitudinal and lateral accelerations for the reference vehicles equipped with the snow standard reference tyre SRTT17-W and for the vans equipped with C2 tyres; data from the previous C1 campaign are included for comparison. The C2 vans exhibited similar acceleration statistics to the C1 reference convoys and remained well within the regulatory boundaries defined in the UN procedure. This confirms that, even when the vans were loaded to 67% of tyre load capacity, the driving pattern was representative of normal use and did not pose difficulties in driving, braking or cornering.
Figure 2.
Standard deviations of longitudinal (left part, blue) and lateral (right part, orange) accelerations for this campaign with the vans fitted with C2 tyres and the reference vehicles fitted with SRT17-W. Three tests with reference vehicles during the C1 campaign are also plotted. The regulation ranges are given with a capped line.
The vehicle alignment settings are described in detail in the regulation. Although we tried to fulfill all requirements, there were some small deviations (Table 3). For example, the toe and camber of the van rear wheels were not adjustable. The camber of the front tyres of all vehicles was also not adjustable. The values were within the default or extended permitted range and the differences in candidate and reference vehicles within acceptable boundaries, or slightly higher (toe rear, camber front). It is important, though, to note that the differences in the set toe and camber among the vans were very small, and most importantly, the values of the toe and camber remained stable over the test campaign.
Table 3.
Vehicle alignment settings (toe and camber). The first lines summarise the regulation requirements (min and max) for front-drive vehicles. If no vehicles can fulfill the requirements, the extended (ext) ranges can be accepted with restrictions between differences between candidate and reference vehicles (Cv-Rv). Asterisks * indicate settings that could not be adjusted for the specific vehicles. Cv = candidate vehicle; E = end; ext = extended; F = front; R = rear; Rv = reference vehicle; s = start.
3.2. Wear Evolution and Abrasion Indices
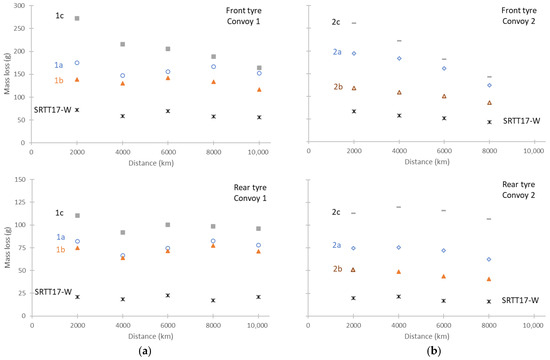
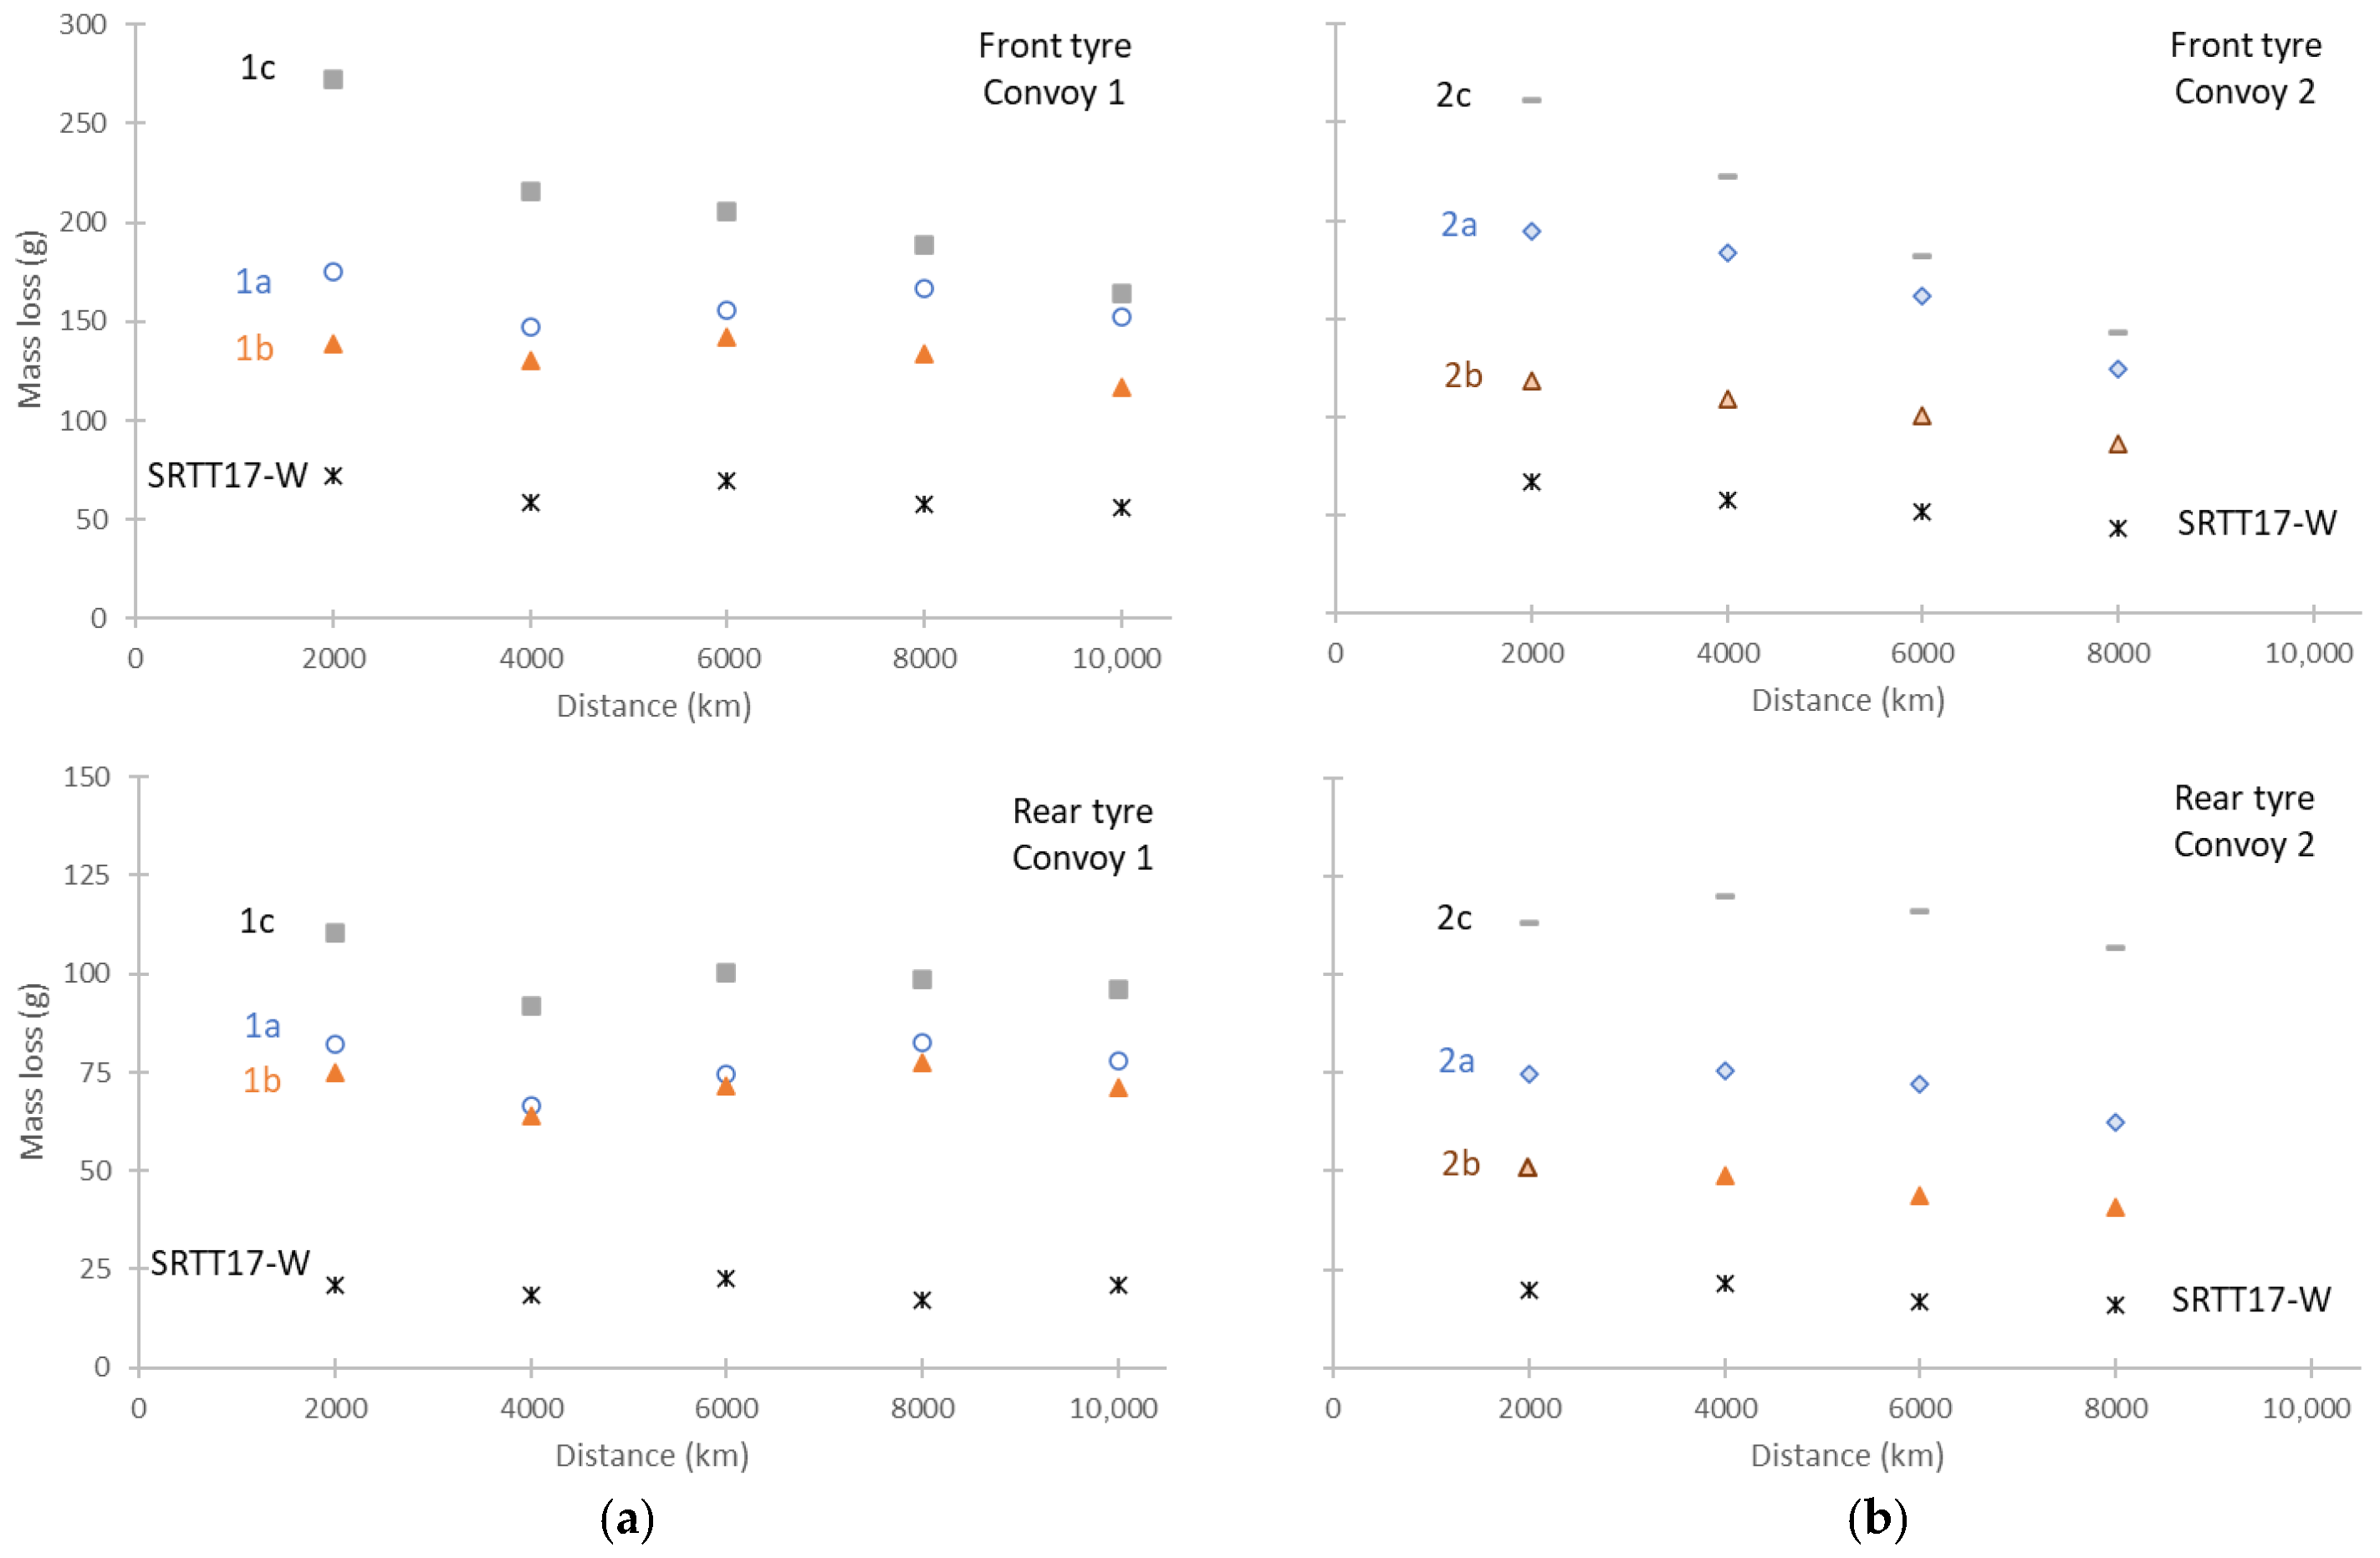
Figure 3 shows the evolution of mass loss every 2000 km for the front and rear tyres of each vehicle in the two convoys. For the reference passenger car, the average mass loss of the front tyres was about 60 g per 2000 km, whereas the rear tyres lost about 20 g per 2000 km. Rear-tyre mass loss was relatively stable over the full distance, while front-tyre mass loss decreased gradually from around 70 g in the first 2000 km to about 50 g in the final interval. Although front and rear tyres were under the same load, front tyres had higher wear for the front-wheel-drive vehicles of our studies, due to steering and higher acceleration and deceleration forces. The higher wear in the first 2000 km is due to the removal of the lubricant coating that prevents the rubber from sticking to the moulds used during manufacturing and due to the higher initial stiffness of the rubber.
Figure 3.
Average mass loss evolution for front tyres (upper panels) and rear tyres (lower panels) for (a) convoy 1; (b) convoy 2. Values refer to one tyre (average of both front or rear tyres).
The candidate C2 tyres showed similar temporal trends but at clearly higher absolute levels. Front-tyre mass loss ranged from about 100 g to 250 g per 2000 km, again with a tendency to decrease as mileage accumulated. Rear-tyre mass loss was more stable and ranged between 50 g and 125 g per 2000 km depending on the tyre model.
For some of the tyres, the mass loss did not stabilise after 8000 km. On the one hand, this raises concerns as to whether 8000 km, as with the C1 protocol, is enough. On the other hand, the ranking of the tyres did not change, challenging the need for longer distances.
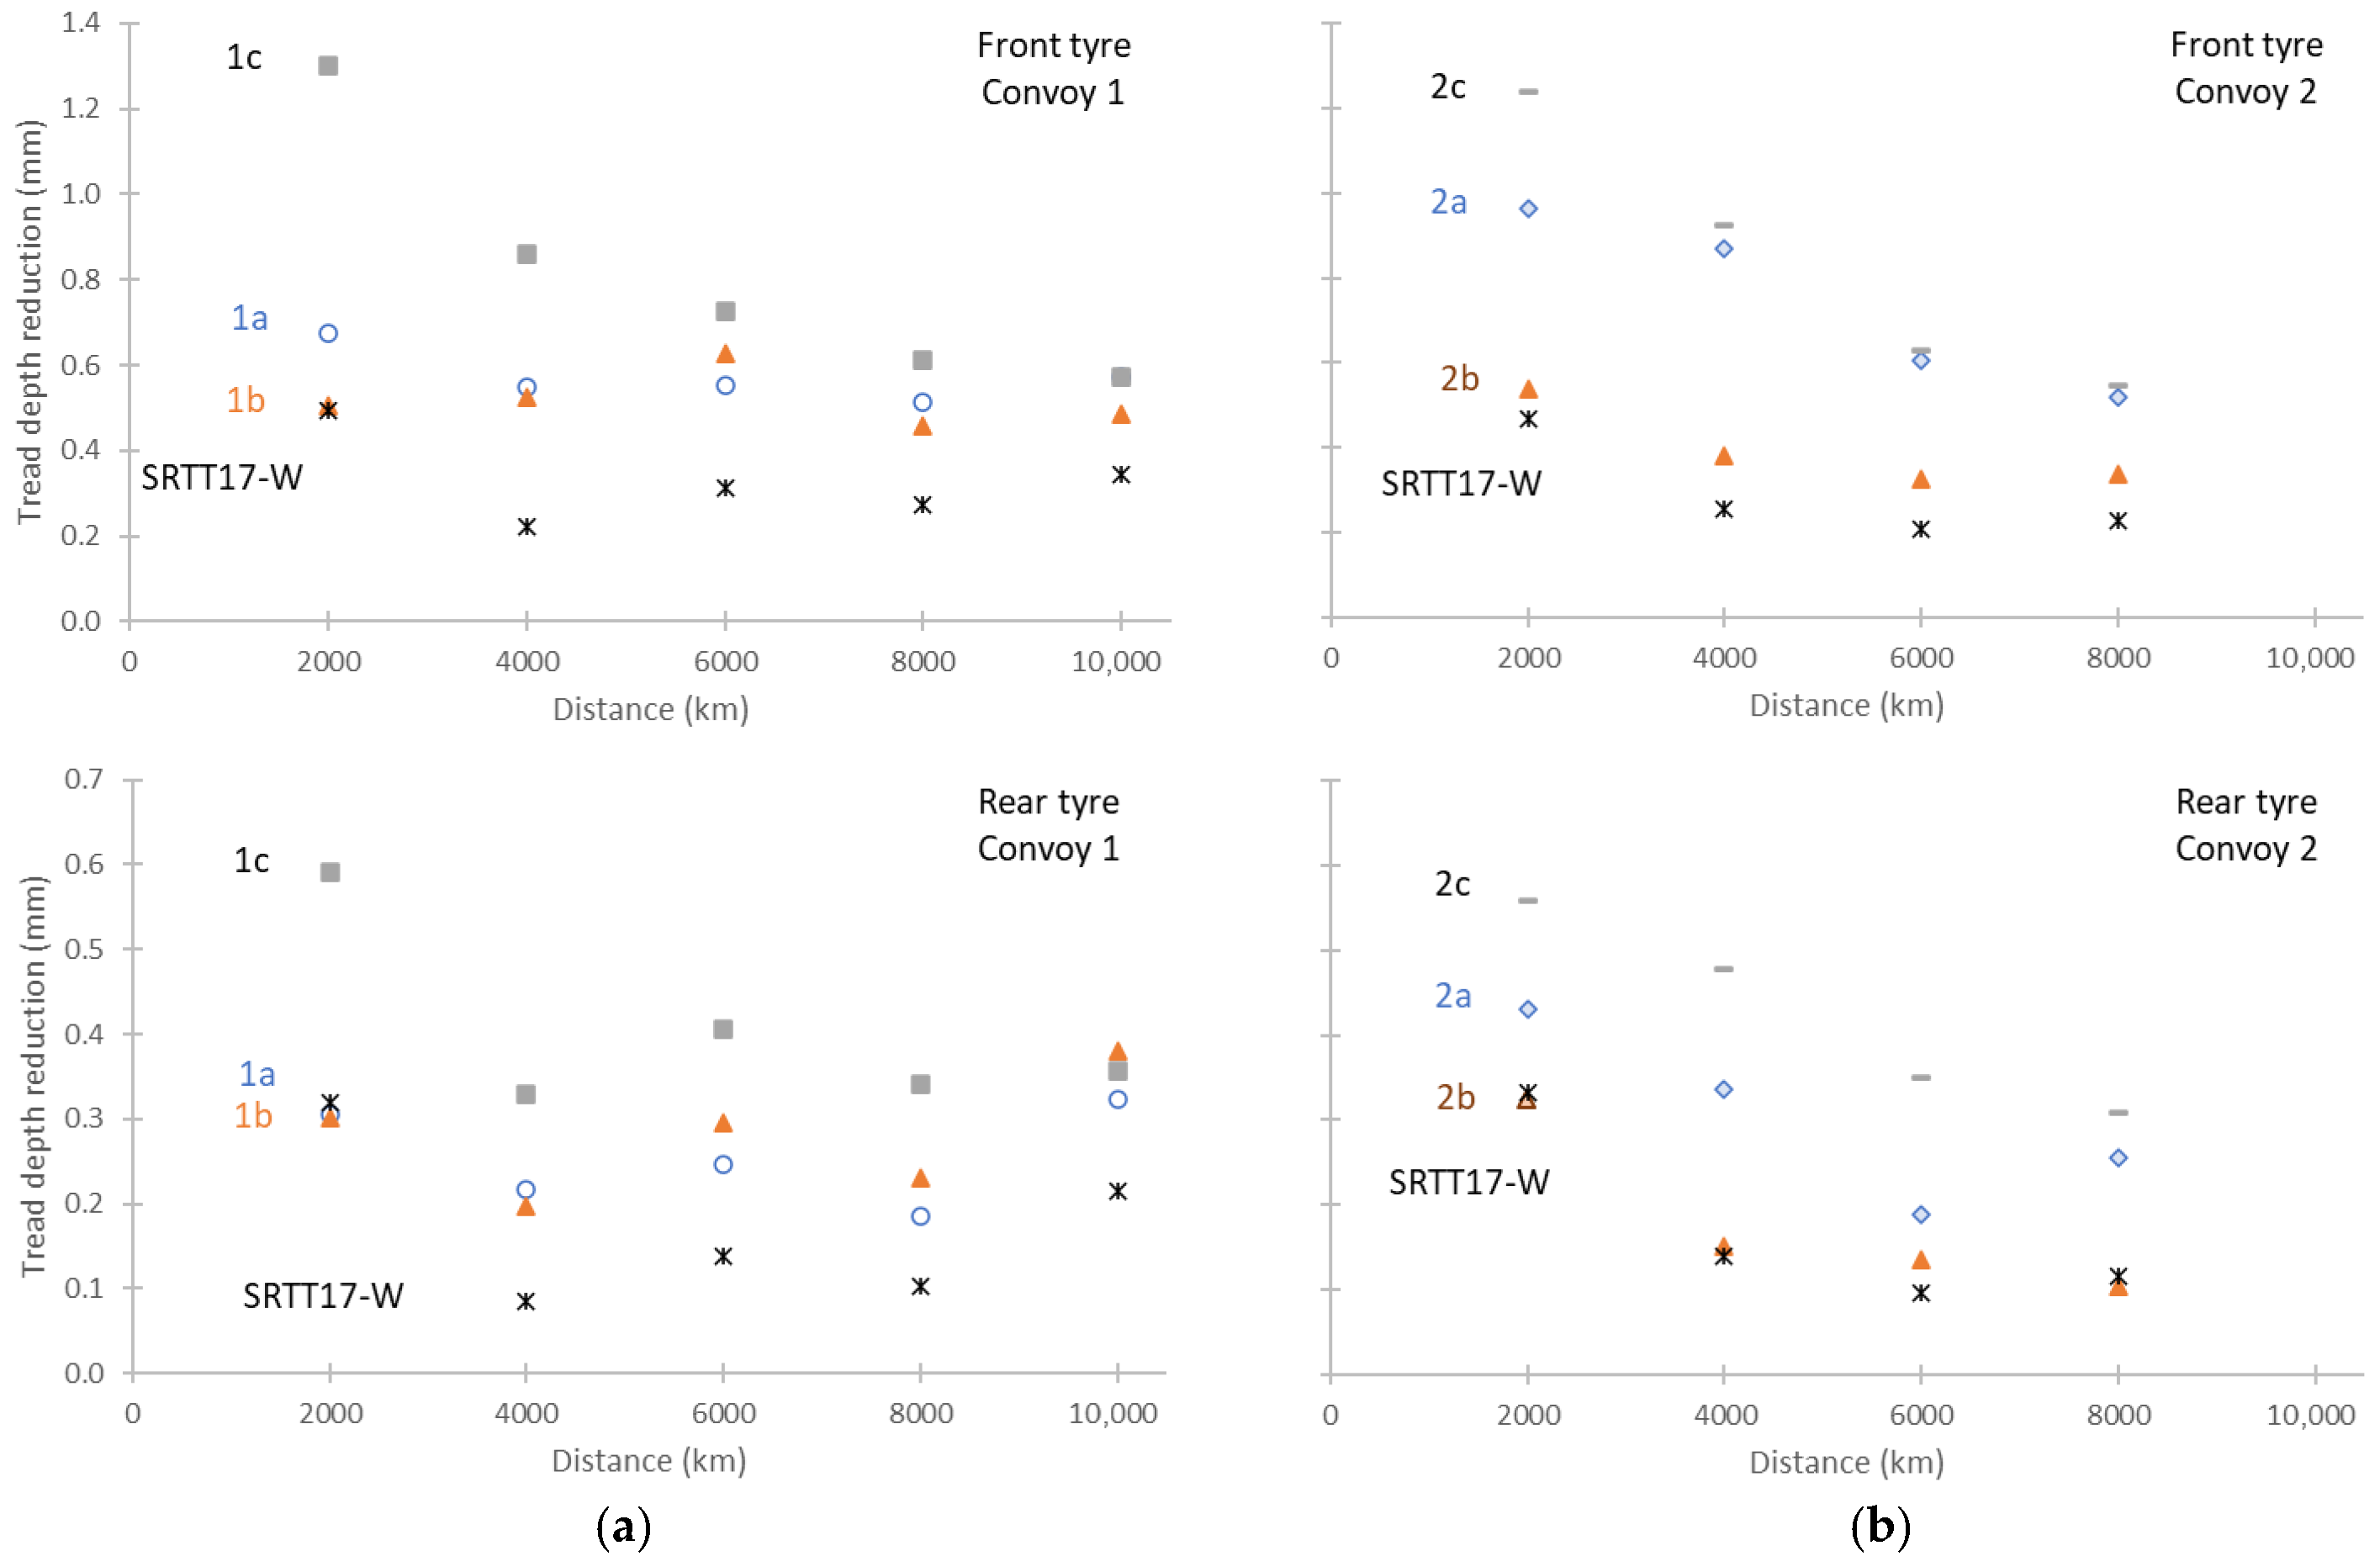
Figure 4 plots the tread depth reduction every 2000 km, separately for the front and rear tyres of the two convoys. The values are tyre-dependent, and the trends are similar to the mass loss: higher at the beginning and tending to stabilise after 8000 km. The reduction in the front tyres is almost double that of the rear tyres. A stabilised value of 0.5 mm every 2000 km for the front tyres translates to 2.5 mm per 10,000 km.
Figure 4.
Average tread depth reduction evolution for front tyres (upper panels) and rear tyres (lower panels) for (a) convoy 1; (b) convoy 2. Values refer to one tyre (average of both front or rear tyres).
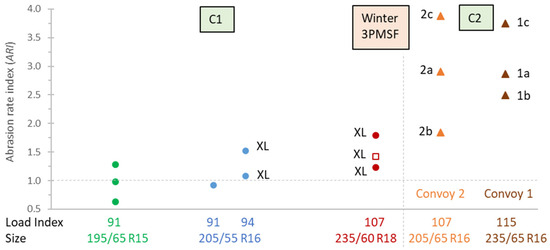
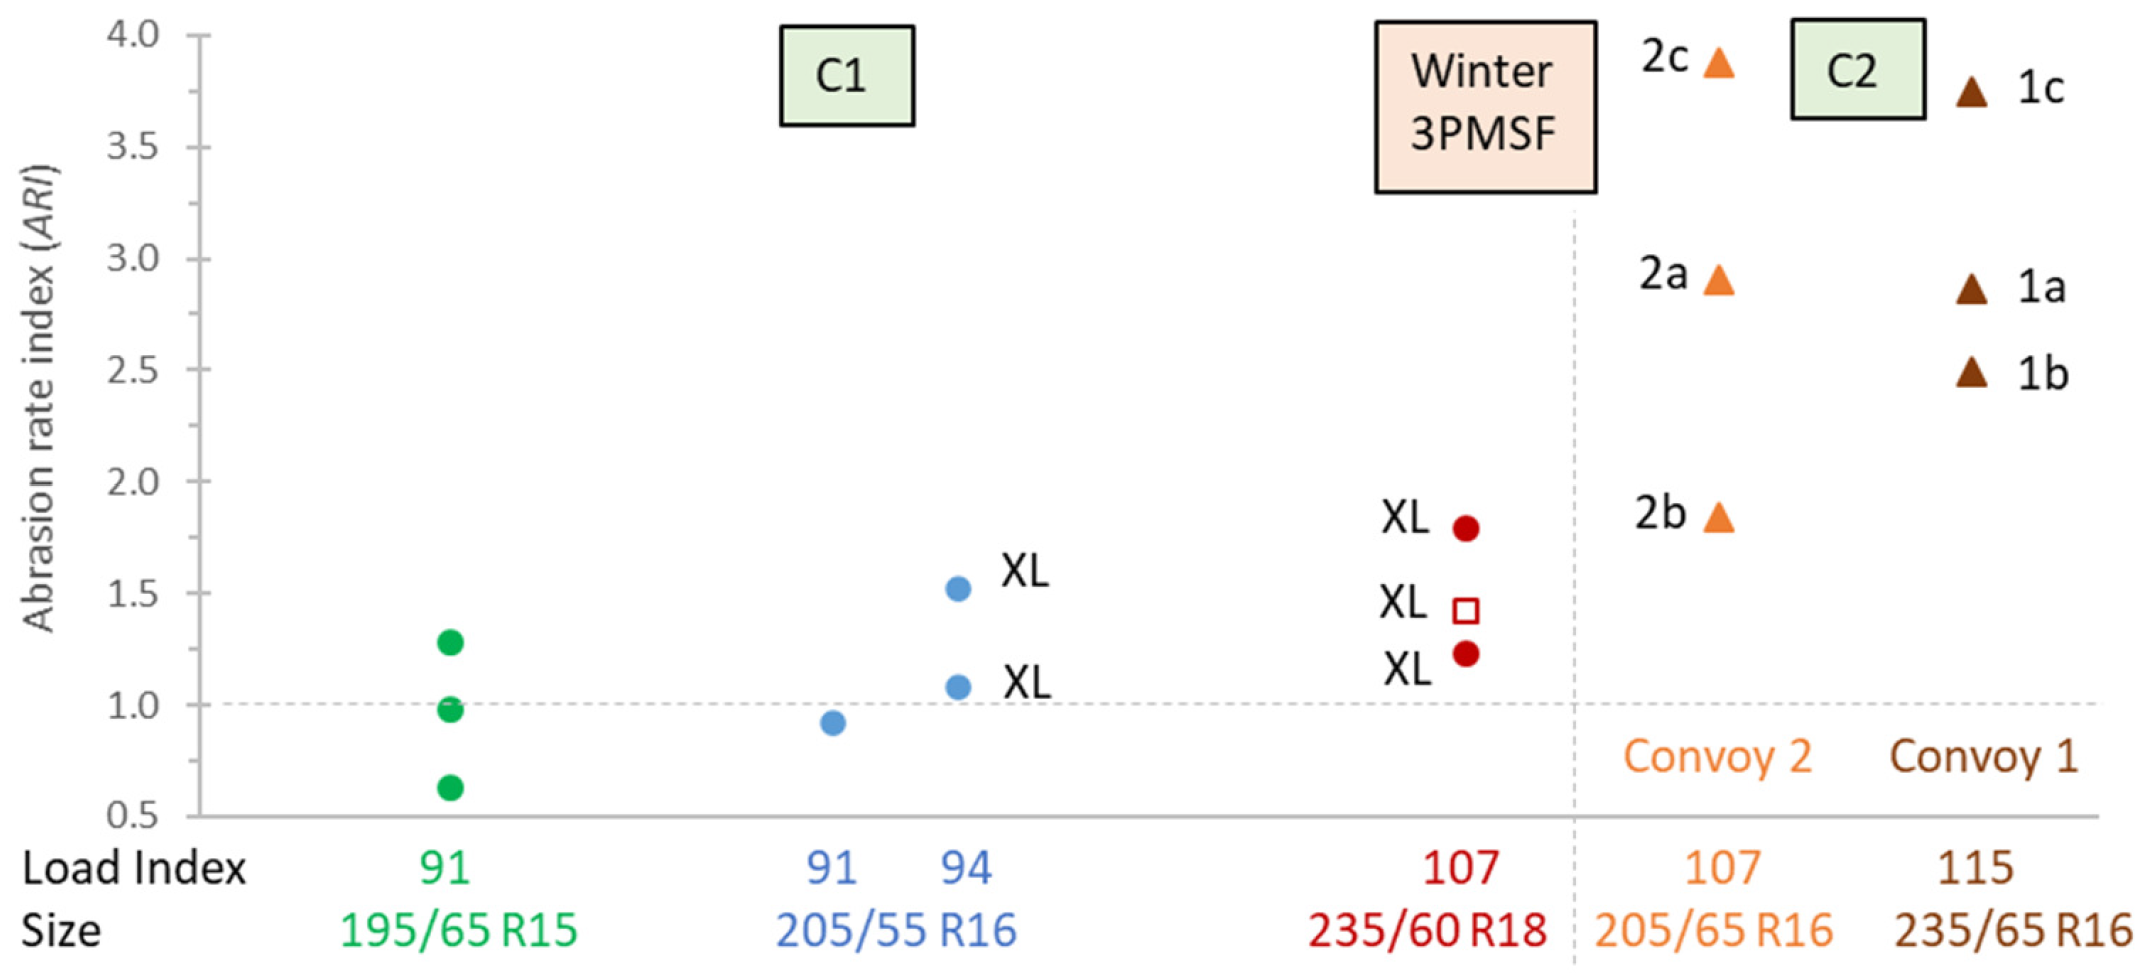
Figure 5 compares the abrasion rate index (ARI) of the C2 tyres tested in this study with the ARI values obtained for C1 tyres in a previous study [39]. In all cases, tyres were tested at 67% of their load index, so a higher load index corresponds to a heavier test vehicle and therefore to higher mechanical stresses on the tyres. Under such conditions, higher abrasion rates are expected for tyres with higher load indices. The ARI of the C2 tyres ranged from 1.8 to 3.9, with an average of 3.0 across the six models. If we assume an average abrasion rate of 83 mg/km for the reference tyre (corresponding to 46 mg/km/t and a reference vehicle mass of 1.8 t), the C2 tyres in our sample would emit approximately 150–325 mg/km, with an average around 250 mg/km at the vehicle level.
Figure 5.
Abrasion rate index (ARI) of snow 3PMSF C2 tyres (triangles; this study) and C1 tyres (circles; [39]). The square marker is a C1 winter M + S tyre without 3PMSF marking. XL (reinforced for increased load capacity) tyres are indicated with an ‘XL’ label.
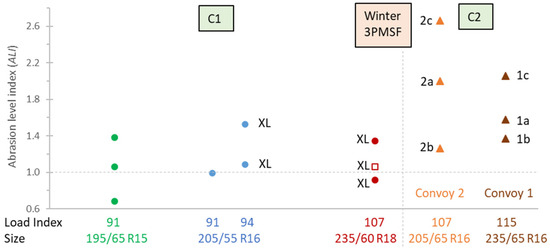
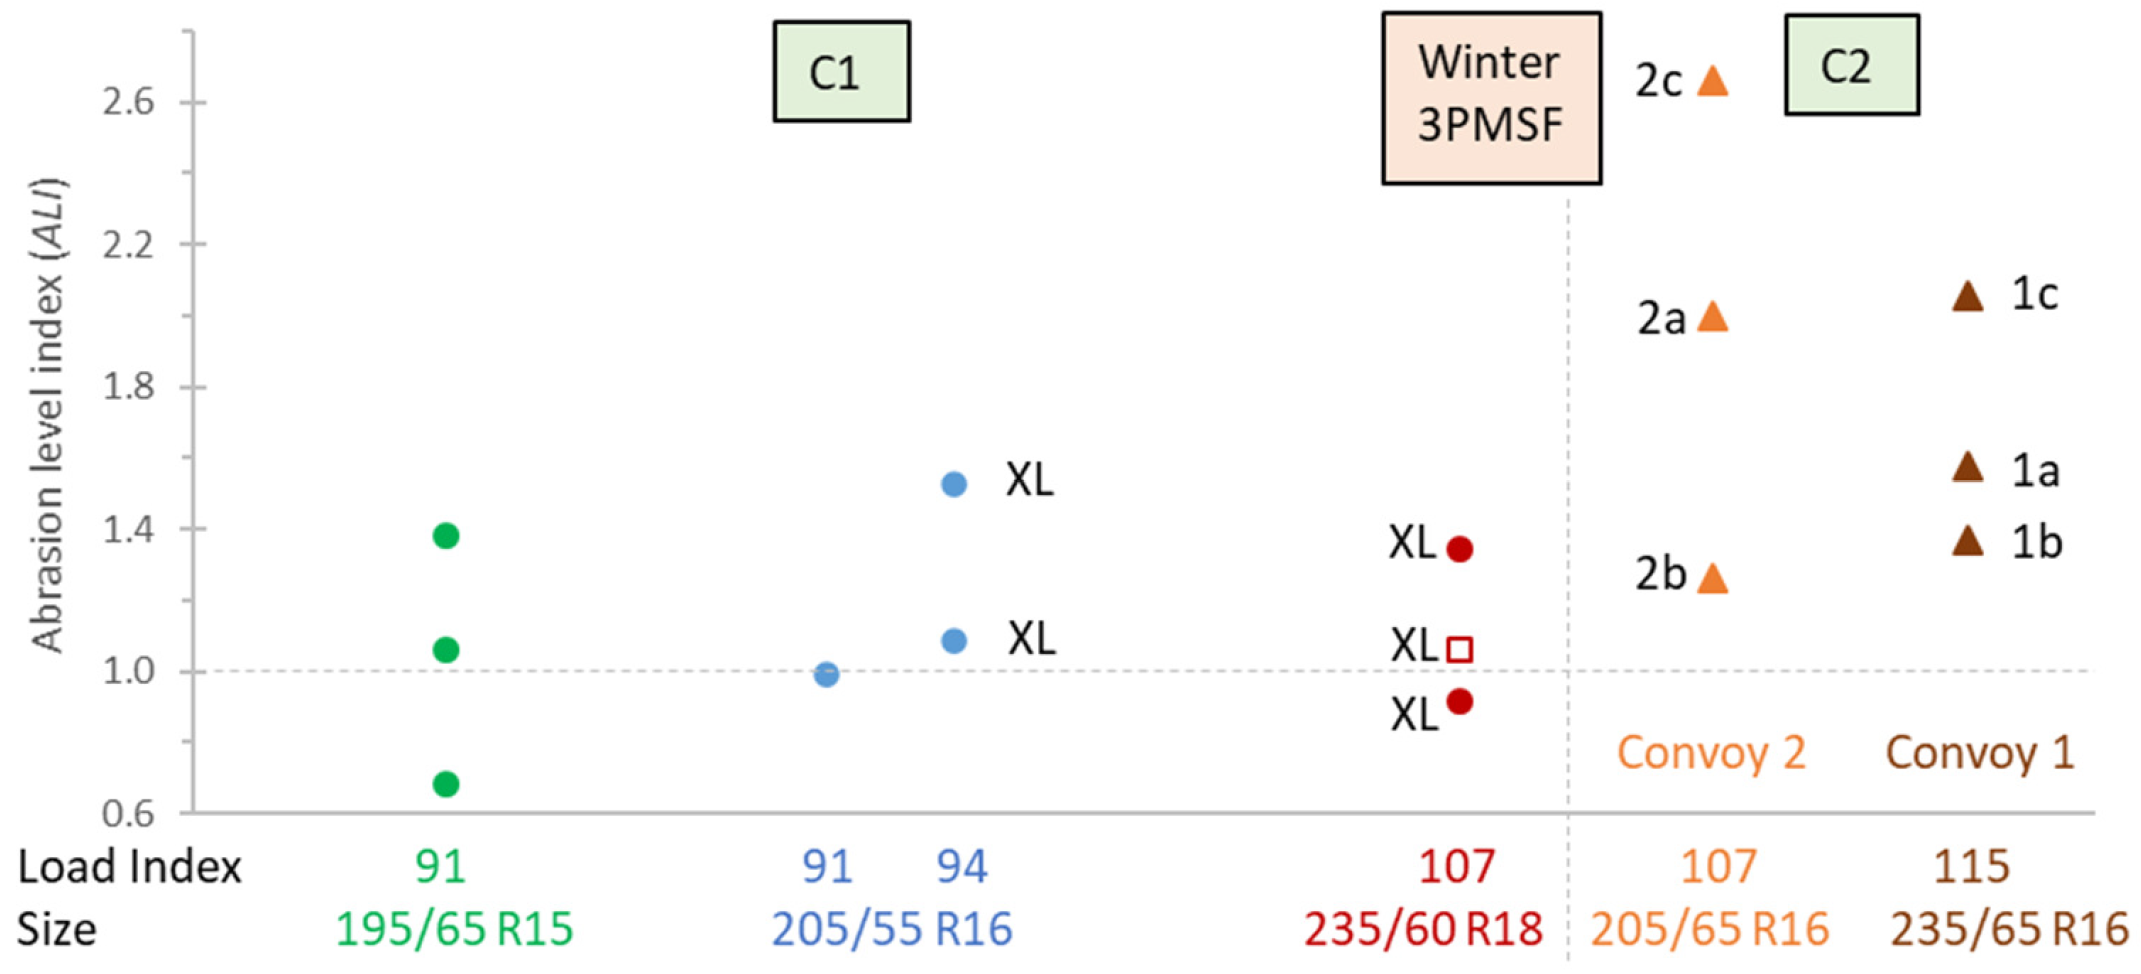
Figure 6 presents the abrasion level index (ALI), which is the ARI normalised to the weight of the vehicle. For the C1 tyres, no clear trend with load index or other design features was observed. The limited C2 data do not allow robust statistical conclusions, but the absolute levels are consistently higher than for C1 tyres: the lowest ALI among the C2 tyres is comparable to the high end of ALIs observed for C1 tyres. For the specific tyres tested here, the mean ALI was 1.1 (range 0.68–1.52) for C1 tyres and 1.8 (range 1.26–2.66) for C2 tyres.
Figure 6.
Abrasion level index of snow 3PMSF C1 tyres (circles) and C2 tyres (triangles). The square point is a C1 tyre M + S but not 3PMSF. XL (reinforced for increased load capacity) tyres are indicated with XL.
3.3. Service Life Index
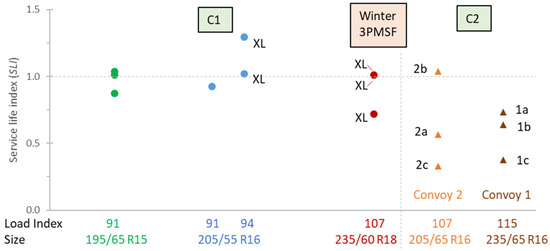
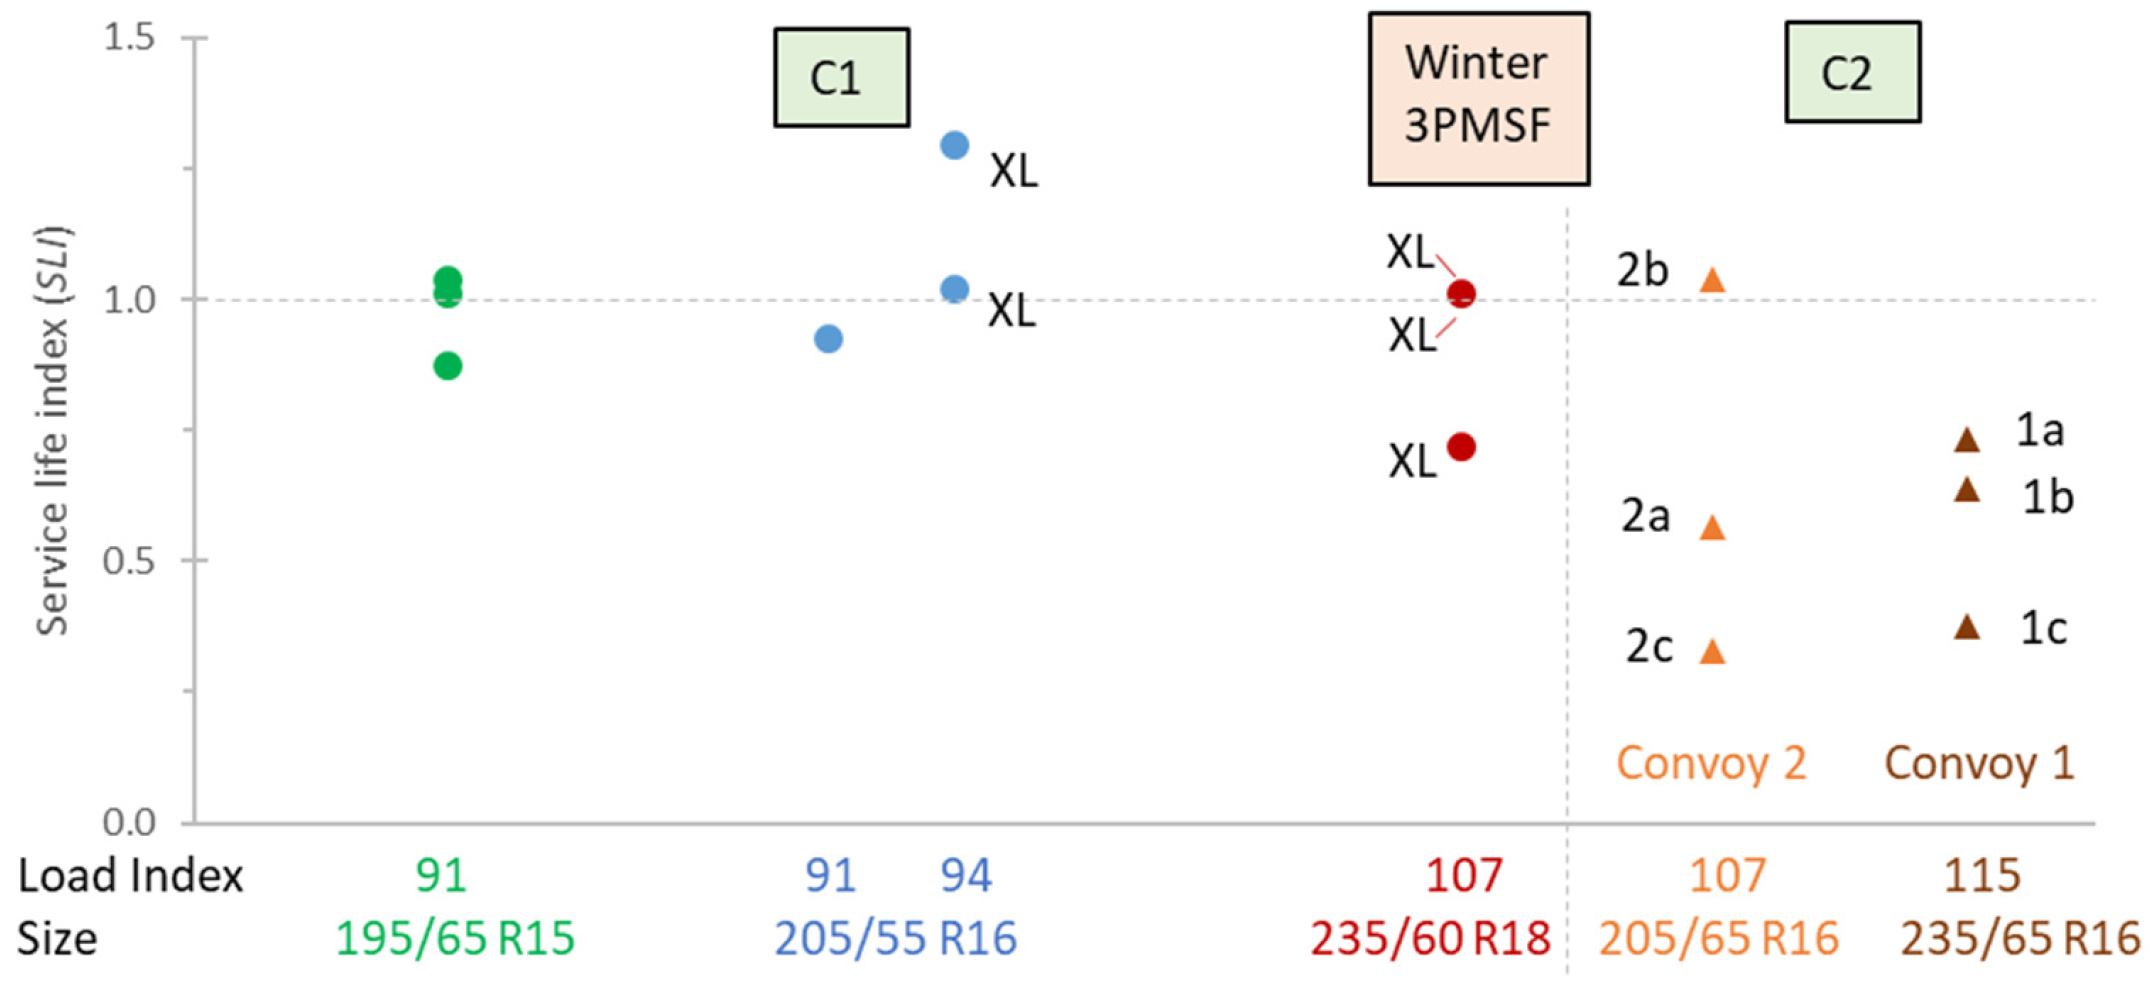
Figure 7 shows the service life index (SLI) derived from tread depth measurements. C2 tyres exhibited SLI values between 0.33 and 1.04 with a mean of 0.61, whereas C1 tyres range from 0.72 to 1.30 with a mean of 0.99. The shorter service life of the C2 tyres is consistent with their higher abrasion levels: under the standardised test conditions used here, the C2 tyres would, on average, reach the legal minimum tread depth after roughly 60% of the mileage of the reference C1 tyres. These values are in agreement with the common practice of changing C1 tyres every 4–5 years and C2 tyres every 3 years (although how often one changes the tyres depends on both the wear and the annual driven distance).
Figure 7.
Service life index of snow 3PMSF C1 tyres (circles) and C2 tyres (triangles). The square point is a C1 tyre M + S but not 3PMSF. XL (reinforced for increased load capacity) tyres are indicated with XL.
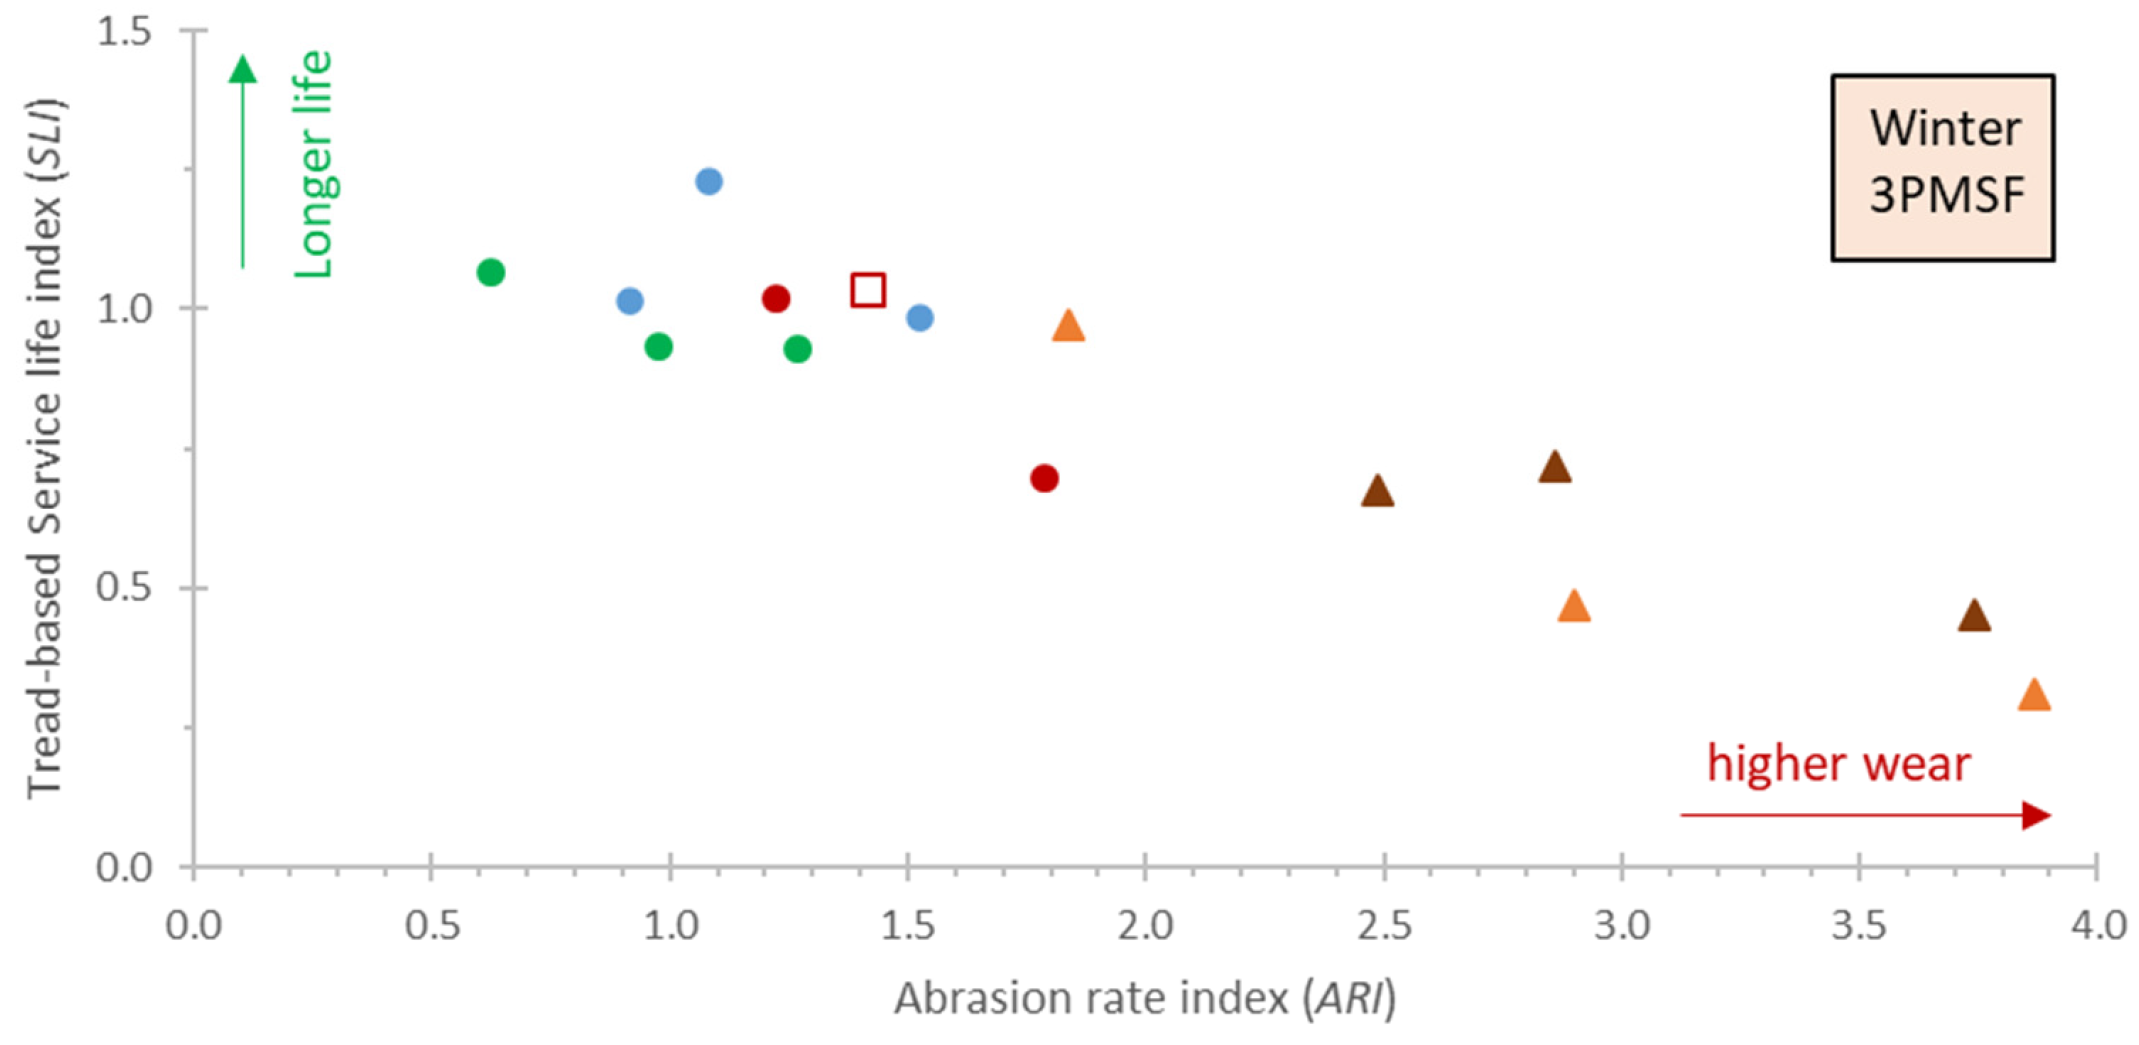
Figure 8 plots the SLI as a function of ARI and reveals an almost linear inverse relationship: tyres with higher abrasion rates have proportionally shorter expected service lives under the standardised conditions of the test. This inverse correlation is consistent with the analytical framework presented in Section 2.2 and with earlier independent findings, for example, from the tyre test programme of German automobile club ADAC [42].
Figure 8.
Correlation of service life index and abrasion rate index of 3PMSF C1 tyres (circles) and 3PMSF C2 tyres (triangles). The square point is a C1 tyre M + S but not 3PMSF. XL (reinforced for increased load capacity) tyres are indicated with XL. The symbols are the same as in Figure 6.
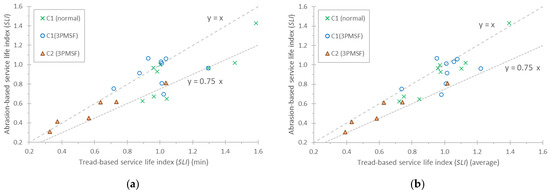
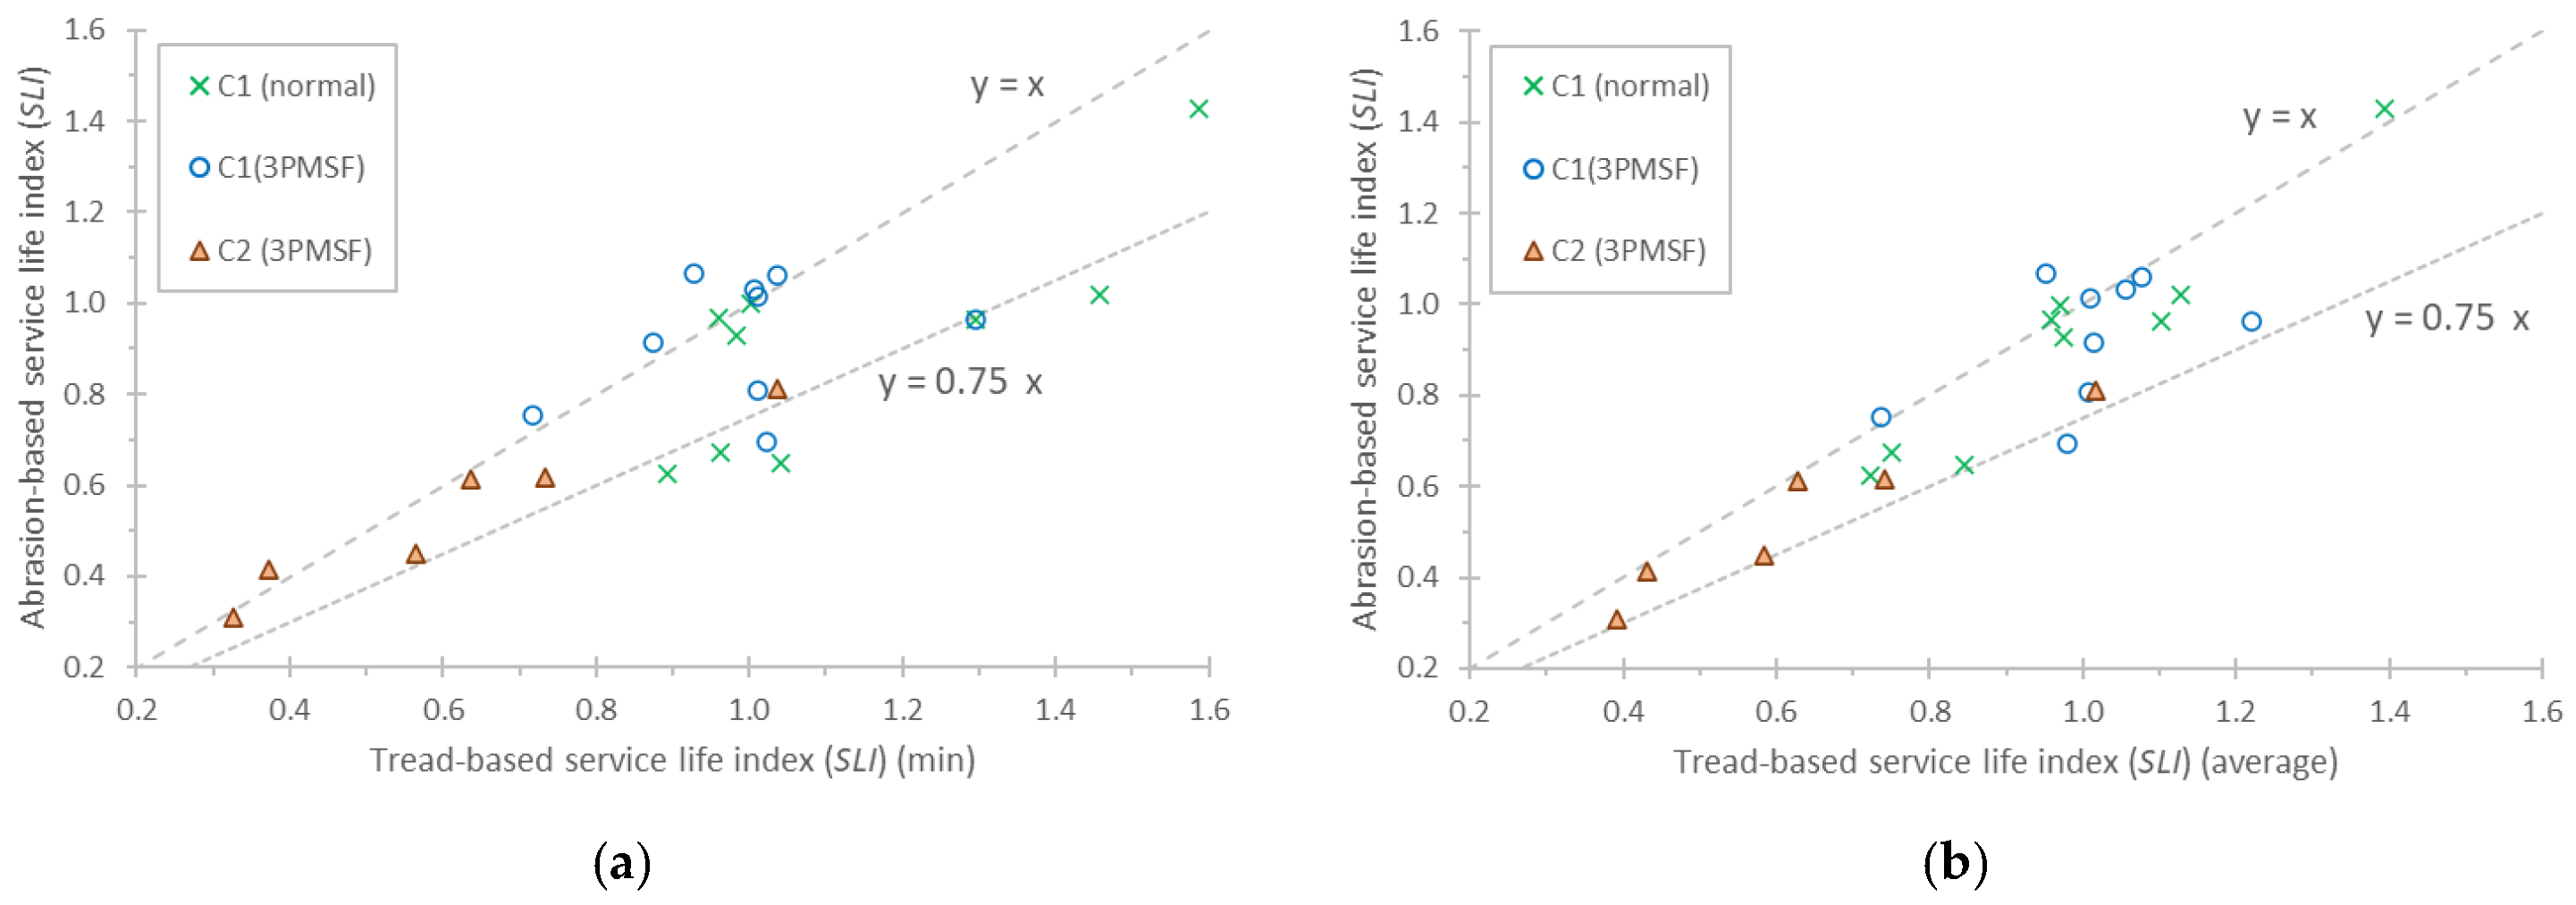
Figure 9a compares the measured SLI based on tread depth reduction (Equation (5)) with the theoretical SLI calculated from abrasion rate, initial tread depth and tyre design parameters (i.e., tread density, void surface, wheel diameter, contact width) (Equation (13)). The detailed values are given in the Appendix A, Table A1. For 3PMSF winter C1 and C2 tyres, the agreement is generally good, whereas larger discrepancies are observed for normal (summer) tyres. Several factors may contribute to these differences, including uncertainties in the estimation of void ratio and contact width, measurement uncertainty in tread depth and mass loss, and the stronger temperature dependence of the reference tyre in summer conditions. In addition, summer tyres often have more pronounced differences in tread depth between shoulders and central ribs, which makes it more difficult to define a single representative initial tread depth.
Figure 9.
Correlation of theoretical (Equation (13)) and measured (Equation (5)) service life index using (a) minimum SL from the main grooves; (b) average SL from the main groove. C1 tyres (normal and 3PMSF) are from our previous study [39].
Figure 9b gives the same comparison but using the average SL from each groove (instead of the minimum) for the calculation of the experimental SLI. Although the results for the winter C1 and C2 tyres did not change much, there is a considerable improvement for the summer C1 tyres using the average SL value from the main grooves. This indicates that the average value gives a better estimate of the lost mass, as expected, while taking the minimum value represents the worst case, which would mean that when one groove has reached the minimum depth, the tyre has to be replaced.
4. Discussion
The main objective of this study was to assess the applicability of the C1 passenger car tyre methodology for C2 van tyres. Identical protocols minimise testing effort and aid comparability of the results. For this reason, the test circuit, driving style, ambient temperature ranges, tyre loading, and reference tyre were the same as in the C1 tyre methodology. While the driving dynamics were not an issue and the vans of our study could easily follow the routes, four points need further discussion: (i) the load distribution was not 56%/44%, but 50%/50%; (ii) the vehicle alignment settings (toe and camber) were not fully compliant; (iii) the tyre inflation pressure had to increase; (iv) the wear had not stabilised after 8000 km for all tyres.
The loading adjustment is not a big issue, as it is still within the allowed range (±7% from target values). We had similar difficulty with SUV C1 tyres where we had to apply a 50%/50% distribution. Furthermore, the regulation defines a 50%/50% load distribution for rear-wheel-drive vehicles. Thus, we consider this issue of secondary importance. Nevertheless, dedicated tests should confirm that the impact on the results remains small.
Regarding the vehicle alignment of the vans, there was not much flexibility. In most cases the settings were within the regulation requirements for C1 tyres. Many studies have demonstrated the impact of misalignment [43,44,45]. Recently, dedicated tests with five tyres fitted on two vehicles with difference 0.69° for the total rear toe found up to 20% differences on the emissions [46]. Thus, the values should be re-examined for vehicles fitted with C2 tyres.
The third point is the higher inflation pressure. The impact of inflation pressure on the results also needs to be considered. Recent studies showed higher wear with higher pressure [27,47]. An ETRTO study with C1 tyres demonstrated that increasing the pressure from 2.5 bar to 2.9 bar resulted in approximately 10% higher wear, even when normalising to the vehicle weight [48]. If these results can be extrapolated to C2 tyres, it would mean that the ALI of convoy 1 would be lower if the tyre pressure is set to 3.8 bar (as with convoy 2), instead of 4.75 bar (see Table 1). It also means that the abrasion levels of C2 tyres might be higher than those of C1 tyres due to the higher pressure.
The fourth point is the total driven distance. In our previous study, most (14 of 15) C1 tyres had stabilised after 4000–8000 km. On the contrary, only half of the six tested C2 tyres had stabilised after 8000 km. This means that either a longer distance is needed for C2 tyres, or an additional uncertainty must be accounted for. For example, for the most extreme case (1c), the ALI was 2.12 at 8000 km and 1.85 at 10,000 km. For the other two cases, the estimated difference (extrapolated mass loss, as there was no measurement at 10,000 km) was very small (2c: 2.92 vs. 2.89), or even in the opposite direction (2b: 1.47 vs. 1.58). Considering also that the ‘ranking’ of the tyres was the same at 8000 and 10,000 km, keeping the same distance of 8000 km seems acceptable. Similar conclusions can be drawn for the tread depth reduction and the service life index.
Regarding the abrasion rates of the 3PMSF C2 tyres of our study, they ranged from 150 to 325 mg/km, with an average around 250 mg/km at the vehicle level. These values are well aligned with the limited literature on the topic: A study in South Korea reported an average value of 224 mg/km for six tyres [35]. An old Russian study from 2013 reported 43–62 mg/km/tyre, which would translate to 128–185 mg/km or 171–247 mg/km (multiplying by 3 or 4 to convert it to vehicle level) [34].
Interestingly, the mean ALI, which normalises the emissions to the vehicle weight, was 1.8 (range 1.26–2.66) for the C2 tyres, much higher than the mean ALI of C1 tyres: 1.1 (range 0.68–1.52). These differences could be due to the specific tyres selected in our study (e.g., they were mainly on the lower price end), or due to the higher inflation pressures (discussed previously), and more testing is necessary before drawing conclusions for the whole C2 tyre market. For example, a study by the European Tyre & Rim Technical Organisation (ETRTO) investigating appropriate protocols for C2 tyres had a sample of nine 3PMSF tyres with ALI ranging from approximately 1.0 to 1.6 with an average around 1.25 [37]. Furthermore, their study showed that the ALI of 3PMSF tyres might be higher at higher ambient temperatures. These findings (sample selection, testing conditions) indicate that the market difference between ALI of C2 and C1 tyres will be smaller than what we found. Nevertheless, our findings support its use for comparison of tyres with different load ratings, constructions, and intended use cases. The absolute abrasion rates, although more suitable from an environmental perspective as they are the actual tyre wear in the environment, makes comparisons of tyres for small passenger cars and loaded vans difficult.
One final point that needs to be addressed is the measurement uncertainty. The tyre mass is measured with good accuracy (±2 g), which translates to 0.4–1.3% uncertainty for the rear C2 tyres and 0.2–0.5% for the front C2 tyres. The reference tyres, due to the low mass loss, have uncertainty of 1% (front) to 2–3% (rear tyres). The vehicle mass is measured with accuracy better than 0.5%. However, there are other sources that need to be considered. As was previously discussed, the load distribution, the inflation pressure, and the vehicle alignment might also play a role. The ambient temperature can have an impact due to the different properties of candidate and reference tyres, as high as 0.3 units [37], which would translate to a 10–20% uncertainty for the abrasion level indices of our study. Regarding the tread depth measurements, the accuracy of the tread depth gauge is better than 0.1 mm; thus, the differences in tread depth measurements should have an uncertainty of 0.14 mm. This translates to an uncertainty of 10% (front) to 25% (rear) for reference tyres, but only 3–10% (front) to 6–20% (rear) for candidate tyres.
The second main objective of this study was to develop an analytical framework to link measured abrasion and tyre characteristics to tyre service life. With such an approach, the time-consuming measurement of tread depth can be avoided. The theoretical analysis showed that it is possible, and that the service life could be predicted by the measured abrasion and the tyre characteristics (such as initial tread depth), thus without the need for measurements. The agreement of the two approaches was good, but not perfect (the abrasion-based approach was 0–25% lower than the tread-based approach). The tread-based approach has uncertainty due to the tread depth measurements discussed above and the assumption of the final tread depth of 1.6 mm (see Appendix A, Table A2 and Table A3). The abrasion approach has uncertainties due to the assumed void ratios and contact widths and the assumption that tread and mass loss develop similarly. While the tread depth approach is straightforward (it extrapolates to the minimum tread depth), the abrasion-based approach seems more robust (less uncertainty) because it is based on mass (abrasion) measurement and tyre characteristics. In the USA, the tread depth-based service life approach is followed, while the abrasion-based approach is something that could be considered in Europe.
5. Conclusions
In this study, the wear of six winter C2-class tyres fitted to vans was investigated using a convoy-based road test that closely follows the procedure underpinning the forthcoming Euro 7 tyre abrasion limits for C1 tyres. The C2 campaign was conducted with the same reference tyre, test route and instrumentation as a previous C1 campaign [39] but with different candidate tyres, which allows a qualitative comparison of abrasion levels and service life indicators between passenger car and van tyres. In addition to the experimental work, a simple analytical framework was developed to relate abrasion rate and tread depth measurements to an index of tyre service life.
The testing campaign was conducted without any issues (e.g., out-of-specification driving dynamics), confirming that the C1 protocol is also suitable for C2 tyres. However, we identified four methodological parameters that require refinement: (i) adopting a load distribution of 50%/50% rather than the 56%/44% standard used for passenger cars; (ii) re-examining vehicle alignment settings (toe, camber) specifically for vehicles fitted with C2 tyres; (iii) clearly defining the required tyre inflation pressure; (iv) reconsidering the total test distance, as 8000 km may not be sufficient for the wear of some C2 tyres to fully stabilise.
For the specific tyres tested in this study, the abrasion level (mg/km/t) and abrasion level index (ALI) of C2 tyres were systematically higher than those of the C1 tyres tested previously. The average ALI of the six C2 tyres was 1.8 (range 1.26–2.66), compared to the approximately 60% higher average ALI of 1.1 (range 0.68–1.52) for C1 tyres. We attribute this difference to the specific sample size, the relatively high ambient temperature during testing and higher inflation pressure. Without normalising to the vehicle weight, we estimated an average C2 abrasion rate of 250 mg/km at the vehicle level. However, further testing is necessary to conclude whether this trend is representative for the whole C2 market.
The mass loss trend of the C2 tyres was similar to C1 tyres. Front-tyre mass loss was highest in the initial interval and decreased with accumulated mileage. For some tyres, the wear did not stabilise even after 8000 km; however, the ranking of the tyres did not change. For the rear tyres, the wear was approximately half and relatively stable throughout the driven distance. Due to the higher wear, the estimated service life was approximately 60% of that estimated for passenger car tyres. At the same time, the limited number of tyres studied here means that further experimental work with a broader range of designs and brands is necessary to derive representative market values.
Service life and abrasion rate were inversely correlated: tyres with higher abrasion rates exhibited shorter expected mileage to the legal minimum tread depth. The theoretical service life index (SLI) derived from abrasion rate and tread depth parameters agreed reasonably well with the SLI obtained from direct groove measurements, although discrepancies of up to 25% were observed for some tyres, particularly normal (summer) tyres. Overall, the results suggest that the proposed indices provide a useful basis for characterising C2 tyres in a regulatory context and for linking abrasion limits to real-world tyre durability, while also highlighting the need for refinements to improve the robustness of the method for different tyre types and operating conditions.
Author Contributions
Conceptualization, B.G. and T.G.; formal analysis, B.G.; writing—original draft preparation, B.G.; writing—review and editing, C.F., T.G., and V.F. All authors have read and agreed to the published version of the manuscript.
Funding
This research received no external funding.
Institutional Review Board Statement
Not applicable.
Informed Consent Statement
Not applicable.
Data Availability Statement
The original contributions presented in this study are included in the article. Further enquiries can be directed to the corresponding author.
Conflicts of Interest
The authors declare no conflicts of interest. B.G. and V.F. are members of the UNECE Task Force on Tyre Abrasion (B.G. representing the European Commission, V.F. as co-chair).
Abbreviations
The following abbreviations are used in this manuscript:
| 3PMSF | Three-Peak Mountain Snowflake (tyre marking symbol) |
| ADAC | General German Automobile Club (Allgemeiner Deutscher Automobil-Club) |
| AL | Abrasion Level |
| ALI | Abrasion Level Index |
| AR | Abrasion Rate |
| ARI | Abrasion Rate Index |
| EC | European Commission |
| ETRTO | European Tyre & Rim Technical Organisation |
| EU | European Union |
| GRBP | Working Group on Noise and Tyres |
| M + S | Mud and Snow |
| PM | Particulate Matter |
| SUV | Sport Utility Vehicle |
| TF TA | UNECE Task Force on Tyre Abrasion |
| SL | Service Life |
| SLI | Service Life Index |
| SRTT | Standard Reference Test Tyre |
| TWI | Tread Wear Indicator |
| UN | United Nations |
| UNECE | United Nations Economic Commission for Europe |
| WP.29 | World Forum for Harmonization of Vehicle Regulations |
Appendix A
Figure A1 and Figure A2 present the footprints of the tested tyres (loaded van at 67% of the tyre load capacity). The tyres in alphabetical order were: Falken Eurowinter van01, Goodride SW612, Goodyear Vector 4 seasons cargo, Minerva Frostrack van, and Tomket Snowroad van. The front of the van was facing the left side, and the outer side of the tyre is in the lower part of the photo. The tread depth measurements were taken at the grooves where the black crosses are. Some measurements were also taken on the tread wear indicators (black areas) in order to compare the impact on the service life estimation. Four measurements at the tyre periphery spaced by 90 degrees were taken.
Figure A1.
Footprints of convoy 1: (a) tyre 1a; (b) tyre 1b; (c) tyre 1c.
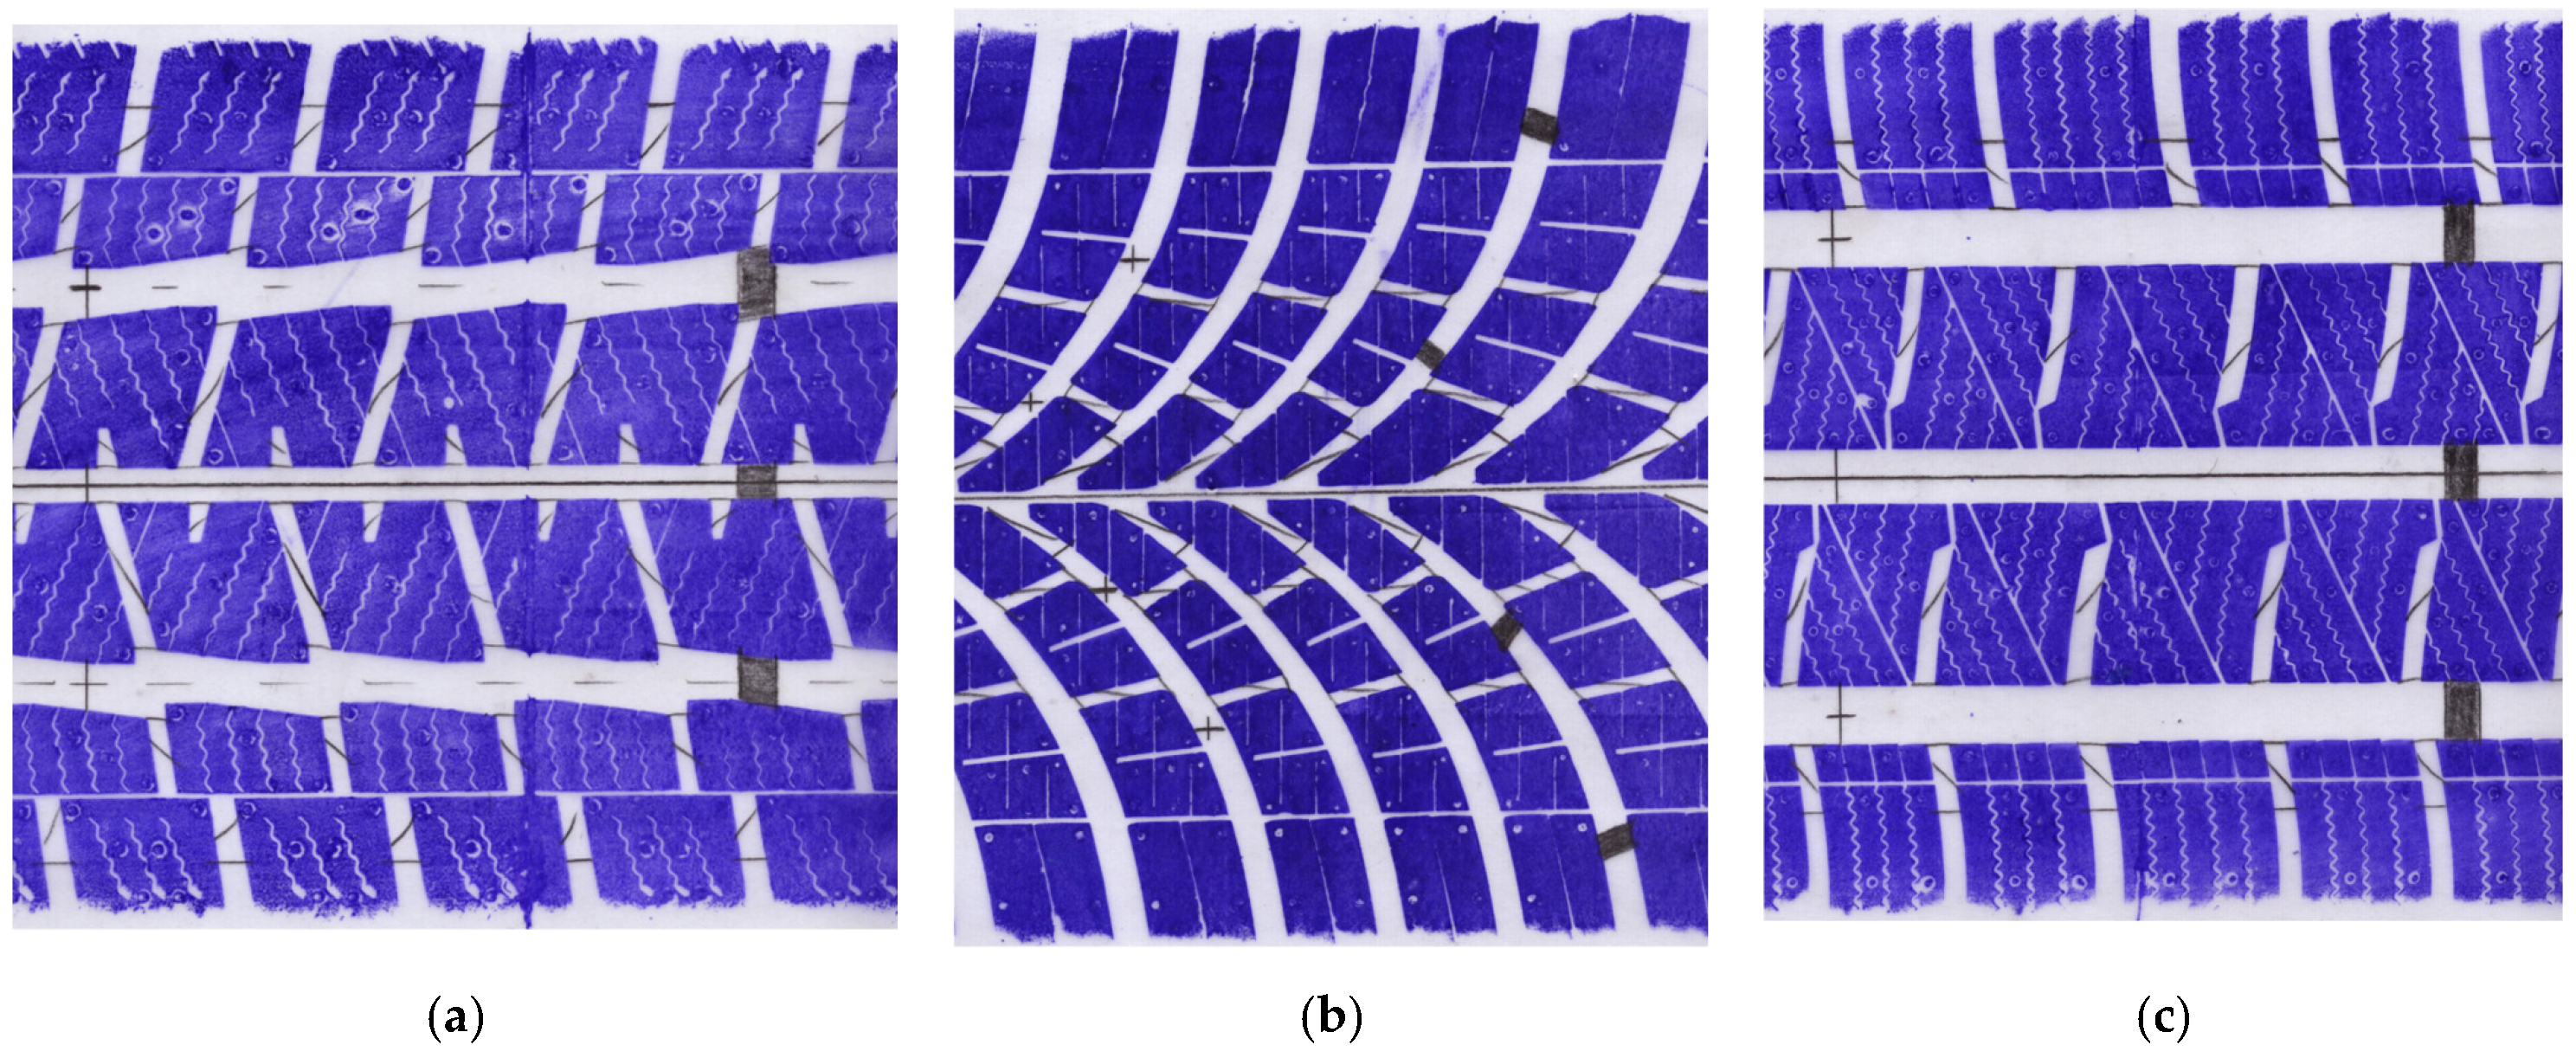
Figure A2.
Footprints of convoy 2: (a) tyre 2a; (b) tyre 2b; (c) tyre 2c.
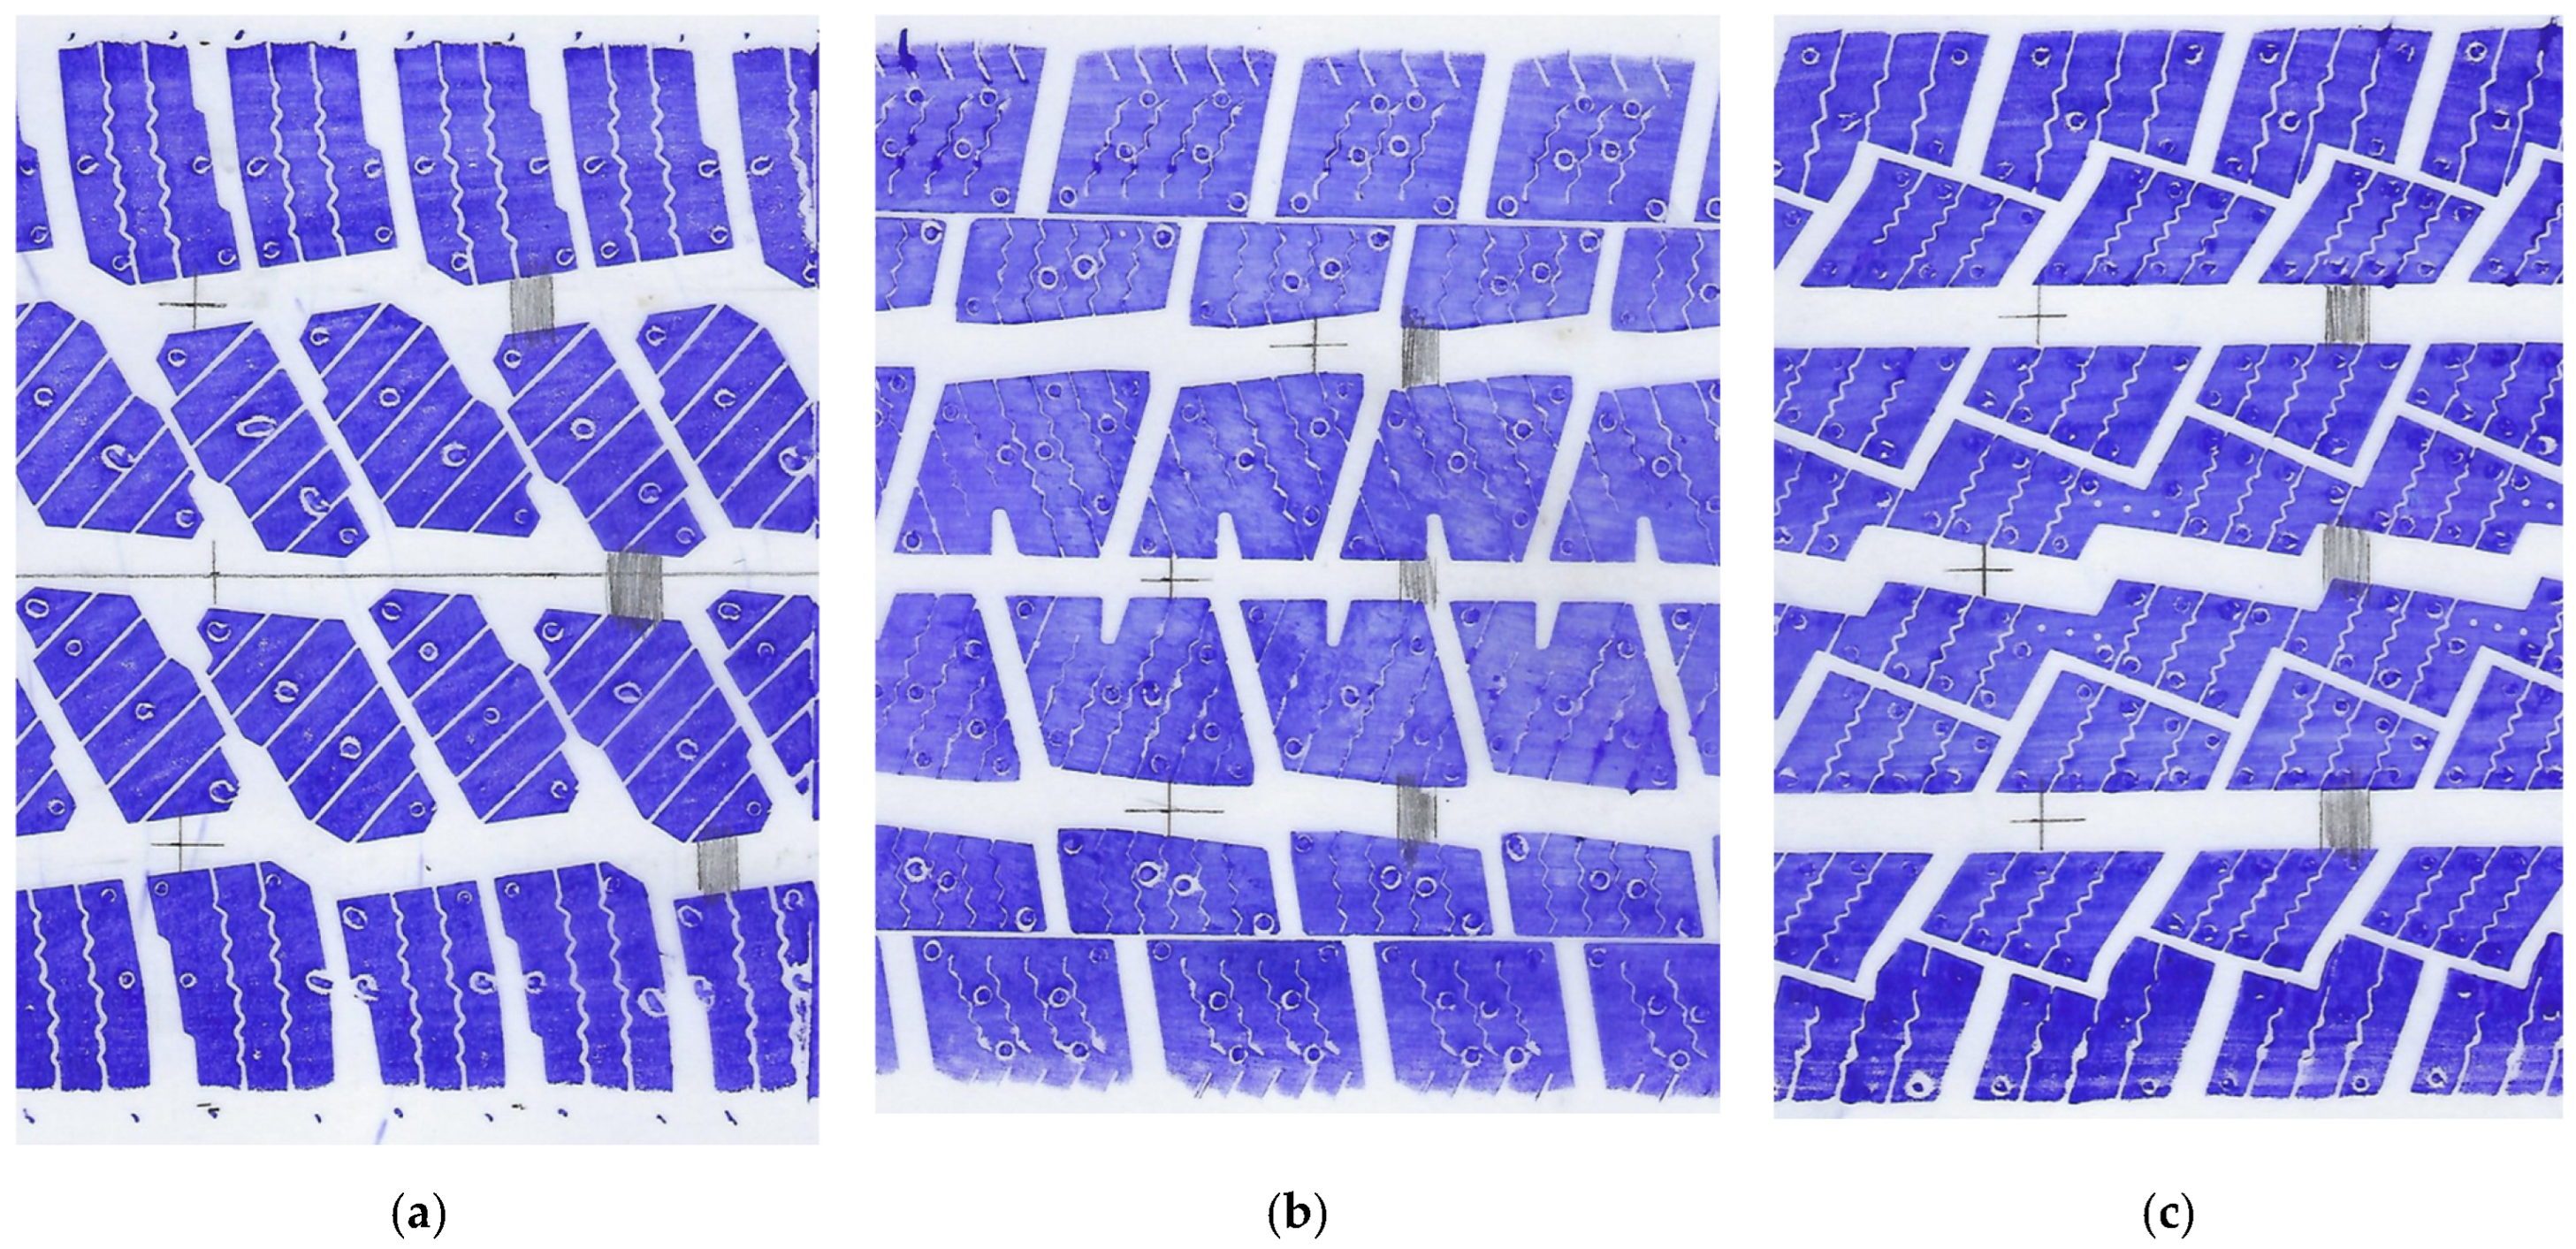
Table A1.
Tyre parameters for service life index estimation. A density of 1.15 g/cm3 was assumed. C = contact width; Ts = initial tread depth; v = void area ratio.
Figure A3 shows the groove depth of the new tyres and the height of the tread wear indicator (TWI), calculated as the difference between tread depth measurements at the grooves and on the TWI. The initial tread was 8.0 to 9.4 mm, while the TWI was 1.6 to 1.8 mm. Table A2 gives, in more detail, the calculated TWI height (difference in the tread depth measurement at the grooves or on the TWI) and the variation in the values (on the order of 0.1 mm), which was calculated from the average of three grooves at four positions around the tyre (separated by 90 degrees).
Figure A3.
Start tread depth and estimated tread wear indicator height.
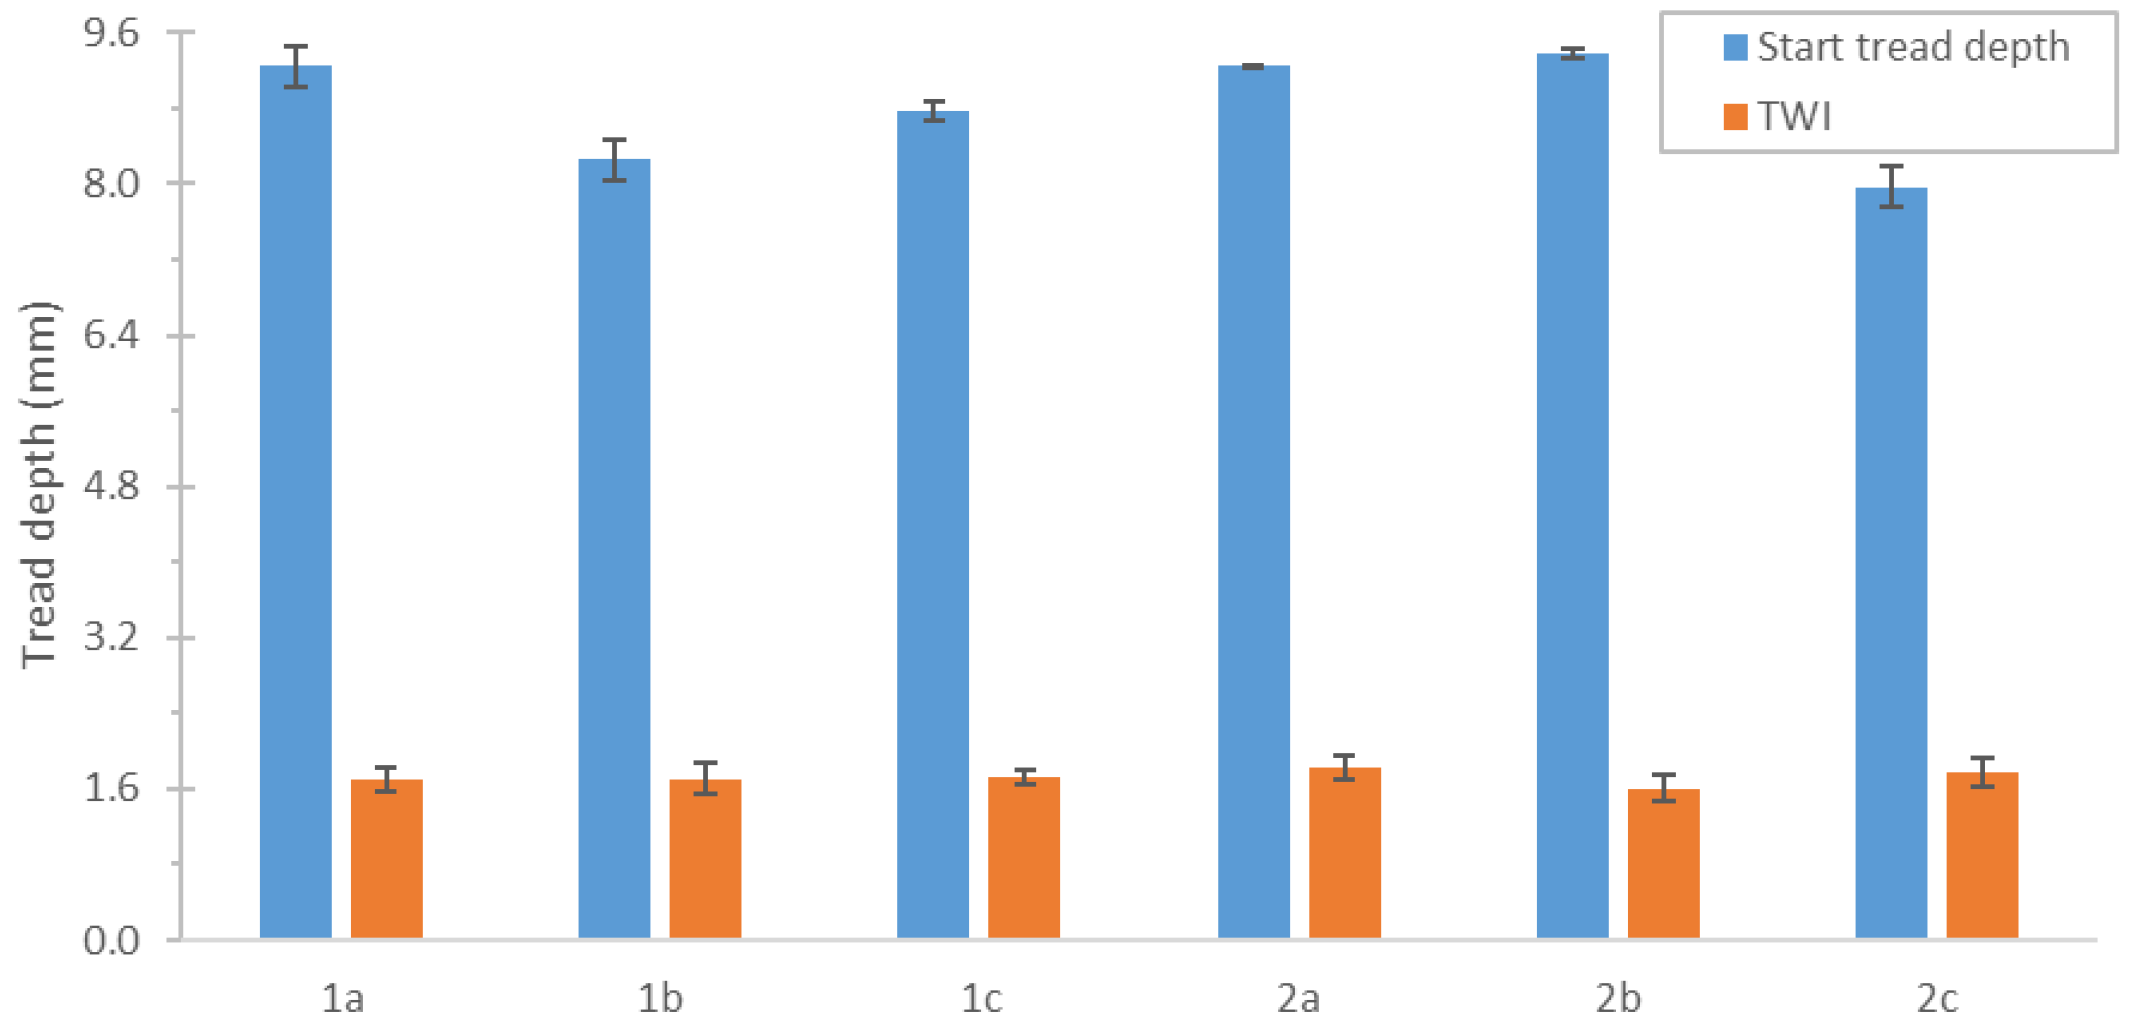
Table A2.
Calculated TWI height of the tested C2 tyres.
The service life indices (Equations (5) and (6)) estimated by the groove measurements and assuming a 1.6 mm remaining tread depth, or by the groove measurements on the TWI and assuming 0 mm tread depth remaining, were within ±4% for the three tyres of convoy 2 (Table A3).
Table A3.
Differences in the service life index measured at the groove (assuming the reference value) or on the TWI.
References
- Gaylarde, C.C.; Baptista Neto, J.A.; Da Fonseca, E.M. Atmospheric Microplastics: Inputs and Outputs. Micro 2025, 5, 27. [Google Scholar] [CrossRef] [Scilit]
- Enyoh, C.E.; Devi, A.; Maduka, T.O.; Tyagi, L.; Rana, S.; Akuwudike, I.S.; Wang, Q. A Review of Materials for the Removal of Micro- and Nanoplastics from Different Environments. Micro 2025, 5, 17. [Google Scholar] [CrossRef] [Scilit]
- Meegoda, J.N.; Hettiarachchi, M.C. A Path to a Reduction in Micro and Nanoplastics Pollution. Int. J. Environ. Res. Public Health 2023, 20, 5555. [Google Scholar] [CrossRef] [Scilit]
- Munhoz, D.R.; Harkes, P.; Beriot, N.; Larreta, J.; Basurko, O.C. Microplastics: A Review of Policies and Responses. Microplastics 2022, 2, 1–26. [Google Scholar] [CrossRef] [Scilit]
- Przekop, R.E.; Sztorch, B.; Pakuła, D.; Romańczuk-Ruszuk, E.; Konieczna, R.; Frydrych, M. Micro- and Nano-Pollutants from Tires and Car Brakes Generated in the Winter Season in the Poznan City Urban Environment. Appl. Sci. 2024, 14, 4235. [Google Scholar] [CrossRef] [Scilit]
- Worek, J.; Badura, X.; Białas, A.; Chwiej, J.; Kawoń, K.; Styszko, K. Pollution from Transport: Detection of Tyre Particles in Environmental Samples. Energies 2022, 15, 2816. [Google Scholar] [CrossRef] [Scilit]
- Mierzyńska, K.; Pol, W.; Martyniuk, M.; Zieliński, P. Traffic Intensity as a Factor Influencing Microplastic and Tire Wear Particle Pollution in Snow Accumulated on Urban Roads. Water 2024, 16, 2907. [Google Scholar] [CrossRef] [Scilit]
- Rai, M.; Pant, G.; Pant, K.; Aloo, B.N.; Kumar, G.; Singh, H.B.; Tripathi, V. Microplastic Pollution in Terrestrial Ecosystems and Its Interaction with Other Soil Pollutants: A Potential Threat to Soil Ecosystem Sustainability. Resources 2023, 12, 67. [Google Scholar] [CrossRef] [Scilit]
- Kole, P.J.; Löhr, A.J.; Van Belleghem, F.; Ragas, A. Wear and Tear of Tyres: A Stealthy Source of Microplastics in the Environment. Int. J. Environ. Res. Public Health 2017, 14, 1265. [Google Scholar] [CrossRef] [Scilit]
- Giechaskiel, B.; Grigoratos, T.; Mathissen, M.; Quik, J.; Tromp, P.; Gustafsson, M.; Franco, V.; Dilara, P. Contribution of Road Vehicle Tyre Wear to Microplastics and Ambient Air Pollution. Sustainability 2024, 16, 522. [Google Scholar] [CrossRef] [Scilit]
- Venghaus, D.; Neupert, J.W.; Barjenbruch, M. Tire Wear Monitoring Approach for Hotspot Identification in Road Deposited Sediments from a Metropolitan City in Germany. Sustainability 2023, 15, 12029. [Google Scholar] [CrossRef] [Scilit]
- Kang, T.; Kim, H. An Experimental Study on the Component Analysis and Variation in Concentration of Tire and Road Wear Particles Collected from the Roadside. Sustainability 2023, 15, 12815. [Google Scholar] [CrossRef] [Scilit]
- Zhong, C.; Sun, J.; Zhang, J.; Liu, Z.; Fang, T.; Liang, X.; Yin, J.; Peng, J.; Wu, L.; Zhang, Q.; et al. Characteristics of Vehicle Tire and Road Wear Particles’ Size Distribution and Influencing Factors Examined via Laboratory Test. Atmosphere 2024, 15, 423. [Google Scholar] [CrossRef] [Scilit]
- Kochanek, A.; Grąz, K.; Potok, H.; Gronba-Chyła, A.; Kwaśny, J.; Wiewiórska, I.; Ciuła, J.; Basta, E.; Łapiński, J. Micro- and Nanoplastics in the Environment: Current State of Research, Sources of Origin, Health Risks, and Regulations—A Comprehensive Review. Toxics 2025, 13, 564. [Google Scholar] [CrossRef] [Scilit]
- Christou, A.; Giechaskiel, B.; Olofsson, U.; Grigoratos, T. Review of Health Effects of Automotive Brake and Tyre Wear Particles. Toxics 2025, 13, 301. [Google Scholar] [CrossRef] [Scilit]
- Mun, S.; Chong, H.; Lee, J.; Lim, Y. Characteristics of Real-World Non-Exhaust Particulates from Vehicles. Energies 2022, 16, 177. [Google Scholar] [CrossRef] [Scilit]
- Kupper, M.; Schubert, L.; Nachtnebel, M.; Schröttner, H.; Huber, M.P.; Fischer, P.; Bergmann, A. Measurement and Analysis of Brake and Tyre Particle Emissions from Automotive Series Components for High-Load Driving Tests on a Wheel and Suspension Test Bed. Atmosphere 2024, 15, 430. [Google Scholar] [CrossRef] [Scilit]
- Jandacka, D.; Brna, M.; Durcanska, D.; Kovac, M. Characterization of Road Dust, PMx and Aerosol in a Shopping–Recreational Urban Area: Physicochemical Properties, Concentration, Distribution and Sources Estimation. Sustainability 2023, 15, 12674. [Google Scholar] [CrossRef] [Scilit]
- Hesse, D.; Feißel, T.; Kunze, M.; Bachmann, E.; Bachmann, T.; Gramstat, S. Comparison of Methods for Sampling Particulate Emissions from Tires under Different Test Environments. Atmosphere 2022, 13, 1262. [Google Scholar] [CrossRef] [Scilit]
- Kunze, M.; Feißel, T.; Ivanov, V.; Bachmann, T.; Hesse, D.; Gramstat, S. Analysis of TRWP Particle Distribution in Urban and Suburban Landscapes, Connecting Real Road Measurements with Particle Distribution Simulation. Atmosphere 2022, 13, 1204. [Google Scholar] [CrossRef] [Scilit]
- Lehne, G.; Brandt, S.; Schiefer, F.; Oelze, B.; Aschenbrenner, N.; Hothan, M.; Ostermeyer, G.-P.; Schilde, C. Time-Resolved On-Board Measurements of TRWP Using Distributed Particle Sensor Systems. Atmosphere 2025, 16, 1059. [Google Scholar] [CrossRef] [Scilit]
- Giechaskiel, B.; Grigoratos, T.; Dilara, P.; Franco, V. Environmental and Health Benefits of Reducing Tyre Wear Emissions in Preparation for the New Euro 7 Standard. Sustainability 2024, 16, 10919. [Google Scholar] [CrossRef] [Scilit]
- Giechaskiel, B.; Grigoratos, T.; Li, L.; Zang, S.; Lu, B.; Lopez, D.; García, J.J. Tyre Wear under Urban, Rural, and Motorway Driving Conditions at Two Locations in Spain and China. Lubricants 2024, 12, 338. [Google Scholar] [CrossRef] [Scilit]
- Li, J.; Zhang, M.; Ge, Y.; Wen, Y.; Luo, J.; Yin, D.; Wang, C.; Wang, C. Emission Characteristics of Tyre Wear Particles from Light-Duty Vehicles. Atmosphere 2023, 14, 724. [Google Scholar] [CrossRef] [Scilit]
- Lee, J.; Kwon, O.; Hwang, Y.; Yeon, G. Laboratory Evaluation of Wear Particle Emissions and Suspended Dust in Tire–Asphalt Concrete Pavement Friction. Appl. Sci. 2024, 14, 6362. [Google Scholar] [CrossRef] [Scilit]
- Schläfle, S.; Unrau, H.-J.; Gauterin, F. Influence of Load Condition, Tire Type, and Ambient Temperature on the Emission of Tire–Road Particulate Matter. Atmosphere 2023, 14, 1095. [Google Scholar] [CrossRef] [Scilit]
- Schläfle, S.; Zhang, M.; Unrau, H.-J.; Gauterin, F. Influence of Vertical Load, Inflation Pressure, and Driving Speed on the Emission of Tire–Road Particulate Matter and Its Size Distribution. Atmosphere 2024, 15, 502. [Google Scholar] [CrossRef] [Scilit]
- Wahlström, J.; Lyu, Y.; Lundberg, J.; Pagels, J.; Hjelm, R. Advancing Tyre and Road Wear Particle Measurements: Balancing Laboratory Conditions and Real-World Relevance. Atmosphere 2025, 16, 588. [Google Scholar] [CrossRef] [Scilit]
- European Commission Regulation (EU). 2024/1257 of the European Parliament and of the Council on Type-Approval of Motor Vehicles and Engines and of Systems, Components and Separate Technical Units Intended for Such Vehicles, with Respect to Their Emissions and Battery Durability (Euro 7), Amending Regulation (EU) 2018/858 of the European Parliament and of the Council and Repealing Regulations (EC) No 715/2007 and (EC) No 595/2009 of the European Parliament and of the Council, Commission Regulation (EU) No 582/2011, Commission Regulation (EU) 2017/1151, Commission Regulation (EU) 2017/2400 and Commission Implementing Regulation (EU) 2022/1362. Off. J. Eur. Comm. 2024, L, 1–49. [Google Scholar]
- TFTA. Proposal for Amendments to the Working Document ECE/TRANS/WP.29/GRBP/2024/10 (UN Regulation 117). Document GRBP-79-12-Rev.2. Presented at the 79th GRBP Session. 2024. Available online: https://unece.org/sites/default/files/2024-02/GRBP-79-12-Rev.2.pdf (accessed on 18 December 2025).
- TFTA Proposal for a New UN Regulation on the Uniform Provisions Concerning the Approval of Tyres with Regard to Abrasion Performance. Document ECE-TRANS-WP29-GRBP-2025-27e. 2025. Available online: https://Unece.Org/Transport/Documents/2025/06/Working-Documents/Tf-Ta-Proposal-New-Un-Regulation-Uniform-Provisions (accessed on 18 December 2025).
- Chen, C.-Y.; Lu, T.-H.; Wang, W.-M.; Liao, C.-M. Assessing Regional Emissions of Vehicle-Based Tire Wear Particle from Macro-to Micro/Nano-Scales with Pandemic Lockdowns and Electromobility Scenarios Implications. Chemosphere 2023, 311, 137209. [Google Scholar] [CrossRef] [Scilit]
- Schubert, L.; Arias Torres, M.A.; Bigl, S.; Steiner, G.; Huber, M.; Lex, C. Challenges in Quantifying Tire Wear Particle Emissions on an Outer Drum Test Bed; SAE International: Warrendale, PA, USA, 2025. [Google Scholar]
- Russian Federation Particulate Matter Emissions by Tyres. Informal Document GRPE-65-20. 2013. Available online: https://unece.org/DAM/trans/doc/2013/wp29grpe/GRPE-65-20e.pdf (accessed on 18 December 2025).
- Lee, H.; Ju, M.; Kim, Y. Estimation of Emission of Tire Wear Particles (TWPs) in Korea. Waste Manag. 2020, 108, 154–159. [Google Scholar] [CrossRef] [Scilit] [PubMed]
- Polukarova, M.; Hjort, M.; Gustafsson, M. Comprehensive Approach to National Tire Wear Emissions: Challenges and Implications. Sci. Total Environ. 2024, 924, 171391. [Google Scholar] [CrossRef] [Scilit] [PubMed]
- C2 Tyre Abrasion Rate Index Vehicle Method Overview and Status. Presented at the 38th TF TA Meeting. 2025. Available online: https://wiki.unece.org/spaces/trans/pages/335740999/TF+TA+session+38 (accessed on 18 December 2025).
- European Commission Regulation (EU). 2020/740 of the European Parliament and of the Council of 25 May 2020 on the Labelling of Tyres with Respect to Fuel Efficiency and Other Parameters, Amending Regulation (EU) 2017/1369 and Repealing Regulation (EC) No 1222/2009. Off. J. Eur. Comm. 2020, L177, 1–31. [Google Scholar]
- Giechaskiel, B.; Ferrarese, C.; Grigoratos, T.; Franco, V. Wear of Passenger Car C1 Tyres Under Regulatory On-Road Testing Conditions. Vehicles 2025, 7, 91. [Google Scholar] [CrossRef] [Scilit]
- Council Council Directive 89/459/EEC of 18 July 1989 on the Approximation of the Laws of the Member States Relating to the Tread Depth of Tyres of Certain Categories of Motor Vehicles and Their Trailers. Off. J. Eur. Comm. 1989, L226, 4.
- Giechaskiel, B.; Ferrarese, C.; Grigoratos, T. Tire Wear, Tread Depth Reduction, and Service Life. Vehicles 2025, 7, 29. [Google Scholar] [CrossRef] [Scilit]
- Silvestro, D. ADAC Tyre Test. Tyre Abrasion vs. Safety Performance. Presented at the Task Force on Tyre Abrasion. Document: TA-13-02 Study_ADAC_tyre_abrasion_safety. 2023. Available online: https://wiki.unece.org/spaces/trans/pages/198674102/TF+TA+session+13 (accessed on 18 December 2025).
- Zhang, S.; Liu, Y.; Zhou, H.; Zhang, W.; Chen, Y.; Zhu, H. Analysis of the Effect of Wear on Tire Cornering Characteristics Based on Grounding Characteristics. World Electr. Veh. J. 2023, 14, 166. [Google Scholar] [CrossRef] [Scilit]
- Schütte, J.; Sextro, W. Tire Wear Reduction Based on an Extended Multibody Rear Axle Model. Vehicles 2021, 3, 233–256. [Google Scholar] [CrossRef] [Scilit]
- Maître, O.L.; Süssner, M.; Zarak, C. Evaluation of Tire Wear Performance; SAE International: Warrendale, PA, USA, 2020; p. 980256. [Google Scholar]
- Oelze, B.; Biesse, F. ETRTO Abrasion testing with vehicle method—Validation results. In 15th International Munich Chassis Symposium 2024; Pfeffer, P.E., Ed.; Springer: Berlin/Heidelberg, Germany, 2025; pp. 9–19. ISBN 978-3-662-71061-6. [Google Scholar]
- Du, X.; Li, H.; Xu, M.; Ge, Y. Research on Ground Contact Characteristics and Influencing Factors of Tires with Complex Tread Patterns Based on Inverse Modeling. Lubricants 2025, 13, 261. [Google Scholar] [CrossRef] [Scilit]
- ETRTO XL Tyres Allowance. TA-37-8 Presented at the 37th TFTA Meeting. 2025. Available online: https://wiki.unece.org/spaces/trans/pages/316768350/TF+TA+session+37 (accessed on 18 December 2025).

Disclaimer/Publisher’s Note: The statements, opinions and data contained in all publications are solely those of the individual author(s) and contributor(s) and not of MDPI and/or the editor(s). MDPI and/or the editor(s) disclaim responsibility for any injury to people or property resulting from any ideas, methods, instructions or products referred to in the content. |
© 2026 by the authors. Licensee MDPI, Basel, Switzerland. This article is an open access article distributed under the terms and conditions of the Creative Commons Attribution (CC BY) license.