


Abstract
Cellulose nanofibers (CNFs) are typically supplied as a 3 wt.% suspension and this leads to higher costs because of the economics associated with shipping a product that is 97% water. Filter pressing is the common approach to reduce shipping cost as water removal leads to approximately 20 wt.% CNF suspensions. In this manuscript, we describe a method to achieve an approximately 35 wt.% CNF suspension by contact dewatering with a dissolvable particle. In this work, contact dewatering was performed using slightly anionic precipitated calcium carbonate (PCC), anionic ground calcium carbonate (GCC), and cationic GCC. After dewatering, calcium carbonate is removed from the CNF suspension by washing with acidic water, and thus a pure CNF suspension is regenerated. Fiber size analysis and scanning electron microscopy imaging showed that the regenerated CNF suspensions had the same properties as the original supplied suspensions.
1. Introduction
Cellulose nanofibers (CNFs) are high-aspect-ratio fibers with diameters of 5 to 100 nm and lengths up to a few microns. CNFs are manufactured by mechanical fibrillation which results in a distribution of fibers in aqueous suspension with various lengths and widths. They are composed of cellulose, a linear chain polymer consisting of repeating anhydro glucose units (AGUs) [1]. Each AGU contains three hydroxyl groups that form intrachain hydrogen bonds, stabilizing the AGU linkages and creating a hydrogel structure in aqueous suspensions. The hydrogen bonding network gives cellulose a high mechanical strength and makes it a relatively stable polymer [2]. Within the cellulose network, there are regions where the cellulose chains are highly ordered and have a crystalline structure. The crystalline part of CNFs is reported to have an axial elastic modulus greater than Kevlar [2]. This high tensile strength property makes CNFs a candidate for use in a variety of industries such as electronics, health care, bioplastics, and polymers [3,4,5] and as a reinforcement for biodegradable plastics such as polylactic acid (PLA) [6,7,8]. Furthermore, upon drying, the CNFs aggregate into films and these films have excellent oxygen, oil, and grease barrier properties, which make CNFs desirable for use in packaging materials [9,10]. When dried using a hot press, layers of CNF films have shown mechanical properties with specific strengths of 184–207 MPa and a toughness six times that of polystyrene [11,12]. It is important to develop methods to dewater CNFs for shipping applications, since its use is so widespread.
The hydroxyl groups on the AGUs form hydrogen bonds with water and between fibers producing a hydrogel-like network that retains high amounts of water. As a result, CNFs are usually supplied as a 3 wt.% suspension. Understanding the nature of the water in these suspensions is important in the development of dewatering methods. Differential scanning calorimetry (DSC) measurements of 3 wt.% CNF suspensions have shown a sharp exothermic peak at 255 K and a broader peak at 230–250 K [13]. The peak at 255 K agrees well with the crystallization of water and was assigned to free water and the second peak at 230–250 K to bound freezing water [13]. These two peaks did not account for the total amount of water, and the difference was attributed to non-freezing bound water. Dewatering of a CNF suspension involves removing the free water to obtain a solids content of approximately 30 wt.%, while drying refers to the complete removal of all three types of water until the suspension exhibits <0.1% weight change at room temperature and 20–30% relative humidity for 1 h [14]. For most applications, CNFs are utilized as a dilute aqueous suspension, and thus any dried CNF material that is shipped would require rehydration at the customer site such that the CNFs return to their native state. Thus, the development of a dewatering or drying process that does not alter the CNFs’ morphology or dimensions is needed.
Evaporative drying of CNF suspensions is perhaps the easiest and simplest approach. However, this approach is an energy-intensive process due to the retention of water in the hydrogen-bonded network of fibers [15,16]. This method also leads to irreversible fiber agglomeration due to the capillary forces exerted upon water evaporation [17]. Agglomeration reduces the material properties, such as a lower viscosity at the same CNFs wt.% [18]. The viscosity of a CNF hydrogel is known to be highly dependent on its morphological characteristics, such as the fibers’ structure, length, and aspect ratio [19].
One method that has been used to dry CNFs and maintain their nano-dimensional architecture is freeze-drying. However, this process is costly due to high energy consumption and long freezing times. Freeze-drying can often take several days as the slower the freeze-drying process, the less fiber agglomeration that occurs [20]. Another method to remove water from CNF suspensions is spray drying. The spray drying method atomizes the fibers into a water droplet that evaporates with the addition of hot gas [17]. However, agglomeration of the CNFs occurs as the surface tension of the droplet forces the fibers to fold upon themselves into various rounded, collapsed shapes [21].
The most common non-evaporative method to dewater CNF suspensions for shipping purposes is filter pressing. For example, the Process Development Center (PDC) at the University of Maine uses a plate and frame press to dewater CNF suspensions and achieved a pressed cake with 18 wt.% CNFs [14]. Pressing to dewater CNF suspensions has also been performed for paper- and film-making applications as CNFs are a promising material to strengthen paper and board products [22]. While achieving a higher CNFs wt.% is desirable, it is difficult to achieve with simple filter pressing. Furthermore, it is unknown if filter pressing above 20 wt.% CNFs will lead to irreversible fiber agglomeration.
Other non-evaporative dewatering methods such as ultrasonication [23] and contact dewatering [14,24] have been reported. The use of ultrasound has been demonstrated as a low-cost, non-thermal, and scalable method to dewater CNF suspensions. Vibrating mesh transducers were used as an ultrasonic dewatering platform to continuously remove water from the CNF suspensions. Using this approach, 72% water removal has been achieved [23]. However, this results in a final CNF concentration of about 11 wt.%, less than can be achieved with filter pressing.
Amini et al. first demonstrated the process of contact dewatering by adding wood flour to a CNF suspension [24]. The hydrogel-like structure occurring in a pure CNF suspension is interrupted by the adsorption of the CNFs on the wood flour, releasing the free water in the process. They also showed that contact dewatering works best with high surface area particles as there is more surface for the CNFs to adsorb. We recently extended the concept of the contact dewatering process to dewater CNF suspensions with polylactic acid (PLA) particles [25,26]. In our case, rather than using a filter press to expel the water, we used a solvent exchange with liquid CO2 (L-CO2). The CNFs adsorbed onto the PLA particles and the water was then pushed out from the suspension by the L-CO2. The L-CO2 was then converted to supercritical CO2 (SC-CO2) before venting by raising the temperature above 31.1 °C, resulting in fully dispersed CNFs distributed throughout the PLA matrix. Although PLA and wood flour work well as contacting particles for dewatering CNF suspensions, they would not be suitable for shipping applications as the CNF suspensions would then be contaminated with the PLA or wood flour. Unless the added particle is a desired component in the final formulation, a means to remove the particle from the dewatered CNF suspension would be required.
The work presented in this manuscript describes a proof of concept for a novel contact dewatering method that could be used to dewater CNF suspensions, in which the contacting particle can be removed. The approach uses calcium carbonate (CaCO3) as the pigment for contact dewatering. Cationic and anionic precipitated CaCO3 (C- and A-PCC) have been shown to increase water drainage from CNF suspensions [27] via contact dewatering, and the pigment can also be dissolved from the suspension by washing with an acidic solution [28,29]. Hence, the use of CaCO3 offers a way to dewater CNF suspensions without contaminating the material or altering the fibers’ morphology and dimensions.
2. Materials and Methods
2.1. Materials
The CNFs were prepared from bleached softwood kraft pulp by mechanical processing and were provided as a 3 wt.% aqueous slurry at 90% fines from the University of Maine’s PDC. Omyafil®—FL GCC, a strongly anionic ground CaCO3 (A-GCC), was supplied by Omya® Products (Omya Inc., Alpharetta, GA, USA). Albacar 5970, a slightly anionic PCC (A-PCC), was supplied by Specialty Minerals (Minerals Technologies Inc., Bethlehem, PA, USA).
The zeta potential and particle size for the A-PCC and the A-GCC and the zeta potential of the CNFs were measured on a Zetasizer 300 Has (Malvern Instruments, Malvern UK). A dilute (0.01 wt.% solids) suspension was prepared for measuring zeta potential and particle size and was sonicated with a tip sonicator (Sonic Dismembrator, Model 100, Fisher Scientific, Waltham, MA, USA) for 30 s before measurement. For measuring particle size, the dilute suspension was added to a cuvette. DI water with a pH of 5.3–6 was used to dilute for all measurements and the pH of the suspension was subsequently adjusted using 1 M NaOH. Hydrochloric acid (36.5–38%) was purchased from Fisher Chemical (Fair Lawn, NJ, USA) and was used at 1 M concentration.
The zeta potential of the A-GCC was −16.3 mV ± 3.7 (denoted strongly anionic) and had an average particle diameter of 575 nm; the zeta potential of the A-PCC was −5.5 mV ± 2.8 (denoted slightly anionic) and had an average particle diameter of 1.9 µm. The average zeta potential of the CNFs at pH 10 was −24.7 mV ± 1.9. The A-PCC has a specific surface area of 7 m2/g and the A-GCC has a specific surface area of 11.5 m2/g.
2.2. Cationic GCC Preparation
Experiments were performed using a cationic GCC (C-GCC) that had the same particle size as the A-GCC. This C-GCC was prepared by adsorbing a cationic polymer, poly(diallyldimethylammonium chloride) (PDADMAC), onto the A-GCC using a procedure described elsewhere [30]. In brief, a 2 wt.% PDADMAC solution was prepared by pipetting 0.572 mL of 35 wt.% PDADMAC into a 20 mL beaker, followed by dilution with 10 mL of DI water. Next, a 20 mL sample of a 10 wt.% A-GCC suspension was prepared by placing 2 g of A-GCC into a 50 mL beaker and adding 18 g of DI water. The 10 wt.% A-GCC suspension was stirred at 500 rpm using a magnetic stirrer for 15 min to obtain a homogenous suspension. The entire volume of the 10 wt.% A-GCC suspension was then added dropwise to 1.5 mL of the 2 wt.% PDADMAC in a 50 mL beaker (final A-GCC suspension-to-PDADMAC solution volume ratio was 13) while stirring at 1000 rpm using a magnetic stirrer. The resulting C-GCC suspension was centrifuged at 3400 rpm for 10 min. The supernatant was then decanted, and the C-GCC was redispersed in 12 mL of DI water, and the centrifugation was repeated three times to remove excess PDADMAC. The zeta potential of the C-GCC was +22.1 mV ± 0.5 and had the same particle size of 575 nm as the A-GCC.
2.3. Preparation of CNF/CaCO3 Suspensions for Vacuum Filtration
In this work, we utilized vacuum filtration as well as a conventional filter press to dewater CNF suspensions. The vacuum filtration method was used to provide a rapid means for screening materials and processes, while the filter press method was tested as it is a low energy process and is easily scalable [14]. We do not envisage that vacuum filtration is a competing option to filter pressing as the CNF suspensions for vacuum filtration required dilution to 0.5 wt.% and the highest dewatering only achieved a 10 wt.% CNF suspension, much less than can be achieved using filter pressing.
A 3 wt.% CNF suspension was diluted to a final concentration of 0.5 wt.% because at 3 wt.% CNFs, the suspension was too viscous to be used with vaccum filtration. To begin, we generated a 0.6 wt.% CNF suspension by diluting 16 g of a 3 wt.% CNF suspension with 64 mL of DI water in a 200 mL beaker and this was stirred at 600 rpm using a magnetic stir bar for 30 min. Next, 0.5 g of A-PCC, A-GCC, or C-GCC was added in one shot to the stirred 0.6 wt.% CNF suspension, and the batch was mixed by hand with a spatula for 1 min, creating a ~1.2 wt.% total solids suspension and 1:1 CNFs: CaCO3 on a dry mass ratio. Selection of a 1:1 CNFs: CaCO3 ratio was based on work reported in the literature which showed that this ratio was optimal when working at 0.6 wt.% CNFs for achieving the fastest water drainage rate from the films [27]. Lastly, 20 mL of DI water was added to adjust the suspension to 1 wt.% total solids (0.5 wt.% CNFs), and this was stirred at 600 rpm using a magnetic stir bar for 30 min. The sample with A-PCC is denoted as 0.5PA, the sample with A-GCC is denoted as 0.5GA, and the sample with C-GCC is denoted as 0.5GC, where 0.5 represents the CNFs wt.%, P and G represent PCC and GCC, and A and C represent anionic and cationic (see Table 1).
Table 1.
Sample formulation details including their abbreviations.
2.4. Preparation of CNF/CaCO3 Suspensions for Filter Press
Filter press measurements were performed with the same 0.5 wt.% CNF samples used for vacuum filtration as well as an additional set of samples prepared using a 3 wt.% CNF suspension. In this case, the PCC or GCC was added directly to the stock 3 wt.% suspension to provide a comparison to the same wt.% CNFs used in the production filtering process at the University of Maine. A 3 wt.% CNF suspension is viscous and difficult to stir. Therefore, we tested 2:1 and 4:1 CNFs: GCC dry basis ratios rather than the 1:1 ratio used for the vacuum filtration samples. This resulted in suspensions with final solids contents of 4.2% for the 2:1 ratio sample and 3.5% for the 4:1 ratio sample.
First, 10 g of a 3 wt.% CNF suspension was placed in a 100 mL beaker. Next, 0.15 or 0.08 g GCC was dispersed in 0.5 mL of DI water in a separate beaker. This was mixed by hand with a spatula and was subsequently added in one shot to the 3 wt.% CNF suspension. The suspension was then mixed by hand with a spatula for 1 min before being transferred to a 10 mL vial and was then vortex mixed for 10 s. For comparative purposes, a 3 wt.% CNF suspension without GCC was tested. Details on the various samples used in this work and their abbreviations are provided in Table 1.
2.5. Dewatering by Vacuum Filtration
For vacuum filtration dewatering, 15–20 g of 0.5GA, 0.5PA, or 0.5GC was placed in a 13.5 cm diameter Büchner funnel lined with a wet 12.5 cm diameter filter paper (Fisherbrand grade Q5, Global Life Sciences Solutions USA LLC, Marlborough, MA, USA). The drainage was performed under 0.33 atm pressure provided by a water aspirator, and the suspensions were vacuum filtered until the drops of water coming out were 10 s apart [27]. For comparative purposes, we also vacuum filtered a 1 wt.% CNF suspension containing no CaCO3. After filtration, the film was removed from the Büchner funnel and weighed to determine the water loss. The procedure to gravimetrically determine the % water lost and wt.% CNFs after each cycle are reported in our previous work [25]. In this manuscript, all % water loss or wt.% CNFs values are reported as the average of three replicates and the error reported is the standard deviation from three separate trials.
2.6. Dewatering by Filter Press
For dewatering by filter press, 15–20 g of 0.5GA was pressed using a DAKE (Grand Haven, MI, USA) hydraulic press [31]. The sample was placed in between two 14.5 × 14.5 cm2 60 mesh stainless steel screens (OV-546; Ovsor, Shenzhen, Guangdong, China) and filter paper (Fisherbrand grade Q5, Global Life Sciences Solutions USA LLC, Marlborough, MA, USA) was placed on top of the mesh to prevent the sample from sticking inside the mesh. Paper towels were placed underneath the bottom mesh to prevent re-absorption of water by the sample. Unless otherwise stated, the samples were pressed for 60 s under 0.29 MPa and this is referred to as one dewatering cycle.
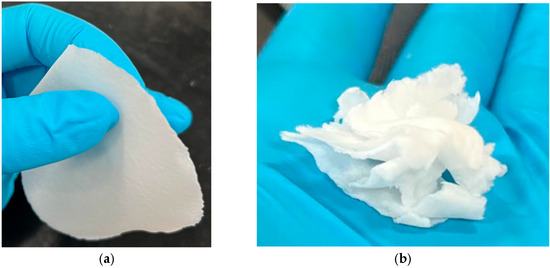
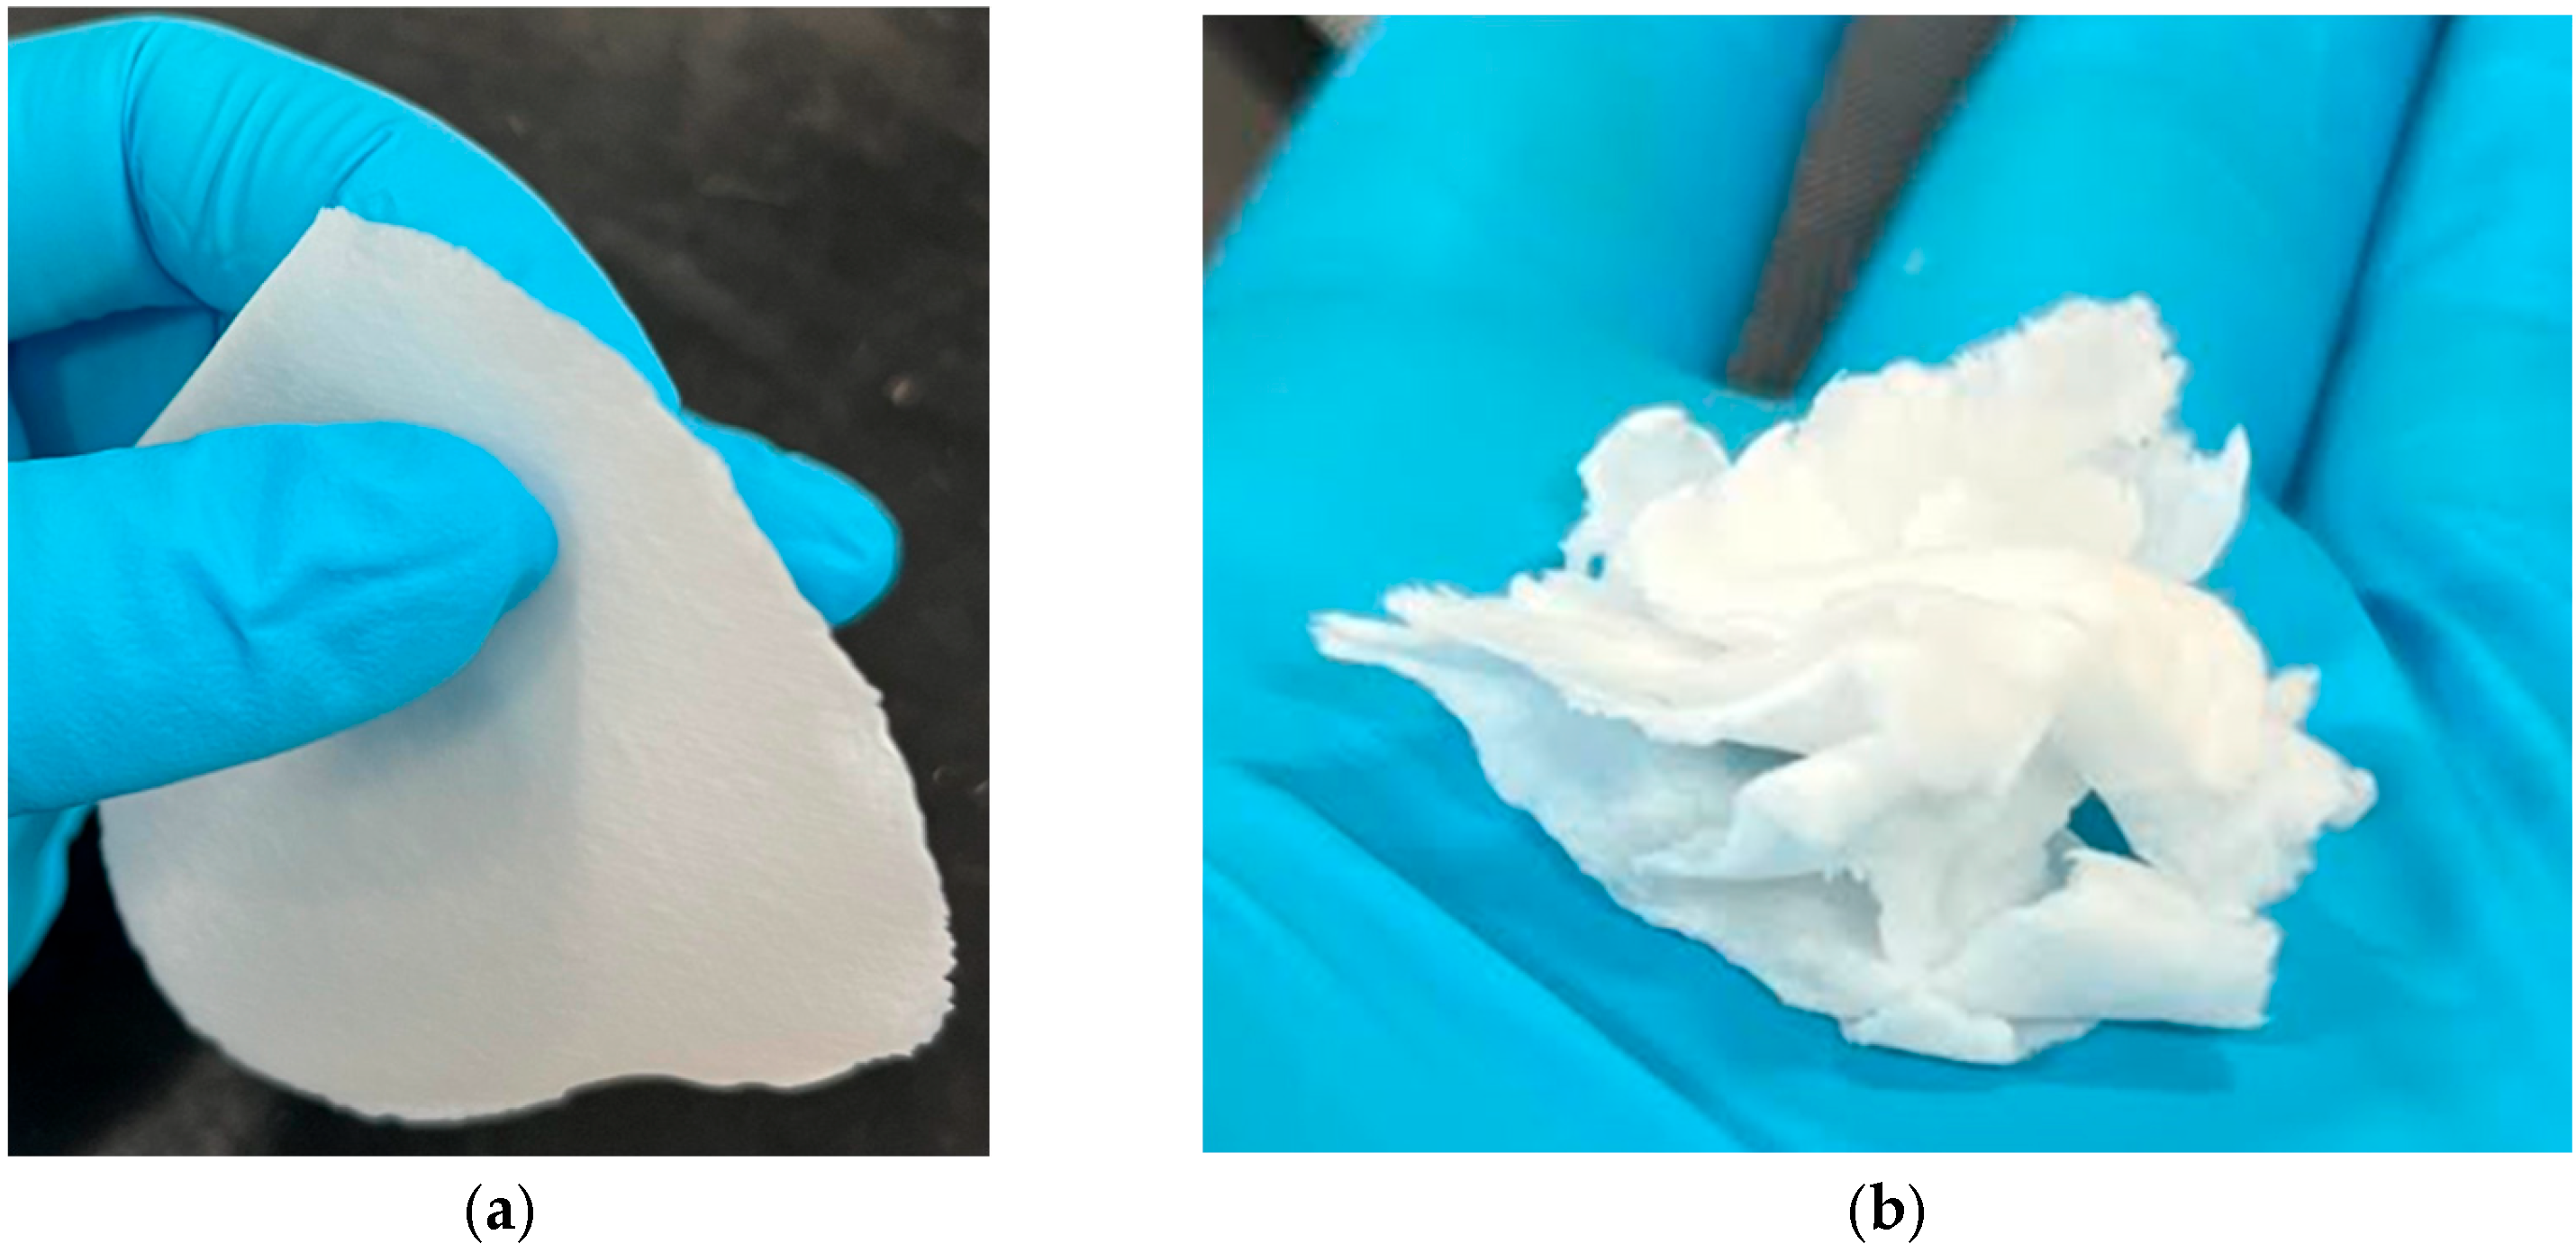
After each cycle, the pressure was released and the sample was scraped off the filter paper with a metal spatula. The paper towels were replaced between cycles to facilitate moisture removal. After each dewatering cycle, the sample was weighed to determine the % water loss and wt.% CNFs before placing it back onto the mesh screens for another dewatering cycle. After each dewatering cycle, we observed that the sample had been flattened to a height of less than 1 mm. Therefore, before performing the next dewatering cycle, we fluffed the sample with a metal spatula to restore it to the original height of approximately 1 cm before repressing (Figure 1). This was done to increase the contact of the CNFs and GCC during pressing. For comparative purposes, we also performed the same experiment using a 1 wt.% CNF suspension that did not contain GCC.
Figure 1.
0.5GA sample (a) after pressing for 1 min at 0.29 MPa, and (b) 0.5GA after fluffing between cycles 1 and 2.
While these initial experiments with multiple filter press cycles provided an estimate of the maximum level of dewatering, the most likely scenario and the one used at the University of Maine is to filter press using only one press cycle and using 3 wt.% CNFs. For one press cycle, approximately 3 g of 3GA-4 or 3GA-2 was placed in between the same stainless steel screens previously described with filter paper placed on top of the screens. Paper towels were placed underneath the bottom mesh to prevent re-absorption of water by the sample. The samples were pressed under 0.39 MPa pressure and for 60 s. For comparative purposes, we also pressed 3 wt.% CNF suspensions without GCC.
2.7. Removal of CaCO3
Dissolution of the CaCO3 was performed by acidification of the CNF/CaCO3 suspensions. After dewatering, the suspensions were placed in a 35 mm diameter Pyrex gravity funnel, and a volume equivalent to 2 mL of 1 M HCl per 100 mg of CaCO3 was added. The HCl was poured over the suspensions in one shot, and allowed to drain until the suspension had the same consistency as a 3 wt.% CNF suspension. The effluent was collected in a 100 mL beaker placed underneath the funnel that was continuously stirred at 700 rpm using a magnetic stir bar, and the pH was monitored with a pH probe placed in the beaker. The acidified samples contained in the Pyrex funnel were then washed by adding 10 mL of DI water followed by two aliquots of 5 mL of DI water to obtain a pH between 5 and 6 for the CNF suspension. The CNF suspension was then removed from the funnel and placed in a 100 mL beaker.
The solubility of CaCO3 in water at varying pH levels was determined by first determining the [H+] in water as a function of pH. Next, the [Ca2+] in solution as a function of pH was determined using the Ksp (5 × 10⁻⁹) and K2 (4.8 × 10⁻¹¹) constants at 25 °C for CaCO3 and the known [H+] in solution, and this was calculated using Equation (1). Then, the solubility of CaCO3 in water in g/L as a function of pH was determined using Equation (2), and this was subsequently converted to molarity (M) by dividing by the molar mass of CaCO3. Measurement of pH was used to determine the point of complete dissolution of the CaCO3. The pH remained in the range of 5–6 while the CaCO3 was dissolving due to the formation of CaCl2, CO2, and water (Figure 2). When all CaCO3 had dissolved, the pH dropped to 2.
Figure 2.
Dissociation of CaCO3 in aqueous media.
2.8. Determination of HCl: CaCO3 Ratio
To ensure that the CaCO3 would dissolve in a reasonable amount of time, an experiment was performed to determine the ratio of HCl: CaCO3 needed. In this experiment, 100 mg of slightly anionic PCC was dissolved in 10 mL of DI water in a 50 mL beaker, and 1 M HCl was added dropwise to the beaker while continuously stirring with a magnetic stir bar at 700 rpm. The pH was continuously measured and the HCl was added until the pH dropped to 2. After the HCl: CaCO3 ratio was determined, we will no longer need to monitor the pH of the suspension or add the HCl dropwise. We can simply calculate the volume of 1 M HCl needed to remove the CaCO3 from a suspension based on how many mg of CaCO3 were in the suspension and then add this volume of HCl to the suspension in one shot. We also confirmed that the CaCO3 was gone by infrared (IR) spectroscopy.
2.9. Infrared Spectroscopy
Infrared spectroscopy (IR) was used to determine if the CaCO3 had been removed from the samples after acid washing. IR spectra were recorded using attenuated total reflectance (ATR) spectroscopy on a Spectrum Two FT-IR Spectrometer (PerkinElmer, Llantrisant, UK).
To measure the amount of CaCO3 removed after HCl addition, a small portion (~1 mg) of the dewatered CNF suspension was used for ATR-IR analysis. CaCO3 produces a strong broad IR band around 1430 cm−1 and so the intensity of this band was used to determine the relative amount of CaCO3 in the suspension. From the intensity ratio of this band to the O-H stretching band for CNFs at 1060 cm−1, the amount of CaCO3 per g of CNFs in the sample was determined using Equation (3), where 2323 cm2/g is the extinction coefficient of the 1430 cm−1 band, 1400 cm2/g is the extinction coefficient for the band at 1060 cm−1, and 1.32 is the ATR correction factor.
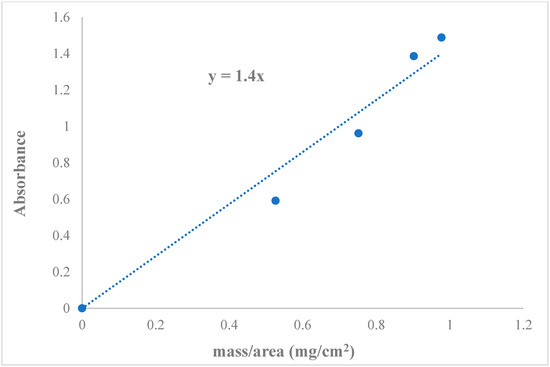
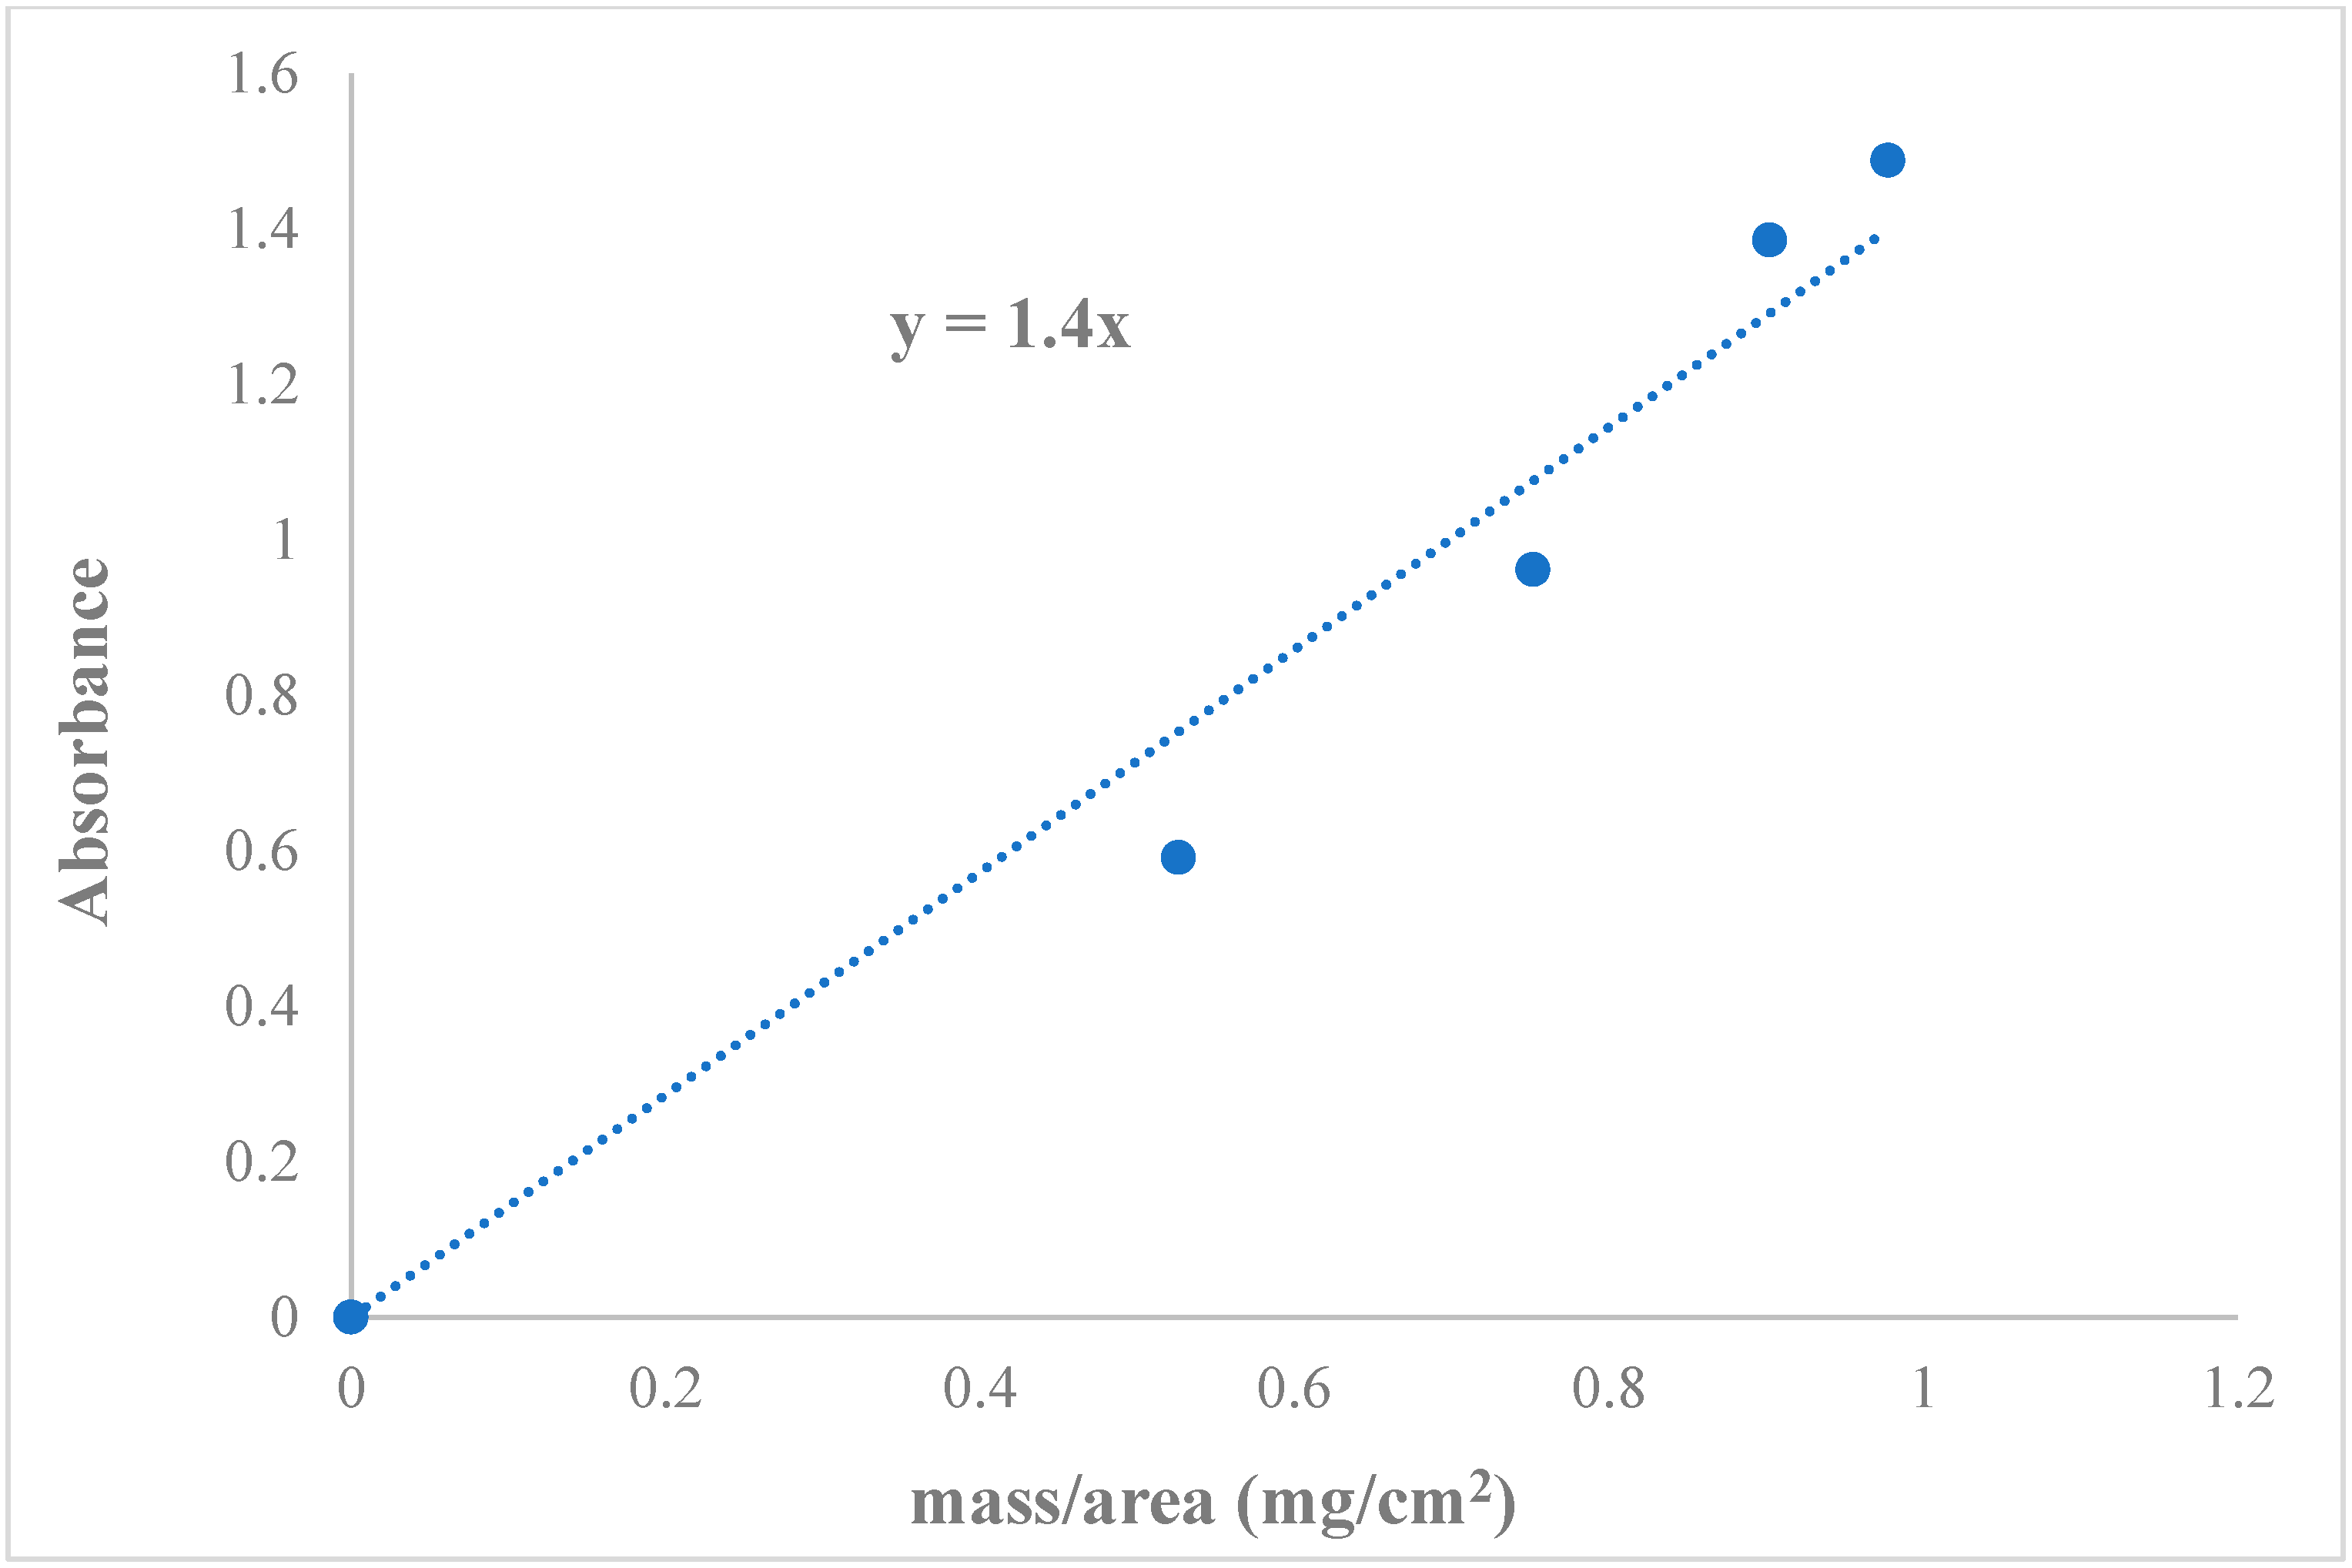
The extinction coefficient of the O-H stretching peak at 1060 cm−1 was determined from the slope of a Beer’s Law plot of known amounts of dried CNFs in KBr pellets recorded in transmission mode (Figure 3) and had a value of 1400 cm2/g. The extinction coefficient of the CaCO3 peak at 1430 cm−1 was determined the same way and had a value of 2323 cm2/g.
Figure 3.
Calibration plot for O-H stretching peak for CNFs at 1060 cm−1.
2.10. Rehydration to 3 wt.% CNFs
The dewatered CNF samples were diluted back to the original 3 wt.% CNFs by addition of an appropriate amount of DI water at 1 mL increments while manually stirring with a spatula, followed by manual stirring with a spatula for an additional min and then vortex mixing for 10 s.
2.11. Fiber Size Analysis
For measuring fiber size, the rehydrated 0.5GA suspension after A-GCC removal was diluted to 0.005 wt.% CNFs by adding 1 L of DI water to 50 mg (dry basis CNFs). The 0.005 wt.% suspension was placed on the carousel on a Techpap Morfi Fiber Analyzer (IDM, Barcelona, Spain) and the suspension was circulated through the instrument at a rate of 200 mL/min and values for the average fiber lengths and widths were obtained. For comparative purposes, average fiber lengths and widths were also recorded for the original supplied 3 wt.% CNF suspension using this same procedure.
2.12. Scanning Electron Microscopy (SEM)
A Zeiss N vision 40 scanning electron microscope (SEM; Oberkochen, Germany) was used to record SEM images of the dewatered 0.5GA suspension, the rehydrated 0.5GA suspension after GCC removal, and the original supplied 3 wt.% CNF suspension.
The samples were prepared by performing a series of dilutions with ethanol to exchange the water in the suspensions with ethanol prior to imaging. Ethanol was added to the suspensions at a 10:1 ethanol: water ratio, and the suspensions were then manually mixed using a spatula for 2 min. After 5 min, the CNFs began to settle, and the top layer of ethanol/water was decanted. This same process was repeated 5 more times until all the water in the suspension had been replaced with ethanol. Finally, the suspensions were diluted to 0.005% using ethanol.
To prepare the samples for imaging, a silicon wafer was mounted on a stub using carbon tape, and 1 drop of the 0.005% suspensions was placed on the wafer. The ethanol evaporated from the suspensions, and the samples were then placed in a desiccator overnight. Finally, the samples were sputter coated with 6 nm of Au/Pd prior to imaging and were scanned at an accelerating voltage of 3.00 kV.
The resulting SEM images were analyzed using ImageJ software (version 1.54g). Two SEM images for each sample were uploaded to the software, and a grid was overlaid on top of the image using the Grid plugin feature with the area per point set to 200,000 nm2. The diameter of each fiber that passed through a square on the grid was measured and recorded, and the length of each fiber that passed through multiple horizontal lines on the grid was also measured and recorded. Examples of these images can be found in the Supplementary Materials Figures S1 and S2. The average fiber diameter and length for all samples was reported.
2.13. Energy Dispersive X-Ray Spectroscopy (EDS)
Elemental analysis of the dewatered 0.5GA suspension, the rehydrated 0.5GA suspension after GCC removal, and of the original supplied 3 wt.% CNF suspension were recorded using an AMRay 1820 SEM (AMRay Inc., Bedford, MA, USA), using a model 550i iXRF system (IXRF Systems, Austin, TX, USA) with an operating voltage of 20 kV. The samples were coated with carbon using a Denton DV502 rotary evaporator (Denton Vacuum, Inc., Moorestown, NJ, USA).
2.14. X-Ray Diffraction (XRD)
XRD patterns of the dewatered 0.5GA suspension, the rehydrated 0.5GA suspension after GCC removal, and of the original supplied 3 wt.% CNF suspension were examined using a Malvern PANalytical X’Pert PRO MRD XL X-ray diffractometer (PANalytical B.V., Almelo, The Netherlands). Incident X-rays were columnated using a parabolic mirror. Diffracted X-rays were collected using a 1-D multichannel PIXcel detector (PANalytical B.V., Almelo, The Netherlands).
3. Results and Discussion
3.1. Dewatering by Vacuum Filtration
After vacuum filtration, the measured wt.% CNFs for the 0.5PA and the 0.5GC were statistically equivalent with values of 10.5 ± 0.8 and 9.9 ± 0.2 wt.% CNFs, respectively, and these were slightly higher than the 8.6 ± 0.6 wt.% CNFs obtained for 0.5GA. The higher dewatering level for the 0.5GC suspension compared to the 0.5GA is attributed to the cationic nature, as the anionic CNFs have an electrostatic interaction with the C-GCC. This is consistent with drainage rates reported by Rao et al. [11]. Furthermore, the total drainage time (defined as the time from the initial pouring of the suspension into the Büchner funnel to the time when water drops dripping from the Büchner funnel were ten seconds apart) for the 0.5GA suspension was 225 s compared to the total drainage time of 210 s for the 0.5GC suspension. In the case of the 0.5PA suspension, the Albacar 5970 PCC used is slightly anionic (−5.5 ± 2.8) and has a specific surface area of 7 m2/g. The slightly higher zeta potential of the PCC compared to the A-GCC allows for more CNFs to adsorb onto the particles, leading to an increase in dewatering levels.
In contrast, the pure 1 wt.% CNF suspension with no CaCO3 gave 5.4 ± 0.2 wt.% CNFs, approximately two times less than what can be achieved by adding either cationic or anionic CaCO3. When CaCO3 is added to the CNF suspension, the porosity of the CNF films is increased because the PCC or GCC pigments set the pore structure, and the CNFs fill in the pores between the pigments [27]. Thus, the addition of the pigment increases the porosity of the films and leads to higher levels of dewatering.
3.2. Dewatering by Filter Press
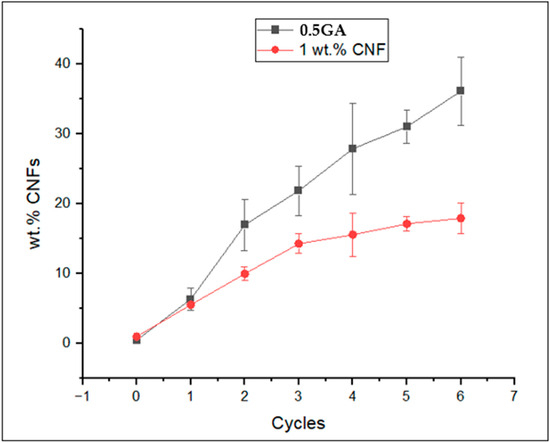
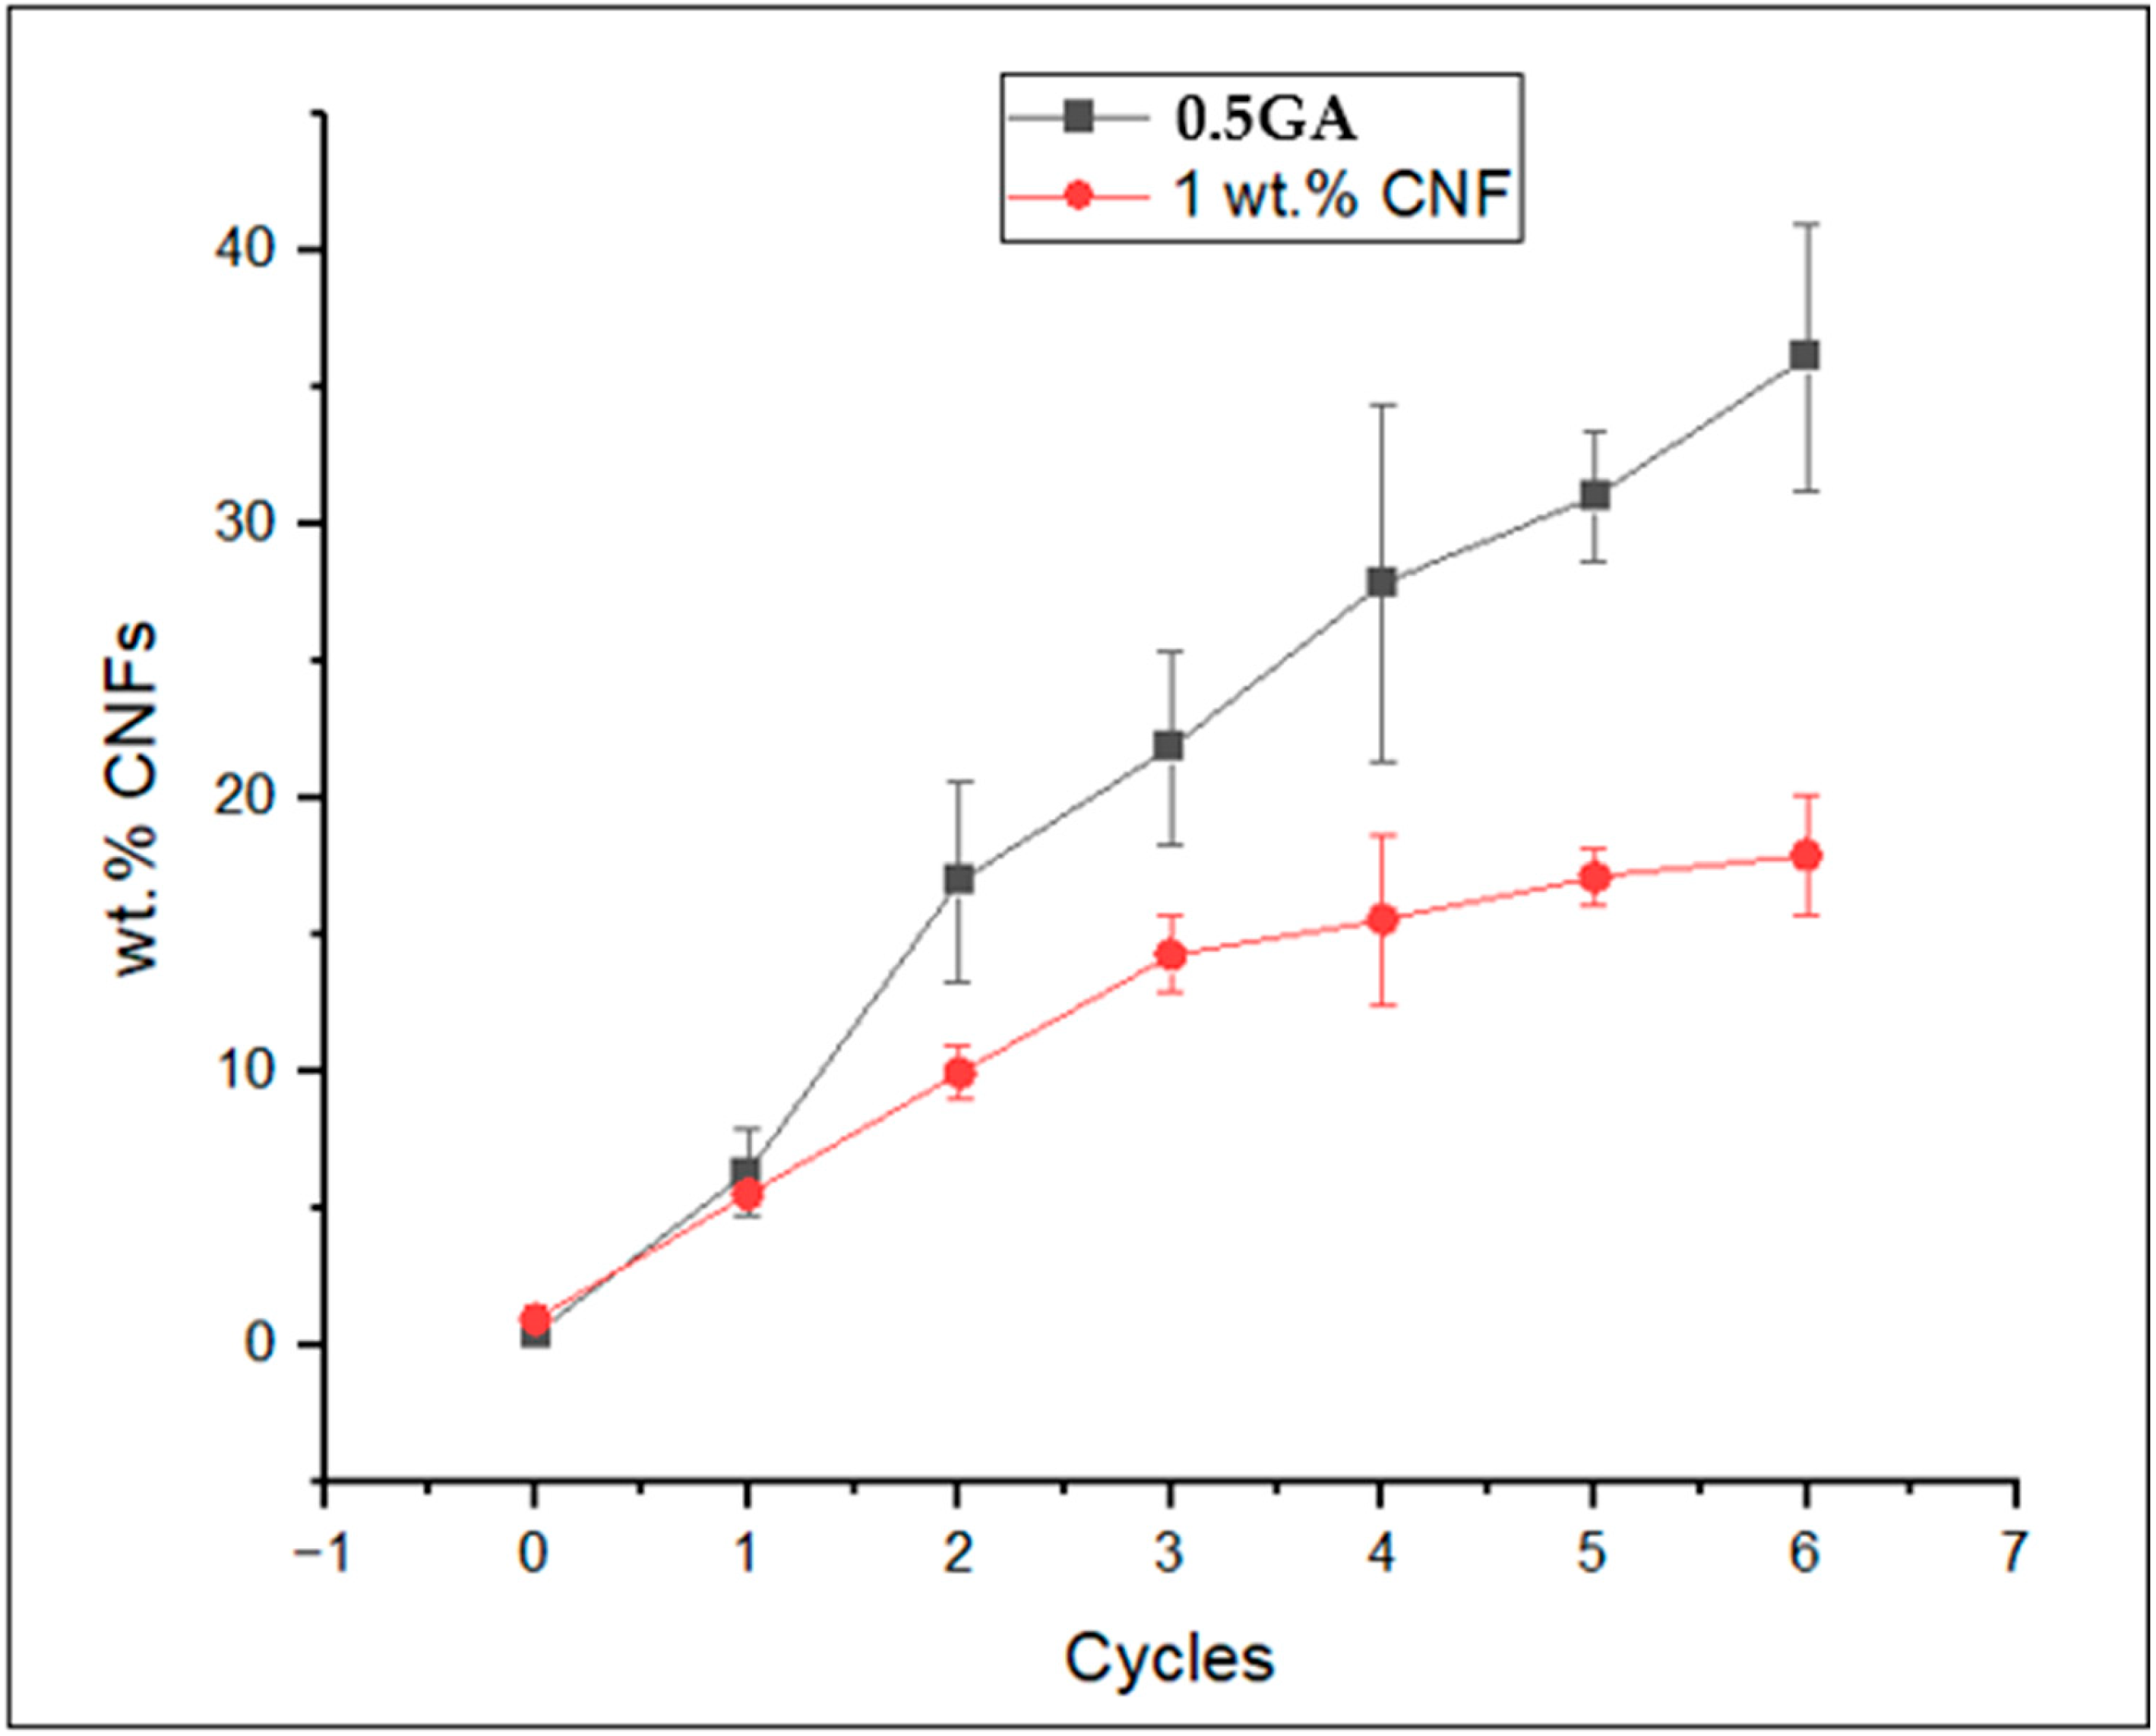
We first investigated the use of multiple filter press cycles with the 0.5GA sample to see if the dewatering level could be amplified with each additional filter press cycle. The 0.5GA as well as a pure 1 wt.% CNF suspension were pressed at 0.1 MPa for 60 s for multiple cycles and the results are shown in Figure 4. At first glance, the curves in Figure 4 show that there is no difference in the l wt.% CNFs after 1 cycle for 0.5GA compared to a starting 1 wt.% CNF suspension. However, in absolute terms with respect to the volume of water removed, more water is removed from the 0.5GA sample. This is because a 1 wt.% CNF suspension has about 50% less total water per g CNFs in the sample than the 0.5GA sample and this translates to two times more water removed from the 0.5GA compared to the 1 wt.% CNF suspension. Figure 4 also shows that the difference in dewatering levels accumulates with each subsequent filter press cycle. After six dewatering cycles, an approximately 40 wt.% CNF suspension was achieved using 0.5GA, whereas the 1 wt.% CNF suspension plateaued after six dewatering cycles to approximately 18 wt.% CNFs. Overall, we achieve two times higher wt.% CNFs for a starting 0.5 wt.% CNFs suspension by adding GA particles compared to pressing without any CaCO3 present.
Figure 4.
wt.% CNFs for 0.5GA and 1 wt.% CNF suspensions as a function of pressing cycles. The error bars represent the standard deviation from three separate trials.
3.3. Filter Press Using 3 wt.% CNF Suspensions
Table 2 shows that the highest wt.% CNFs value was obtained starting with the original supplied 3 wt.% CNF suspension without GCC after one press cycle (0.39 MPa, 60 s). Thus, the GCC does not have the same effect on the dewatering as it does when a 0.5 wt.% CNF suspension is used. One possible explanation for this could be the difficulty in mixing when working with the more viscous 3 wt.% CNF suspension. Another possibility could be due to the mechanism of dewatering. The 3 wt.% samples were dewatered using mechanical pressing via a cold press, while the 0.5 wt.% samples were dewatered by vacuum filtration.
Table 2.
wt.% CNFs values obtained after 1 press cycle (0.39 MPa, 60 s) with various amounts of anionic GCC.
3.4. Removal of CaCO3
Based on the known solubility of CaCO3 in water as a function of pH, we determined that the amount of CaCO3 at pH 2 in a 1 wt.% CNF suspension containing a 1:1 CNFs: CaCO3 ratio would be 10 times lower than the solubility limit (Figure S3). Thus, from a thermodynamic perspective, acidifying the suspension to pH 2 after contact dewatering dissolves all CaCO3 and releases the CNFs.
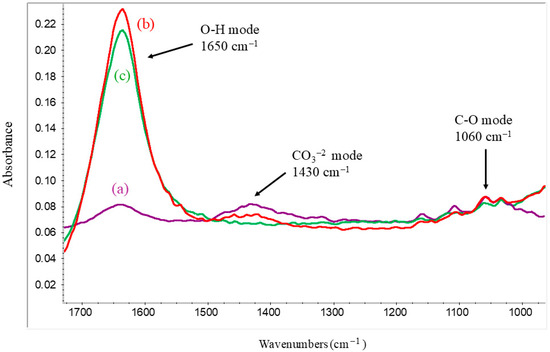
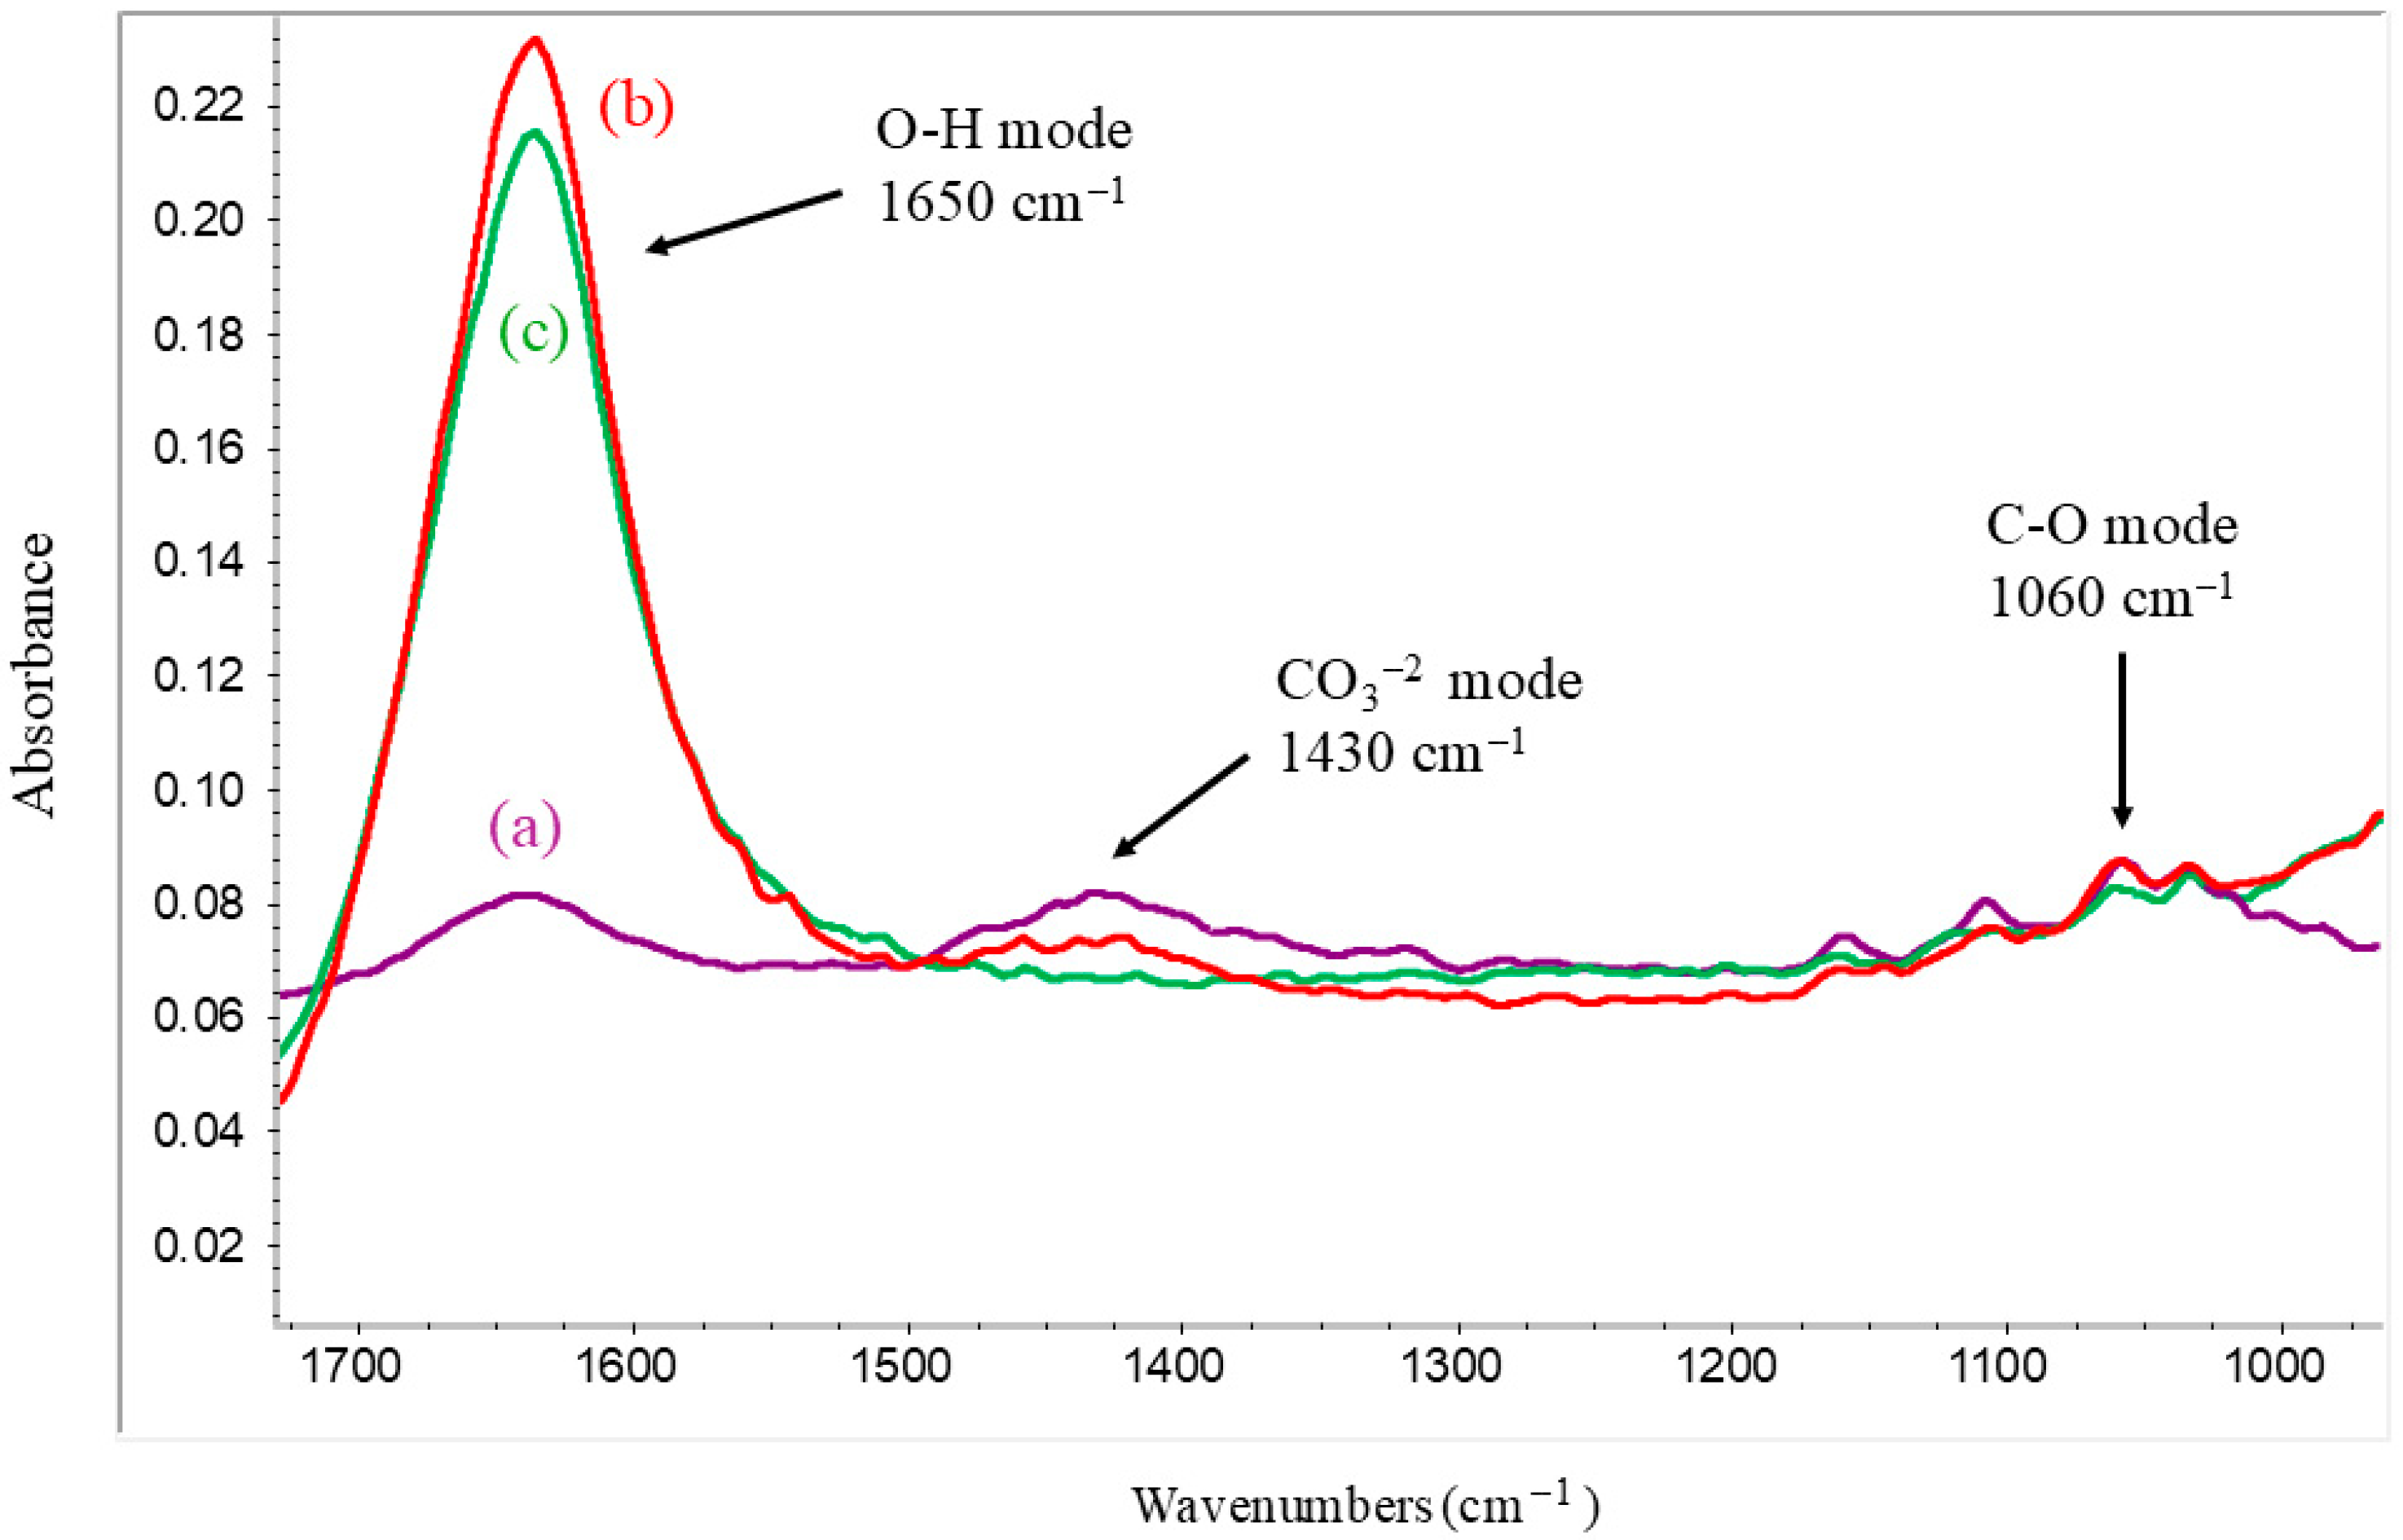
A ratio of 2 mL of 1 M HCl per 100 mg of CaCO3 was determined to be the optimal ratio to achieve complete dissolution of the CaCO3 particles. The absence of CaCO3 in the CNF suspensions was confirmed by recording ATR-IR spectra of the suspensions (Figure 5).
Figure 5.
IR spectra for (a) the dewatered 0.5GA suspension and the 0.5GA suspensions after acid washing with (b) 2 mL HCl/1 g GCC and (c) 2 mL HCl/100 mg GCC. The key bands in this spectrum have been indexed.
After dissolving C-GCC, the adsorbed cationic PDADMAC would likely remain in the suspension and affect the colloidal properties of the system. Contact dewatering with C-GCC was to demonstrate the concept that the CNF is adsorbing onto the GCC. Thus, for scale-up we would not recommend using C-GCC.
3.5. Infrared Spectroscopy
Figure 5 shows the IR spectra of the 0.5GA sample dewatered to approximately 40 wt.% CNFs (a) and the same sample after the addition of 2 mL of HCl per g GCC (b) and after the addition of 2 mL of HCl per 100 mg GCC (c). The key bands in these spectra are the CO3−2 mode of CaCO3 at 1430 cm−1 and the C-O stretching mode of CNFs at 1060 cm−1 as described previously.
Figure 5(a) is the spectrum recorded before adding HCl, and the 1430 and 1060 cm−1 bands are of similar intensities. Figure 5(b) is the IR spectrum after the addition of a volume of HCl equivalent to 2 mL HCl per g of GCC. In this case, a band at 1430 cm−1 is observed, indicating that GCC is still present in the sample. However, in Figure 5(c), a band at 1430 cm−1 is not observed which means that the GCC, if present, is below the noise limit of the spectrum and is estimated to be less than 1% of the original amount of GCC in the suspension. This shows that the 2 mL of HCl per 100 mg of GCC ratio was sufficient for removing the GCC particles from the dewatered suspension. There is also no observed decrease in the CNFs band at 1060 cm−1, indicating no CNF degradation after HCl washing.
After HCl washing, we observe an increase in the band at 1650 cm−1. This band is assigned to the O–H bending vibration of adsorbed or bound water, After HCl washing, this band became more pronounced because the IR spectra was taken after the CNFs had been rehydrated from 30 wt.% to 3 wt.%.
3.6. Rehydration to 3 wt.% CNFs
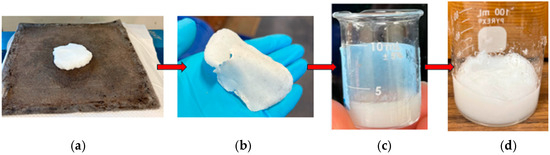
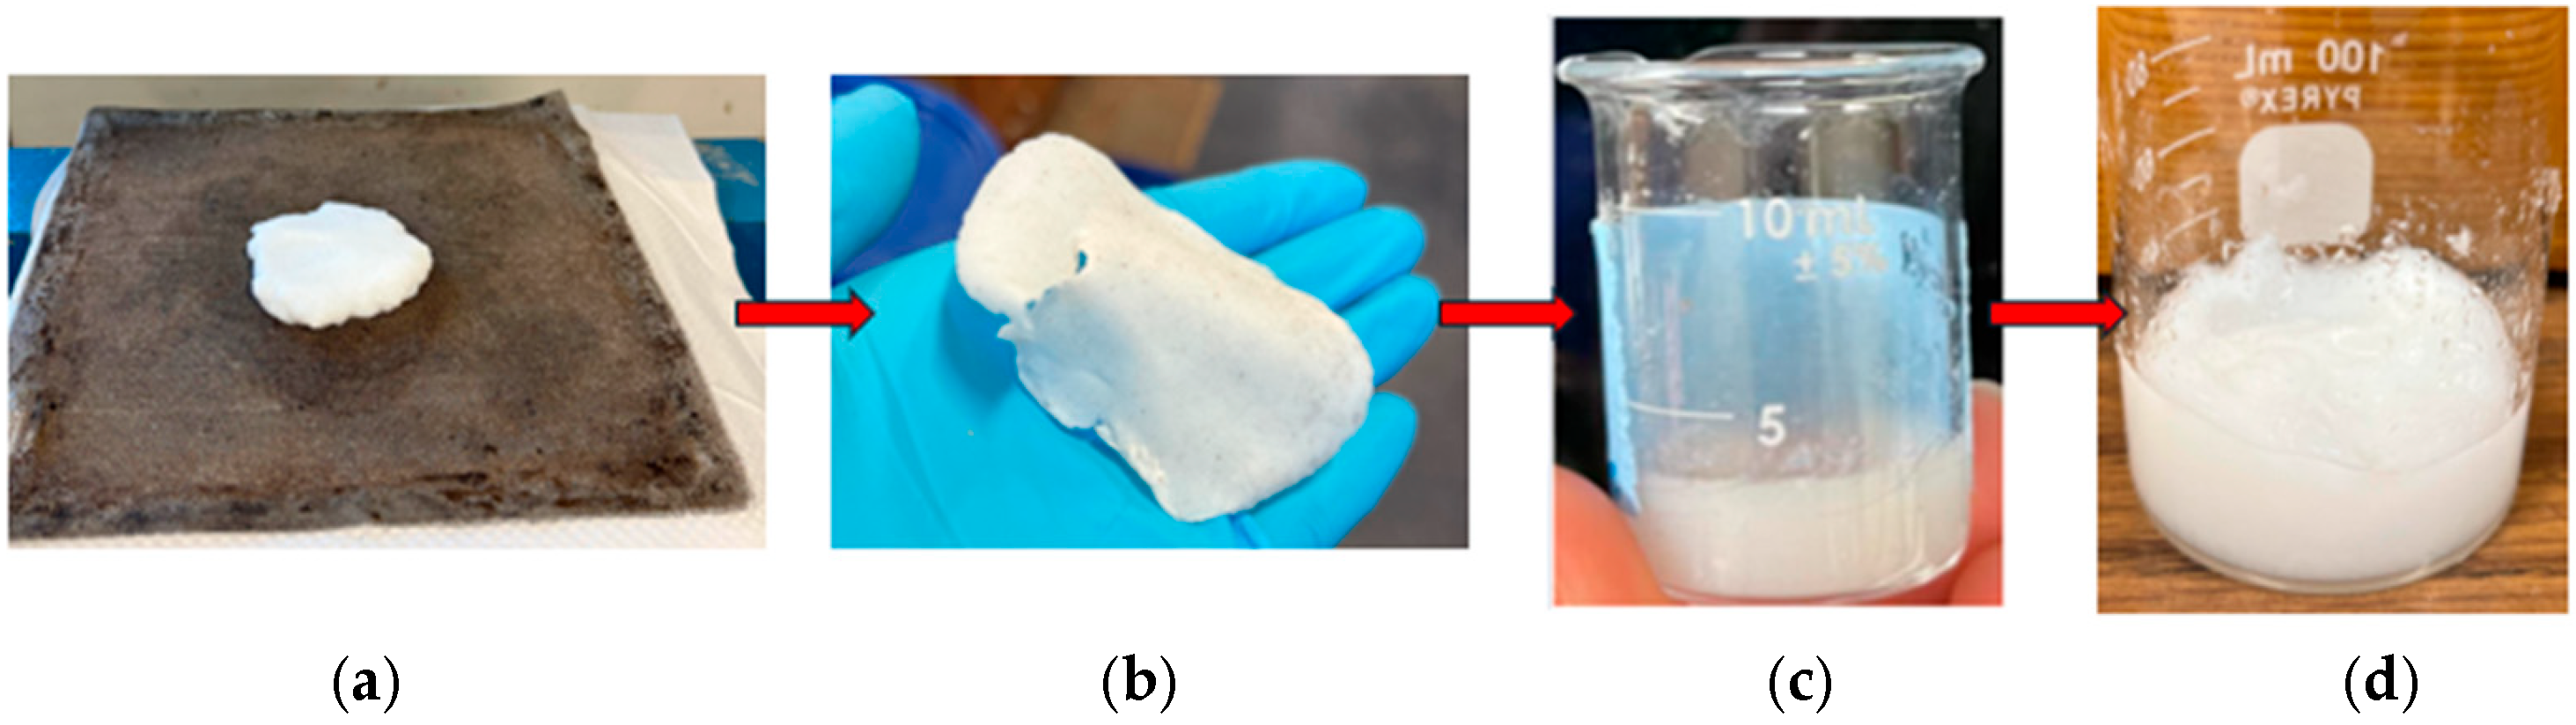
Figure 6 shows pictures of (a) the 0.5GA before dewatering, (b) after dewatering, (c) after acid-washing and rehydration and (d) of the starting 3 wt.% CNF suspension. The dewatered suspension was able to be rehydrated back to 3 wt.% by a simple manual mixing method. Visually, the rehydrated suspension appears to have the same consistency as the original 3 wt.% CNF suspension. Fiber analysis was conducted as further evidence.
Figure 6.
(a) 0.5GA suspension, (b) dewatered 0.5GA suspension, (c) rehydrated 0.5GA suspension, (d) original 3 wt.% CNF suspension.
3.7. Fiber Size Analysis
The average fiber length and width after rehydration of the 0.5GA sample back to 3 wt.% CNFs were 33.5 ± 0.42 and 23.3 ± 0.92 µm, respectively. These values are equivalent to the fiber length and width values of 34 ± 0.28 µm and 24.6 ± 0.14 µm obtained for the original supplied 3 wt.% CNF suspension. This indicated that our method did not alter the fiber dimensions.
3.8. Scanning Electron Microscopy
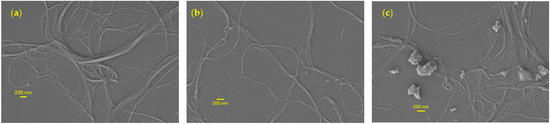
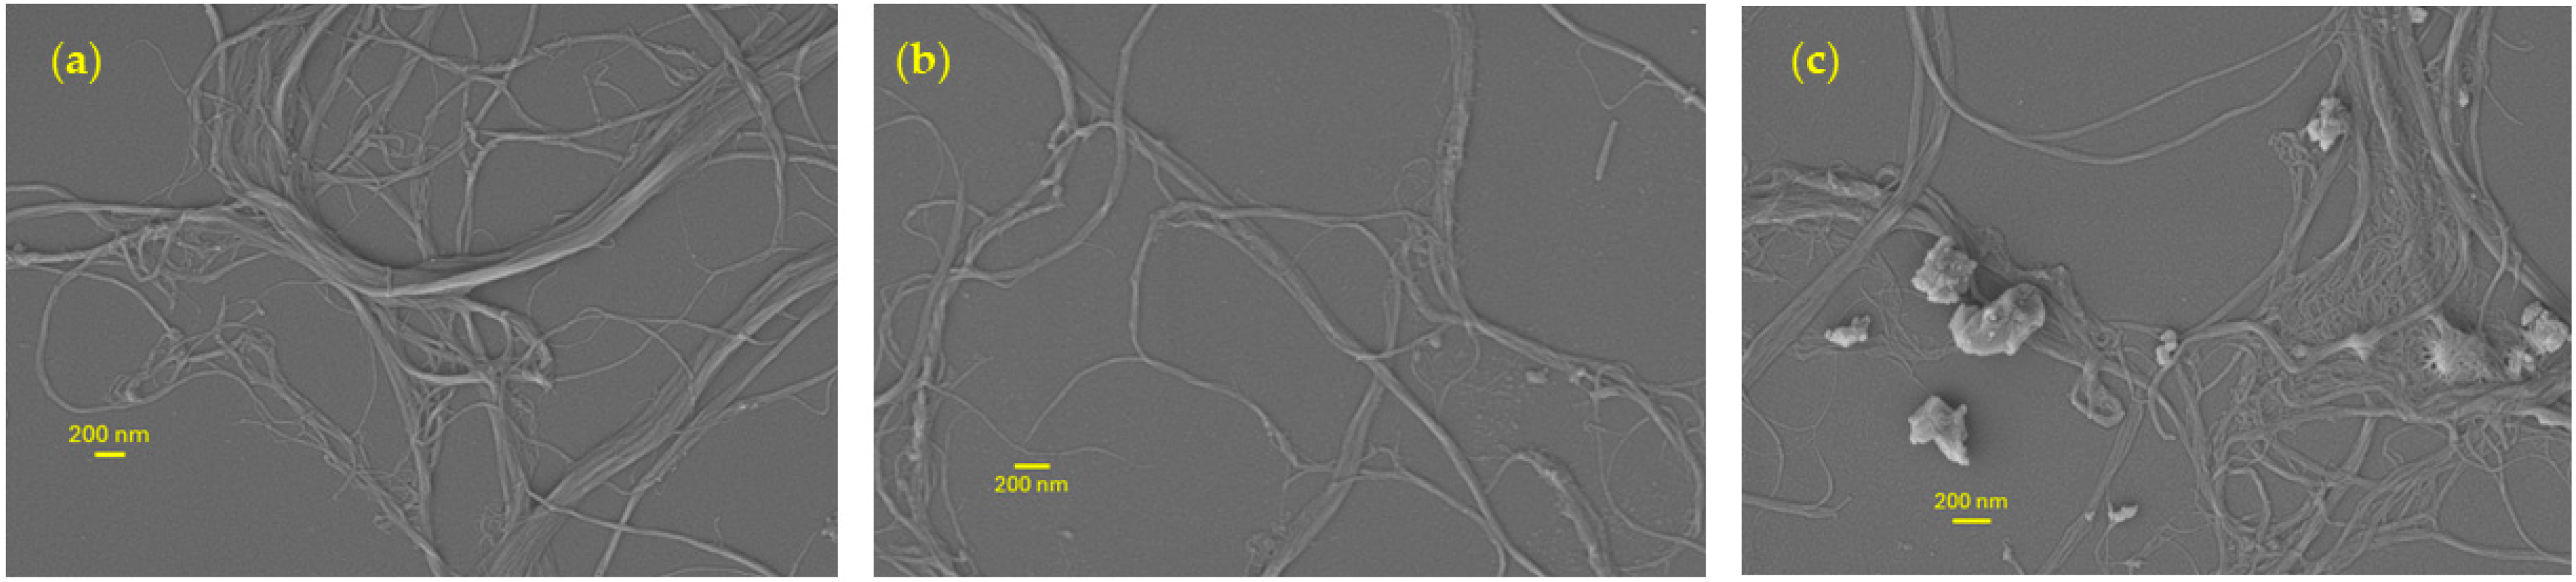
The SEM images for the original supplied 3 wt.% CNF suspension, the rehydrated 0.5GA suspension after GCC removal, and the dewatered 0.5GA suspension before GCC removal by acid washing are shown in Figure 7a, Figure 7b and Figure 7c, respectively. In Figure 7a,b, 50 nm diameter fibers are observed, showing that the dewatering and rehydration process did not alter the fiber dimensions. Furthermore, in Figure 7b there are no GCC particles present, providing further evidence that the acid washing removed all CaCO3 from the suspensions without changing the fiber dimensions. In Figure 7c, GCC particles are observed and several of these particles are interacting with the CNFs which in indicative of the contact dewatering process.
Figure 7.
(a) 3 wt.% CNFs control; (b) rehydrated 0.5GA after GCC removal; (c) dewatered 0.5GA suspension before GCC removal.
The average fiber diameter and length for the 3 wt.% CNFs control, as measured using ImageJ software (see Figures S1 and S2), was reported to be 61.2 nm and 4.4 µm, respectively. The average fiber diameter and length for the rehydrated 0.5GA after GCC removal was reported to be 60.2 nm and 3.5 µm, respectively. This indicates no CNF aggregation or degradation during the dewatering, HCl washing, or rehydration steps.
3.9. Energy Dispersive X-Ray Spectroscopy (EDS)
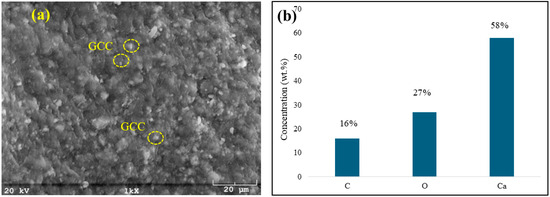
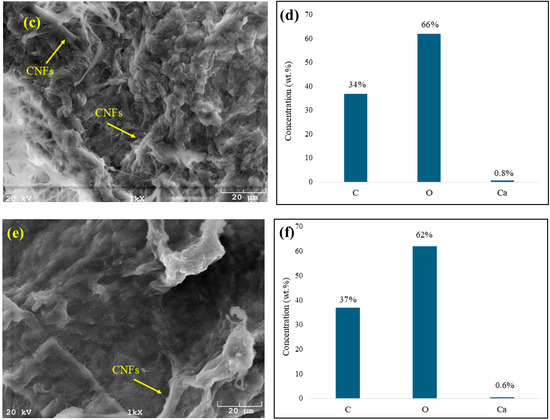
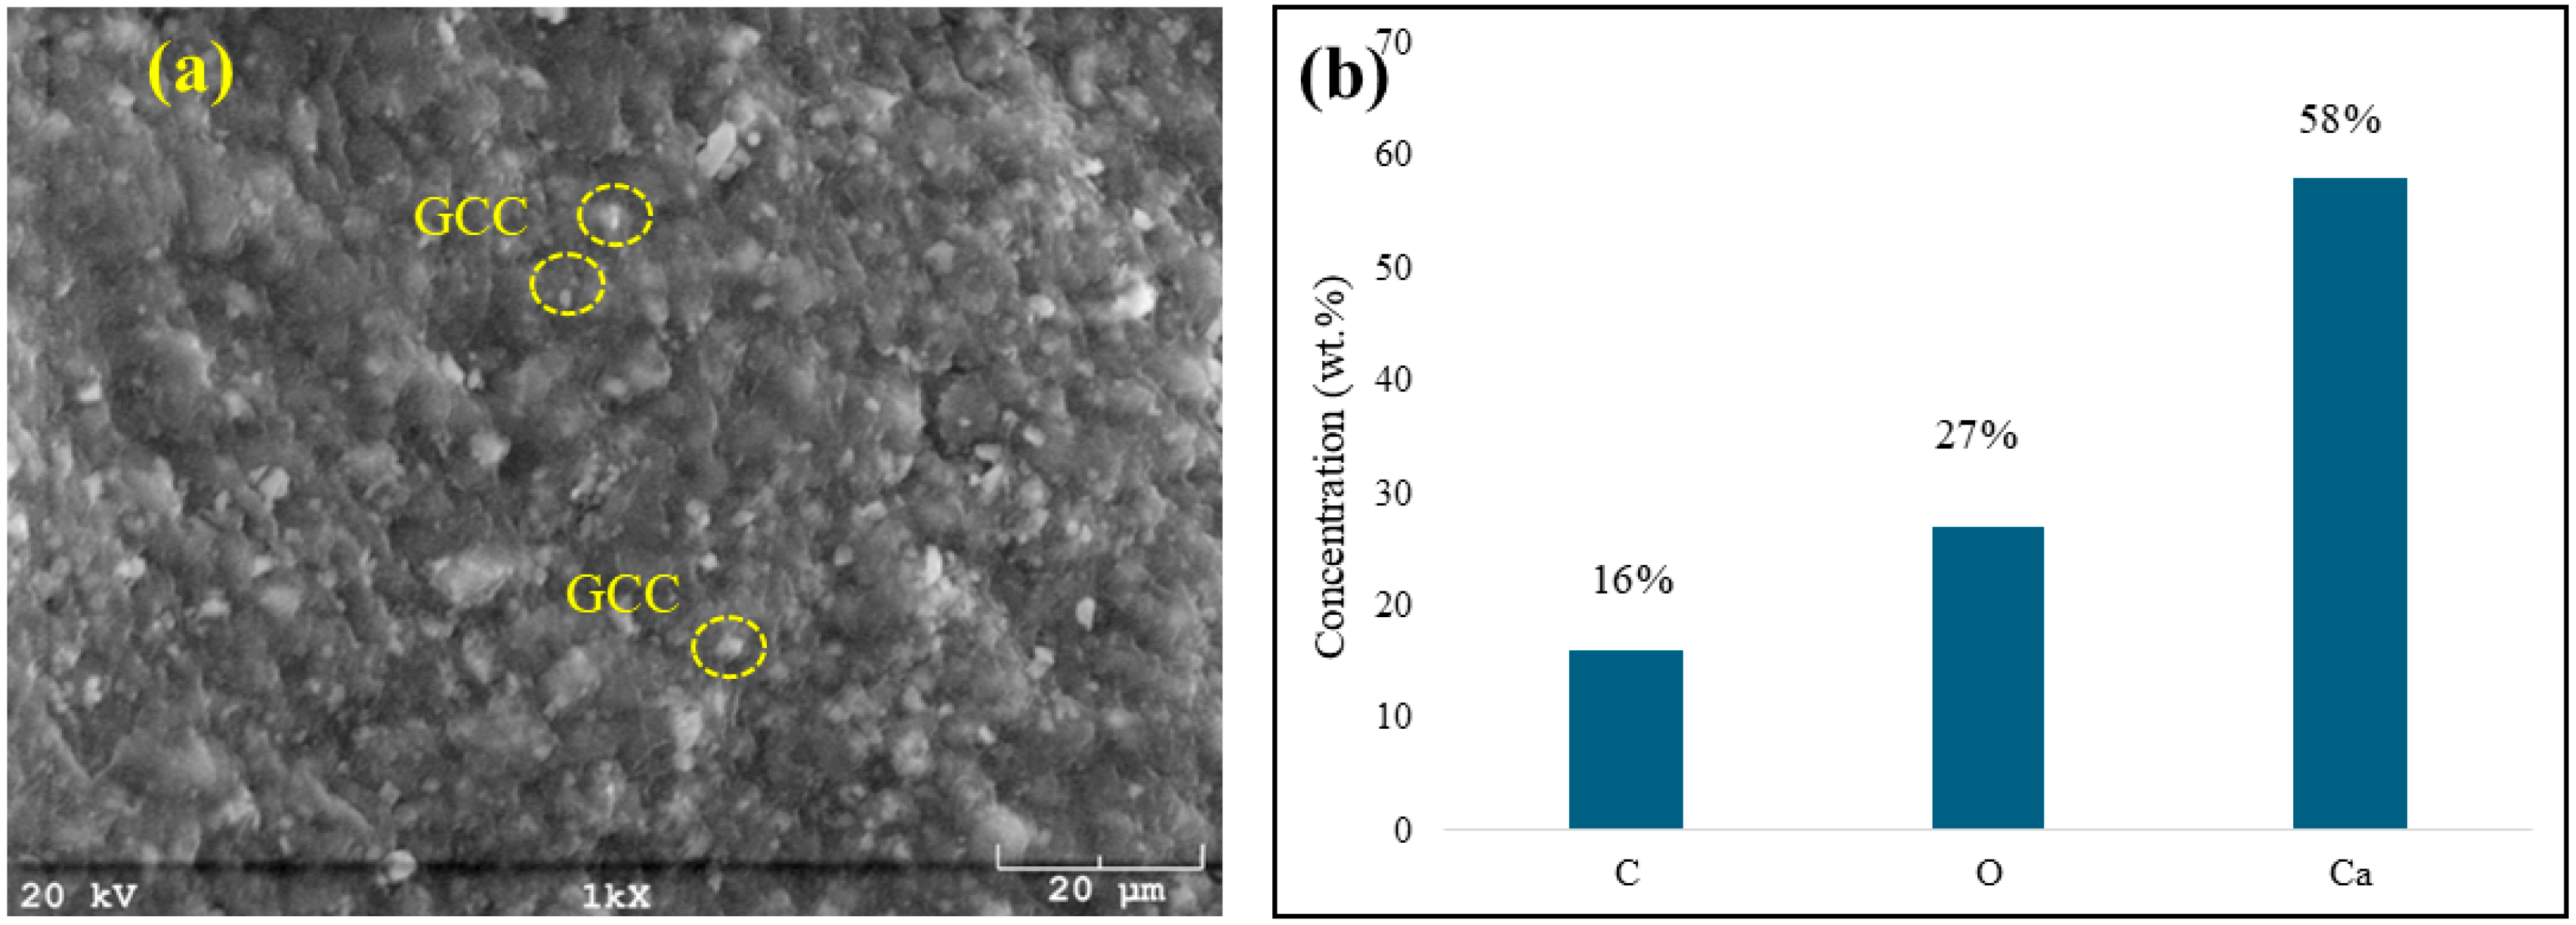
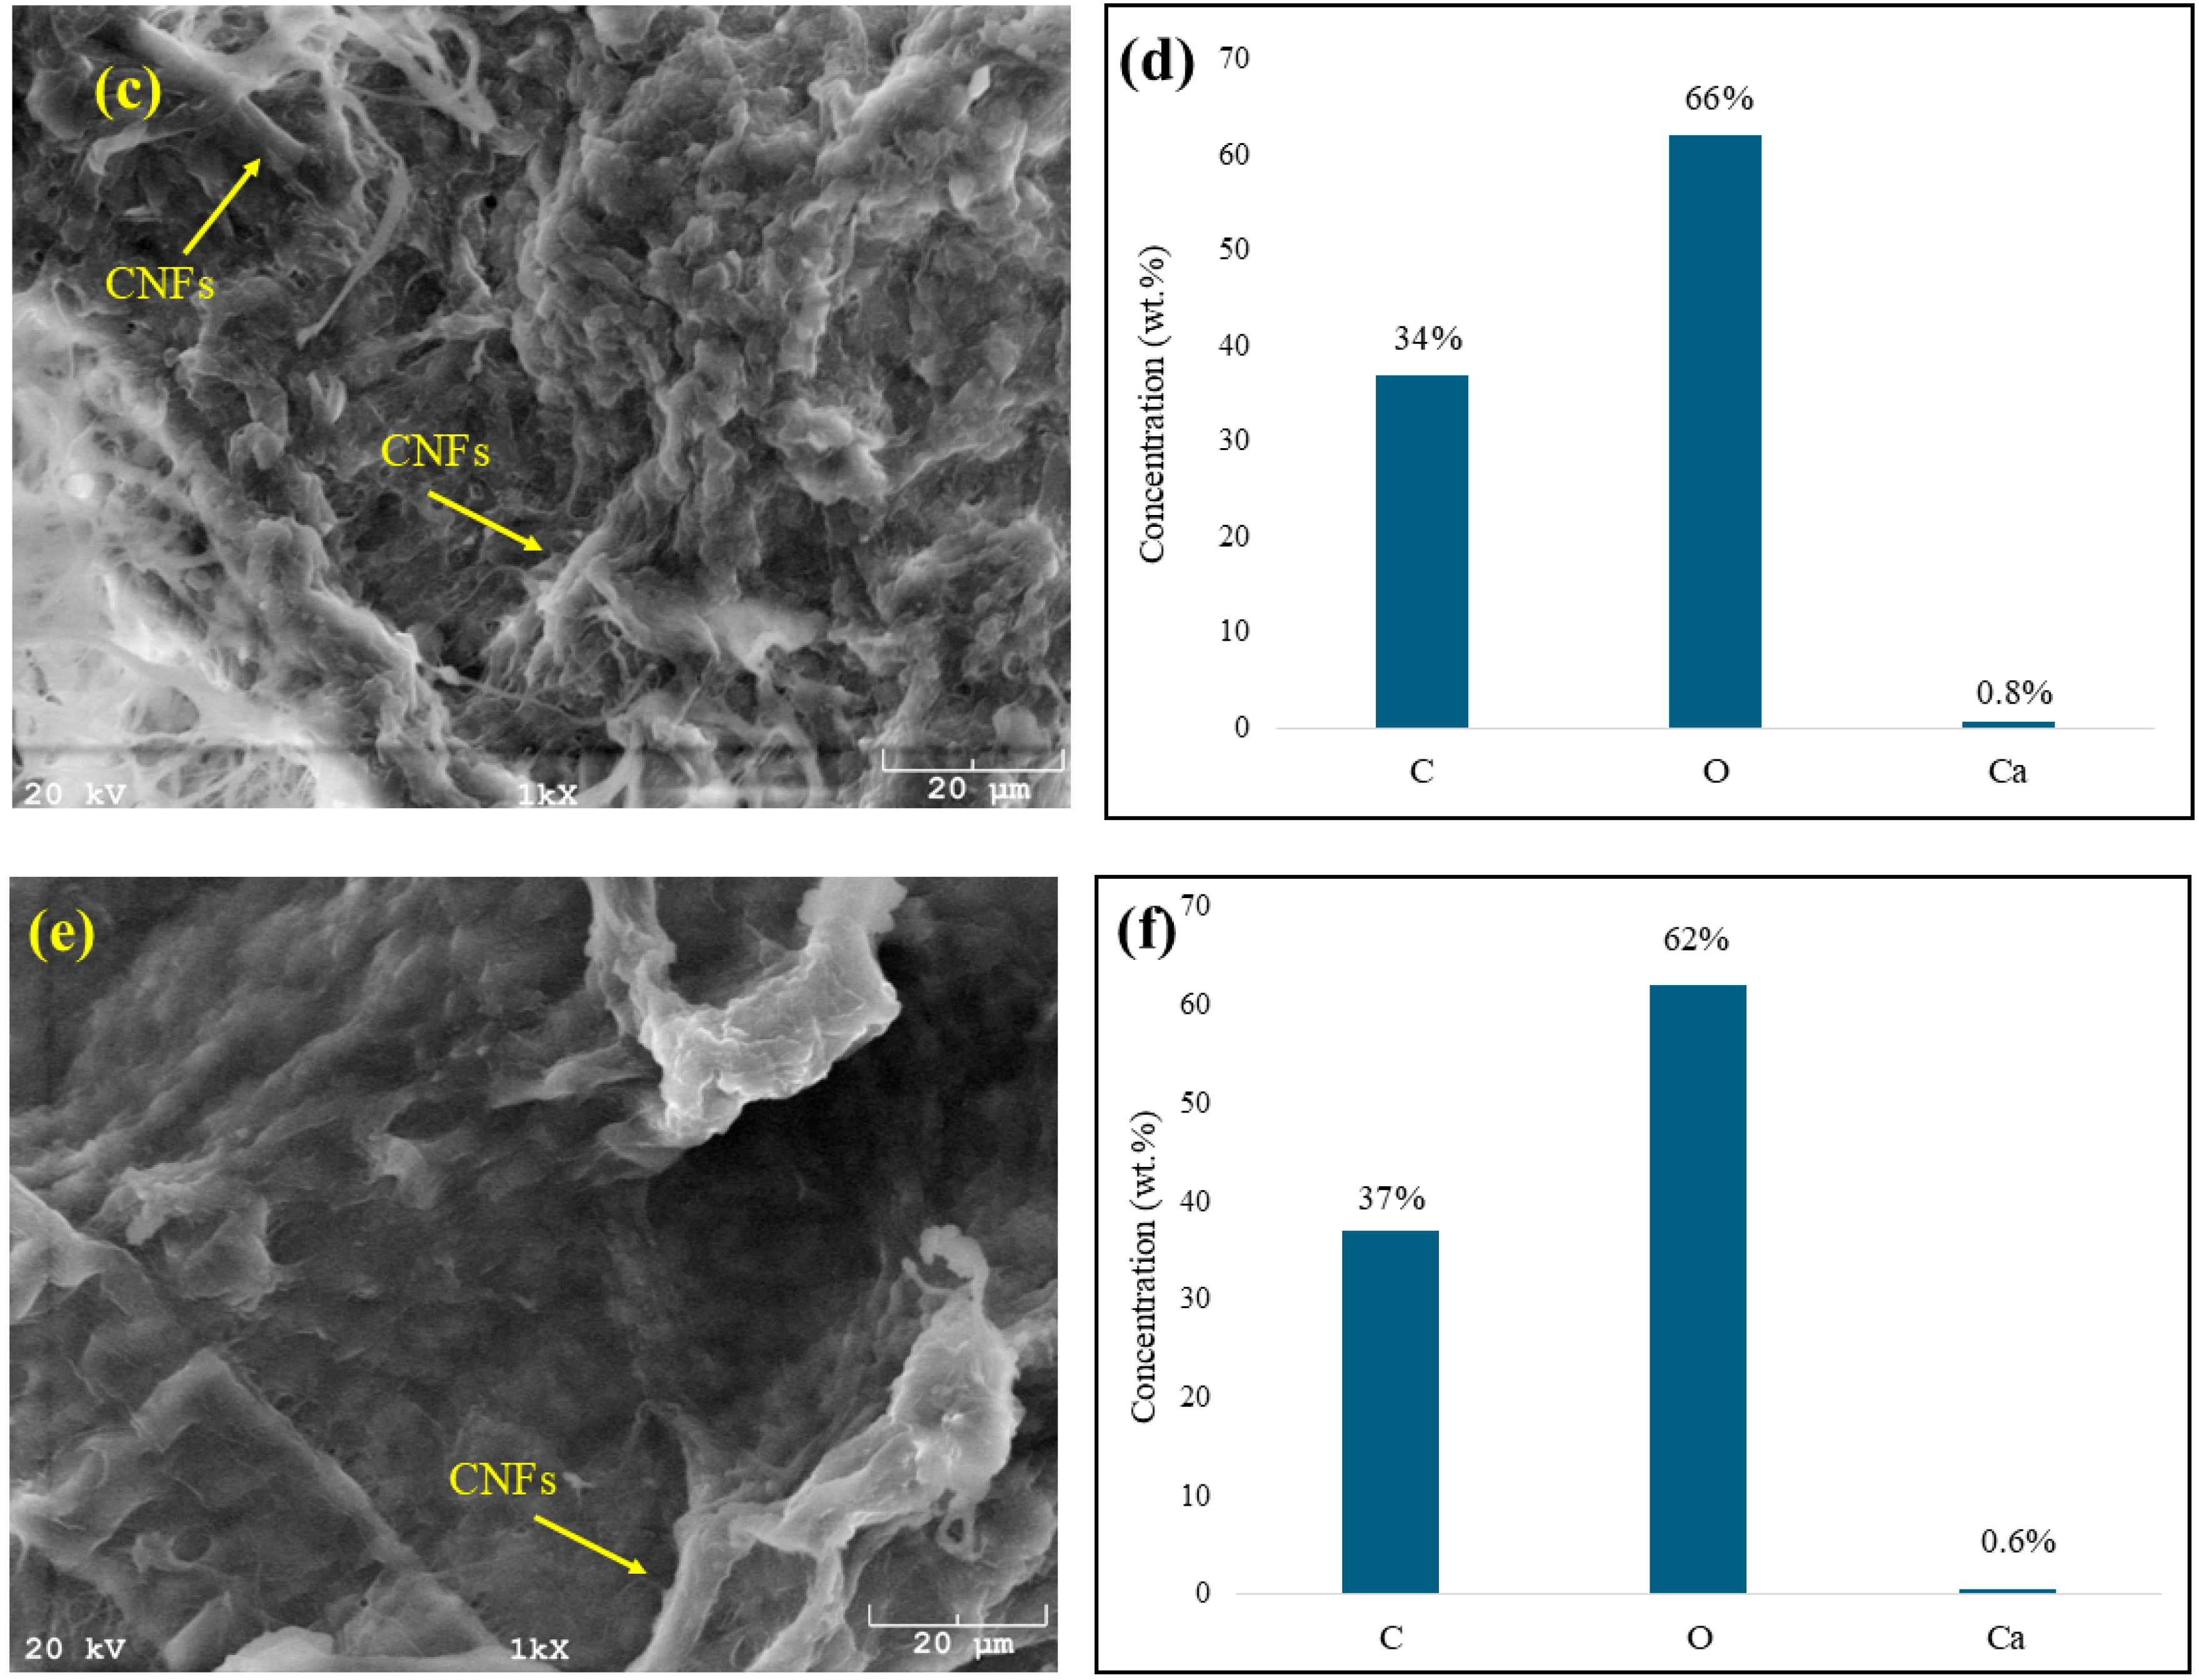
The elemental analysis obtained by EDS for the dewatered 0.5GA suspension, the rehydrated 0.5GA suspension after GCC removal, and the original supplied 3 wt.% CNF suspension are shown in Figure 8a–f, respectively. Figure 8a,c,e show the SEM images and Figure 8b,d,f show the elemental analysis for carbon, oxygen, and calcium present in each sample.
Figure 8.
(a) SEM image of dewatered 0.5GA suspension before GCC removal; (b) elemental analysis of dewatered 0.5GA; (c) SEM image of rehydrated 0.5GA after GCC removal; (d) elemental analysis of rehydrated 0.5GA; (e) SEM image of 3 wt.% CNF suspension; (f) elemental analysis of 3 wt.% CNF suspension.
For the dewatered 0.5GA suspension, the CNFs and GCC were in a 1:1 ratio, and thus the Ca concentration in the sample shows 58 wt.% (Figure 8b). Figure 8a shows the corresponding SEM image for this sample at 1kx magnification, and spherical GCC particles are observed; however, no individual CNFs are observed because they are adsorbed on the GCC. After washing with HCl, the concentration of Ca in the sample drops to 0.8 wt.% (Figure 8d), and the corresponding SEM image (Figure 8c) shows the fibrous CNFs, indicating that the GCC has been removed. The SEM image of dried CNFs from the original 3 wt.% CNF suspension (Figure 8e) shows aggregated CNFs, which are not observed using our process as shown in Figure 8.
3.10. X-Ray Diffraction (XRD)
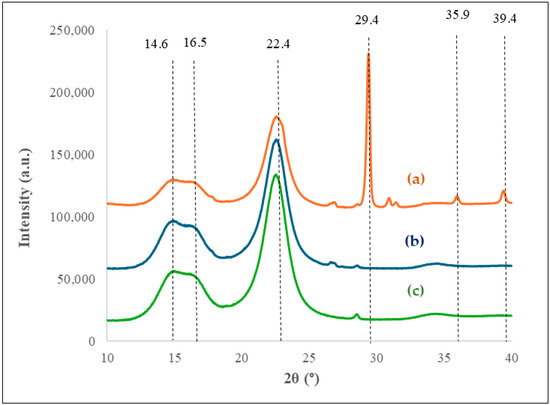
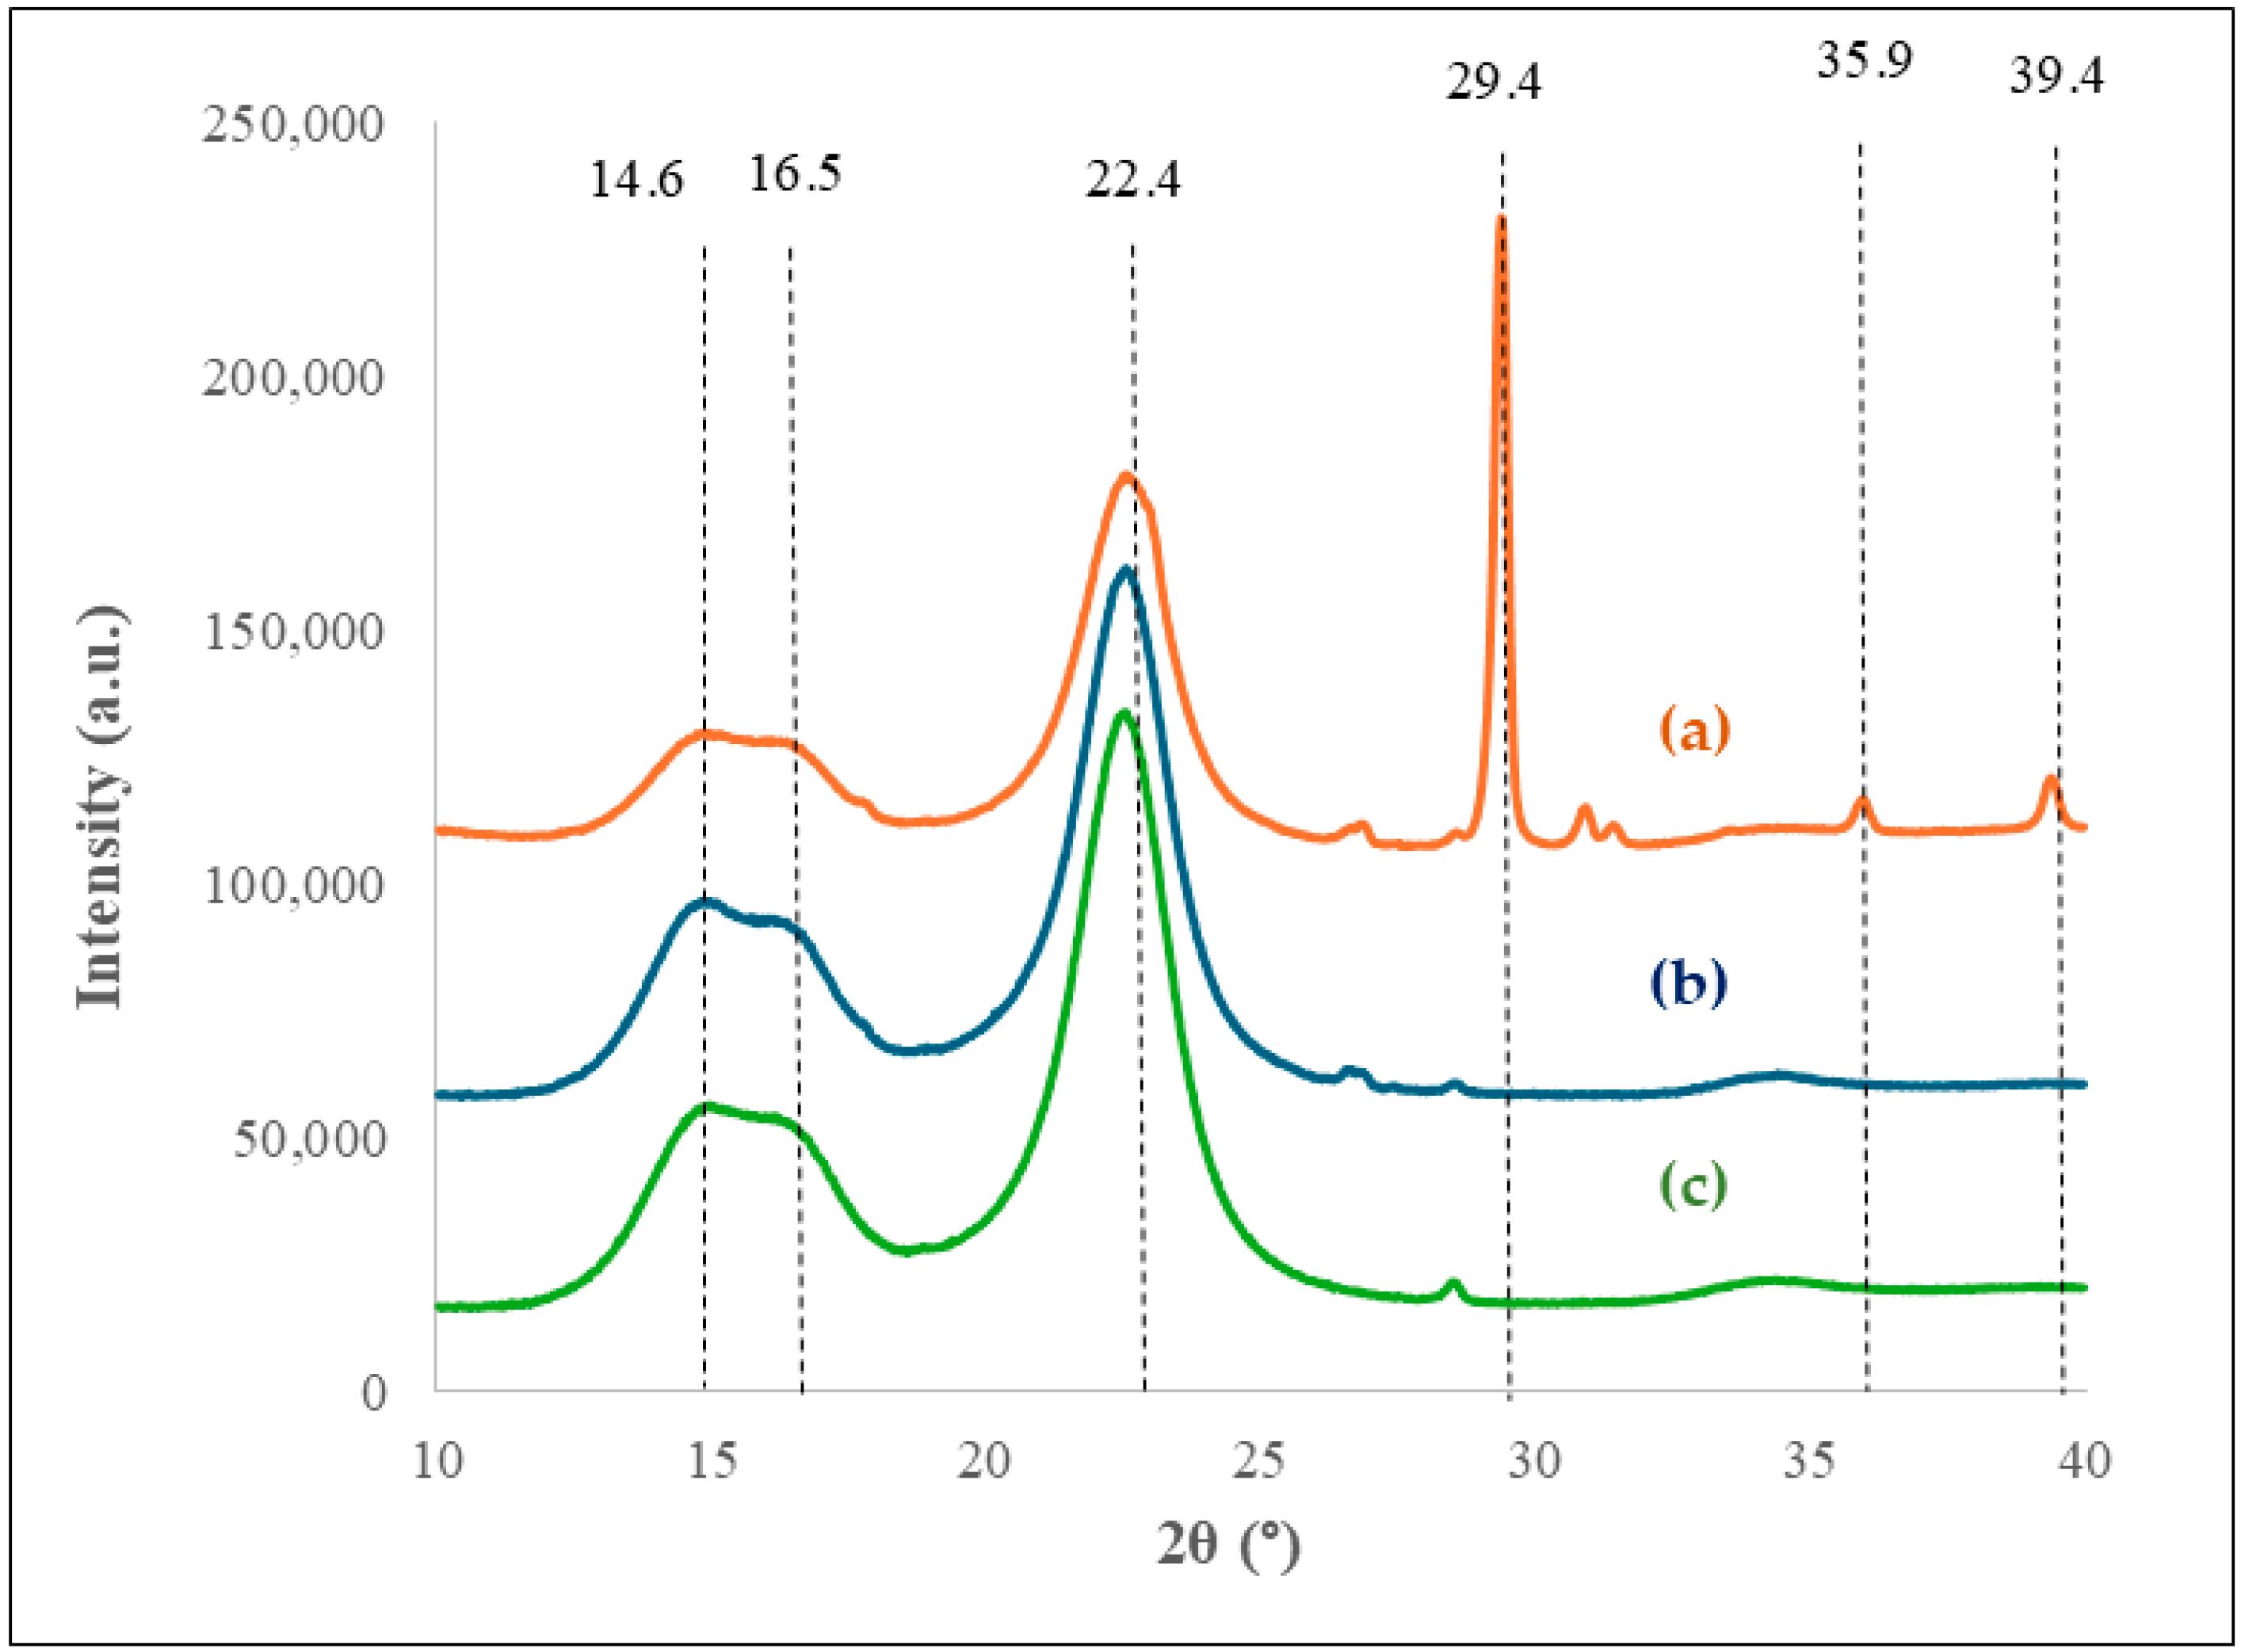
Figure 9 shows the XRD patterns for (a) the dewatered 0.5GA suspension, (b) the rehydrated 0.5GA suspension after GCC removal, and (c) the original supplied 3 wt.% CNF suspension. All patterns show characteristic diffraction peaks of 2θ at 14.6, 16.5, and 22.4° which correspond to the 1̅10, 110, 200 crystalline planes of cellulose [32], indicating that the crystallinity of cellulose did not change after the addition of GCC and after the removal of GCC with 1 M HCl. CaCO3 has a distinct peak at 29.4° which corresponds to the 104 crystalline plane for calcite. There are also minor peaks at 35.9° and 39.4°, corresponding to the 110 and 113 planes for calcite [33]. These peaks are observed in Figure 9(a), which shows the XRD pattern for the dewatered 0.5GA suspension, indicating that GCC is present in this sample. However, after HCl washing, the calcite peaks disappear, indicating the removal of GCC using our process. The small peak around 28.5° in Figure 9(c) could be due to mineral contamination in the cellulose slurry. The small peak around 26.5° observed in Figure 9(a,b) could be due to an impurity in the GCC, as the data sheet indicates that it is only 98% GCC. The data sheet states that the main impurity in the system is MgCO3; however, this does not align with the peak at 26.5°. Consistent with the IR spectra shown in Figure 5, the concentrations of calcium, carbon, and oxygen in the control sample are within 0.2, 3, and 4% as the concentrations in the acid-washed sample, confirming that the GCC has been removed.
Figure 9.
XRD patterns for (a) dewatered 0.5GA suspension, (b) rehydrated 0.5GA suspension after GCC removal, (c) original supplied 3 wt.% CNF suspension.
4. Conclusions
We show a proof of concept for a contact dewatering method using CaCO3 as a dissolvable pigment as the CaCO3 can be removed after dewatering by washing the suspension with acidified water. At 0.5 wt.% CNFs, two times more CNFs per 100 g dewatered sample were obtained when performing dewatering press cycles with CaCO3 compared to without CaCO3. The dewatered 0.5GA suspension was rehydrated back to 3 wt.% CNFs after acid washing and had the same fiber sizes as those measured for the original supplied 3 wt.% CNF suspension. The EDS and XRD data indicate that all CaCO3 was removed after acid washing, and SEM images of the rehydrated 0.5GA suspension show that nano-dimensional fibers were retained during the dewatering and rehydration processes. This indicates that our dewatering method does not cause irreversible fiber agglomeration and thus is a viable method for lowering the shipping costs of CNF suspensions.
Supplementary Materials
The following supporting information can be downloaded at https://www.mdpi.com/article/10.3390/suschem7030041/s1, Figure S1: Example SEM image of CNFs with grid overlaid by ImageJ software for fiber dimension analysis; Figure S2: Example SEM image of CNFs with grid overlaid by ImageJ software for fiber length analysis; Figure S3: Solubility curve for CaCO3 at varying pH.
Author Contributions
Writing—original draft preparation, A.M.; investigation and validation, A.M., A.L., E.H. and D.S.; writing—review and editing, conceptualization, and supervision, C.P.T. All authors have read and agreed to the published version of the manuscript.
Funding
This material is based upon work supported by the Department of Agriculture, Agricultural Research Service, under agreement No. 58-0204-4-004. Any opinions, findings, conclusions or recommendations expressed in this publication are those of the authors and do not necessarily reflect the view of the Department of Agriculture.
Institutional Review Board Statement
Not applicable.
Informed Consent Statement
Not applicable.
Data Availability Statement
The original contributions presented in this study are included in the article/Supplementary Materials. Further inquiries can be directed to the corresponding author.
Acknowledgments
We would like to acknowledge Emma Perry and the Electron Microscopy Laboratory at the University of Maine for assistance with the SEM images and EDS analysis. We would also like to acknowledge Henry S. Carfagno and the Frontier Institute for Research in Sensor Technologies (FIRST) and CORE Microfabrication Cleanroom Core Facility at the University of Maine for assistance with the XRD data.
Conflicts of Interest
The authors declare no conflicts of interest.
References
- Samir, M.; Alloin, F.; Dufresne, A. Review of recent research into cellulosic whiskers, their properties and their application in nanocomposite field. Biomacromolecules 2005, 6, 612–626. [Google Scholar] [CrossRef] [Scilit] [PubMed]
- Moon, R.J.; Martini, A.; Nairn, J.; Simonsen, J.; Youngblood, J. Cellulose nanomaterials review: Structure, properties and nanocomposites. Chem. Soc. Rev. 2011, 40, 3941–3994. [Google Scholar] [CrossRef] [Scilit] [PubMed]
- Zhang, W.; Chen, B.; Zhao, H.; Yu, P.; Fu, D.; Wen, J.; Peng, X. Processing and characterization of supercritical CO2 batch foamed poly (lactic acid)/poly (ethylene glycol) scaffold for tissue engineering application. J. Appl. Polym. Sci. 2013, 130, 3066–3073. [Google Scholar] [CrossRef] [Scilit]
- Trache, D.; Tarchoun, A.F.; Derradji, M.; Hamidon, T.S.; Masruchin, N.; Brosse, N.; Hussin, M.H. Nanocellulose: From fundamentals to advanced applications. Front. Chem. 2020, 8, 392. [Google Scholar] [CrossRef] [Scilit] [PubMed]
- Dias, O.A.T.; Konar, S.; Leão, A.L.; Yang, W.; Tjong, J.; Sain, M. Current state of applications of nanocellulose in flexible energy and electronic devices. Front. Chem. 2020, 8, 420. [Google Scholar] [CrossRef] [Scilit] [PubMed]
- Wang, J.; Gardner, D.J.; Stark, N.M.; Bousfield, D.W.; Tajvidi, M.; Cai, Z. Moisture and oxygen barrier properties of cellulose nanomaterial-based films. ACS Sustain. Chem. Eng. 2018, 6, 49–70. [Google Scholar]
- Qin, S.; Pour, M.G.; Lazar, S.; Köklükaya, O.; Gerringer, J.; Song, Y.; Wågberg, L.; Grunlan, J.C. Super gas barrier and fire resistance of nanoplatelet/nanofibril multilayer thin films. Adv. Mater. Interfaces 2019, 6, 1801424. [Google Scholar] [CrossRef] [Scilit]
- Tyagi, P.; Lucia, L.A.; Hubbe, M.A.; Pal, L. Nanocellulose-based multilayer barrier coatings for gas, oil, and grease resistance. Carbohydr. Polym. 2019, 206, 281–288. [Google Scholar] [CrossRef] [Scilit] [PubMed]
- Gumowska, A.; Kowaluk, G.; Labidi, J.; Robles, E. Barrier properties of cellulose nanofiber film as an external layer of particleboard. Clean Technol. Environ. Policy 2019, 21, 2073–2079. [Google Scholar] [CrossRef] [Scilit]
- Trifol, J.; Moriana, R. Barrier packaging solutions from residual biomass: Synergetic properties of CNF and LCNF in films. Ind. Crops Prod. 2022, 177, 114493. [Google Scholar] [CrossRef] [Scilit]
- Rao, P.D. Charged-Particle Interactions to Generate Novel Coatings and Materials; The University of Maine: Orono, ME, USA, 2022. [Google Scholar]
- El Awad Azrak, S.M.; Clarkson, C.M.; Moon, R.J.; Schueneman, G.T.; Youngblood, J.P. Wet-stacking lamination of multilayer mechanically fibrillated cellulose nanofibril (CNF) sheets with increased mechanical performance for use in high-strength and lightweight structural and packaging applications. ACS Appl. Polym. Mater. 2019, 1, 2525–2534. [Google Scholar] [CrossRef] [Scilit]
- Nakamura, K.; Hatakeyama, T.; Hatakeyama, H. Studies on bound water of cellulose by differential scanning calorimetry. Text. Res. J. 1981, 51, 607–613. [Google Scholar] [CrossRef] [Scilit]
- Sinquefield, S.; Ciesielski, P.N.; Li, K.; Gardner, D.J.; Ozcan, S. Nanocellulose dewatering and drying: Current state and future perspectives. ACS Sustain. Chem. Eng. 2020, 8, 9601–9615. [Google Scholar] [CrossRef] [Scilit]
- Brodin, F.W.; Gregersen, Ø.W.; Syverud, K. Cellulose nanofibrils: Challenges and possibilities as a paper additive or coating material—A review. Nord. Pulp Pap. Res. J. 2014, 29, 156–166. [Google Scholar] [CrossRef] [Scilit]
- Peng, Y.; Gardner, D.J.; Han, Y.; Kiziltas, A.; Cai, Z.; Tshabalala, M.A. Influence of drying method on the material properties of nanocellulose I: Thermostability and crystallinity. Cellulose 2013, 20, 2379–2392. [Google Scholar] [CrossRef] [Scilit]
- Peng, Y.; Gardner, D.J.; Han, Y. Drying cellulose nanofibrils: In search of a suitable method. Cellulose 2012, 19, 91–102. [Google Scholar] [CrossRef] [Scilit]
- Zha, L.; Wang, S.; Berglund, L.A.; Zhou, Q. Mixed-linkage (1,3;1,4)-β-d-glucans as rehydration media for improved redispersion of dried cellulose nanofibrils. Carbohydr. Polym. 2023, 300, 120276. [Google Scholar] [CrossRef] [Scilit] [PubMed]
- Moberg, T.; Sahlin, K.; Yao, K.; Geng, S.; Westman, G.; Zhou, Q.; Oksman, K.; Rigdahl, M. Rheological properties of nanocellulose suspensions: Effects of fibril/particle dimensions and surface characteristics. Cellulose 2017, 24, 2499–2510. [Google Scholar] [CrossRef] [Scilit]
- Han, J.; Zhou, C.; Wu, Y.; Liu, F.; Wu, Q. Self-assembling behavior of cellulose nanoparticles during freeze-drying: Effect of suspension concentration, particle size, crystal structure, and surface charge. Biomacromolecules 2013, 14, 1529–1540. [Google Scholar] [CrossRef] [Scilit] [PubMed]
- Peng, Y.; Han, Y.; Gardner, D.J. Spray-drying cellulose nanofibrils: Effect of drying process parameters on particle morphology and size distribution. Wood Fiber Sci. 2012, 44, 448–461. [Google Scholar]
- Rantanen, J.; Maloney, T.C. Consolidation and dewatering of a microfibrillated cellulose fiber composite paper in wet pressing. Eur. Polym. J. 2015, 68, 585–591. [Google Scholar] [CrossRef] [Scilit]
- Ringania, U.; Harrison, J.; Moon, R.J.; Bhamla, M.S. Dewatering of cellulose nanofibrils using ultrasound. Cellulose 2022, 29, 5575–5591. [Google Scholar] [CrossRef] [Scilit]
- Amini, E.; Tajvidi, M.; Bousfield, D.W.; Gardner, D.J.; Shaler, S.M. Dewatering behavior of a wood-cellulose nanofibril particulate system. Sci. Rep. 2019, 9, 14584. [Google Scholar] [CrossRef] [Scilit] [PubMed]
- Manley, A.; Tripp, C.P. Supercritical CO2 solvent exchange and removal of water from dispersed cellulose nanofiber/polylactic acid composites without an alcohol exchange step. Cellulose 2023, 30, 10999–11012. [Google Scholar] [CrossRef] [Scilit]
- Manley, A.; Es-haghi, S.S.; Tripp, C.P. Rheological and mechanical properties of dispersed cellulose nanofiber/polylactic acid composites produced by a liquid-supercritical CO2 water removal process. Cellulose 2026, 33, 189–201. [Google Scholar] [CrossRef] [Scilit]
- Rao, P.D.; Bousfield, D.W.; Tripp, C.P. Influence of electrostatic interactions on the dewatering and mechanical properties of cellulose nanofiber/precipitated calcium carbonate composite films. Cellulose 2022, 29, 4919–4930. [Google Scholar] [CrossRef] [Scilit]
- Hart, P.W.; Colson, G.W.; Burris, J. Application of carbon dioxide to reduce water-side lime scale in heat exchangers. Pulp Pap. Can. 2013, 114, 21–24. [Google Scholar]
- Goss, S.L.; Lemons, K.A.; Kerstetter, J.E.; Bogner, R.H. Determination of calcium salt solubility with changes in pH and PCO2, simulating varying gastrointestinal environments. J. Pharm. Pharmacol. 2007, 59, 1485–1492. [Google Scholar] [CrossRef] [Scilit] [PubMed]
- Rao, P.D.; Bousfield, D.W.; Tripp, C.P. The use of an all-cationic coating formulation to reduce the amount of latex in paper coatings. Colloid Polym. Sci. 2023, 301, 303–312. [Google Scholar] [CrossRef] [Scilit]
- Collins, A.; Tajvidi, M. Contact-dewatered cellulose nanomaterials for reinforced biopolymer composites. Mater. Today Commun. 2022, 31, 103443. [Google Scholar] [CrossRef] [Scilit]
- Senevirathne, V.; Tajvidi, M.; Carfagno, H.S.; Tripp, C.P. The Reaction of Cellulose Nanofibrils with Silanes in the Gas Phase and in Supercritical CO2. Langmuir 2026, 23, 16359–16368. [Google Scholar] [CrossRef] [Scilit] [PubMed]
- Mougkogiannis, P.; Adamatzky, A. Protocell Computing on Aragonite Substrates. ACS Omega 2026, 3, 4362–4398. [Google Scholar] [CrossRef] [Scilit] [PubMed]



Disclaimer/Publisher’s Note: The statements, opinions and data contained in all publications are solely those of the individual author(s) and contributor(s) and not of MDPI and/or the editor(s). MDPI and/or the editor(s) disclaim responsibility for any injury to people or property resulting from any ideas, methods, instructions or products referred to in the content. |
© 2026 by the authors. Licensee MDPI, Basel, Switzerland. This article is an open access article distributed under the terms and conditions of the Creative Commons Attribution (CC BY) license.