


Abstract
Electrochemical conversion of carbon dioxide (CO2) to ethanol offers a potential route for integrating carbon utilization with low-carbon electricity; however, its environmental performance is governed by the complete process system rather than by catalytic selectivity alone. This study presents a detailed attributional cradle-to-gate life cycle assessment of anion-exchange-membrane (AEM) and bipolar-membrane (BPM) electrolyzer systems using a functional unit of 1 kg of ethanol at the plant gate. The foreground inventory combines stoichiometric balances, peer-reviewed electrochemical evidence, process-energy estimates, and transparent engineering assumptions, while background processes are represented using ecoinvent 3.7.1. Climate-change impacts are evaluated with the IPCC 2021 100-year global warming potential method. The modeled AEM and BPM systems require 23.32 and 27.92 kWh of electricity per kilogram of ethanol, respectively. Wind-powered operation yields the lowest reported impacts, at 0.318 kg CO2-eq kg−1 ethanol for AEM and 0.442 kg CO2-eq kg−1 for BPM. Photovoltaic scenarios yield 1.812 and 2.231 kg CO2-eq kg−1, whereas the Austrian-grid scenarios yield 1.349 and 4.686 kg CO2-eq kg−1, respectively. Electricity supply is the dominant environmental driver, while separation heat, carbon utilization, component lifetime, and oxygen co-product treatment remain important secondary parameters. The BPM Austrian-grid result is disproportionately high relative to the 19.7% increase in modeled electricity demand and therefore requires exchange-level verification before it can be interpreted as a physical membrane effect. Overall, environmentally credible CO2-to-ethanol deployment requires low-carbon electricity, reduced cell voltage, efficient carbon management, concentrated product streams, durable components, and transparent co-product accounting.
1. Introduction
Anthropogenic greenhouse gas emissions have increased the urgency of developing technologies that can simultaneously reduce fossil-carbon use and manage unavoidable CO2 streams. Deep decarbonization requires rapid emissions reduction, expansion of low-carbon electricity, and, where appropriate, carbon capture, storage, and utilization pathways [1,2]. Carbon capture and utilization (CCU) is not inherently climate beneficial: its performance depends on the source and capture burden of CO2, the energy system, conversion efficiency, product lifetime, and the fossil product that is displaced. Nevertheless, CCU can contribute to circular-carbon strategies when captured CO2 is converted into products using low-emission energy and when the resulting system is evaluated over a transparent life-cycle boundary [3,4,5].
Electrochemical CO2 reduction (CO2RR) is attractive because it can operate at relatively mild temperatures and pressures and can be dynamically coupled with renewable power. Modern gas-diffusion electrodes and membrane-electrode-assembly reactors enable current densities far above those of conventional aqueous H-cells, but they also introduce mass-transfer limitations, electrolyte-management requirements, flooding and salt-precipitation risks, and demanding scale-up constraints [6,7,8]. The environmental and economic viability of CO2 electrolysis therefore depends not only on catalyst selectivity but also on full-cell voltage, Faradaic efficiency, current density, single-pass conversion, carbon efficiency, product concentration, stability, and the energy needed for downstream separation [9,10].
Ethanol is a particularly relevant CO2RR product because it is a liquid at ambient conditions; has an established market as a fuel component, solvent, and chemical intermediate; and can be handled with existing storage and distribution infrastructure. Its electrochemical formation is nevertheless challenging because the reaction requires carbon–carbon coupling and a complex sequence of proton-coupled electron-transfer steps. Copper remains the principal catalyst family capable of producing appreciable C2+ products, and research has focused on oxide-derived copper, nanostructured copper, bimetallic interfaces, grain-boundary engineering, tandem catalysis, wettability control, and electrolyte-microenvironment design [11,12,13,14,15,16].
Recent studies have clarified the roles of Cu–Ag interfaces, Cu(I)/Cu(0) boundaries, adsorbed intermediates, and local water-to-CO2 ratios in steering selectivity between ethylene and ethanol [17,18,19,20,21,22]. Other approaches include Cu/Au heterojunctions, Cu–Zn and Cu–Ni systems, cobalt-containing catalysts, nitrogen-doped carbon supports, and machine-learning-guided operating-window selection [23,24,25,26,27,28]. High reported ethanol selectivity in specialized catalyst architectures is scientifically important, but the translation of laboratory performance into a low-impact process also requires stable gas-diffusion electrodes, commercially relevant current density, low cell voltage, limited crossover, high carbon utilization, and concentrated product streams [29,30,31,32,33].
The membrane is central to this system-level behavior. AEMs transport anionic species such as OH−, HCO3−, and CO32− and can support alkaline or near-neutral cathode environments favorable for C–C coupling. Their comparatively low ionic resistance can reduce full-cell voltage, but the reaction of cathodically generated OH− with CO2 produces carbonate species that cross the membrane and release CO2 at the anode. This pathway reduces single-pass carbon utilization and can increase the burden of CO2 recovery and recycle [34,35,36]. BPMs combine an anion-exchange layer and a cation-exchange layer. Water dissociation at the bipolar junction generates H+ and OH−, allowing distinct local pH environments and potentially improved carbon management, but the additional junction and transport resistance usually impose a voltage penalty [37,38,39].
BPM research has progressed from reverse-bias architectures toward forward-bias and pure-water-fed concepts, while membrane design has targeted lower water-dissociation overpotential, improved durability, and controlled ion transport [40,41,42,43,44]. Earlier system analyses also emphasized the trade-off between membrane-enabled carbon management and energy efficiency [45,46]. Consequently, a membrane cannot be judged from selectivity or carbon efficiency alone; its environmental value must be assessed together with cell voltage, electricity carbon intensity, CO2 recovery, separation energy, lifetime, and infrastructure requirements.
Life cycle assessment (LCA) provides the appropriate framework for integrating these foreground and background effects. Prospective LCA studies of power-to-ethanol and other electrochemical CO2 conversion routes consistently identify electricity supply, process efficiency, separation, and allocation choices as decisive parameters [47,48,49]. Techno-economic and energy analyses similarly show that the viability of electrochemical products is governed by the electricity price and carbon intensity, current density, selectivity, stack lifetime, and downstream recovery [50,51,52]. Because emerging-process data are uncertain and frequently derived from laboratory studies, transparent inventory construction and explicit uncertainty treatment are essential [53,54].
Complementary catalyst studies show that ethanol selectivity can also be altered by deliberately switching the reaction pathway and by combining gold and copper in tandem architectures. These advances reinforce the need to connect catalyst-level performance with integrated-cell voltage, carbon efficiency, stability, and product concentration when constructing prospective inventories [55,56].
This study addresses four methodological gaps. First, it establishes a harmonized foreground inventory for AEM- and BPM-based ethanol production using a common functional unit and cradle-to-gate system boundary. Second, it separates theoretical stoichiometric requirements from process-level inventory values, thereby avoiding the presentation of ideal material balances as realistic operating data. Third, it compares Austrian-grid, photovoltaic, and wind electricity scenarios under identical reporting conventions. Fourth, it applies explicit consistency checks so that genuine membrane-related differences can be distinguished from artifacts caused by exchange signs, background-dataset selection, voltage-level mismatches, or other modeling choices. The principal literature domains used to define the foreground model and support the interpretation of the results are summarized in Table 1.
Table 1.
Principal literature domains used to define the foreground model and interpret the results.
The principal objective is to quantify and interpret the cradle-to-gate climate-change impact of producing 1 kg of ethanol through electrochemical CO2 reduction in AEM and BPM electrolyzers. The specific objectives are to:
- Develop a transparent life-cycle inventory that distinguishes theoretical, process-level, and database-derived quantities;
- Compare AEM and BPM systems under harmonized material and energy assumptions;
- Evaluate the effect of Austrian-grid, photovoltaic, and wind electricity on GWP100;
- Identify the dominant environmental hotspots and explain the physical reasons for their contribution;
- Assess the methodological importance of oxygen co-product treatment, CO2 utilization, separation heat, and database linkage;
- Provide a reporting and verification framework suitable for a prospective MDPI LCA article.
2. Materials and Methods
2.1. Goal, Scope, and LCA Framework
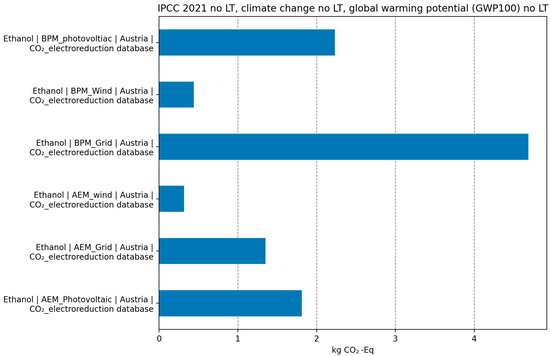
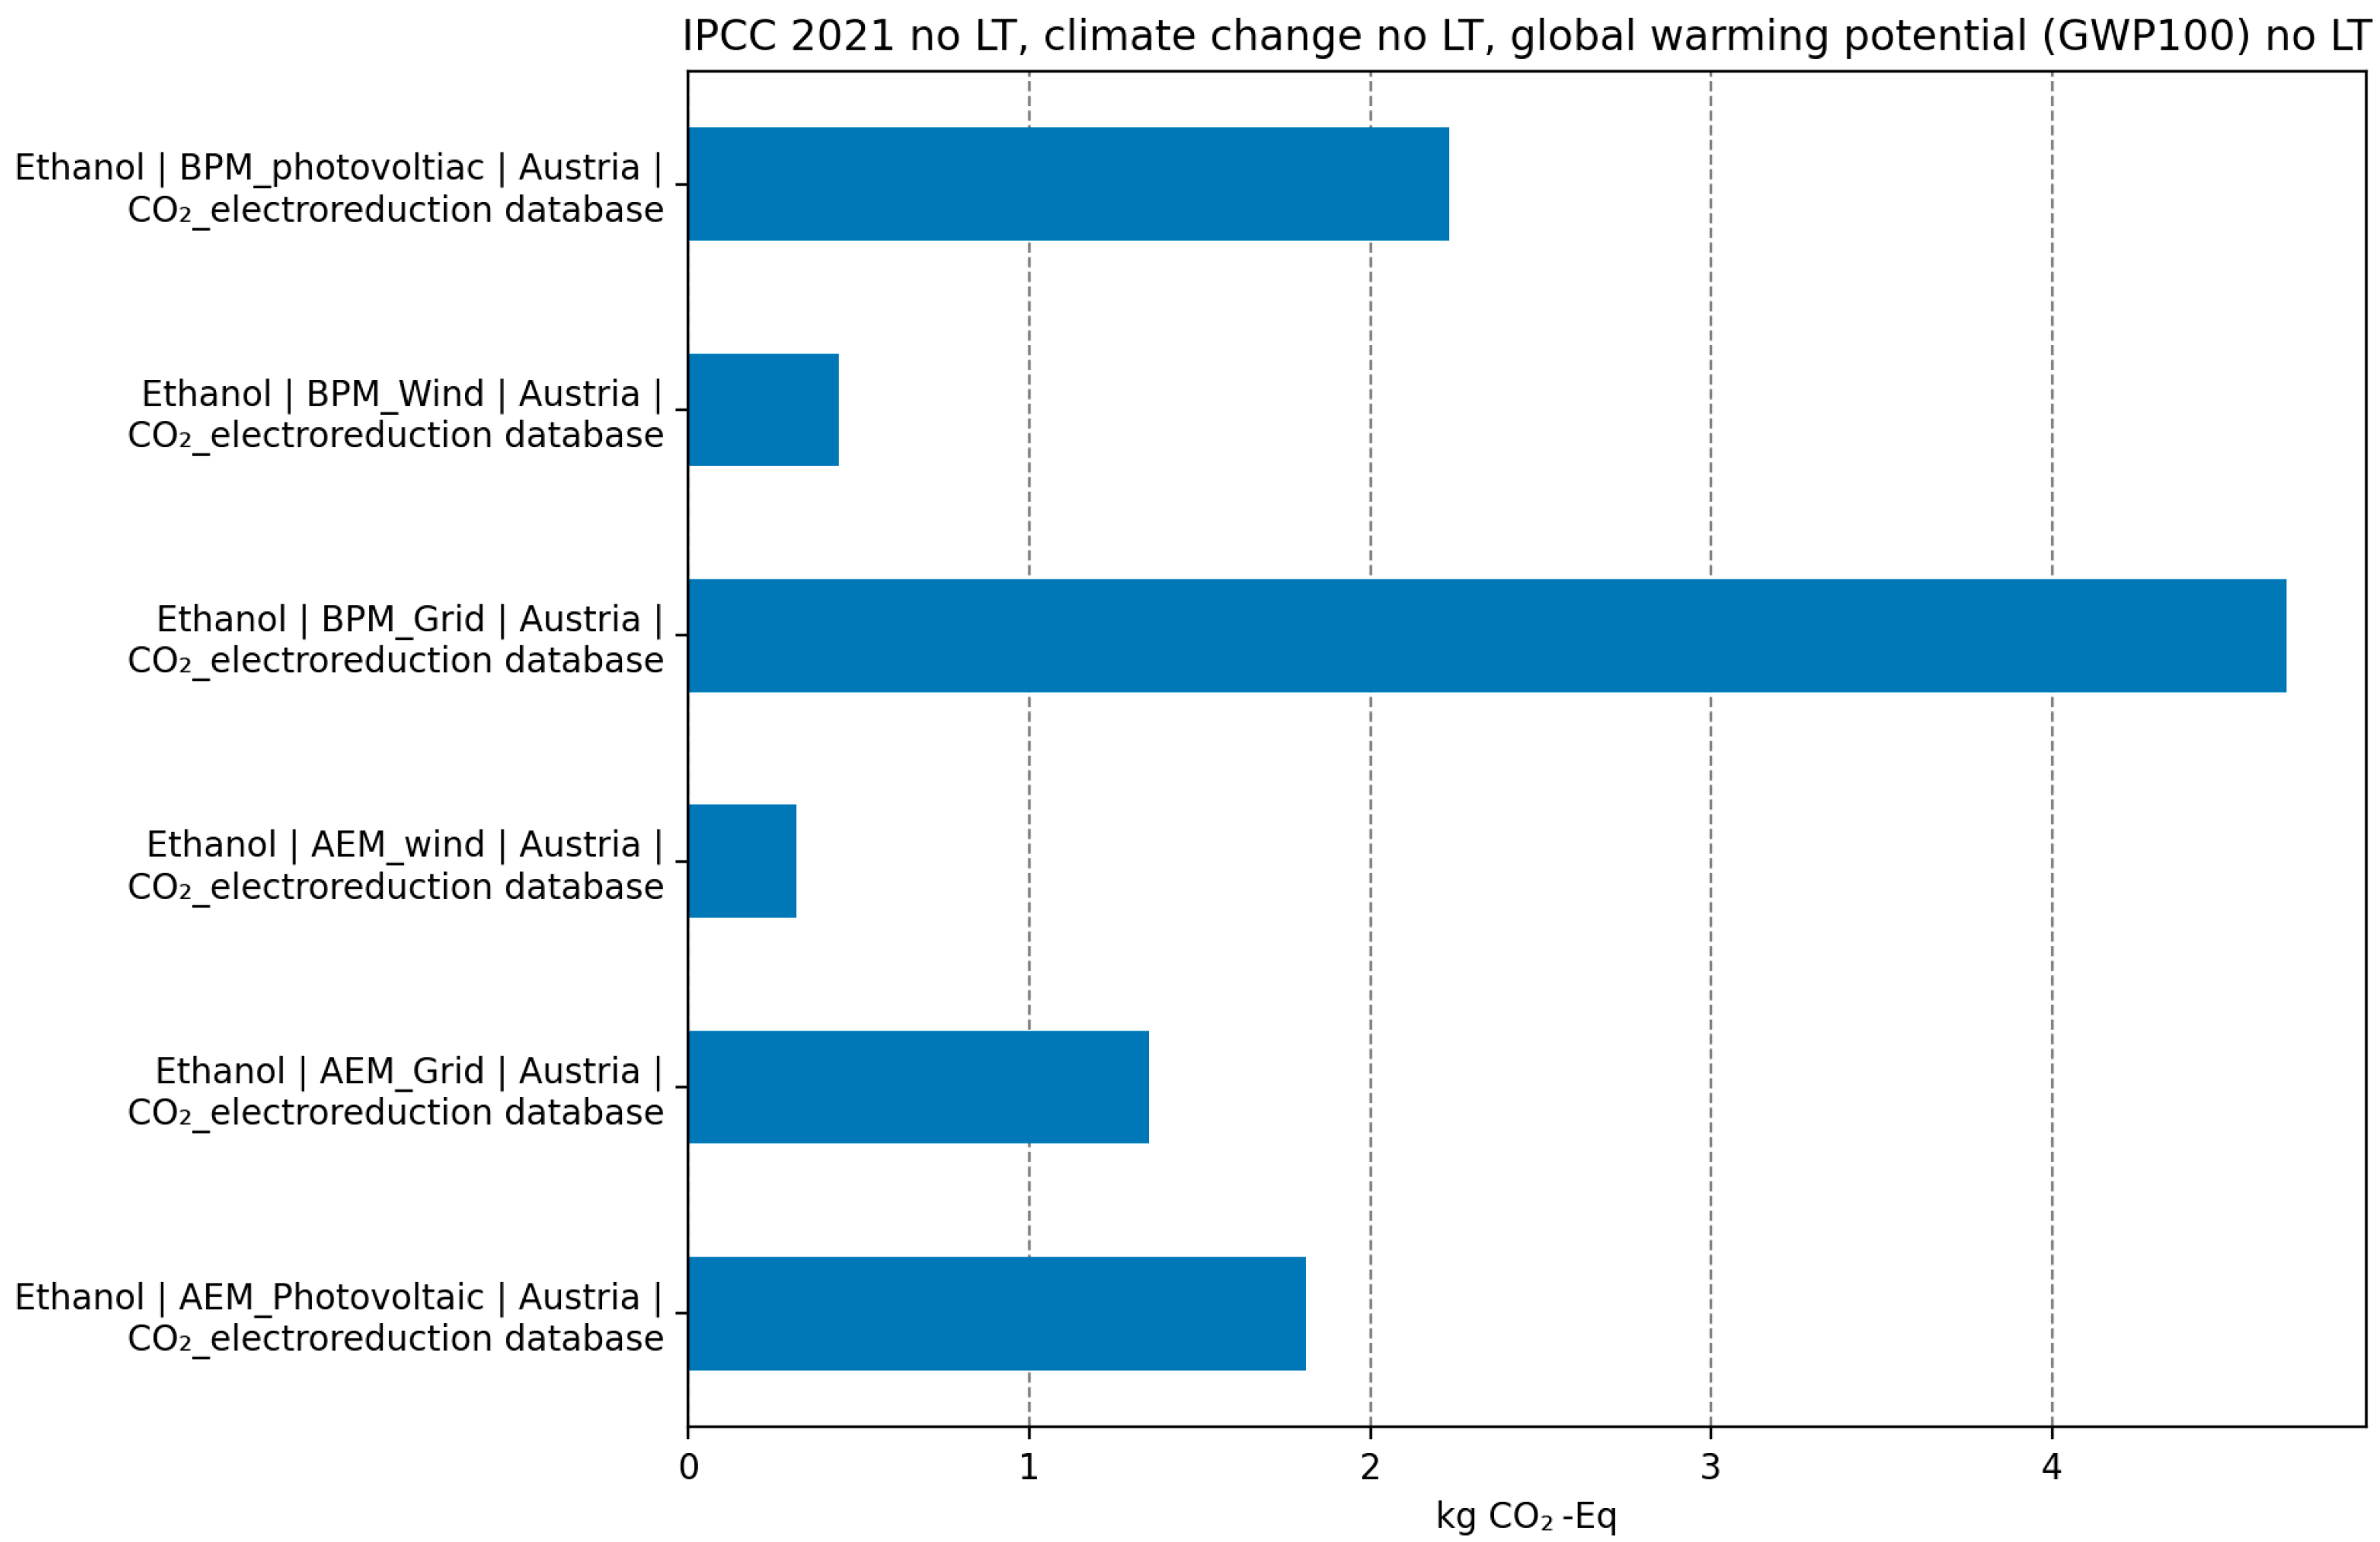
As shown in Figure 1, the global warming potential (GWP100) of CO2 electroreduction to ethanol varies substantially across electricity supply scenarios and electrolyzer configurations. The results demonstrate that the electricity source is the dominant factor influencing the climate-change performance of the process, consistent with previous life cycle assessment studies of CO2 electrolysis systems [2,10,18]. The higher impacts observed for the BPM configuration, particularly under grid-electricity conditions, are associated with its greater electricity demand compared with the AEM system. In contrast, the use of low-carbon electricity substantially reduces the GWP100 of both configurations, emphasizing electricity decarbonization and improved electrolyzer energy efficiency as key priorities for reducing the climate-change burden of electrochemical ethanol production.
Figure 1.
Global warming potential (GWP100) of CO2 electroreduction to ethanol for different electrolyzer configurations (AEM and BPM) and electricity supply scenarios in Austria. Results are expressed in kg CO2-equivalents per functional unit (1 kg ethanol). The figure highlights the dominant influence of the electricity source, with wind-based electricity resulting in the lowest climate-change impacts and grid electricity leading to the highest impacts, particularly for the BPM system.
The assessment follows the principles and requirements of ISO 14040 and ISO 14044 [57,58]. It is an attributional, prospective cradle-to-gate LCA designed to compare two emerging electrochemical configurations within a harmonized modeling framework. The intended application is to support research and process-development decisions rather than to provide an environmental product declaration. The results are therefore interpreted as prospective indicators of environmental hotspots and design priorities rather than as verified measures of commercial-scale plant performance.
The study focuses on climate-change impact because the life-cycle model was evaluated using the IPCC 2021 GWP100 method. Other environmental impact categories—including mineral-resource scarcity, water consumption, human and ecosystem toxicity, land occupation, and particulate-matter formation—remain relevant but were outside the scope of the consistently available numerical results evaluated in this study. This climate-focused scope is explicitly stated because a low GWP100 result should not be interpreted as evidence of comprehensive environmental superiority, particularly where catalysts, membranes, polymers, metals, and process chemicals may contribute to trade-offs in non-climate impact categories [53,54].
2.2. Functional Unit and Reference Flow
The functional unit is the production of 1 kg of ethanol at the plant gate through electrochemical reduction of captured CO2. All foreground inputs, background burdens, co-products, and impact results are normalized to this quantity. A mass-based functional unit permits direct comparison of membrane configurations; however, it does not represent the use-phase energy service of ethanol. Comparisons with fuels on an energy basis would require an additional functional unit, such as 1 MJ of lower heating value delivered to the user [47,48].
The reference flow is 1 kg of ethanol leaving the modeled separation and purification train. Product distribution, transport after the plant gate, combustion, and end-of-life treatment are excluded. Because the analysis is cradle-to-gate, the reported GWP values represent production-stage impacts and should not be interpreted as complete fuel-cycle emissions [47,48,51].
2.3. System Boundary
The foreground system begins with the supply of captured CO2, process and deionized water, electrolyte make-up, supporting materials, electricity, and heat. It includes electrochemical conversion in an AEM or BPM electrolyzer, the represented gas- and liquid-handling operations, electrical and thermal requirements for ethanol recovery, and oxygen generation at the anode. The system ends when the ethanol product leaves the modeled production site. Figure 1 presents the harmonized boundary, which is consistent with prospective assessments of electrochemical and power-to-ethanol pathways [47,48,49].
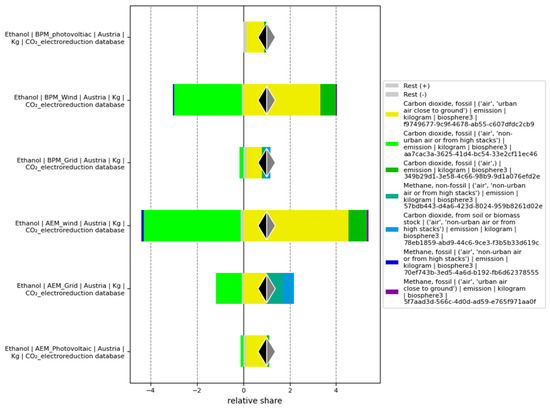
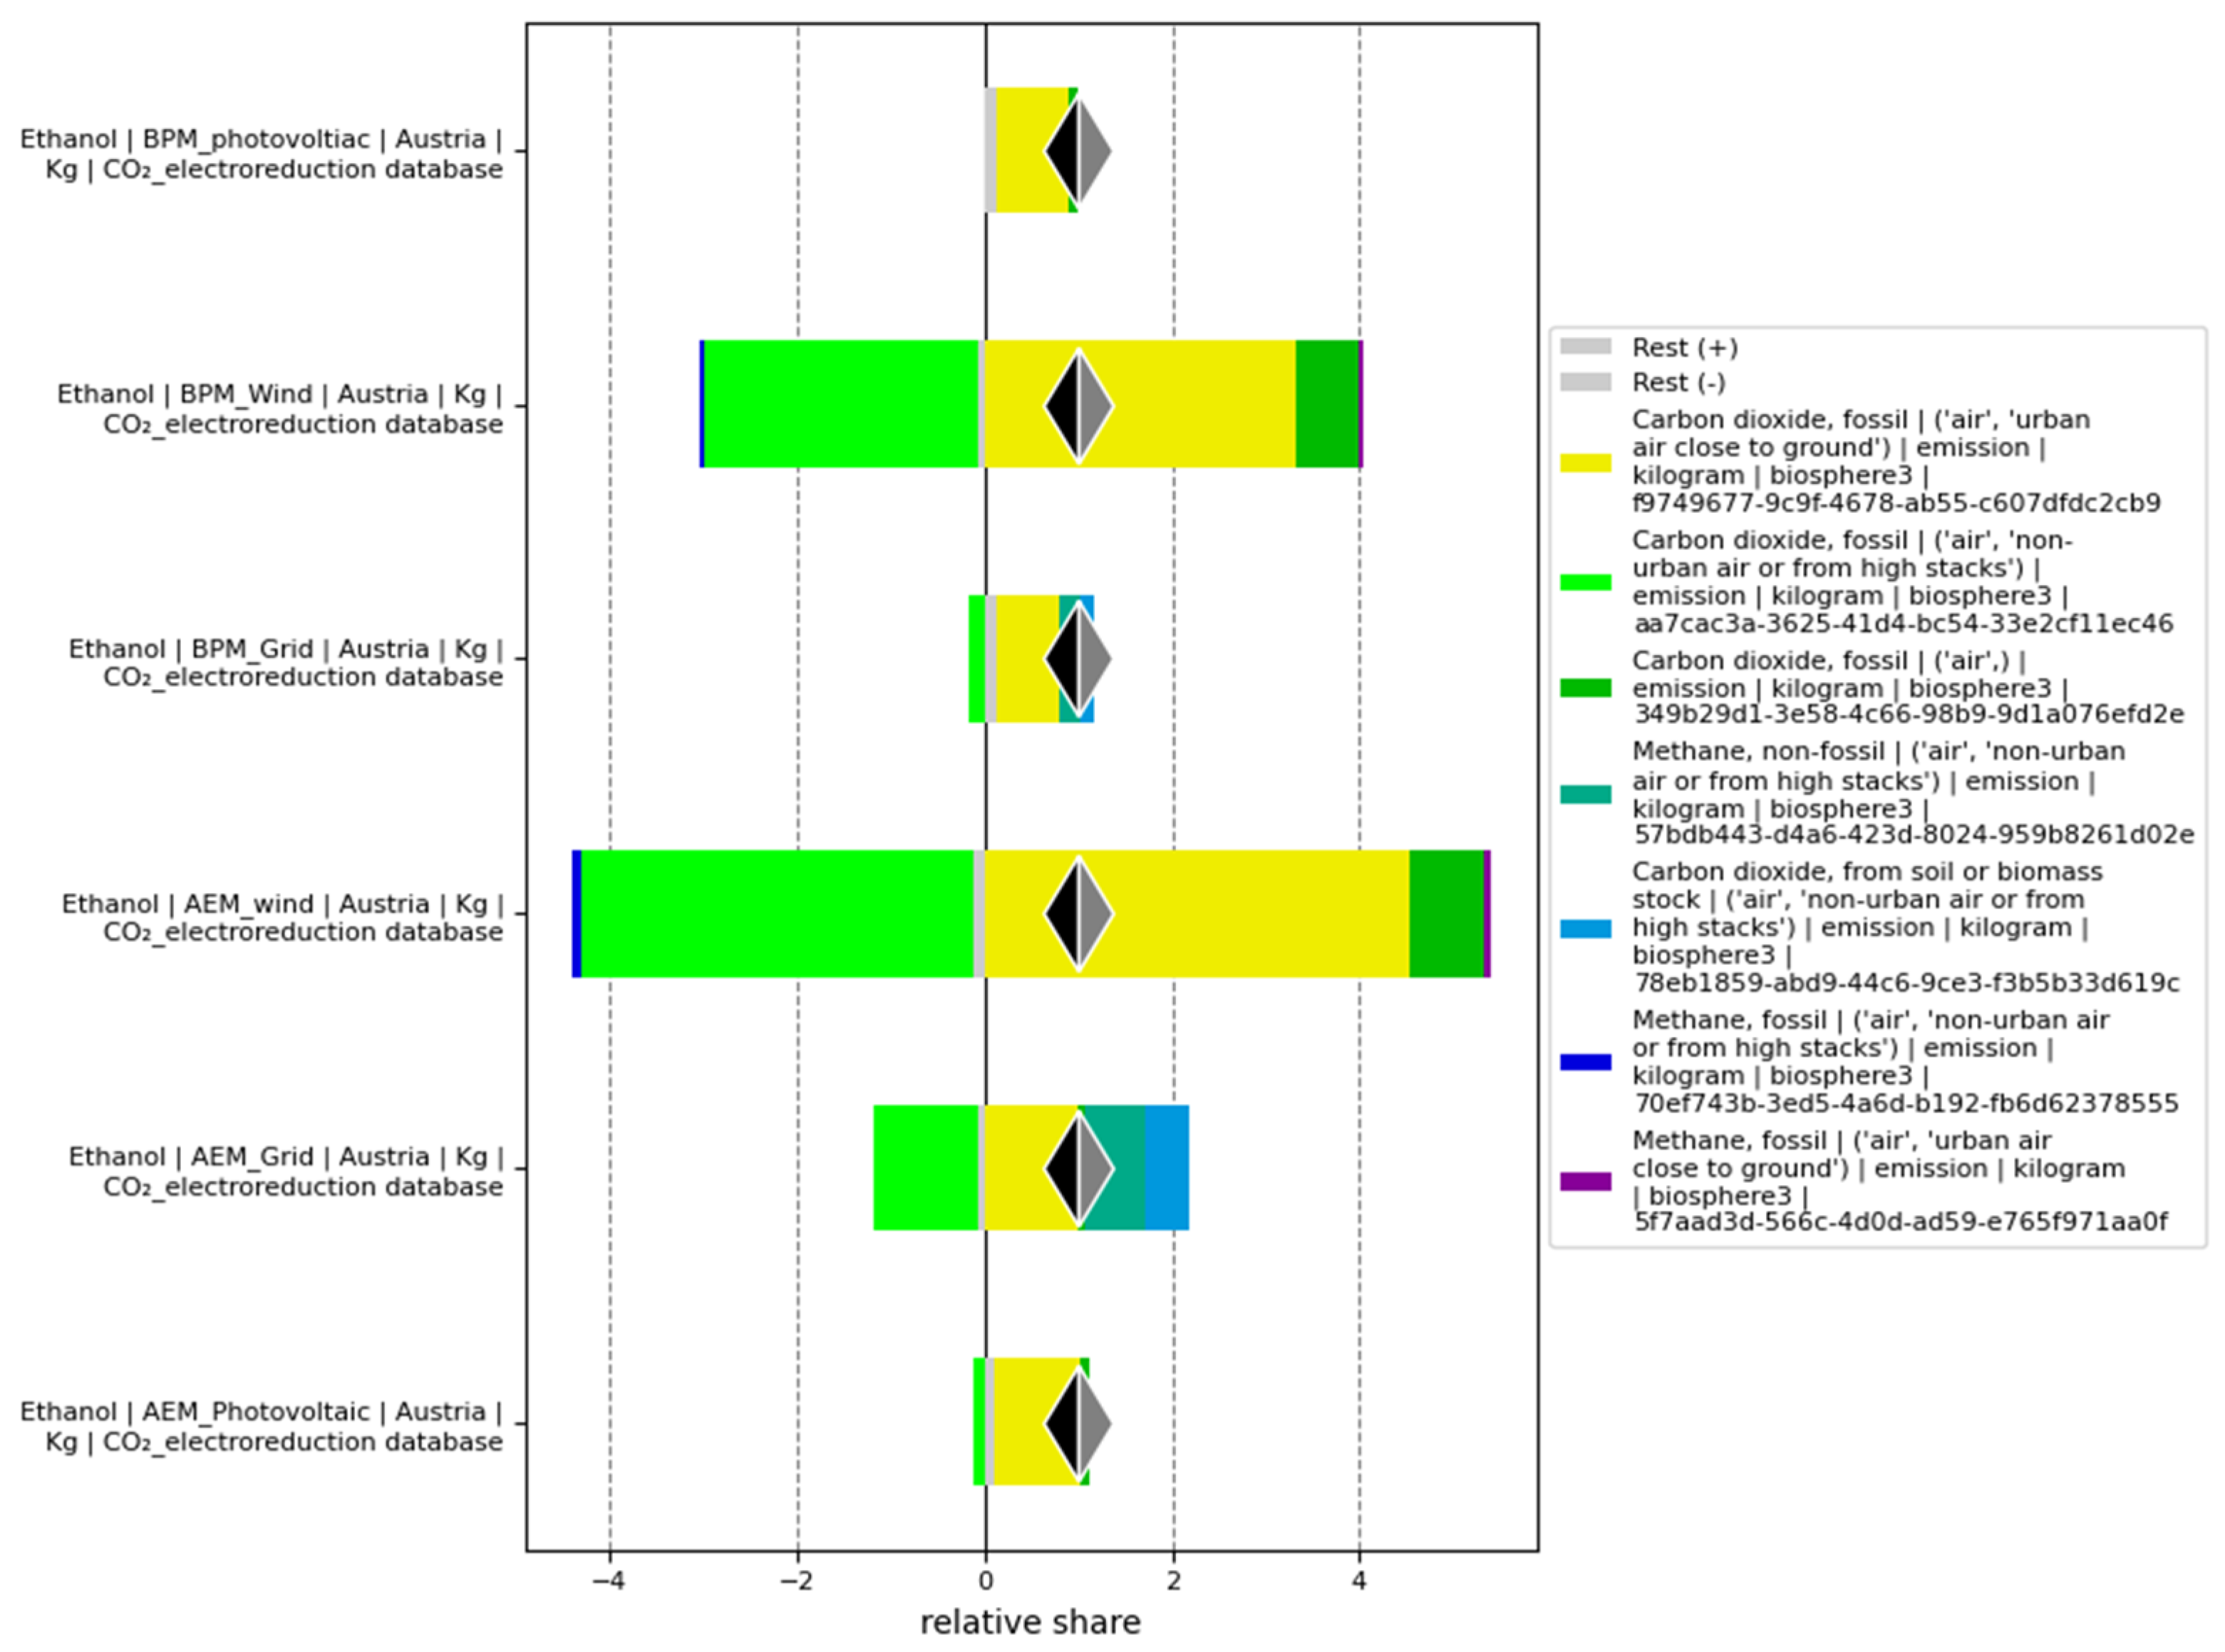
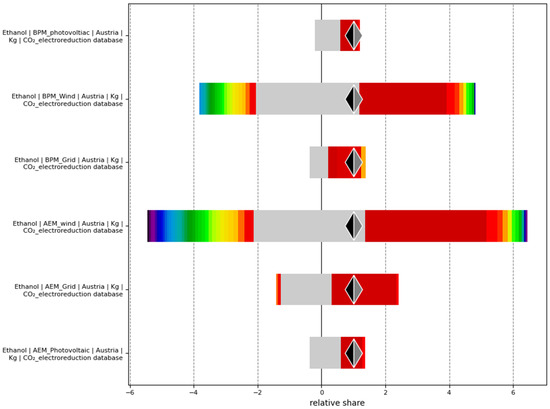
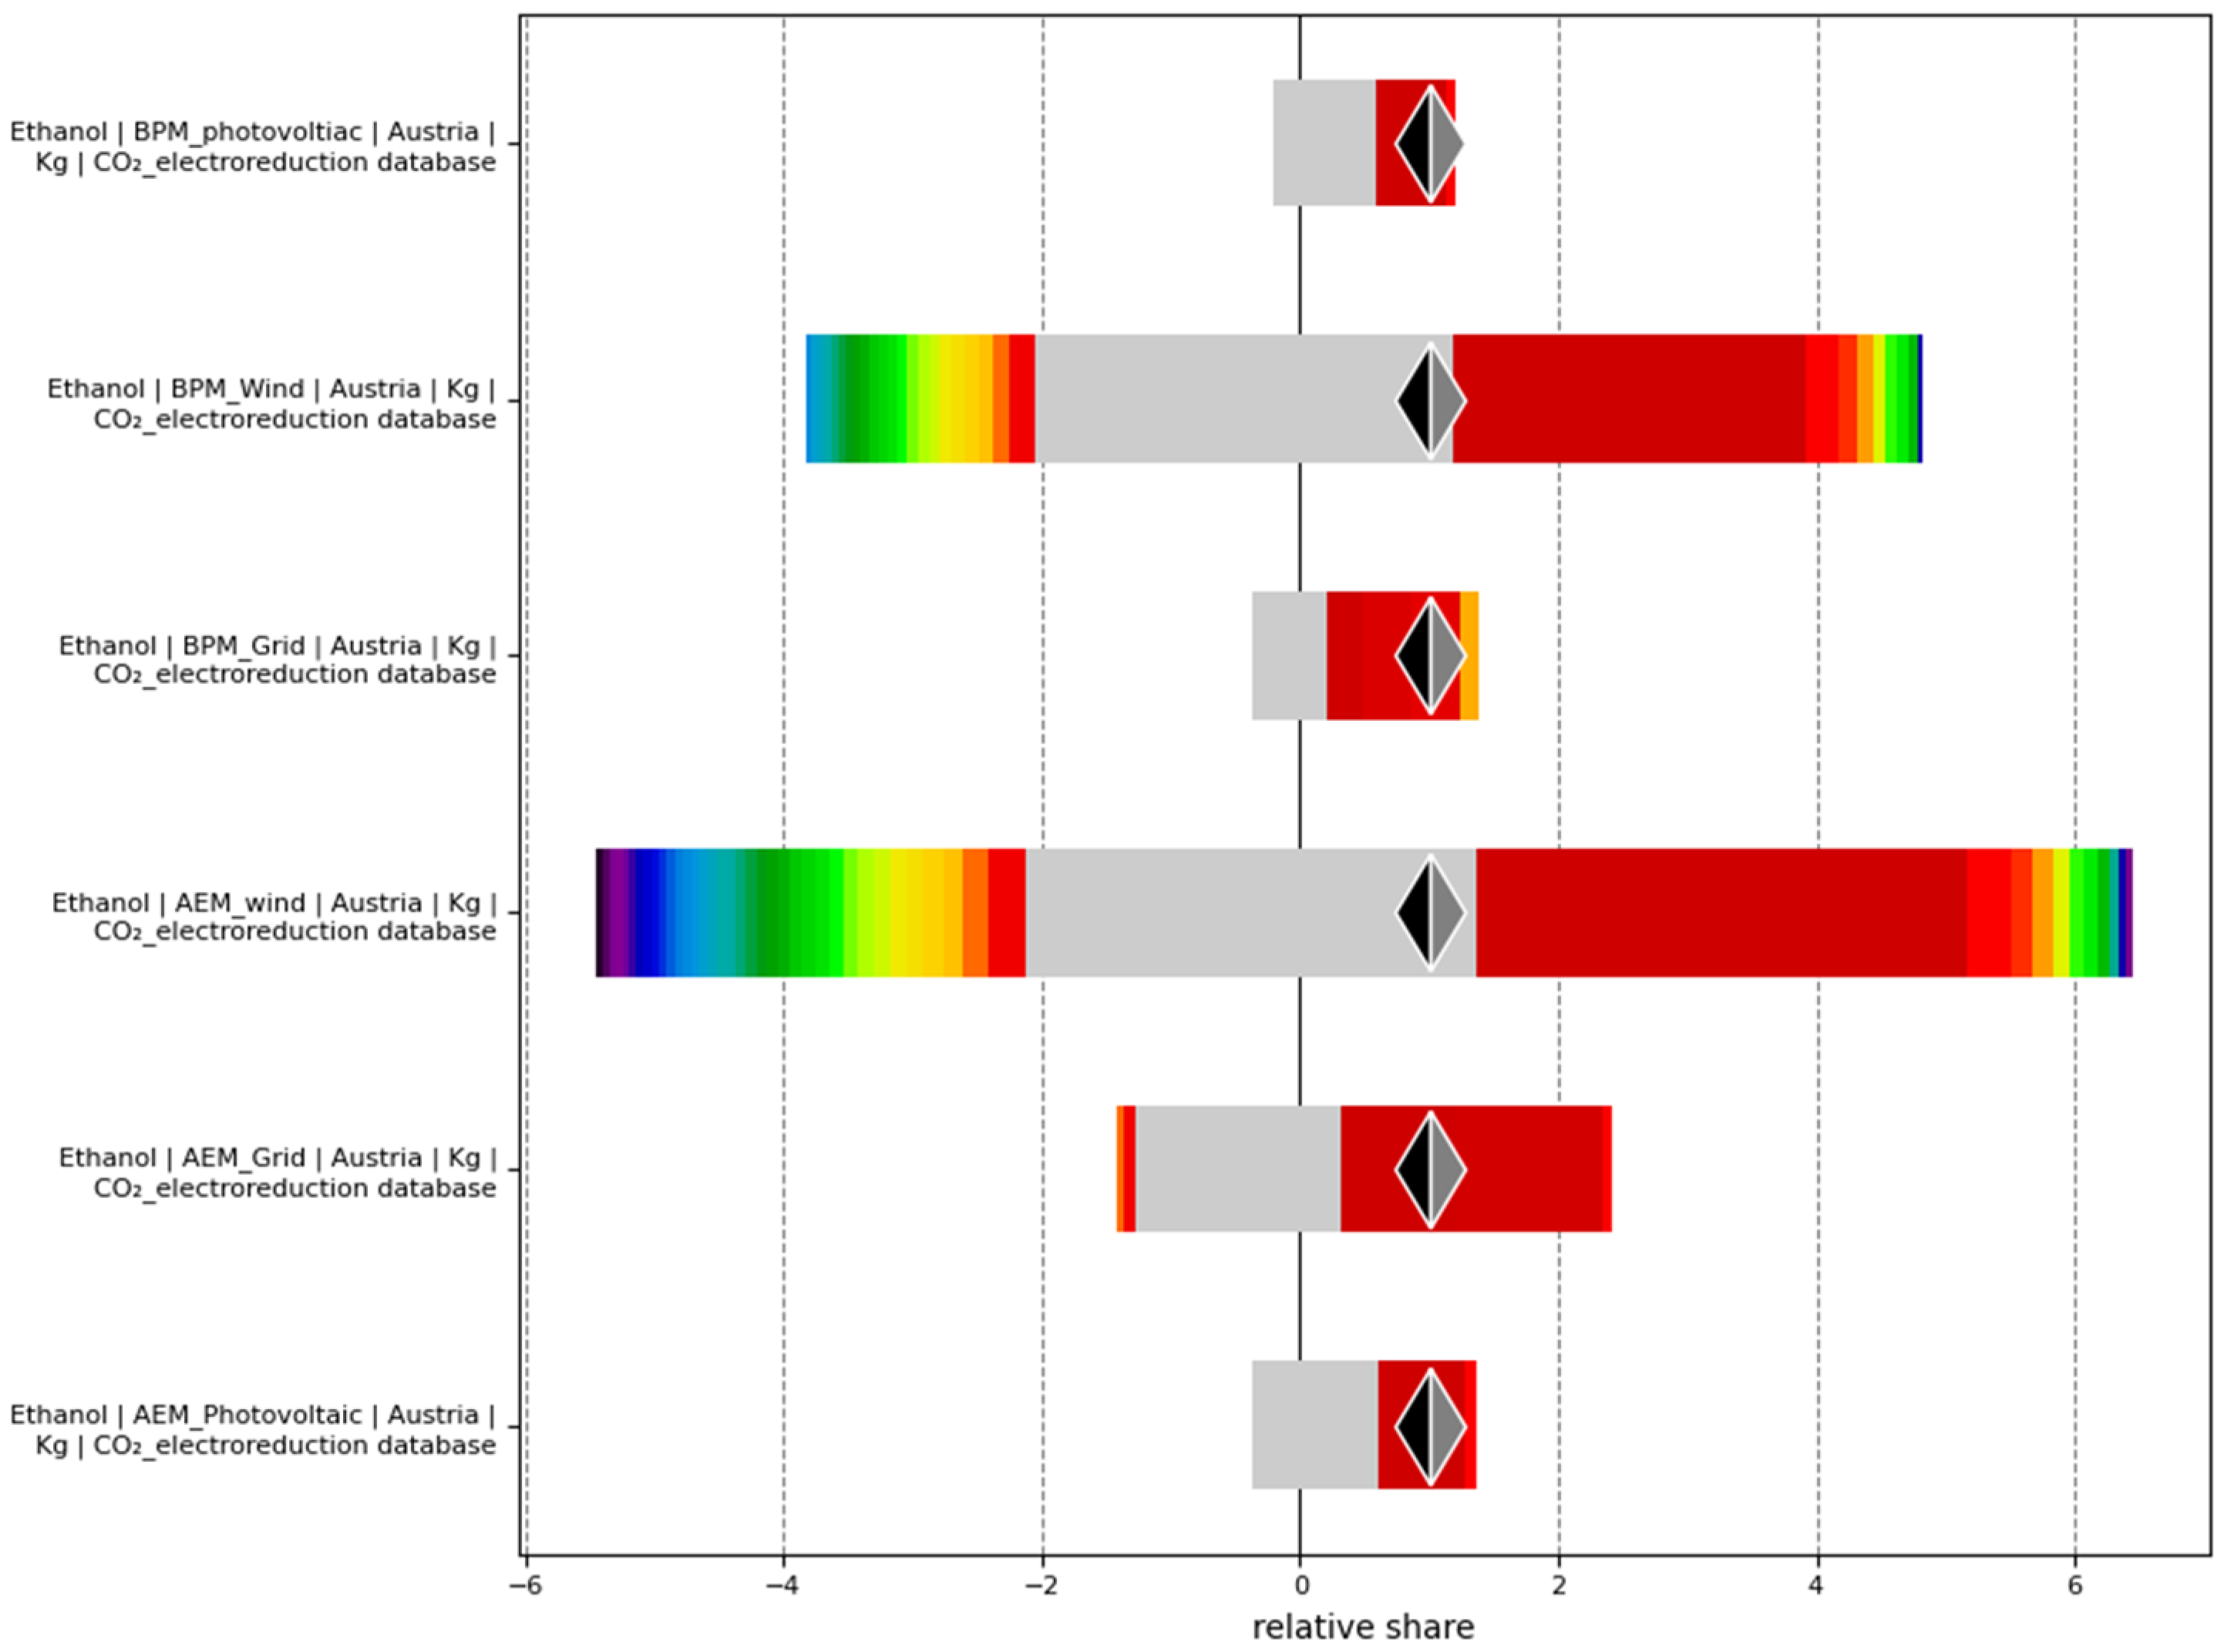
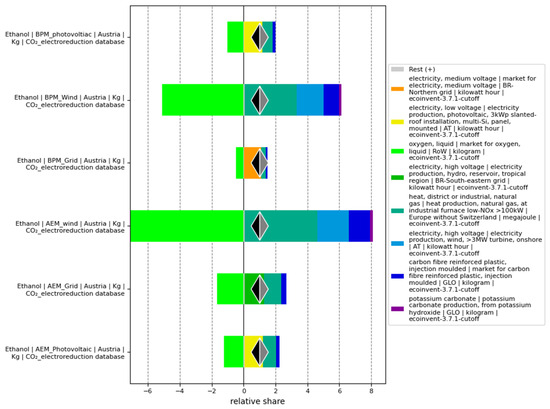
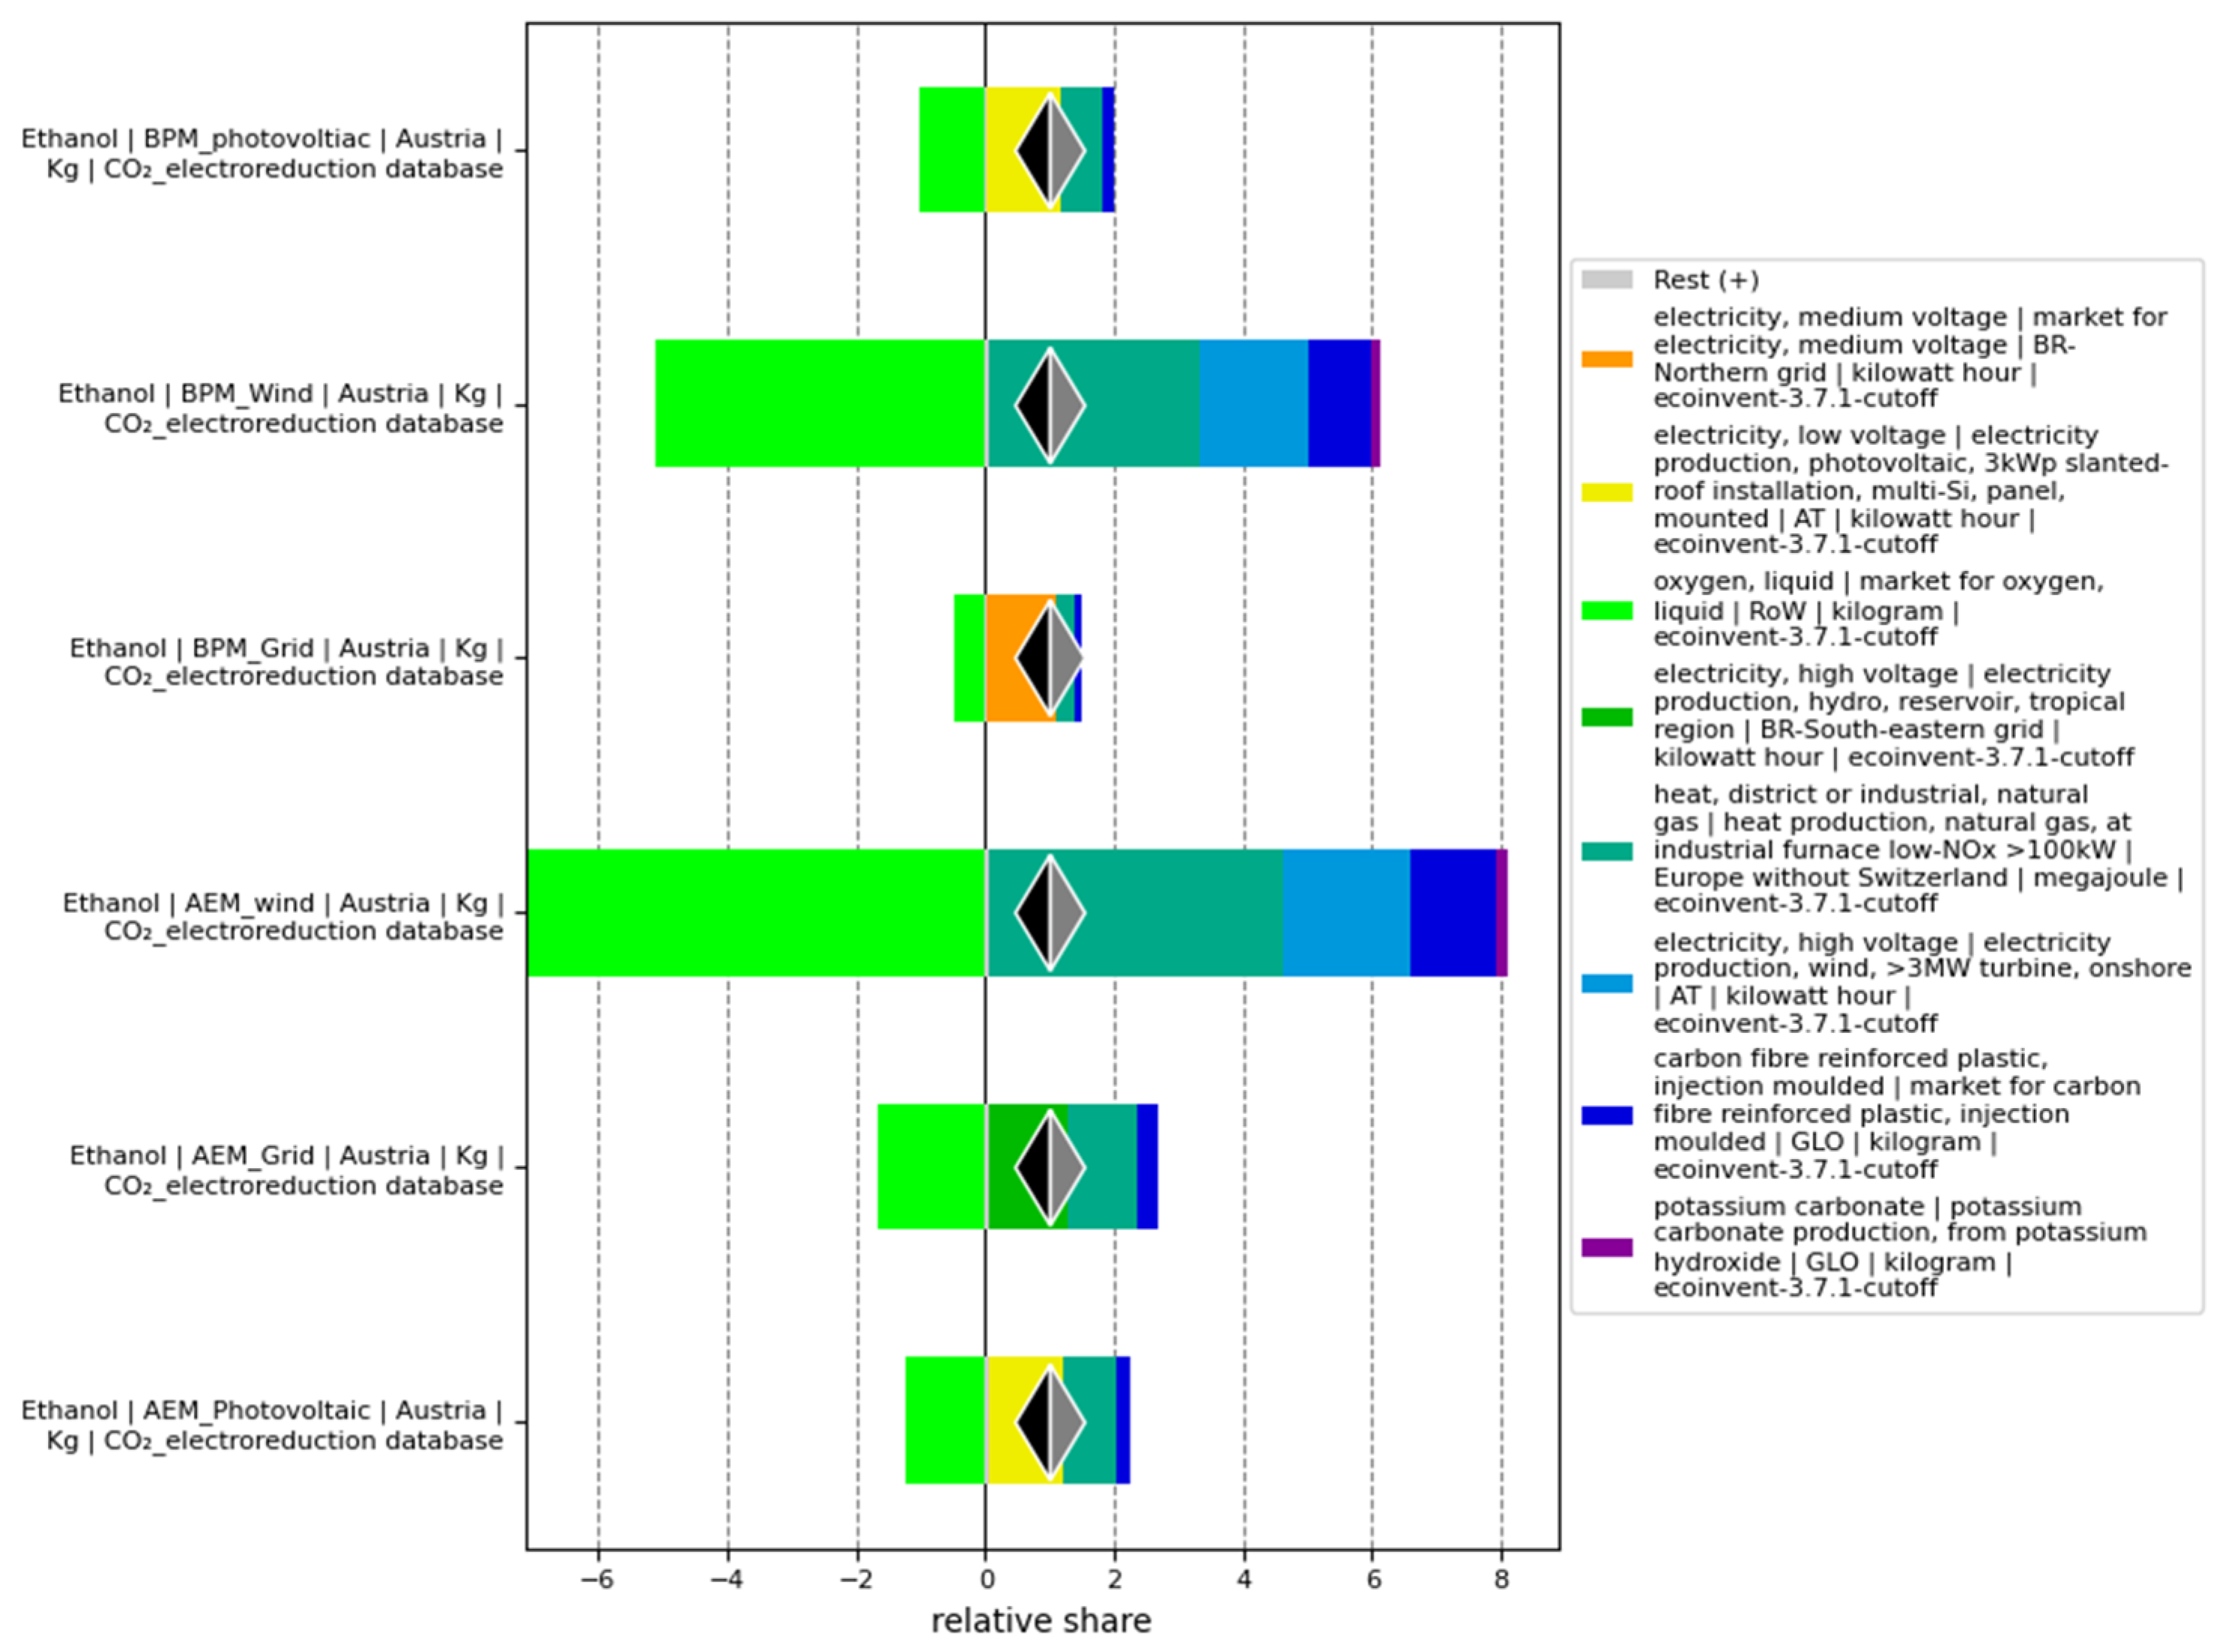
The contribution analysis presented in Figure 2 illustrates the relative share of key emission sources contributing to the global warming potential (GWP100) of CO2 electroreduction to ethanol under different electricity supply scenarios and electrolyzer configurations. The results clearly demonstrate that electricity consumption is the dominant contributor to total environmental impacts, consistent with numerous studies on electrochemical CO2 conversion and life cycle assessment [2,3,4,9,10,11,17,18,19,20,21,39,40,41].
Figure 2.
Contribution analysis of global warming potential (GWP100) for CO2 electroreduction to ethanol under different electrolyzer configurations (AEM and BPM) and electricity supply scenarios in Austria. Results are expressed as relative contributions of key emission sources. Electricity-related emissions, particularly fossil CO2 and methane, dominate the overall environmental impact across all scenarios, while wind-based systems exhibit the lowest contributions.
Across all scenarios, emissions associated with electricity generation—particularly fossil-derived carbon dioxide and methane emissions to air—account for the largest share of the overall GWP. This finding reflects the inherently energy-intensive nature of CO2 electrolysis systems and confirms that upstream electricity production is the primary environmental hotspot, as widely reported in both LCA and techno-economic analyses [2,10,11,18,21,42,43].
Wind-based scenarios exhibit the lowest environmental impact, with contributions mainly arising from minor upstream emissions associated with wind energy infrastructure, including turbine manufacturing, installation, and maintenance [33,34]. The low carbon intensity of wind electricity significantly reduces the contribution of energy-related emissions, making it one of the most favorable options for decarbonizing electrochemical processes [33,34,48].
In contrast, grid-based scenarios show substantially higher contributions from fossil carbon dioxide and methane emissions, reflecting the carbon intensity of the electricity mix. Even in regions such as Austria, where the electricity mix includes a high share of renewable energy, residual fossil-based generation still contributes significantly to total emissions [26,28,45]. These results highlight the strong dependence of environmental performance on electricity system characteristics, as also emphasized in previous studies [10,18,21,43].
Photovoltaic (PV) scenarios demonstrate intermediate performance, where emissions are primarily attributed to the embodied impacts of photovoltaic panel production, including silicon processing, module manufacturing, and material supply chains [17,20,34]. Although operational emissions from PV electricity are negligible, the life cycle impacts associated with infrastructure production remain significant, particularly in early-stage systems or when panel lifetimes are limited [17,20,33].
Furthermore, the analysis reveals that BPM systems consistently exhibit higher contributions from electricity-related emissions compared to AEM systems across all scenarios. This difference is directly linked to the higher energy requirements of BPM electrolyzers, which have been widely reported to consume more electricity due to additional voltage losses and membrane-related energy penalties [14,35,36,37,38,50]. As a result, any increase in electricity demand directly amplifies the environmental burden associated with energy supply [2,11,42].
Other contributions, including material inputs, electrolyte consumption, and auxiliary chemicals, are found to be negligible in comparison to energy-related emissions. This observation is consistent with previous LCA studies, which indicate that infrastructure and material flows typically contribute only a minor fraction of total impacts in electrochemical CO2 conversion systems [18,20,21,46].
Overall, the contribution analysis confirms that electricity consumption represents the primary environmental hotspot, and that reducing both electricity demand and the carbon intensity of electricity supply is essential for improving the sustainability of CO2 electroreduction pathways. These findings align with broader conclusions in the literature emphasizing the critical role of energy systems, process efficiency, and system integration in determining the environmental viability of electrochemical technologies [2,3,4,10,18,21,39,40]. The system-boundary definition, included and excluded processes, and comparability rules applied in this study are summarized in Table 2.
Table 2.
System-boundary definition and comparability rules.
2.4. Electrolyzer Configurations
2.4.1. Anion-Exchange-Membrane System
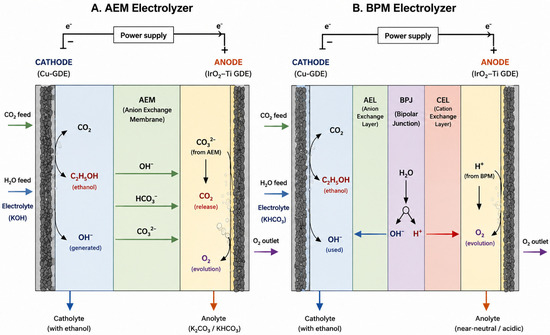
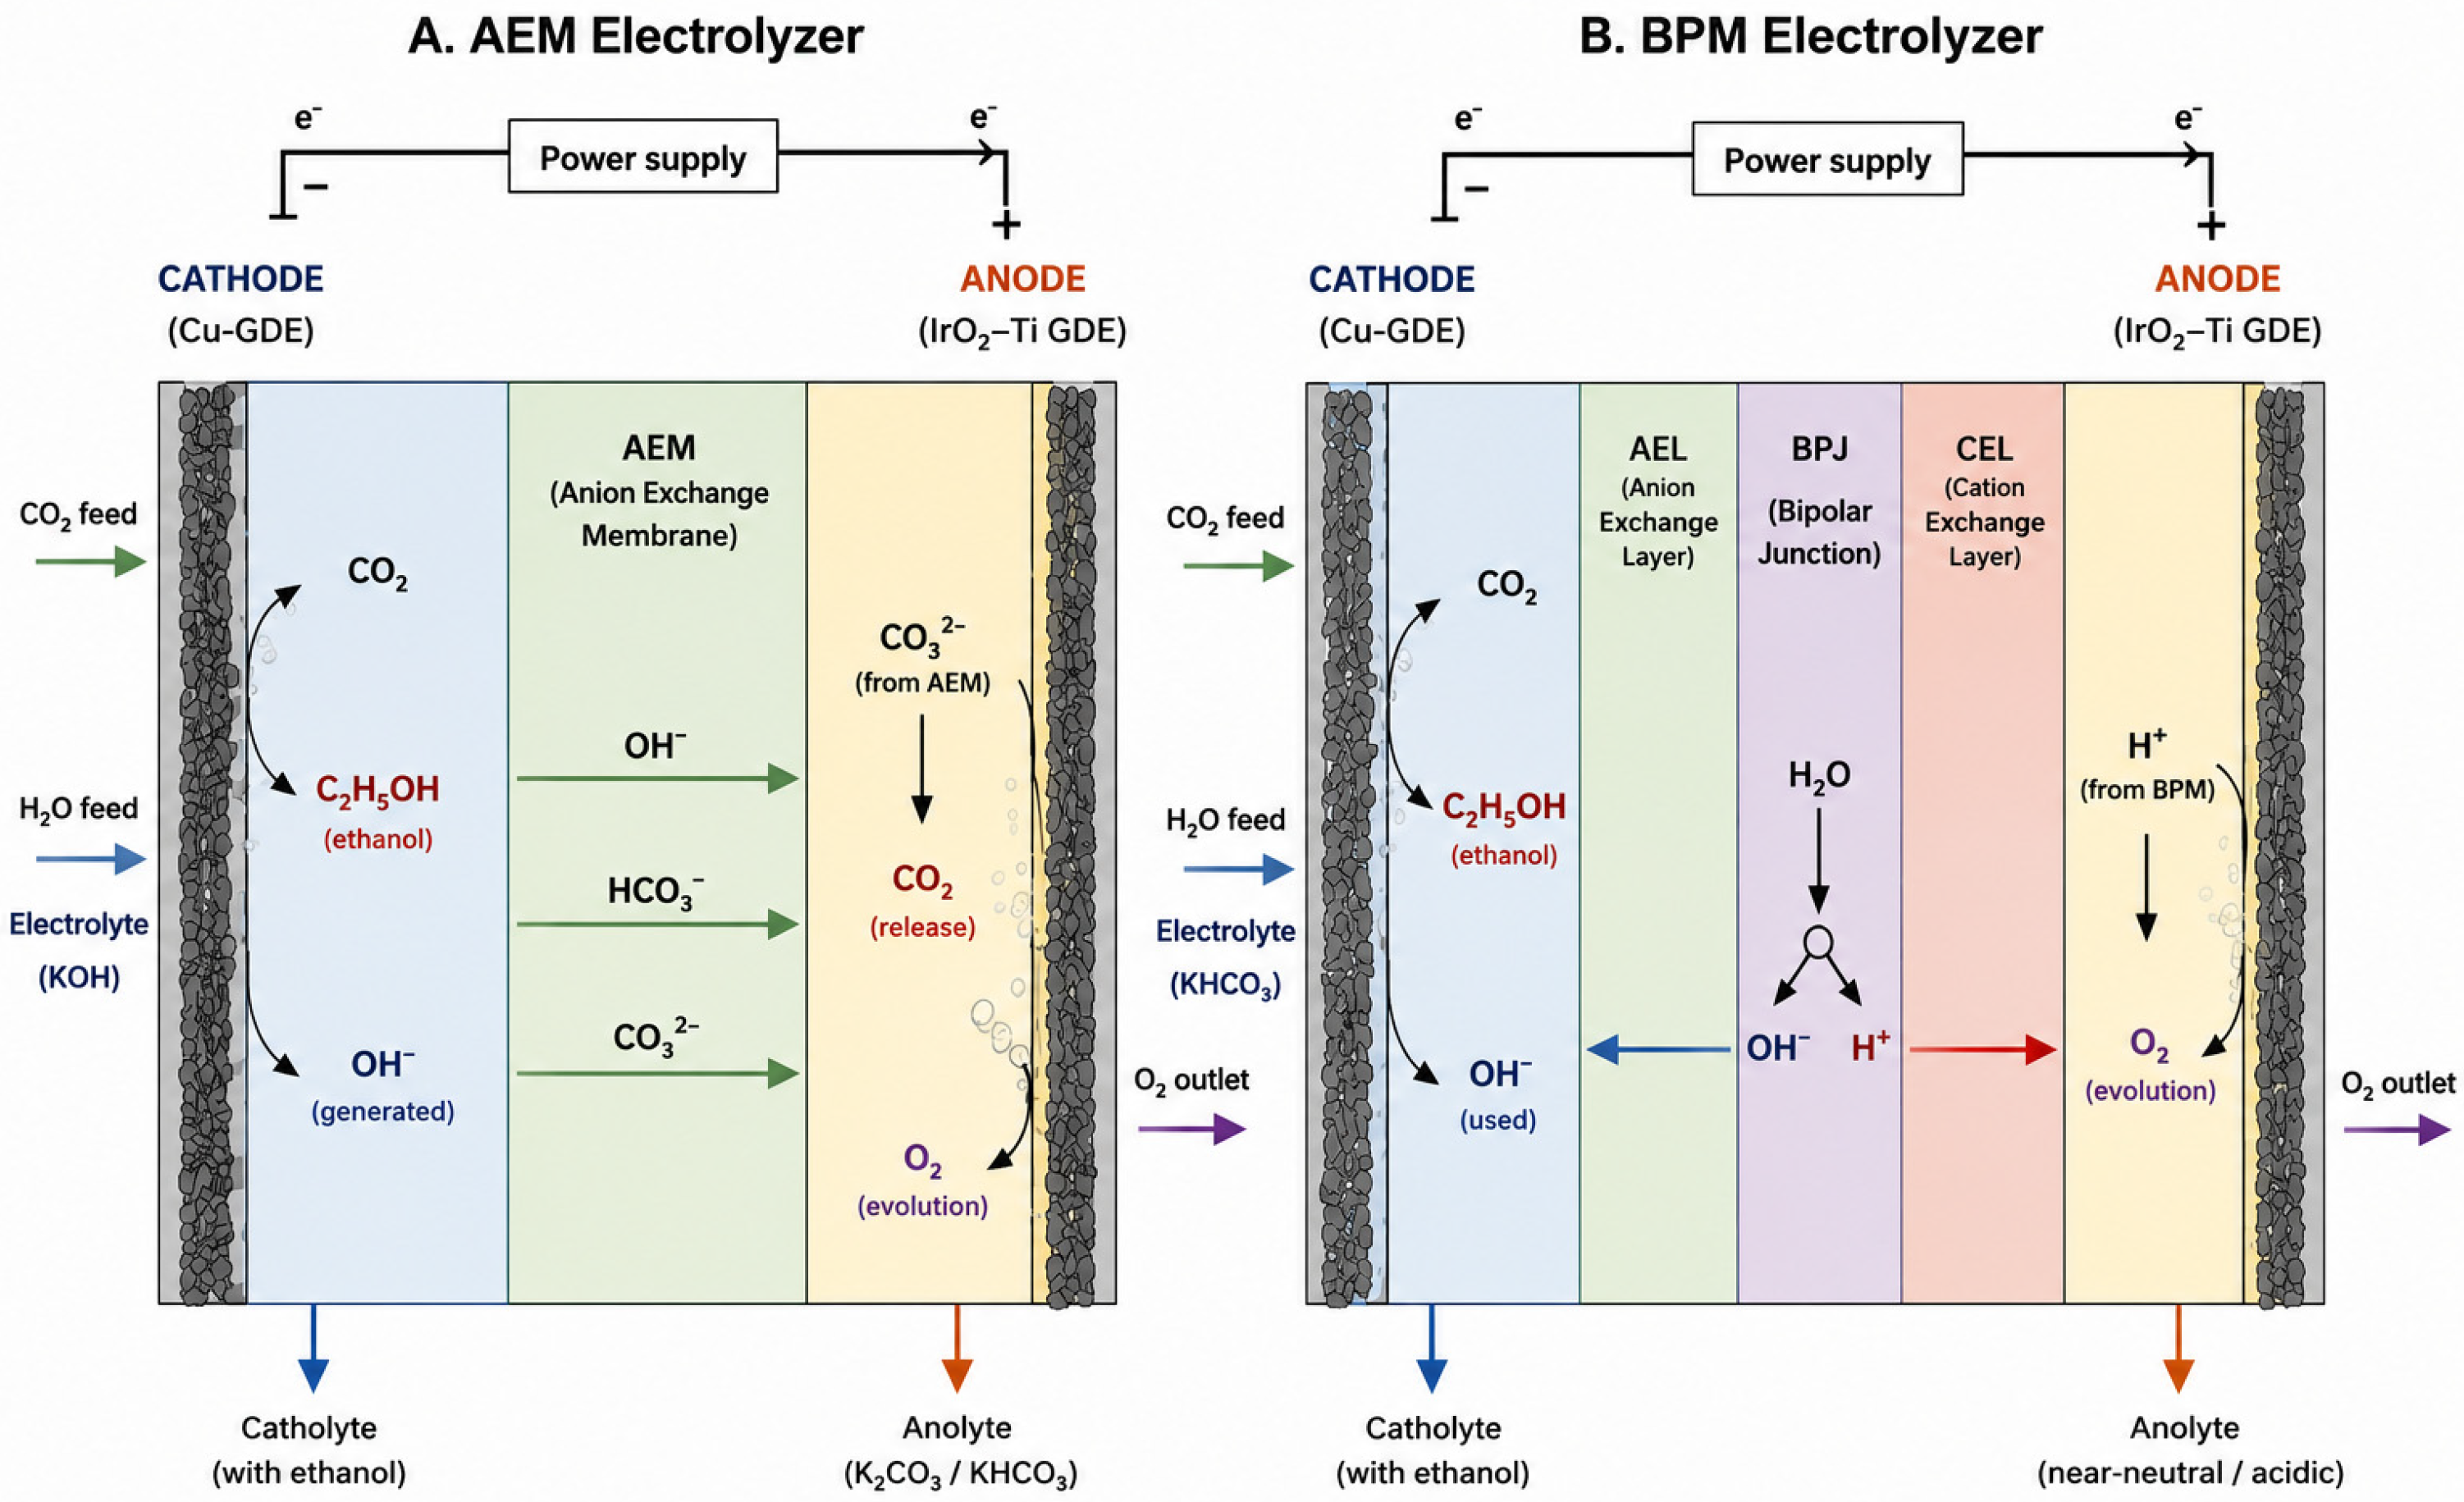
In the AEM configuration, CO2 is supplied to a gas-diffusion cathode and electrochemically reduced on a copper-based catalyst. As schematically illustrated in Figure 3A, the anion-exchange membrane transports anionic species, including OH−, HCO3−, and CO32−, from the cathode side toward the anode. An alkaline or near-neutral cathode environment can suppress the competing hydrogen evolution reaction and promote C–C coupling; however, cathodically generated OH− can react with CO2 to form bicarbonate and carbonate species. The subsequent transport of these carbon-containing anions through the AEM may result in CO2 release at the anode, reducing single-pass carbon utilization and increasing the requirements for CO2 capture, recycle, and gas separation. Neutral ethanol may also cross the membrane, potentially causing product losses or additional downstream recovery requirements. Nevertheless, the AEM configuration has a lower modeled electricity demand in the present study because it avoids the explicit water-dissociation process and associated voltage penalty of the bipolar junction [34,35,36,45,46].
Figure 3.
Schematic representation of the operating principles and principal ion-transport pathways in (A) anion-exchange-membrane (AEM) and (B) bipolar-membrane (BPM) electrolyzer configurations for electrochemical CO2 reduction to ethanol. The AEM system enables the transport of OH−, HCO3−, and CO32− species from the cathode toward the anode, whereas the BPM configuration incorporates an anion-exchange layer (AEL), bipolar junction (BPJ), and cation-exchange layer (CEL), with water dissociation at the bipolar junction generating OH− and H+ ions that migrate toward the cathode and anode, respectively. Cu-GDE: copper gas-diffusion electrode; IrO2–Ti GDE: iridium oxide–titanium gas-diffusion electrode.
2.4.2. Bipolar-Membrane System
The BPM configuration consists of an anion-exchange layer (AEL) and a cation-exchange layer (CEL) joined at a bipolar junction (BPJ), as shown in Figure 3B. Under an applied electric field, water dissociation at the bipolar junction generates H+ and OH− ions, which migrate toward the anode and cathode sides, respectively. This ion-generation mechanism enables distinct local pH environments to be maintained on the two sides of the membrane and can influence carbonate and bicarbonate management. Depending on the cell configuration and operating conditions, local proton availability can promote the conversion of bicarbonate or carbonate species to CO2 and may reduce net carbon crossover compared with conventional AEM operation. However, an environmental advantage is not inherent to the BPM configuration because water dissociation, bipolar-junction losses, and ion transport through two functional membrane layers can increase cell resistance and electricity demand. The BPM inventory must therefore be evaluated as a coupled carbon–energy trade-off rather than as a simple membrane substitution [37,38,39,40,41,42,43,44,45,46]. The principal technical characteristics and operating differences between the AEM and BPM electrolyzer configurations used in this study are summarized in Table 3.
Table 3.
Technical comparison of the AEM and BPM configurations used to interpret the LCA results. Mechanistic interpretation is based on Refs. [34,35,36,37,38,39,40,41,42,43,44,45,46].
2.5. Stoichiometric Basis and Mass Balance
The ideal overall reaction for the electrochemical conversion of carbon dioxide and water to ethanol is:
2CO2 + 3H2O → C2H5OH + 3O2
Using molar masses of approximately 44.01 g mol−1 for CO2, 18.015 g mol−1 for water, 46.07 g mol−1 for ethanol, and 32.00 g mol−1 for oxygen, the theoretical mass requirements per kilogram of ethanol are calculated as follows:
mCO2, theoretical = (2 × 44.01/46.07) = 1.91 kg CO2 kg−1 ethanol
mH2O, theoretical = (3 × 18.015/46.07) = 1.17 kg H2O kg−1 ethanol
mO2, theoretical = (3 × 32.00/46.07) = 2.08 kg O2 kg−1 ethanol
The foreground inventory uses 2.08 kg of CO2 per kilogram of ethanol rather than the theoretical requirement of 1.91 kg. The ratio of the theoretical to modeled requirement corresponds to an effective mass-based utilization of approximately 92%. This quantity is not a Faradaic efficiency; it is an aggregate inventory factor representing incomplete utilization, competing products, carbonate formation, purge losses, and imperfect recovery. Because carbon efficiency and single-pass conversion are major determinants of system energy and environmental performance, future models should replace this aggregate factor with explicit feed, conversion, carbonate-crossover, recycle, and purge balances [9,10,36,39].
The process-water input is 3.80 kg kg−1 ethanol, substantially above the 1.17 kg stoichiometric requirement. The difference represents water used for electrolyte preparation, membrane and feed humidification, circulation, washing, cooling, purge compensation, and downstream recovery. It is therefore treated as an operational requirement rather than as an additional reactant. This distinction is important because water consumption, water circulation, and water quality impose different environmental burdens and should be reported separately in future multi-category assessments [6,7,8,47].
2.6. Life-Cycle Inventory
The life-cycle inventory combines stoichiometric calculations, peer-reviewed electrochemical evidence, process-energy data, and explicitly stated engineering assumptions. Theoretical values are reported separately from process-level values so that ideal chemical requirements are not presented as actual industrial consumption. This distinction is consistent with prospective LCA practice, in which measured data, modeled values, and assumptions should remain traceable so that uncertainty and scale-up effects can be assessed transparently [47,48,54]. Table 4 summarizes the principal inventory flows.
Table 4.
Principal life-cycle inventory flows per functional unit of 1 kg ethanol. Inventory construction follows the prospective LCA principles discussed in Refs. [47,48,54].
The process contribution analysis presented in Figure 4 further confirms that electricity production is the dominant contributor to the global warming potential (GWP100) of CO2 electroreduction systems across all evaluated scenarios. This dominance is primarily attributed to the high energy demand of the electrochemical conversion process, which has been consistently identified as the key driver of environmental impacts in CO2 electrolysis systems [2,3,4,9,10,11,17,18,19,20,21,39,40,41].
Figure 4.
Relative process contribution to greenhouse gas emissions (IPCC 2021 GWP100) for CO2-to-ethanol production. The analysis highlights electricity generation as the primary environmental hotspot, followed by thermal energy demand, whereas upstream processes such as CO2 capture, electrolyte production, and infrastructure materials contribute only marginally to the overall impact.
Heat supply for downstream product separation represents the second-largest contribution to overall emissions, particularly in scenarios where thermal energy is provided by natural gas. The contribution of heat demand is associated with fuel combustion emissions and the energy-intensive nature of separation processes such as distillation, which are known to significantly influence the life cycle performance of chemical production systems [18,19,21,31].
In contrast, the contribution of CO2 capture from cement plants is relatively small, indicating that the environmental burden associated with the carbon source is minor compared to energy-related inputs. This finding aligns with previous studies showing that CO2 capture processes can exhibit relatively low incremental environmental impacts when integrated into industrial point sources, especially when compared to the dominant influence of electricity consumption [18,20,32].
Material inputs, including electrolytes, auxiliary chemicals, and infrastructure components, contribute only marginally to the total impact. These results are consistent with prior LCA studies, which have demonstrated that material-related contributions are typically negligible in comparison to energy flows in electrochemical conversion systems [17,18,21,46].
Furthermore, the analysis indicates that BPM systems exhibit higher contributions from electricity-related emissions compared to AEM systems across all scenarios. This difference is directly linked to the higher energy requirements of BPM electrolyzers, which are associated with additional voltage losses and membrane-related energy penalties, as reported in the literature [14,35,36,37,38,50]. Consequently, increased electricity demand directly amplifies the environmental burden associated with energy supply [2,11,42].
Overall, the process-level contribution analysis highlights that electricity consumption and heat supply are the primary environmental hotspots, while CO2 capture and material inputs play a secondary role. These findings clearly indicate that reducing electricity demand, improving electrolyzer efficiency, and transitioning to low-carbon electricity and heat sources are the most effective strategies for improving the environmental performance of CO2 electroreduction to ethanol, consistent with conclusions drawn in previous LCA and techno-economic studies [2,3,4,10,18,21,39,40].
2.7. Electricity and Heat Scenarios
The elementary flow contribution analysis further reveals that fossil carbon dioxide emissions to air are the dominant contributors to the total GWP across all scenarios. These emissions primarily originate from electricity generation and thermal energy supply, reflecting the carbon intensity of upstream energy systems [10,18,21,43]. This finding highlights the critical role of energy-related emissions in determining the environmental performance of electrochemical processes.
Methane emissions represent the second most significant contribution, particularly in grid-based electricity scenarios. These emissions are associated with upstream processes such as fossil fuel extraction, processing, and combustion, and are well documented as important contributors to life cycle greenhouse gas emissions due to their high global warming potential [22,23,45].
Biogenic carbon dioxide emissions exhibit a comparatively minor contribution and vary depending on the electricity source and system configuration. In renewable-based scenarios, such emissions are generally low and are often associated with indirect upstream processes rather than direct operational emissions [17,20].
Other greenhouse gas emissions, including minor trace gases, contribute negligibly to the overall impact. In some cases, avoided emissions associated with co-products or system expansion—such as oxygen production—provide a small environmental credit, slightly reducing the total GWP. This approach is consistent with established LCA methodologies for handling multi-functional systems [18,24,25].
Overall, the results confirm that fossil-based emissions from energy supply dominate the environmental profile of CO2 electroreduction systems, further emphasizing the importance of integrating low-carbon electricity and heat sources. These findings are in strong agreement with previous studies highlighting that the decarbonization of energy inputs is the most effective pathway for improving the sustainability of electrochemical CO2 conversion technologies [2,3,4,10,18,21,39,40]. The first-tier process contribution analysis for the evaluated AEM and BPM systems under different electricity supply scenarios is presented in Figure 5.
Figure 5.
First-tier process contribution analysis of global warming potential (GWP100) for CO2 electroreduction to ethanol under different electrolyzer configurations (AEM and BPM) and electricity supply scenarios in Austria. The results are expressed as relative contributions of key foreground and background processes. Across all scenarios, electricity production clearly dominates the environmental impact, followed by heat supply for downstream separation processes, while other inputs—including materials and electrolytes—contribute only marginally. This distribution is consistent with previous life cycle assessment studies of electrochemical CO2 conversion systems [2,3,4,9,10,11,17,18,19,20,21].
Global warming potential over a 100-year time horizon, with results reported as kilograms of CO2-equivalent per kilogram of ethanol. The database version, system model, geographical location, and exact dataset identifiers are treated as essential reproducibility information because background-market selection can materially alter prospective LCA results [47,48,53].
For each scenario, total GWP is calculated as the sum of the characterized burdens of all material and energy inputs minus the credited burden of substituted co-products:
where Qi is the quantity of inventory flow i, CFi is the corresponding cradle-to-gate climate-change impact per unit, and Cj is an avoided burden assigned through system expansion. Contribution analysis is used to identify the relative importance of electricity, heat, CO2 supply, oxygen credit, chemicals, and infrastructure materials.
GWPtotal = Σ(Qi × CFi) − Σ(Cj)
2.8. Model-Network Transparency
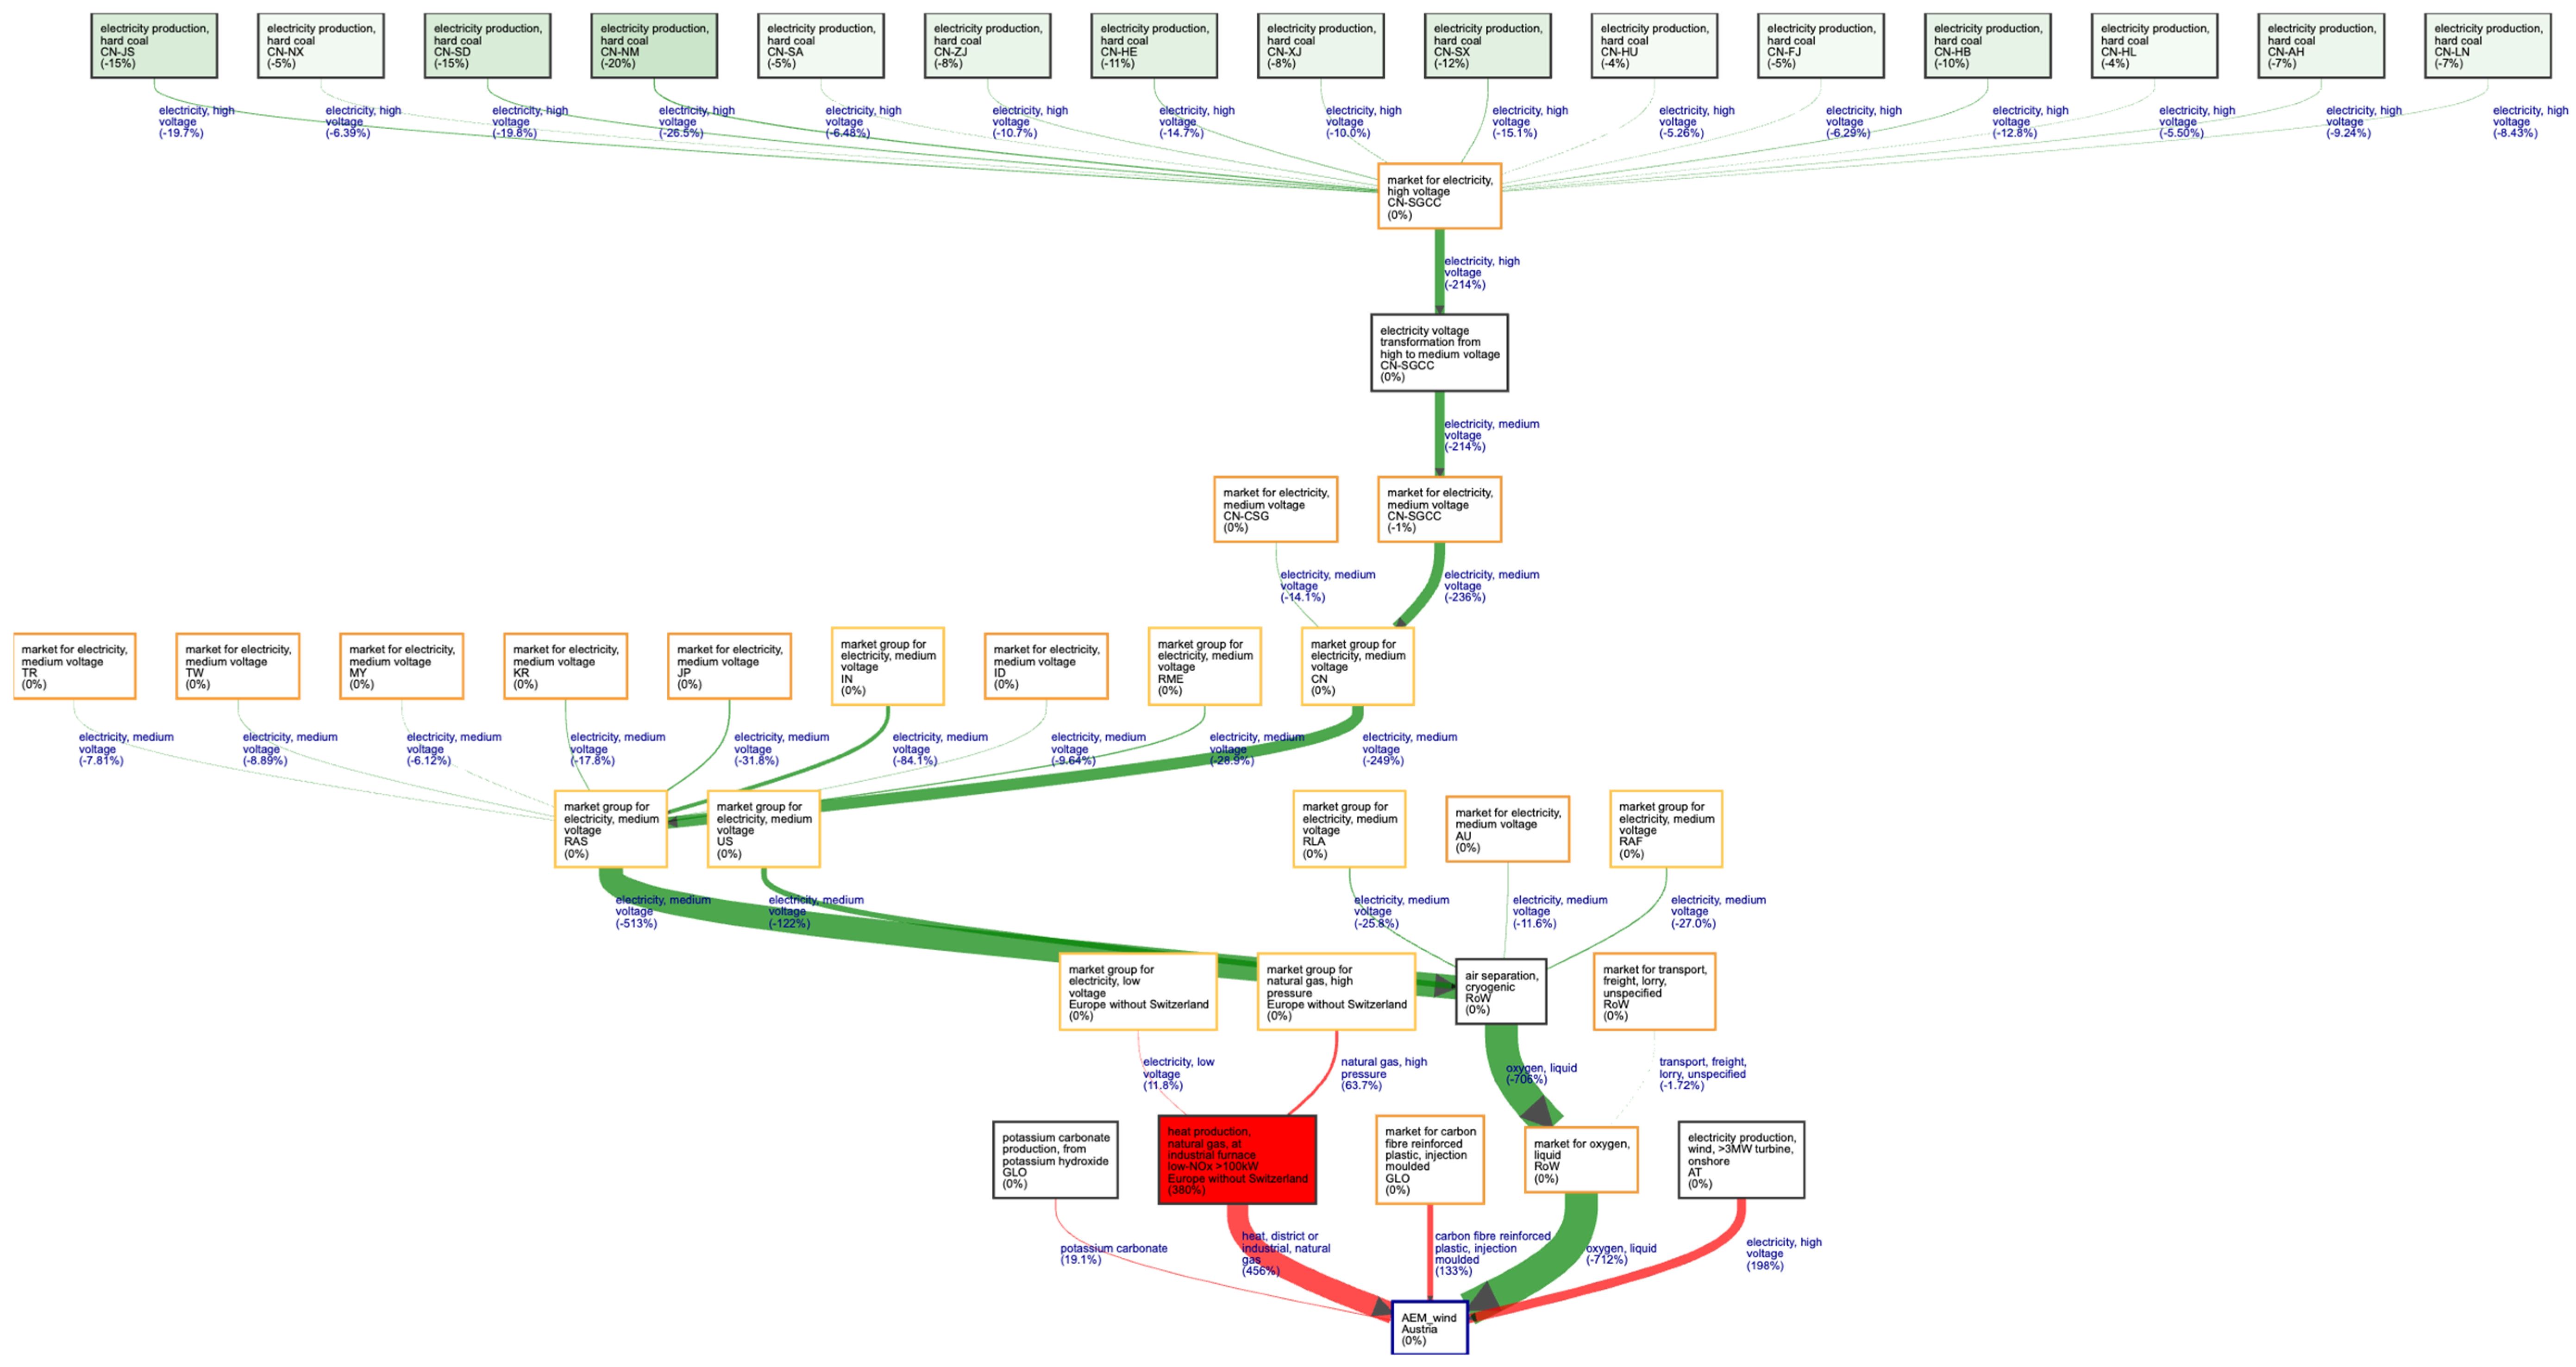
Figure 2 presents the process-network visualization generated from the Activity Browser model. The network documents the principal foreground–background links and shows connections to electricity generation, heat, transport, oxygen, carbonate, polymer, and CO2-supply processes. It is not used as a substitute for the numerical inventory; rather, it provides a structural transparency check and emphasizes the need to verify that every AEM and BPM scenario is connected to the intended background datasets [47,48,53,59].
Figure 6 shows the first-tier process contribution to global warming potential (GWP100, IPCC 2021) for CO2 electroreduction to ethanol under different electrolyzer configurations (AEM and BPM) and electricity supply scenarios in Austria. Results are presented as relative contributions of key processes. Electricity production dominates the environmental impact across all scenarios, followed by heat supply for product separation, while contributions from CO2 capture, materials, and auxiliary chemicals remain minor.
Figure 6.
Activity Browser process-network diagram for the AEM wind scenario. The diagram shows foreground links and selected background processes; edge thickness and color are generated by the software contribution view. The figure serves as a model-transparency aid and should be interpreted together with the numerical inventory and contribution tables.
The first-tier contribution analysis presented in Figure 6 demonstrates that electricity production is the dominant contributor to the global warming potential (GWP100) of CO2 electroreduction to ethanol across all evaluated scenarios. This observation directly reflects the high electricity demand of the electrochemical conversion process and is consistent with numerous studies identifying energy consumption as the primary environmental hotspot in CO2 electrolysis systems [2,3,4,9,10,11,17,18,19,20,21,39,40,41].
Wind-based electricity scenarios exhibit the lowest overall environmental impact, owing to the low carbon intensity of wind energy and its minimal associated upstream emissions [33,34]. In contrast, grid-based scenarios show significantly higher contributions, driven by fossil-based emissions from electricity generation, including carbon dioxide and methane emissions to air [10,18,21,43]. These results highlight the strong dependence of environmental performance on the carbon intensity of the electricity supply.
Photovoltaic (PV) scenarios demonstrate intermediate performance, with environmental impacts largely attributed to the embodied emissions associated with panel manufacturing, material extraction, and supply chains rather than operational emissions [17,20,34]. This finding underscores the importance of considering full life cycle impacts when evaluating renewable energy technologies.
Heat supply for downstream product separation represents the second-largest contributor across all scenarios. This contribution is primarily associated with natural gas consumption for thermal processes such as distillation, which are known to be energy-intensive and significant sources of greenhouse gas emissions in chemical production systems [18,19,31].
Contributions from CO2 capture, electrolyte production, and infrastructure materials—including polymers and carbon-fiber-reinforced plastics—are comparatively small and do not significantly influence the overall environmental impact. This observation is consistent with previous LCA studies showing that material and infrastructure inputs typically represent a minor share of total emissions relative to energy-related contributions [17,18,21,46].
Furthermore, BPM systems consistently exhibit higher contributions from electricity-related processes compared to AEM systems across all scenarios. This difference is directly linked to the higher energy requirements of BPM electrolyzers, which are associated with additional voltage losses and membrane-related energy penalties [14,35,36,37,38,50]. As a result, increased electricity demand amplifies the environmental burden associated with energy supply [2,11,42].
Overall, the results confirm that electricity consumption remains the primary environmental hotspot, and that reducing both electricity demand and the carbon intensity of energy supply is critical for improving the sustainability of CO2 electroreduction systems. These findings are consistent with broader conclusions in the literature emphasizing that system-level energy optimization and decarbonization are essential for achieving low-carbon production pathways [2,3,4,10,18,21,39,40].
2.9. Scenario Analysis, Consistency Checks, and Uncertainty Treatment
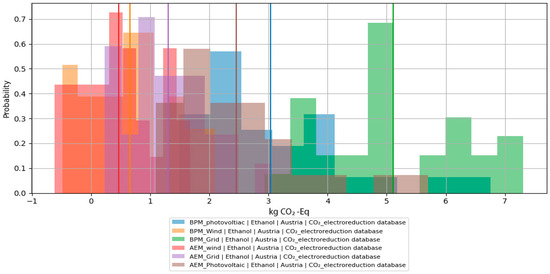
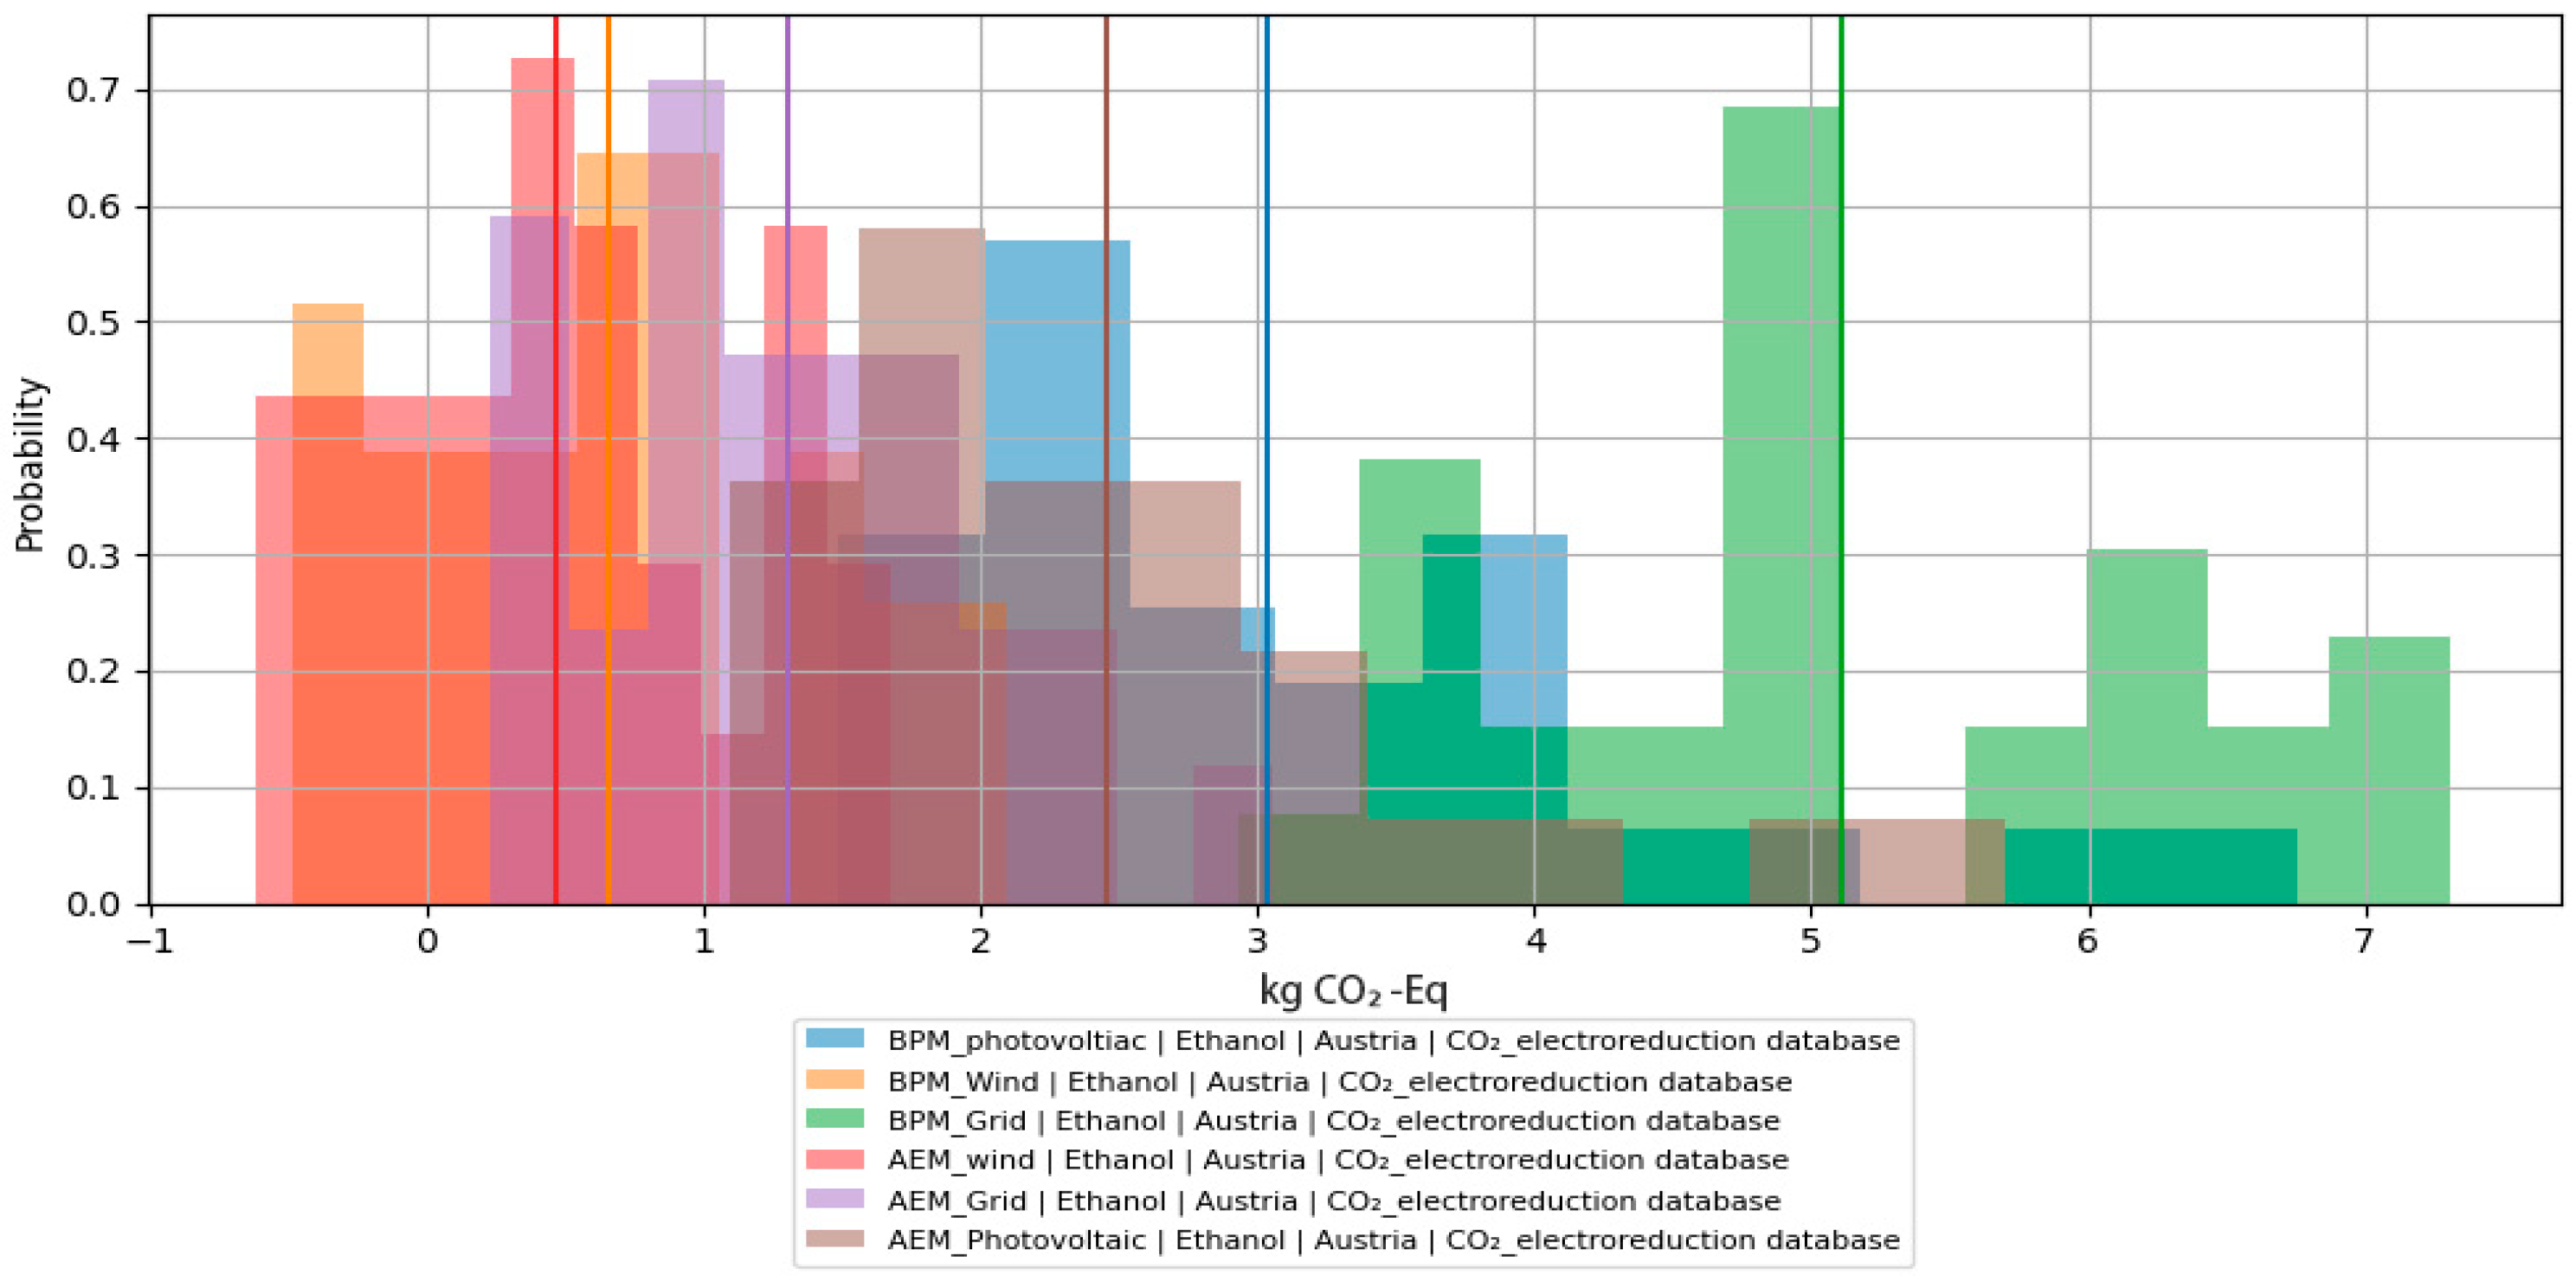
The Monte Carlo simulation results presented in Figure 7 provide insights into the uncertainty and variability associated with the global warming potential (GWP100) of CO2 electroreduction to ethanol across different electricity supply scenarios and electrolyzer configurations. The probabilistic distributions highlight the sensitivity of environmental performance to variations in key input parameters, consistent with established uncertainty analysis practices in life cycle assessment [22,23,24,25].
Figure 7.
Monte Carlo simulation results for the global warming potential (GWP100, IPCC 2021) of CO2 electroreduction to ethanol using anion-exchange membrane (AEM) and bipolar membrane (BPM) electrolyzers under different Austrian electricity-supply scenarios. The probability distributions represent uncertainty arising from stochastic variation in key input parameters, and the vertical lines indicate the corresponding mean GWP100 values. Areas in which the distributions overlap indicate scenarios with partially similar environmental-performance ranges despite differences in their mean values. The overlap should therefore be considered together with the distribution widths and mean positions when interpreting the robustness of the scenario comparisons.
Wind-based scenarios consistently exhibit the lowest environmental impacts, with relatively narrow probability distributions, indicating robust and stable performance under uncertainty. This behavior can be attributed to the low carbon intensity and relatively consistent upstream emissions associated with wind electricity systems [33,34,48]. The narrow spread further suggests that variations in input parameters have limited influence on the overall environmental outcome in low-carbon energy scenarios.
In contrast, grid-based scenarios display higher mean GWP values and wider probability distributions, reflecting greater variability and uncertainty. This is primarily due to fluctuations in the carbon intensity of electricity generation and upstream emissions associated with fossil fuel-based energy systems [10,18,21,43,45]. The broader distributions indicate that environmental performance is highly sensitive to variations in electricity-related parameters in these scenarios.
Photovoltaic (PV) scenarios demonstrate intermediate performance, with moderate mean values and uncertainty ranges. The variability observed in these scenarios is largely influenced by uncertainties in upstream processes, including material production, panel manufacturing, and system lifetimes, which are known to contribute significantly to life cycle impacts of photovoltaic systems [17,20,34].
Across all scenarios, AEM systems exhibit lower mean GWP values and reduced variability compared to BPM systems, confirming their superior energy efficiency and more stable environmental performance. This difference is directly linked to the lower electricity consumption of AEM electrolyzers, whereas BPM systems are associated with higher energy demand and additional operational losses, leading to amplified variability in environmental outcomes [14,35,36,37,38,50].
Importantly, the probability distributions show minimal overlap between the best-performing (wind-based) and worst-performing (grid-based) scenarios. This indicates that the ranking of scenarios is robust despite uncertainty in input parameters, and that the conclusions regarding the superiority of renewable electricity sources remain valid [22,23].
Overall, the Monte Carlo analysis confirms that the electricity source is the dominant factor influencing environmental performance, and that the key findings of this study remain robust under uncertainty. These results reinforce the importance of integrating low-carbon electricity sources and improving energy efficiency to achieve sustainable CO2 electroreduction pathways, in agreement with previous LCA and uncertainty studies [2,3,4,10,18,21,39,40].
The analysis distinguishes scenario uncertainty from parameter uncertainty. Scenario uncertainty is represented directly through the three electricity backgrounds. Parameter uncertainty remains important for electricity demand, CO2 utilization, separation heat, oxygen recovery, membrane and catalyst lifetime, and product concentration; however, defensible probability distributions and correlations were unavailable for several foreground parameters. Consequently, the present study reports deterministic consistency checks rather than a Monte Carlo analysis. A future probabilistic assessment should document the distribution type, central value, spread, truncation, correlations, iteration count, random seed, and reported percentile interval for every uncertain parameter [54]. The electricity and heat scenarios considered in the life cycle assessment, together with their corresponding background datasets and assumptions, are summarized in Table 5.
Table 5.
Internal consistency checks applied to the revised manuscript.
2.10. Data Quality and Methodological Limitations
The study is prospective and combines laboratory-scale evidence with engineering assumptions. Temporal, geographical, and technological representativeness are therefore uneven. Electricity datasets are geographically specific; electrolysis energy is based on modeled process values rather than long-duration industrial operation; membrane and catalyst replacement are incompletely represented; and the separation burden depends strongly on uncertain product concentration and recovery assumptions. These limitations are typical of early-stage electrochemical process assessments and should be addressed through scenario analysis, transparent data-quality scoring, and progressively updated inventories [47,48,54]. The oxygen credit and the BPM Austrian-grid result are the highest-priority model-verification issues.
The present study does not model individual commercially available AEM or BPM products and should not be interpreted as a product-specific comparison of membrane manufacturers or membrane grades. Commercial membranes can differ in ionic conductivity, thickness, ion-exchange capacity, water uptake, swelling behavior, carbonate transport, product crossover, chemical stability, and operational lifetime. These characteristics can affect full-cell resistance, cell voltage, carbon utilization, membrane replacement frequency, and ultimately life-cycle environmental performance. The AEM and BPM configurations considered here are therefore represented as harmonized system-level archetypes based on reported membrane operating mechanisms and process-energy requirements. The modeled differences reflect configuration-level energy and transport characteristics rather than the performance of a specific commercial membrane. Product-specific conductivity, crossover, degradation, lifetime, and membrane-manufacturing inventories should be incorporated in future assessments when consistent and transparent commercial or long-duration experimental data become available. The life cycle inventory data and corresponding background datasets used for the impact assessment are summarized in Table 6.
Table 6.
Data-quality assessment and priority actions. Priority ranking reflects established uncertainty considerations in Ref. [54].
3. Results
3.1. Climate-Change Results by Electricity Scenario
Table 7 and Figure 3 summarize the IPCC 2021 GWP100 results. Wind electricity yields the lowest climate-change impact for both membrane configurations: 0.318 kg CO2-eq kg−1 ethanol for AEM and 0.442 kg CO2-eq kg−1 for BPM. Photovoltaic electricity produces intermediate values of 1.812 and 2.231 kg CO2-eq kg−1 for AEM and BPM, respectively. The Austrian-grid values are 1.349 kg CO2-eq kg−1 for AEM and 4.686 kg CO2-eq kg−1 for BPM. The strong dependence on electricity background is consistent with prospective LCA and techno-economic studies of electrochemical CO2 conversion [9,10,47,48,49,50,51,52].
Table 7.
Reported GWP100 results for the modeled electricity and membrane scenarios.
Figure 3 reports the IPCC 2021 GWP100 values for AEM and BPM CO2-to-ethanol systems under wind, photovoltaic, and Austrian-grid electricity. Values are normalized to 1 kg of ethanol at the plant gate.
The scenario ranking indicates that the life-cycle burden of electricity is more influential than the membrane distinction alone. Wind electricity reduces the burden of electrochemical energy demand sufficiently for fixed material, heat, CO2-supply, and co-product contributions to become comparatively more visible. Photovoltaic electricity remains substantially below the BPM-grid result but exceeds the AEM Austrian-grid result in the modeled system, reflecting the relatively low-carbon Austrian electricity mix and the embodied burdens of photovoltaic infrastructure represented in the background database [47,48,49,59].
3.2. AEM–BPM Differences
The BPM system consumes 4.60 kWh more electricity per kilogram of ethanol than the AEM system, corresponding to a 19.7% increase. Under wind electricity, the BPM GWP is 39.0% higher than the AEM value; under photovoltaic electricity, it is 23.1% higher. These differences are directionally consistent with the additional voltage and energy demand expected for BPM operation, although their exact magnitude also reflects fixed foreground contributions and the relative size of the oxygen credit [37,38,39,40,41,42,43,44,45,46].
The Austrian-grid difference is substantially larger: the BPM result is 247% above the AEM value. A 19.7% increase in electricity demand cannot explain this gap if all other foreground exchanges and background electricity links are identical. The difference therefore indicates either an additional BPM-specific exchange, a different grid-market or voltage-transformation chain, an inconsistent co-product sign, or another database-linkage discrepancy. The reported value is retained for transparency but should be regarded as provisional until the Activity Browser technosphere links, amounts, locations, and exchange signs are audited [53,54,59]. The results corresponding to this analysis are summarized in Table 8.
Table 8.
Membrane-specific differences and model-consistency interpretation.
3.3. Contribution Structure and Environmental Hotspots
The process-network diagram and contribution views indicate that electricity production is the dominant positive contribution in all scenarios, which is physically consistent with total electricity demands above 23 kWh kg−1 ethanol. The contribution increases for BPM because of the additional energy required for bipolar-junction water dissociation and transport through the membrane layers. Under wind electricity, the impact per kilowatt-hour is sufficiently low to reduce the electricity contribution, whereas grid and photovoltaic scenarios retain larger upstream burdens [37,38,39,40,41,42,43,44,45,46,47,48,49].
Separation heat is the second major operational hotspot. The 19.38 MJ kg−1 heat input is associated with recovering dilute ethanol from an aqueous product stream. Even when electrolysis is supplied by low-carbon electricity, thermally driven recovery can prevent total GWP from approaching zero. The environmental importance of separation therefore depends on outlet ethanol concentration, product recovery, heat integration, distillation configuration, and access to low-carbon heat [47,48,49,50,51,52].
CO2 supply, electrolyte make-up, monoethanolamine, water, polymers, and carbon-fiber-reinforced plastic contribute less to GWP than energy in the modeled inventory. Their relative importance increases under wind electricity because the electricity burden becomes smaller. Moreover, a low contribution to GWP does not imply negligible performance in other impact categories; polymers, metals, chemicals, and water may become important for toxicity, resource use, and water-related indicators [47,48,53].
The oxygen co-product appears to be an avoided burden. Because the base case substitutes liquid oxygen, the credit may be optimistic unless the anodic oxygen is purified, compressed, and delivered at equivalent quality. A no-credit rerun would increase all scenario results but would not necessarily change the qualitative ranking if oxygen treatment were applied consistently to AEM and BPM systems. The magnitude of the credit should therefore be tested explicitly in future sensitivity analysis [47,48,53,54].
3.4. Stoichiometric and Process-Level Interpretation
The modeled CO2 input is 8.7% above the theoretical requirement. This relatively narrow difference implies an effective mass-based utilization of approximately 92%, which is ambitious for a system subject to carbonate formation, product selectivity losses, gas purge, and incomplete recycle. Future models should link CO2 input to measured single-pass conversion, carbon efficiency, carbonate crossover, and recycle recovery rather than representing all non-idealities with one aggregated factor [9,10,36,39].
Process-water demand is more than three times the theoretical water consumption. This difference is plausible because most process water is not consumed stoichiometrically; it circulates through electrolyte preparation, humidification, washing, cooling, and purification. Nevertheless, consumptive and circulating water flows should be separated in a future water-footprint assessment. Likewise, the oxygen output is currently stoichiometric rather than charge-based. A rigorous electrochemical balance should calculate anodic oxygen from total charge and anodic Faradaic efficiency and then apply recovery, purity, compression, and marketability factors [6,7,8,47,54].
3.5. Electricity-Scenario Interpretation
The wind scenarios demonstrate the potential climate benefit of coupling CO2 electrolysis with low-impact electricity. However, the result does not imply that every wind-powered plant will achieve the same GWP. Turbine technology, capacity factor, lifetime, grid connection, curtailment, and regional manufacturing influence the background burden. Photovoltaic results likewise depend on module technology, manufacturing electricity, irradiation, lifetime, and balance-of-system assumptions [47,48,49,53,59].
The Austrian-grid result is geographically specific and should not be transferred directly to countries with fossil-intensive electricity mixes. Transferability is better evaluated by separating foreground electricity demand from the background emission factor. Because AEM and BPM require 23.32 and 27.92 kWh kg−1 ethanol, respectively, each increase of 0.1 kg CO2-eq kWh−1 in electricity intensity would add approximately 2.33 kg CO2-eq to the AEM product and 2.79 kg CO2-eq to the BPM product before fixed burdens and credits are considered. This relationship explains why electricity-system decarbonization is a prerequisite for low-impact electrochemical ethanol [3,4,5,9,10,47,48,49,50,51,52].
4. Discussion
4.1. Comparison with the Wider CO2-to-Ethanol Literature
The strong influence of electricity is consistent with prospective LCA and techno-economic studies of CO2 conversion and power-to-ethanol systems [47,48,49,50]. These studies show that low-carbon electricity, high energy efficiency, high selectivity, durable stacks, and efficient separation are required simultaneously; improvement in one metric cannot indefinitely compensate for poor performance elsewhere.
Catalyst research has produced substantial advances in ethanol selectivity and mechanistic control, including asymmetric C–C coupling, tandem and bimetallic interfaces, nanograin boundaries, pathway switching, and microenvironment engineering [11,13,17,18,19,33,55,56]. Nevertheless, LCA requires performance values at the integrated-cell level. Reported catalyst selectivity should therefore be accompanied by full-cell voltage, total current density, product concentration, single-pass carbon utilization, carbon balance, stability, membrane crossover, and separation assumptions [6,7,8,9,10].
The AEM–BPM comparison reflects a well-established physical trade-off. AEMs can reduce voltage and electricity demand, whereas BPMs can improve pH management and, in some configurations, carbon utilization [38,39,45,46]. Recent forward-bias and membrane-engineering studies seek to reduce the BPM voltage penalty and improve pure-water operation [40,41,42]. If these developments lower total system electricity while retaining carbon-management benefits, the environmental ranking could change. The present results should therefore not be interpreted as a permanent judgment that AEMs are environmentally superior; they apply to the foreground inventory and background datasets evaluated here.
4.2. Implications for Electrolyzer Design
The results identify four interdependent design priorities. First, total cell voltage must be reduced at commercially relevant current density. Second, ethanol selectivity must increase without sacrificing carbon efficiency, stability, or product concentration. Third, the electrolyzer should generate the most concentrated practical ethanol stream to reduce downstream heat. Fourth, CO2 and electrolyte recycle should minimize compression, purification, carbonate loss, and purge requirements. These objectives are coupled: increasing current density may worsen mass transfer, flooding, and salt precipitation, while changing membrane transport can alter local pH, carbonate formation, and product crossover [6,7,8,30,32,33,34,35,36,37,38,39,40,41,42,43,44,45,46].
For AEM systems, the most important research targets are lower carbonate loss, improved water management, reduced ethanol crossover, and stable operation at high current density. For BPM systems, the key targets are lower water-dissociation overpotential, thinner and more conductive layers, durable bipolar junctions, and operating strategies that translate improved carbon management into a net reduction in total system energy and CO2 demand [37,38,39,40,41,42,43,44,45,46]. Membrane, catalyst, and gas-diffusion-electrode lifetimes should be reported because frequent replacement can increase material burdens and downtime even when their contribution to a single GWP result appears small [6,7,8,30,47,54]. The results obtained for the evaluated scenarios are summarized in Table 9.
Table 9.
Decision-oriented interpretation of membrane and process-development priorities. The decision criteria synthesize evidence from Refs. [37,38,39,40,41,42,43,44,45,46,47,48,49,50,51,52].
4.3. Separation and Process Integration
Downstream separation is frequently underestimated in laboratory-centered assessments. Ethanol is produced in water together with electrolyte and potentially other liquid products, and recovery energy rises sharply as product concentration decreases. Process-intensification options include membrane-assisted recovery, adsorption, pervaporation, selective extraction, heat-pump-assisted distillation, and integration with low-grade industrial heat. Each option, however, introduces additional materials, electricity, solvent-recovery duties, or selectivity constraints that must be represented in the LCA [47,48,49,50,51,52].
A more rigorous model should calculate separation energy from a process simulation linked to measured ethanol concentration, recovery, and co-product distribution. The 19.38 MJ kg−1 value used here should therefore be regarded as a transparent engineering input rather than a universal property of CO2-to-ethanol conversion. Reporting inlet composition, ethanol recovery, product purity, reflux ratio, heat source, and heat-integration level would substantially improve reproducibility and comparability [47,48,49,50,52].
4.4. Oxygen Credit and Carbon Accounting
The oxygen credit illustrates the distinction between physical co-production and environmental substitution. The electrolyzer physically produces oxygen, but an avoided burden arises only when that oxygen replaces a market product of equivalent function and quality. If the oxygen is vented, lacks market demand, or requires substantial purification and compression, the credit should be reduced or removed. A consequential assessment could additionally consider regional oxygen-market saturation, whereas the attributional system-expansion approach used here assumes substitution without explicitly modeling market constraints [47,48,53,54].
Carbon accounting should likewise distinguish captured CO2 input from permanent climate mitigation. Carbon incorporated into ethanol is generally released when the product is combusted or oxidized. The cradle-to-gate model therefore evaluates production burdens and does not claim permanent carbon removal. Climate benefit relative to fossil ethanol or gasoline would require a cradle-to-grave comparison including the CO2 source, capture energy, use-phase emissions, displaced product, and temporal carbon storage [1,2,3,4,5,47,48,51].
4.5. Model Verification and Reproducibility
The most important verification action is an exchange-by-exchange comparison of the AEM and BPM Austrian-grid models. Foreground amounts should be exported to a machine-readable table, and each electricity exchange should be checked for dataset name, location, voltage level, sign, and amount. The oxygen exchange should be checked for an identical sign and substitution dataset, followed by comparison of heat, CO2, water, electrolyte, and infrastructure exchanges. Only after these checks have taken place should the 4.686 kg CO2-eq BPM-grid result be interpreted as a membrane effect [53,54,59].
A reproducible supplementary package should contain the Activity Browser project, a machine-readable inventory table, dataset identifiers, impact-method identifier, software version, database version and system model, parameter definitions, and a documented procedure for generating each scenario. Probabilistic uncertainty should be added only when foreground distributions and correlations are defensible. At minimum, the number of iterations, distribution type, central value, spread, truncation, random seed, and reported percentile interval should be disclosed [53,54,59]. The results of the present analysis are summarized in Table 10.
Table 10.
Minimum reporting package recommended for reproducible prospective CO2-electrolysis LCA.
4.6. Additional Evidence Considered
Complementary evidence on reactive capture and nanoporous copper electrodes was also considered to broaden the discussion of carbon-efficient process integration and catalyst-structure effects. These studies were used to identify future data needs rather than to introduce additional numerical assumptions into the present inventory [60,61].
5. Conclusions
This study presents a detailed cradle-to-gate LCA framework for comparing AEM and BPM electrochemical CO2-to-ethanol systems. The functional unit is 1 kg of ethanol at the plant gate, and the inventory explicitly distinguishes theoretical stoichiometry from process-level consumption. Per functional unit, the modeled process uses 2.08 kg of CO2, 3.80 kg of process water, and 19.38 MJ of separation heat, together with total electricity demands of 23.32 kWh for AEM and 27.92 kWh for BPM.
Wind electricity gives the lowest reported climate-change impacts: 0.318 kg CO2-eq kg−1 for AEM and 0.442 kg CO2-eq kg−1 for BPM. Photovoltaic electricity gives 1.812 and 2.231 kg CO2-eq kg−1, respectively, while the Austrian-grid results are 1.349 and 4.686 kg CO2-eq kg−1. The AEM configuration performs better in every reported scenario, primarily because of its lower electricity demand. However, the BPM Austrian-grid difference is much larger than the 19.7% electricity-demand penalty and must be verified at the database-linkage level before it is presented as a physical membrane effect.
The analysis confirms that low-carbon electricity is necessary but not sufficient. Separation heat, carbon utilization, product concentration, CO2 recycle, membrane and catalyst lifetime, and oxygen co-product treatment can materially influence environmental performance. Future BPM systems will become more competitive only if improved carbon management is achieved with a substantially lower voltage penalty. AEM systems, in turn, must control carbonate loss and product crossover while maintaining stable high-current-density operation.
The principal conclusion is that membrane choice cannot be separated from electricity supply, carbon management, and downstream recovery. The framework developed here is suitable for prospective process development and comparative decision support, provided that the BPM-grid linkage, oxygen-substitution assumption, and foreground uncertainties are resolved before final publication. A broader environmental assessment should subsequently extend the analysis beyond GWP100 to resource use, toxicity, water-related impacts, and infrastructure replacement.
Author Contributions
Conceptualization, A.G. and M.H.; methodology, A.G.; software, A.G.; validation, A.G. and M.H.; formal analysis, A.G.; investigation, A.G.; data curation, A.G.; writing—original draft preparation, A.G.; writing—review and editing, A.G. and M.H.; visualization, A.G.; supervision, M.H. All authors have read and agreed to the published version of the manuscript.
Funding
This research received no external funding.
Institutional Review Board Statement
Not applicable.
Informed Consent Statement
Not applicable.
Data Availability Statement
The principal inventory values and scenario results used in this study are reported in the manuscript. The Activity Browser project, exchange-level inventory export, and supplementary verification files can be made available by the corresponding author upon reasonable request, subject to database-license restrictions.
Acknowledgments
The authors acknowledge the TU Wien Bibliothek for financial support through its Open Access Funding Programme.
Conflicts of Interest
The authors declare no conflicts of interest.
References
- IPCC. Climate Change 2021: The Physical Science Basis. Contribution of Working Group I to the Sixth Assessment Report of the Intergovernmental Panel on Climate Change; Cambridge University Press: Cambridge, UK, 2021. [Google Scholar]
- Bui, M.; Adjiman, C.S.; Bardow, A.; Anthony, E.J.; Boston, A.; Brown, S.; Fennell, P.S.; Fuss, S.; Galindo, A.; Hackett, L.A.; et al. Carbon capture and storage (CCS): The way forward. Energy Environ. Sci. 2018, 11, 1062–1176. [Google Scholar] [CrossRef] [Scilit]
- De Luna, P.; Hahn, C.; Higgins, D.; Jaffer, S.A.; Jaramillo, T.F.; Sargent, E.H. What would it take for renewably powered electrosynthesis to displace petrochemical processes? Science 2019, 364, eaav3506. [Google Scholar] [CrossRef] [Scilit] [PubMed]
- Kumar, B.; Muchharla, B.; Dikshit, M.; Dongare, S.; Kumar, K.; Gurkan, B.; Spurgeon, J.M. Electrochemical CO2 Conversion Commercialization Pathways: A Concise Review on Experimental Frontiers and Technoeconomic Analysis. Environ. Sci. Technol. Lett. 2024, 11, 1161–1174. [Google Scholar] [CrossRef] [Scilit] [PubMed]
- IEAGHG. Techno-Economic Assessment of Electrochemical CO2 Conversion Technologies; Tech. Rep. 2023-03; IEAGHG: Cheltenham, UK, 2023. [Google Scholar]
- Wakerley, D.; Lamaison, S.; Wicks, J.; Clemens, A.; Feaster, J.; Corral, D.; Jaffer, S.A.; Sarkar, A.; Fontecave, M.; Duoss, E.B.; et al. Gas diffusion electrodes, reactor designs and key metrics of low-temperature CO2 electrolysers. Nat. Energy 2022, 7, 130–143. [Google Scholar] [CrossRef] [Scilit]
- Lu, X.; Dereli, B.; Shinagawa, T.; Eddaoudi, M.; Cavallo, L.; Takanabe, K. High Current Density Microkinetic and Electronic Structure Analysis of CO2 Reduction Using Co and Fe Complexes on Gas Diffusion Electrode. Chem Catal. 2022, 2, 1143–1162. [Google Scholar] [CrossRef] [Scilit]
- Henckel, D.A.; Saha, P.; Rajana, S.; Baez-Cotto, C.; Taylor, A.K.; Liu, Z.; Resch, M.G.; Masel, R.I.; Neyerlin, K.C. Understanding Limitations in Electrochemical Conversion to CO at Low CO2 Concentrations. ACS Energy Lett. 2024, 9, 3433–3439. [Google Scholar] [CrossRef] [Scilit] [PubMed]
- Jouny, M.; Luc, W.; Jiao, F. General techno-economic analysis of CO2 electrolysis systems. Ind. Eng. Chem. Res. 2018, 57, 2165–2177. [Google Scholar] [CrossRef] [Scilit]
- Pickett, I.; Vo, T.; Wu, H.Y.; Expósito, A.J. A Technoeconomic Model Coupled with HYSYS to Analyze the Electroreduction of Carbon Dioxide to Ethanol. Adv. Theory Simul. 2023, 6, 2200782. [Google Scholar] [CrossRef] [Scilit]
- Wang, P.; Yang, H.; Tang, C.; Wu, Y.; Zheng, Y.; Cheng, T.; Davey, K.; Huang, X.; Qiao, S.-Z. Boosting electrocatalytic CO2-to-ethanol production via asymmetric C–C coupling. Nat. Commun. 2022, 13, 3754. [Google Scholar] [CrossRef] [Scilit] [PubMed]
- Alkoshab, M.Q.; Thomou, E.; Abdulazeez, I.; Suliman, M.H.; Spyrou, K.; Iali, W.; Alhooshani, K.; Baroud, T.N. Low-overpotential electrochemical reduction of CO2 to ethanol enabled by Cu/CuxO nanoparticles embedded in nitrogen-doped carbon cuboids. Nanomaterials 2023, 13, 230. [Google Scholar] [CrossRef] [Scilit] [PubMed]
- Ma, X.; Zhang, G.; Du, J.; Lin, X.; Zhen, S.; Cheng, D.; Wang, C.; Chang, X.; Wu, S.; Shi, X.; et al. Directing CO2 electroreduction to ethanol via delicate geometrical modification of copper-based alloys. Mater. Horiz. 2025, 12, 5694–5701. [Google Scholar] [CrossRef] [Scilit] [PubMed]
- Robens, E.; Hecker, B.; Kungl, H.; Tempel, H.; Eichel, R.-A. Bimetallic copper–silver catalysts for the electrochemical reduction of CO2 to ethanol. ACS Appl. Energy Mater. 2023, 6, 7571–7577. [Google Scholar] [CrossRef] [Scilit]
- Park, Y.S.; Jeong, J.; Noh, Y.; Jang, M.J.; Lee, J.; Lee, K.H.; Lim, D.C.; Seo, M.H.; Kim, W.B.; Yang, J.; et al. Commercial anion exchange membrane water electrolyzer stack through non-precious metal electrocatalysts. Appl. Catal. B Environ. 2021, 292, 120170. [Google Scholar] [CrossRef] [Scilit]
- Song, Y.; Peng, R.; Hensley, D.K.; Bonnesen, P.V.; Liang, L.; Wu, Z.; Meyer, H.M.; Chi, M.; Ma, C.; Sumpter, B.G.; et al. High-selectivity electrochemical conversion of CO2 to ethanol using a Cu nanoparticle/N-doped graphene electrode. ChemistrySelect 2016, 1, 6055–6061. [Google Scholar] [CrossRef] [Scilit]
- Li, J.; Xiong, H.; Liu, X.; Wu, D.; Su, D.; Xu, B.; Lu, Q. Weak CO binding sites induced by Cu–Ag interfaces promote CO electroreduction to multi-carbon liquid products. Nat. Commun. 2023, 14, 698. [Google Scholar] [CrossRef] [Scilit] [PubMed]
- Zhang, T.; Xu, S.; Chen, D.; Luo, T.; Zhou, J.; Kong, L.; Feng, J.; Lu, J.; Weng, X.; Wang, A.; et al. Selective increase in CO2 electroreduction to ethanol via nanograin-boundary Cu(I)/Cu(0) sites. Angew. Chem. Int. Ed. 2024, 63, e202407748. [Google Scholar] [CrossRef] [Scilit] [PubMed]
- Zhan, C.; Dattila, F.; Rettenmaier, C.; Herzog, A.; Herran, M.; Wagner, T.; Scholten, F.; Bergmann, A.; López, N.; Cuenya, B.R. Key intermediates and Cu active sites for CO2 electroreduction to ethylene and ethanol. Nat. Energy 2024, 9, 1485–1496. [Google Scholar] [CrossRef] [Scilit] [PubMed]
- Ting, L.R.L.; Piqué, O.; Lim, S.Y.; Tanhaei, M.; Calle-Vallejo, F.; Yeo, B.S. Enhancing CO2 electroreduction to ethanol on copper–silver composites by opening an alternative catalytic pathway. ACS Catal. 2020, 10, 4059–4069. [Google Scholar] [CrossRef] [Scilit]
- Tang, H.; Liu, Y.; Zhou, Y.; Qian, Y.; Lin, B.-L. Boosting the electroreduction of CO2 to ethanol via the synergistic effect of Cu–Ag bimetallic catalysts. ACS Appl. Energy Mater. 2022, 5, 14045–14052. [Google Scholar] [CrossRef] [Scilit]
- Chen, J.; Qiu, H.; Zhao, Y.; Yang, H.; Fan, L.; Liu, Z.; Xi, S.; Zheng, G.; Chen, J.; Chen, L.; et al. Selective and stable CO2 electroreduction at high rates via control of the local H2O/CO2 ratio. Nat. Commun. 2024, 15, 5893. [Google Scholar] [CrossRef] [Scilit] [PubMed]
- Kuang, S.; Su, Y.; Li, M.; Liu, H.; Chuai, H.; Chen, X.; Hensen, E.J.M.; Meyer, T.J.; Zhang, S.; Ma, X. Asymmetrical electrohydrogenation of CO2 to ethanol with a Cu/Au heterojunction. Proc. Natl. Acad. Sci. USA 2023, 120, e2214175120. [Google Scholar] [CrossRef] [Scilit] [PubMed]
- Ren, D.; Ang, B.S.-H.; Yeo, B.S. Tuning the selectivity of carbon dioxide electroreduction toward ethanol on oxide-derived Cu–Zn catalysts. ACS Catal. 2016, 6, 8239–8247. [Google Scholar] [CrossRef] [Scilit]
- Zhang, K.; Wang, J.; Zhang, W.; Yin, H.; Han, J.; Yang, X.; Fan, W.; Zhang, Y.; Zhang, P. Regulated Surface Electronic States of CuNi Nanoparticles through Metal-Support Interaction for Enhanced Electrocatalytic CO2 Reduction to Ethanol. Small 2023, 19, e2300281. [Google Scholar] [CrossRef] [Scilit] [PubMed]
- Chala, S.A.; Liu, R.; Oseghe, E.O.; Clausing, S.T.; Kampf, C.; Bansmann, J.; Clark, A.H.; Zhou, Y.; Lieberwirth, I.; Biskupek, J.; et al. Selective electroreduction of CO2 to ethanol via cobalt-based catalysts. ACS Catal. 2024, 14, 15553–15564. [Google Scholar] [CrossRef] [Scilit]
- Zhao, Y.; Yuan, Q.; Xu, R.; Zhang, C.; Sun, K.; Wang, A.; Zhang, A.; Wang, Z.; Jiang, J.; Fan, M. Boosting electrochemical conversion of CO2 to ethanol through the confinement of pyridinic N–B layer on copper nanoparticles. Appl. Catal. B Environ. Energy 2024, 355, 124168. [Google Scholar] [CrossRef] [Scilit]
- Wang, Z.; Li, Y.; Ma, Z.; Wang, D.; Ren, X. Strategies for overcoming challenges in selective electrochemical CO2 conversion to ethanol. iScience 2024, 27, 110437. [Google Scholar] [CrossRef] [Scilit] [PubMed]
- Parkash, A.; Kadier, A.; Ma, P.-C. Copper-deposited basalt-fiber fabric for electrochemical CO2 reduction to ethanol with high selectivity. Energy 2025, 327, 136453. [Google Scholar] [CrossRef] [Scilit]
- Patil, J.V.; Mali, S.S.; Hong, C.K. Holmium rare earth metal ion incorporated and ambient-air processed all-inorganic γ-CsPbI2.5Br0.5 perovskite solar cells yielding high efficiency and stable performance. J. Mater. Chem. A 2023, 11, 21312–21321. [Google Scholar] [CrossRef] [Scilit]
- Papangelakis, P.; O’bRien, C.P.; Zeraati, A.S.; Liu, S.; Paik, A.; Nelson, V.; Park, S.; Xiao, Y.C.; Dorakhan, R.; Sun, P.; et al. Scaled CO electroreduction to alcohols. Nat. Commun. 2025, 16, 4969. [Google Scholar] [CrossRef] [Scilit] [PubMed]
- Lin, Y.; Wang, T.; Zhang, L.; Zhang, G.; Li, L.; Chang, Q.; Pang, Z.; Gao, H.; Huang, K.; Zhang, P.; et al. Tunable CO2 electroreduction to ethanol and ethylene with controllable interfacial wettability. Nat. Commun. 2023, 14, 3575. [Google Scholar] [CrossRef] [Scilit] [PubMed]
- Da, Y.; Chen, J.; Fan, L.; Jiang, R.; Xiao, Y.; Wang, M.; Chen, G.; Tian, Z.; Zhang, H.; Jin, H.; et al. Selective and Energy Efficient Electrocatalytic CO2-to-Ethanol Conversion through Anion Modulation. Angew. Chem. Int. Ed. 2025, 64, e202506867. [Google Scholar] [CrossRef] [Scilit] [PubMed]
- Dinh, C.-T.; Burdyny, T.; Kibria, M.G.; Seifitokaldani, A.; Gabardo, C.M.; de Arquer, F.P.G.; Kiani, A.; Edwards, J.P.; De Luna, P.; Bushuyev, O.S.; et al. CO2 electroreduction to ethylene via hydroxide-mediated copper catalysis at an abrupt interface. Science 2018, 360, 783–787. [Google Scholar] [CrossRef] [Scilit] [PubMed]
- Chang, F.; Xiao, M.; Miao, R.; Liu, Y.; Ren, M.; Jia, Z.; Han, D.; Yuan, Y.; Bai, Z.; Yang, L. Copper-based catalysts for electrochemical carbon dioxide reduction to multicarbon products. Electrochem. Energy Rev. 2022, 5, 4. [Google Scholar] [CrossRef] [Scilit]
- Ozden, A.; Li, J.; Kandambeth, S.; Li, X.-Y.; Liu, S.; Shekhah, O.; Ou, P.; Finfrock, Y.Z.; Wang, Y.-K.; Alkayyali, T.; et al. Energy- and carbon-efficient CO2/CO electrolysis to multicarbon products via asymmetric ion migration–adsorption. Nat. Energy 2023, 8, 179–190. [Google Scholar] [CrossRef] [Scilit]
- Bui, J.C.; Lucas, É.; Lees, E.W.; Liu, A.K.; Atwater, H.A.; Xiang, C.; Bell, A.T.; Weber, A.Z. Analysis of bipolar membranes for electrochemical CO2 capture from air and ocean water. Energy Environ. Sci. 2023, 16, 5076–5095. [Google Scholar] [CrossRef] [Scilit]
- Siritanaratkul, B.; Forster, M.; Greenwell, F.; Sharma, P.K.; Yu, E.H.; Cowan, A.J. Zero-gap bipolar membrane electrolyzer for carbon dioxide reduction using acid-tolerant molecular electrocatalysts. J. Am. Chem. Soc. 2022, 144, 7551–7556. [Google Scholar] [CrossRef] [Scilit] [PubMed]
- Xie, K.; Miao, R.K.; Ozden, A.; Liu, S.; Chen, Z.; Dinh, C.-T.; Huang, J.E.; Xu, Q.; Gabardo, C.M.; Lee, G.; et al. Bipolar-membrane electrolyzers enable high single-pass CO2 electroreduction to multicarbon products. Nat. Commun. 2022, 13, 3609. [Google Scholar] [CrossRef] [Scilit] [PubMed]
- Brückner, S.; Ju, W.; Strasser, P. Efficient forward-bias bipolar-membrane CO2 electrolysis in absence of metal cations. Adv. Energy Mater. 2025, 15, 2500186. [Google Scholar] [CrossRef] [Scilit]
- Heßelmann, M.; Lee, J.K.; Chae, S.; Tricker, A.; Keller, R.G.; Wessling, M.; Su, J.; Kushner, D.; Weber, A.Z.; Peng, X. Pure-water-fed forward-bias bipolar-membrane CO2 electrolyzer. ACS Appl. Mater. Interfaces 2024, 16, 24649–24659. [Google Scholar] [CrossRef] [Scilit] [PubMed]
- Yu, W.; Zhang, Z.; Luo, F.; Li, X.; Duan, F.; Xu, Y.; Liu, Z.; Liang, X.; Wang, Y.; Wu, L.; et al. Tailoring high-performance bipolar membrane for durable pure water electrolysis. Nat. Commun. 2024, 15, 10220. [Google Scholar] [CrossRef] [Scilit] [PubMed]
- Yang, J.; Lu, H.; Zhang, X.; Zhang, Y. Recent advances in bipolar membranes for CO2 electrochemical-reduction electrolyzers. J. Environ. Chem. Eng. 2025, 13, 119587. [Google Scholar] [CrossRef] [Scilit]
- Wu, S.; Shen, F.; Zhao, P.; Chen, T. High-performance bipolar membrane for CO2 electroreduction to CO in organic electrolyte with NaOH and Cl2 produced as by-products. J. Membr. Sci. 2024, 704, 122882. [Google Scholar] [CrossRef] [Scilit]
- Vermaas, D.A.; Wiegman, S.; Nagaki, T.; Smith, W.A. Ion transport mechanisms in bipolar membranes for (photo)electrochemical water splitting. Sustain. Energy Fuels 2018, 2, 2006–2015. [Google Scholar] [CrossRef] [Scilit]
- Endrődi, B.; Kecsenovity, E.; Samu, A.; Darvas, F.; Jones, R.V.; Török, V.; Danyi, A.; Janáky, C. Multilayer Electrolyzer Stack Converts Carbon Dioxide to Gas Products at High Pressure with High Efficiency. ACS Energy Lett. 2019, 4, 1770–1777. [Google Scholar] [CrossRef] [Scilit] [PubMed]
- Mo, W.; Tan, X.-Q.; Ong, W.-J. Prospective life cycle assessment bridging biochemical, thermochemical, and electrochemical CO2 reduction toward sustainable ethanol synthesis. ACS Sustain. Chem. Eng. 2023, 11, 5782–5799. [Google Scholar] [CrossRef] [Scilit]
- Leong, Y.K.; Chang, J.S. Waste stream valorization-based low-carbon bioeconomy utilizing algae as a biorefinery platform. Renew. Sustain. Energy Rev. 2023, 178, 113245. [Google Scholar] [CrossRef] [Scilit]
- Xie, J.; Ajagekar, A.; You, F. Multi-agent attention-based deep reinforcement learning for demand response in grid-responsive buildings. Appl. Energy 2023, 342, 121162. [Google Scholar] [CrossRef] [Scilit]
- Osorio-Tejada, A.M.; Escriba-Gelonch, M.; Vertongen, R.; Bogaerts, A.; Hessel, V. CO2 conversion to CO via plasma and electrolysis: A techno-economic and energy-cost analysis. Energy Environ. Sci. 2024, 17, 5833–5853. [Google Scholar] [CrossRef] [Scilit] [PubMed]
- Garcia, J.A.; Villen-Guzman, M.; Rodriguez-Maroto, J.M.; Paz-Garcia, J.M. Comparing CO2 storage and utilization: Enhancing sustainability through renewable-energy integration. Sustainability 2024, 16, 6639. [Google Scholar] [CrossRef] [Scilit]
- Inocencio-García, P.J.; Alzate, C.A.C. Techno-economic comparison of CO2 valorization through chemical and biotechnological conversion. Waste Biomass Valorization 2025, 16, 3969–3985. [Google Scholar] [CrossRef] [Scilit]
- Huijbregts, M.A.J.; Steinmann, Z.J.N.; Elshout, P.M.F.; Stam, G.; Verones, F.; Vieira, M.; Zijp, M.; Hollander, A.; van Zelm, R. ReCiPe2016: A harmonized life-cycle impact-assessment method at midpoint and endpoint level. Int. J. Life Cycle Assess. 2017, 22, 138–147. [Google Scholar] [CrossRef] [Scilit]
- Cucurachi, S.; Blanco, C.F.; Steubing, B.; Heijungs, R. Implementation of uncertainty analysis and moment-independent global sensitivity analysis for full-scale life cycle assessment models. J. Ind. Ecol. 2022, 26, 374–391. [Google Scholar] [CrossRef] [Scilit]
- Tong, X.; Zhang, P.; Chen, P.; He, Z.; Kang, X.; Yin, Y.; Cheng, Y.; Zhou, M.; Jing, L.; Wang, C.; et al. Switching CO2-reduction pathways between ethylene and ethanol via tuning microenvironment of the coating on copper nanofibers. Angew. Chem. Int. Ed. 2025, 64, e202413005. [Google Scholar] [CrossRef] [Scilit] [PubMed]
- Morales-Guio, C.G.; Cave, E.R.; Nitopi, S.A.; Feaster, J.T.; Wang, L.; Kuhl, K.P.; Jackson, A.; Johnson, N.C.; Abram, D.N.; Hatsukade, T.; et al. Improved CO2-reduction activity toward C2+ alcohols on a tandem gold-on-copper electrocatalyst. Nat. Catal. 2018, 1, 764–771. [Google Scholar] [CrossRef] [Scilit]
- ISO 14040:2006; Environmental Management—Life Cycle Assessment—Principles and Framework. International Organization for Standardization: Geneva, Switzerland, 2006.
- ISO 14044:2006; Environmental Management—Life Cycle Assessment—Requirements and Guidelines. International Organization for Standardization: Geneva, Switzerland, 2006.
- Ecoinvent Association. Ecoinvent Database; Version 3.7.1; Cut-Off System Model; Ecoinvent Association: Zurich, Switzerland, 2020. [Google Scholar]
- Wang, S.; Li, F.; Zhao, J.; Zeng, Y.; Li, Y.; Lin, Z.-Y.; Lee, T.-J.; Liu, S.; Ren, X.; Wang, W.; et al. Manipulating C–C coupling pathway in electrochemical CO2 reduction for selective ethylene and ethanol production over single-atom alloy catalyst. Nat. Commun. 2024, 15, 10247. [Google Scholar] [CrossRef] [Scilit] [PubMed]
- Hoang, T.T.H.; Ma, S.; Gold, J.I.; Kenis, P.J.A.; Gewirth, A.A. Nanoporous Copper Films by Additive-Controlled Electrodeposition: CO2 Reduction Catalysis. ACS Catal. 2017, 7, 3313–3321. [Google Scholar] [CrossRef] [Scilit]

Disclaimer/Publisher’s Note: The statements, opinions and data contained in all publications are solely those of the individual author(s) and contributor(s) and not of MDPI and/or the editor(s). MDPI and/or the editor(s) disclaim responsibility for any injury to people or property resulting from any ideas, methods, instructions or products referred to in the content. |
© 2026 by the authors. Licensee MDPI, Basel, Switzerland. This article is an open access article distributed under the terms and conditions of the Creative Commons Attribution (CC BY) license.