


Abstract
Reliable sustainability analysis requires more than the presence of ESG disclosure; it requires information that is specific, traceable and analytically usable. This exploratory study assesses a purposive corpus of 36 organisations in Bulgaria and Moldova (18 per country) using a Data Gap Matrix covering 15 ESG indicators. The revised framework explicitly separates three observed disclosure-quality dimensions—availability, granularity and auditability—from two framework-assigned analytical overlays—LCSA relevance and environmental-risk relevance. Environmental security is retained only as a framework-based interpretive lens for the environmental-risk overlay and is not treated as an observed outcome. The matrix generated 540 organisation–indicator coding units. Medians, interquartile ranges and score frequencies are the primary descriptive summaries; country and sector tests are retained only as secondary, sample-specific checks and are restricted to the three observed dimensions. Auditability is the principal weakness (median = 1.00), with only 7 of 540 coding units receiving the maximum score, while Scope 3 greenhouse gas emissions constitute the weakest observed indicator. No Holm-adjusted country or sector difference is established for the observed disclosure-quality dimensions, consistent with limited statistical power. The findings diagnose limited disaggregation, source traceability and assurance readiness, but do not measure organisational ESG performance, conduct an LCSA, or establish environmental-security outcomes. Interpretation is constrained by purposive sampling, heterogeneous report types, common-indicator applicability and the absence of independent double coding.
1. Introduction
1.1. Regulatory and Research Context
Sustainability reporting in Europe is undergoing a structural transformation. The Corporate Sustainability Reporting Directive (CSRD) has expanded the scope and regulatory significance of sustainability disclosure, while the European Sustainability Reporting Standards (ESRS) have introduced a more detailed architecture for reporting material impacts, risks and opportunities across environmental, social and governance dimensions [1,2]. Under this framework, sustainability reporting is no longer limited to voluntary corporate communication. It is becoming a regulated information system expected to support comparability, assurance, capital-market transparency, risk assessment and strategic decision-making.
The ESRS framework substantially increases the informational demands placed on organisations. Undertakings are expected to disclose sustainability matters in relation to governance, strategy, impact, risk and opportunity management, and metrics and targets. Environmental standards cover climate change, pollution, water and marine resources, biodiversity and ecosystems, and resource use and circular economies. Social standards cover the undertaking’s own workforce, workers in the value chain, affected communities, consumers and end-users, while governance disclosures address business conduct. This architecture shifts the analytical focus from the mere existence of sustainability reports towards the quality, completeness, traceability and usability of the underlying ESG information.
A central feature of this transformation is double materiality. Organisations must consider both impact materiality, relating to their actual or potential effects on people and the environment, and financial materiality, relating to how sustainability matters affect their development, performance, position, cash flows, access to finance or cost of capital [2]. Double materiality makes ESG data quality particularly important because sustainability disclosures must be connected to evidence-based assessment, documented methodologies, value-chain information and risk-management processes. In this context, missing, aggregated or weakly supported ESG data may undermine not only reporting quality, but also assurance, regulatory confidence and decision usefulness.
The emergence of sustainability assurance further strengthens the importance of auditability. The CSRD introduces assurance requirements for sustainability information, while the International Standard on Sustainability Assurance 5000 (ISSA 5000) provides a global framework for assurance engagements over sustainability information across different topics and reporting frameworks [3]. These developments imply that ESG information must be supported by identifiable sources, documented calculation methods, internal controls, audit trails and verifiable evidence. Previous research has also shown that sustainability assurance is constrained when the underlying data are incomplete, poorly documented or insufficiently standardised [4].
The quality of ESG information is also directly relevant to Life Cycle Sustainability Assessment (LCSA). LCSA integrates environmental Life Cycle Assessment (LCA), Life Cycle Costing (LCC) and Social Life Cycle Assessment (SLCA) to support sustainability assessment across products, processes, organisations and value chains [5,6]. Many ESRS disclosure areas, including greenhouse gas emissions, energy use, resource efficiency, circular economy, workforce impacts and value-chain risks, have clear life-cycle implications. However, LCSA requires structured, granular, comparable and methodologically transparent data rather than general sustainability narratives.
This article therefore examines ESG data gaps in Bulgaria and Moldova from a multiview LCSA and environmental-risk perspective. Bulgaria represents an EU member-state context directly embedded in the CSRD/ESRS framework, while Moldova represents an EU-aligned transition economy progressing through regulatory convergence, institutional modernisation and sustainability-governance reform. The comparison is relevant because both countries face increasing expectations for structured sustainability reporting, but their institutional contexts, reporting traditions and data infrastructures differ. Within this design, environmental security is used only to contextualise the potential governance relevance of information on climate resilience, energy security, resource efficiency, infrastructure vulnerability and pollution prevention [7,8,9].
1.2. Problem Statement
The central problem addressed in this study is the mismatch between the increasing regulatory and methodological expectations placed on ESG reporting and the actual quality of publicly disclosed ESG data. Under the CSRD and ESRS, sustainability information should be material, comparable, specific, verifiable and useful for decision-making. In practice, however, many organisations still disclose ESG information in narrative, fragmented, aggregated or partially quantitative form. Such disclosures may demonstrate awareness of sustainability issues, but they do not necessarily provide data that are suitable for assurance, life-cycle analysis, environmental-risk assessment or regulatory monitoring.
Three dimensions of the problem are particularly important. First, ESG disclosures often suffer from limited granularity. Even when information is present, it may be reported at the group level, without breakdowns by entity, geography, activity, facility, emission scope, value-chain stage or time period. This limits the capacity of users to interpret sustainability performance, assess material risks or compare organisations. Granularity is especially important for indicators such as Scope 3 greenhouse gas emissions, renewable energy, energy consumption, occupational health and safety, workforce composition and ESG risk management.
Second, auditability remains weak. Sustainability information is auditable only when it can be traced back to identifiable sources, documented methods, internal controls, approvals, calculations and, ideally, external assurance. If disclosed data are unsupported, estimated without methodological explanation or presented only as general statements, their credibility and usefulness are reduced. Weak auditability is particularly problematic in the context of ISSA 5000 and the broader movement toward sustainability assurance.
Third, ESG information is increasingly used as a potential input to broader analytical purposes, including multiview LCSA and environmental-risk analysis. Missing or weakly documented information on emissions, energy use, resource efficiency, pollution, infrastructure resilience, climate-risk governance or value-chain impacts may reduce the potential usefulness of public disclosures for such analyses. The present study evaluates data readiness and relevance; it does not test whether disclosure gaps cause environmental insecurity, governance failure or changes in LCSA results.
1.3. Research Gap and Contribution
Although sustainability-reporting quality is widely studied, less attention has been paid to whether individual ESG disclosures are sufficiently available, granular and auditable for downstream analytical use. Existing research commonly evaluates disclosure presence, compliance, aggregate report quality or organisation-level ESG performance, whereas this study focuses on the documentary characteristics required to trace and reuse a specific indicator.
The Data Gap Matrix is therefore distinct from commercial ESG ratings and broad scoring systems such as Refinitiv, MSCI and Bloomberg ESG scores. Commercial ratings typically aggregate heterogeneous information into organisation-level assessments of performance, exposure or risk, and their divergence partly reflects differences in scope, measurement and weighting [10]. By contrast, the matrix used here is a study-specific exploratory rubric: it does not rank organisational sustainability performance, assign investment quality or estimate financial risk. It records the usability of disclosed evidence at the indicator level and keeps observed disclosure quality separate from framework-assigned analytical relevance.
A second gap concerns the connection between ESG reporting and multiview Life Cycle Sustainability Assessment. LCSA requires boundary-explicit, quantitative and methodologically documented information, yet this study does not perform an LCA, LCC or S-LCA. Its contribution is narrower: it diagnoses whether public ESG indicators exhibit data characteristics potentially required for later life-cycle analysis.
A third gap concerns the interpretation of disclosure deficiencies in relation to environmental risk. Environmental-risk relevance is treated as an ex ante analytical classification grounded in climate, energy, resource, infrastructure and pollution domains, not as an observed organisational outcome. Bulgaria and Moldova provide contrasting reporting contexts, but the purposive sample is not representative of either national population and cannot identify causal institutional effects.
Environmental-security scholarship indicates that credible information may be relevant to the anticipation and interpretation of climate-, energy-, resource-, infrastructure- and pollution-related risks [7,8,9]. The present study draws on this literature only to interpret the environmental-risk relevance anchors; it does not assess environmental-security conditions, resilience or governance effectiveness.
The contribution is threefold. First, the study applies an indicator-level rubric that distinguishes disclosure presence from granularity and auditability. Second, it separates those observed properties from LCSA and environmental-risk relevance assigned through predefined anchors. Third, it provides exploratory comparative evidence from two under-researched reporting environments while explicitly delimiting the claims to the selected public-document corpus.
1.4. Aim and Research Questions
The aim is to diagnose the usability of publicly disclosed ESG information in the selected Bulgarian and Moldovan corpus. Availability, granularity and auditability are treated as observed properties of the documents. LCSA relevance and environmental-risk relevance are treated as framework-assigned analytical overlays used to interpret where weak disclosure may matter for subsequent analysis.
The study addresses the following research questions:
RQ1: To what extent do publicly disclosed ESG indicators exhibit the data characteristics potentially required for multiview LCSA?
RQ2: Which ESG indicators show the weakest observed availability, granularity and auditability?
RQ3: How do the observed disclosure-quality gaps align at the indicator level with framework-assigned LCSA and environmental-risk relevance?
For this interpretive purpose, environmental security denotes the potential governance relevance of the five predefined environmental-risk domains rather than an additional empirical variable.
Country and sector comparisons are secondary exploratory checks within the selected corpus. They are not tests of causal effects arising from EU membership, candidate-country status, institutional capacity or reporting culture.
2. Theoretical Background and Conceptual Framework
2.1. ESG Reporting Quality Under CSRD and ESRS
The CSRD and ESRS represent a decisive shift from non-financial reporting towards regulated sustainability reporting. Directive (EU) 2022/2464 expands sustainability reporting obligations and strengthens the link between sustainability information, corporate governance, assurance and transparency [1]. Commission Delegated Regulation (EU) 2023/2772 introduces the first set of ESRS, which defines the structure and content of sustainability disclosures [2].
From a data-quality perspective, the ESRS are important because they require information to be material, specific, comparable and decision-useful. Reporting entities are expected to disclose policies, actions, targets, metrics and governance arrangements in relation to sustainability matters. This requirement implies that high-quality ESG reporting cannot be reduced to general narrative statements. Instead, it requires reliable indicators, clearly defined reporting boundaries, documented methodologies and evidence capable of supporting assurance and stakeholder analysis.
The datapoint logic of the ESRS further increases the importance of disclosure granularity. EFRAG’s implementation guidance and XBRL taxonomy demonstrate the movement toward structured and machine-readable sustainability information [11]. Even though the present article does not analyse digital tagging as an empirical outcome, the regulatory direction is relevant because it confirms that ESG data are expected to become more standardised, comparable and electronically processable. This strengthens the need to assess whether current disclosures already provide sufficiently structured and auditable information [12].
Digitalisation can facilitate the standardisation, integration and electronic processing of ESG information, but it also creates new organisational, competency, data-governance and professional-accounting challenges for the entities responsible for generating, controlling and assuring sustainability data, particularly in smaller enterprises seeking to connect sustainability reporting with circular-economy information [13,14].
2.2. Data Gaps and ESG Information Quality
Data gaps are multidimensional deficiencies in sustainability information. They may arise from missing indicators, excessive aggregation, weak methodological explanation, unsupported estimates, unclear boundaries, lack of comparability or absence of audit evidence. In the context of ESG reporting, a data gap does not necessarily mean that no information is disclosed. An indicator may be present in a sustainability report but still suffer from low usefulness if it is purely narrative, aggregated at group level, not supported by calculations or not comparable across time.
Availability is the first dimension of data quality. ESG information is available when the relevant indicator can be identified and linked to a sustainability matter or reporting area. However, availability should not be equated with meaningful usability. A narrative mention of climate policy or diversity commitment provides a lower level of evidence than a quantified, disaggregated and methodologically explained metric.
Granularity is the second dimension. Granular ESG information is sufficiently disaggregated to support interpretation across scopes, facilities, business units, geographical areas, time periods, value-chain stages or stakeholder categories. Granularity is essential for LCSA because life-cycle interpretation depends on boundaries, flows and contextual detail.
Auditability is the third dimension. ESG information is auditable when it is sup-ported by identifiable sources, calculation methods, internal controls, approvals, third-party verification or assurance. Auditability is becoming increasingly important under the CSRD and ISSA 5000 because sustainability information is expected to become subject to assurance procedures [3].
2.3. Multiview LCSA and the Usability of ESG Data
Life Cycle Sustainability Assessment provides an integrative framework for evaluating sustainability impacts across environmental, economic and social dimensions. The established formulation of LCSA combines environmental LCA, Life Cycle Costing and Social LCA [5,6,15]. This tripartite structure enables the identification of trade-offs, synergies, hotspots and burden-shifting across the life cycle of products, services, organisations and value chains.
For ESG reporting, the relevance of LCSA lies in its ability to transform sustainability information from isolated disclosure items into analytically connected evidence. Environmental indicators such as Scope 1, Scope 2 and Scope 3 emissions, energy use and renewable energy share are directly relevant to environmental LCA and climate-risk assessment [16]. Social indicators such as employee turnover, training, health and safety, diversity and community engagement are relevant to Social LCA, although they often remain less standardised. Governance indicators such as ESG governance, risk management, ethics and transparency influence the reliability of the data-generation process and the capacity to manage sustainability risks.
The integration of ESG reporting and LCSA is methodologically demanding. LCSA-compatible ESG data must be sufficiently structured, disaggregated and documented. If ESG disclosures remain fragmented, narrative or weakly auditable, they cannot reliably support life-cycle-based analysis. Accordingly, the present study treats LCSA relevance as a framework-assigned analytical overlay within the Data Gap Matrix, rather than as an observed disclosure-quality dimension.
2.4. Environmental-Risk Relevance and Environmental-Security Interpretation
Environmental risk encompasses climate-, energy-, resource-, infrastructure- and pollution-related conditions that may affect organisations, institutions and communities. Human-security and European climate-risk frameworks show why credible environmental information can be relevant to governance and preparedness [7,8,9]. However, the present study does not measure environmental-security conditions, resilience or governance effectiveness.
In this article, environmental security refers to the potential governance relevance of information for anticipating and interpreting climate-, energy-, resource-, infrastructure- and pollution-related risks. This perspective draws on human-security and European climate-risk frameworks [7,8,9], but it is operationalised solely through the existing environmental-risk relevance anchors.
Accordingly, references to environmental security identify where weak disclosure may matter for future risk analysis; they do not convert relevance scores into measured exposure, resilience, governance capacity or security outcomes.
Environmental-risk relevance is therefore used only as a framework-assigned analytical overlay. Indicator anchors identify the potential relevance of each ESG item to climate resilience, energy security, resource efficiency, infrastructure vulnerability and pollution prevention. These assignments are conceptually informed classifications rather than empirical outcomes extracted from the organisations’ documents.
The analytical purpose is to identify whether indicators assigned greater potential relevance are also weakly available, granular or auditable. Any resulting “relevance–quality gap” refers to the contrast between an ex ante relevance classification and observed disclosure quality; it does not establish that a disclosure gap caused a governance or security outcome.
2.5. Conceptual Framework
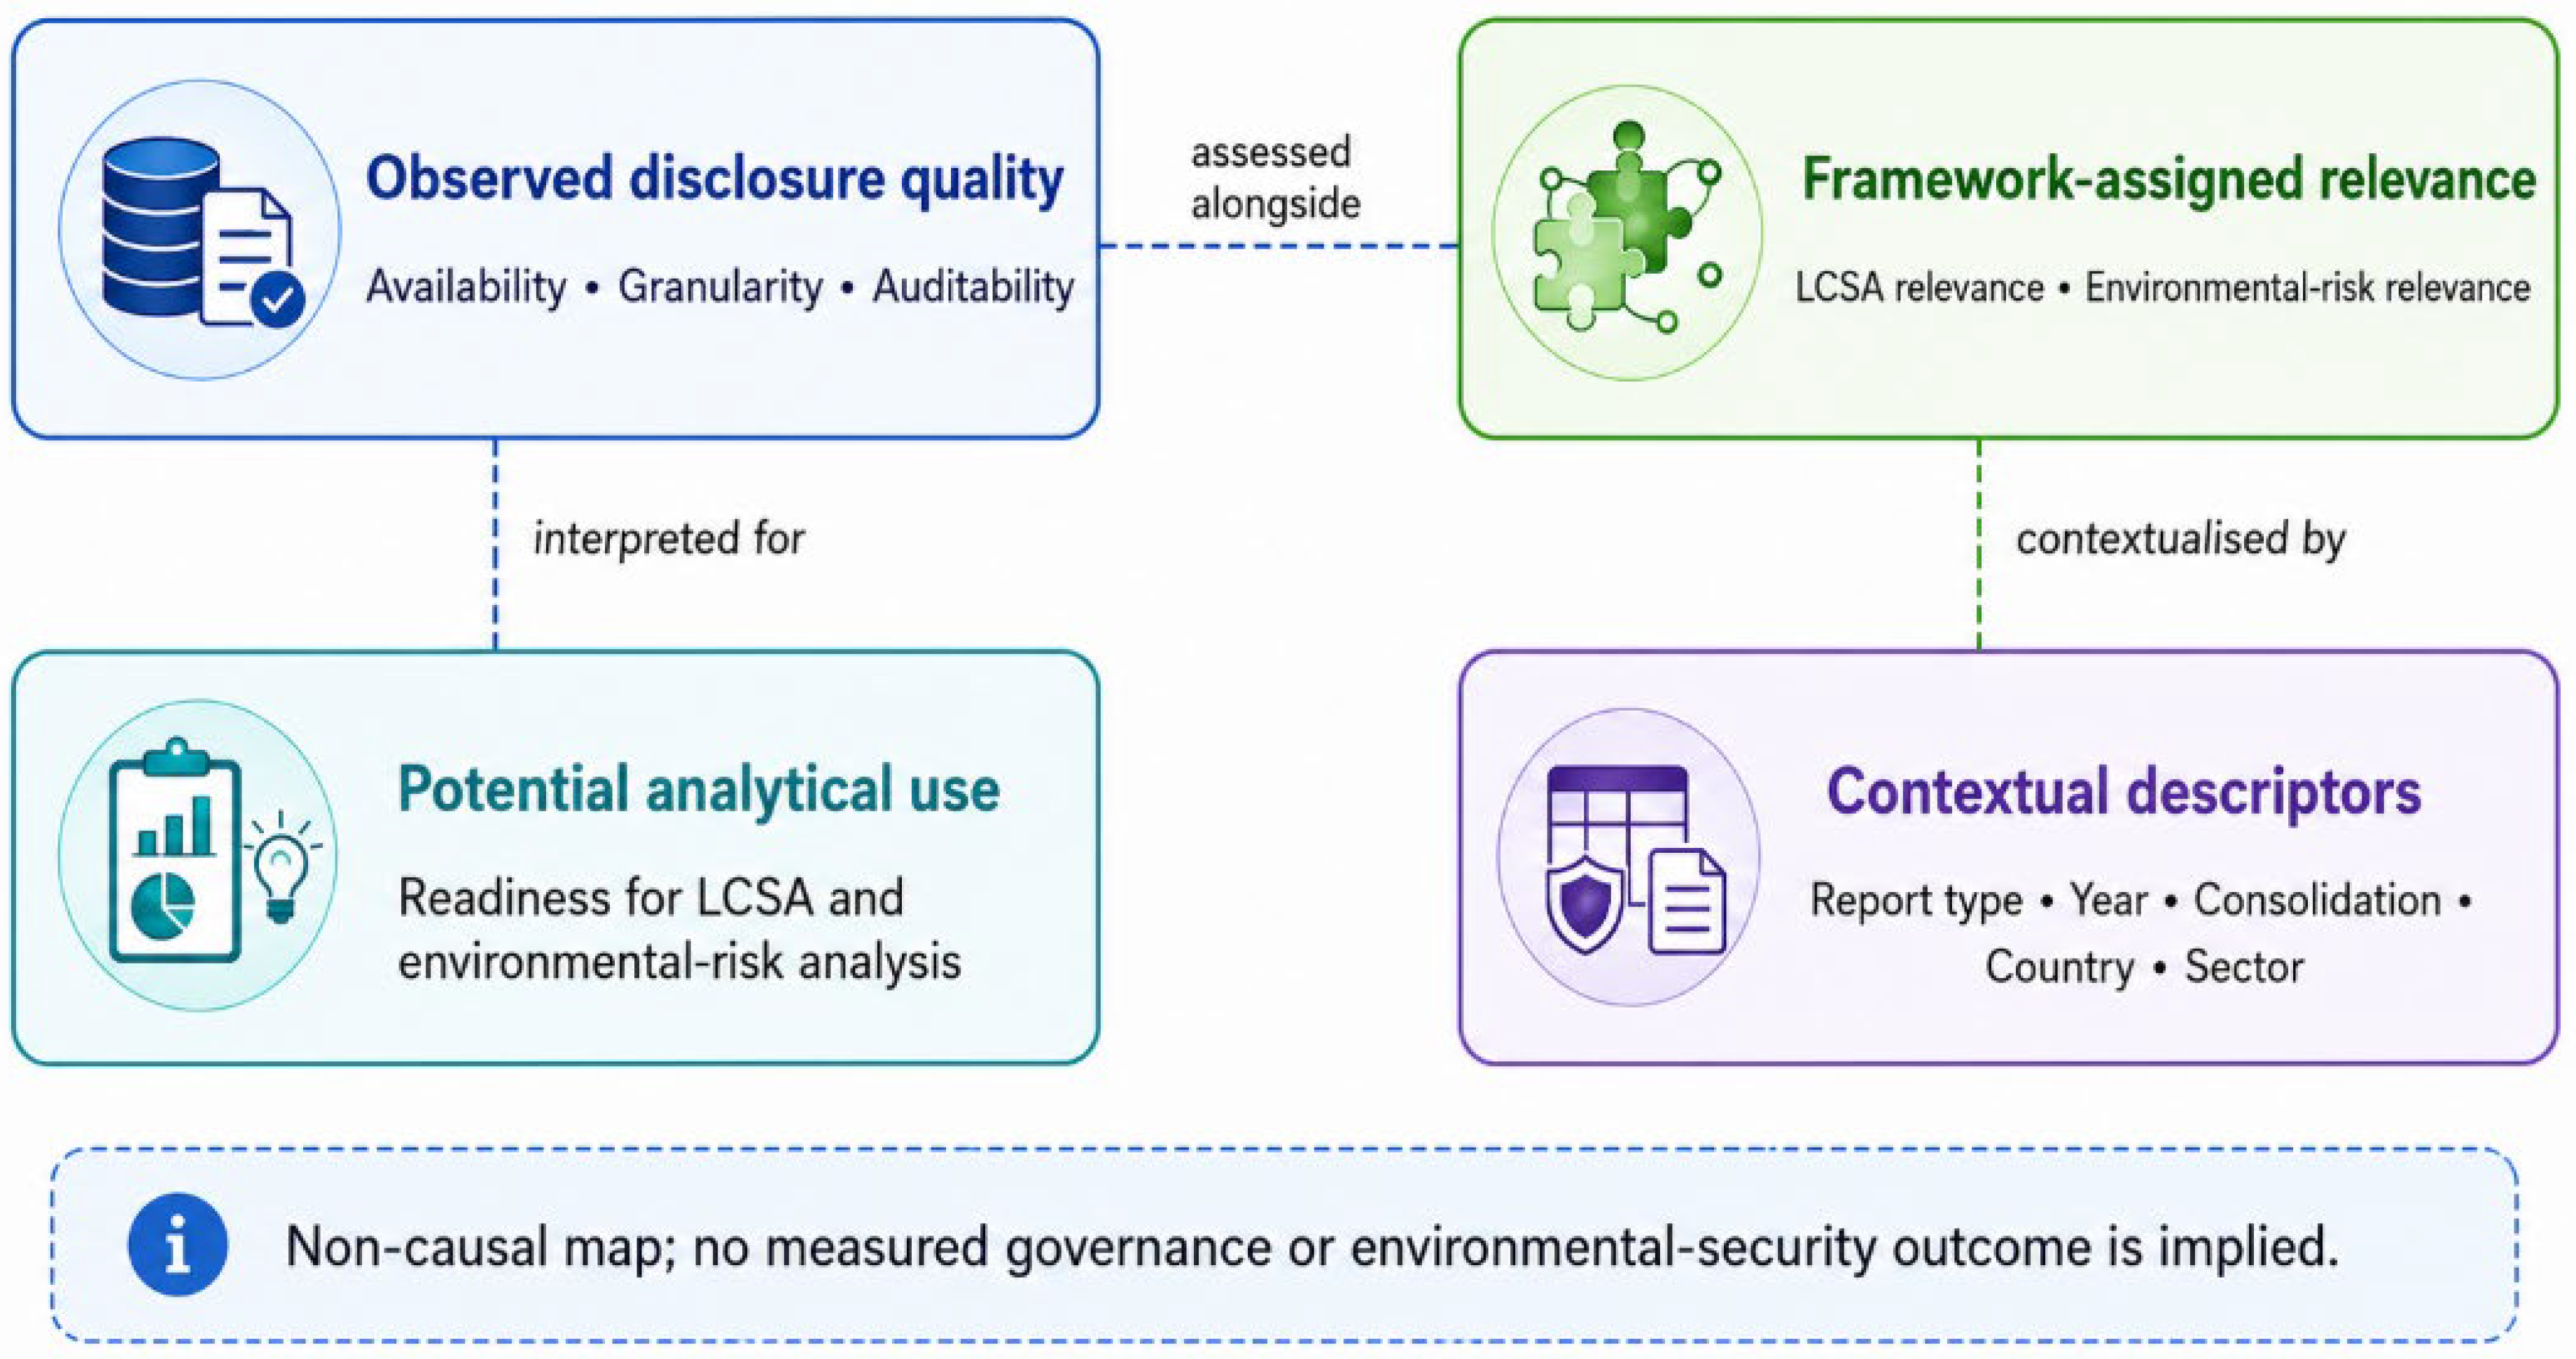
The revised conceptual framework separates evidence observed in disclosure documents from relevance assigned through the analytical rubric. The first component comprises availability, granularity and auditability. The second comprises LCSA relevance and environmental-risk relevance, which are defined through indicator anchors rather than measured as organisational outcomes.
Environmental-security interpretation is therefore located on the framework-assigned side of the analytical map and is assessed alongside, rather than inferred from, the observed disclosure-quality dimensions.
Figure 1 presents these components as a non-causal analytical map. Observed disclosure quality is assessed alongside framework-assigned relevance and interpreted in relation to potential analytical use. Report type, reporting year, consolidation level, country and sector are contextual characteristics that may influence the observed patterns but are not modelled as causal determinants.
Figure 1.
Non-causal analytical map of observed disclosure quality and framework-assigned relevance.
The framework consequently supports two different statements. Empirically, the study can report whether a disclosure is present, detailed and traceable. Analytically, it can identify whether that indicator has been assigned potential relevance to LCSA or environmental-risk interpretation. It cannot establish that weak disclosure reduces measured LCSA performance, causes environmental insecurity or reflects national governance effectiveness.
3. Materials and Methods
3.1. Research Design
The study uses a comparative, document-based and exploratory design combining structured qualitative content analysis with ordinal coding. The unit of evidence is the public disclosure attached to a specific organisation–indicator pair. The design evaluates documentary usability rather than sustainability performance, legal compliance or causal institutional effects.
The analytical architecture now distinguishes two variable classes. Availability, granularity and auditability are coded from observable documentary evidence. LCSA relevance and environmental-risk relevance are assigned through indicator-specific anchors to support interpretation. The latter two dimensions are not treated as equivalent empirical measures of disclosure quality.
The five environmental-security domains are not coded as a separate empirical construct; they provide the interpretive terminology for the existing environmental-risk relevance anchors.
Bulgaria and Moldova are theoretically motivated contexts rather than representative national samples. Country, sector, report type, year and consolidation level are used as contextual descriptors. The design cannot determine whether any pattern is caused by regulatory status, institutional capacity or reporting culture.
Reproducibility is limited to the released coding dataset, scoring rules and statistical calculations. The original coding involved interpretative judgement and was not independently double-coded. Accordingly, the Data Gap Matrix is presented as an exploratory rubric requiring future external validation rather than as a validated measurement instrument.
OpenAI Codex (OpenAI, https://chatgpt.com/, accessed on 30 June 2026) did not select documents, assign scores, alter evidence quotations or resolve coding decisions. It was used only for language editing, assistance with statistical programming and a secondary computational consistency check after the authors had completed the original coding. This distinction is stated here and in the Acknowledgments.
3.2. Empirical Sample and Document Corpus
The empirical sample consists of 36 organisations from Bulgaria and Moldova and is balanced equally by country, with 18 organisations from each national context. It comprises three organisational categories: 20 corporate entities, 8 financial institutions and 8 public-sector bodies. Corporate entities were included because they represent the primary field of sustainability reporting. Financial institutions were selected because they are increasingly exposed to ESG- and climate-risk disclosure expectations, while public-sector bodies were included because environmental governance, climate policy, infrastructure resilience and public accountability are directly relevant to environmental security. As shown in Table 1, the same purposive structure was applied in both countries: 10 corporate entities, 4 financial institutions and 4 public-sector bodies.
Table 1.
Structure of the empirical sample.
Organisations were eligible when they had identifiable operations or a public mandate in the relevant country and a stable, publicly accessible sustainability-related document covering 2023–2025. Documents were screened for sufficient scope to apply the common 15-indicator rubric, including the assignment of zero where an item was not located. The study did not construct a census-based sampling frame, and it cannot report the total number of organisations with no sustainability document. This selection feature is important: the corpus likely represents relatively visible reporters and may overstate disclosure availability in the wider organisational populations.
The document corpus includes sustainability reports, integrated reports, non-financial reports or statements, ESG disclosure documents, annual reports containing sustainability sections, carbon-footprint reports, public-sector climate reports and environmental-governance documents. The reporting years represented are 2023, 2024 and 2025. As summarised in Table 2, 2024 is the dominant reporting year, accounting for 29 of the 36 documents, compared with 6 reports from 2023 and 1 report from 2025.
Table 2.
Reporting years represented in the corpus.
The corpus is heterogeneous by document type. Table 3 presents the distribution separately for Bulgaria and Moldova so that this potential source of non-comparability is visible in the main text.
Table 3.
Report types by country in the selected corpus.
All documents were publicly available. Where an entity-level report was unavailable, a group-level, integrated or institutional report was used only when it contained evidence relevant to the selected organisation. Such substitution does not remove the boundary problem: consolidated documents may reduce entity-level granularity and limit comparability. Scores were therefore conservative, and the evidence register identifies the source and reporting boundary used.
Report composition differs substantially between the two country subsamples, as shown in Table 3. Report format, reporting year, organisational type and consolidation level may affect quantification, methodological documentation and assurance evidence independently of country context. Consequently, the comparative results are described as sample-specific and are not attributed to national institutional conditions.
The common 15-indicator set was retained to permit a consistent documentary screen across corporate, financial and public-sector organisations. It should not be interpreted as an organisation-specific double-materiality assessment. Because an explicit “not applicable” category was not included in the original coding protocol, a zero may combine nondisclosure with possible non-materiality, non-applicability or reporting at another institutional level. Retrospective recoding without a new materiality assessment would be methodologically unreliable; this limitation is therefore made explicit, and the findings are framed as common-set disclosure usability rather than compliance failure.
3.3. Data Gap Matrix
The Data Gap Matrix evaluates 15 ESG indicators across five analytical dimensions. The indicators are organised into environmental, social and governance categories. As presented in Table 4, the environmental group comprises five indicators related to greenhouse gas emissions, energy use and renewable energy; the social group includes five indicators concerning employees, occupational health and safety, diversity and community engagement; and the governance group covers five indicators relating to governance structures, board independence, risk management, ethics and disclosure transparency.
Table 4.
Indicators included in the Data Gap Matrix.
Each indicator was assessed for every organisation, producing 540 indicator-level coding units nested within 36 organisations (36 organisations × 15 indicators).
The matrix contains two analytically distinct classes. Availability, granularity and auditability are observed disclosure-quality dimensions coded directly from documentary evidence. LCSA relevance and environmental-risk relevance are framework-assigned overlays used only to interpret potential analytical importance. They are not direct measures of disclosure quality, organisational sustainability performance, LCSA outcomes or environmental-security conditions.
Availability records whether and in what form an indicator is disclosed. Granularity records the degree of disaggregation and boundary specificity. Auditability records whether identifiable methods, evidence, controls, verification or assurance support the disclosure. LCSA relevance classifies potential usefulness for E-LCA, LCC, S-LCA or cross-cutting life-cycle interpretation. Environmental-risk relevance classifies potential connection with climate, energy, resource, infrastructure and pollution domains. For backward compatibility with the originally released machine-readable dataset, the field name “Security_Materiality” is retained in Supplementary Material S3. Throughout the manuscript and the accompanying analytical outputs, this field is interpreted and displayed as environmental-risk relevance.
Indicator-specific anchors for the two analytical overlays are documented in Supplementary Material S1. They were derived from the LCSA, sustainability-reporting and environmental-risk concepts reviewed in Section 2.3 and Section 2.4. The anchors were not independently validated by an external expert panel, and no alternative-anchor sensitivity analysis was conducted. Organisation-specific variation was permitted only where sector exposure or explicit documentary evidence justified an adjustment. These limitations are now stated directly because the overlays should be interpreted as researcher-assigned classifications.
Table 5 summarises both the score interpretation and the analytical status of each dimension. This separation is carried through the Results: country and sector tests are limited to the three observed dimensions, while the two assigned relevance dimensions are used descriptively at the indicator level.
Table 5.
Scoring logic and analytical status of the Data Gap Matrix dimensions.
Observed disclosure-quality scores are summarised for the full sample, indicator groups and individual indicators. The assigned relevance overlays are reported separately to identify indicators whose potential analytical importance is high despite weak disclosure. No composite ESG performance ranking is produced.
The scoring procedure followed a conservative logic. General, group-level, estimated or weakly documented disclosures received lower observed-quality scores unless the evidence was specific and traceable. The relevance overlays were not calculated from the observed-quality scores, avoiding a mechanically circular relationship.
After the authors completed the original coding, the dataset underwent a secondary computational consistency audit assisted by scripts written in Python 3.13.5 and by OpenAI Codex (OpenAI, https://chatgpt.com/, accessed on 30 June 2026). The audit checked duplicate keys, missing evidence fields, source references, score ranges and predefined logical constraints. It did not make or revise interpretative coding decisions and cannot substitute for independent human double coding. The absence of an inter-coder reliability statistic is therefore treated as a central limitation.
3.4. Data Aggregation and Statistical Analysis
The 540 organisation–indicator records are nested within 36 organisations and are not treated as statistically independent observations. Indicator-level frequencies, medians, ranges and rankings constitute the empirical core of the analysis.
Because the observed scores are ordinal, medians, interquartile ranges and category frequencies are the primary descriptive summaries. Arithmetic means are retained only as supplementary diagnostic values for comparison with earlier scoring studies and should not be interpreted as precise interval measurements.
Country and sector comparisons are retained as secondary exploratory checks and are restricted to availability, granularity and auditability. Organisation-level mean summaries from the pre-specified analysis are used for the rank-based tests, while the tables report the median and interquartile range of those organisation-level summaries. A median-based sensitivity check is used only to assess specification dependence.
Two-sided Mann–Whitney U and Kruskal–Wallis tests are reported with effect sizes. The existing Holm-adjusted values were calculated across the original five pre-specified dimensions and are retained as conservative adjustments after the relevance overlays were removed from comparative interpretation. Re-adjusting the Holm correction across only the three observed dimensions would leave every conclusion unchanged, as no comparison approaches significance under either adjustment family. Given the small purposive sample, no population-level power or precision claim is made; rather than adding confidence intervals that could imply representativeness, the revised manuscript reduces inferential emphasis and concludes only whether a pattern is stable across specifications.
The two assigned relevance dimensions are not tested as equivalent organisation-level outcomes. Equal weighting is not used to produce a composite index, and indicator-level results—especially Scope 3—are interpreted directly so that material gaps are not diluted by averaging across heterogeneous indicators.
Statistical analyses were performed in Python 3.13.5 using NumPy 2.3.5, SciPy 1.17.0 and statsmodels 0.14.6. Supplementary Material S2 validates the structure of the cleaned indicator-level dataset provided in Supplementary Material S3 and reproduces the descriptive statistics, country and sector comparisons restricted to availability, granularity and auditability, and the median-based sensitivity analysis. Holm-adjusted p-values are calculated across the original five pre-specified dimensions as a conservative correction, but comparative outputs and interpretation are limited to the three observed disclosure-quality dimensions.
4. Results
The Data Gap Matrix generated 540 organisation–indicator coding units. The Results first report the observed disclosure-quality distributions and then use the two framework-assigned relevance overlays to interpret indicator-level priorities. Country and sector comparisons are secondary and restricted to the observed dimensions.
Table 6 shows the most robust empirical result: auditability is the weakest observed dimension, with a median of 1.00 and only 7 of 540 coding units (1.3%) receiving the maximum score. Availability and granularity both have medians of 2.00, indicating that disclosure presence is generally stronger than evidence traceability and assurance readiness. The LCSA and environmental-risk columns are framework-assigned relevance summaries and are not interpreted as observed organisational outcomes.
Table 6.
Descriptive distribution of observed disclosure-quality scores and framework-assigned relevance scores.
The score frequencies demonstrate that the principal problem is not simply complete absence. Many disclosures are present but remain aggregated, methodologically under-explained or weakly supported. This distinction between presence and auditability is the empirical centre of the revised manuscript.
Table 7 reports exploratory country comparisons for the three observed disclosure-quality dimensions only. None of the Holm-adjusted comparisons is statistically significant. The table is included to show the selected-sample distributions, not to estimate national effects.
Table 7.
Exploratory country comparison of observed disclosure-quality dimensions. Reported median (IQR) values summarise organisation-level mean scores, not indicator-level ordinal medians.
As shown in Table 7, the selected Bulgarian and Moldovan subsamples differ descriptively on some observed scores, but no adjusted country effect is established. These patterns may reflect report type, year, consolidation level, organisation mix or other unmodelled characteristics. They should not be attributed to EU membership or national institutional quality.
Table 8 presents the analogous exploratory sector comparison for the observed dimensions. The corporate, financial and public-sector groups are unbalanced, and none of the Holm-adjusted tests is statistically significant.
Table 8.
Exploratory sector comparison of observed disclosure-quality dimensions. Reported median (IQR) values summarise organisation-level mean scores, not indicator-level ordinal medians.
The unadjusted auditability signal does not survive Holm adjustment. Together with the aggregation sensitivity reported in Supplementary Material S2, this indicates limited statistical power and specification dependence rather than a stable sector effect.
Overall, the exploratory comparisons do not establish a stable country or sector effect. The remainder of the Results therefore focuses on the observed indicator-level disclosure gaps and uses the two relevance overlays only for descriptive interpretation.
Table 9 provides supplementary means by indicator group. Each group contains 180 organisation–indicator coding units (36 organisations × 5 indicators). The first three columns describe observed disclosure quality; the final two columns report framework-assigned relevance.
Table 9.
Supplementary means by indicator group: observed disclosure quality and framework-assigned relevance (n = 180 per group).
Table 9 does not show that the documents empirically “produce” higher LCSA or environmental-risk relevance. Rather, environmental indicators classified ex ante as highly relevant display comparatively weak observed availability, granularity and auditability. This is the specific meaning of the relevance–quality mismatch.
Social indicators show moderate disclosure presence but weak auditability and limited standardisation. Their lower framework-assigned LCSA relevance reflects the study’s anchors and should not be interpreted as lower social importance.
Governance indicators have the strongest observed disclosure-quality profile, especially for availability and granularity. Their assigned environmental-risk relevance reflects the potential role of governance processes in producing and controlling environmental information; it is not evidence of measured governance effectiveness.
4.1. Indicator-Level Disclosure Quality and Assigned Relevance
Indicator-level results clarify which observed data gaps drive the aggregate pattern. Table 10 reports selected means for 36 organisations per indicator. The first three dimensions are evidence-based; the final two are framework-assigned.
Table 10.
Selected indicator-level supplementary means: observed disclosure quality and framework-assigned relevance (n = 36 per indicator).
Scope 3 greenhouse gas emissions are the weakest observed indicator in Table 10, with mean scores of 1.06 for availability, 0.81 for granularity and 0.44 for auditability. The high values in the final two columns are assigned relevance classifications and are not derived from disclosure quality.
The Scope 3 pattern is consistent with the wider European concern that ESG and value-chain data remain incomplete and difficult to trace [17]. It supports a practical conclusion about data collection, methods and assurance readiness, not a claim about environmental performance.
Energy use is more frequently disclosed than the other selected environmental indicators, but its moderate granularity and auditability still limit reuse across organisational boundaries or life-cycle stages.
The selected governance indicators record the strongest observed disclosure-quality means. This suggests better visibility of policies and oversight structures, but it does not demonstrate their operating effectiveness.
4.2. Weakest Observed Data Gaps and Framework-Assigned Environmental-Risk Relevance
To identify the most critical disclosure deficiencies, the indicators were ranked separately by availability and auditability. The five lowest-ranked indicators for each dimension are presented in Table 11.
Table 11.
Weakest observed indicators by availability and auditability (n = 36 per indicator).
As shown in Table 11, Scope 3 greenhouse gas emissions constitute the weakest indicator in both rankings. Employee turnover and renewable energy share also appear among the three weakest indicators for both availability and auditability. Scope 2 emissions and board independence complete the availability ranking, whereas diversity and inclusion and health and safety are included among the least auditable indicators.
The results in Table 11 demonstrate that ESG data gaps are not confined to environmental indicators. The low auditability of employee turnover, diversity and inclusion, and occupational health and safety confirms the methodological difficulties associated with social ESG data. Such information is often presented narratively or through isolated quantitative values without consistent definitions, reporting boundaries, calculation methods or independent verification. Consequently, its usefulness for Social LCA and cross-organisational comparison remains limited.
The indicators assigned the greatest potential environmental-risk relevance were ranked separately from observed disclosure quality. Table 12 reports the seven highest-ranked indicators in this framework-based ordering.
Table 12.
Seven indicators assigned the highest environmental-risk relevance within the framework.
Table 12 reproduces the framework’s indicator anchors and limited evidence-based adjustments. It should not be read as an empirical ranking of organisational environmental risk or governance performance.
5. Discussion
5.1. Disclosure Presence Is Stronger than Auditability
The principal empirical result is the gap between disclosure presence and evidence quality. Availability and granularity have medians of 2.00, whereas auditability has a median of 1.00 and only 1.3% of coding units receive the maximum score. The selected reports therefore contain substantial ESG content, but much of it remains difficult to trace to methods, controls, source evidence or external assurance.
This distinction matters for CSRD/ESRS implementation and ISSA 5000 readiness. Narrative or aggregated disclosure may satisfy a communication objective while remaining insufficient for re-performance, assurance or structured analytical reuse. The revised interpretation is limited to the documentary evidence and does not infer actual sustainability performance.
5.2. Observed Gaps in Indicators Assigned High Analytical Relevance
The study’s relevance–quality mismatch is now defined narrowly. LCSA relevance and environmental-risk relevance are assigned through predefined anchors; availability, granularity and auditability are observed. The mismatch occurs when an indicator classified as potentially important has weak observed disclosure quality. It is not an empirical causal relationship between reporting and LCSA or environmental-security outcomes.
Scope 3 emissions provide the clearest example. They have the weakest observed availability, granularity and auditability, while the framework classifies them as highly relevant to value-chain and environmental-risk analysis. This finding identifies a data-readiness priority without claiming that the study performed an LCSA or measured environmental risk.
From an environmental-security perspective, this result indicates only that weakly documented information coincides with an indicator assigned potential relevance to climate and value-chain risk analysis. It does not demonstrate an environmental-security effect or governance failure.
5.3. Comparative Results Are Exploratory and Context-Sensitive
No stable country or sector effect is established for the observed disclosure-quality dimensions. The purposive sample, sector imbalance and substantial differences in report type prevent attribution of descriptive patterns to national institutions. Bulgaria and Moldova remain useful contrasting contexts, but the evidence supports corpus-specific observations rather than population estimates.
The common indicator set also creates an applicability limitation. Some zero scores may reflect non-materiality, non-applicability or reporting at a different institutional level. A future design should combine the common rubric with organisation-specific materiality and sector-applicability screening.
5.4. Contribution and Boundaries
The contribution is methodological and diagnostic. The Data Gap Matrix makes the difference between presence, detail and auditability visible at the indicator level and places those observations alongside—not inside—two relevant classifications. Its value lies in structuring questions for data readiness, assurance and future LCSA applications. Independent coding validation, alternative anchor testing and sector-specific applicability rules are required before the rubric can be treated as a validated measurement instrument.
6. Policy and Governance Implications
6.1. Evidence Traceability and Assurance Readiness
Given the auditability median of 1.00 and the fact that only 7 of 540 coding units reached the maximum score, the most direct policy priority is stronger source traceability. Reporting organisations should document data ownership, calculation methods, boundaries, controls, approvals and links to underlying evidence. Professional bodies and educators can support this priority through guidance tied specifically to these documented weaknesses rather than through generic ESG training.
6.2. Scope 3 and Value-Chain Data
The observed Scope 3 scores—1.06 for availability, 0.81 for granularity and 0.44 for auditability—support targeted recommendations for supplier-data protocols, estimation transparency, category-level disaggregation and evidence retention. These priorities are relevant in both country contexts and are consistent with wider European concerns regarding incomplete ESG data [17].
6.3. Comparative and Institutional Implications
Because no stable country or sector effect is established, the study does not support causal claims about EU membership, candidate-country status or institutional capacity. Country-specific pathways, bilateral cooperation and interoperable platforms remain reasonable propositions for future policy assessment, but they are no longer presented as empirical conclusions. The evidence directly supports a narrower agenda: improve disaggregation, methodology, source traceability and assurance readiness across the selected reporting environments. Any broader environmental-security implications should consequently be treated as propositions for future assessment rather than as conclusions derived from the present comparisons.
7. Limitations and Future Research
Four limitations are central. First, the corpus is purposive and limited to organisations with publicly accessible sustainability-related documentation. It may therefore represent relatively visible reporters and cannot support national population estimates. Differences in report type, year and consolidation level further limit country comparability.
Second, the ordinal coding involves interpretative judgement and was not independently double-coded. The computational consistency audit verifies data structure and logical coherence only. Claims of reproducibility are therefore restricted to the released scores and calculations, and the Data Gap Matrix should be treated as an exploratory rubric until weighted Cohen’s kappa, ordinal Krippendorff’s alpha or another formal reliability assessment is available.
Third, the common 15-indicator screen is not an organisation-specific double-materiality assessment. Because the original protocol did not include a “not applicable” category, some zeros may reflect non-materiality, non-applicability or reporting at another level rather than disclosure failure. Future research should use a sector-specific applicability matrix and calculate summaries only across applicable indicators.
Fourth, LCSA relevance and environmental-risk relevance are researcher-assigned overlays, not observed outcomes. Their anchors were not externally validated and were not subjected to alternative-weight sensitivity analysis. The study does not perform LCA, LCC or S-LCA and does not measure environmental-security performance or governance effectiveness. Future work should validate the anchors with external experts, independently recode a stratified subsample and test the rubric in larger, sector-specific and longitudinal datasets. The environmental-security wording retained in the manuscript refers to this same interpretive overlay and introduces no additional empirical measure.
8. Conclusions
This study diagnoses the usability of ESG disclosures in a purposive corpus of 36 organisations in Bulgaria and Moldova. The revised analysis clearly separates observed disclosure quality—availability, granularity and auditability—from framework-assigned LCSA and environmental-risk relevance.
The most robust result is that disclosure presence is stronger than auditability. Availability and granularity have medians of 2.00, while auditability has a median of 1.00 and only 7 of 540 coding units receive the maximum score. Scope 3 emissions are the weakest observed indicator, combining low availability, granularity and auditability.
No stable country or sector effect is established for the observed dimensions. The evidence therefore does not support conclusions about national ESG systems, institutional capacity, environmental-security performance or governance effectiveness. It supports a narrower practical conclusion: selected public disclosures require stronger disaggregation, methodological documentation, source traceability and assurance readiness.
Environmental security is retained solely as a framework-based interpretive lens for the potential governance relevance of the environmental-risk domains and not as a measured result.
The Data Gap Matrix offers an exploratory structure for identifying these documentary weaknesses and placing them alongside potential analytical relevance. Its further use requires independent coding validation, explicit applicability rules and testing of alternative relevance anchors. Within these boundaries, the study provides a transparent and computationally reproducible starting point for future research on ESG data readiness for LCSA and environmental-risk analysis.
Supplementary Materials
The following supporting information can be downloaded at https://www.mdpi.com/article/10.3390/world7080141/s1, Supplementary Material S1, Data Gap Matrix workbook containing the coded evidence trail, codebook, indicator anchors, sample-selection documentation, validation checks, descriptive results for all five analytical dimensions, and country and sector analyses restricted to the three observed disclosure-quality dimensions; Supplementary Material S2, Python script used to validate Supplementary Material S3 and reproduce the descriptive statistics, conservative Holm-adjusted exploratory comparisons and median-based sensitivity analysis; Supplementary Material S3, Cleaned indicator-level Data Gap Matrix dataset in CSV format.
Author Contributions
Conceptualisation, R.K.-H. and L.D.; methodology, R.K.-H.; software, R.K.-H.; validation, R.K.-H. and L.D.; formal analysis, L.D.; investigation, L.D.; resources, R.K.-H. and L.D.; data curation, R.K.-H.; writing—original draft preparation, R.K.-H. and L.D.; writing—review and editing, R.K.-H. and L.D.; visualisation, R.K.-H.; supervision, R.K.-H.; project administration, R.K.-H. All authors have read and agreed to the published version of the manuscript.
Funding
This research received no external funding.
Institutional Review Board Statement
Not applicable.
Informed Consent Statement
Not applicable.
Data Availability Statement
The study is based on publicly available documents. Supplementary Material S1 contains the coded evidence trail, scoring documentation, indicator anchors, sample-selection information, validation checks and reported result tables. Supplementary Material S3 provides the cleaned indicator-level dataset, while Supplementary Material S2 validates that dataset and reproduces the reported descriptive and exploratory analyses. The selected corpus is purposive and is not a census of reporting organisations in either country.
Acknowledgments
This article is based upon work from COST Action CA23157, European Network for Multiple View Life Cycle Sustainability Assessment (MultiViewLCSA), supported by COST (European Cooperation in Science and Technology). OpenAI GPT-5.5 Thinking-Codex (OpenAI, https://chatgpt.com/, accessed on 30 June 2026) was used for language editing, assistance with statistical programming and a secondary computational consistency check after the authors completed the original coding. It did not select documents, assign or modify scores, or resolve interpretative coding decisions. The authors reviewed all outputs and take full responsibility for the manuscript.
Conflicts of Interest
The authors declare no conflicts of interest.
References
- European Union. Directive (EU) 2022/2464 of the European Parliament and of the Council of 14 December 2022 Amending Regulation (EU) No 537/2014, Directive 2004/109/EC, Directive 2006/43/EC and Directive 2013/34/EU, as Regards Corporate Sustainability Reporting. Off. J. Eur. Union 2022, L 322, 15–80. [Google Scholar]
- European Commission. Commission Delegated Regulation (EU) 2023/2772 of 31 July 2023 Supplementing Directive 2013/34/EU as Regards Sustainability Reporting Standards. Off. J. Eur. Union. 2023. L 2023/2772. Available online: https://eur-lex.europa.eu/eli/reg_del/2023/2772/oj (accessed on 30 June 2026).
- International Auditing and Assurance Standards Board (IAASB). International Standard on Sustainability Assurance 5000: General Requirements for Sustainability Assurance Engagements; IAASB: New York, NY, USA, 2024. [Google Scholar]
- Boiral, O.; Heras-Saizarbitoria, I.; Brotherton, M.-C. Professionalizing the Assurance of Sustainability Reports: The Auditors’ Perspective. Account. Audit. Account. J. 2020, 33, 309–334. [Google Scholar] [CrossRef] [Scilit]
- Kloepffer, W. Life Cycle Sustainability Assessment of Products. Int. J. Life Cycle Assess. 2008, 13, 89–95. [Google Scholar] [CrossRef] [Scilit]
- Finkbeiner, M.; Schau, E.M.; Lehmann, A.; Traverso, M. Towards Life Cycle Sustainability Assessment. Sustainability 2010, 2, 3309–3322. [Google Scholar] [CrossRef] [Scilit]
- United Nations Development Programme (UNDP). Human Development Report 1994: New Dimensions of Human Security; Oxford University Press: New York, NY, USA, 1994. [Google Scholar]
- European Environment Agency (EEA). European Climate Risk Assessment; EEA Report No. 01/2024; European Environment Agency: Copenhagen, Denmark, 2024. [Google Scholar]
- Diaconu, L.; Krastev, B.; Georgieva, E.; Krasteva-Hristova, R. Environmental Auditing, Public Finance, and Risk: Evidence from Moldova and Bulgaria. J. Risk Financ. Manag. 2025, 18, 683. [Google Scholar] [CrossRef] [Scilit]
- Berg, F.; Kölbel, J.F.; Rigobon, R. Aggregate Confusion: The Divergence of ESG Ratings. Rev. Financ. 2022, 26, 1315–1344. [Google Scholar] [CrossRef] [Scilit]
- European Financial Reporting Advisory Group (EFRAG). ESRS Set 1 XBRL Taxonomy; EFRAG: Brussels, Belgium, 2024. [Google Scholar]
- Petrova, P. Accounting for Impacts: Exploring Sustainability Reporting in Bulgarian Companies under the CSRD. Proc. Int. Conf. Bus. Excell. 2024, 18, 2172–2182. [Google Scholar] [CrossRef] [Scilit]
- Krasteva-Hristova, R.; Moneva, I. Digitalization, ESG Reporting, and Circular Economy: Accounting Challenges for Women-Led SMEs. World 2026, 7, 91. [Google Scholar] [CrossRef] [Scilit]
- Pavlova, M.; Petrova, R. The Emerging Changes in the Accounting Profession and the Accounting Practice under the Influence of Technology. Econ. Arch. 2023, 1, 24–40. [Google Scholar] [CrossRef] [Scilit]
- UNEP/SETAC Life Cycle Initiative. Towards a Life Cycle Sustainability Assessment: Making Informed Choices on Products; United Nations Environment Programme: Paris, France, 2011. [Google Scholar]
- Georgieva, V. Analysis of Agricultural Emissions and Economic Growth in Europe in Search of Ecological Balance. Open Agric. 2024, 9, 20220373. [Google Scholar] [CrossRef] [Scilit]
- European Banking Authority (EBA). Report on Data Availability and Feasibility of Common Methodology for ESG Exposures; European Banking Authority: Paris, France, 2025. [Google Scholar]

Disclaimer/Publisher’s Note: The statements, opinions and data contained in all publications are solely those of the individual author(s) and contributor(s) and not of MDPI and/or the editor(s). MDPI and/or the editor(s) disclaim responsibility for any injury to people or property resulting from any ideas, methods, instructions or products referred to in the content. |
© 2026 by the authors. Licensee MDPI, Basel, Switzerland. This article is an open access article distributed under the terms and conditions of the Creative Commons Attribution (CC BY) license.