1. Introduction
Rapid urbanization, population growth, and rising living standards have significantly increased global energy demand, particularly in developing countries [
1]. This surge in demand, coupled with reliance on fossil fuel-based electricity generation, has intensified concerns related to energy security, economic stability, and climate change [
2]. In many regions, the volatility of fuel prices and the environmental impacts of conventional power generation have accelerated the transition toward renewable energy systems as a sustainable alternative [
3]. Among these, solar photovoltaic (PV) technology has emerged as one of the most promising solutions due to its scalability, declining costs, and suitability for decentralized electricity generation [
4].
Pakistan represents a compelling case where the challenges of energy insecurity and environmental sustainability converge [
5]. The country relies heavily on imported fossil fuels for electricity generation, which exposes the energy sector to global price fluctuations and increases the financial burden on the economy. Recent reports indicate that a significant portion of electricity is generated from thermal sources, leading to rising electricity tariffs and substantial import expenditures [
6,
7]. At the same time, frequent power outages and grid instability in major urban centers, including Karachi, have further highlighted the need for reliable and resilient energy solutions. In this context, rooftop PV systems have gained considerable attention as a viable option for reducing grid dependency and ensuring uninterrupted power supply [
8].
Residential PV installations in urban areas offer multiple benefits, including reduced electricity costs, improved energy access, and lower greenhouse gas emissions [
9]. However, the performance and feasibility of PV systems depend strongly on system configuration, particularly the integration of battery storage and grid interaction [
10]. Grid-tied systems, off-grid systems, and hybrid systems with battery storage each present distinct advantages and limitations [
11]. For instance, grid-connected PV systems are generally cost-effective but remain vulnerable to grid outages, whereas off-grid systems ensure energy independence but require significant capital investment and storage capacity [
12]. Hybrid configurations, which combine PV generation with battery storage and grid support, have been identified as a promising compromise between cost, reliability, and sustainability.
Khalid and Junaidi [
13] evaluated the economic feasibility of a 10 MW photovoltaic plant in Quetta, Pakistan, using RETScreen, with emphasis on annual electricity generation and electricity cost. Faiz et al. [
14] modelled a 3 MW grid-connected PV system for a university building in Bahawalpur and assessed its electricity-generation and fuel-saving potential. Xu et al. [
15] examined an off-grid PV system with battery storage in Sindh and reported its technical and economic feasibility for areas with limited grid access. Irfan et al. [
16] investigated an off-grid residential PV system in Punjab and evaluated its electricity-supply and carbon-emission reduction potential. Shah et al. [
17] assessed a grid-connected PV plant in Sukkur; however, their analysis focused on large-scale electricity generation rather than household-level energy consumption.
Studies from other geographic regions also demonstrate that PV feasibility is strongly influenced by climatic, economic, and operational conditions. El-Houari et al. [
18] optimized an off-grid residential PV system in Morocco using location-specific demand and climatic data. Han et al. [
19] evaluated residential PV–battery systems in Switzerland and showed that economic performance depends on household demand, rooftop availability, solar irradiation, electricity tariffs, and storage costs. Yazdani and Yaghoubi [
20] conducted a techno-economic assessment of PV systems in Shiraz, Iran, and highlighted the importance of local climatic and operating conditions. Although these studies provide valuable location-specific findings, most examine a single PV configuration, installation scale, or grid-interaction strategy. A consistent comparison of multiple residential PV configurations under the same load, climatic, cost, and evaluation assumptions remains limited for Karachi.
In addition to operational greenhouse gas reduction, the broader environmental performance of PV systems can be evaluated through life-cycle assessment (LCA). Following the ISO 14040 [
21] and ISO 14044 [
22] framework, an LCA may include material extraction, component manufacturing, transportation, installation, operation, replacement, and end-of-life management. PV LCA studies can examine not only greenhouse gas emissions but also cumulative energy demand, acidification, eutrophication, particulate and criteria-pollutant emissions, ozone depletion, human and ecosystem toxicity, heavy-metal emissions, water consumption, and resource use [
23]. Dedicated LCA software like openLCA and life-cycle inventory databases can support such multi-category assessments. However, their results depend strongly on the selected system boundary, inventory data, electricity mix, technology, component lifetime, and recycling assumptions.
To address this research gap, the present study evaluates four residential PV configurations for a representative urban household in Karachi: (i) daytime PV with the remaining demand supplied by the grid (Case A), (ii) daytime PV with 6 h battery backup and grid support (Case B), (iii) daytime PV with full battery backup and no grid support (Case C), and (iv) daytime PV with net metering (Case D). The configurations are compared in terms of installed PV capacity, rooftop-area requirement, battery-storage demand, payback period, net present value, lifecycle cost, levelized cost of electricity, and avoided greenhouse gas emissions. The configuration providing the most balanced practical performance is subsequently evaluated using PVsyst.
The contribution of this study lies in the consistent comparison of four practically relevant residential PV configurations under the same household load, climatic conditions, component costs, and evaluation assumptions for Karachi. Rather than proposing a new modelling methodology, the study applies established technical, economic, environmental, and PVsyst-based assessment tools to clarify the trade-offs among grid dependence, battery storage, investment requirements, electricity cost, and greenhouse gas reduction. The resulting comparison provides context-specific guidance for homeowners, energy planners, and policymakers considering residential PV deployment in developing urban environments.
2. Materials and Methods
2.1. Study Area and Residential Energy Demand
This study considers a residential building located in Karachi, Pakistan. Karachi is situated in the southern region of the country along the Arabian Sea, at approximately 24.8607° N latitude and 67.0011° E longitude. The city receives a substantial solar resource and is therefore suitable for the evaluation of rooftop photovoltaic systems. The monthly meteorological inputs for Karachi were retrieved from the Meteonorm 8.1 database integrated into PVsyst version 7.3.0, using the geographical coordinates of 24.8607° N and 67.0011° E [
24,
25]. The values represent location-specific long-term meteorological data provided through the PVsyst meteorological database rather than measurements collected directly at the investigated residence. The parameters extracted for the analysis were global horizontal irradiation, diffuse horizontal irradiation, extraterrestrial horizontal irradiation, clearness index, ambient temperature, and wind speed, as presented in
Table 1.
Global horizontal irradiation (GHI) represents the total solar energy received by a horizontal surface, including both direct and diffuse components, and is the principal indicator of the solar resource available for electricity generation. Diffuse horizontal irradiation (DHI) represents solar radiation scattered by clouds, atmospheric particles, and water vapour; it influences PV output during cloudy or hazy conditions and is also required when estimating irradiation on a tilted PV array. Extraterrestrial horizontal irradiation (H0) is the theoretical solar irradiation available at the top of the atmosphere and does not directly represent the energy received by the PV modules. Instead, it provides a reference for calculating the clearness index. The clearness index (Kt), defined as the ratio of GHI to extraterrestrial irradiation, indicates the degree of atmospheric transmission and the reduction in solar radiation caused by clouds, aerosols, and other atmospheric effects. Ambient temperature influences PV-cell operating temperature, and elevated module temperature generally reduces electrical conversion efficiency. Wind speed affects convective heat removal from the module surface and can therefore reduce module operating temperature and associated thermal losses. Wind conditions are also relevant to the mechanical and structural requirements of rooftop installations. Collectively, these meteorological parameters influence the available solar resource, PV-module temperature, expected energy yield, required system capacity, and the resulting economic performance of the rooftop PV configurations.
The residential load profile was estimated using an appliance-based bottom-up approach. The appliance power ratings were adopted from the K-Electric Energy Consumption Calculator [
26], while the number of appliances and their daytime and nighttime operating durations were defined for the representative household considered in this study. The electricity demand of each appliance was calculated from its rated power, quantity, and operating duration using
, where
is the electricity demand in kWh,
is the appliance power rating in W,
is the number of appliances, and
is the operating duration in hours. As presented in
Table 2, the estimated daytime and nighttime electricity demands were 13.364 and 21.166 kWh/day, respectively. These values represent a design-load scenario used for comparative PV-system sizing and should not be interpreted as directly monitored household electricity consumption.
These values represent a fixed summer design-day load profile and were applied consistently to all four PV configurations. Seasonal variation in household electricity demand was not modelled, while weather-related variation in PV generation was considered separately using the monthly meteorological data and PVsyst simulation.
2.2. Photovoltaic System Configurations
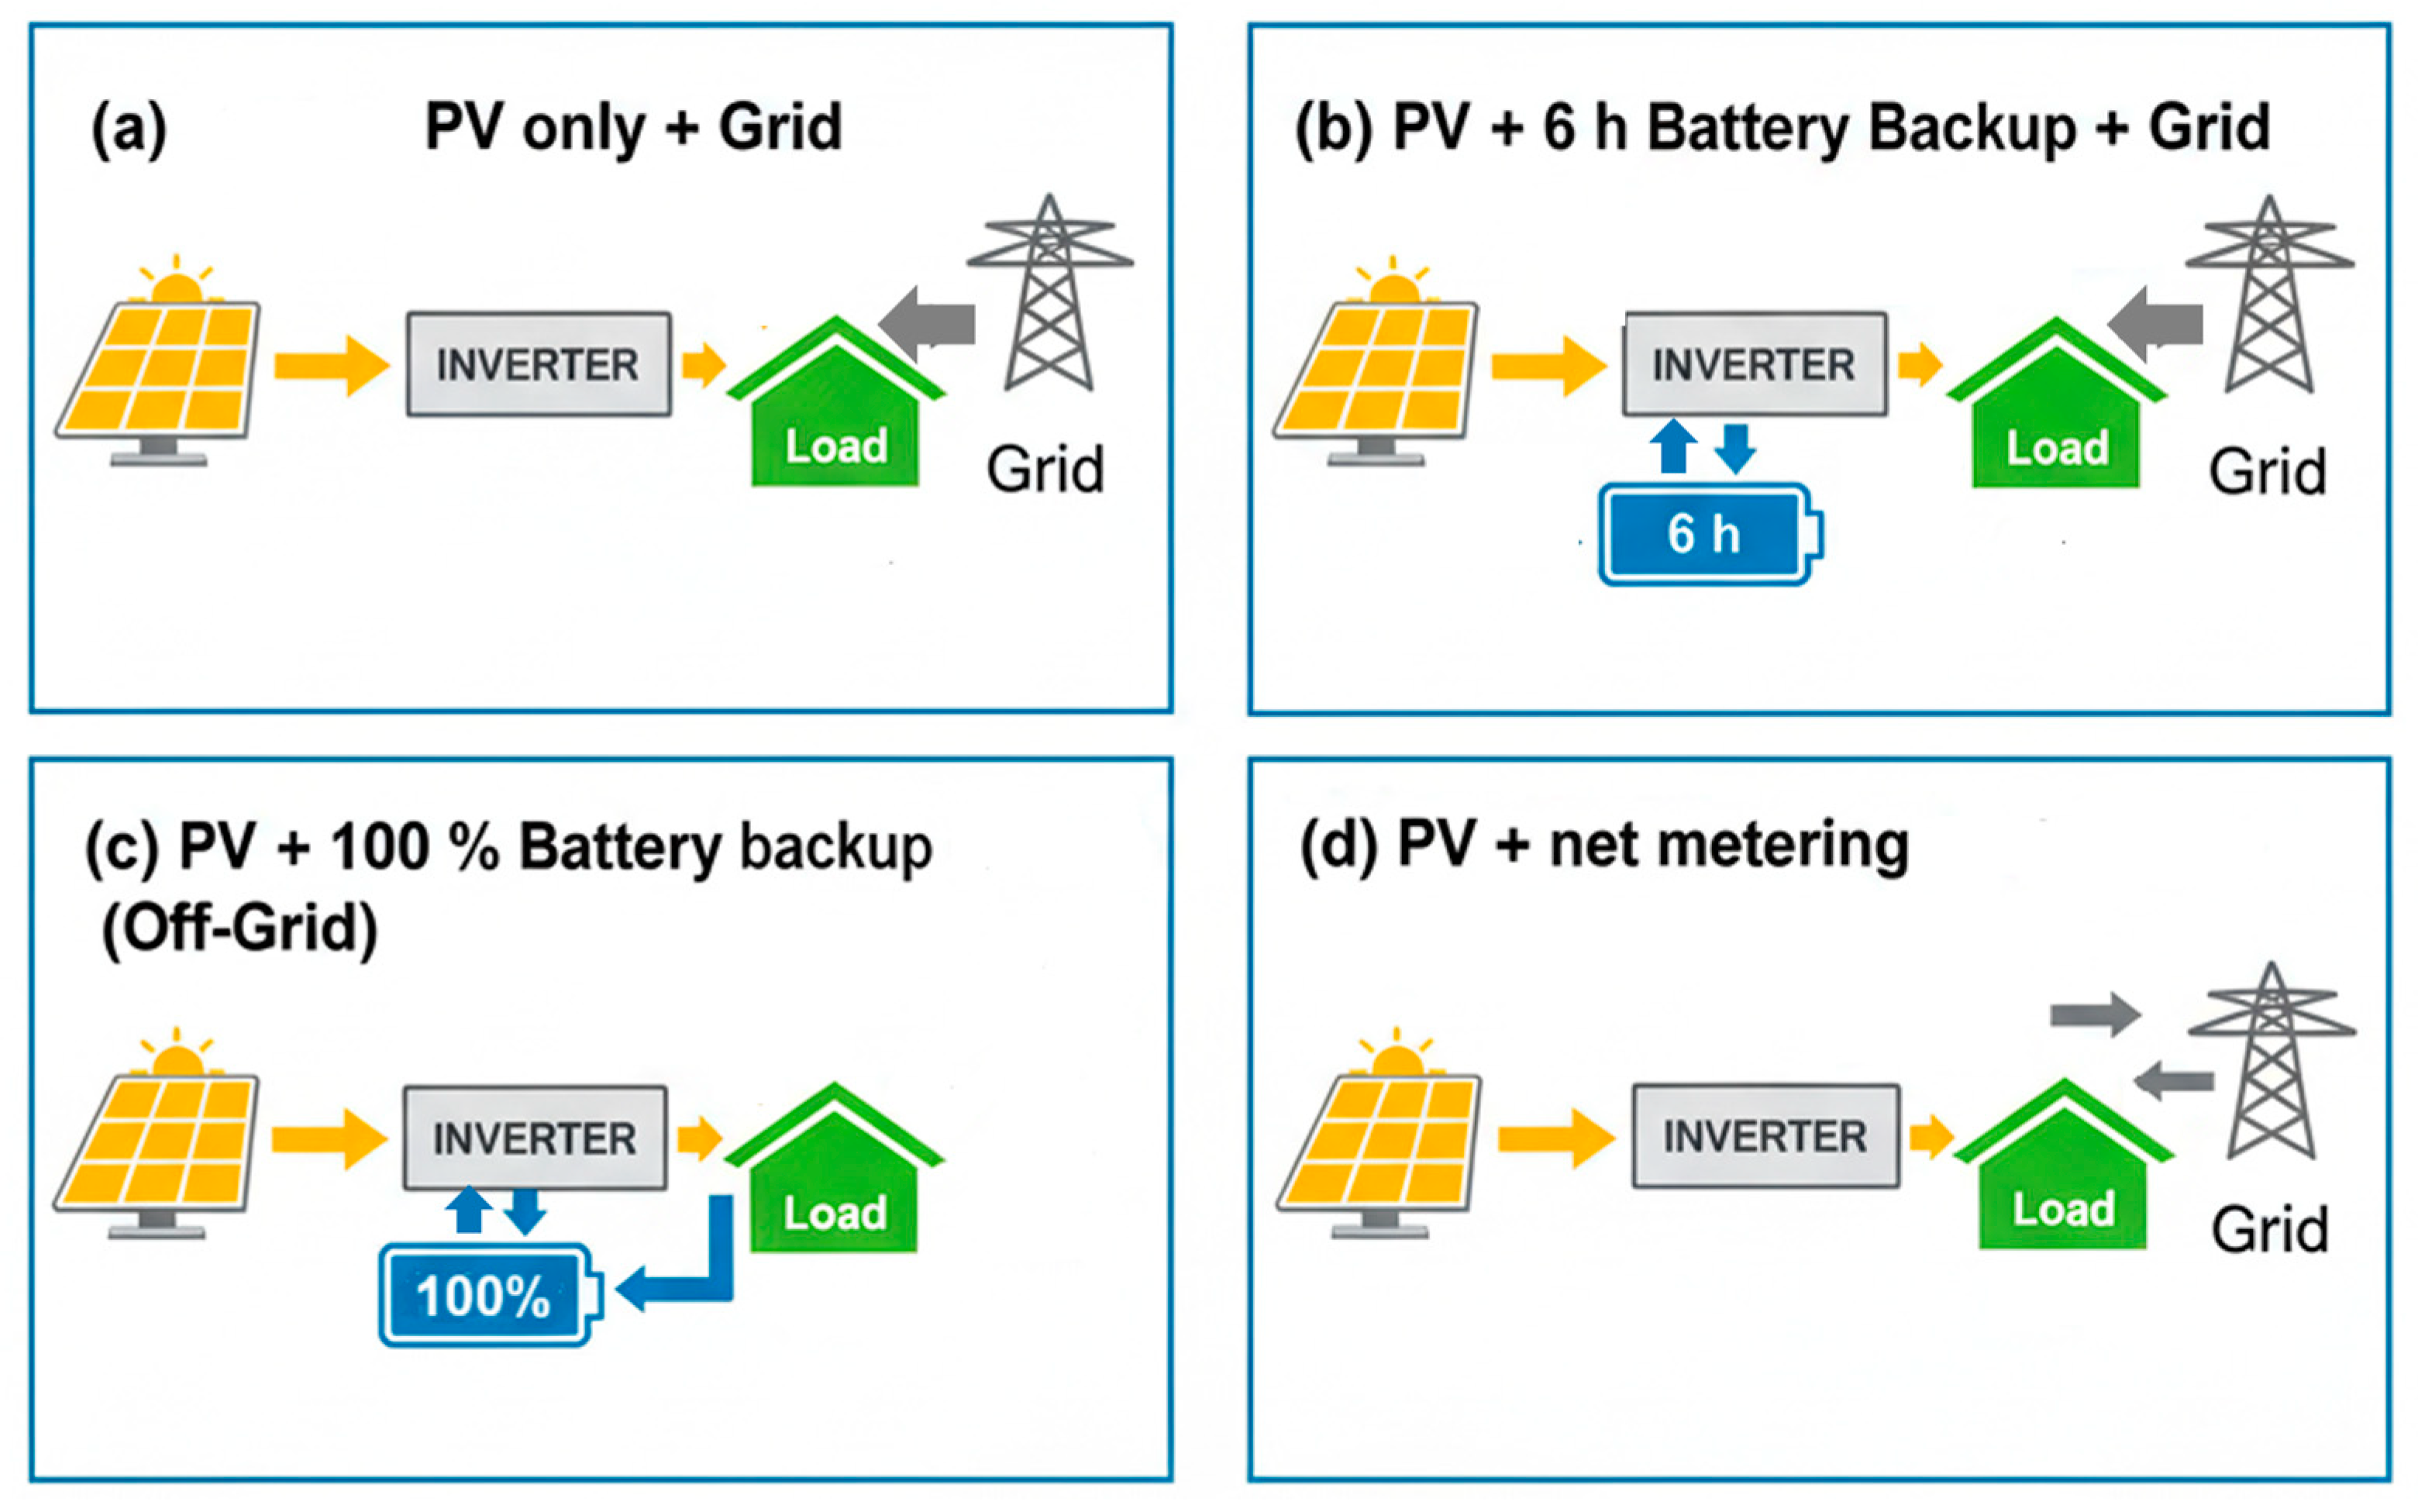
Four residential PV system configurations were evaluated in this study to compare their technical, economic, and environmental performance. These configurations represent different levels of grid interaction and storage integration.
Case A represents a daytime PV system in which solar energy is used only during daylight hours, while the remaining electricity demand is supplied by the grid. Case B includes daytime PV generation with 6 h of battery backup, while the remaining non-solar-hour demand is supplied by the grid. Case C represents a fully battery-supported PV system designed to meet the complete daily electricity demand without grid support. Case D represents a daytime PV system with net metering, where excess solar electricity generated during the day is exported to the grid and electricity is imported during non-solar hours.
The schematic representation of all four configurations is shown in
Figure 1. These cases were selected to represent the practical choices available to urban households in Pakistan, ranging from grid-supported systems to fully solar-dependent systems.
2.3. Energy Analysis
The energy analysis was conducted to determine the required PV installed capacity, rooftop area, and battery storage capacity for each system configuration. The residential load was first divided into daytime and nighttime energy demand, as presented in
Table 2. The daytime demand was used for sizing the PV system for direct solar utilization, while the nighttime demand was used to estimate the storage requirements for battery-supported systems.
The total daily
energy demand of the residential building was calculated based on the rated power, number of appliances, and operating duration of each appliance. Peak sun hours (PSH) represent the equivalent number of hours per day during which the solar irradiance would be 1 kW/m
2 and would provide the same total daily solar irradiation. Thus, PSH should not be interpreted as the actual duration of daylight. An annual-average daily peak-sun-hour value of 5.4 h/day for Karachi was adopted from the literature [
27,
28] and was applied consistently to all four configurations in the analytical system-sizing calculations. This value represents the annual average solar resource and was not calculated separately for each month. Monthly and seasonal variations in solar irradiation were subsequently considered through the site-specific meteorological dataset used in the PVsyst simulation.
Since PV systems generate
DC electricity while residential appliances operate on
electricity, the required
DC energy was determined by accounting for inverter efficiency [
29].
The required rooftop area for PV installation was estimated based on the required system capacity and the specifications of the selected PV module, as provided in
Table 3.
For configurations involving battery storage, namely Case B and Case C, the nighttime energy demand was converted into the required
DC storage demand.
Based on the required stored energy, the battery capacity was calculated considering the system voltage.
In Equations (1)–(5), is the required PV capacity in kW; the energy required is the case-specific daily electricity demand in kWh/day; peak sun hours represent the annual-average equivalent solar hours in h/day; PDC is the required DC installed capacity in kW; and the conversion efficiency is the adopted overall system efficiency. Area represents the required PV-module area in m2, while ηPV,module is the rated module efficiency. For the battery calculations, the energy required by the battery is the electricity demand to be supplied during the backup period, the DC battery load is the corresponding battery-side energy after accounting for inverter efficiency, the system voltage is the nominal battery-bank voltage, DoD is the allowable depth of discharge adopted as 50%, and battery capacity is the required nominal storage capacity in Ah.
Based on the required DC energy storage, the nominal battery-bank capacity was calculated by considering the system voltage and allowable depth of discharge, as expressed in Equation (5). In this equation, battery capacity is expressed in ampere-hours (Ah), DC battery load represents the required stored energy in watt-hours (Wh), system voltage is expressed in volts (V), and DoD represents the allowable fractional depth of discharge. A DoD of 50% was adopted for the selected lead-acid battery, meaning that only half of its nominal capacity was considered usable during routine operation. Gradual battery aging and capacity fade were not explicitly included in the sizing calculation; therefore, the calculated value represents the initial nominal battery-bank capacity. However, battery replacement costs were considered in the lifecycle economic assessment. The effects of cycle-dependent degradation, operating temperature, and long-term capacity loss are acknowledged as limitations of the present analysis.
In Equation (5),
DoD represents the adopted depth of discharge of the lead-acid battery. The technical specifications reported in
Table 3 and
Table 4 were obtained from the manufacturers’ product information for the selected JinkoSolar photovoltaic module and Atlas lead-acid battery, respectively [
29,
31]. These components were selected because they were readily available and commonly used in the local market at the time of the study. The rated power, voltage, current, dimensions, and nominal battery capacity were therefore treated as manufacturer-provided input data rather than calculated values. A depth of discharge of 50% was adopted for the lead-acid battery in the battery-bank sizing calculation.
The lead-acid battery was selected as the baseline storage technology because the selected Atlas battery was readily available, commonly used in residential PV and uninterruptible power-supply applications, and represented a comparatively affordable upfront option in the surveyed local market. Battery chemistry influences the usable storage capacity, operating lifetime, and replacement requirement. For the selected lead-acid battery, a maximum depth of discharge of 50% was adopted to limit deep cycling and reduce premature capacity deterioration. Lithium-ion batteries generally allow deeper discharge, provide higher energy density and conversion efficiency, and may offer a longer cycle life; however, they usually involve a higher initial investment and require an appropriate battery-management system [
33,
34]. Consequently, the use of lead-acid batteries may increase the required nominal battery-bank capacity and may result in more frequent replacement during the project lifetime compared with a lithium-ion system. Conversely, their lower initial cost and local availability can improve initial affordability. Therefore, the battery-sizing and economic results reported in this study are specific to the selected lead-acid technology.
2.4. Economic Assessment
The economic assessment was conducted to evaluate the financial feasibility of the four PV system configurations. The analysis considered initial investment cost, operation and maintenance cost, replacement cost, system lifetime, annual energy generation, and electricity cost savings. The cost data for PV modules, inverters, batteries, wiring, breakers, support structures, and miscellaneous components were obtained from a local market survey in Karachi and are presented in
Table 5. The economic analysis was conducted using component costs obtained from the local Karachi market, a project lifetime of 15 years, and a nominal discount rate of 20%. The resulting indicators are therefore site- and assumption-specific comparative estimates rather than universally applicable investment projections.
The net present value (
NPV) was calculated by comparing the present value of annual electricity-cost savings with the initial investment and discounted component-replacement costs over the project lifetime:
The lifecycle cost (
LCC) represents the present value of the initial investment, operation and maintenance expenditure, and component-replacement costs incurred during the system lifetime:
The levelized cost of electricity (
LCOE) was calculated by dividing the lifecycle cost by the total electricity generated over the assumed system lifetime:
In Equations (6)–(8), CI is the initial investment cost (USD), AS is the annual electricity-cost saving (USD/year), CO&M is the annual operation and maintenance cost (USD/year), Crep is the component-replacement cost (USD), i is the nominal discount rate, N is the project lifetime in years, n is the year in which replacement occurs, and EAC,y is the annual electricity generation (kWh/year). The term (P/A,i,N) represents the present-worth factor for a uniform annual series, whereas (P/F,i,n) represents the present-worth factor for a future single payment. When multiple replacements occur, their discounted present values are summed. NPV, LCC, and LCOE are reported in USD, USD, and USD/kWh, respectively.
The cost values used in the economic assessment were obtained by the authors from a survey of locally available residential PV-system components in Karachi. The reported values were adopted as fixed economic input assumptions for comparing the four configurations. The technical specifications in
Table 3 and
Table 4 were obtained from manufacturer information, whereas the cost inputs in
Table 5 were based on the local market survey.
2.5. Environmental Impact Assessment
The present analysis estimates the operational greenhouse gas emissions avoided by displacing conventional grid electricity with electricity generated by each PV configuration. The assessment includes CO2, CH4, and N2O because these gases were available in the adopted grid-emission dataset. It is not a complete life-cycle assessment and does not quantify emissions or environmental impacts associated with PV-module and battery manufacturing, transportation, installation, replacement, recycling, or disposal. Other impact categories, including air pollutants, acidification, eutrophication, toxicity, water use, and resource depletion, are therefore outside the scope of the present comparative analysis.
The avoided emissions were calculated based on the total electricity generated by each PV system over its lifetime and the corresponding emission factors for each greenhouse gas.
The avoided carbon dioxide emissions were determined as follows:
Similarly, the avoided methane emissions were calculated using:
The avoided nitrous oxide emissions were calculated as:
where E
life represents the total energy generated over the system lifetime in MWh, and EF
CO2, EF
CH4, and EF
N2O represent the emission factors for CO
2, CH
4, and N
2O, respectively. The CO
2, CH
4, and N
2O emission factors were adopted from a Pakistan-focused published study because it reported all three greenhouse gases on a consistent per-unit-electricity basis. The factors were treated as average grid-electricity displacement factors rather than technology- or power-plant-specific values. They reflect the Pakistani electricity mix represented in the source study but were not independently recalculated using the latest annual generation data or the specific K-Electric supply mix for Karachi. Because the national and utility-level generation mixes can vary over time, the calculated avoided emissions should be interpreted as approximate comparative estimates rather than exact current-year emission reductions.
2.6. PVsyst Simulation of the Optimum System
Following the techno-economic and environmental assessment, the most suitable PV configuration was further evaluated using PVsyst 7.3.0 simulation software to assess its performance under realistic operating conditions. The simulation was conducted for Karachi, Pakistan, using site-specific climatic data.
The system was modeled with an azimuth angle of 0° and a plane tilt angle of 25°, and optimization was performed based on annual solar irradiation. The residential load profile described in
Table 2 was used as the input demand for the simulation.
A single PVsyst simulation run (n = 1) was conducted for the selected system configuration using one fixed simulation variant. The standard PVsyst simulation applied in this study is deterministic for the specified meteorological data, PV-module and battery characteristics, system configuration, orientation, load profile, losses, and simulation settings. No stochastic, Monte Carlo, or randomized procedure was applied. Therefore, repeating the same unchanged simulation variant would not provide independent observations, and calculation of replicate-based mean values and standard deviations was not applicable. The results reported in this study are the direct outputs of this single simulation run.
The performance ratio (PR) is a dimensionless indicator that compares the actual useful energy output of the PV system with the theoretical energy output expected from the installed nominal capacity and available in-plane irradiation. It accounts collectively for losses associated with module temperature, wiring, inverter conversion, mismatch, battery operation, and other system inefficiencies. A higher PR therefore indicates better overall system performance under the specified operating conditions.
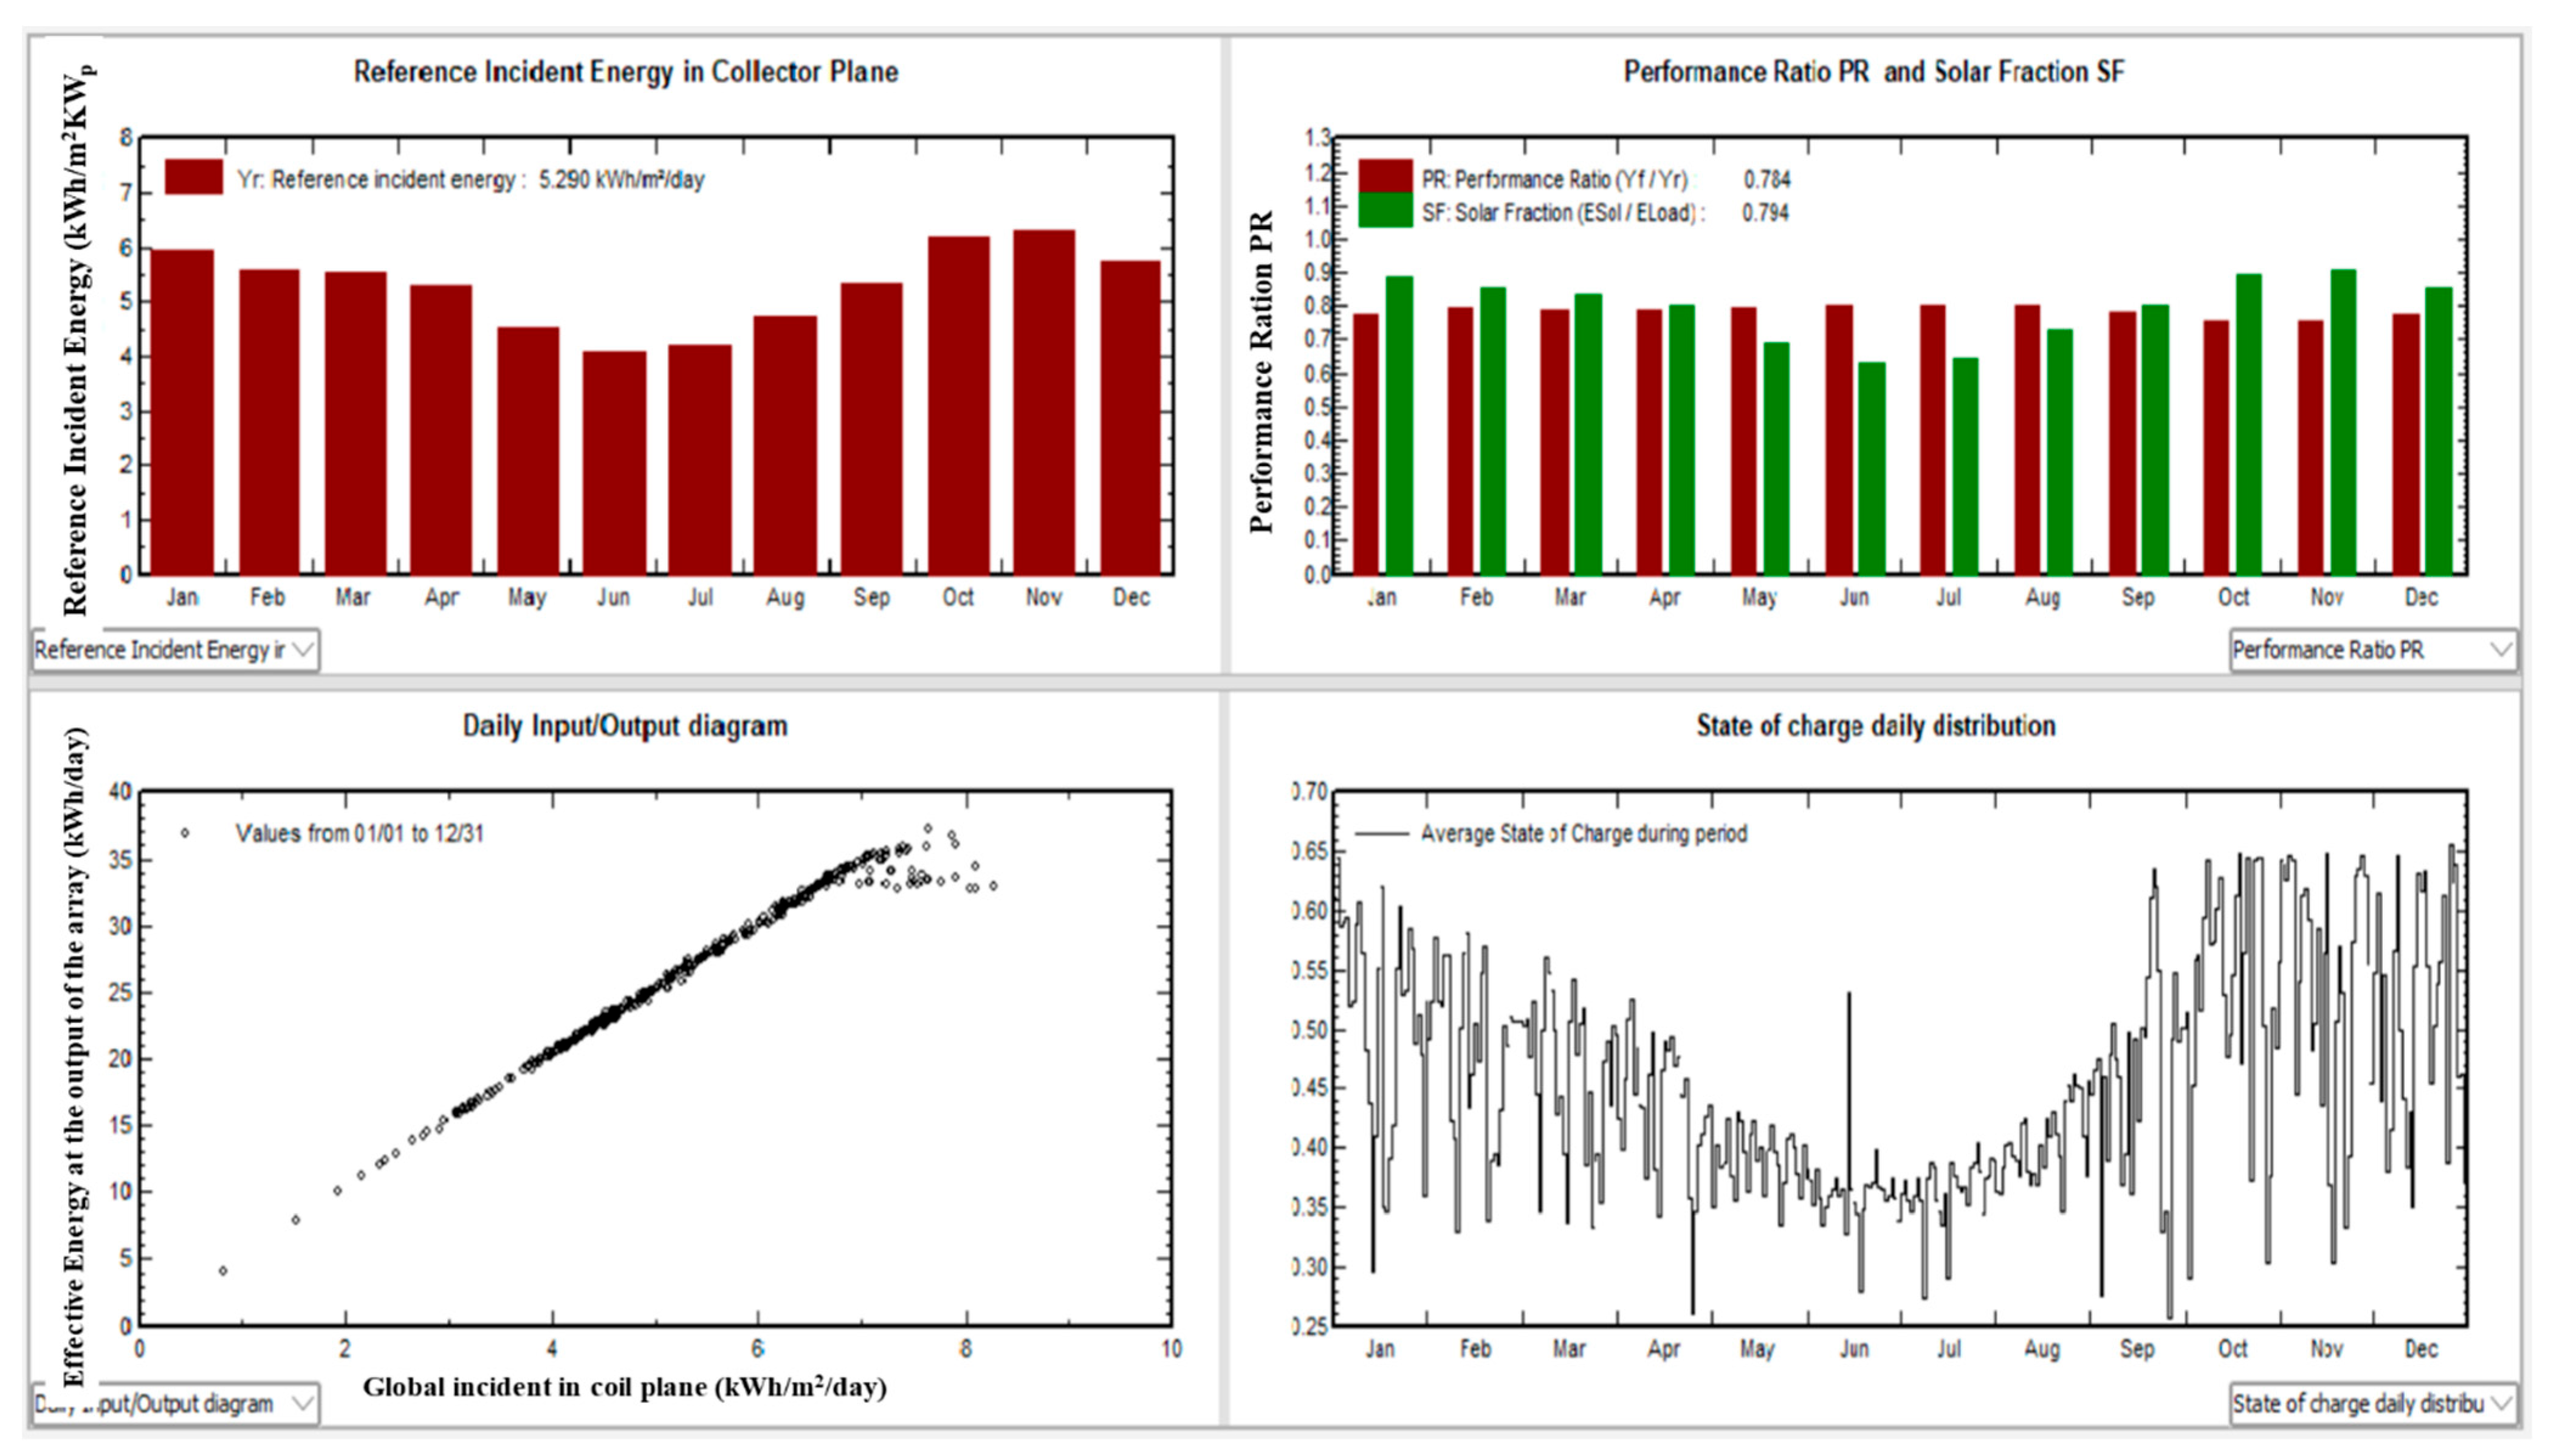
Key performance indicators obtained from the simulation included reference incident energy, performance ratio, solar fraction, daily input–output characteristics, and battery state-of-charge distribution. These parameters were used to validate the analytical results and to assess the operational reliability of the selected PV configuration.
No sensitivity analysis was conducted for the panel tilt angle, household load profile, or battery parameters. The selected Case B configuration was simulated using fixed inputs, including a tilt angle of 25°, the representative residential load profile reported in
Table 2, and the selected battery specifications. Therefore, the PVsyst results represent the performance of this configuration under one defined design scenario rather than the full range of possible operating conditions. Variations in tilt angle, seasonal electricity demand, battery capacity, depth of discharge, and battery efficiency could affect the simulated energy yield, solar fraction, state of charge, and grid dependence.
2.7. Use of Generative Artificial Intelligence
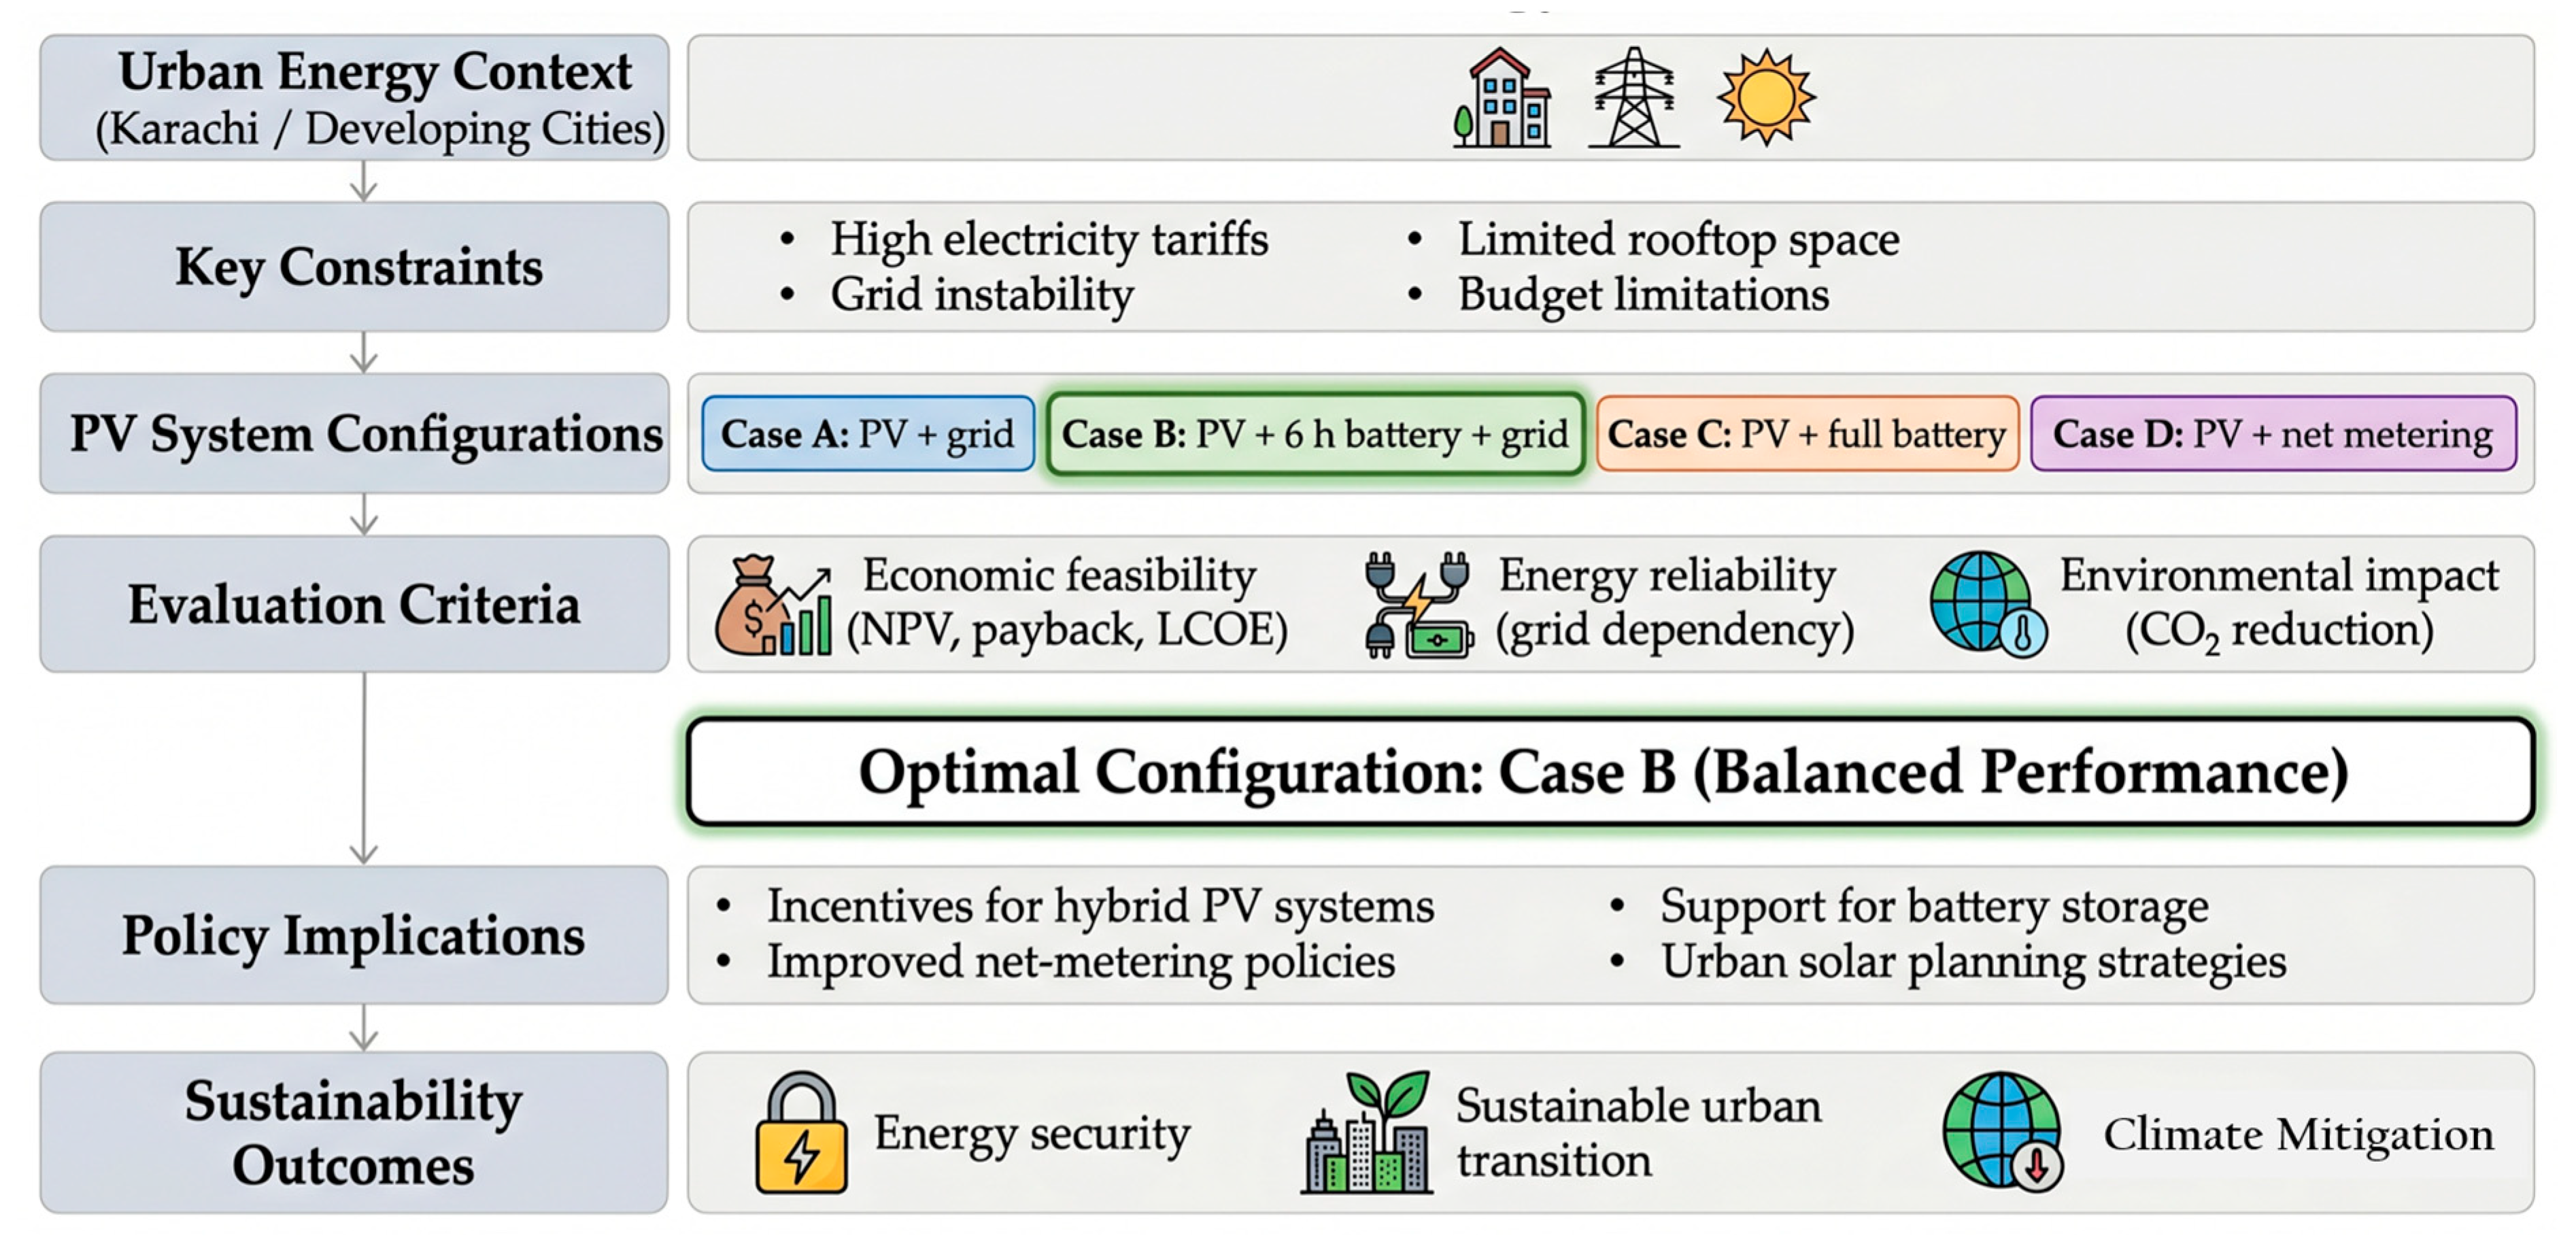
During the preparation of Figure 11, the authors used Gemini (Gemini 3.1 Pro, Google LLC, Mountain View, CA, USA) to generate an initial schematic based on author-provided instructions, scientific information, and the findings of this study. The generative artificial intelligence tool was not used to formulate the study design, generate research data, perform technical or economic calculations, conduct the PVsyst simulation, analyze the results, or make scientific interpretations. The authors critically reviewed, edited, and verified the generated graphical output and take full responsibility for the accuracy, originality, integrity, and final content of Figure 11.
3. Results
3.1. Energy Performance of PV Configurations
The energy performance of the four photovoltaic (PV) system configurations was evaluated based on installed capacity, area requirement, battery storage needs, and energy utilization patterns. The results highlight the trade-offs between system size, storage requirements, and grid dependency. The plotted values in
Figure 2,
Figure 3,
Figure 4 and
Figure 5 were calculated by the authors and were not taken directly from the literature or an external database.
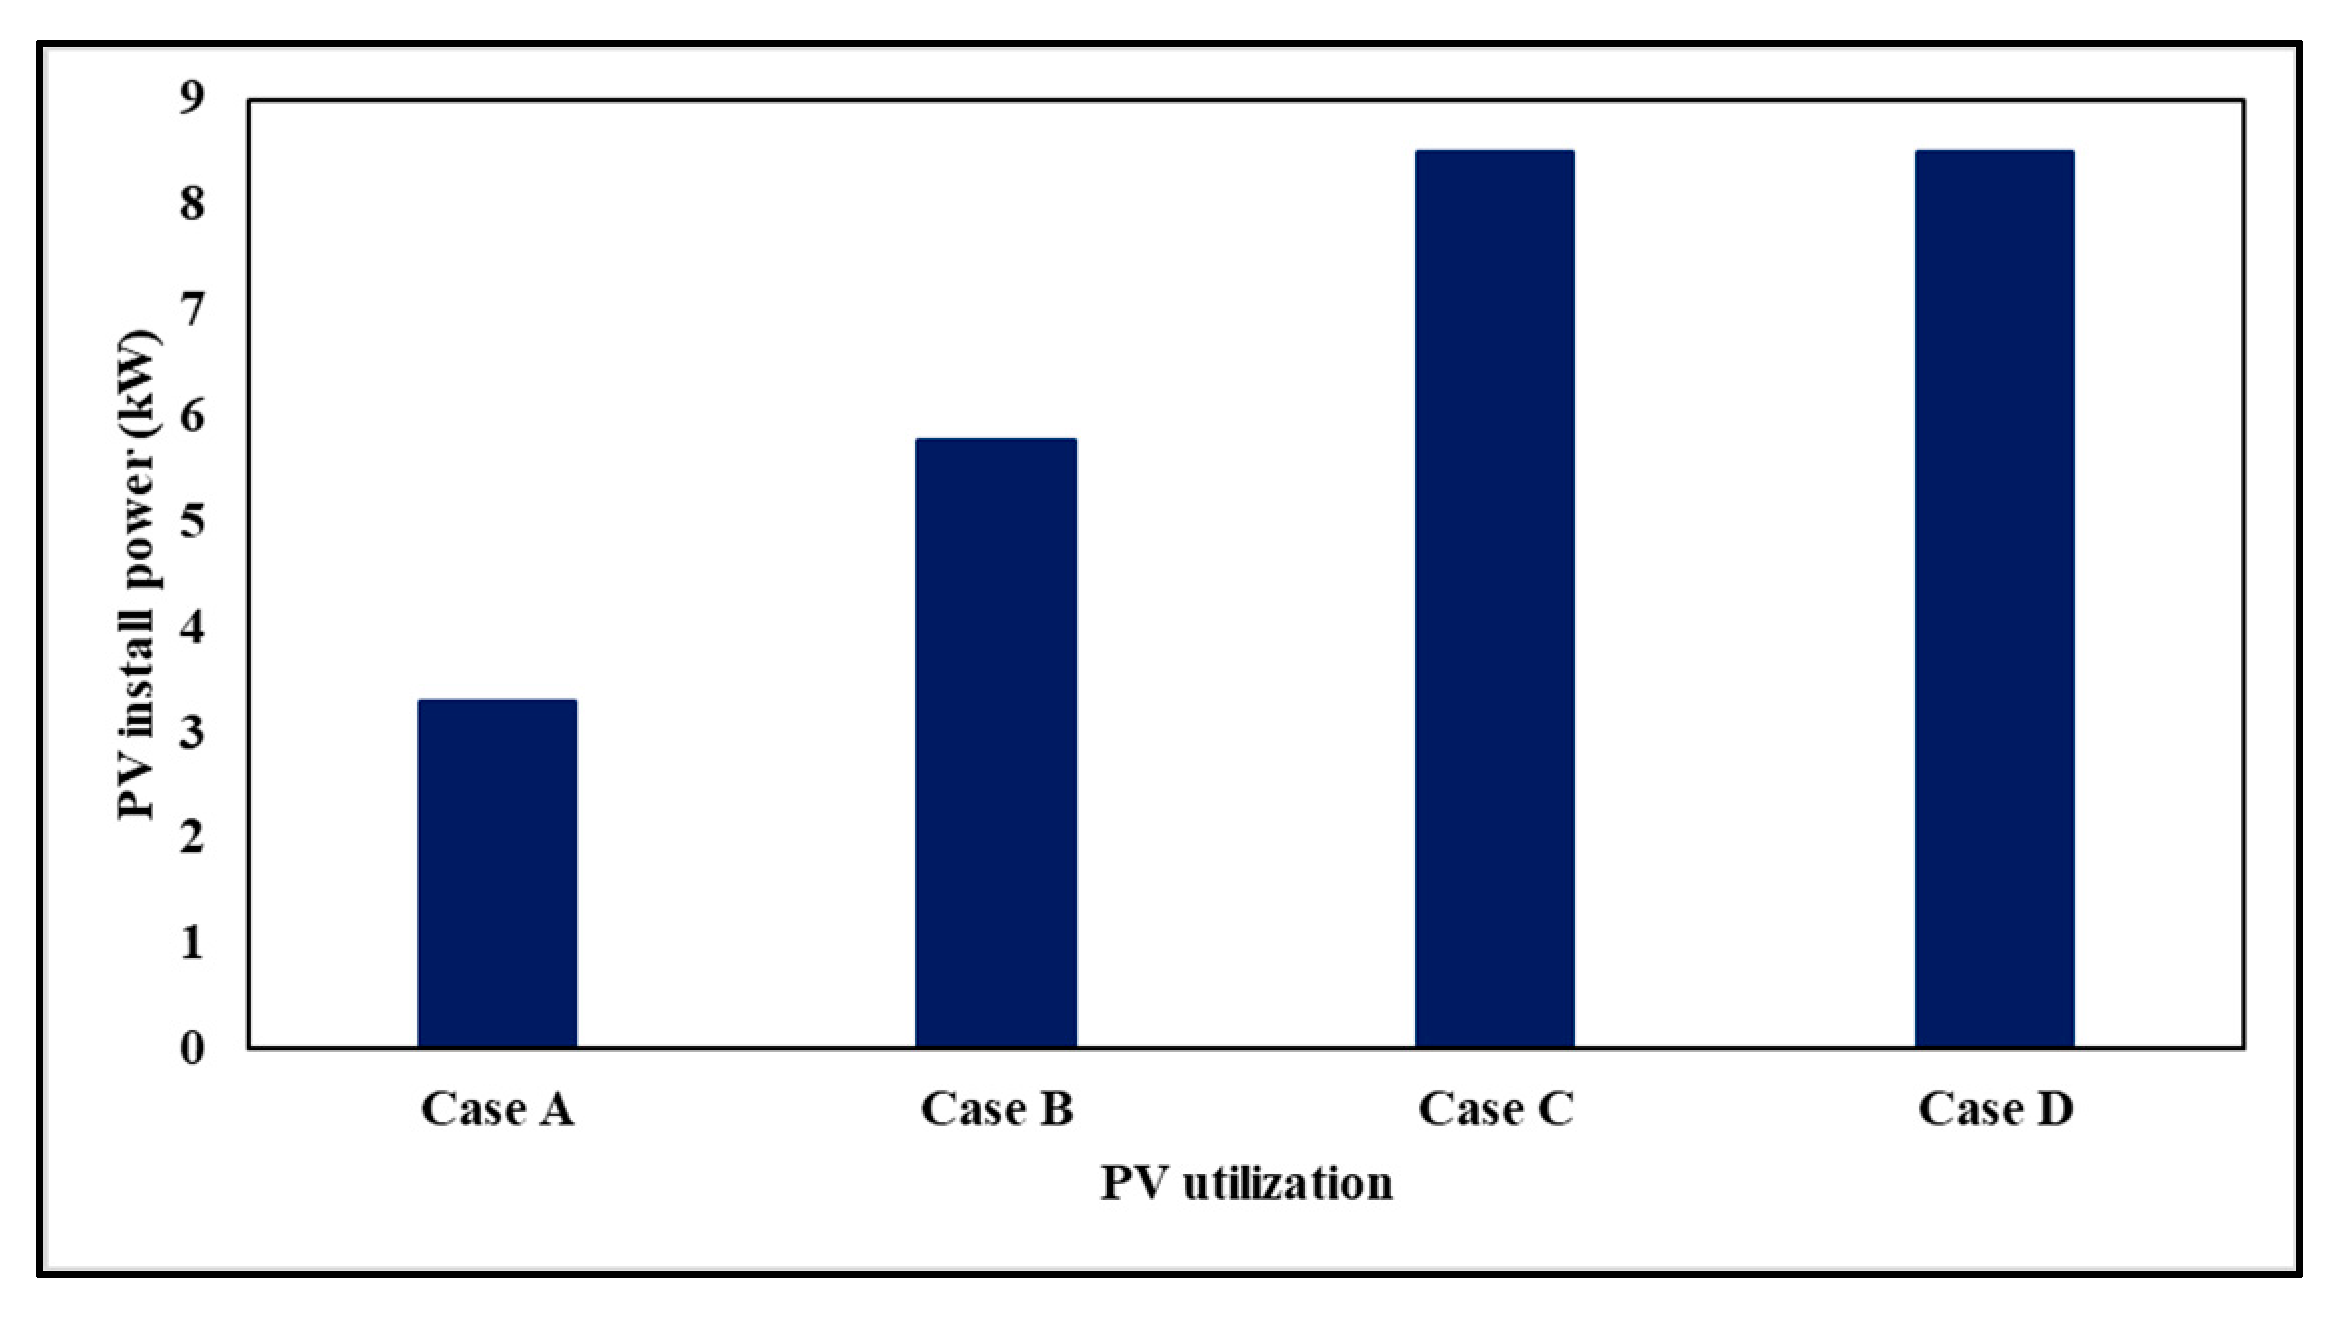
The installed PV capacities presented in
Figure 2 were calculated using Equations (1) and (2), based on the case-specific residential electricity demand in
Table 2, the adopted peak sun hours, and the system conversion efficiency. For Case A (daytime PV with grid support), the required capacity was approximately 3.3 kW, as the system was designed to meet only the daytime energy demand. In contrast, Case B (PV with 6 h battery backup and grid support) required a higher capacity of approximately 5.7 kW to accommodate both daytime consumption and partial storage requirements. For Case C (fully battery-supported PV system) and Case D (net-metered PV system), the required capacity increased to approximately 8.3 kW, reflecting the need to meet the full daily energy demand through solar generation. These results indicate that increasing energy independence from the grid significantly increases the required system size.
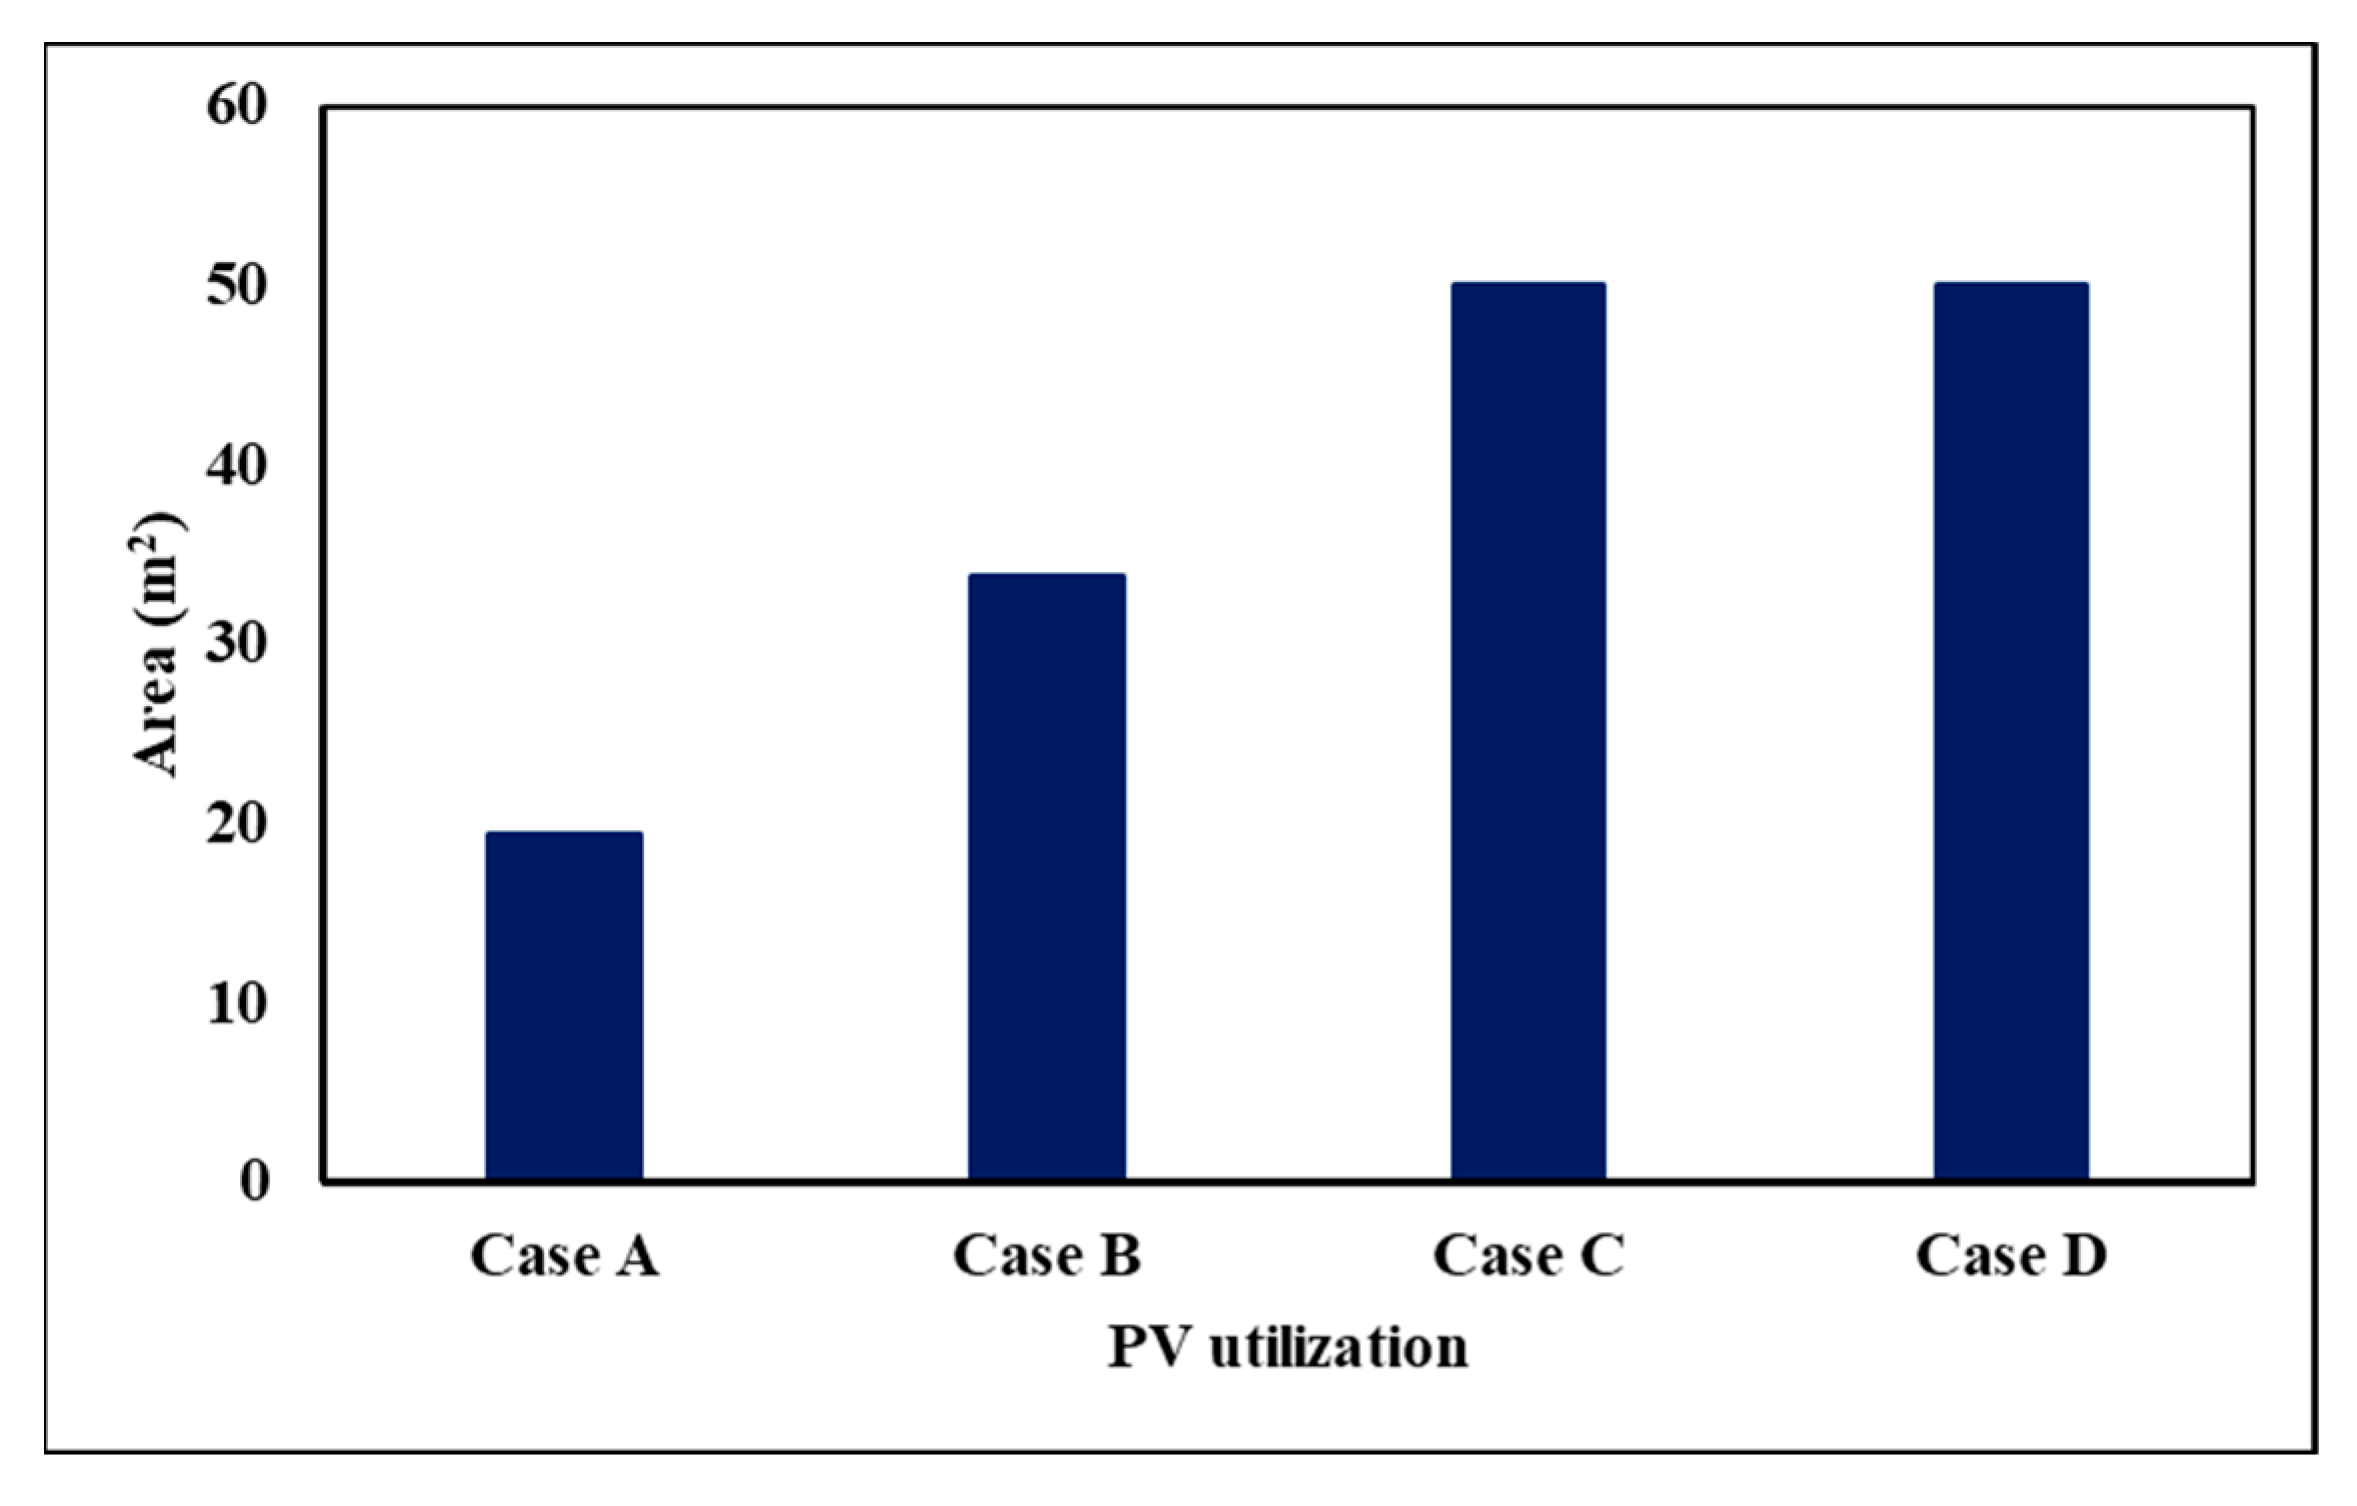
The corresponding rooftop-area requirements in
Figure 3 were calculated using Equation (3) and the selected PV-module characteristics reported in
Table 3. Case A required approximately 19 m
2 of installation area, while Case B required around 33 m
2. For Case C and Case D, the required area increased to approximately 50 m
2. The increase in area requirement is directly associated with higher energy generation needs, particularly for systems designed to supply electricity during non-solar hours. This highlights the importance of rooftop availability in determining the feasibility of PV system configurations in urban residential settings.
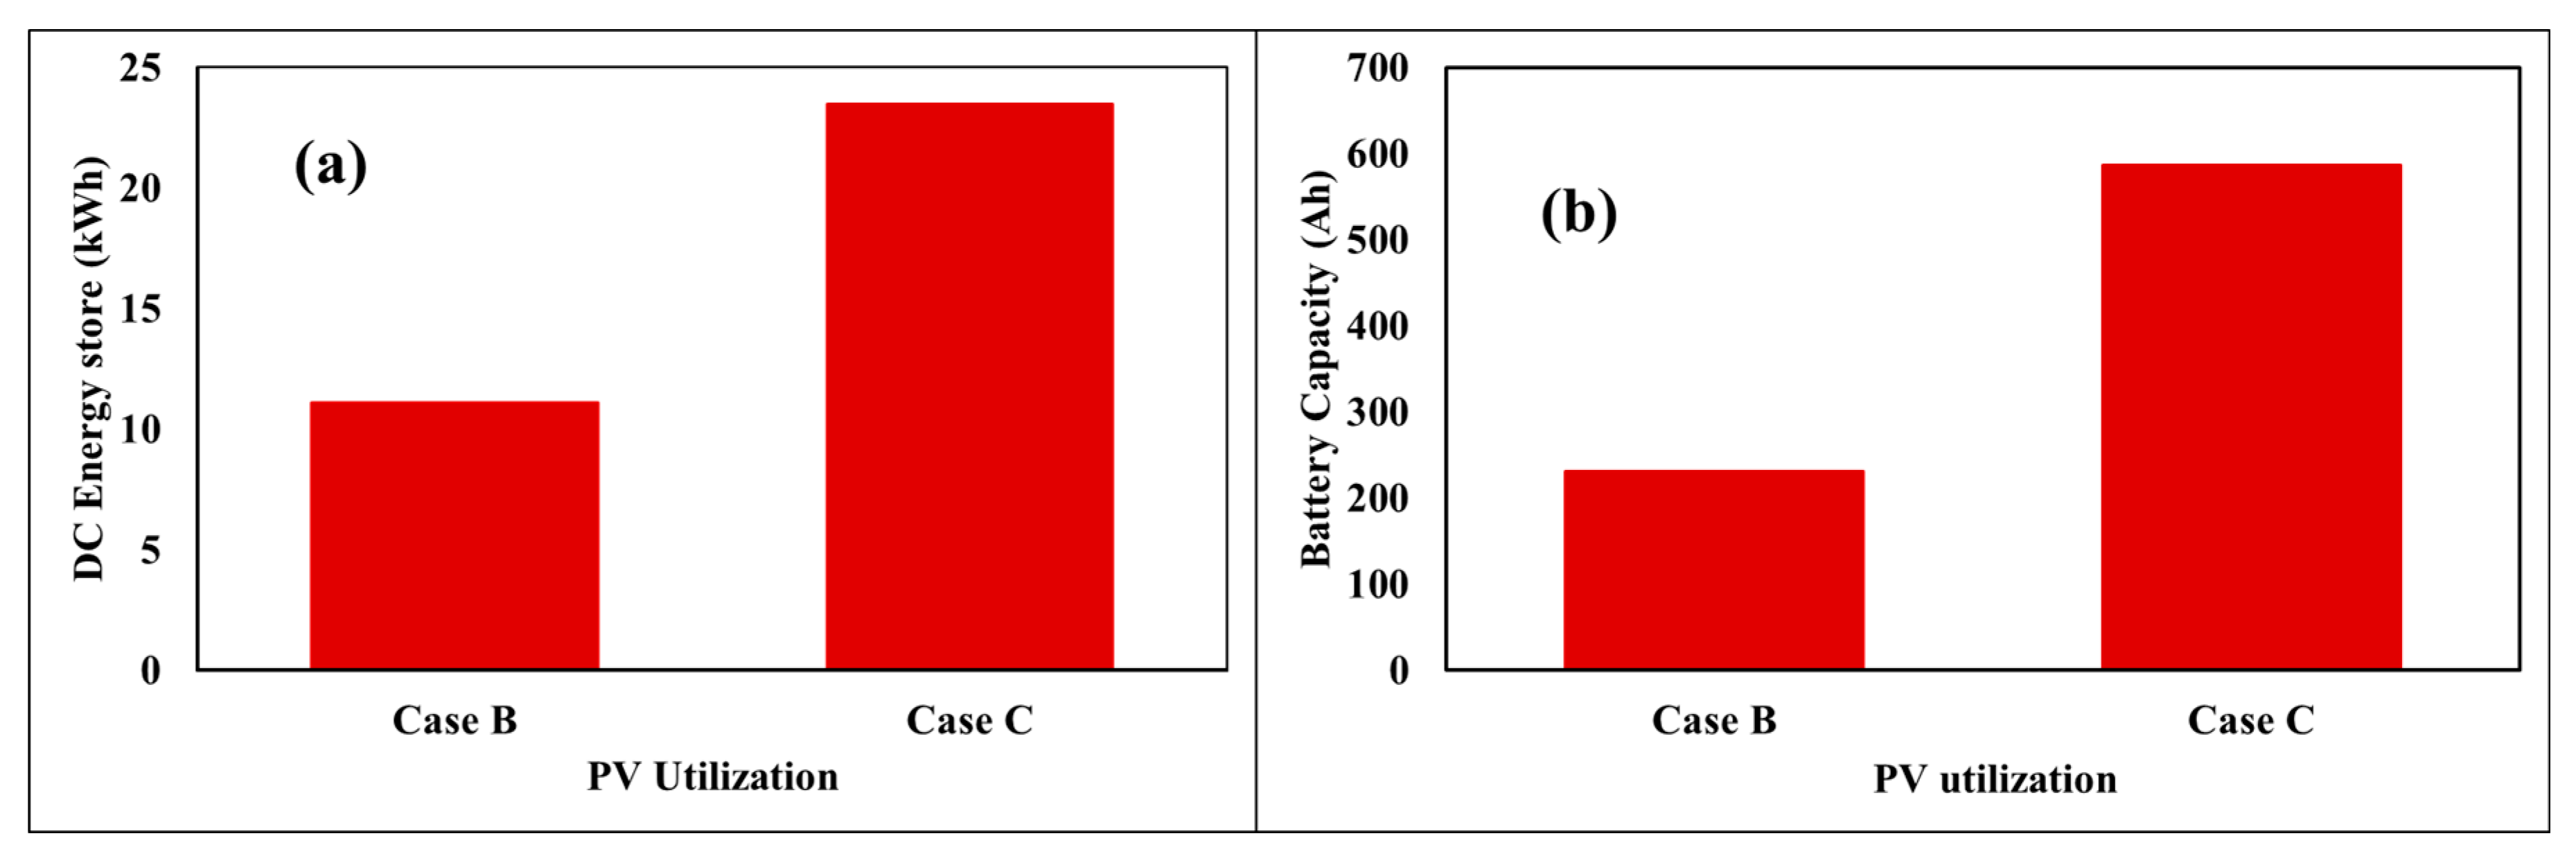
For the battery-supported configurations, the DC energy-storage requirements and corresponding ampere-hour capacities shown in
Figure 4 were calculated using Equations (4) and (5). Case B required approximately 10 kWh of stored energy to provide 6 h of backup, while Case C required approximately 24 kWh to meet the full nighttime demand. The corresponding battery capacity was approximately 230 Ah for Case B and 590 Ah for Case C. These values were determined based on system voltage and inverter efficiency, indicating that full energy independence requires substantially larger storage capacity.
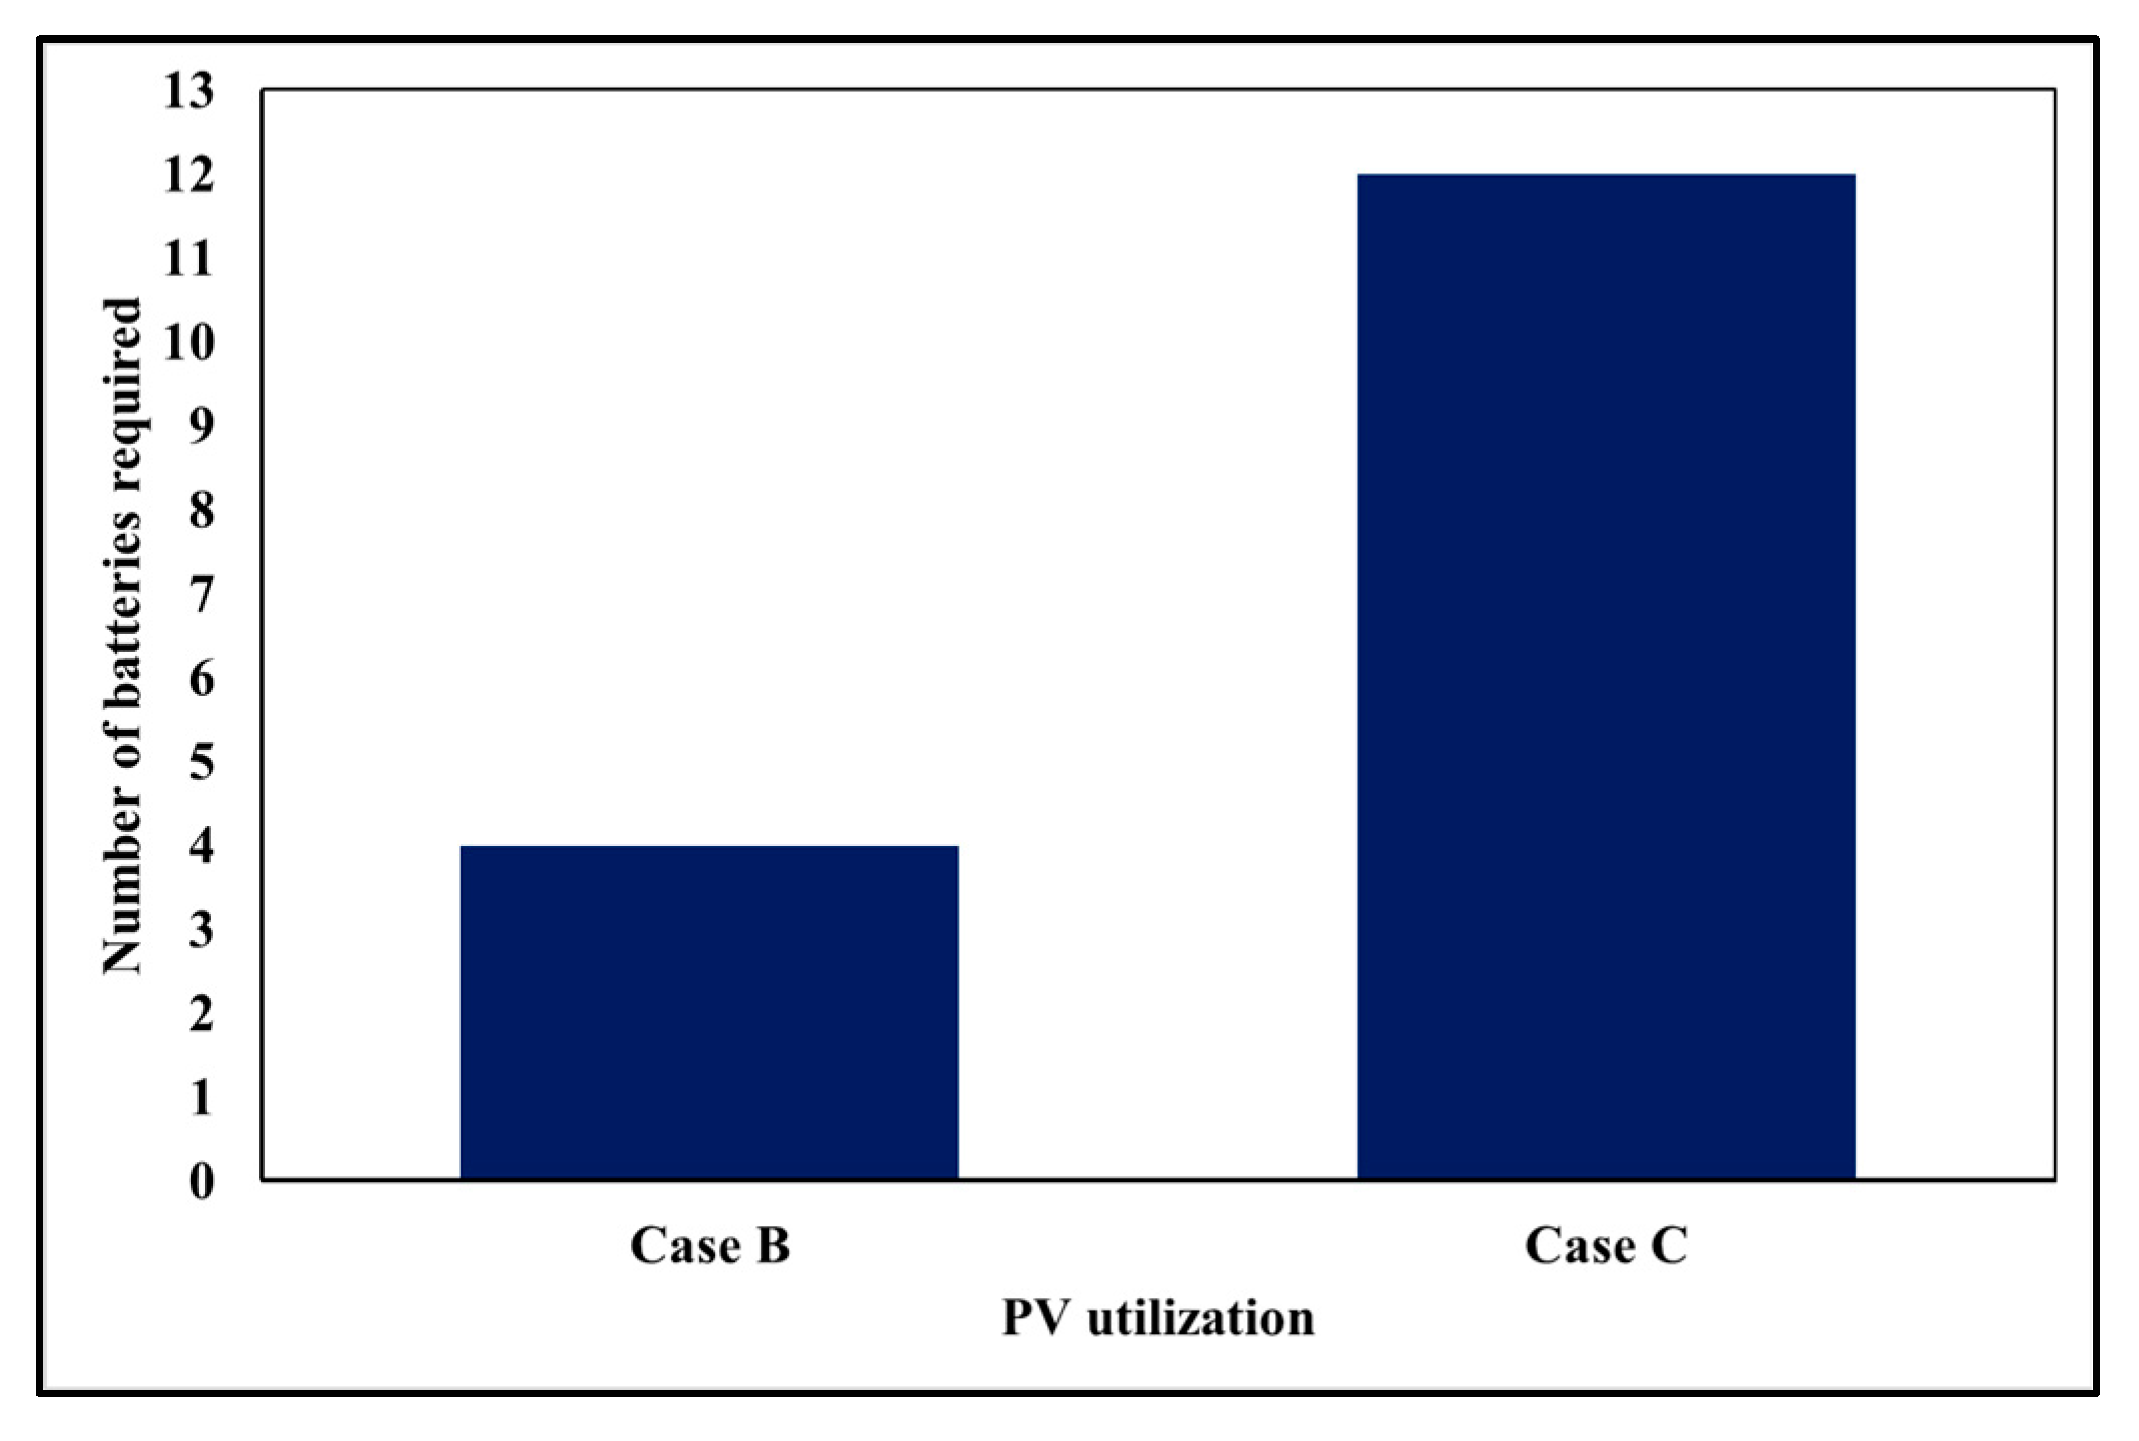
The number of batteries shown in
Figure 5 was subsequently determined by comparing the required battery-bank voltage and capacity with the nominal voltage and capacity of the individual battery reported in
Table 4. Case B required four batteries connected in series to achieve the desired system voltage, whereas Case C required twelve batteries arranged in multiple series-parallel combinations to meet both voltage and capacity requirements. This substantial increase in battery count further emphasizes the higher capital and spatial requirements associated with fully off-grid systems.
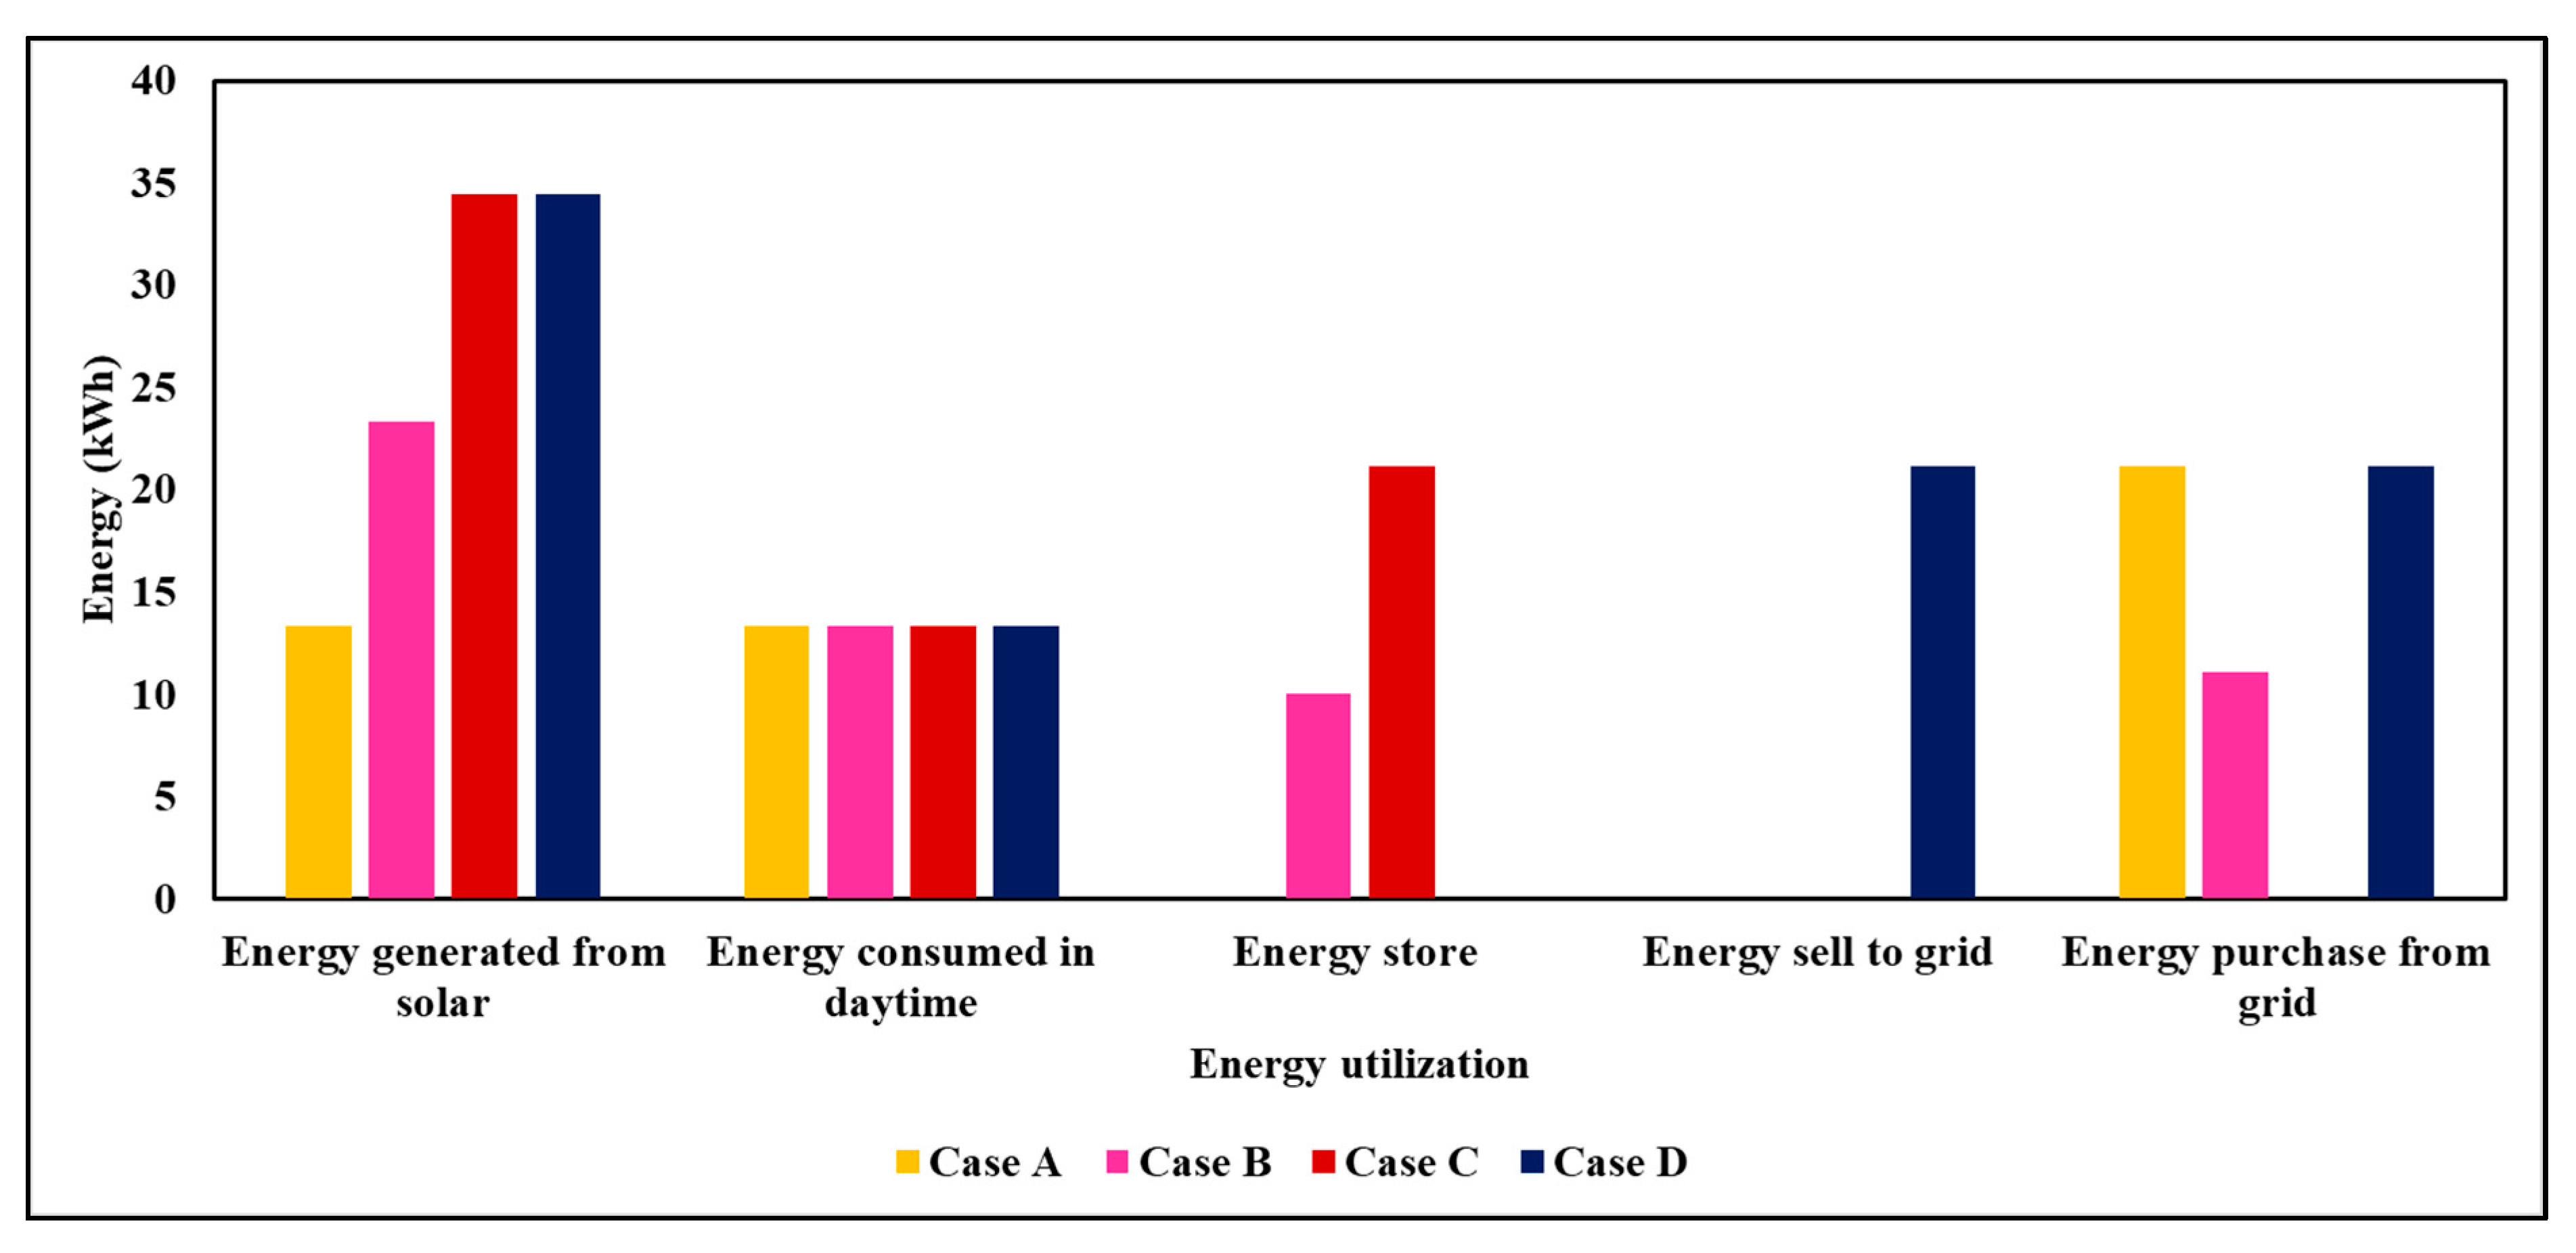
The overall energy utilization patterns for all configurations are summarized in
Figure 6. Case A relied heavily on grid electricity during non-solar hours, with no energy storage or export. Case B balanced solar generation, battery storage, and grid usage, reducing grid dependency while maintaining system flexibility. Case C operated independently of the grid, with all energy supplied through solar generation and storage. Case D utilized net metering to export excess daytime energy to the grid and import energy during non-solar hours, effectively using the grid as a virtual storage system. These results demonstrate that hybrid configurations, particularly Case B and Case D, provide more balanced energy management strategies compared to purely grid-dependent or fully off-grid systems.
3.2. Economic Performance of PV Configurations
The values plotted in
Figure 7 and
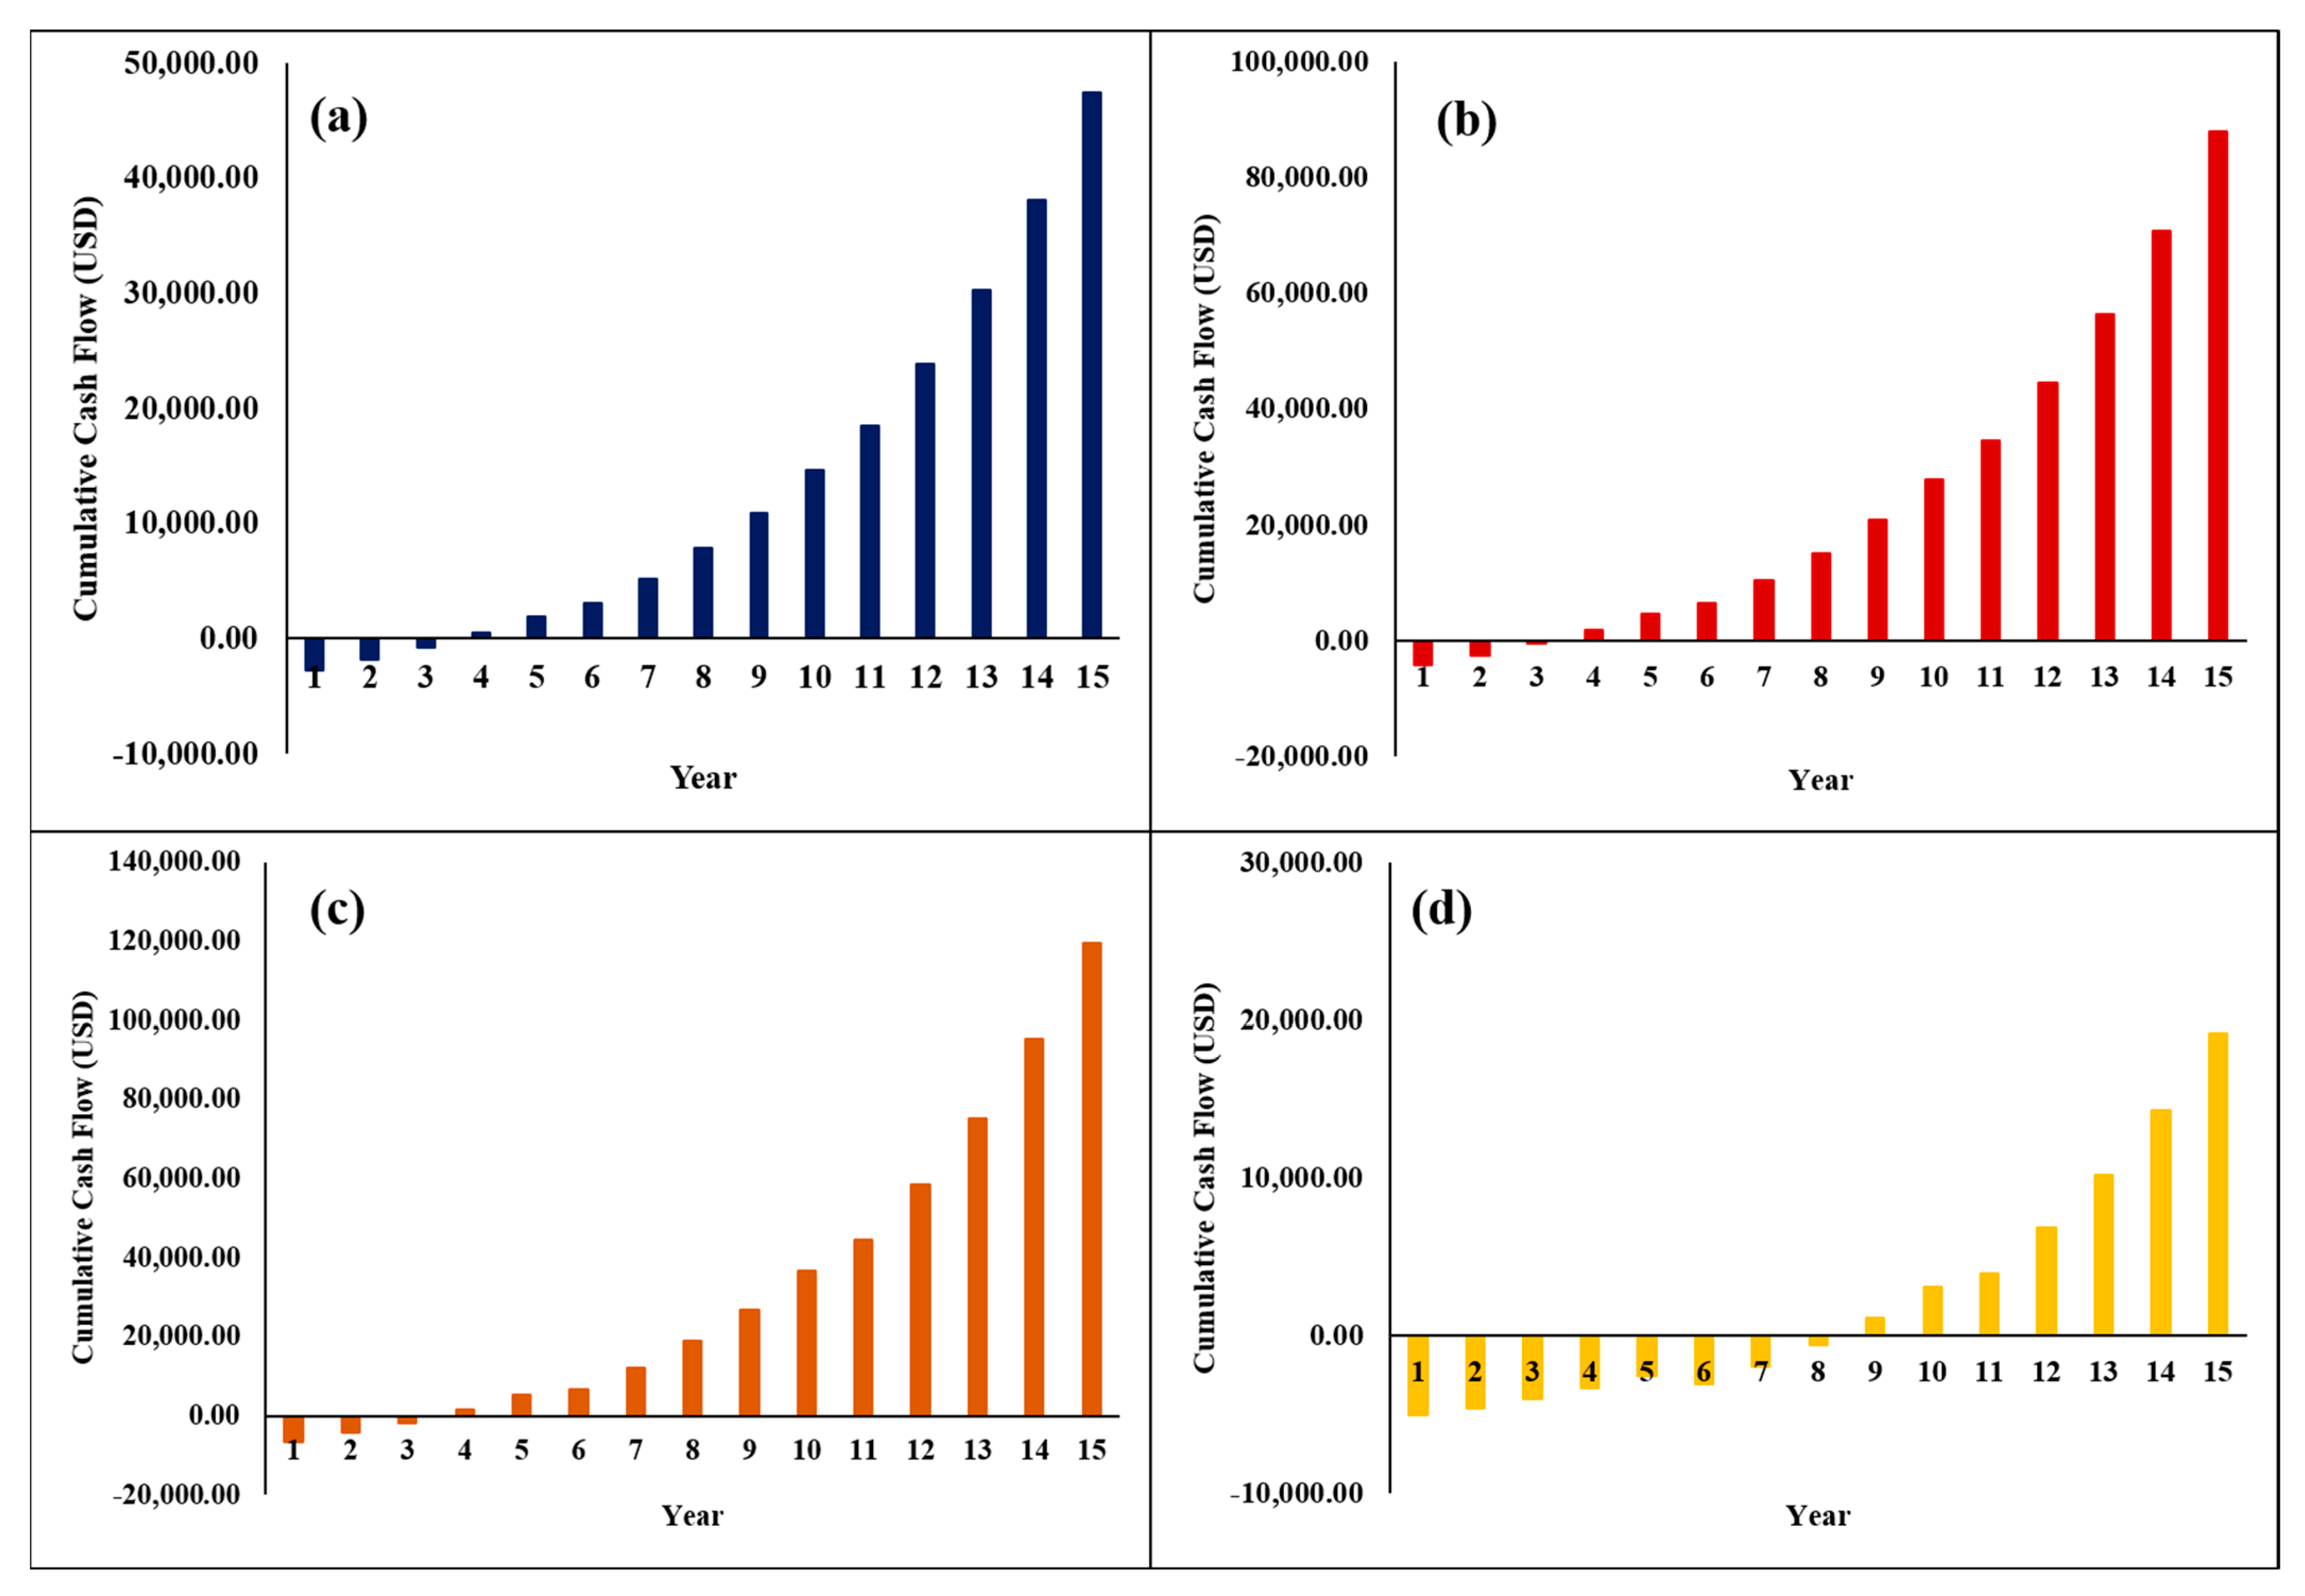
Figure 8 were calculated from the economic inputs and equations described in this section and were not taken directly from the published literature. The cumulative cash-flow curves in
Figure 7 were developed by considering the initial investment, annual electricity-cost savings, operation and maintenance costs, and applicable component-replacement costs over the assumed 15-year system lifetime.
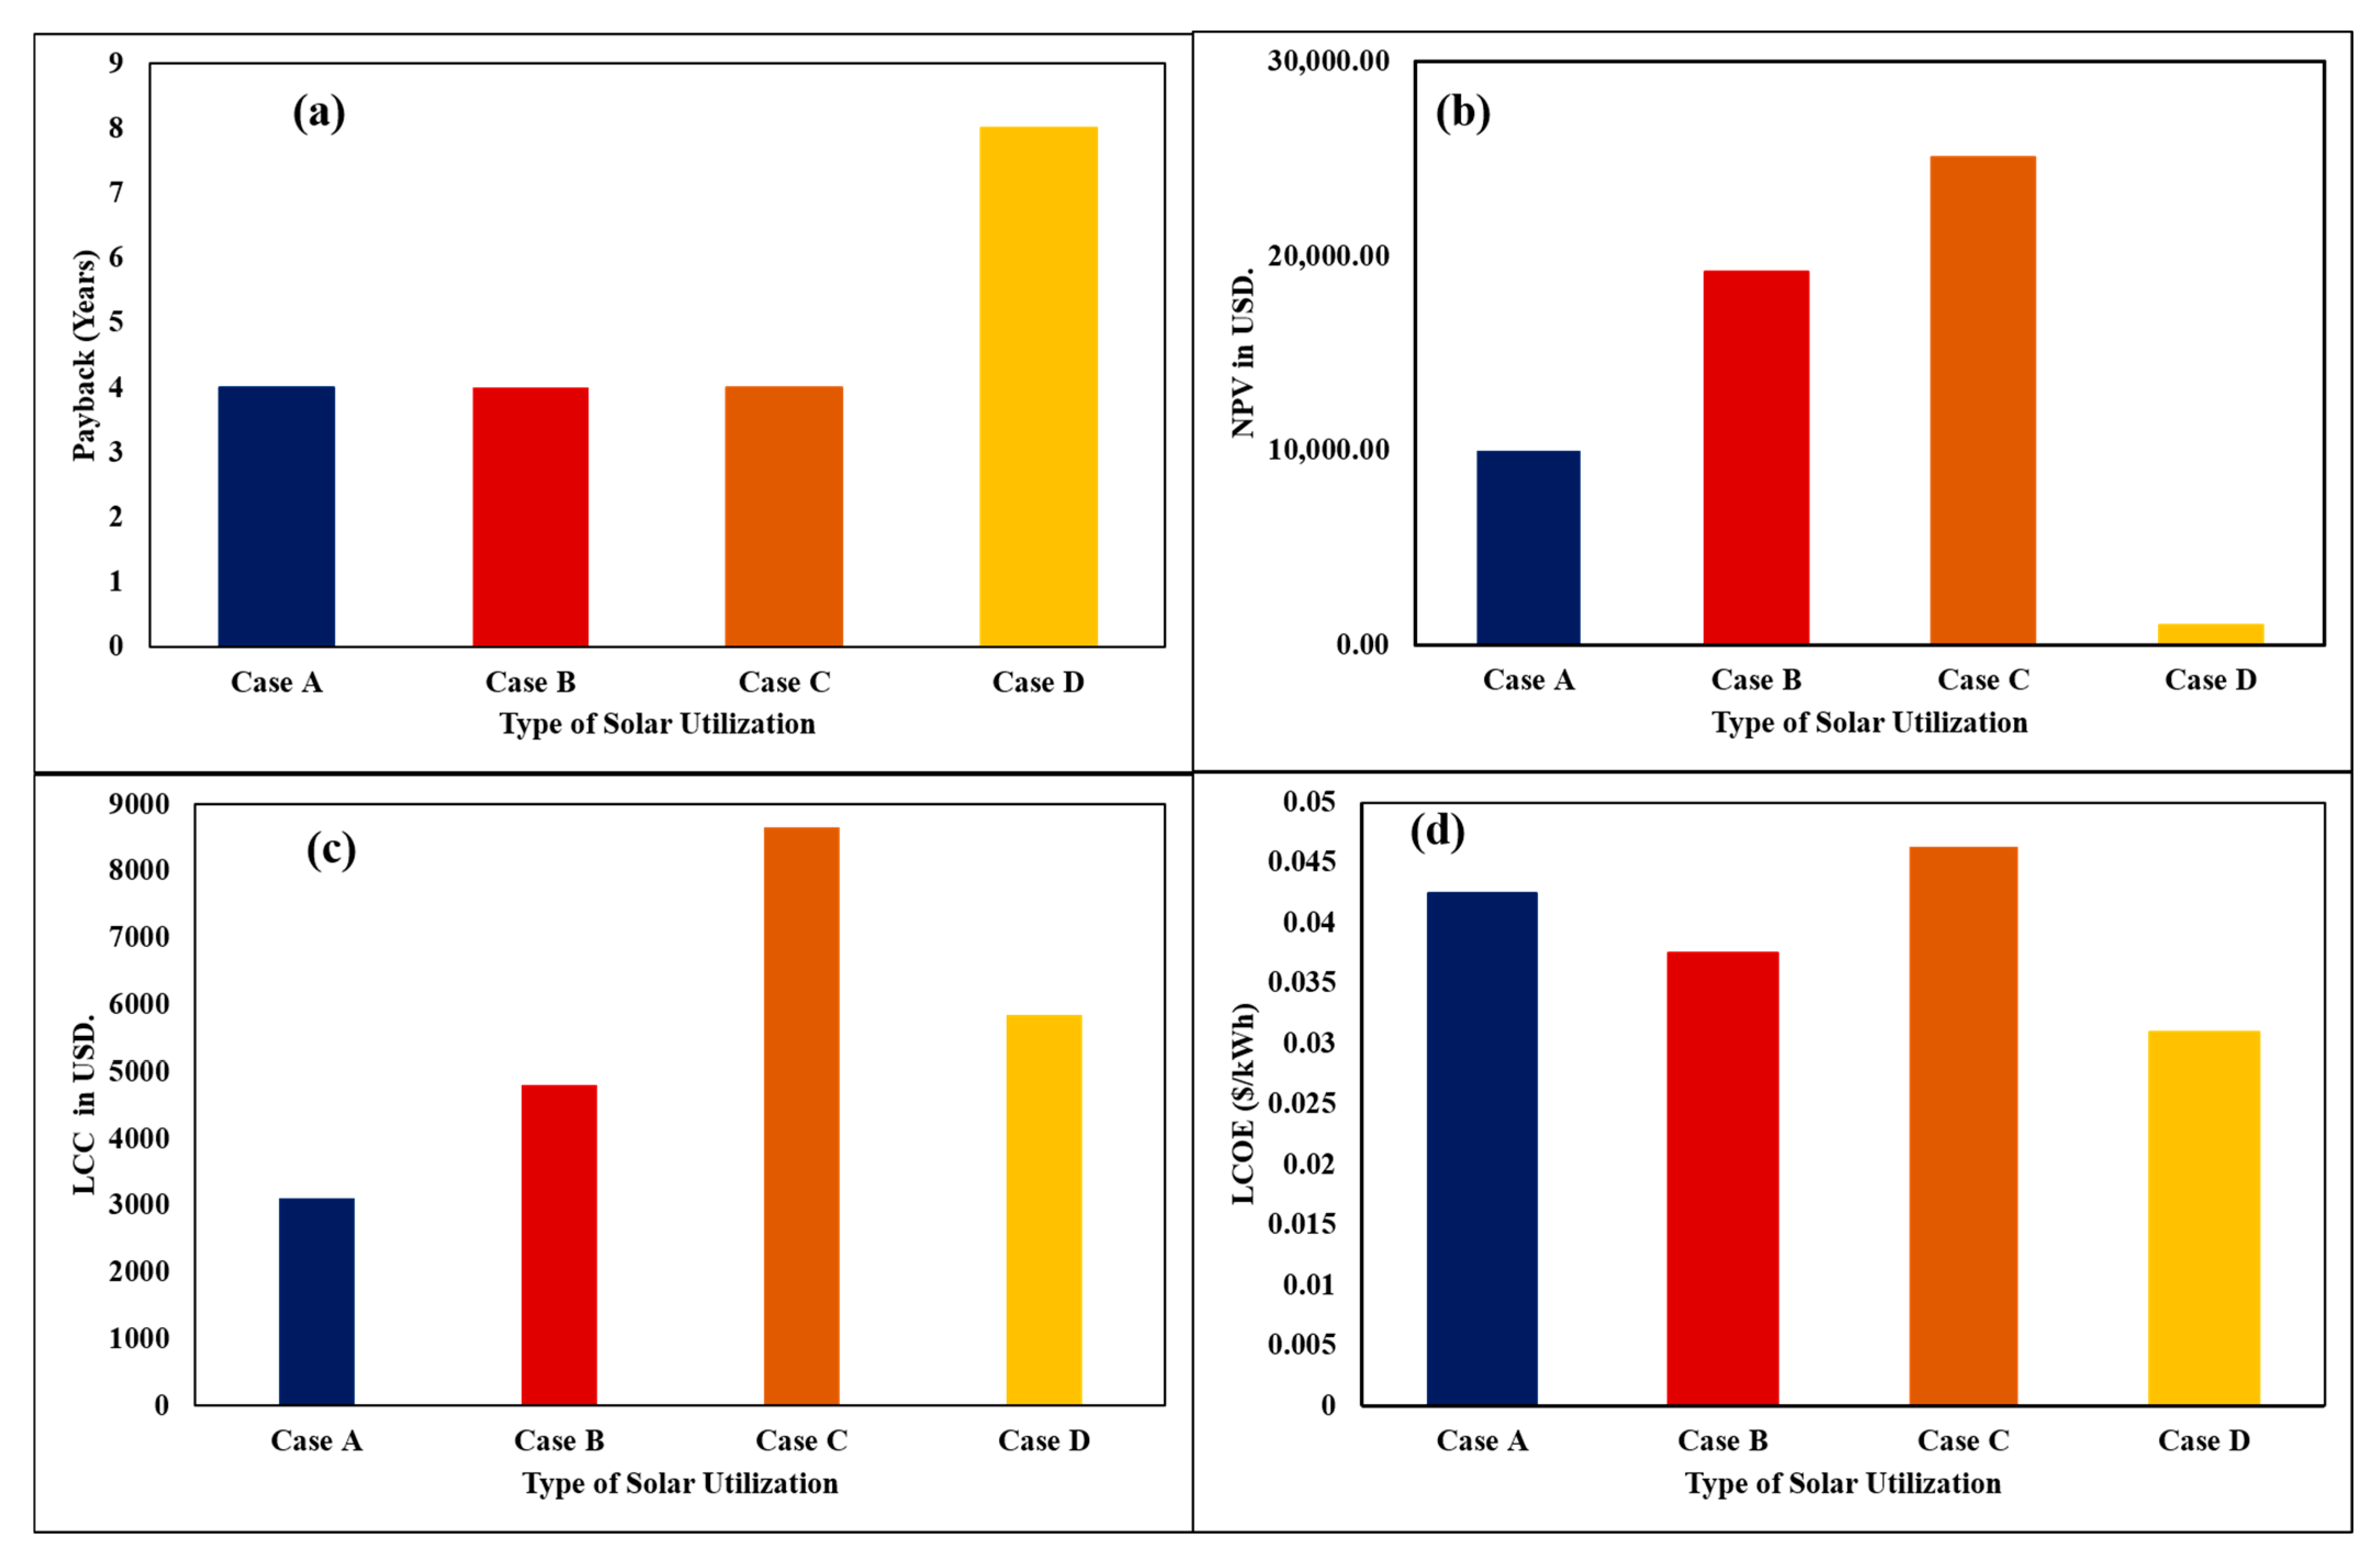
Figure 8 summarizes the resulting payback period, net present value, life-cycle cost, and levelized cost of electricity calculated using the corresponding economic equations and the cost inputs reported in
Table 5. A nominal discount rate of 20% was used in the present-value calculations.
As shown in
Figure 7, all four configurations required an initial capital investment, resulting in negative cash flow at the beginning of the project. Over time, the cash flow became positive due to savings from reduced electricity purchases from the grid. The cash flow profiles also reflect the effect of component replacement, particularly batteries and inverters, which are expected to be replaced during the system lifetime. These replacement costs temporarily reduce the cumulative cash flow but do not eliminate the long-term financial benefits of the systems.
The payback periods of the four configurations are presented in
Figure 8a. Cases A, B, and C achieved payback periods of approximately 4 years under the adopted assumptions, whereas Case D required approximately 8 years. Although Case C had a larger initial investment because of its greater PV and battery capacity, the higher avoided grid-electricity expenditure resulted in a comparatively short payback period. The longer payback of Case D was associated with its larger installed PV capacity and the economic conditions applied to net-metered electricity exchange.
The
NPV results are presented in
Figure 8b. Case C achieved the highest
NPV of USD 25,104.3, followed by Case B with USD 19,183.58. Case A produced a lower
NPV because its smaller PV capacity resulted in lower lifetime electricity savings, while Case D showed the lowest
NPV under the adopted net-metering and cost assumptions. These revised values are substantially lower than those reported in the previous manuscript version and are more consistent with the scale of the evaluated residential systems.
The lifecycle-cost results are shown in
Figure 8c. Case A had the lowest lifecycle cost because it did not include battery storage and used the smallest PV capacity. Case C had the highest lifecycle cost because it required the largest battery-supported system and associated replacement expenditure. Cases B and D showed intermediate lifecycle costs.
The
LCOE results are presented in
Figure 8d. Case D achieved the lowest
LCOE of USD 0.0307/kWh, followed by Case B. Case C had the highest
LCOE because of its greater PV capacity and battery-storage requirements. These results show that the configuration with the highest
NPV does not necessarily have the lowest unit cost of electricity. Therefore, the economic indicators should be interpreted collectively rather than using a single metric.
3.3. Environmental Performance of PV Configurations
The environmental performance of the four PV configurations was assessed based on avoided greenhouse gas emissions over the system lifetime. The analysis considered carbon dioxide (CO
2), methane (CH
4), and nitrous oxide (N
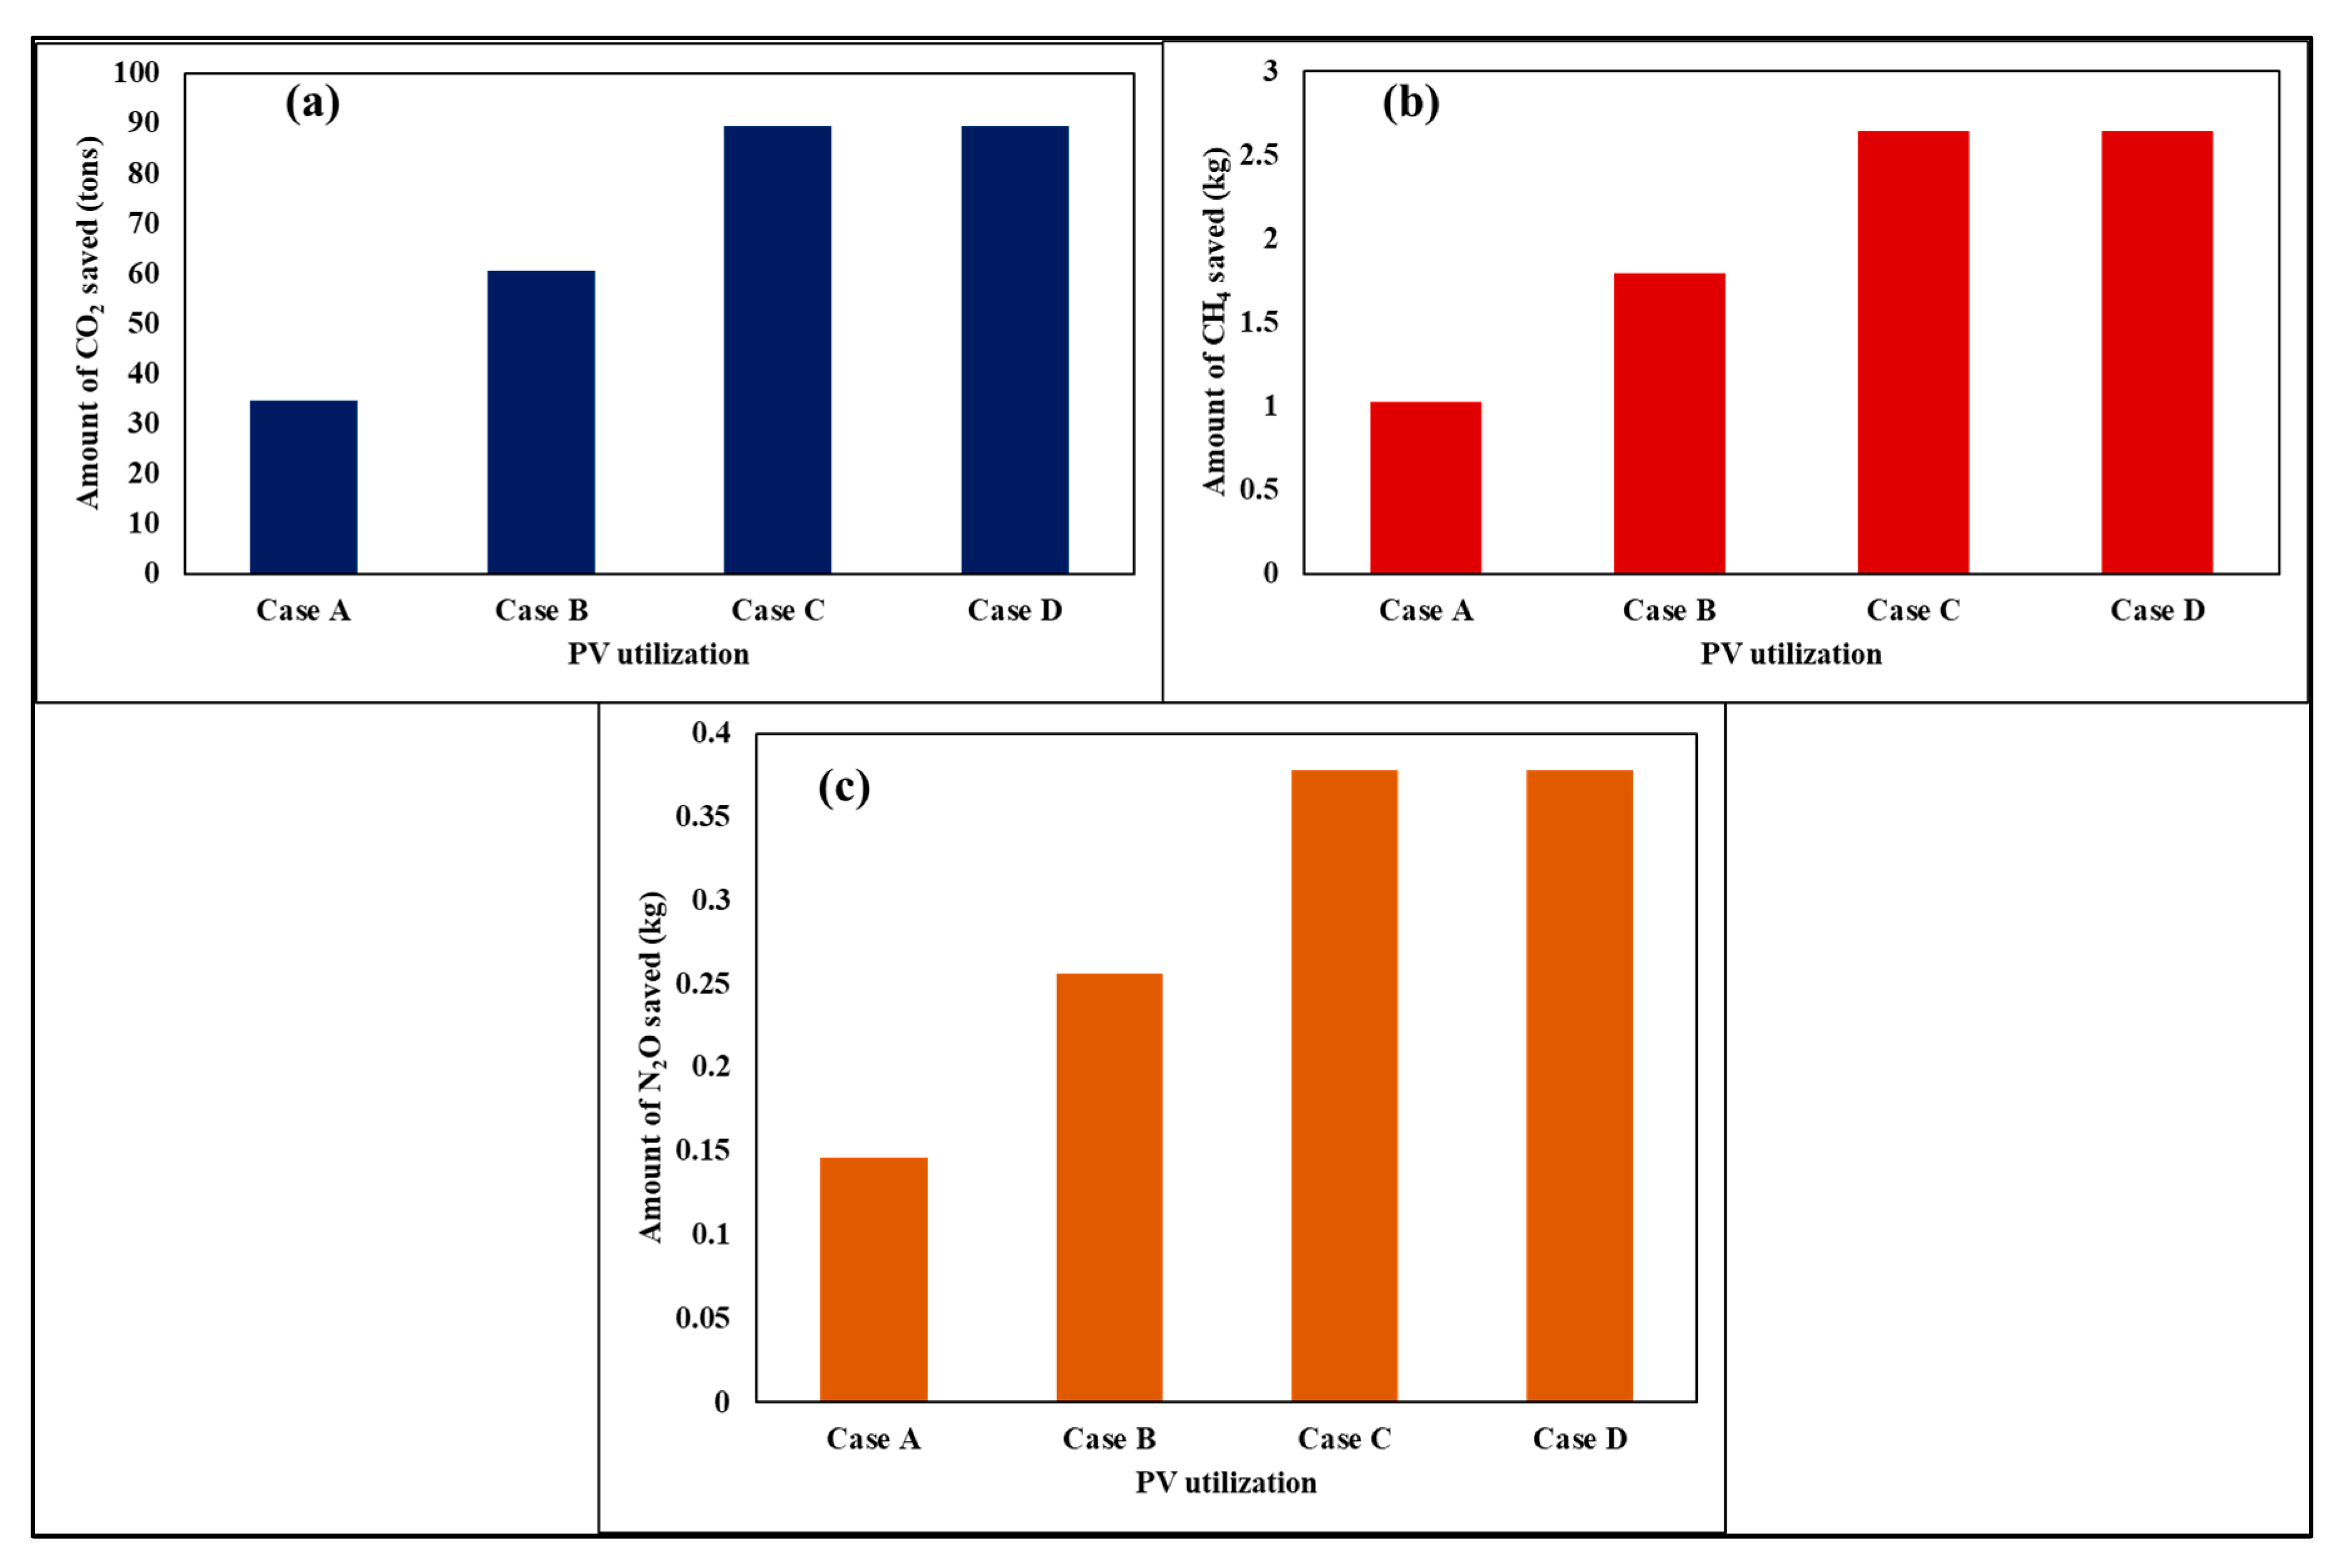
2O) emissions that would otherwise be produced through conventional grid-based electricity generation. The results are presented in
Figure 9. The values plotted in
Figure 9 were calculated by multiplying the lifetime electricity generation of each PV configuration by the corresponding emission factors for CO
2, CH
4, and N
2O, as expressed in Equations (9)–(11). The emission-factor values were adopted from the published source cited as Reference [
35].
As shown in
Figure 9a, all PV configurations reduced CO
2 emissions, but the magnitude of avoided emissions varied according to the level of solar energy utilization. Case A achieved the lowest CO
2 reduction, approximately 35 tons over the system lifetime, because it supplied only daytime electricity demand and continued to rely on grid electricity during non-solar hours. Case B avoided approximately 60 tons of CO
2 by combining daytime solar generation with 6 h of battery backup, thereby reducing grid dependence more effectively.
Case C and Case D achieved the highest emission reductions, with approximately 90 tons of CO
2 avoided over the system lifetime. This is because both configurations were designed to meet the full daily electricity demand through solar energy, either by battery storage in Case C or by net-metering exchange in Case D. Similar trends were observed for avoided CH
4 and N
2O emissions, as shown in
Figure 9b,c.
These findings indicate that systems with greater solar utilization provide stronger climate mitigation benefits. However, environmental performance must be interpreted alongside economic feasibility and practical implementation constraints. While Case C and Case D offer the highest emission reductions, Case B provides a balanced option by combining substantial emission reduction with favorable economic performance and improved energy reliability.
3.4. PVsyst Simulation Performance of the Optimum Configuration
Although Case C achieved the highest
NPV, Case B was selected for further PVsyst evaluation because it provided a more balanced and practically deployable configuration, combining a short payback period, the second-highest
NPV, moderate lifecycle cost, partial battery backup, and continued grid support. Unlike Case C, it reduces the battery-capacity and investment burden associated with fully off-grid operation. Therefore, this configuration was evaluated through a single fixed-variant PVsyst simulation to assess its performance under the specified climatic and operational conditions for Karachi. The simulation results are presented in
Figure 10.
The PVsyst simulation estimated the required PV capacity for Case B as approximately 5.75 kW, which is in close agreement with the analytically calculated value of approximately 5.7 kW. This agreement confirms the reliability of the sizing approach used in the study. The reference incident energy in the collector plane was found to be 5.290 kWh/m2/day, indicating favorable solar resource availability at the selected location.
The simulated performance ratio was 0.784, or 78.4%. This indicates that the system delivered approximately 78.4% of its theoretical reference output after accounting for temperature, inverter, wiring, mismatch, storage, and other operational losses. The remaining difference represents the combined losses between the reference yield and the useful system output. The solar fraction was 0.794, indicating that approximately 79.4% of the household energy demand could be supplied by the PV system, while the remaining 20.6% was supplied by the grid. This confirms that the hybrid PV system with 6 h battery backup can substantially reduce grid dependency while maintaining operational flexibility.
The daily input–output behavior showed a strong relationship between incident solar radiation and PV energy output. Minor deviations at higher radiation levels may be attributed to temperature effects, inverter losses, and other system inefficiencies. The battery state-of-charge distribution also indicated seasonal variations in storage performance, with lower charge levels during periods of higher demand or reduced solar availability. These results suggest that the selected configuration is technically feasible, although further optimization of battery capacity, load scheduling, and module temperature management could improve system autonomy and long-term performance.
The PVsyst outputs for Case B represent its performance under the initial fixed component parameters. Annual PV-module degradation and progressive battery-capacity fade were not included in the simulation; therefore, the reported performance ratio, solar fraction, and energy yield were not adjusted for long-term component aging. Battery replacement costs were included in the lifecycle economic assessment, but the replacement schedule was based on the assumed service life rather than a dynamic degradation model. Consequently, long-term electricity generation and solar contribution may be overestimated, while lifecycle costs and LCOE may be underestimated. These results should therefore be interpreted as comparative estimates under the adopted assumptions.
4. Discussion
The integrated technical, economic, environmental, and policy findings of this study are summarized in
Figure 11. The framework illustrates how residential PV-system selection depends on the combined consideration of investment cost, energy reliability, grid dependence, rooftop availability, battery-storage requirements, and greenhouse gas reduction. It also provides an overview of the main issues discussed in
Section 4.1,
Section 4.2,
Section 4.3 and
Section 4.4, including urban energy security, economic feasibility, climate mitigation, practical implementation, and supporting policy mechanisms.
4.1. Implications for Urban Energy Security
The findings of this study highlight the important role of residential PV systems in improving urban energy security in cities facing high electricity prices, grid instability, and increasing household energy demand. Karachi represents a relevant urban case because residential consumers often experience both economic pressure from rising tariffs and reliability concerns associated with grid dependence. In this context, rooftop PV systems can support decentralized electricity generation and reduce household exposure to grid-related disruptions.
The comparison of the four PV configurations shows that system design strongly influences the level of energy security achieved. Case A reduces daytime electricity purchases but remains highly dependent on the grid during non-solar hours. Case D reduces net electricity cost through energy exchange with the grid but does not provide physical backup during outages unless additional storage is included. Case C offers the highest level of autonomy but requires substantial PV capacity and battery storage, which may limit affordability for many households. Case B provides a practical compromise by combining solar generation, partial battery backup, and grid support. This configuration reduces grid dependence while avoiding the high cost and storage burden of a fully off-grid system.
From an urban planning perspective, hybrid PV systems can contribute to household-level resilience while also reducing pressure on centralized electricity infrastructure. Wider deployment of such systems may help manage peak demand, improve reliability during periods of supply constraint, and support gradual transition toward decentralized urban energy systems. Therefore, the results suggest that residential PV adoption should be considered not only as a cost-saving measure but also as a component of broader urban energy-security planning.
4.2. Economic Feasibility and Policy Relevance
The economic analysis shows that Case C achieved the highest NPV under the adopted assumptions, primarily because it displaced the greatest amount of purchased grid electricity. However, it also had the highest lifecycle cost and required the largest battery-storage system. Case B achieved the second-highest NPV and a similarly short payback period while requiring less storage capacity and retaining grid support. Therefore, Case B was interpreted as the most balanced practical configuration rather than the configuration with the highest individual economic indicator.
The results also highlight the influence of net metering policies on economic outcomes. Case D achieved the lowest LCOE, indicating efficient electricity generation; however, its overall financial benefit was limited by the difference between electricity selling and purchasing tariffs. In Pakistan, the lower compensation rate for exported electricity reduces the economic incentive for net-metered systems despite their technical efficiency. This finding underscores the importance of policy frameworks in shaping the financial viability of residential PV systems.
From a policy perspective, the results suggest that stable and supportive regulatory mechanisms—such as fair net metering rates, incentives for battery storage, and financing schemes—are essential to accelerate PV adoption. Hybrid systems like Case B may particularly benefit from targeted incentives, as they provide both economic and reliability advantages. Policymakers can use such insights to design interventions that balance grid stability, consumer affordability, and renewable energy expansion.
The economic results should be interpreted in view of the simplified comparative framework adopted in this study. Although the analysis considered initial investment, operation and maintenance costs, component-replacement costs, annual electricity savings, a 15-year project lifetime, and a nominal discount rate of 20%, annual PV-module degradation was not explicitly modelled. Therefore, constant annual electricity generation was assumed throughout the project lifetime. This assumption may overestimate long-term electricity production and financial savings and may consequently overestimate NPV and underestimate LCOE. Because the same assumption was applied consistently to all four configurations, the results remain useful for comparative assessment; however, their absolute long-term economic values may be optimistic. Progressive battery-capacity loss, tariff escalation, financing structure, taxation, insurance, incentives, salvage value, and uncertainty in future costs were also not explicitly included. Accordingly, the reported economic indicators should be regarded as site-specific comparative estimates rather than complete investment-grade projections.
The battery-storage model also represents a simplified nominal-capacity approach. Battery sizing was based on the required stored energy, system voltage, and a fixed DoD of 50%, while dynamic state-of-charge behaviour, temperature effects, charge–discharge efficiency variation, cycle-dependent degradation, and progressive capacity fade were not explicitly modelled. These approximations may overestimate the usable storage capacity and battery lifetime and may consequently underestimate replacement requirements and lifecycle costs. However, because the same battery assumptions were applied consistently to Cases B and C, the results remain useful for comparing the two battery-supported configurations, although their absolute long-term performance and economic indicators should be interpreted cautiously.
4.3. Climate Mitigation and Sustainability Implications
The environmental analysis confirms that residential PV systems can play a significant role in reducing greenhouse gas emissions and supporting climate mitigation objectives. All configurations resulted in substantial reductions in CO2, CH4, and N2O emissions compared to conventional grid-based electricity. The magnitude of emission reduction was directly linked to the extent of solar energy utilization.
Case C and Case D achieved the highest emission reductions due to their ability to meet the full daily energy demand through solar energy, either via storage or grid exchange. However, these configurations differ in their practical implementation. Case C requires extensive battery storage, which may have additional environmental and economic implications related to battery production and disposal. Case D, while efficient in terms of energy utilization, depends on grid infrastructure and policy frameworks.
Case B, although slightly lower in emission reduction compared to fully solar-dependent systems, still achieved significant environmental benefits while maintaining economic feasibility and operational flexibility. This indicates that hybrid PV systems can provide a balanced pathway toward sustainability by combining emission reduction with practical deployability.
At a broader level, widespread adoption of residential PV systems can contribute to national and global climate targets by reducing reliance on fossil fuel-based electricity. In urban areas, this transition can also improve air quality and reduce the environmental footprint of residential energy consumption.
If long-term battery degradation, repeated replacement, and end-of-life treatment were included, the economic and environmental performance of the battery-supported configurations would likely become less favourable. Progressive capacity fade would reduce the usable stored energy and may increase grid dependence or unmet demand, while additional battery replacements would increase lifecycle cost, LCOE, and possibly the payback period, while reducing NPV. These effects would be more pronounced for Case C because it relies on a larger battery bank, whereas Case B would experience a smaller but still important impact because of its partial storage requirement and continued grid support. In environmental terms, battery manufacturing, transportation, replacement, recycling, and disposal would introduce additional embodied emissions, resource use, and potential toxicity impacts that are not captured by the present avoided-operational-emissions assessment. Consequently, the net environmental advantage of Cases B and C would be lower than the values reported here, while the relative environmental position of the non-battery Cases A and D may improve. However, the magnitude of these changes depends on battery chemistry, service life, recycling efficiency, disposal practice, and replacement frequency and therefore requires a dedicated life-cycle and degradation assessment.
4.4. Practical Implications for Residential PV Adoption
The results of this study provide practical insights for homeowners, energy planners, and stakeholders involved in urban energy systems. For homeowners, the choice of PV configuration should be guided by a balance between budget, energy reliability requirements, and available rooftop space. While fully off-grid systems offer maximum independence, hybrid systems such as Case B provide a more practical solution by delivering both economic benefits and backup power capability.
For energy planners and utilities, increasing adoption of residential PV systems will influence grid demand patterns. Systems with net metering may reduce daytime demand but still rely on grid supply during nighttime, whereas hybrid systems can reduce peak demand and improve load management. Understanding these dynamics is important for designing grid infrastructure and demand-side management strategies.
The results can support municipalities and energy policymakers in designing residential solar programs that prioritize hybrid PV systems similar to Case B, particularly for low-income households that require both affordability and supply reliability. Practical measures may include targeted capital subsidies, low-interest or installment-based financing, on-bill repayment, reduced import duties or taxes on approved PV and battery components, and bulk procurement of standardized system packages. Municipalities may also facilitate simplified permitting, technical guidance, installer certification, and rooftop suitability assessments to reduce transaction and installation costs. Because Case B retains grid support while providing limited battery backup, it may require a smaller storage investment than a fully battery-supported system and can therefore provide a more affordable pathway for improving household resilience during grid interruptions. Pilot programs should initially target households in areas with frequent outages and should include performance monitoring, consumer education, maintenance support, and minimum quality standards. However, the affordability and effectiveness of these measures should be confirmed through household-income, financing, and policy-sensitivity analyses before large-scale implementation.
5. Conclusions
This study presented a comprehensive techno-economic and environmental assessment of four residential photovoltaic (PV) system configurations for a typical urban household in Karachi, Pakistan. The analysis demonstrated that PV system performance is highly dependent on the level of grid interaction and battery storage integration. Among the evaluated configurations, Case C achieved the highest NPV of USD 25,104.3, while Cases A, B, and C showed payback periods of approximately 4 years. Nevertheless, the hybrid system with 6 h battery backup and grid support (Case B) provided the most balanced practical performance because it combined the second-highest NPV of USD 19,183.58 with partial backup capability, moderate lifecycle cost, and lower storage requirements than the fully off-grid configuration. In contrast, fully solar-dependent configurations offered the greatest environmental benefits but required substantially higher investment and storage capacity.
The results highlight that no single PV configuration is universally optimal; instead, system selection should be based on a trade-off between economic feasibility, energy reliability, and environmental impact. Hybrid PV systems emerge as a practical solution for urban households by combining affordability with improved energy resilience. Net-metered systems offer low electricity generation costs but remain dependent on policy frameworks and grid reliability, while fully off-grid systems provide maximum independence at higher economic cost.
From a broader perspective, the findings emphasize the potential of residential PV systems to support sustainable urban energy transition, enhance energy security, and contribute to climate mitigation in developing economies. The study provides useful insights for homeowners, policymakers, and urban planners by identifying system configurations that balance cost, reliability, and environmental performance.
Future work may focus on integrating advanced battery technologies, incorporating cycle- and temperature-dependent battery capacity degradation into the technical and economic analyses, optimizing system design under dynamic tariff structures, and evaluating the long-term environmental impacts of energy-storage systems. Such analyses would provide a more realistic assessment of battery sizing, replacement frequency, and lifecycle economic performance. Future work should also include sensitivity analysis of panel tilt angle, seasonal load profiles, battery technology, capacity, depth of discharge, and discount rate to quantify their effects on system performance, reliability, and economic feasibility. For practical deployment, targeted financing, quality-control measures, and municipal pilot programs may help make hybrid PV systems more accessible to low-income urban households.