


Abstract
Regional trade liberalization via preferential agreements increasingly shapes economic outcomes in small open economies embedded in overlapping regional frameworks. This study evaluates the short-run economy-wide effects of tariff and non-tariff measure (NTM) reforms under the South Asian Free Trade Area (SAFTA) and the Bay of Bengal Initiative for Multi-Sectoral Technical and Economic Cooperation (BIMSTEC) using a Computable General Equilibrium (CGE) model calibrated to the GTAP 10 database. Gravity-based estimates of ad valorem equivalents (AVEs) of NTMs are integrated into the CGE framework, enabling explicit modeling of regulatory barriers alongside tariff reductions. Policy simulations examine scenarios involving a 90 percent tariff cut and a 50 percent NTM reduction, applied individually and jointly, under a short-run closure with fixed factor endowments and a trade balance for Nepal. Results indicate that combined liberalization yields positive macroeconomic adjustments, with real GDP rising by about one percent and exports increasing by over 14 percent, driven primarily by the manufacturing sector, particularly textiles, while agricultural responses vary by exposure to NTMs. These findings provide policy-relevant evidence on the relative effectiveness of tariff and regulatory reforms, informing strategies for deeper regional integration and enhanced competitiveness in small, structurally constrained economies.
Keywords:
CGE modeling; GTAP; NTMs; SAFTA; BIMSTEC; small open economies; regional trade agreements; Nepal 1. Introduction
Regional trade liberalization has become a central economic policy tool in developing regions characterized by fragmented markets, asymmetrical trading partners, and overlapping preferential trade agreements (PTAs) [1,2]. While PTAs are intended to improve efficiency, promote specialization, and expand market access, their economy-wide effects vary widely, especially for small, landlocked, and structurally constrained economies [3,4]. The growing literature emphasizes that the gains from regional integration increasingly depend not only on tariff reductions but also on addressing non-tariff measures (NTMs), which now constitute a dominant source of trade costs in developing economies [5,6,7]. However, despite their growing importance, the combined economy-wide effects of tariff and NTM reforms, particularly within overlapping regional trade arrangements, remain insufficiently understood.
Nepal, a landlocked country, is a member of two major regional trade frameworks: the South Asian Free Trade Area (SAFTA), signed in 2006, and the Bay of Bengal Initiative for Multi-Sectoral Technical and Economic Cooperation (BIMSTEC), joined in 2004. Within these FTAs, India is economically dominant, whereas Nepal, Bangladesh, Bhutan, and Myanmar are classified as least-developed countries (LDCs). Such asymmetries in economic size and productive capacity create uneven adjustment pressures, often intensifying the challenges faced by smaller and less diversified economies [3,8,9]. These structural asymmetries are central to understanding why trade liberalization may generate qualitatively different outcomes in small economies than those typically predicted by standard trade models calibrated to large or diversified countries.
Nepal exhibits high economic vulnerability, with a vulnerability index of 29.7 out of 100, reflecting heavy reliance on agriculture, export concentration, and exposure to external shocks [10]. Nepal’s export basket remains heavily concentrated in a narrow range of low-value-added products, primarily textiles, agricultural commodities, and processed foods, as reflected in the sectoral composition of the GTAP model baseline and confirmed by Nepal’s Third Trade Policy Review [11]. This limited product sophistication constrains Nepal’s ability to capture higher rents from trade liberalization and underscores the importance of pairing tariff and NTM reforms with domestic industrial policy aimed at upgrading productive capacity. In this respect, Nepal’s case is broadly representative of other small, landlocked LDCs, such as Lao PDR, Bhutan, and land-linked economies in Sub-Saharan Africa, that face similar structural barriers to export diversification within regional trade agreements, making the findings of this study relevant beyond the South Asian context. Persistent trade imbalances further underscore these challenges.
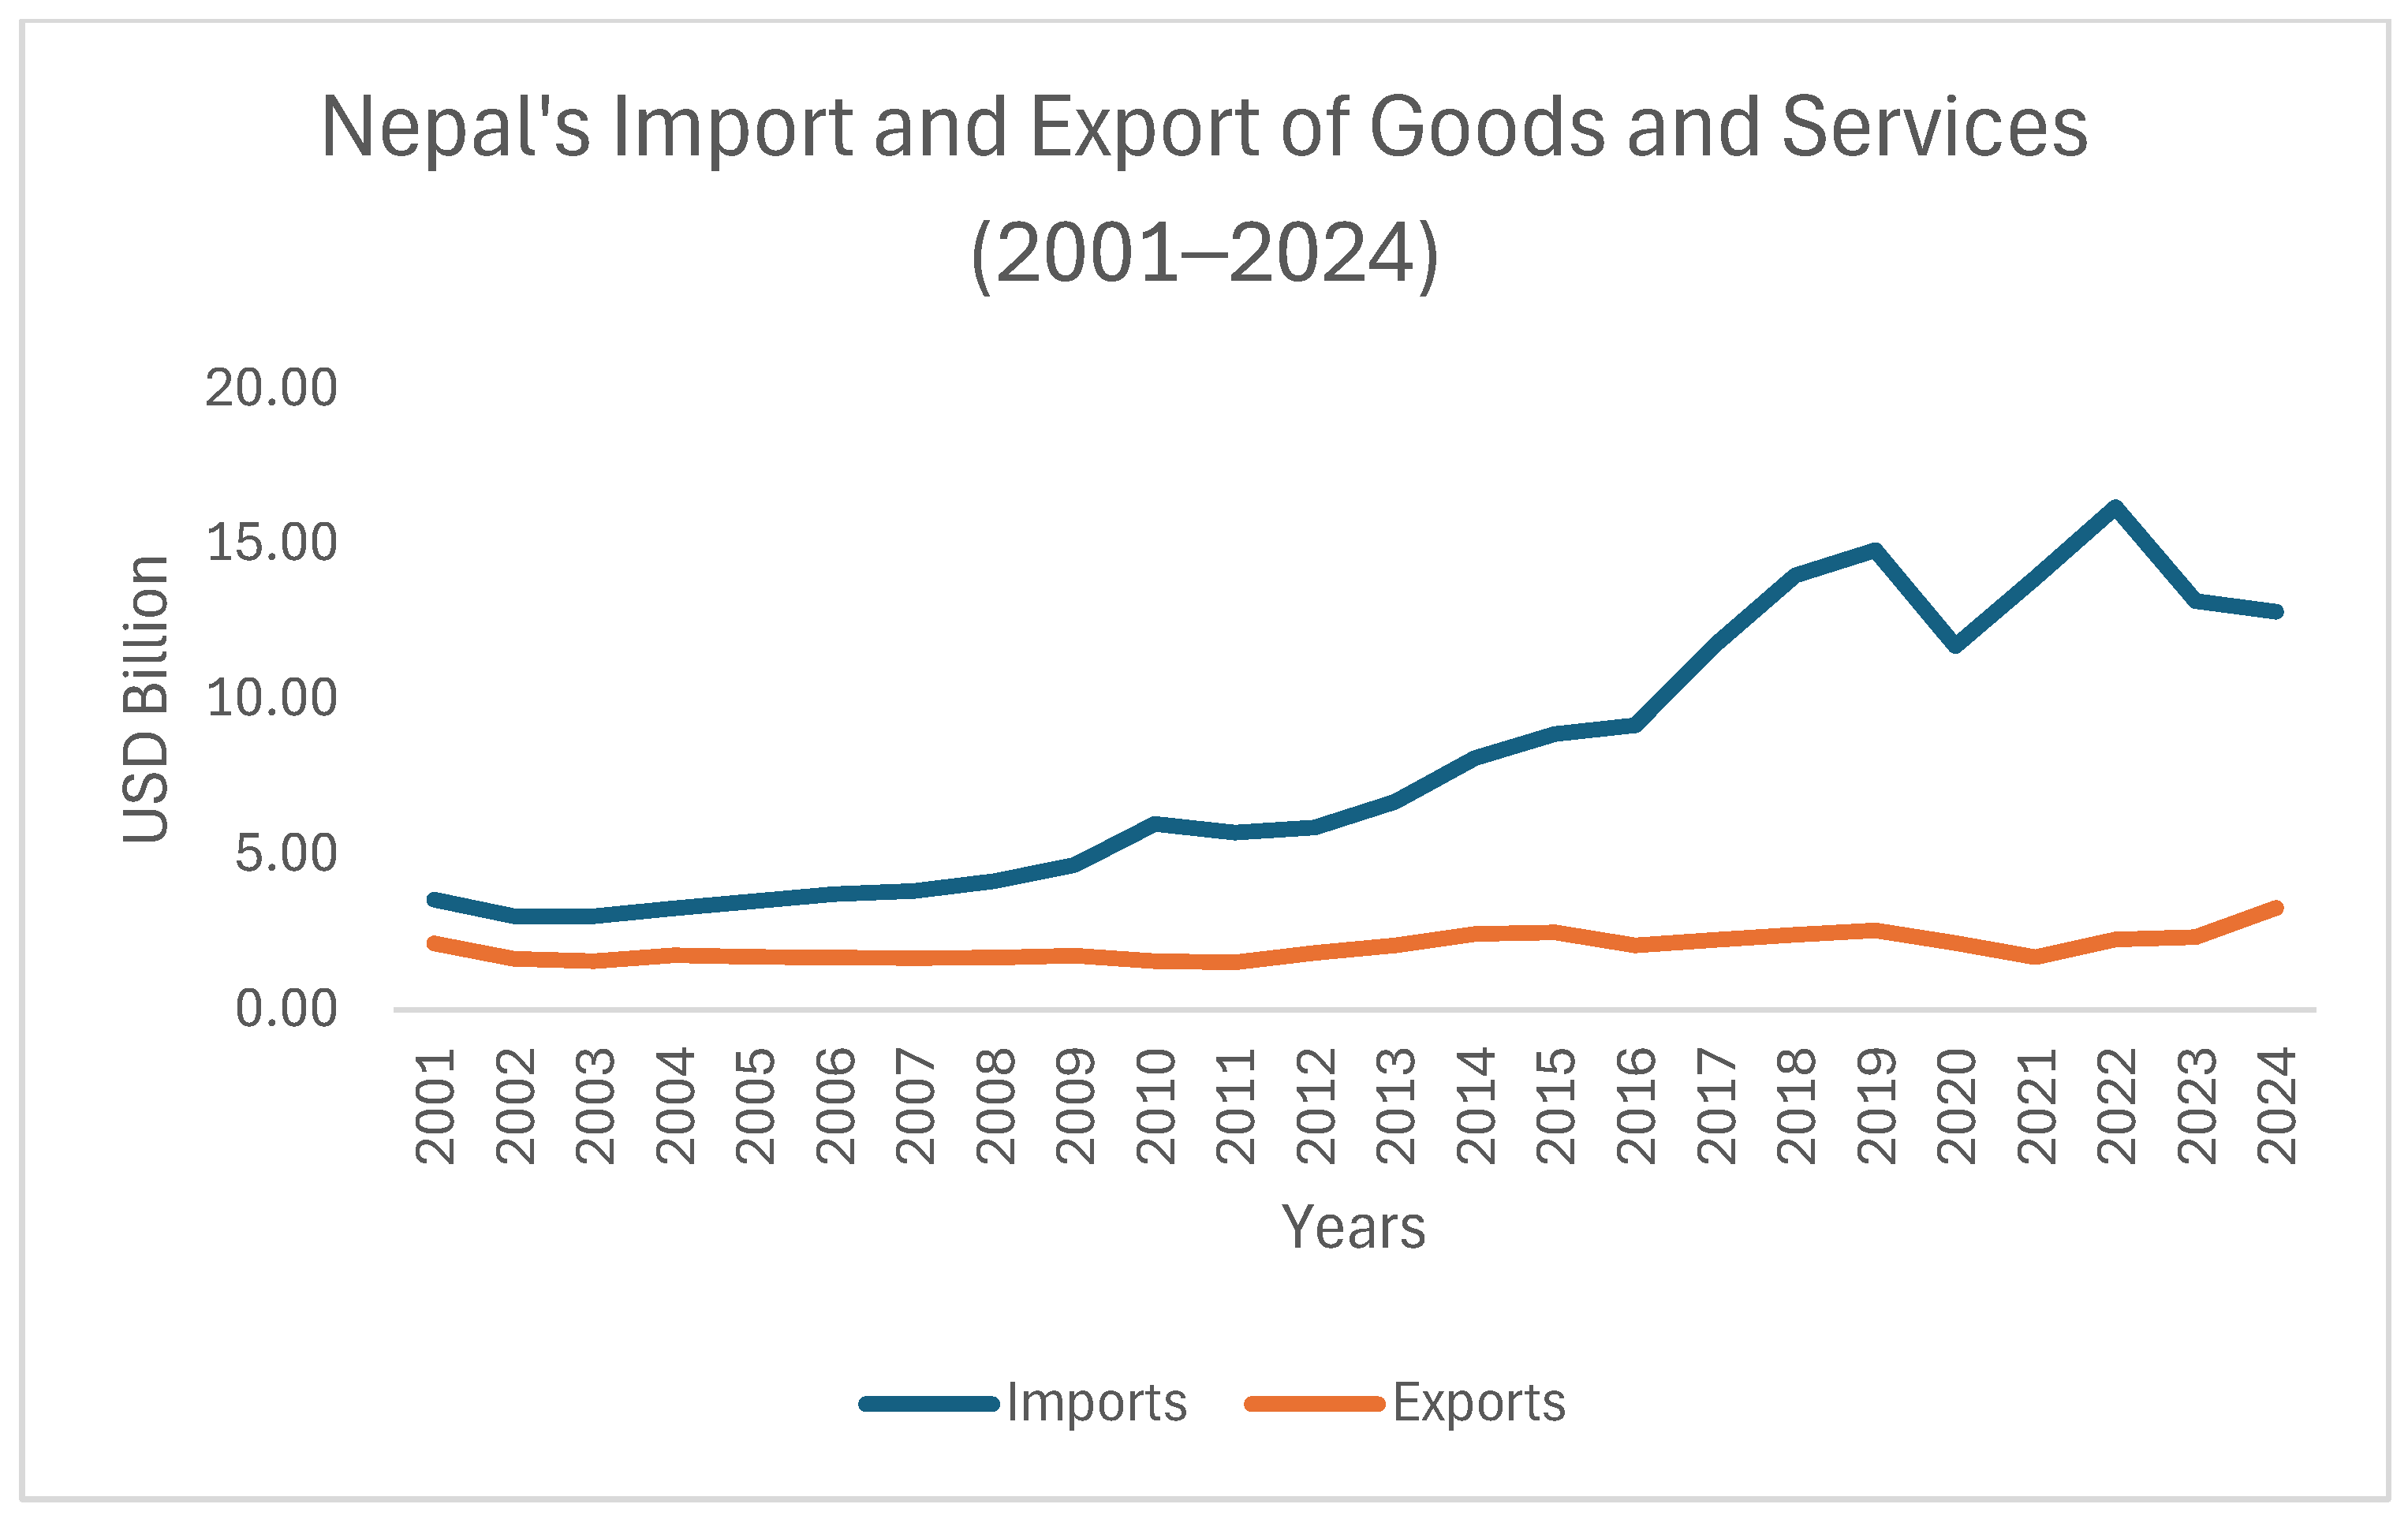
Nepal’s trade deficit has widened markedly, driven by sluggish export growth and rapidly rising imports (Figure 1). According to Nepal’s Third Trade Policy Review (FY 2024/25), total imports increased from NPR 1418.6 billion (USD 9.9 billion) in FY 2018/19 to NPR 1804.1 billion (USD 12.58 billion) in FY 2024/25, while exports, though increasing, remain structurally constrained, resulting in a widening trade deficit [11]. Recent data further indicate that imports are nearly four times exports, with an import-export ratio of approximately 3.9 in 2024 [12]. Nepal’s widening trade deficit must be understood within the broader context of its balance of payments structure. On the current account, remittance inflows have historically served as the primary cushion against the trade deficit, constituting approximately 24.25 percent of GDP in 2020, the base year of this study, and rising to 26.89 percent by 2023, one of the highest remittance-to-GDP ratios in the world [13]. These inflows have financed the persistent trade deficit and maintained foreign exchange reserves; however, they also underscore a structural fragility: Nepal’s external balance remains heavily dependent on labor migration earnings rather than productive export capacity, creating significant vulnerability to external shocks in labor-receiving economies such as the Gulf states and Malaysia. On the capital account, foreign direct investment (FDI) inflows into Nepal have remained persistently modest, fluctuating between approximately 0.38 and 0.68 percent of GDP over the 2017–2022 period [14], far below the levels needed to compensate for the structural trade deficit or to catalyze productive diversification. Consequently, Nepal’s external imbalance represents not merely a trade policy challenge but a structural macroeconomic vulnerability, one that trade liberalization reforms under SAFTA and BIMSTEC must be carefully designed to address rather than inadvertently deepen. This pattern of strong import growth alongside relatively flat export performance highlights the urgency of identifying policy pathways that enhance export competitiveness while managing adjustment pressures in small open economies.
Figure 1.
Nepal’s import and export of goods and services [12].
Computable General Equilibrium (CGE) models have become the dominant analytical framework for evaluating the economy-wide effects of regional trade agreements, providing a comprehensive approach that accounts for simultaneous adjustments across production, consumption, and trade [4,15]. The GTAP framework, developed by Hertel [16] and continuously updated by Aguiar et al. [17], has become the standard tool for multi-country trade policy analysis, enabling systematic cross-country comparisons through a globally consistent multi-sectoral database. Prior GTAP-based assessments of regional trade agreements have demonstrated significant economy-wide effects across a range of integration initiatives, with outcomes varying considerably depending on the size, structural characteristics, and degree of openness of the economies involved [4,15]. For small, structurally constrained economies in particular, the general equilibrium effects of trade liberalization, including factor market adjustments, terms-of-trade changes, and real exchange rate responses, often differ substantially from those predicted by partial equilibrium analyses, underscoring the importance of the CGE approach adopted in the present study [3,4].
A substantial literature has examined the trade and welfare effects of regional integration in South Asia, particularly under SAFTA. Early assessments by Raihan and Razzaque [9] and Jain [18] found modest gains for large economies such as India, while noting that LDC members, including Nepal, were largely treated as residual aggregates rather than subjects of dedicated analysis. Masood et al. [19] confirmed limited trade potential for smaller South Asian economies under prevailing SAFTA implementation conditions, while Shah [20] found that regional economic integration had positive but heterogeneous effects on growth across SAARC members. For BIMSTEC specifically, the quantitative literature remains sparse. Hossain [21] provides one of the few CGE-based assessments, reporting positive GDP effects for member countries following tariff reductions, while Rahman and Kim [22] demonstrate notable benefits from tariff elimination for larger BIMSTEC economies, but do not assess Nepal separately. Rai et al. [23] and Kaur and Gupta [24] examine India’s bilateral trade flows with BIMSTEC nations using gravity models, confirming the significant role of distance, economic size, and institutional factors in shaping intra-regional trade. A consistent finding across this literature is that Nepal’s trade outcomes under both agreements have been either ignored or subsumed within broader country groupings, leaving a clear gap for the present Nepal-specific analysis.
Alongside tariff-focused analyses, parallel literature has developed around the measurement and incorporation of non-tariff measures into applied trade models. Kee, Nicita, and Olarreaga [5] pioneered the estimation of Trade Restrictiveness Indices that incorporate both tariff and non-tariff components, while Berden and Francois [6] and UNCTAD [7] further developed the empirical toolkit for converting NTMs into ad valorem equivalents (AVEs). The structural gravity approach to AVE estimation, introduced by Anderson and Van Wincoop [25] and extended by Webb, Strutt et al. [26] and Engelbert et al. [27] for GTAP applications, has become the standard methodology in the applied NTM literature. Disdier and Marette [28] and Beverelli, Neumueller [29] demonstrate that NTMs can impose trade costs equivalent to, or in excess of, tariffs, a finding particularly relevant for Nepal, whose agricultural exports face complex SPS and documentation requirements in regional markets. Gaurav and Bharti [30] specifically document the disproportionate burden of NTMs on intra-SAFTA trade, while Kathuria [8] confirms that addressing non-tariff barriers is essential for realizing the full potential of South Asian regional integration. Despite this growing evidence base, no prior study has estimated Nepal-specific AVEs of NTMs using a structural gravity framework and incorporated them into a CGE model: a gap this study directly addresses.
Despite extensive research on SAFTA and BIMSTEC, a clear gap remains in the literature regarding a dedicated economy-wide analysis of Nepal. Existing studies on SAFTA by Jain [18], Masood, Khurshid [19], Raihan and Razzaque [9], and BIMSTEC by Rai, Paswan [23], Kaur and Gupta [24], Hossain [21] have primarily focused on larger economies like India and Bangladesh, often categorizing Nepal as part of a residual “rest of the world” group. Moreover, most analyses emphasize tariff liberalization while largely overlooking non-tariff measures (NTMs), even though NTMs are increasingly important in shaping trade outcomes in developing regions [5,7,31]. Importantly, Nepal’s trade with SAFTA and BIMSTEC partners, while strategically significant, represents a subset of its total external trade. China, the European Union, and the United States collectively constitute major sources of Nepal’s imports, particularly for manufactured goods, machinery, and petroleum products, and these rest-of-world trade relationships are not addressed by preferential liberalization under either SAFTA or BIMSTEC [11]. This means that the welfare gains modeled in this study are partial, and that Nepal’s broader external vulnerability cannot be resolved through intra-regional integration alone. NTMs are defined as policy measures other than basic customs tariffs that can influence international trade by changing quantities traded, prices, or both [7,31]. While multilateral and regional initiatives have led to substantial reductions in tariff rates, many NTMs continue to impede meaningful progress in intra-regional trade within South Asia [1,32]. For example, while studies such as Rahman and Kim [22] demonstrate notable benefits from tariff elimination in BIMSTEC for key economies, the restrictive effects of NTMs on countries such as Nepal have not been quantified. Given that Nepal’s agricultural exports must navigate a complex array of sanitary, phytosanitary, quality, and documentation requirements, NTMs likely constitute a significant barrier to its integration into regional markets rather than merely residual protection. Recent regulatory reforms further highlight the relevance of NTMs. Since 2019, Nepal has expanded its sanitary and phytosanitary and technical regulation framework, including the enactment of the Food Safety and Quality Act (2024), the Plant Quarantine and Protection Act (2024), and expanded laboratory accreditation covering more than 800 food safety parameters by 2025 [11]. While these reforms aim to align domestic standards with international norms, they also increase compliance costs, reinforcing the need to quantify NTMs in applied trade analysis [28,29]. The present study addresses these gaps by providing the first Nepal-specific gravity-based estimates of NTM AVEs and integrating them into a GTAP-based CGE framework to assess the economy-wide effects of tariff and NTM reforms under SAFTA, BIMSTEC, and their interaction.
Nepal remains fully committed to both SAFTA and BIMSTEC as its core regional trade platforms. The Government of Nepal reaffirmed its engagement in the BIMSTEC Free Trade Area and its constituent agreements during the 2019–2025 review period, positioning BIMSTEC as a strategic bridge between South and Southeast Asian markets [11]. These developments motivate a systematic assessment of whether tariff and NTM liberalization under overlapping regional frameworks generate additive gains or diminishing returns for small economies with limited administrative and adjustment capacity. Accordingly, this study addresses the following research question: What are the economy-wide impacts of jointly reducing tariffs and non-tariff measures on Nepal’s agricultural trade under the SAFTA and BIMSTEC FTAs? To answer this question, the study adopts a two-stage approach. First, a structural gravity model is used to estimate the ad valorem equivalents (AVEs) of NTMs for Nepal’s bilateral agricultural trade. Second, these econometric estimates are incorporated into a CGE model based on the Global Trade Analysis Project (GTAP) framework to assess macroeconomic and sectoral responses to alternative liberalization scenarios. By integrating econometric estimation with general equilibrium simulation, the analysis captures the interconnected effects of trade policy reforms on production, consumption, factor markets, and trade flows in a structurally constrained economy, such as Nepal [33,34].
This study contributes to the existing literature in four main ways: First, it provides the first Nepal-specific estimates of AVEs of NTMs using a structural gravity framework, thereby addressing a key empirical gap in the South Asian trade literature and offering a replicable methodological template for similarly small, data-constrained economies. Second, by jointly evaluating tariff and NTM reforms within a GTAP-based CGE model, the analysis moves beyond the tariff-centric focus that has dominated prior SAFTA and BIMSTEC research, providing a more comprehensive assessment of trade liberalization than tariff-only studies. Third, this research study directly compares SAFTA and BIMSTEC for a small LDC economy, providing new evidence on whether their combined implementation generates additive gains or diminishing returns: a question of growing relevance for countries embedded in multiple preferential frameworks. Fourth, the analysis situates Nepal’s trade integration challenges within its structural economic vulnerabilities, including its persistent trade deficit, landlocked geography, and post-LDC graduation pressures, thereby providing policy-relevant insights that extend beyond a technical CGE exercise.
2. Methodology
2.1. General Equilibrium Models
General equilibrium models offer a comprehensive framework for assessing the economy-wide impacts of trade policy reforms by accounting for simultaneous adjustments across production, consumption, factor markets, and trade flows [15]. Unlike partial equilibrium approaches, which analyze policy effects in a single market in isolation, CGE models capture the full chain of inter-sectoral linkages and general equilibrium price adjustments that characterize real economies [4]. They are therefore particularly well-suited to analyzing free trade agreements, where changes in tariffs and non-tariff barriers simultaneously affect multiple sectors, alter relative prices, redistribute factor income, and induce consumption substitution [16].
The choice of the GTAP framework specifically is motivated by three considerations. First, the GTAP database provides a globally consistent multi-regional, multi-sectoral social accounting matrix that has been widely applied in trade policy analysis and whose parameters have been extensively validated [16,17]. Second, the GTAP model accommodates the explicit integration of NTM shocks through the prams variable, enabling joint simulation of tariff and regulatory reforms, a capability essential for the research questions addressed here [26,27]. Third, for a small open economy such as Nepal, which lacks the data infrastructure for an independently estimated domestic SAM, the GTAP framework provides the most rigorous and internationally comparable analytical baseline available. The short-run closure adopted in this study, fixing factor endowments and the trade balance, is appropriate given Nepal’s structural rigidities, limited labor mobility, and constrained capital markets, as discussed further in Section 2.2.
Beyond its empirical contribution, this study aims to extend the theoretical understanding of trade liberalization in small open economies by demonstrating that the effects of overlapping regional agreements are not simply additive: the general equilibrium interactions between membership-overlapping RTAs generate distinct macroeconomic outcomes that cannot be inferred from analyzing each agreement in isolation. This finding has theoretical implications for the welfare economics of preferential trade agreements and for the design of multi-agreement trade negotiation strategies in small, structurally constrained economies.
2.2. Global Trade Analysis Project (GTAP) Framework
The simulations were conducted using the multi-regional GTAP model implemented in RunGTAP version 10 [17], with GEMPACK 11.2 [35]. Although the GTAP database contains 134 regions and 57 sectors, the Nepal-specific model aggregates these into 16 regions and 30 sectors (Tables S1–S3). The benchmark year was updated from 2014 to 2020 using a sequential exogenous updating procedure consistent with established GTAP practice of using macroeconomic aggregates from the World Bank World Development Indicators to update input-output tables to a common reference year [17,36,37]. Specifically, macroeconomic aggregates, including GDP, aggregate trade flows, and sectoral output shares, were updated using data from the World Bank World Development Indicators and Nepal Rastra Bank national accounts. The Social Accounting Matrix (SAM) was rebalanced iteratively using the RAS (biproportional) method developed by the British economist Sir Richard Stone in the 1960s, which rescales rows and columns of the input-output matrix to be consistent with updated macroeconomic control totals, while preserving the structural relationships of the original GTAP coefficients [38,39]. Technical coefficients were not independently re-estimated, as this lies beyond the scope of comparative-static simulations; instead, behavioral parameters (elasticities) were retained from the validated GTAP 10 database. This approach aligns with prior CGE studies assessing the impacts of regional trade agreements on trade patterns and economic performance [40,41]. The WTO Trade Policy Review identified the 2019–2025 period as one of active regulatory transition, supporting the use of comparative-static CGE simulations to assess the near-term economy-wide impacts of tariff and NTM reforms for Nepal. As emphasized by Hertel [16], short-run closures are suitable when factor supplies do not adjust immediately, which reflects Nepal’s structural rigidities, limited labor mobility, and constrained capital accumulation. Thus, this study adopts a short-run macroeconomic closure with the global price index as the numeraire, while trade balance (trdslack), savings rate (psaveslack), and real government expenditure (cgdslack) are held fixed. Several CGE studies on SAFTA, BIMSTEC, and South Asian integration, including Bandara and Cai [42] and Hossain [21], adopt similar closures by fixing the current account balance and allowing endogenous savings adjustments. Fixing the trade balance is also common for economies with limited short-run exchange-rate flexibility [43,44], while the CGDS sector swap follows best practices for low-capacity economies [45].
2.3. Scenarios
For all three scenarios: SAFTA, BIMSTEC, and the interaction of SAFTA and BIMSTEC, three liberalization experiments were implemented to reflect policy feasibility consistent with the empirical ranges used in the GTAP and NTM literature, mirroring the same structure of tariff reductions, non-tariff measure reforms, and their combined effects. The shock magnitudes are grounded in Nepal’s policy trajectory. The 90 percent tariff reduction reflects the SAFTA mandate for LDC members to reduce tariffs to the 0–5 percent range, which implies a reduction of approximately 90 percent from Nepal’s current average applied tariff of 10.59 percent on South Asian imports [11]. The 50 percent NTM reduction is consistent with the regulatory reform ambitions documented in Nepal’s Third Trade Policy Review (2024/25) [11], including the enactment of the Food Safety and Quality Act (2024), the Plant Quarantine and Protection Act (2024), and expanded laboratory accreditation covering more than 800 food safety parameters by 2025, which collectively signal a trajectory toward substantial reduction in behind-the-border regulatory barriers. These shock levels are further consistent with the empirical ranges applied in comparable CGE-NTM studies for similar developing economies [5,6,7].
- a.
- Tariff elimination 90 percent:
A 90 percent reduction in tariffs is applied to all agricultural sectors to all member countries using the GTAP prtms variable.
- b.
- NTM reduction by 50percent:
A 50 percent reduction in non-tariff measures, such as SPS requirements, documentation processes, and administrative barriers, is applied across all agricultural sectors using the prams variable.
- c.
- Combined tariff (90 percent) and NTM (50 percent) reduction:
Both shocks are applied simultaneously to capture the joint effects of tariff and regulatory reforms within the SAFTA framework.
2.3.1. Scenario 1: SAFTA
SAFTA was designed to progressively reduce and eliminate tariff barriers among member countries by 2016; however, full implementation remains incomplete [46]. Nepal’s tariff remains relatively high, with applied tariff rates between two and nine times those of its regional partners [8]. For instance, Nepal’s average tariff on imports from South Asia is 10.59 percent, compared to 6.87 percent on imports from the rest of the world [11]. Under SAFTA, least developed countries such as Nepal are permitted to gradually reduce tariffs from 30 percent or below to the 0–5 percent range over an eight-year transition period [47].
2.3.2. Scenario 2: BIMSTEC
Recent statements from the 6th BIMSTEC Summit confirm that the FTA has not yet been finalized, and member states have been urged to “extend full cooperation to ensure timely finalization of the six fundamental agreements on trade” [48]. Given the non-operational status of the BIMSTEC FTA, the present analysis adopts a forward-looking approach to assess the potential economy-wide implications for Nepal should comprehensive trade liberalization be implemented in the future.
2.3.3. Scenario 3: Interaction of SAFTA and BIMSTEC
Nepal’s dual membership in SAFTA and BIMSTEC creates overlapping regionalism, where trade reforms under one agreement may interact with, reinforce, or partially offset the effects of liberalization under another. The overlapping members between SAFTA and BIMSTEC in our GTAP aggregation are India, Bangladesh, Sri Lanka, and Myanmar. To prevent double-counting tariff and NTM reductions for these common members in the combined scenario, shocks were applied only once per bilateral pair. Specifically, for overlapping member pairs, the tariff shock was set to the maximum of the SAFTA and BIMSTEC shock magnitudes (i.e., 90 percent), rather than applied cumulatively. This treatment ensures that bilateral tariff rates cannot fall below zero and avoids artificial amplification of reform effects for shared members, as applying shocks cumulatively across overlapping agreements would have no meaningful policy interpretation. NTM shocks were treated analogously: the 50 percent reduction was applied once per bilateral trade flow, irrespective of the number of agreements under which the pair qualifies. Non-overlapping member pairs were assigned the full shock magnitude corresponding to their respective agreement. To capture the full interaction effects, a third scenario was developed to model simultaneous liberalization across both RTAs and assess whether combined reforms yield additive gains or diminishing returns relative to standalone agreements.
2.4. Gravity Model Framework and Calculation of Tariff Equivalents
International trade is a crucial factor driving economic growth, and its influence on a country’s development is widely acknowledged [49]. Among the various factors affecting trade, NTMs are growing in importance, often impacting trade patterns more than tariffs themselves [26,50]. NTMs include regulatory, technical, and administrative requirements that affect trade flows but are typically not reflected in exporters’ cost structures, leading to incomplete assessments of trade protection. To address this limitation, a growing literature converts NTMs into AVEs and incorporates them into applied general equilibrium models. Two approaches are commonly used to estimate AVEs of NTMs: price-based and quantity-based methods [51]. This study adopts a quantity-based structural gravity framework, which explains bilateral trade flows as increasing with economic size and decreasing with trade costs such as distance and policy barriers. The gravity model allows trade volumes to be evaluated relative to exporter production, importer demand, and observable trade frictions [27]. Estimation is carried out using the Poisson Pseudo Maximum Likelihood (PPML) estimator developed by Silva and Tenreyro [52], which is well-suited for handling heteroskedasticity and zero trade flows. Following the structural gravity framework of Anderson and Van Wincoop [25], bilateral trade flows are modeled as a function of exporter production, importer demand, and bilateral trade costs. The theoretical foundation follows the structural gravity model of Anderson and Van Wincoop [25], and is expressed as:
where represents the export value from country i to country j, is the exporter (production) country output, is the importer (consumption) country output, and is the global output. captures the bilateral trade cost between country i and country j. represents the elasticity of substitution between imported and domestic goods.
The trade resistance () can be expressed through observable trade costs, such as transport costs () and a border variable (). This allows us to replace unobservable trade costs with measurable factors, yielding the following equation:
where represents transport costs between country i and country j, represents a border variable. and are the corresponding coefficients determining the impact of these factors on trade resistance. Substituting Equation (2) into Equation (1) and taking logs yields the estimable form:
where is a constant. To accurately estimate the border effects consistent with economic theory, each gravity equation is estimated separately for the three trade configurations: SAFTA (Equation (4)), BIMSTEC (Equation (5)), and the combined SAFTA-BIMSTEC interaction (Equation (6)). The subscripts i and j denote the exporting and importing country, respectively. The interaction dummies , , and their bilateral decompositions (e.g., , ) are binary indicator variables equal to one when the bilateral trade flow belongs to the respective agreement-specific corridor, and zero otherwise. In the combined Equation (6), both sets of dummies are included simultaneously, allowing the model to isolate the marginal contribution of each agreement while controlling overlapping membership. All dummies are mutually exclusive within each equation to prevent collinearity. In Equations (4)–(6), is a dependent variable, is a constant, are the coefficients of estimates for independent variables, and the remaining variables are the independent variables.
- (1)
- For SAFTA:
- (2)
- For BIMSTEC:
- (3)
- For interaction between SAFTA and BIMSTEC:
- : Export value from i to j
- : Production value of i
- : Consumption value of j
- : Distance between i and j
- : Equal to zero if both countries are not landlocked, one if there is one landlocked country, and two if there are two landlocked countries
- : Equal to one when there is contiguity between the two countries
- : Equal to one if both countries have the same official language
- : Equal to one if both countries are members of an RTA
- : Ad valorem tariff imposed by region j on exports from i
- : Equal to one if the dependent variable measures intra-SAFTA trade
- : Equal to one if the dependent variable measures the exports from SAFTA to Nepal
- : Equal to one if the dependent variable measures the exports from Nepal to SAFTA
- : Equal to one if the dependent variable measures cross-border trade not mentioned before
- : Equal to one if the dependent variable measures intra-BIMSTEC trade
- : Equal to one if the dependent variable measures the exports from BIMSTEC to Nepal
- : Equal to one if the dependent variable measures the exports from Nepal to BIMSTEC
- : Equal to one if the dependent variable measures cross-border trade not mentioned before
- : Error term
Bilateral trade data, tariffs, production, and consumption variables are drawn from the GTAP 10 database (2020 base year). Nepal’s tariff data are sourced from Nepal Customs Tariffs 2020/2021 [53]. Data for distance (between capitals of countries), landlocked status, contiguity, and language (official) variables were obtained from the Centre D’Etudes Prospectives et D’Informations Internationales (CEPII) [54]. Finally, we ran three separate regressions for the gravity equation using a PPML estimator for Equations (4)–(6).
2.5. Estimation of AVEs of NTMs
In gravity models with constant elasticity of substitution (CES) preferences, trade barriers enter multiplicatively as iceberg trade costs, affecting trade flows through the term [25]. Accordingly, the estimated coefficient on a bilateral border dummy captures the impact of regulatory and policy-related trade frictions and can be transformed into a tariff-equivalent measure [55]. Following established practice in the literature [5,6,7], AVEs of NTMs are computed using the estimated border-dummy coefficients (Table S4) and the elasticity of substitution between goods derived from the GTAP Database:
where
- AVEbij: Ad valorem equivalents of bilateral border barriers
- βij: Estimated border dummy coefficient
- σ: The elasticity of substitution. Sector-specific elasticities are taken from the ESUBM parameter in GTAP, consistent with the model’s sectoral aggregation [48].
3. Results and Discussion
3.1. Calculation of AVEs of NTMs
Gravity model results confirmed that production, consumption, contiguity, and common language significantly increase bilateral trade flows, aligning with prior findings of Webb, Strutt [26] and Cororaton and Orden [56]. Landlocked status behaved as expected: trade increased when one partner is landlocked but declined when both are, due to compounded logistical challenges. Most estimated coefficients are statistically significant at the 1 percent level (p ≤ 0.01, CI = 99 percent), confirming the robustness of the gravity estimates (Table S4). The RTA dummy was negative and statistically significant, reflecting overlapping agreements, weak enforcement, extensive exemption lists, complex administrative procedures, and high compliance costs in South Asia [1,20,32]. Accordingly, the negative RTA coefficient is interpreted as capturing effective trade resistance, rather than the formal existence of agreements. The resulting AVE of NTMs should therefore be viewed as conservative estimates of regulatory trade barriers, suitable for scenario-based policy simulations rather than precise point estimates [57].
The border dummy coefficients reported in Table S4 served as the basis for estimating the AVEs of NTMs, capturing the trade-reducing effects of regulatory and procedural barriers between Nepal and its trading partners. Separate gravity estimations were conducted for Nepal’s major partners: SAARC, BIMSTEC, India, China, the European Union (EU), and the United States (USA), revealing substantial asymmetries in regulatory barriers (Table S5). In Nepal-India trade, Nepal applies higher NTMs on imports of cereal grains (20.8 percent) and livestock (3.6 percent), while India imposes substantially higher NTMs on Nepal’s exports, particularly livestock (41 percent), vegetables and fruits (13 percent), and processed food products (6.6 percent). Similar asymmetries are observed in Nepal-China trade, where China imposes relatively high NTMs on Nepal’s exports of livestock, horticultural products, food products, oilseeds, and cereal grains. In trade with the EU and USA, both partners impose relatively high NTMs on livestock and horticultural products, with the EU additionally applying higher barriers on Nepal’s vegetable, fruit, and oilseed exports. These patterns highlight that Nepal faces substantially higher regulatory barriers to exporting than to importing, underscoring the importance of NTM reforms to improve export competitiveness. Although AVEs were estimated for all major trading partners, only the India-related AVEs were incorporated into the CGE simulations, as India is the sole trading partner common to both SAFTA and BIMSTEC in the GTAP aggregation. Prior to simulations, estimated AVEs were incorporated into the GTAP database to ensure that the baseline accurately captured both tariff and non-tariff barriers. All policy experiments were solved using the Gragg 2–4–6 steps extrapolation method, the standard GTAP solution procedure, ensuring numerical accuracy and stability in nonlinear model simulations.
3.2. Macroeconomic Impacts of Removing Tariffs and Non-Tariffs
The following results should be read considering Nepal’s broader trade structure: SAFTA and BIMSTEC partners collectively account for a significant but not dominant share of Nepal’s total trade, with the rest of the world, particularly China and the European Union, representing large and growing import sources. The gains reported below therefore represent the partial-equilibrium benefits of intra-regional preferential liberalization and should not be extrapolated as the total effect of trade reform. The SAFTA and BIMSTEC frameworks aim to promote agricultural development, enhance food security, and boost regional integration through increased agricultural trade and cooperation. The following sections analyze and interpret the macroeconomic effects of each liberalization pathway under SAFTA, BIMSTEC, and the combined SAFTA-BIMSTEC scenarios.
3.2.1. Impact on GDP, Volume of Imports, Volume of Exports, and Private Household Demand of Commodities for Nepal
The simulation results indicate that trade liberalization under SAFTA and BIMSTEC generates positive yet complex macroeconomic opportunities for Nepal. As the smallest economy among the 16 modeled regions, with a baseline GDP of USD 30 billion in 2020 (Table S1), Nepal is highly sensitive to trade policy reforms. Across all scenarios, the removal of trade barriers increases real GDP (Table 1), consistent with standard trade theory emphasizing efficiency gains and improved market access [25]. The elimination of tariffs in BIMSTEC increased Nepal’s GDP by 1.31 percent ($258.29 million). Comparable CGE evidence from BIMSTEC member countries similarly reports positive GDP effects following tariff reductions [21]. These outcomes reflect gains from specialization, economies of scale, and enhanced regional integration [4]. When tariffs and NTMs are jointly reduced, GDP increases by 1.04 percent across scenarios, with larger absolute gains under BIMSTEC.
Table 1.
Impact on Nepal’s GDP, Volume of Imports, and Volume of Exports.
Exports respond strongly to liberalization, particularly under tariff reduction scenarios. Export volumes increased by over 14 percent ($274 million), highlighting the unlocking of Nepal’s comparative advantages through improved market access [2]. NTM reduction also raised exports by 3.21 percent ($62 million), confirming that regulatory barriers impose significant costs on Nepalese exporters [29]. Conversely, the imports were more complex. While NTM removal alone increased imports modestly by 0.23 percent ($20 million), consistent with lower compliance costs, the removal of tariffs, whether alone or combined with NTMs, led to a slight decline in import volumes (around −0.3 percent or −$28 million). This counterintuitive outcome reflects real exchange rate appreciation driven by export expansion, which reduces the price competitiveness of imports and shifts demand toward domestically produced goods, a mechanism commonly observed in CGE analyses of small open economies [58].
These results must be interpreted in the context of Nepal’s structural trade deficit, illustrated in Figure 1. The slight decline in import volumes under tariff liberalization may appear counterintuitive in light of Nepal’s import-heavy trade structure. However, this outcome reflects the real exchange rate appreciation mechanism inherent to the short-run CGE closure: as exports expand, the real exchange rate appreciates, raising the effective cost of imports and dampening overall import demand. Importantly, this dynamic is most pronounced for SAFTA and BIMSTEC partner imports, because the tariff and NTM shocks are applied specifically to these bilateral corridors. Trade with the rest of the world, which is not subject to preferential liberalization in our scenarios, experiences relatively smaller direct price adjustments, consistent with the observed pattern in Figure 1, where Nepal’s imports from non-SAFTA/BIMSTEC partners have grown more rapidly than intra-regional trade. This reflects structural complementarities: Nepal’s imports from China, the European Union, and other rest-of-world partners are concentrated in manufactured goods, machinery, and energy products for which no regional substitutes exist within SAFTA or BIMSTEC, and which are therefore insensitive to preferential tariff changes. This structural dependency on rest-of-world imports is an important caveat to the overall positive results and points to the limits of intra-regional liberalization as a tool for addressing Nepal’s broader external imbalance.
The combined effect of rising GDP and exports alongside stable or declining imports improves Nepal’s trade balance and supports greater economic self-reliance. These findings align with regional evidence suggesting that Nepal can reduce import dependence while expanding export opportunities within South Asia [59,60]. The growth trends also support Hossain’s [21] findings related to BIMSTEC. Sectoral results indicate that export gains are concentrated in textiles, which account for over USD 70 million in additional exports under tariff liberalization, confirming its strong comparative advantage and validating earlier findings on the export potential of South Asian LDCs, as noted by Raihan and Razzaque [9]. Although some sectors exhibit large percentage changes (e.g., Meat Products), their absolute contributions remain small, underscoring that macroeconomic outcomes are driven by sectors with larger trade shares [4,16]. Comparisons across scenarios suggest that BIMSTEC, either alone or combined with SAFTA, delivers slightly stronger outcomes than SAFTA alone, though marginal gains from combining both agreements remain limited.
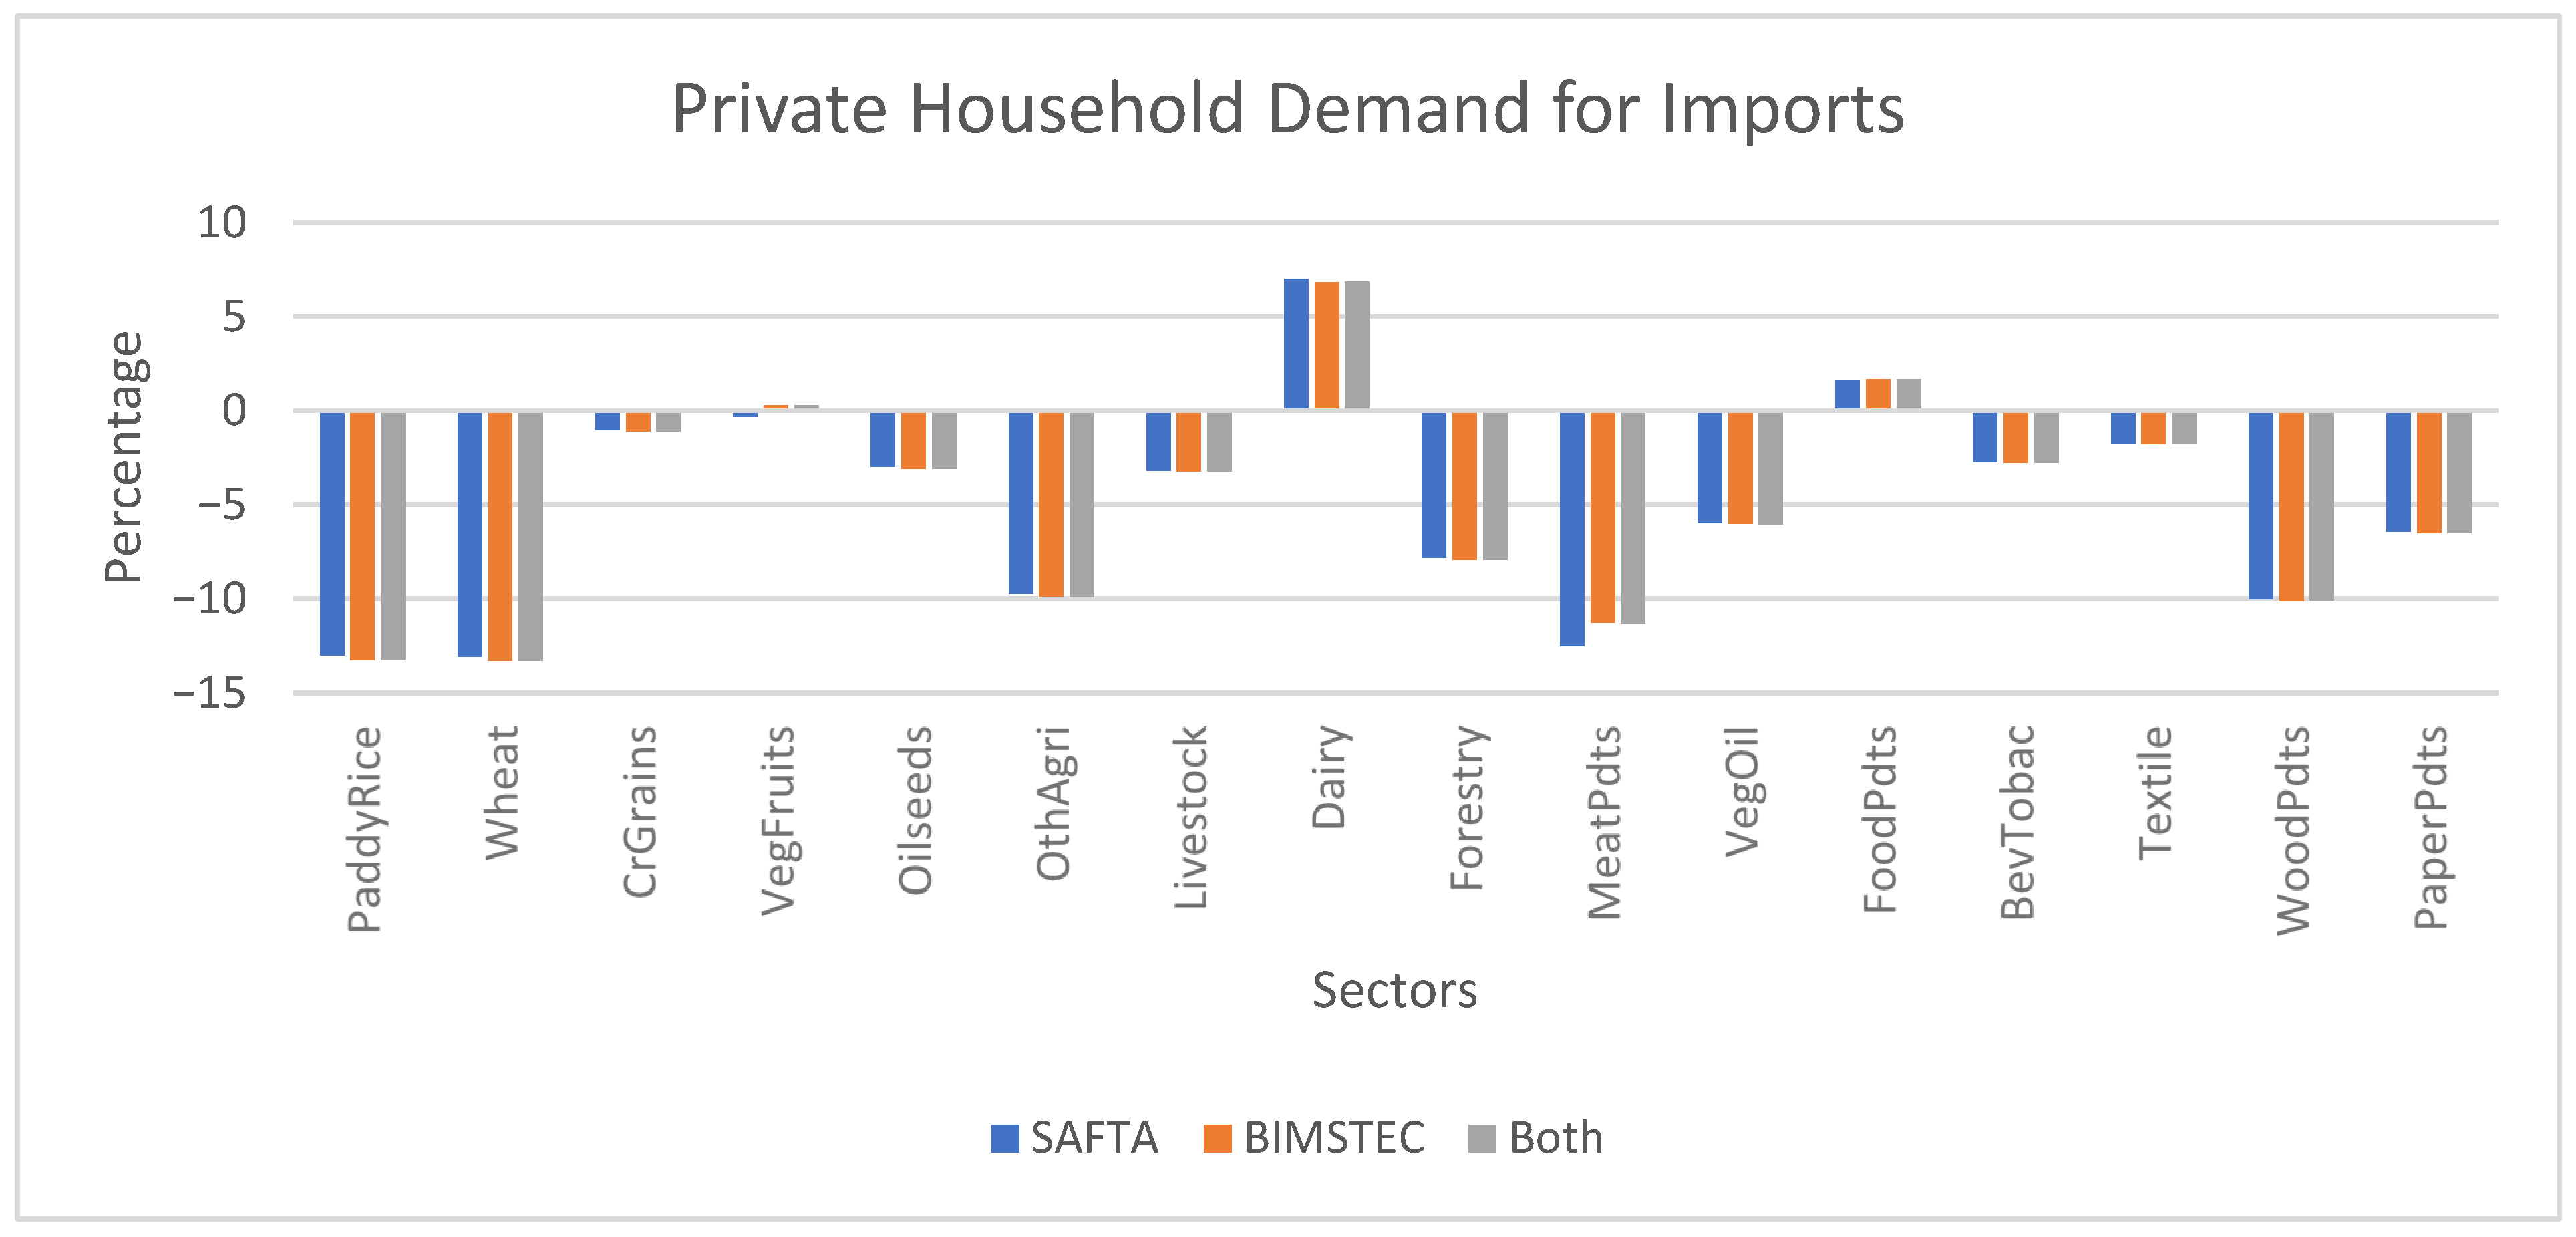
Changes in trade policy also affect private household demand for imports. Under joint tariff and NTM liberalization, import demand declined for most commodities, except for Dairy (increase by 6.85 percent), Food Products (increase by 1.67 percent), and Vegetables and Fruits (increase by 0.30 percent) (Figure 2; Table S6). This pattern is again explained by real exchange rate appreciation, which dampens household demand for foreign goods despite lower trade barriers [58]. Tariff removal increased demand for staple food commodities across all scenarios (Tables S7 and S8), while NTM removal raised demand for selected products, including Paddy Rice, Beverages and Tobacco, and Textiles. Overall, the results indicate that tariff reduction plays a more decisive role in boosting Nepal’s exports, while NTM reforms produce more heterogeneous effects across commodities.
Figure 2.
Impact on Private Household Demand for Imports of Commodities.
This study suggests that eliminating tariffs could significantly increase exports of agricultural commodities, as evidenced by increases across all scenarios. While Raihan [61] noted that Nepal faced negative effects on imports and exports after joining SAFTA, our findings indicate that Nepal could benefit from eliminating 90% of tariffs and reducing NTMs by 50%. Similarly, Gaurav and Bharti [30] emphasize that reducing NTMs is crucial for enhancing intra-regional trade among SAFTA members. These results highlight that the effects of trade liberalization on imports are context-specific and depend on general equilibrium adjustments. The potential rise in export earnings may appreciate Nepal’s real exchange rate, making imports costlier and thus decreasing demand, consistent with findings from [58] regarding other small, open economies. Overall, these results align with trade theory while underscoring the intricate general equilibrium effects at play.
3.2.2. Macroeconomic Trade Performance and Sectoral Shifts
The trade balance, defined as exports minus imports, is a key indicator of a country’s international trade position [49]. The simulations reveal a notable improvement in Nepal’s macroeconomic trade situation, with the overall trade balance rising mainly due to the performance of a few key sectors (Table 2). In particular, the textiles sector stands out, with net exports rising by over $90 million under tariff-removal scenarios, indicating that tariffs are a major constraint on Nepalese textile exports. This finding is consistent with evidence highlighting textiles as a core export opportunity for South Asian economies [62,63]. Additional positive contributions are observed in PaddyRice (~$8.7 million), Beverages & Tobacco (~$6.1 million), and Paper Products (~$6.5 million).
Table 2.
Impact on Trade Balance of Nepal after tariff and NTMs removal in USD million.
The effects of NTM removal alone are more mixed. While it improves the trade balance for vegetables and fruits (over $10 million), suggesting strong sensitivity to behind-the-border barriers, it worsens the trade balance for Other Agriculture ($5.9 million). This pattern implies that some domestic NTMs may have provided implicit protection, and their removal exposes import-competing sectors to greater foreign competition [28]. Processed food products experience persistent trade balance losses ($22–25 million), reflecting their reliance on existing protection and the expected reallocation effects of trade liberalization. Across all scenarios, BIMSTEC yields a more favorable trade balance outcome than SAFTA, while the combined SAFTA-BIMSTEC scenario delivers only marginal additional gains. The projected expansion of Nepal’s textile exports may intensify regional competition, particularly with producers in India and Bangladesh, while reduced import demand could affect export-oriented sectors in neighboring economies. Consistent with earlier GTAP-based analyses of SAFTA [61], the results suggest that trade liberalization yields greater gains when accompanied by complementary trade facilitation, infrastructure improvements, and regulatory cooperation. Overall, the findings reinforce the view that deeper integration through non-tariff reforms and coordinated regional policies delivers greater benefits than tariff reduction alone [25].
4. Conclusions
This study employed a Nepal-specific CGE model, based on the GTAP 10 framework, to evaluate the short-run economy-wide impacts of tariff and NTM liberalization under the SAFTA and BIMSTEC agreements. In doing so, it makes several contributions to the literature on regional trade integration, CGE methodology, and trade policy in small open economies. Empirically, it provides the first Nepal-specific estimates of AVEs of NTMs using a structural gravity framework, filling a critical gap identified in the South Asian trade literature [5,7,9]. Methodologically, it demonstrates a replicable two-stage approach, combining gravity estimation with CGE simulation, that can be applied to other data-constrained small economies embedded in overlapping preferential trade agreements. Theoretically, the findings contribute to the literature on the welfare economics of overlapping RTAs by providing empirical evidence that combined SAFTA-BIMSTEC liberalization produces only marginal additional gains over standalone agreements, consistent with theoretical predictions of diminishing returns from preferential liberalization under overlapping membership. The simulation results indicate consistent macroeconomic gains for Nepal across all scenarios, with real GDP increasing by approximately 1.04 percent when both tariffs and NTMs are reduced. These gains are primarily driven by strong export growth, particularly in the BIMSTEC region, where export volumes increased by over 14 percent, while imports declined slightly due to real exchange rate appreciation. The textiles sector emerges as Nepal’s strongest comparative advantage, with export gains exceeding USD 90 million following tariff liberalization, a finding consistent with and extending the prior literature on LDC export patterns in South Asia.
The policy recommendations that follow are based on the simulation results of this study and in the structural characteristics of the Nepalese economy described above, including its persistent trade deficit, remittance dependence, limited export complexity, and the partial coverage of SAFTA and BIMSTEC relative to Nepal’s total trade links. First, Nepal’s textile sector emerges as its dominant comparative advantage; thus, policymakers should prioritize negotiating preferential market access for textiles within both SAFTA and BIMSTEC frameworks, including by advocating for the removal of India’s applied NTMs on Nepal’s textile and garment exports, which our gravity estimates place at approximately 6.6 percent. Second, the asymmetric pattern of NTMs identified in the gravity results, whereby Nepal faces substantially higher regulatory barriers to exporting than to importing, particularly for livestock and vegetables and fruits, underscores the need for dedicated bilateral NTM negotiation tracks with India. Third, the simulation results show that processed food products experience persistent trade balance losses across all liberalization scenarios, indicating that domestic producers in this sector will face significant competitive pressure; targeted transitional support, including worker retraining programs and temporary adjustment assistance, should therefore be integrated into Nepal’s trade policy planning ahead of any full liberalization. Fourth, the finding that the combined SAFTA-BIMSTEC scenario delivers only marginally greater macroeconomic gains than standalone BIMSTEC alone suggests that Nepal’s limited negotiating resources may be most efficiently directed toward deepening implementation within the BIMSTEC framework, particularly through the finalization of the BIMSTEC FTA currently under negotiation. Fifth, while tariff reduction plays a more decisive role in boosting exports, with export volumes rising by over 14 percent under tariff liberalization compared to 3.21 percent under NTM reduction alone, the complementary domestic policy agenda remains essential: upgrading sanitary and phytosanitary infrastructure, expanding laboratory accreditation capacity, and simplifying customs procedures are necessary preconditions for fully realizing the export gains modeled in this study. From a comparative perspective, Nepal’s experience has implications for other small, landlocked economies embedded in overlapping regional trade agreements. The findings suggest that the benefits of preferential liberalization are concentrated in sectors with existing comparative advantages, in Nepal’s case, textiles, rather than catalyzing export diversification into more complex products. Realizing broader structural transformation will therefore require complementary industrial and trade facilitation policies that lie beyond the scope of the CGE framework used here.
Despite its contributions, this study is subject to several limitations. The comparative-static CGE framework captures short-run adjustment effects but does not account for dynamic processes such as investment responses, technological change, or productivity growth that could influence long-term outcomes. In addition, reliance on the GTAP 10 database (base year 2020) introduces several data limitations: the sectoral and regional aggregation may mask heterogeneity within broad sector groupings; the exogenous updating from 2014 to 2020 using RAS rebalancing preserves structural coefficients that may not fully reflect post-earthquake reconstruction (2015–2019) or COVID-19 disruptions (2020); and the gravity-estimated NTM proxies, while methodologically consistent with best practice, should be treated as indicative rather than precise point estimates. Future research could address these limitations in several directions. First, dynamic CGE models incorporating capital accumulation and productivity spillovers would allow assessment of Nepal’s long-term growth trajectory under deeper liberalization. Second, firm-level and household survey data could be integrated with the macro CGE results to assess distributional impacts across income groups, of particular social relevance given Nepal’s high rural poverty rates. Third, the methodological framework developed here offers a replicable template for other small, landlocked economies in South Asia (Bhutan, Afghanistan) and beyond (Lao PDR, landlocked African LDCs) that face similar pressing trade policy questions. From a societal perspective, the findings provide actionable guidance for Nepal’s post-LDC graduation trade strategy, informing negotiations with SAFTA and BIMSTEC partners and domestic policy design aimed at translating the modeled export gains into inclusive economic development.
Supplementary Materials
The following supporting information can be downloaded at: https://www.mdpi.com/article/10.3390/world7040056/s1, File S1: Trade Liberalization under SAFTA and BIMSTEC: Evidence from a CGE-GTAP Case Study of a Small Open Economy.
Author Contributions
Conceptualization, G.B. and P.L.; methodology, G.B.; software, G.B.; validation, G.B.; formal analysis, G.B.; investigation, G.B.; resources, P.L.; data curation, G.B.; writing: original draft preparation, G.B.; writing: review and editing, G.B. and P.L.; visualization, G.B.; supervision, P.L. All authors have read and agreed to the published version of the manuscript.
Funding
This research received no external funding.
Institutional Review Board Statement
Not applicable.
Informed Consent Statement
Not applicable.
Data Availability Statement
The data used in this study include licensed databases (GTAP) and model-generated outputs. Due to licensing restrictions, the underlying datasets are not publicly available but may be provided by the corresponding author upon reasonable request. A minimal dataset containing derived variables used in the analysis has been uploaded as Supplementary Materials.
Conflicts of Interest
The authors declare no conflicts of interest.
References
- Freund, C.; Ornelas, E. Regional Trade Agreements. Annu. Rev. Econ. 2010, 2, 139–166. [Google Scholar] [CrossRef] [Scilit]
- Baier, S.L.; Bergstrand, J.H. Do free trade agreements actually increase members’ international trade? J. Int. Econ. 2007, 71, 72–95. [Google Scholar] [CrossRef] [Scilit]
- Rodrik, D. Straight Talk on Trade: Ideas for a Sane World Economy; Princeton University Press: Princeton, NJ, USA, 2017. [Google Scholar]
- Burfisher, M.E. Introduction to Computable General Equilibrium Models, 3rd ed.; Cambridge University Press: Cambridge, UK, 2020. [Google Scholar]
- Kee, H.L.; Nicita, A.; Olarreaga, M. Estimating trade restrictiveness indices. Econ. J. 2009, 119, 172–199. [Google Scholar] [CrossRef] [Scilit]
- Berden, K.; Francois, J. Quantifying non-tariff measures for TTIP. In Rule-Makers or Rule-Takers? Exploring the Transatlantic Trade and Investment Partnership; Pelkmans, J., Hamilton, D.S., Eds.; Bloomsbury Publishing PLC: London, UK, 2015; pp. 97–137. [Google Scholar]
- United Nations Conference on Trade and Development. Non-Tariff Measures: Evidence from Selected Developing Countries and Future Research Agenda; United Nations: New York, NY, USA, 2012. [Google Scholar]
- Kathuria, S. A Glass Half Full: The Promise of Regional Trade in South Asia; World Bank Publications: Washington, DC, USA, 2018. [Google Scholar]
- Raihan, S.; Razzaque, M.A. Regional Integration in South Asia: Trends, Challenges and Prospects; Commonwealth Secretariat: London, UK, 2014; p. 500. [Google Scholar]
- United Nations, Department of Economic and Social Affairs. Least Developed Country Category—Nepal Profile. Available online: https://policy.desa.un.org/themes/least-developed-countries-category/least-developed-country-category-nepal-profile (accessed on 17 May 2024).
- World Trade Organization. Trade Policy Review: Nepal; World Trade Organization: Geneva, Switzerland, 2025. [Google Scholar]
- The World Bank. Exports/Imports of Goods and Services; World Bank Group: Washington, DC, USA, 2025. [Google Scholar]
- The World Bank. World Development Indicators: Personal Remittances, Received (% of GDP)—Nepal; World Bank Group: Washington, DC, USA, 2025. [Google Scholar]
- The World Bank. World Development Indicators: Foreign Direct Investment, Net Inflows (% of GDP)—Nepal; World Bank Group: Washington, DC, USA, 2025. [Google Scholar]
- Hossain, S.S.; Delin, H. Rice and wheat tariff impact in Bangladesh: CGE analysis using GTAP model. J. Agric. Sci. 2019, 11, 63. [Google Scholar] [CrossRef] [Scilit]
- Hertel, T.W. Global Trade Analysis: Modeling and Applications; Cambridge University Press: Cambridge, UK, 1997. [Google Scholar]
- Aguiar, A.; Chepeliev, M.; Corong, E.L.; McDougall, R.; Van Der Mensbrugghe, D. The GTAP Data Base: Version 10. J. Glob. Econ. Anal. 2019, 4, 1–27. [Google Scholar] [CrossRef] [Scilit]
- Jain, H. Implications of SAFTA for Indian economy: Trade, compatibility and welfare effects. Foreign Trade Rev. 2019, 54, 355–374. [Google Scholar] [CrossRef] [Scilit]
- Masood, S.; Khurshid, N.; Haider, M.; Khurshid, J.; Khokhar, A.M. Trade potential of Pakistan with the South Asian Countries: A gravity model approach. Asia Pac. Manag. Rev. 2023, 28, 45–51. [Google Scholar] [CrossRef] [Scilit]
- Shah, M.I. Investigating the role of regional economic integration on growth: Fresh insights from South Asia. Glob. J. Emerg. Mark. Econ. 2021, 13, 35–57. [Google Scholar] [CrossRef] [Scilit]
- Hossain, S.M. Impacts of BIMSTEC Free Trade Area: A CGE Analysis. J. Econ. Sustain. Dev. 2013, 4, 13. [Google Scholar]
- Rahman, M.M.; Kim, C. Prospects for Economic Integration of BIMSTEC: Trade and Investment Scenario. Int. J. u-e-Serv. Sci. Technol. 2016, 9, 235–248. [Google Scholar] [CrossRef] [Scilit]
- Rai, S.; Paswan, A.S.; Jha, S.N. The An Analysis of India’s Trade Flow with BIMSTEC nations-A Gravity Model Approach. Stud. Econ. Bus. Relat. 2021, 2, 2. [Google Scholar] [CrossRef] [Scilit]
- Kaur, G.; Gupta, A. India-BIMSTEC Bilateral Trade Activities: A Gravity Model Approach. In Regional Trade and Development Strategies in the Era of Globalization; IGI Global: Hershey, PA, USA, 2020; pp. 126–145. [Google Scholar]
- Anderson, J.E.; Van Wincoop, E. Gravity with gravitas: A solution to the border puzzle. Amer. Econ. Rev. 2003, 93, 170–192. [Google Scholar] [CrossRef] [Scilit]
- Webb, M.; Strutt, A.; Gibson, J.; Walmsley, T. Modelling the Impact of Non-Tariff Measures on Supply Chains in ASEAN. World Econ. 2020, 43, 2172–2198. [Google Scholar] [CrossRef] [Scilit]
- Engelbert, T.; Brockmeier, M.; De Jong, B. Comparing gravity model specifications to estimate NTBs using the GTAP framework. In 15th Annual Conference on Global Economic Analysis; Purdue University: Geneva, Switzerland, 2012. [Google Scholar]
- Disdier, A.C.; Marette, S. The combination of gravity and welfare approaches for evaluating nontariff measures. Am. J. Agric. Econ. 2010, 92, 713–726. [Google Scholar] [CrossRef] [Scilit]
- Beverelli, C.; Neumueller, S.; Teh, R. Export diversification effects of the WTO Trade Facilitation Agreement. World Devel. 2015, 76, 293–310. [Google Scholar] [CrossRef] [Scilit]
- Gaurav, K.; Bharti, N. Has trade improved from SAPTA to SAFTA? Evidence from the gravity model. Int. J. Bus. Glob. 2020, 23, 532–548. [Google Scholar] [CrossRef] [Scilit]
- Khan, O.H. Barriers to Trade and Trade Facilitation in Reference to SAARC Region; Springer: Singapore, 2021; pp. 41–82. [Google Scholar]
- Bombarda, P.; Gamberoni, E. Firm heterogeneity, rules of origin, and rules of cumulation. Int. Econ. Rev. 2013, 54, 307–328. [Google Scholar] [CrossRef] [Scilit]
- Jefferson, P.N. The Oxford Handbook of the Economics of Poverty; Oxford University Press: Oxford, UK; New York, NY, USA, 2012. [Google Scholar]
- Dixon, P.B.; Rimmer, M.; Tran, N. Creating a disaggregated CGE model for trade policy analysis: GTAP-MVH. Foreign Trade Rev. 2020, 55, 42–79. [Google Scholar] [CrossRef] [Scilit]
- Corong, E.L.; Hertel, T.W.; McDougall, R.; Tsigas, M.E.; Van Der Mensbrugghe, D. The standard GTAP model, Version 7. J. Glob. Econ. Anal. 2017, 2, 1–119. [Google Scholar] [CrossRef] [Scilit]
- Aguiar, A.; Narayanan, B.; McDougall, R. An overview of the GTAP 9 data base. J. Glob. Econ. Anal. 2016, 1, 181–208. [Google Scholar] [CrossRef] [Scilit]
- Dixon, P.B.; Rimmer, M.T. Creating a GTAP baseline for 2014 to 2050 using shock-intensive simulations. J. Glob. Econ. Anal. 2025, 10, 50–105. [Google Scholar] [CrossRef] [Scilit]
- Lahr, M.; De Mesnard, L. Biproportional techniques in input-output analysis: Table updating and structural analysis. Econ. Syst. Res. 2004, 16, 115–134. [Google Scholar] [CrossRef] [Scilit]
- Stone, R.; Brown, A. A Computable Model of Economic Growth; Chapman & Hall: London, UK, 1962. [Google Scholar]
- Kumar, S.; Ahmed, S. Gravity model by panel data approach: An empirical application with implications for South Asian countries. Foreign Trade Rev. 2015, 50, 233–249. [Google Scholar] [CrossRef] [Scilit]
- Bussière, M.; Gaulier, G.; Steingress, W. Global trade flows: Revisiting the exchange rate elasticities. Open Econ. Rev. 2020, 31, 25–78. [Google Scholar] [CrossRef] [Scilit]
- Bandara, J.S.; Cai, Y. The impact of climate change on food crop productivity, food prices and food security in South Asia. Econ. Anal. Pol. 2014, 44, 451–465. [Google Scholar] [CrossRef] [Scilit]
- Decreux, Y.; Valin, H. MIRAGE, Updated Version of the Model for Trade Policy Analysis: Focus on Agriculture and Dynamics; in Working Paper No. 2007-15; CEPII: Paris, France, 2007. [Google Scholar]
- Narayanan, B.G.; Walmsley, T.L. Global Trade, Assistance, and Production: The GTAP 7 Data Base; Center for Global Trade Analysis, Purdue University: Geneva, Switzerland, 2008. [Google Scholar]
- Horridge, M. The TERM model and its database. In Economic Modeling of Water: The Australian CGE Experience; Springer: Dordrecht, The Netherlands, 2012; Volume 3, pp. 13–35. [Google Scholar]
- SAARC. Agreement on South Asian Free Trade Area (SAFTA). 2021. Available online: https://www.saarc-sec.org/index.php/resources/agreements-conventions/36-agreement-on-south-asian-free-trade-area-safta/file (accessed on 10 June 2025).
- Government of India. Agreements Signed in SAARC Summit. 2016. Available online: https://mea.gov.in/lok-sabha.htm?dtl/26747/QUESTION_NO1753_AGREEMENTS_SIGNED_IN_SAARC_SUMMIT (accessed on 10 June 2025).
- BIMSTEC. The 6th BIMSTEC Summit and Related Meetings-Day 3. 2025. Available online: https://www.bimstecthailand.com/en/news-en/the-6%e1%b5%97%ca%b0-bimstec-summit-and-related-meetings-day-3/ (accessed on 10 June 2025).
- Krugman, P.R.; Obstfeld, M.; Melitz, M. International Trade: Theory and Policy, 12th ed.; Pearson Education: London, UK, 2023. [Google Scholar]
- Walmsley, T.; Minor, P. Demand shifts and willingness to pay in applied trade models. World Econ. 2020, 43, 1499–1520. [Google Scholar] [CrossRef] [Scilit]
- Kurniasih, T.; Panennungi, M.A. Estimating Ad Valorem Equivalents (AVES) of Non-Tariff Measures: The Case of the Sanitary and Phytosanitary (SPS) and Technical Barrier to Trade (TBT) in Indonesian Bilateral Trade with 20 Main Trade Partners. Adv. Soc. Sci. Educ. Humanit. Res. 2019, 558, 485–495. [Google Scholar] [CrossRef] [Scilit]
- Silva, J.M.C.S.; Tenreyro, S. The log of gravity. Rev. Econ. Stat. 2006, 88, 641–658. [Google Scholar] [CrossRef] [Scilit]
- Government of Nepal. Budget Summary of Fiscal Year 2077/78 BS (2020/21 AD); Government of Nepal, Ministry of Finance: Kathmandu, Nepal, 2021.
- Head, K.; Mayer, T. Gravity equations: Toolkit, cookbook, workhorse. Handb. Int. Econ. 2013, 4, 131–195. [Google Scholar] [CrossRef] [Scilit]
- Novy, D. Gravity redux: Measuring international trade costs with panel data. Econ. Inq. 2013, 51, 101–121. [Google Scholar] [CrossRef] [Scilit]
- Cororaton, C.B.; Orden, D. Potential Economic Effects of the Reduction in Agricultural and Nonagricultural Trade Barriers in the Transatlantic Trade and Investment Partnership; International Food Policy Research Institute (IFPRI): Washington, DC, USA, 2016; p. 62. [Google Scholar]
- Kohl, T. Do we really know that trade agreements increase trade? Rev. World Econ. 2014, 150, 443–469. [Google Scholar] [CrossRef] [Scilit]
- Lakatos, C.; Nilsson, L. The EU-Korea FTA: Anticipation, trade policy uncertainty and impact. Rev. World Econ. 2017, 153, 179–198. [Google Scholar] [CrossRef] [Scilit]
- Bastola, U.; Sapkota, P. Causality between trade and economic growth in a least developed economy: Evidence from Nepal. J. Dev. Areas 2015, 49, 197–213. [Google Scholar] [CrossRef] [Scilit]
- Kharel, K.R.; Upadhyay, Y.M.; Adhikari, D.B. Trade liberalization in Nepal: Analysis of its impact. Butwal Campus J. 2021, 4, 25–36. [Google Scholar] [CrossRef] [Scilit]
- Raihan, S. SAFTA and the South Asian Countries: Quantitative Assessments of Potential Implications; Munich Personal RePEc Archive (MPRA): London, UK, 2012. [Google Scholar]
- World Bank. Creating Markets in Nepal: Diagnostic Trade Integration Study; World Bank Group: Washington, DC, USA, 2020. [Google Scholar]
- Sadhna, G.S.; Kumar, R.; Mokanaasri, E. Future Outlook: Opportunities and Challenges for the Asian Textile and Garment Industry. In Consumption and Production in the Textile and Garment Industry: A Comparative Study Among Asian Countries; Springer: Singapore, 2024. [Google Scholar]

Disclaimer/Publisher’s Note: The statements, opinions and data contained in all publications are solely those of the individual author(s) and contributor(s) and not of MDPI and/or the editor(s). MDPI and/or the editor(s) disclaim responsibility for any injury to people or property resulting from any ideas, methods, instructions or products referred to in the content. |
© 2026 by the authors. Licensee MDPI, Basel, Switzerland. This article is an open access article distributed under the terms and conditions of the Creative Commons Attribution (CC BY) license.