


Abstract
This paper presents a three-station Internet of Things (IoT) architecture for distributed thermal monitoring and local heater automation. The scope is deliberately limited to environmental monitoring, hysteresis-control characterization, and heat-risk screening; it is not presented as a complete thermal-comfort assessment or an occupational heat-stress instrument. Each workstation integrates an M5Stack AtomS3 Lite, a DHT22 temperature–humidity sensor installed at approximately 0.8 m above the floor, a relay, and a 1500 W, 110 V heater. Local automatic control uses a 20–25 °C hysteresis band. Embedded acquisition/transmission was configured at 15 s, while accepted cloud records in the analyzed tests had median intervals of 30–31 s. Repeated automatic-control tests were identified for all three stations, yielding seven, five, and nine ON/OFF transition pairs for Stations 1, 2, and 3, respectively. The mean reported ON-transition temperatures were 19.94, 19.96, and 19.72 °C, respectively, whereas mean reported OFF-transition temperatures were 25.20, 25.58, and 25.32 °C. These results characterize the synchronized cloud-reported heater state, not an independently instrumented relay contact. Packet-level ESP-NOW logs were not available; consequently, packet loss and end-to-end latency are not inferred. In response to the thermal-assessment limitations, the fuzzy layer was simplified to Heat Index, a 5 min Heat-Index trend, and a 15 min hot-sample fraction. Estimated WBGT, Discomfort Index, PMV, and PPD were removed from the decision layer. The HeatRiskScore is therefore an operational heat-screening indicator rather than a comfort or occupational-risk metric. Against a simple instantaneous Heat-Index baseline, the fuzzy classifier reproduced all 18 stable/low-exposure synthetic scenarios and escalated 7/18 scenarios under high recent heat exposure and 9/18 under combined high exposure and rising trend, demonstrating the intended temporal added value without claiming external validation. A datasheet-bound uncertainty sensitivity and a 108-case PMV/PPD factorial analysis further quantify the limitations of low-cost sensing and assumed comfort inputs.
1. Introduction
1.1. Background
Indoor thermal conditions can vary substantially over short distances because of localized heat sources, ventilation paths, solar gains, envelope temperatures, equipment, and occupant activity. A single room-level temperature measurement may therefore fail to represent the microenvironment experienced at an individual workstation. Continuous distributed sensing is attractive for automation because it permits each physical zone or workstation to be observed and controlled independently while retaining centralized supervision. Reviews of environmental monitoring technologies emphasize that the value of a connected sensing system depends not only on connectivity, but also on measurement quality, the intended decision task, and the relationship between the monitored variables and the phenomenon being inferred [1]. IoT implementations in hospitals, laboratories, agriculture, and industrial environments have shown how environmental sensors can be integrated with dashboards, cloud storage, and analytical services [2,3,4,5].
A critical distinction is required between thermal monitoring, thermal comfort, and heat stress. Thermal monitoring refers to measurement of physical environmental variables such as air temperature and relative humidity. Thermal comfort is a human-response construct for moderate environments and depends on the interaction of air temperature, mean radiant temperature, air velocity, humidity, metabolic rate, and clothing insulation. ISO 7730 formalizes the PMV/PPD framework for general thermal comfort under its stated applicability conditions [6]. Heat stress, by contrast, concerns potentially severe thermal exposure and is evaluated with other methods and indices; ISO 7243, for example, defines WBGT as a screening method for heat stress and requires the physical quantities specific to that index [7]. Recent reviews have highlighted that conflating these domains or calculating standardized indices without the required input quantities can produce misleading interpretations [8].
The present system was initially designed as an automation prototype based on low-cost distributed temperature and humidity sensing. It was not instrumented with a globe thermometer, anemometer, natural wet-bulb sensor, or occupant-response protocol. Accordingly, the manuscript narrows its claims to the evidence supported by the available measurements. The core contribution is the automation architecture: each station measures air temperature and relative humidity, performs local ON/OFF hysteresis control of its own heater, exchanges data through a multi-protocol IoT stack, and supports remote supervision. An auxiliary fuzzy layer provides a heat-screening score based on Heat Index and recent temporal context. The system is not claimed to measure complete thermal comfort, and it is not claimed to provide an ISO 7243 occupational heat-stress assessment.
1.2. State of the Art and Research Gap
Distributed IoT monitoring has been widely explored, but the literature reveals a recurring gap between successful connectivity demonstrations and rigorous measurement/control characterization. Coulby et al. [1] emphasized that environmental monitoring systems should be evaluated in terms of data quality, context, and user purpose. Garcés et al. [2] showed the value of online processing for thermal and indoor-air monitoring in hospitals, while Hidayat et al. [4] demonstrated real-time web monitoring of temperature and humidity in a process environment. Related embedded and edge-IoT studies show that compact single-board architectures can combine sensing, communication, and local processing, but they also make data provenance and system boundaries important for reproducibility [9,10,11]. These studies illustrate the utility of continuous sensing, but the transfer of such data into comfort or risk decisions requires stronger attention to metrology and model applicability.
Low-cost sensors are attractive for dense networks because of their price, digital interface, and ease of deployment. However, measurement accuracy, repeatability, response time, drift, calibration, and uncertainty remain fundamental. Taştan [12] demonstrated the need to calibrate and evaluate low-cost IoT sensors before relying on them for higher-criticality decisions. ISO 7726:2025 specifically addresses the characteristics of instruments used to measure and monitor the physical quantities that characterize thermal environments [13]. The same concern appears across distributed monitoring domains: environmental-control systems in poultry facilities, hydroponic environments, and precision agriculture demonstrate the scalability of networked sensing and actuation, while also emphasizing that the physical meaning and quality of measurements must be separated from the mere availability of connected data [14,15,16]. Consequently, a low-cost sensor network should not be described as standards-compliant merely because it reports temperature and humidity. Compliance depends on instrument performance, measurement procedure, placement, and the intended class of evaluation.
Thermal automation systems span simple ON/OFF control, fuzzy control, predictive control, and learning-based strategies. Hysteresis remains attractive for embedded systems because it is deterministic, computationally inexpensive, and robust to small fluctuations near a switching boundary. More advanced methods can improve energy or comfort objectives when adequate sensing and models are available. Hang and Kim [17] combined model-based predictive control and fuzzy logic for thermal-comfort management in an IoT space, while Khanghah et al. [18] experimentally compared IoT-enabled fuzzy control with ON/OFF control in a solar-thermal application. Sirisumrannukul et al. [19] used data analytics and optimization for cooling management in a smart home. Predictive and AI-assisted measurement/control approaches have also been explored for ambient-temperature prediction and measurement-system intelligence [20,21]. These works show that algorithmic sophistication can be valuable, but they also underline the need to define the controlled quantity and validation reference clearly.
For the human and occupational interpretation of thermal conditions, the literature further supports a strict separation between environmental sensing and validated comfort or heat-stress assessment. PMV-based comfort models depend on environmental and personal variables beyond air temperature and relative humidity [6,22], while ergonomics research highlights the importance of measuring the thermal environment with methods appropriate to the phenomenon under study [23]. Occupational heat-warning systems increasingly combine environmental measurements with physiological or wearable information and accumulated exposure [24,25,26]. NIOSH guidance likewise treats occupational heat exposure within a broader framework that includes workload, acclimatization, clothing, work/rest schedules, and environmental measurements [27]. These references motivate the deliberately narrower interpretation adopted in the present work.
The use of thermal indices introduces another layer of methodological risk. PMV/PPD is relevant to moderate indoor environments only when the required environmental and personal inputs are available with adequate quality [6,8]. WBGT has a different purpose and physical definition. In particular, the natural wet-bulb temperature used by WBGT is not equivalent to a conventional psychrometric wet-bulb temperature estimated only from air temperature and relative humidity. Natural wet-bulb behavior is influenced by convective and radiative conditions, and indoor WBGT also requires globe temperature. A two-variable DHT22 node therefore cannot reconstruct a standards-compliant WBGT. Similarly, non-standard indices may be useful for visualization but should not be mixed with standardized comfort or heat-stress metrics without a clear scientific rationale.
Fuzzy logic is useful when a decision problem contains gradual boundaries, but the rule base must be reproducible and non-redundant. Boobalan et al. [28] showed how linguistic rules can be mapped into industrial control logic, and several IoT applications have used fuzzy inference to handle uncertainty or multi-variable decisions [29,30]. A common weakness, however, is to combine highly correlated or mathematically dependent indicators as if they were independent evidence. PMV and PPD, for example, are mathematically linked. Heat Index, wet-bulb surrogates, and discomfort indices may all be derived from the same two measured variables. Adding such correlated quantities to a rule base can increase complexity without increasing information content.
These observations define the research gap addressed here. Existing low-cost IoT monitoring studies often emphasize connectivity, while thermal-assessment studies emphasize standardized instrumentation and human/environmental variables. There is a need for transparent automation prototypes that (i) preserve local control during supervisory or cloud interruptions; (ii) quantify repeated switching behavior using time-aligned telemetry; (iii) distinguish application-level data continuity from packet-level network reliability; (iv) avoid overstating the meaning of low-cost temperature/humidity measurements; and (v) use a fuzzy layer only when its added temporal decision value can be explained relative to a simpler baseline.
1.3. Aim and Novelty of the Study
The aim of this study is to design and evaluate a multi-station IoT automation architecture for distributed temperature/humidity monitoring and independent local heater control, while restricting the analytical layer to a clearly defined, non-normative heat-screening function. The principal contributions are fourfold. First, the architecture separates local control, local supervision, and cloud analytics across ESP-NOW, HTTP, MQTT, Node-RED, ThingSpeak, and MATLAB Analysis R2026a. Second, repeated hysteresis behavior is quantified from new multi-day telemetry for all three stations using the reported heater-state channel and the actual 20–25 °C thresholds. Third, the fuzzy model is simplified from a previously over-complete eight-input structure to three non-duplicative roles: instantaneous Heat Index, recent Heat-Index trend, and recent hot-sample fraction. Fourth, the paper explicitly quantifies metrological and model uncertainty, including DHT22 datasheet-bound sensitivity and a factorial PMV/PPD analysis, while avoiding claims of external comfort or occupational heat-stress validation.
2. Materials and Methods
2.1. Scope of the Measurement and Decision Framework
The analytical framework distinguishes measured, derived, assumed, and decision quantities. Air temperature T and relative humidity are the only environmental quantities measured directly at each station. Dew point and vapor-pressure deficit are derived from T and and are used only for descriptive visualization. Heat Index (HI) is also derived from T and and is used as an operational heat-screening variable. It is not treated as an occupational exposure limit.
Mean radiant temperature and air velocity v were not measured. Metabolic rate M and clothing insulation were not observed for occupants because the experiments were controlled engineering tests rather than an occupant field study. Accordingly, PMV and PPD are not used by the controller or the fuzzy HeatRiskScore. They are retained only in a separate sensitivity analysis to demonstrate how strongly an apparently precise comfort output can vary when unmeasured inputs are assumed. No statements about perceived thermal comfort are inferred from PMV/PPD in the present evaluation.
The prototype previously calculated a quantity labelled as estimated WBGT using an estimated conventional wet-bulb temperature. That quantity has been removed from the updated decision framework. The Stull-type wet-bulb approximation estimates a conventional psychrometric wet-bulb temperature from T and , whereas ISO 7243 WBGT requires natural wet-bulb temperature and globe temperature according to its specified configuration [7,8]. Because these required quantities were not measured, this paper does not report the surrogate as WBGT and does not use it for occupational inference. The Discomfort Index is likewise removed from the fuzzy decision layer because it is not a principal standardized index for indoor thermal-comfort assessment.
2.2. System Architecture
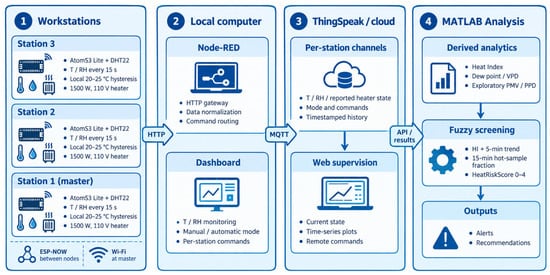
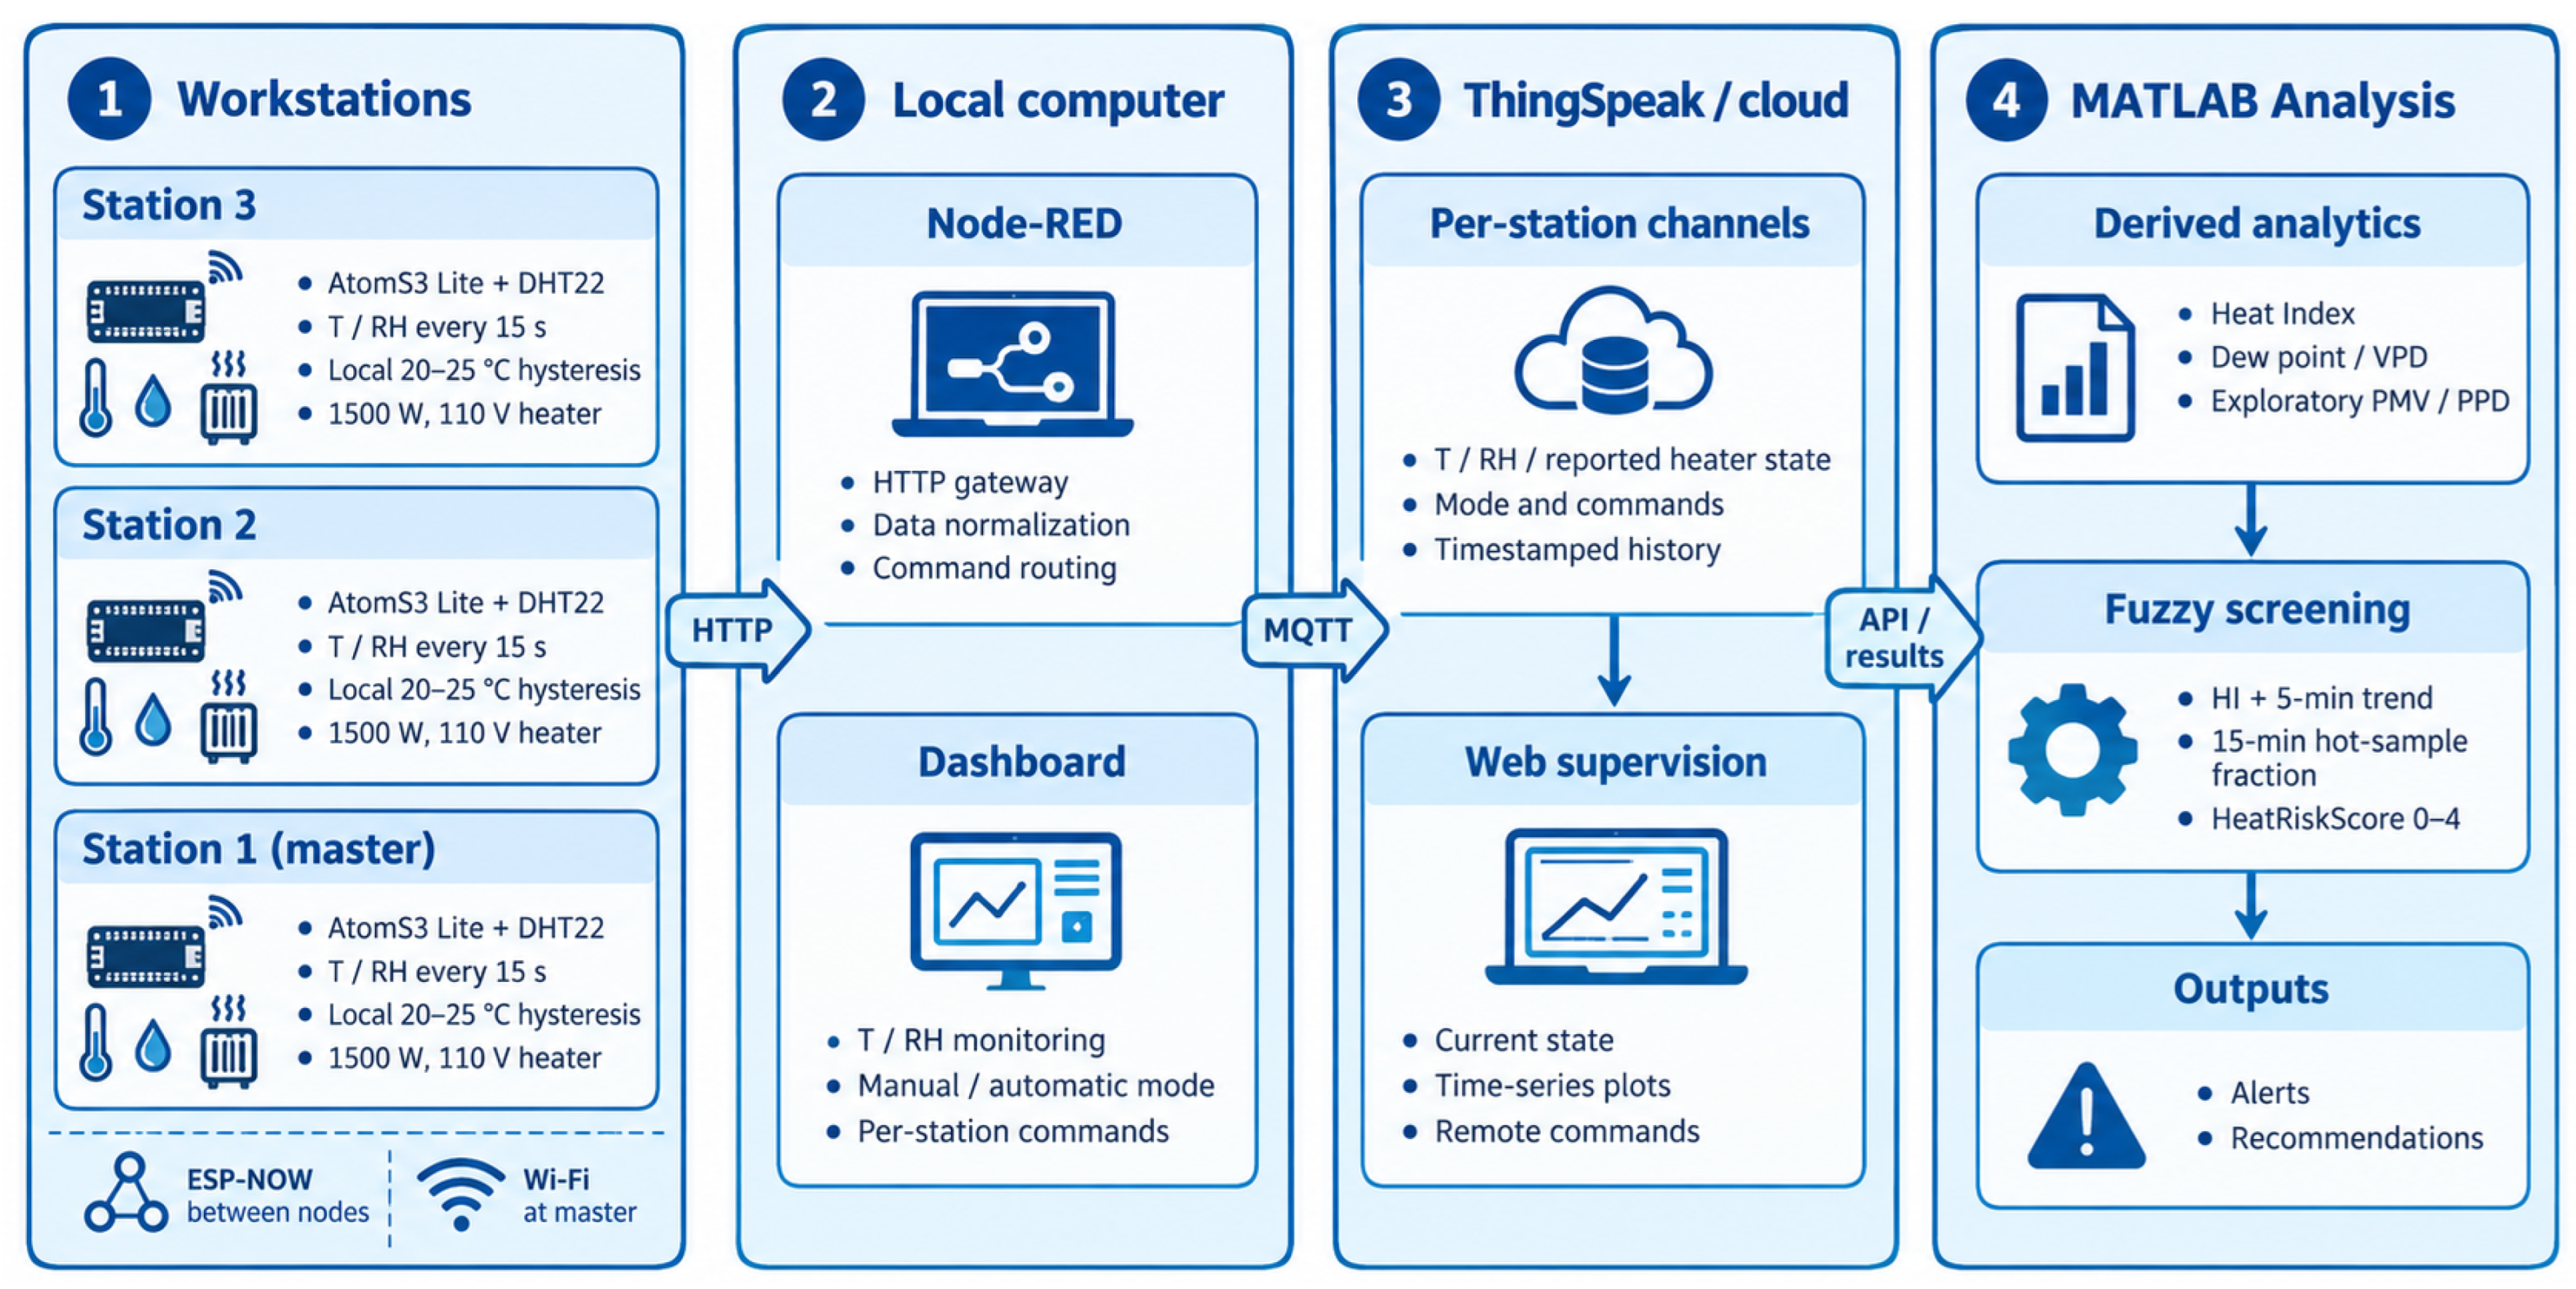
The architecture is organized into four layers, as shown in Figure 1. The first layer is the physical workstation level. Each station contains an embedded node, DHT22 sensor, relay, and heater. The embedded node acquires T and and executes the local hysteresis logic. The second layer is the local coordination layer. Stations 2 and 3 exchange telemetry and commands with Station 1, the master, through ESP-NOW. Only the master associates with the local Wi-Fi network. The third layer is a local computer running Node-RED, which receives data over HTTP, normalizes station messages, presents the supervisory dashboard, and routes commands. The fourth layer comprises ThingSpeak and MATLAB Analysis for per-station storage, remote visualization, and periodic analytical processing. The local supervisory layer was implemented in Node-RED 5.0 (OpenJS Foundation, Wilmington, DE, USA). Cloud data storage and MQTT synchronization were implemented using ThingSpeak (The MathWorks, Inc., Natick, MA, USA; cloud service with no user-selectable software version), while data processing and fuzzy heat-risk analysis were performed using MATLAB R2026a (The MathWorks, Inc., Natick, MA, USA).
Figure 1.
Multi-station IoT architecture.
The local-first design is intentional. A cloud service is not placed inside the immediate heater control loop. Each node can therefore continue its automatic hysteresis logic if Node-RED or ThingSpeak is temporarily unavailable. Supervisory services can change operating mode and parameters, but they do not replace the embedded switching law.
2.3. Hardware, Placement, and Metrological Characteristics
Each station uses an M5Stack AtomS3 Lite development board (M5Stack Technology Co., Ltd., Shenzhen, China), based on the ESP32-S3 platform (Espressif Systems (Shanghai) Co., Ltd., Shanghai, China). Air temperature and relative humidity were measured using a DHT22/AM2302 digital sensor (Guangzhou Aosong Electronics Co., Ltd. [ASAIR], Guangzhou, China). Each station controlled a Power Zone FH04 electric fan heater (750/1500 W; Orgill, Inc., Collierville, TN, USA) through a Songle SRD-05VDC-SL-C electromechanical relay (Ningbo Songle Relay Co., Ltd., Yuyao, Zhejiang, China). The manufacturer reports a typical temperature accuracy of ±0.5 °C, temperature repeatability of approximately ±0.2 °C, typical relative-humidity accuracy of RH, relative-humidity repeatability of approximately RH, and response times below approximately 10 s for temperature and 6 s for humidity under the specified test conditions. These are manufacturer specifications and were not independently verified in the present campaign.
The sensors were installed at approximately 0.8 m above floor level and positioned outside the direct hot-air jet of the heater. This height was selected for the controlled workstation prototype and is reported to make the measurement protocol reproducible; it is not presented as proof of compliance with a specific occupant-measurement height prescribed for a standardized comfort study. No traceable thermometer/hygrometer reference comparison was performed, and no pre-test or post-test calibration coefficients were obtained. Consequently, the experiment does not demonstrate compliance of the DHT22 nodes with ISO 7726:2025. ISO 7726 specifies minimum characteristics and measurement methods for instruments used to characterize thermal environments [13]; therefore, the absence of calibration and reference comparison is treated as a primary limitation rather than hidden behind the datasheet specification.
Each station controls an independent 1500 W, 110 V electric heater through a relay interface. The trials were conducted under controlled laboratory supervision. The firmware retained the watchdog behavior available on the ESP32-S3 software platform, and the control initialization explicitly set the heater command to OFF after restart. No additional dedicated experimental thermal cutoff, custom command-expiry safety layer, or independently logged overtemperature interlock was added for this campaign. This limitation is important because a 1500 W heater is a high-power cyber-physical actuator. The discussion therefore distinguishes the protections that were actually implemented from the protections recommended for unattended deployment. ESP-IDF documents interrupt and task watchdog mechanisms for the ESP32-S3 platform. The main hardware components, operating parameters, sensor placement, and implemented protection measures are summarized in Table 1.
Table 1.
Hardware and experimental implementation.
2.4. Local Hysteresis Control
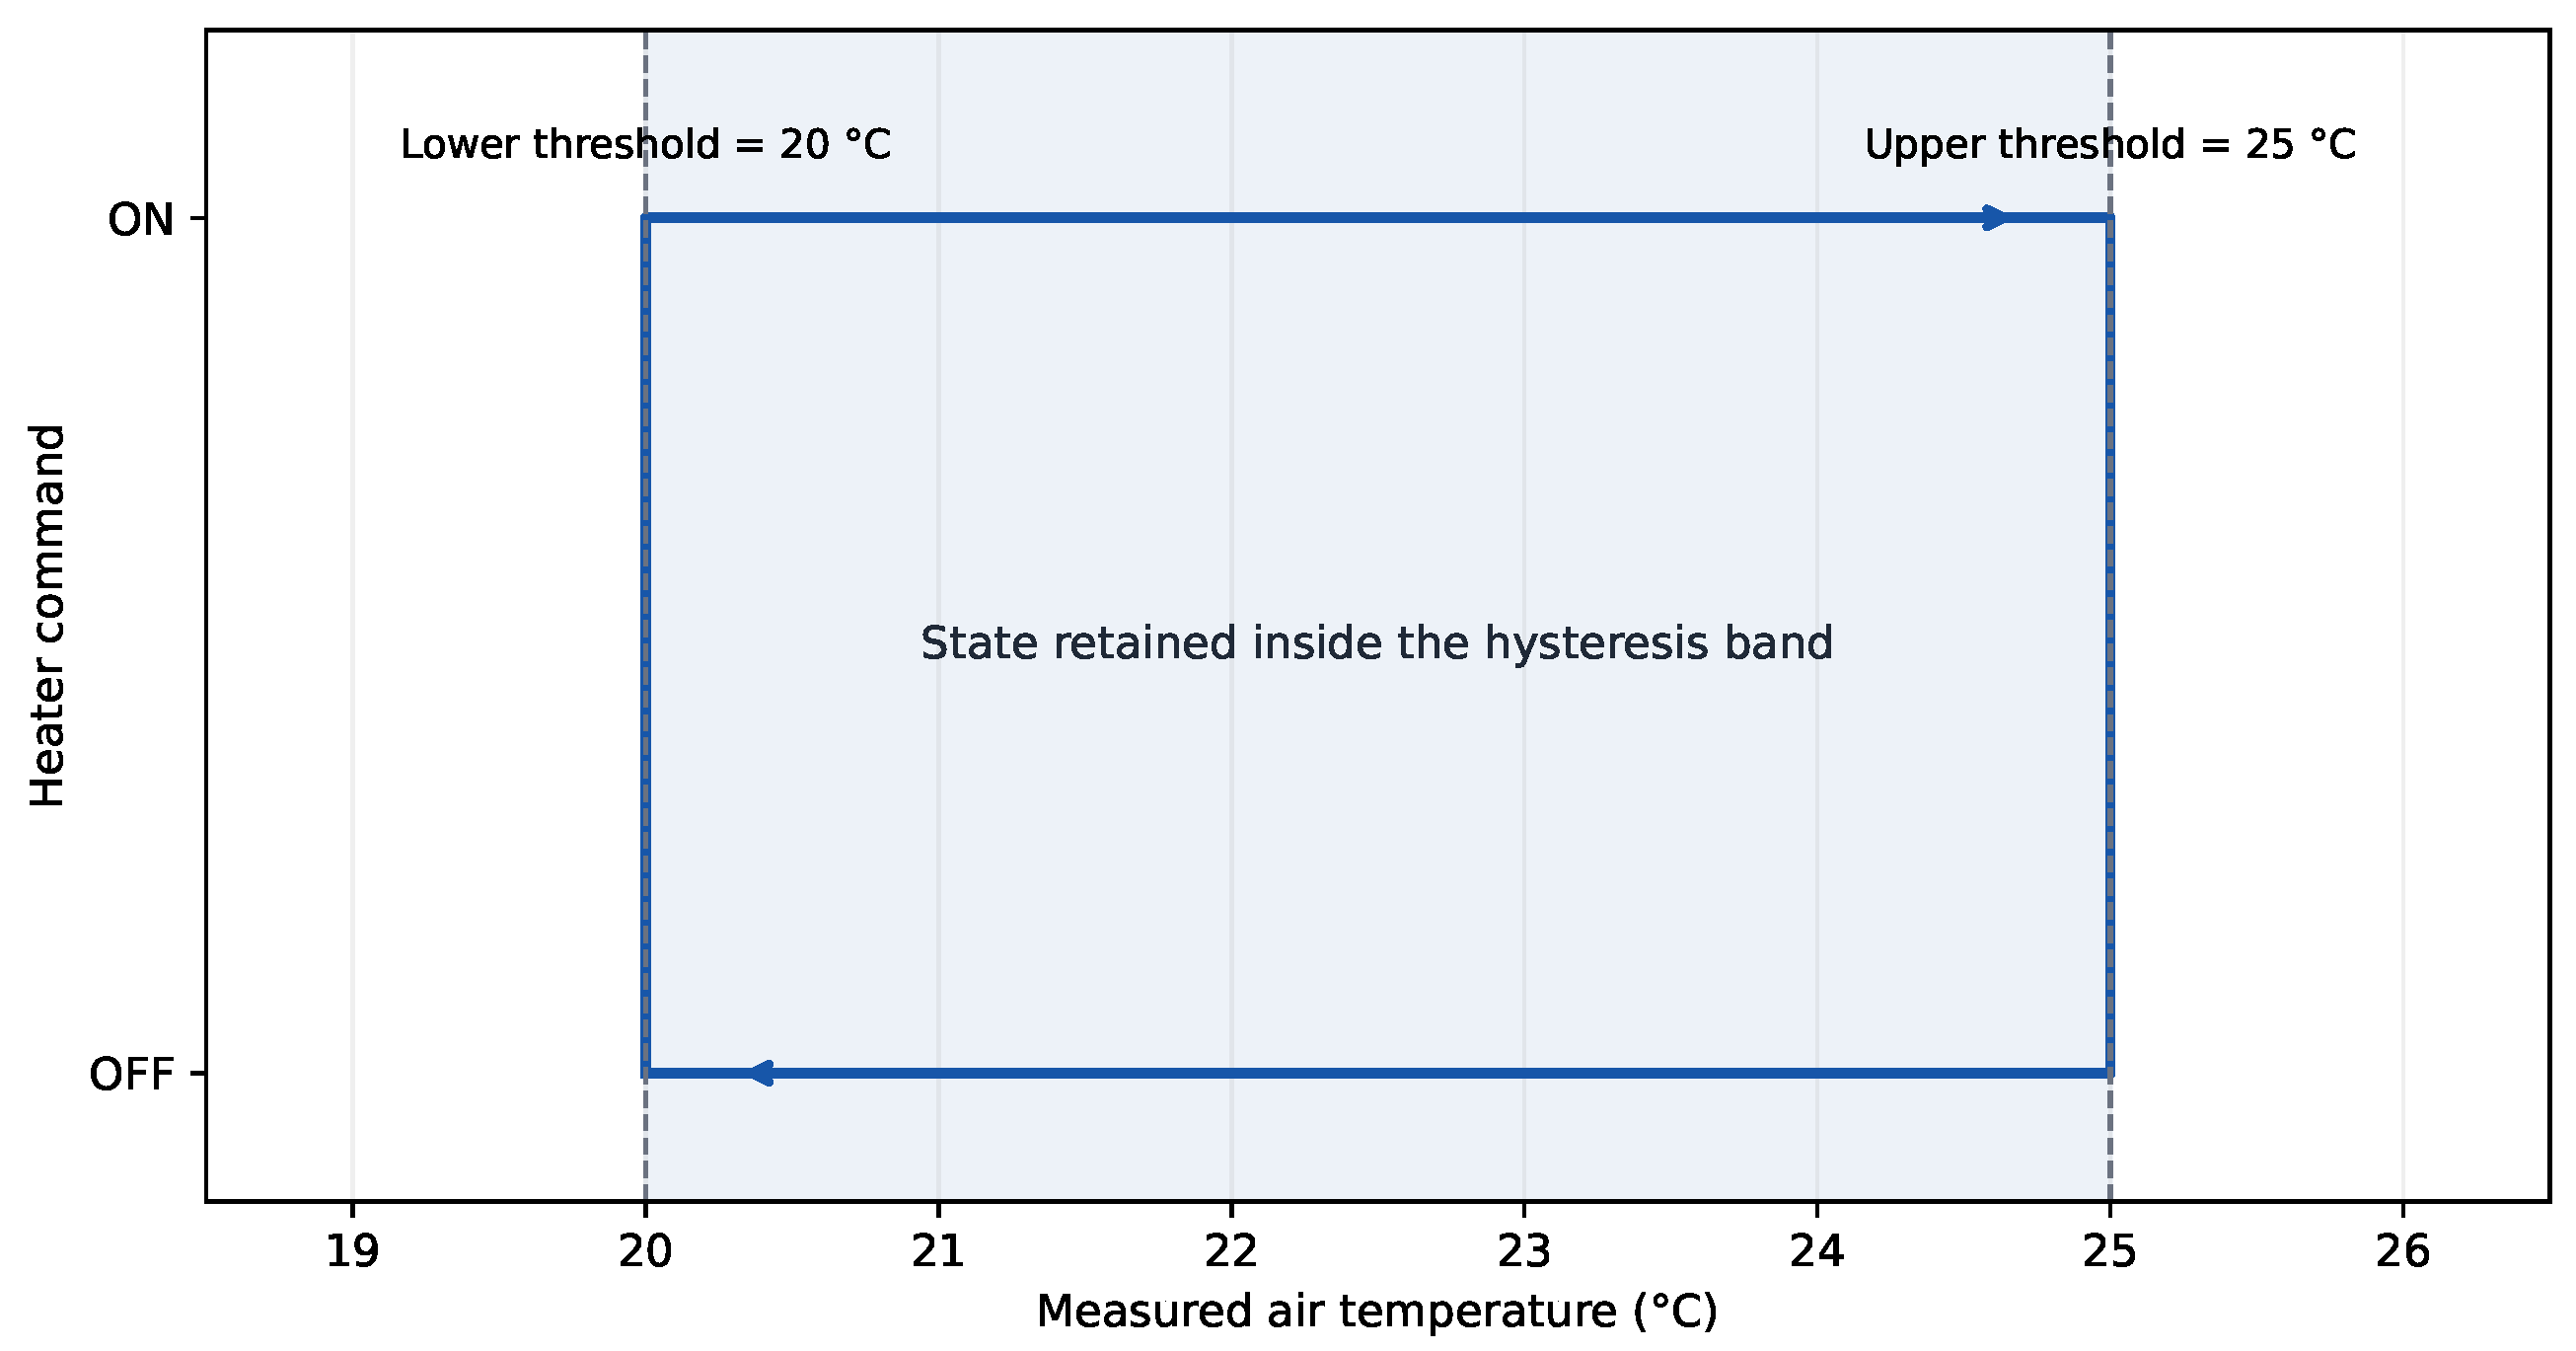
In automatic mode the local controller applies a two-threshold hysteresis law. Let and . The commanded heater state is
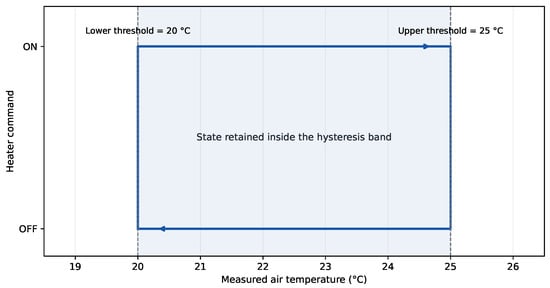
This implementation avoids rapid relay chatter inside the five-degree band. The conceptual switching path is shown in Figure 2. In manual mode the user can explicitly set the commanded state through the supervisory interface.
Figure 2.
Implemented local ON/OFF hysteresis with the actual automatic thresholds used in the reported tests.
A classical settling-time metric is not fully representative of this controller because the intended steady behavior is a limit cycle between switching thresholds rather than convergence to a single setpoint. The quantitative analysis therefore reports ON-transition temperature, OFF-transition temperature, heating interval, cooling interval, overshoot beyond 25 °C, and undershoot below 20 °C.
2.5. Communication Protocols, Sampling, and Synchronization
Stations 2 and 3 communicate with the master using ESP-NOW. The master connects to Node-RED through HTTP over local Wi-Fi, and Node-RED exchanges data with ThingSpeak using MQTT. Because ESP-NOW shares the 2.4 GHz Wi-Fi radio environment, coexistence and indoor interference remain relevant considerations for future reliability testing [31]. ThingSpeak maintains per-station channels containing temperature, relative humidity, reported heater state, control mode, and command-related fields. MathWorks documents a 15 s minimum message-update interval for the free ThingSpeak option; the embedded acquisition/transmission cycle was configured at 15 s accordingly.
The exported cloud datasets reveal that accepted temperature/humidity records during the selected automatic-control windows were typically separated by approximately 30–31 s. This observed persistence interval is reported independently from the embedded 15 s acquisition/transmission configuration. It must not be interpreted as a 50% packet-loss result because the experiment did not record ESP-NOW send/receive counters, retransmissions, or end-to-end timestamps. Application-layer aggregation, cloud-write scheduling, intermediate control messages, and other unlogged events can affect the number of persisted records.
ThingSpeak timestamps provide a common cloud-side time base. Missing temperature or humidity rows are excluded from thermal calculations. State-only messages are retained for control-transition timing. When a heater-state transition is recorded without a simultaneous valid temperature value, the transition temperature is assigned from the first valid temperature record occurring within the following 45 s. This procedure makes the cloud telemetry analysis reproducible, but it is still not equivalent to an electrical contact measurement of the relay. The communication paths, protocols, directions, and level of experimental evidence available for each system layer are summarized in Table 2.
Table 2.
Communication paths and evidence available in the present campaign.
2.6. Derived Environmental Quantities
The analytical layer retains only quantities whose interpretation is consistent with the measured inputs. Dew point is calculated with the Magnus approximation,
where and . Vapor-pressure deficit is calculated as
These quantities are used for descriptive visualization rather than comfort certification. Heat Index is calculated through the NWS/Rothfusz implementation used in the project code, including its lower-temperature branch and humidity adjustments. The full regression in degrees Fahrenheit is
where , followed by conversion back to degrees Celsius. The NWS severity breakpoints near 80, 90, 103, and 125 °F (approximately 26.7, 32.2, 39.4, and 51.7 °C) are used only as an ordinal heat-screening reference [32]. Heat Index is not interpreted as a replacement for ISO occupational heat-stress assessment.
2.7. Fuzzy Heat-Risk Screening
The fuzzy model was intentionally simplified after examining the redundancy and applicability of the previous eight-input structure. Estimated WBGT, Discomfort Index, PMV, and PPD are not inputs to the updated decision layer. The HeatRiskScore uses only three roles: current Heat Index , the change of Heat Index relative to the preceding five minutes, and the fraction of valid samples during the preceding 15 min for which C. The latter two variables introduce temporal information that is absent from a simple instantaneous Heat-Index threshold classifier.
The five-minute trend is
and the 15 min hot-sample fraction is
Actual timestamps are used rather than assuming a fixed number of samples, which avoids bias when cloud persistence intervals vary.
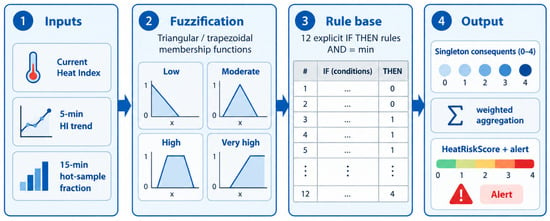
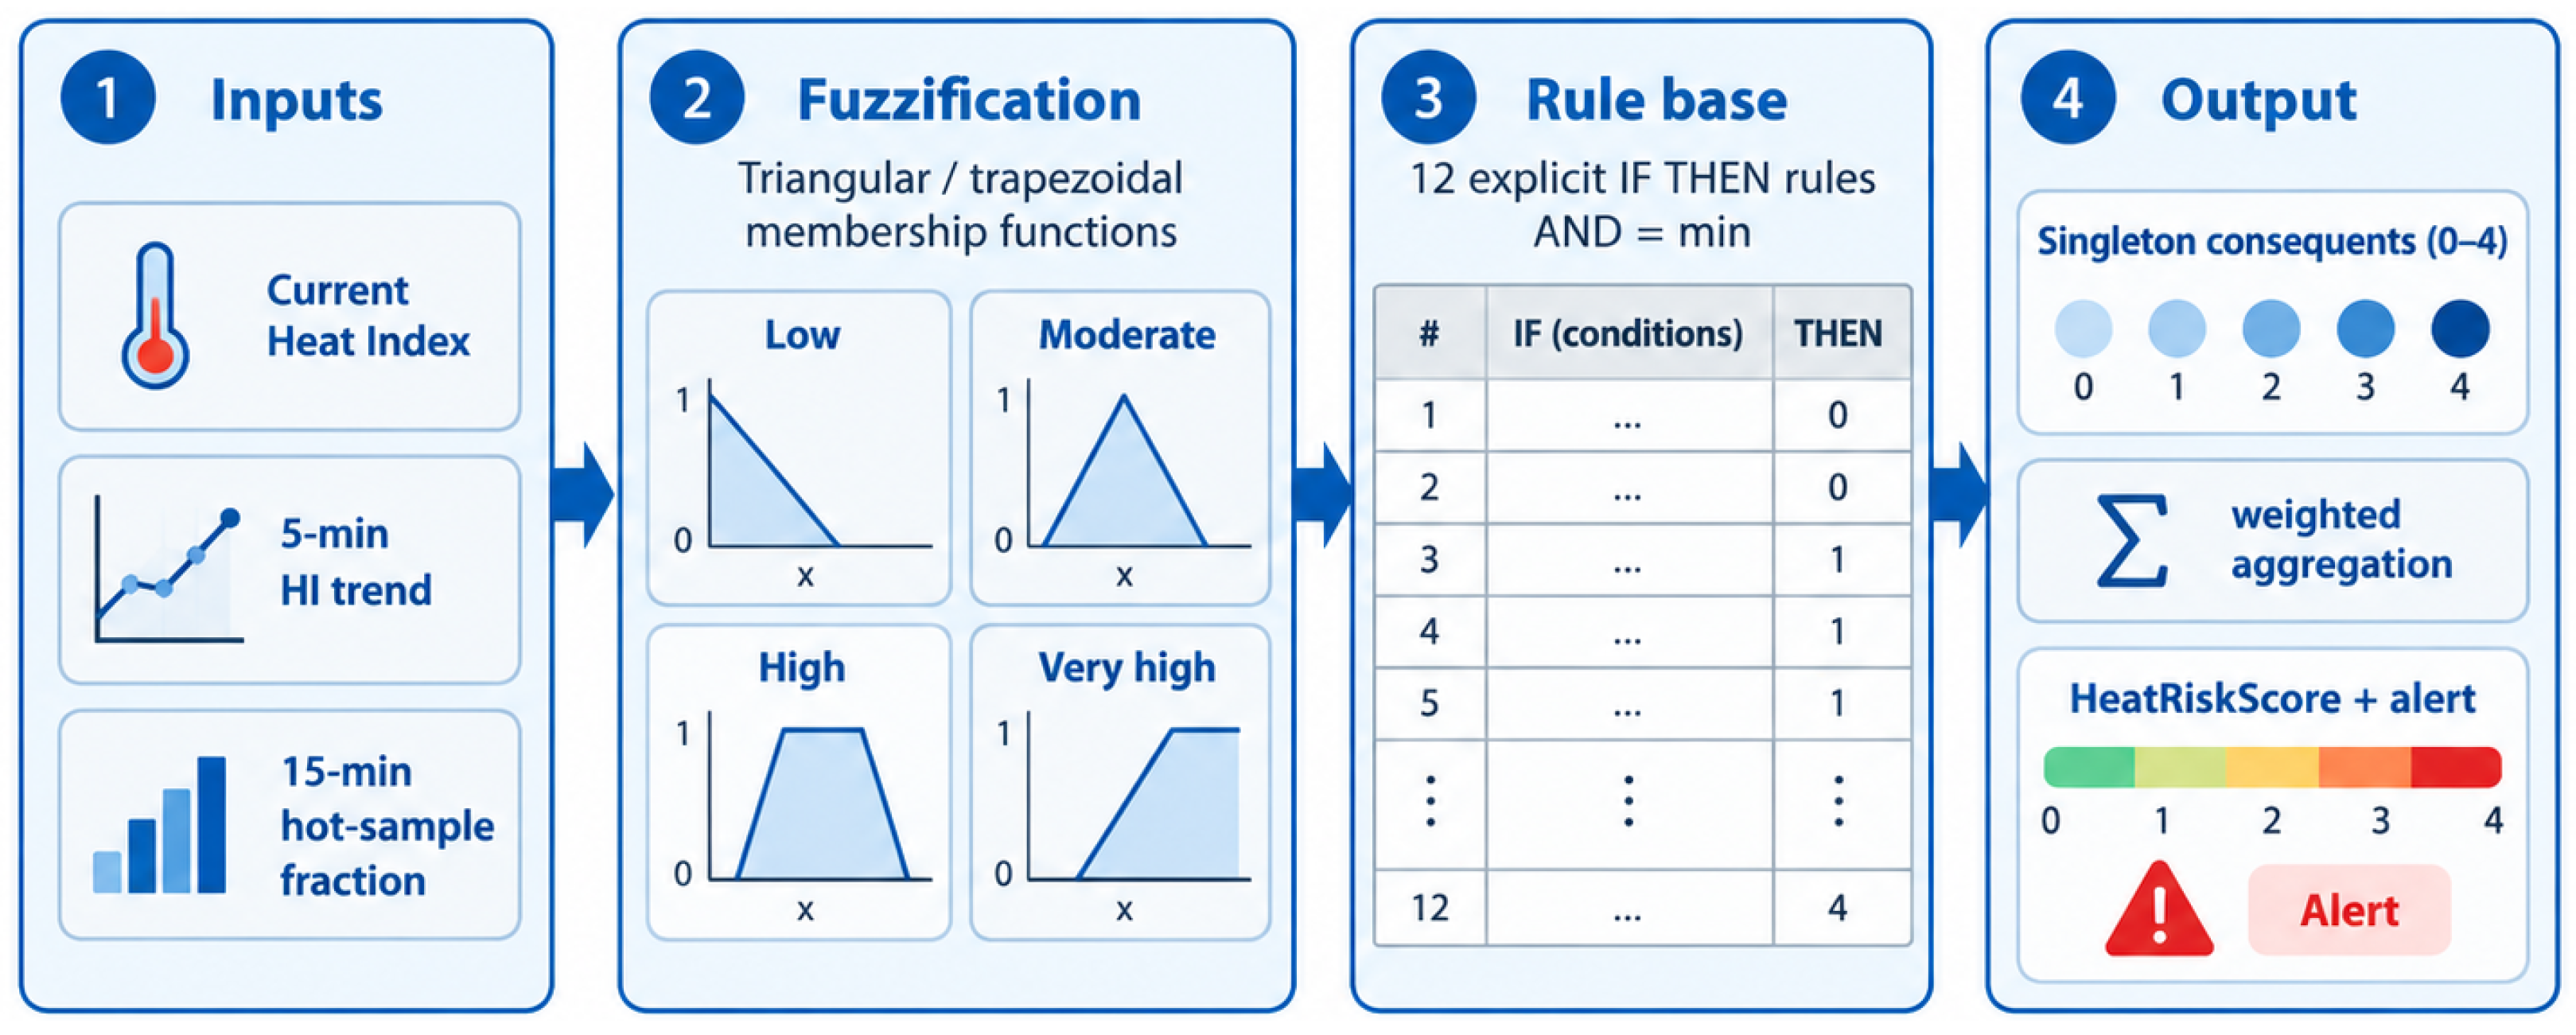
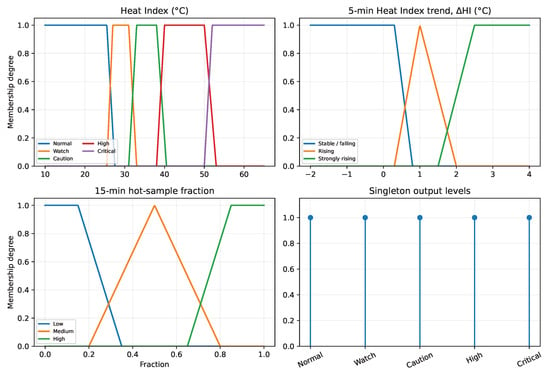
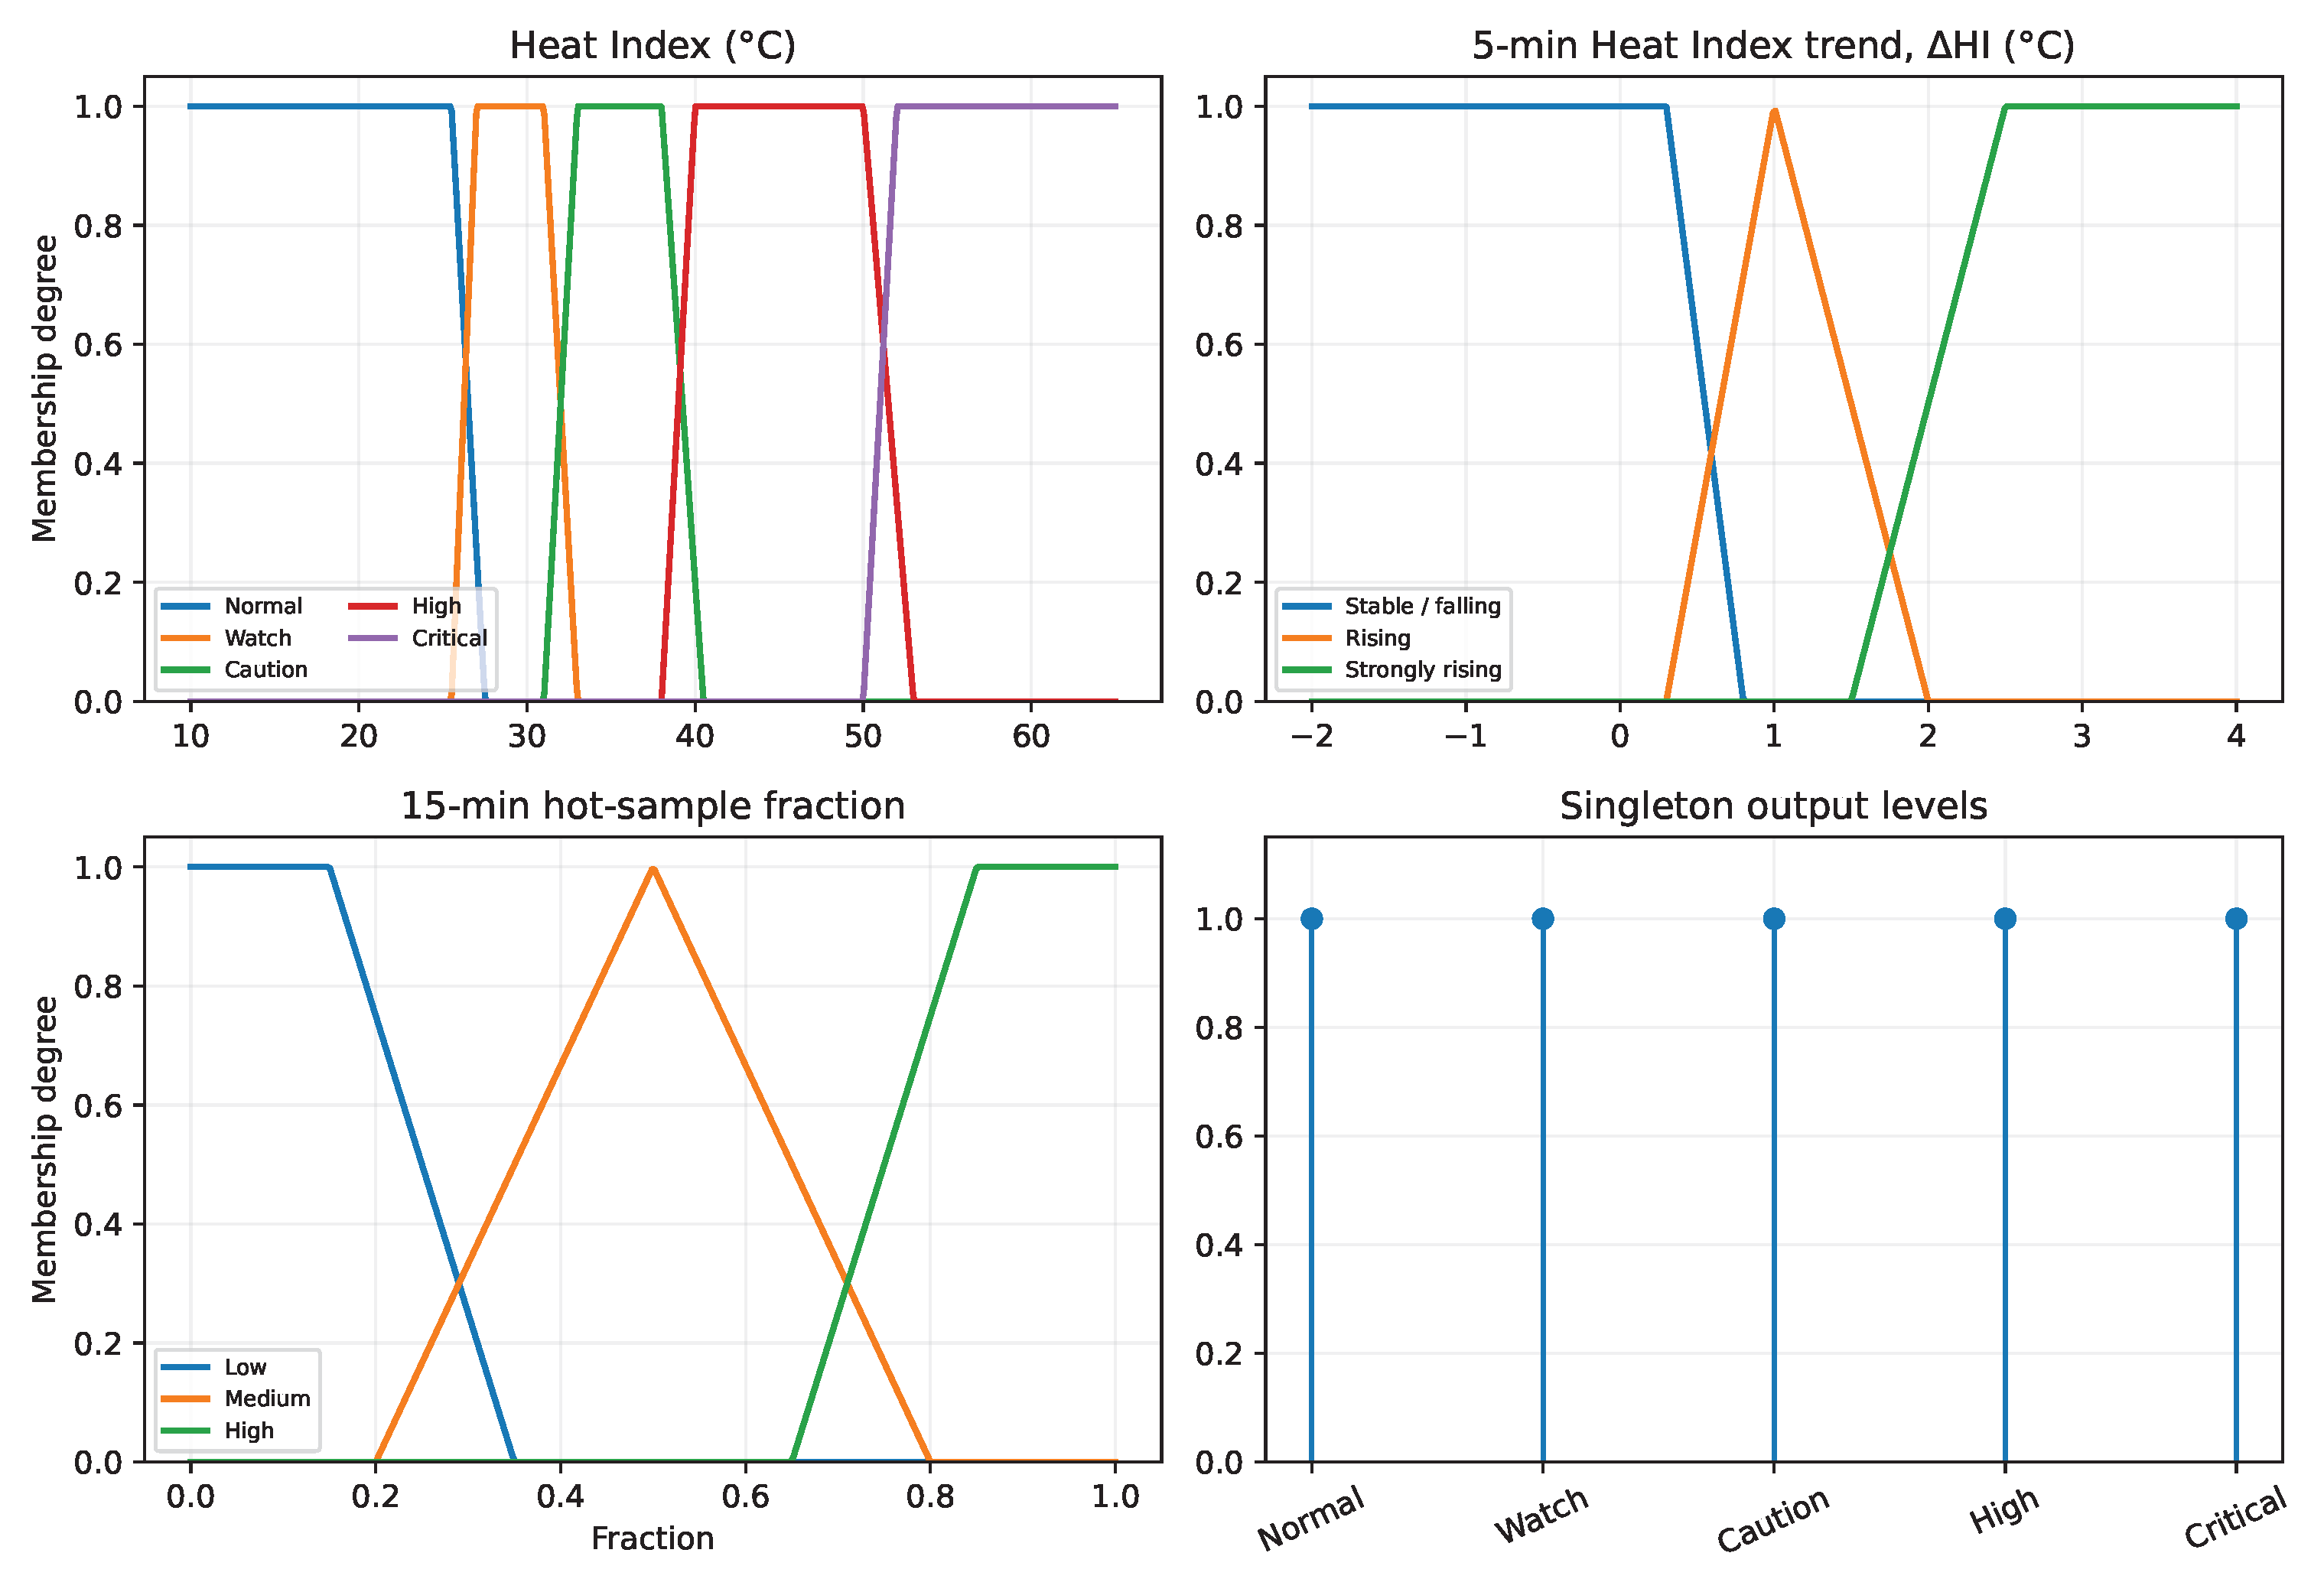
The inference flow is shown in Figure 3, and the numerical membership functions are shown in Figure 4. For every rule i, the antecedent activation is . All multi-condition rules in the rule base use logical AND implemented by the minimum operator; no semicolon-separated condition is interpreted ambiguously as OR. Each rule has a singleton consequent . The output is
Figure 3.
Fuzzy heat-screening procedure.
Figure 4.
Membership functions and singleton outputs of the updated three-input HeatRiskScore.
The weighted average resolves conflicts when several rules are active and normalizes by total activation. The base Heat-Index memberships cover the intended analysis domain. If numerical clipping or an out-of-domain condition nevertheless produces zero total activation, the fallback is the direct ordinal Heat-Index baseline rather than an arbitrary zero-risk output. The complete set of fuzzy rules and their singleton consequents is reported in Table 3. The numerical definitions of the membership functions used for the three inputs and the output singletons are summarized in Table 4.
Table 3.
Twelve-rule fuzzy base. All compound antecedents use AND = min.
Table 4.
Membership functions used by the fuzzy model.
The fuzzy thresholds are an engineering screening design anchored to the NWS Heat-Index severity progression and deliberately augmented with temporal context. They are not occupational exposure limits. The output is named HeatRiskScore to avoid implying symmetric hot/cold comfort classification. Cold discomfort is outside the stated output domain.
2.8. Experimental Datasets and Hysteresis-Performance Extraction
Three cloud-exported CSV files were analyzed: the master channel (Station 1), Slave 1 (Station 2), and Slave 2 (Station 3). For each station, the most informative window showing sustained repeated automatic cycling was selected independently from the available telemetry. The selected windows were not required to correspond to the same calendar day, which avoided interpolating or fabricating missing test periods.
Automatic-control intervals were identified from the mode field. Heater-state transitions were obtained from the reported heater-state field. Temperature and RH rows containing missing values were excluded from thermal calculations, while state-only rows were retained for transition timing. If a state transition contained no simultaneous valid temperature, the first valid measurement within 45 s was assigned to that event. For each station, the following metrics were calculated: number of reported ON and OFF transitions, mean and standard deviation of transition temperature, 95% confidence interval of the mean transition temperature, mean heating interval from ON to the next OFF command, mean cooling interval from OFF to the next ON command, maximum overshoot above 25 °C, maximum undershoot below 20 °C, valid cloud-record fraction, and median cloud inter-record interval.
The reported heater-state channel is synchronized at the cloud application level, but no independent voltage/current sensing was installed at the relay contact. Therefore, the paper uses the terms reported heater state and reported transition. These data provide stronger controller evidence than temperature alone but still do not prove the electrical contact state independently.
2.9. Baseline Comparison and Internal Behavioral Verification
A simple instantaneous Heat-Index classifier was selected as the baseline because it represents the minimum decision layer needed to reproduce the four NWS severity boundaries. Eighteen synthetic environmental scenarios combine C with . For each scenario, the instantaneous baseline class is compared with the fuzzy HeatRiskScore under stable trend and low recent heat exposure. The same scenarios are then evaluated with high recent hot-sample fraction and with combined high recent heat plus rising trend.
This procedure is an internal behavioral verification, not external validation. HI is an input to the fuzzy model; therefore, agreement with an HI baseline cannot demonstrate external validity. Its purpose is instead to answer a narrower automation question: does the fuzzy layer reduce to the expected instantaneous severity when temporal context is benign, and does it provide a defined escalation when recent temporal context worsens? No p-value is reported because the comparison is deterministic and not an independent inferential-validation experiment.
2.10. Uncertainty Sensitivity and Exploratory PMV/PPD Analysis
Two complementary sensitivity analyses were performed. First, the DHT22 manufacturer accuracy bounds (C and RH) were propagated deterministically through the Heat-Index calculation by evaluating the four corner combinations around every valid automatic-control record. A record was flagged as classification-sensitive if the direct instantaneous Heat-Index class changed anywhere within that rectangular input envelope. This is a datasheet-bound sensitivity analysis rather than a traceable uncertainty budget because calibration bias, covariance, and actual error distributions were not measured.
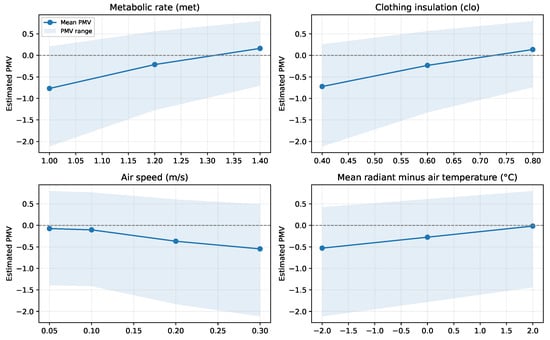
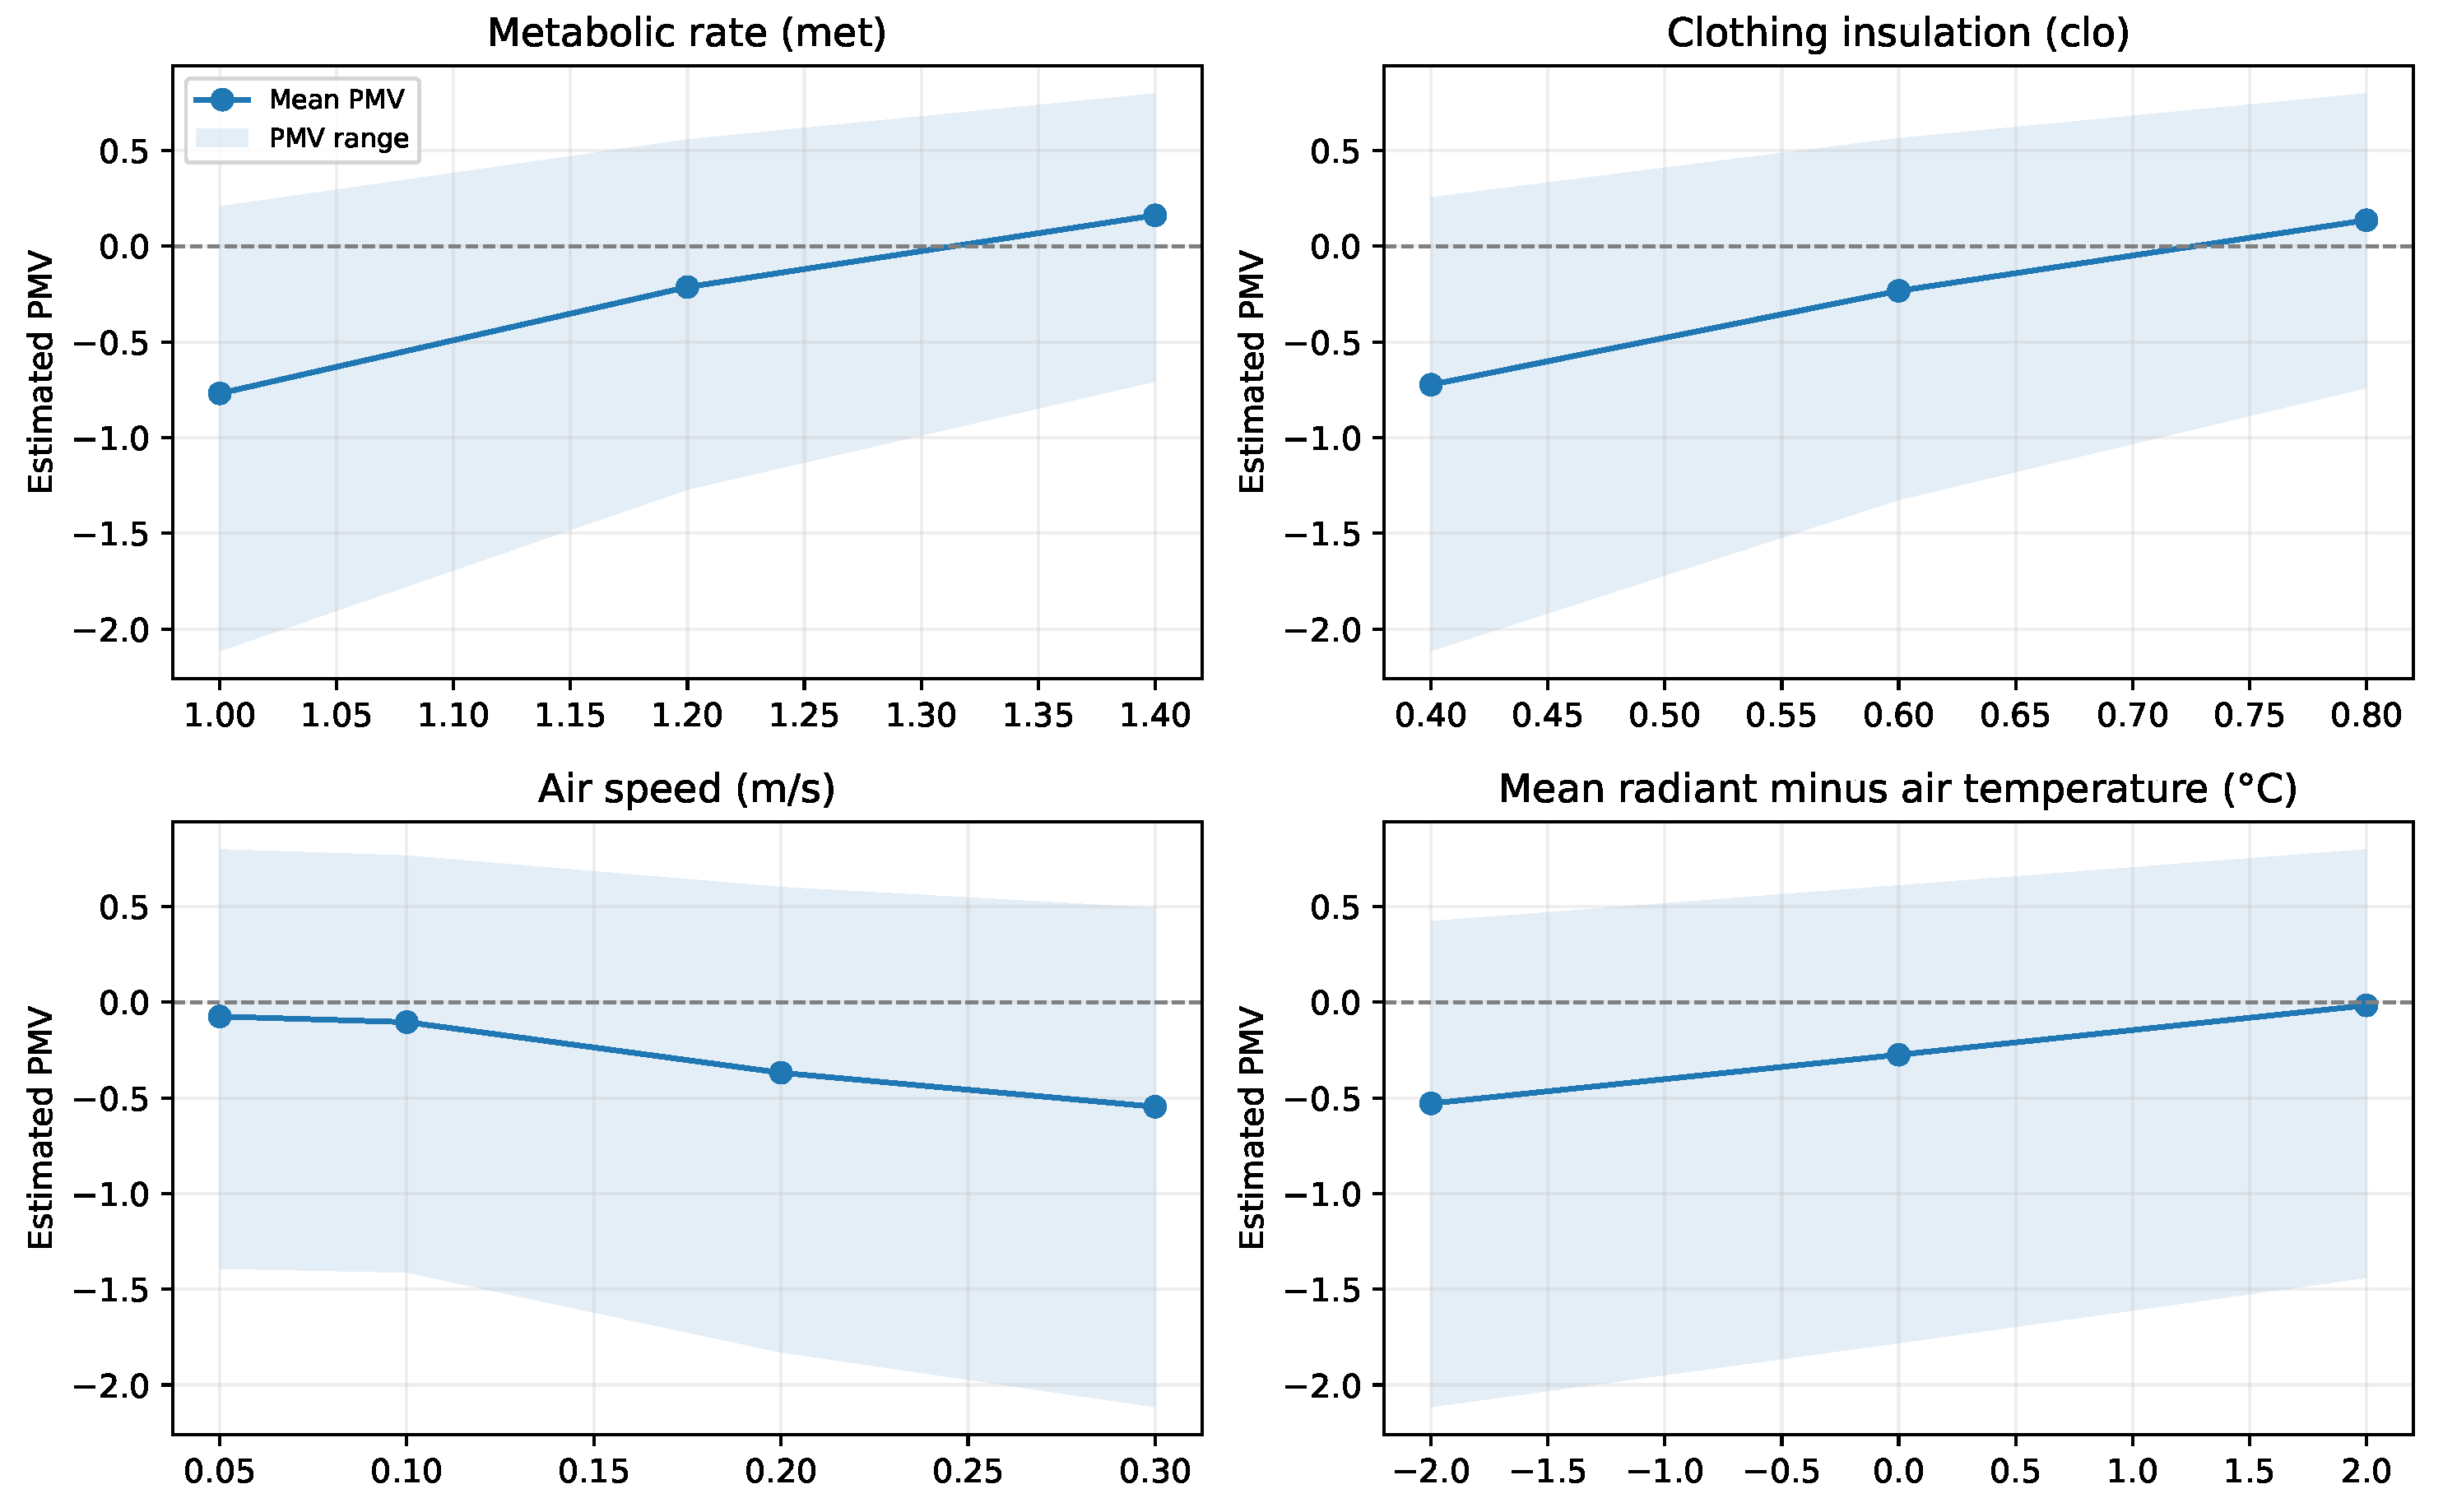
Second, PMV/PPD sensitivity was evaluated only to quantify why those variables were removed from the decision layer. At C and , 108 factorial combinations were generated from metabolic rate met; clothing insulation clo; air speed m/s; and C. PMV and PPD were computed using the standard heat-balance implementation already present in the project analysis code. Because v, , M, and were not measured during the automation tests, this factorial result is interpreted solely as sensitivity to assumptions.
3. Results
3.1. System Implementation
The three stations operated as independent sensing and control units. Station 1 acted as the master gateway and also controlled its local heater. Stations 2 and 3 used ESP-NOW to exchange telemetry and commands with the master. Node-RED presented per-station measurements and control state, while ThingSpeak stored time-stamped channel data. The same architecture supported automatic hysteresis operation and remote manual commands without moving the immediate switching decision to the cloud.
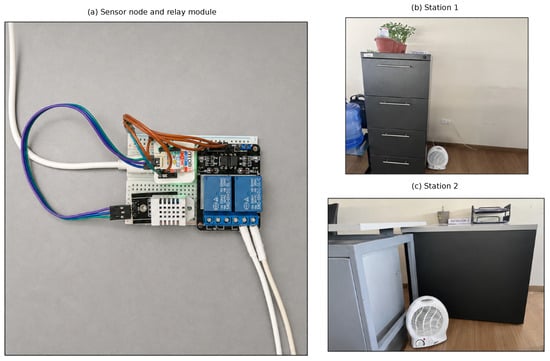
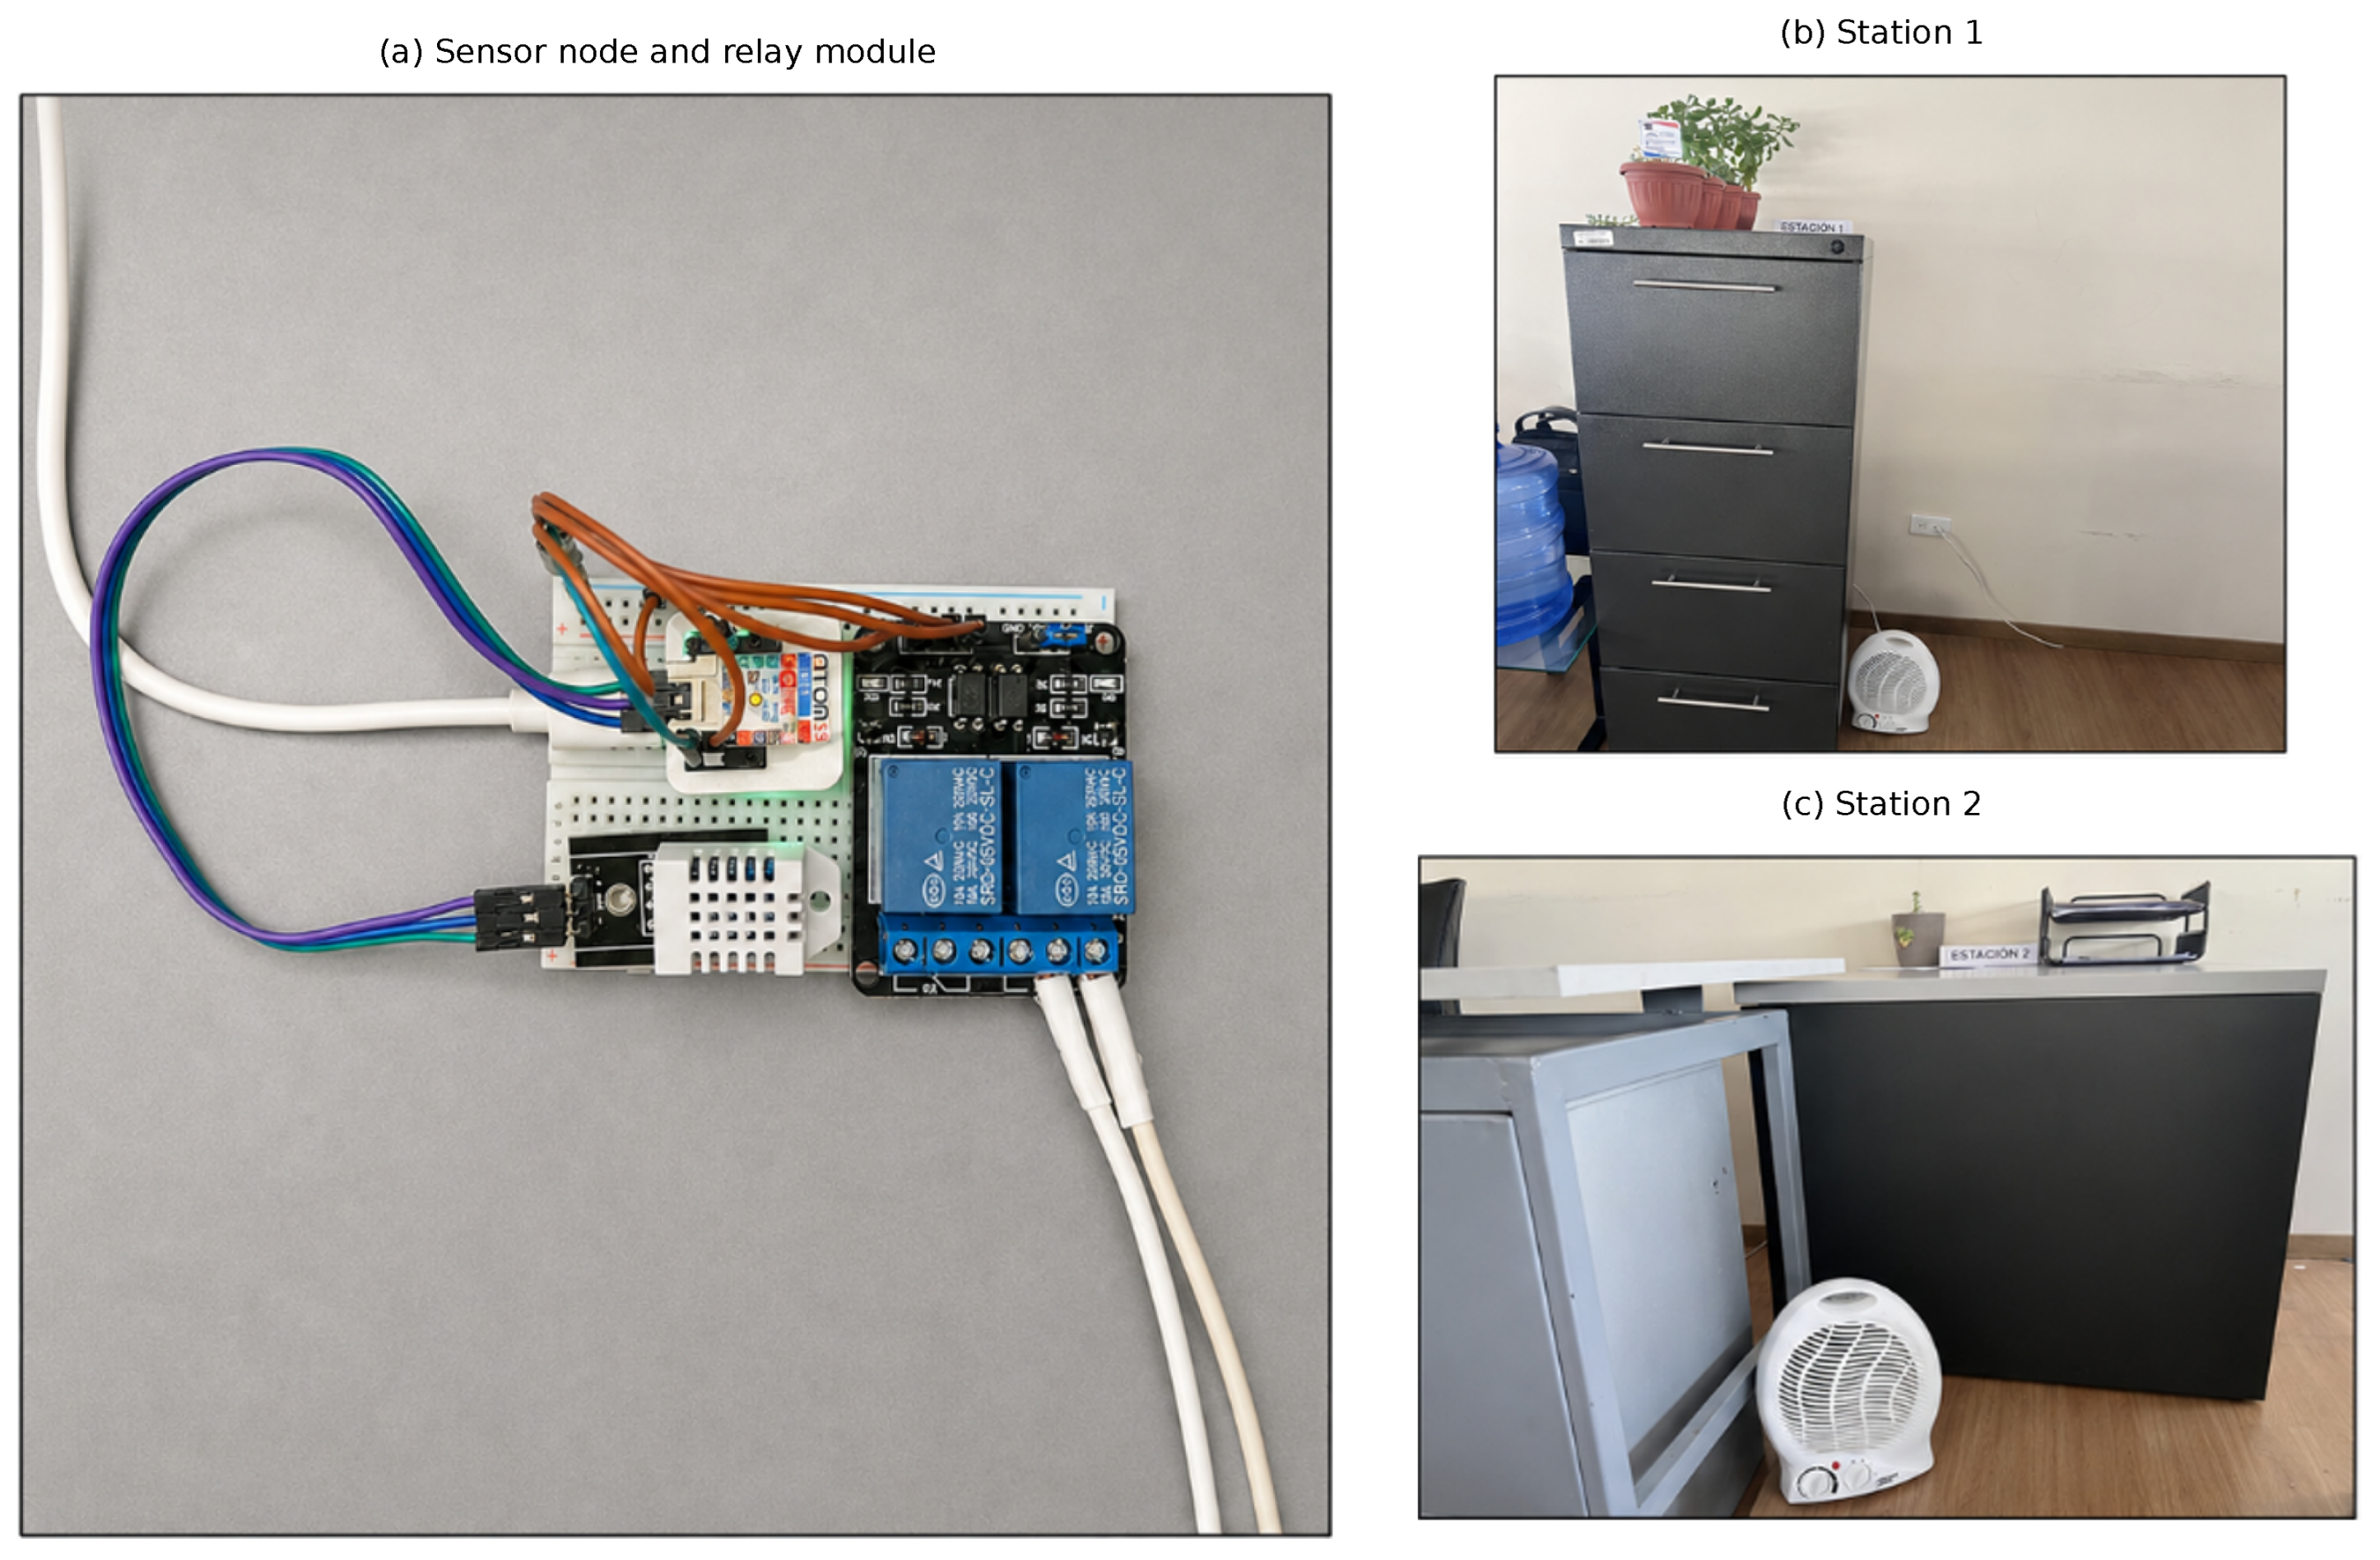
Representative installation photographs are shown in Figure 5. The DHT22 sensors were approximately 0.8 m above floor level and were not placed directly in the heater outlet stream. The tests were supervised and used 1500 W, 110 V heaters.
Figure 5.
Representative prototype hardware and workstation installation.
3.2. Repeated Hysteresis Behavior
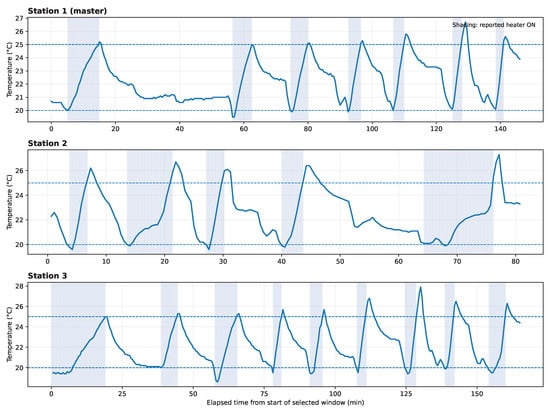
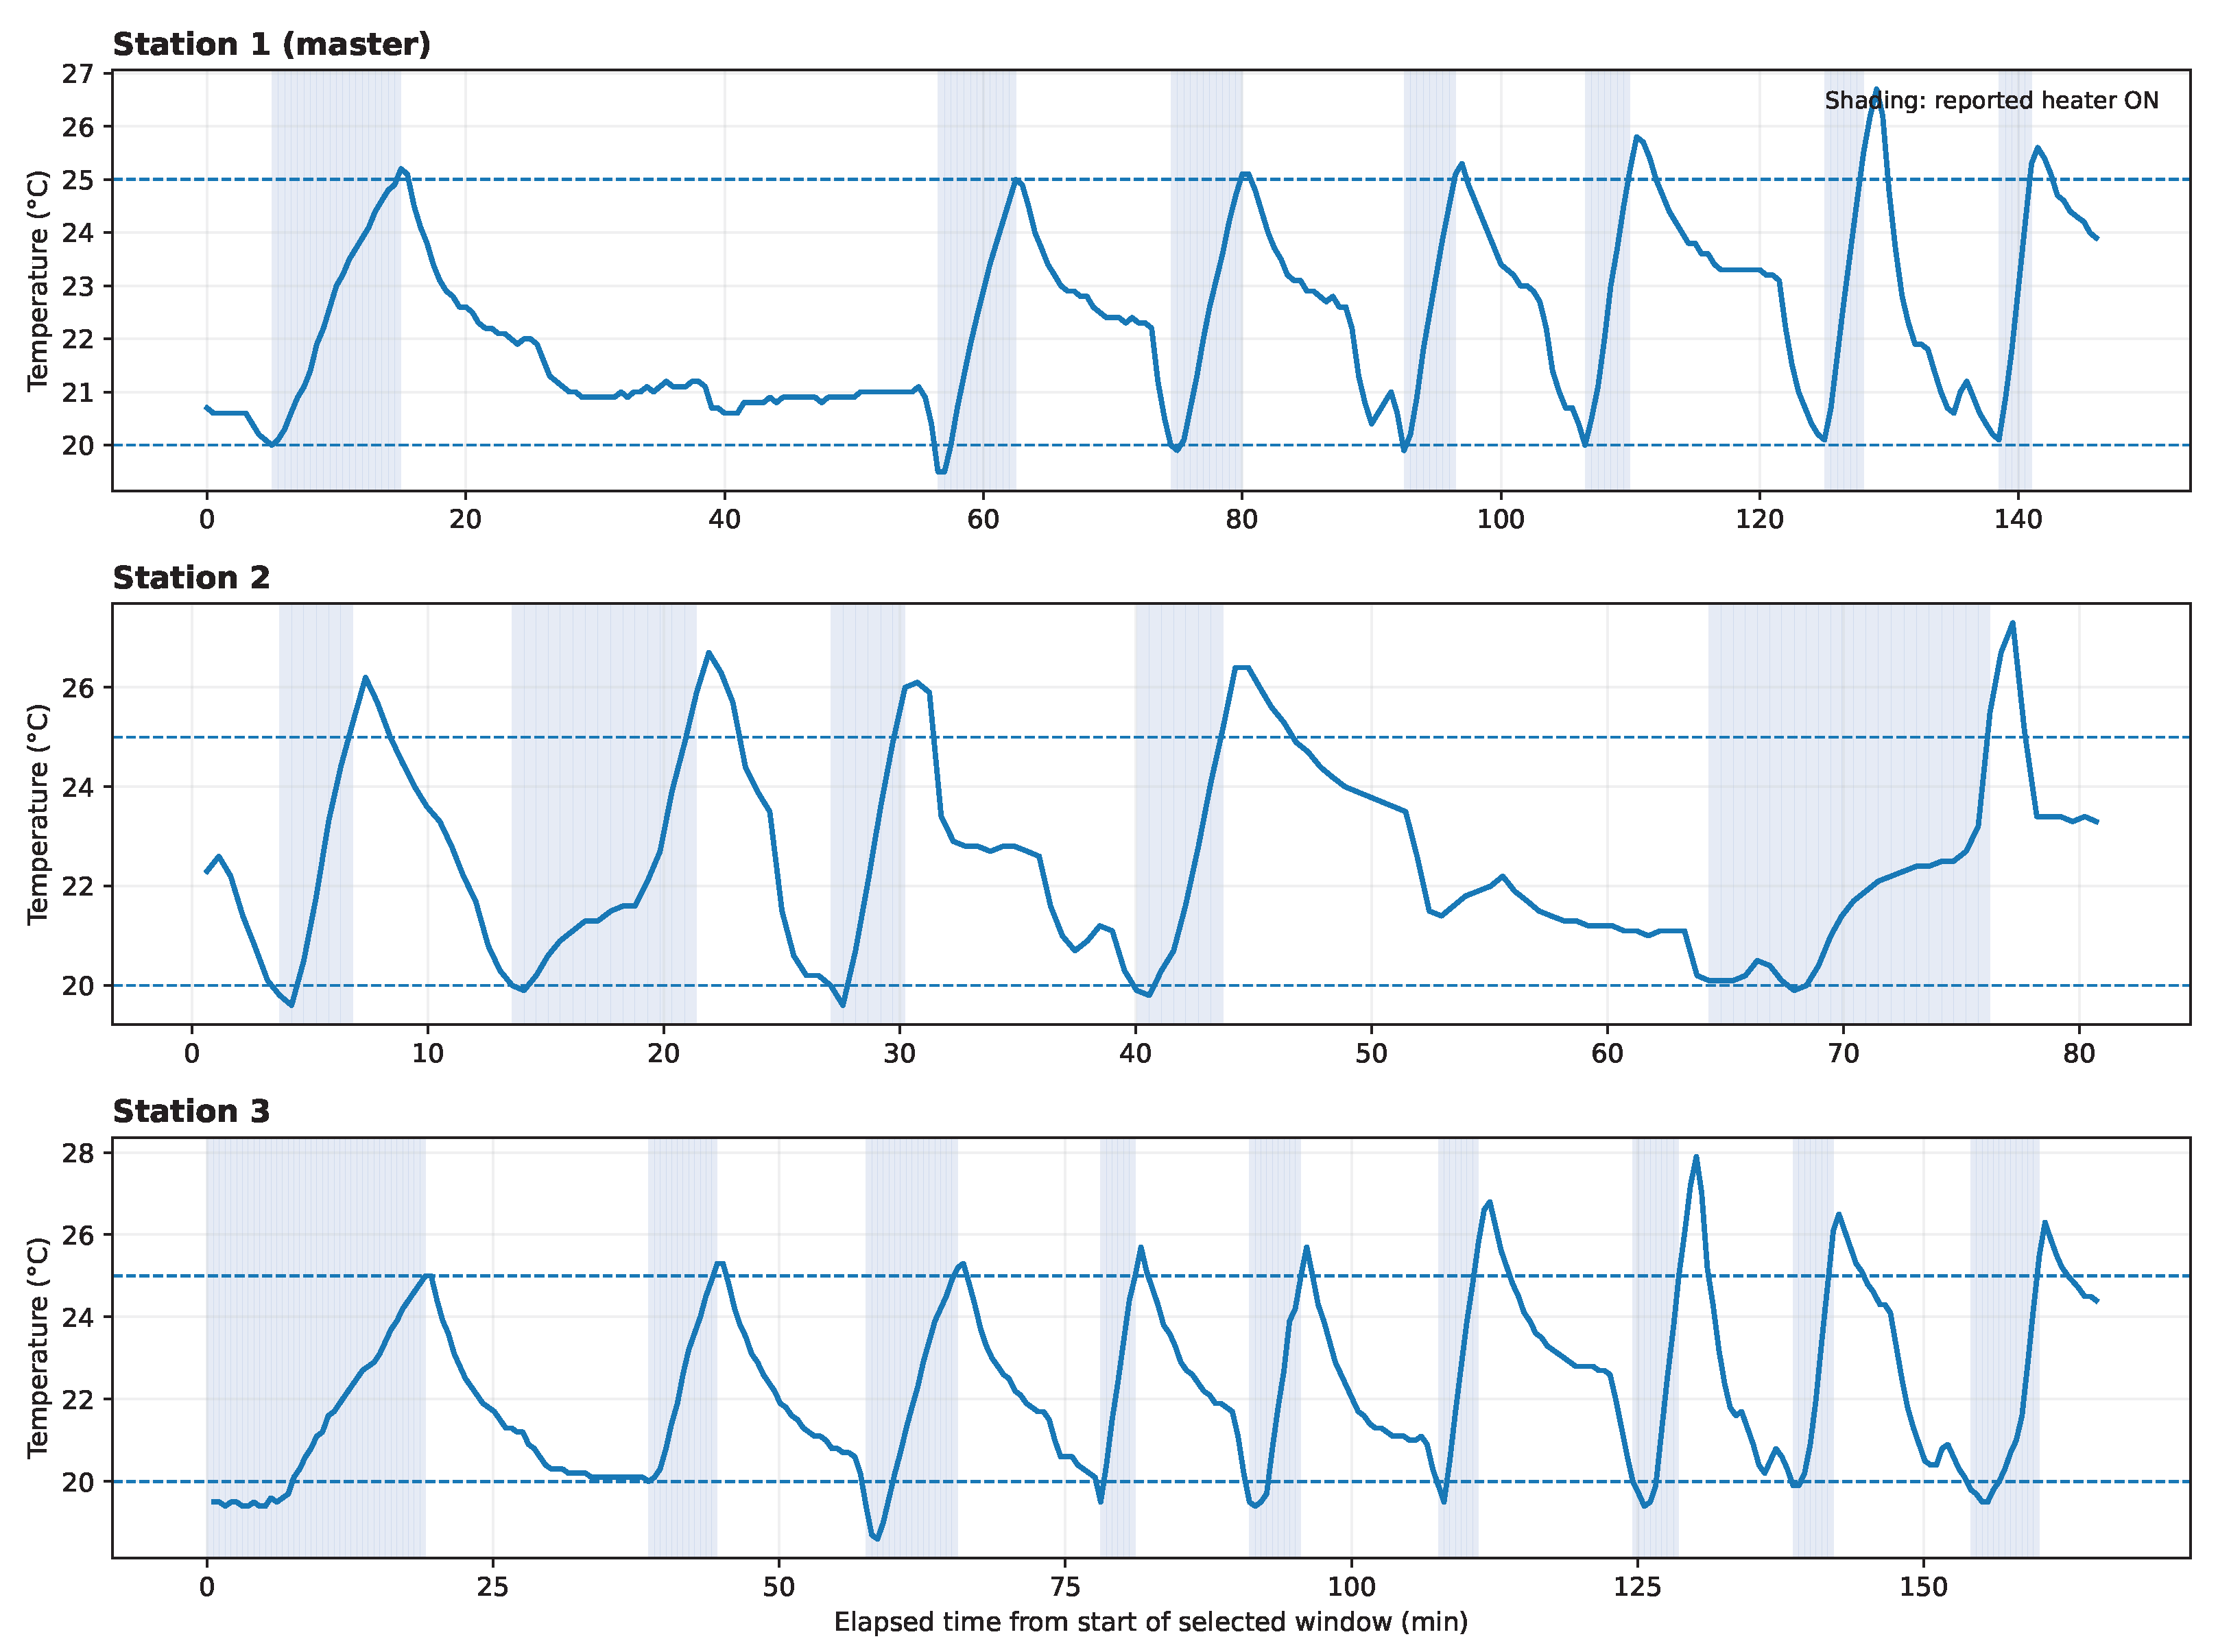
Figure 6 shows representative repeated automatic switching for the three stations using one selected test window per station. Each window was chosen independently as the clearest sustained automatic-cycling sequence available for that station. Blue shading indicates periods in which the cloud-reported heater state was ON. Dashed lines mark the implemented 20 and 25 °C thresholds.
Figure 6.
Repeated automatic hysteresis behavior using selected telemetry windows for the three stations. Blue shading denotes the cloud-reported heater-ON state; dashed lines denote the 20 and 25 °C control thresholds. The horizontal axis shows elapsed time from the beginning of each selected window.
The numerical controller results are summarized in Table 5. Station 1 contained seven ON and seven OFF transitions, Station 2 five of each, and Station 3 nine of each. The mean reported ON-transition temperature was within 0.28 °C of the nominal 20 °C lower threshold for every station. The mean reported OFF transition ranged from 25.20 to 25.58 °C. Across all 21 ON transitions, the pooled mean was 19.85 °C with a standard deviation of 0.23 °C; across all 21 OFF transitions, the pooled mean was 25.34 °C with a standard deviation of 0.35 °C.
Table 5.
Repeated hysteresis performance derived from reported heater-state transitions.
The 95% confidence intervals for the mean ON/OFF transition temperatures were 19.75–20.13/25.05–25.35 °C for Station 1, 19.82–20.10/25.14–26.02 °C for Station 2, and 19.53–19.91/25.01–25.63 °C for Station 3. The overshoot values reflect residual heat delivery and sensor/air thermal inertia after the reported OFF event. Station 3 exhibited the largest observed overshoot, 2.9 °C, indicating that actuator power, heater thermal inertia, sensor placement, and local airflow should be considered when selecting hysteresis limits.
These repeated tests provide quantitative evidence that the reported control state changes near the programmed thresholds, which was not available in the earlier single-trajectory analysis. Nevertheless, the result remains one level below a direct hardware validation: the relay contacts were not independently instrumented with voltage/current sensing. Consequently, duty cycle and switching statistics are reported from the channel state rather than described as electrically verified relay events.
3.3. Application-Level Data Continuity
During the selected automatic-control windows, valid temperature/RH data represented 99.85% of Station 1 records, 99.54% of Station 2 records, and 99.85% of Station 3 records. The median cloud inter-record intervals were 30, 31, and 30 s, respectively; the 95th-percentile intervals were 31, 33, and 31 s. These values demonstrate high continuity of accepted cloud records during the selected tests.
This result is intentionally labelled application-level data continuity, not communication reliability. The 15 s acquisition/transmission configuration and the approximately 30 s cloud persistence interval are different layers of the system. Without sequence counters at each ESP-NOW sender and receiver, it is impossible to determine whether any missing cloud write originated from radio loss, gateway scheduling, application aggregation, or cloud-side timing. Thus, no ESP-NOW packet-loss percentage or end-to-end latency is claimed.
3.4. Derived Indicators and HeatRiskScore
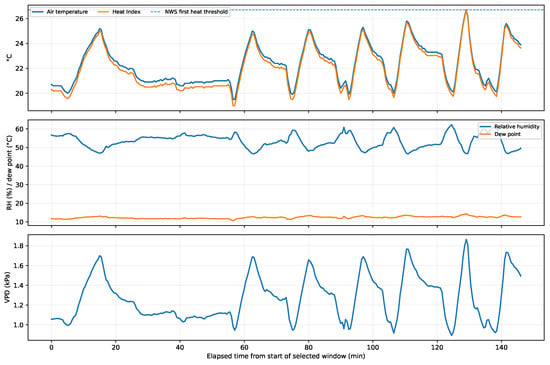
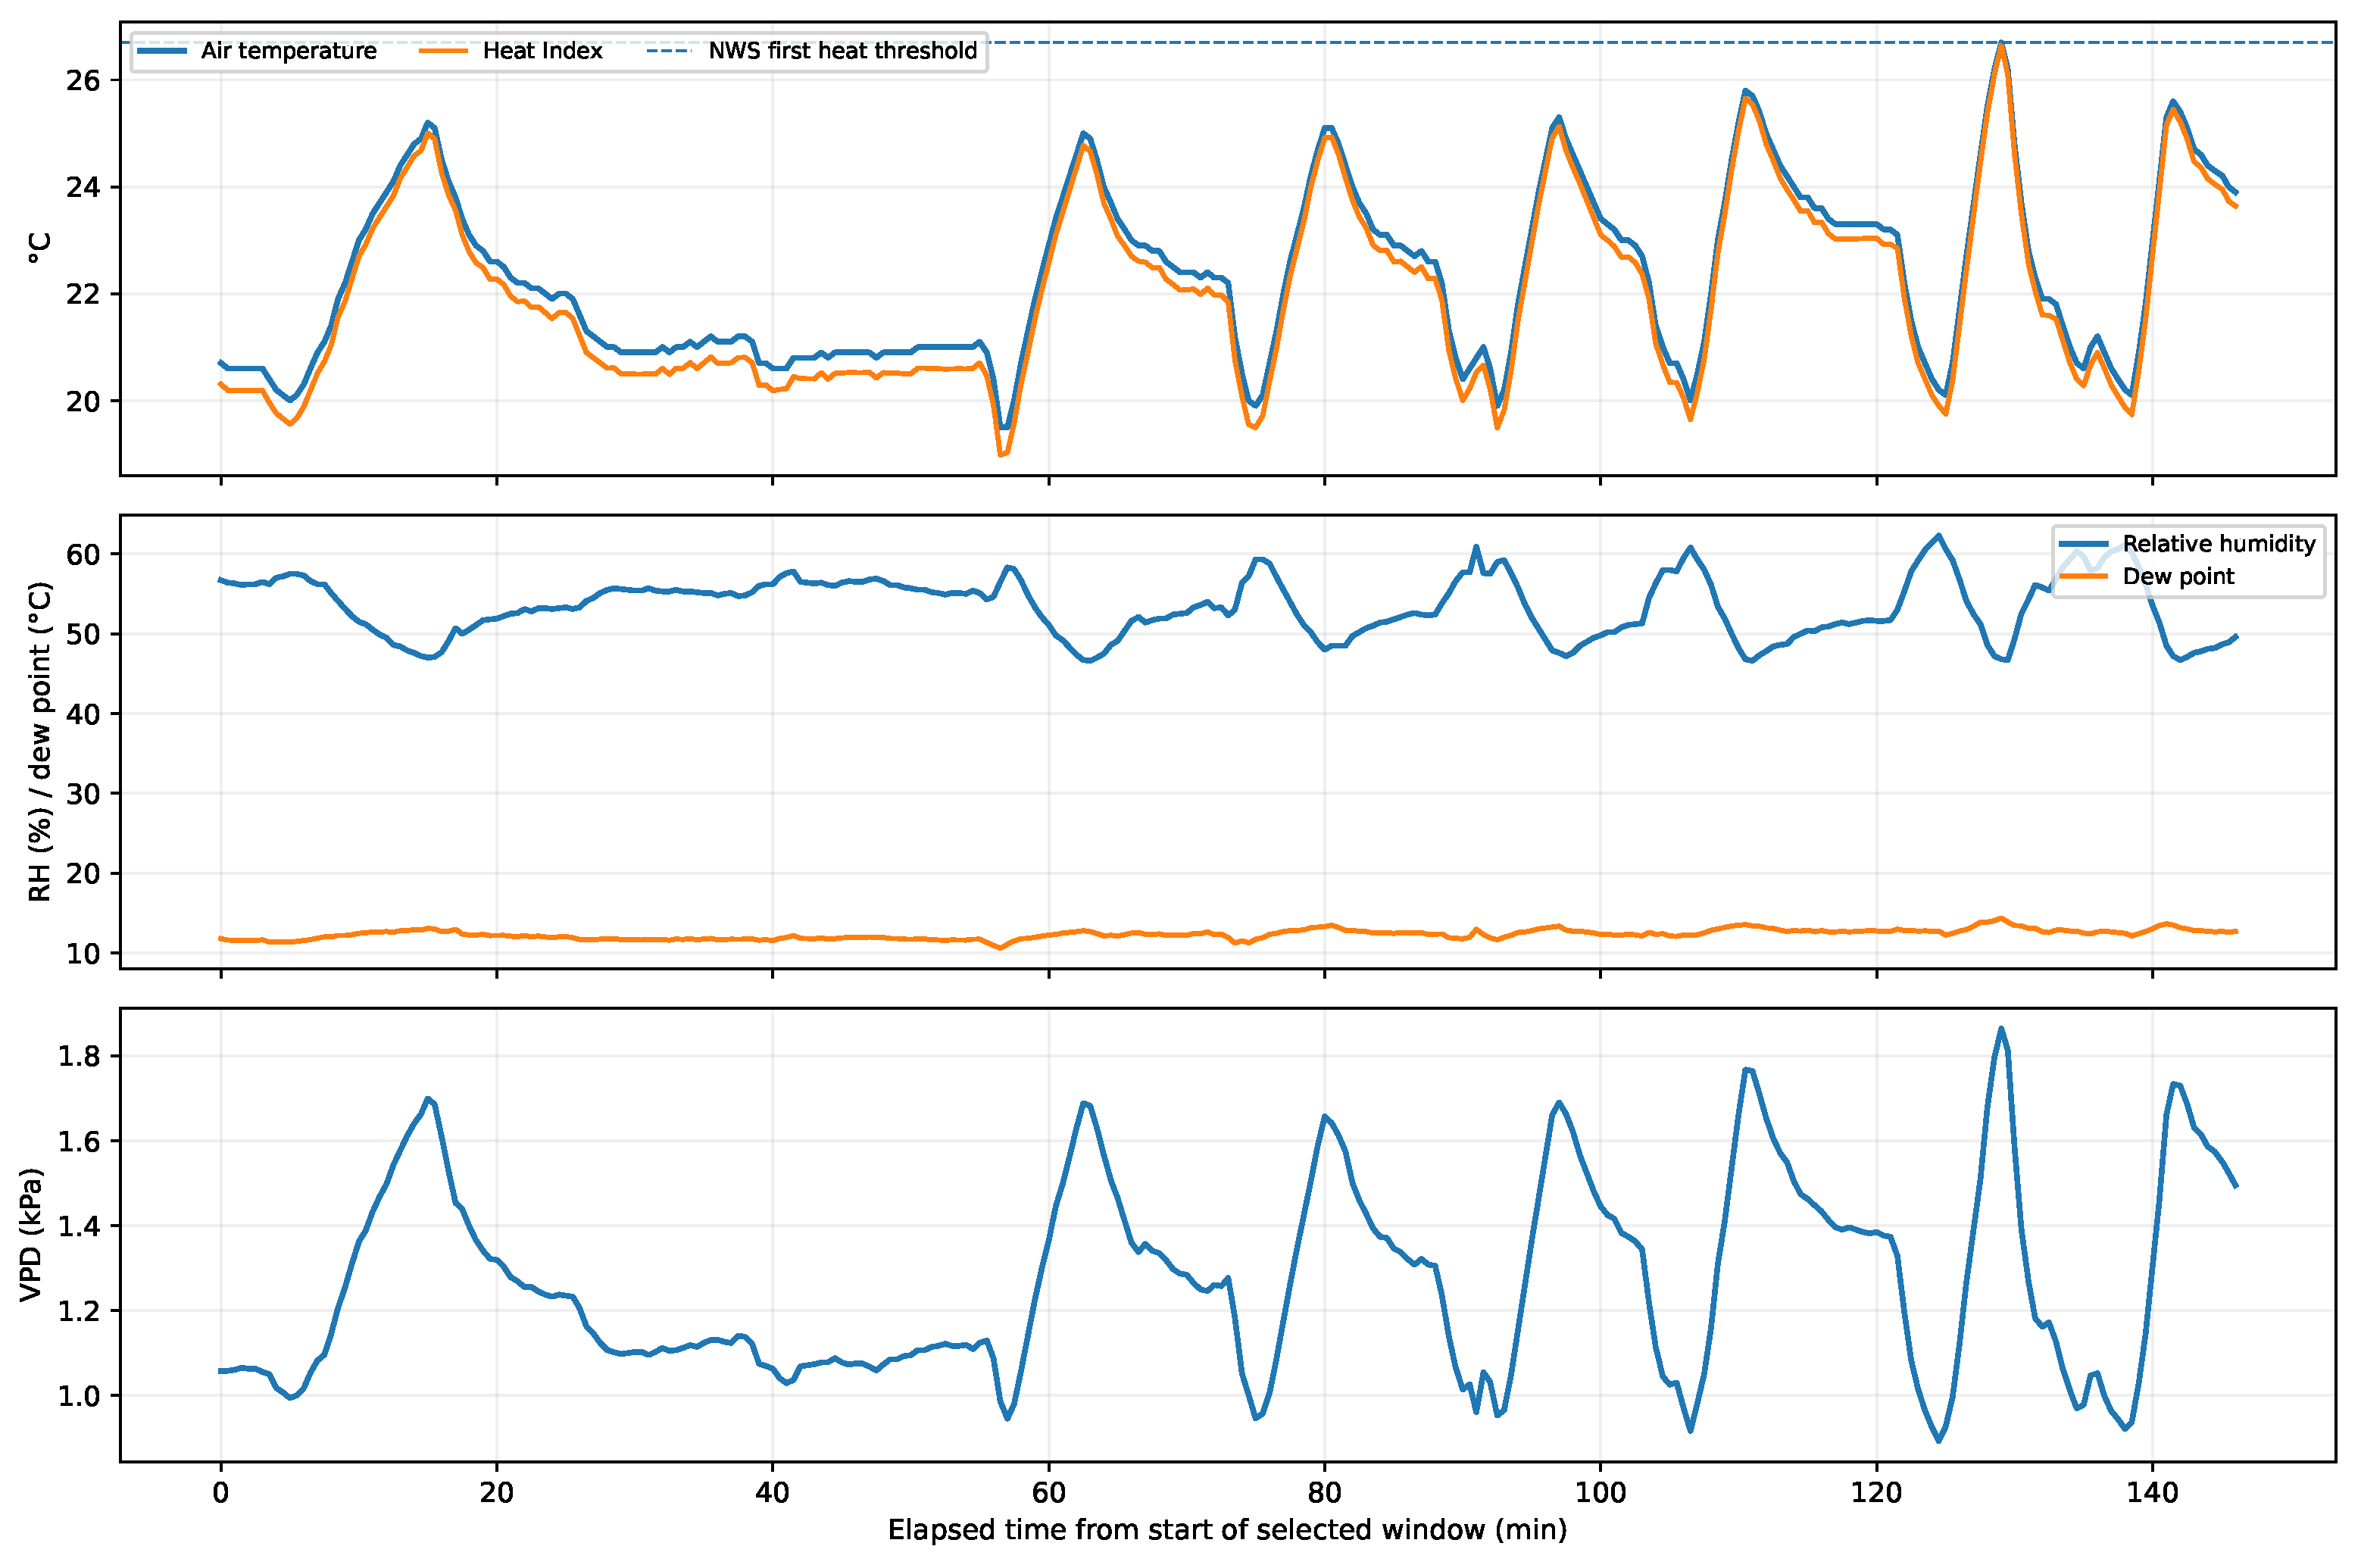
Figure 7 shows descriptive environmental quantities for Station 1 during the selected repeated-control interval. Heat Index generally follows the air-temperature evolution and remains near or below the first NWS heat-severity boundary for most of the cycling period. Dew point changes more gradually than air temperature, while VPD increases during warmer/drier portions of the cycle. These plots provide environmental context but are not interpreted as standardized comfort indices.
Figure 7.
Derived environmental quantities for Station 1 during the selected automatic-control period: air temperature and Heat Index, relative humidity and dew point, and vapor-pressure deficit.
When the timestamp-based HeatRiskScore was applied to the selected automatic-control windows, most observations remained in level 0 because HI was below the first heat-screening boundary. Short periods reached Watch or Caution when temperature/HI increased and the recent hot-sample fraction accumulated. For Station 1, the maximum score was 1.50; Station 2 reached 0.93; and Station 3 reached 1.00. These values are operational screening outputs only. They should not be interpreted as measured thermal comfort, WBGT heat stress, or an occupational exposure category.
3.5. Baseline Comparison and Added Temporal Context
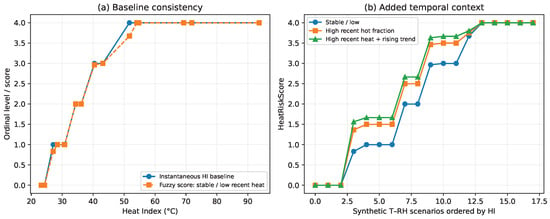
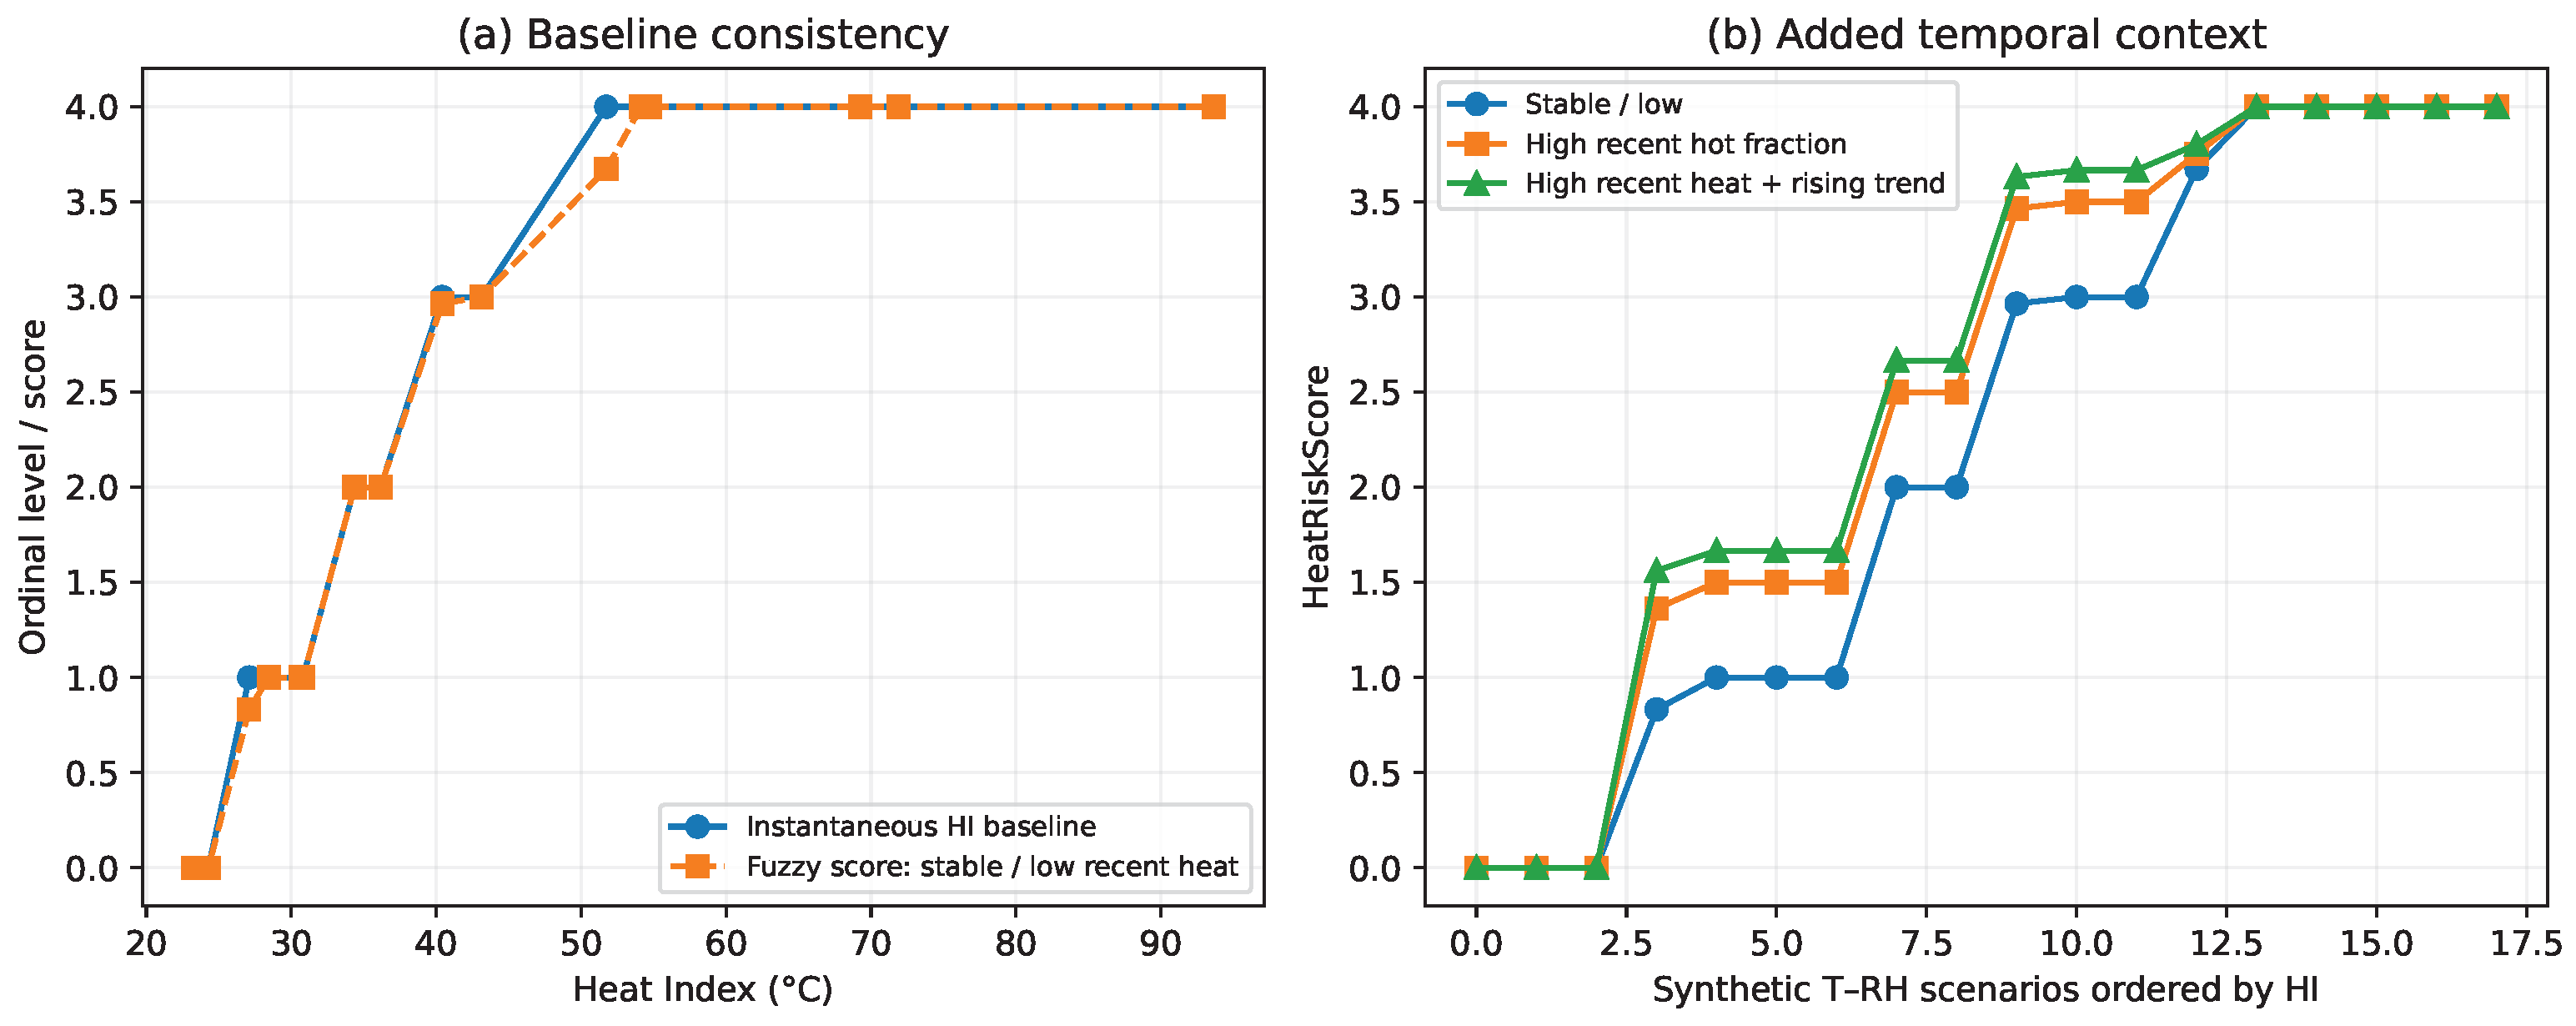
Figure 8 compares the fuzzy HeatRiskScore with the simple instantaneous HI baseline across the 18 synthetic T– scenarios. Under stable trend and low recent heat exposure, the fuzzy class matched the instantaneous HI baseline in all 18 scenarios. This exact agreement is expected because the base HI memberships were intentionally anchored to the baseline; it is therefore an internal implementation check rather than independent validation.
Figure 8.
Internal baseline comparison. (a) Under stable/low-exposure conditions, the fuzzy output follows the instantaneous Heat-Index baseline. (b) High recent hot-sample fraction and rising trend can increase the HeatRiskScore.
When the same current environmental scenarios were assigned a high recent hot-sample fraction, the fuzzy layer escalated seven of 18 cases above the instantaneous baseline class. When high recent heat and a rising trend were combined, nine of 18 cases were escalated. The added value of the fuzzy layer is thus not an attempt to create a new independently validated physiological scale. Its defined contribution is temporal context: two states with similar current HI can receive different operational priority when their recent trajectories differ.
The previous manuscript reported a Spearman correlation against NWS Heat-Index severity even though Heat Index was already an input to the fuzzy model. That statistic has been removed from the validation claims because it was not independent. The present paper explicitly limits its evidence to internal consistency, temporal-behavior verification, and preliminary feasibility.
3.6. Measurement-Uncertainty Sensitivity and PMV/PPD Assumptions
The DHT22 datasheet-bound perturbation analysis showed that the width of the resulting Heat-Index envelope averaged approximately 1.24 °C for Station 1, 1.21 °C for Station 2, and 1.25 °C for Station 3, with maximum envelope widths of approximately 1.59, 1.50, and 1.72 °C. Within these bounds, the direct instantaneous HI category could change for 14.9% of Station 1 automatic-window records, 2.8% of Station 2 records, and 10.4% of Station 3 records. The affected observations were primarily those close to the first heat-screening threshold. This result illustrates how even a simple ordinal classification can become sensitive to sensor accuracy near a boundary.
The PMV/PPD factorial analysis reinforces a different point. At the fixed environmental condition C and , the 108 combinations of M, , v, and produced PMV values from approximately to 0.80 and PPD from approximately 5.0% to 81.7%. Figure 9 shows the PMV sensitivity grouped by each assumed parameter. The wide range confirms that PMV/PPD should not be presented as measured outcomes when air velocity, mean radiant temperature, metabolic rate, and clothing insulation were not measured.
Figure 9.
Exploratory PMV sensitivity at C and over 108 factorial combinations: met; clo; m/s; and C. PMV/PPD are not inputs to the HeatRiskScore.
4. Discussion
4.1. What the Evidence Demonstrates
The strongest evidence in the manuscript concerns the automation architecture and repeated threshold-based behavior. The new datasets contain repeated state changes for all three stations, and the reported ON/OFF transition temperatures cluster close to the programmed 20 and 25 °C thresholds. This is substantially stronger than describing a single temperature trajectory without a synchronized state channel. The data also show a physically plausible difference between commanded transition and subsequent air-temperature response: after the OFF command, temperature can continue to rise because a 1500 W heater and the local air volume have thermal inertia. Station 3’s 2.9 °C maximum overshoot is therefore an important engineering result rather than a value to hide. It indicates that hysteresis thresholds should be tuned with actuator power, sensor location, airflow, and thermal lag in mind.
At the same time, the distinction between a reported control-state field and a physically measured relay contact remains essential. The cloud state indicates the command/state propagated by the application, but no independent voltage or current sensor verified the contact position. The wording therefore avoids claiming electrically verified duty cycle or switching reliability. A future controller-validation campaign should log relay-coil command, contact voltage/current, temperature, and thresholds on the same time base.
4.2. Thermal Monitoring Versus Thermal Comfort and Heat Stress
The thermal-assessment claims are deliberately narrowed to match the available measurements. The system directly measures only air temperature and relative humidity. These variables are useful for environmental monitoring and can support local heater automation, but they are insufficient to determine complete thermal comfort in a spatially heterogeneous indoor environment. Mean radiant temperature can differ strongly from air temperature near windows, walls, machinery, or radiant sources; air velocity and personal variables further affect heat exchange. This is why ISO 7730 and recent thermal-environment reviews treat PMV/PPD as a model requiring a broader set of inputs [6,8].
The same distinction applies more strongly to WBGT. A conventional wet-bulb estimate from T and is not natural wet-bulb temperature, and indoor WBGT requires globe temperature. The paper therefore removes the estimated-WBGT surrogate from the decision layer and from the claimed results. This resolves the methodological ambiguity in the earlier version and prevents an inexpensive DHT22 node from being presented as if it were an ISO 7243 instrument.
The paper also avoids equating Heat Index with occupational heat stress. HI is retained because it provides a simple, transparent T– heat-severity baseline for a prototype heat-alert layer. It is not used to set work/rest schedules or exposure limits. This narrower framing is consistent with the available measurements and makes the fuzzy output easier to interpret.
4.3. Why the Fuzzy Layer Was Simplified
The previous fuzzy structure combined HI, an estimated WBGT surrogate, dew point, Discomfort Index, PMV, PPD, trend, and exposure. Several of these quantities are derived from the same T and , while PMV and PPD are directly linked mathematically. Treating them as separate evidence risks double counting information and makes the rule base difficult to justify physically. The updated three-input model separates roles instead of multiplying indices: HI provides instantaneous heat severity, provides short-term direction, and provides recent persistence.
The baseline experiment clarifies the intended contribution. If trend is stable and recent hot exposure is low, the fuzzy layer reproduces the simple HI classification. If recent history is unfavorable, it can increase the operational priority. This behavior is not proof that the fuzzy score predicts human heat strain better than HI. It is a transparent automation rule for prioritizing a station when current conditions are accompanied by persistence or worsening trajectory. Independent validation would require an external reference not mathematically contained in the model, such as controlled environmental measurements with appropriate instrumentation, a recognized occupational protocol where applicable, or human-response data if comfort prediction were again claimed.
4.4. Metrology and Uncertainty
The metrological limitations are now explicit. Manufacturer specifications for the DHT22 are not equivalent to a calibration certificate, and the present campaign did not measure sensor bias, repeatability in situ, long-term drift, or uncertainty against a traceable reference. The 0.8 m installation height is reported for reproducibility, but the measurement configuration was not designed as a full ISO 7726 comfort-assessment protocol. Consequently, the system should be described as a low-cost automation prototype, not a thermal-environment measurement instrument demonstrated to meet ISO requirements.
The deterministic datasheet-bound sensitivity shows why this distinction matters. Near a category boundary, plausible sensor error can change a Heat-Index class. A formal uncertainty budget would require calibration data, uncertainty distributions, environmental dependence, and correlations that were not available. The PMV sensitivity result is even more instructive: the range from approximately to 0.80 under one fixed T– condition arises solely from plausible changes in assumed M, , v, and . This is the reason PMV/PPD were removed from the control/risk logic rather than defended as measured comfort outcomes.
4.5. Communication Evidence and Reproducibility
The cloud datasets demonstrate high application-level continuity, but they do not provide packet-level reliability. The distinction is important because a persisted ThingSpeak row is the end product of multiple stages: sensor acquisition, node logic, ESP-NOW transfer for secondary stations, master processing, HTTP exchange, Node-RED logic, MQTT publication, and cloud acceptance. Missing data at the final layer cannot be assigned to one network segment without instrumentation at intermediate points.
Future communication tests should therefore record monotonically increasing sequence identifiers at the source, receive counters at the master, timestamps before and after each protocol boundary, and explicit acknowledgments for critical commands. Repeated tests under controlled 2.4 GHz interference would then allow packet-delivery ratio, latency distribution, jitter, recovery time, and command success rate to be reported separately for ESP-NOW, HTTP, and MQTT. Until such data exist, the present paper intentionally avoids numerical packet-loss and latency claims.
4.6. Safety Implications
The heater power used in the experiments makes safety a central issue. The actually implemented measures were limited to supervised controlled tests, platform watchdog behavior, and an OFF command after restart. The prototype did not include a dedicated independently verified thermal cutoff or a full fail-safe command-expiry subsystem. This is acceptable for a supervised engineering proof-of-concept only if it is described transparently; it would not be sufficient for unattended deployment.
A deployment-oriented version should add hardware overtemperature protection independent of the application processor, appropriately rated overcurrent protection, relay/contactors rated for the load, maximum continuous-ON timers, command expiration, stale-data detection, explicit safe-state behavior after network loss, and independent logging of actuator power. Cybersecurity controls should include protected credentials, station authentication, command integrity, and rejection of stale or malformed messages. The local-first architecture provides a useful foundation because cloud failure does not force the heater into uncontrolled network-dependent behavior, but local autonomy must be paired with independent physical protections.
4.7. Limitations and Future Work
The first limitation is metrological. The DHT22 nodes were not calibrated against a traceable reference, and mean radiant temperature and air velocity were not measured. Future work should use instrumentation consistent with the intended thermal-environment standard and should document calibration, uncertainty, placement, response time, and repeatability. If thermal comfort is to be claimed, occupant variables and subjective responses must also be collected under an appropriate protocol.
The second limitation is controller instrumentation. Although repeated reported heater-state transitions are now available, the relay contact itself was not independently sensed. Future trials should log electrical actuator state together with temperature and thresholds to quantify verified duty cycle, delay, overshoot, undershoot, and energy use. Controlled disturbances should be repeated across multiple days and initial conditions.
The third limitation is network instrumentation. No ESP-NOW packet-level logs or end-to-end timestamps were recorded. Future tests should quantify packet delivery, latency, jitter, reconnection, and recovery separately for each protocol layer. The fourth limitation is model validation. The current baseline comparison demonstrates only internal behavior. External validation of a heat-screening score would require an independent reference appropriate to the intended application. Because the paper does not claim perceived thermal comfort, no occupant survey is used as a validation endpoint in the present study.
Finally, only three stations were tested. Larger deployments should investigate channel contention, gateway load, scaling of cloud updates, and whether local control performance changes when many nodes share the same 2.4 GHz environment. Predictive or adaptive control strategies should be compared against the transparent hysteresis baseline only after these measurement and communication layers are instrumented sufficiently to support reproducible evaluation.
5. Conclusions
This study presents a multi-station IoT architecture for distributed thermal monitoring, independent local heater control, and fuzzy heat screening. The system is explicitly limited to thermal monitoring and preliminary heat-risk screening rather than complete thermal-comfort or ISO 7243 heat-stress assessment, because only air temperature and relative humidity were directly measured. Accordingly, estimated WBGT, Discomfort Index, PMV, and PPD were removed from the fuzzy decision layer, with PMV/PPD retained only for sensitivity analysis.
Repeated automatic-control cycles were identified for all three stations. Across 21 reported ON and 21 OFF transitions, the pooled mean switching temperatures were 19.85 ± 0.23 °C and 25.34 ± 0.35 °C, respectively, closely matching the programmed 20–25 °C hysteresis thresholds. The observed overshoot, reaching up to 2.9 °C, confirms the influence of thermal inertia and local operating conditions. Application-level valid-record fractions exceeded 99.5%, although ESP-NOW packet loss and end-to-end latency could not be quantified because packet-level logs were not recorded.
The three-input fuzzy layer provides temporal heat-risk screening by combining current Heat Index, recent HI trend, and hot-sample exposure. Its main added value is the ability to increase station priority when worsening trends or sustained hot exposure are detected, without claiming external physiological validation. Future work should include traceable sensor calibration, mean radiant temperature and air-velocity measurements when comfort assessment is intended, independent relay-state sensing, hardware thermal protection, packet-level communication logs, and external validation against an appropriate reference.
Author Contributions
Conceptualization, methodology, formal analysis, investigation, project administration, resources, and writing—original draft preparation, J.V.-A.; software, validation, visualization, and data acquisition, S.A.-T.; data curation, supervision, and writing—review and editing, C.D.-V.-S. All authors have read and agreed to the published version of the manuscript.
Funding
This work was supported in part by the institutional research project “Tecnologías de la Industria 4.0 en Educación, Salud, Empresa e Industria” at Universidad Tecnológica Indoamérica, funding code 2026 INV-001-017.
Institutional Review Board Statement
Not applicable.
Informed Consent Statement
Not applicable.
Data Availability Statement
The datasets used in the analysis presented in this study, the HeatRiskScore analysis script and the source code are available in the project repository: https://github.com/josevarela90/MultIoTFuzzy.git, accessed on 11 September 2026.
Acknowledgments
The authors thank Universidad Tecnológica Indoamérica for institutional support. During preparation of this revision, the authors used ChatGPT-5.6 Sol high for English-language editing, figures and sentence-clarity improvement.
Conflicts of Interest
The authors declare no conflicts of interest.
Abbreviations
The following abbreviations are used in this manuscript:
| HI | Heat Index |
| HTTP | Hypertext Transfer Protocol |
| IoT | Internet of Things |
| MQTT | Message Queuing Telemetry Transport |
| NWS | National Weather Service |
| PMV | Predicted Mean Vote |
| PPD | Predicted Percentage Dissatisfied |
| RH | Relative Humidity |
| VPD | Vapor-Pressure Deficit |
References
- Coulby, G.; Clear, A.; Jones, O.; Godfrey, A. A Scoping Review of Technological Approaches to Environmental Monitoring. Int. J. Environ. Res. Public Health 2020, 17, 3995. [Google Scholar] [CrossRef] [Scilit] [PubMed]
- Garcés, H.O.; Durán, C.; Espinosa, E.; Jerez, A.; Palominos, F.; Hinojosa, M.; Carrasco, R. Monitoring of Thermal Comfort and Air Quality for Sustainable Energy Management inside Hospitals Based on Online Analytical Processing and the Internet of Things. Int. J. Environ. Res. Public Health 2022, 19, 12207. [Google Scholar] [CrossRef] [Scilit] [PubMed]
- Marques, G.; Pitarma, R. Non-Contact Infrared Temperature Acquisition System Based on Internet of Things for Laboratory Activities Monitoring. Procedia Comput. Sci. 2019, 155, 487–494. [Google Scholar] [CrossRef] [Scilit]
- Hidayat, S.S.; Shabiya, K.I.; Kadiran, S.A.; Mujahidin, I.; Prabowo, M.C.A.; Nursyahid, A.; Wasito, E.; Helmy. Real-Time Web-Based Monitoring System for Temperature, Humidity, and Solar Panels in Ramie Drying Facilities. Sci. J. Inform. 2024, 11, 69–80. [Google Scholar] [CrossRef] [Scilit]
- Varela-Aldás, J.; Gavilanes, A.; Velasco, N.; Del-Valle-Soto, C.; Bran, C. Acceptance of an IoT System for Strawberry Cultivation: A Case Study of Different Users. Sustainability 2024, 16, 7221. [Google Scholar] [CrossRef] [Scilit]
- ISO 7730:2025; Ergonomics of the Thermal Environment—Analytical Determination and Interpretation of Thermal Comfort Using Calculation of the PMV and PPD Indices and Local Thermal Comfort Criteria. International Organization for Standardization: Geneva, Switzerland, 2025.
- ISO 7243:2017; Ergonomics of the Thermal Environment—Assessment of Heat Stress Using the WBGT (Wet Bulb Globe Temperature) Index. International Organization for Standardization: Geneva, Switzerland, 2017.
- d’Ambrosio Alfano, F.R.; Palella, B.I.; Riccio, G. Standardized Indices for the Assessment of Indoor Thermal Environments: Background, Application and Perspectives. Energies 2026, 19, 3894. [Google Scholar] [CrossRef] [Scilit]
- Álvarez, J.L.; Mozo, J.D.; Durán, E. Analysis of Single Board Architectures Integrating Sensors Technologies. Sensors 2021, 21, 6303. [Google Scholar] [CrossRef] [Scilit] [PubMed]
- Guevara, I.; Ryan, S.; Singh, A.; Brandon, C.; Margaria, T. Edge IoT Prototyping Using Model-Driven Representations: A Use Case for Smart Agriculture. Sensors 2024, 24, 495. [Google Scholar] [CrossRef] [Scilit] [PubMed]
- Yavari, A.; Bagha, H.; Korala, H.; Mirza, I.; Dia, H.; Scifleet, P.; Sargent, J.; Shafiei, M. ParcEMon: IoT Platform for Real-Time Parcel Level Last-Mile Delivery Greenhouse Gas Emissions Reporting and Management. Sensors 2022, 22, 7380. [Google Scholar] [CrossRef] [Scilit] [PubMed]
- Taştan, M. Machine Learning-Based Calibration and Performance Evaluation of Low-Cost Internet of Things Air Quality Sensors. Sensors 2025, 25, 3183. [Google Scholar] [CrossRef] [Scilit] [PubMed]
- ISO 7726:2025; Ergonomics of the Thermal Environment—Instruments for Measuring and Monitoring Physical Quantities. International Organization for Standardization: Geneva, Switzerland, 2025.
- Elwakeel, A.E. A Smart Automatic Control and Monitoring System for Environmental Control in Poultry Houses Integrated with Earlier Warning System. Sci. Rep. 2025, 15, 31630. [Google Scholar] [CrossRef] [Scilit] [PubMed]
- Ley, W.E.; Lim, C.L.; Kok, C.L.; Koh, Y.Y.; Lee, C.C.C. Sustainable Urban Farming Using a Smart Hydroponic Approach Using IoT and Real Time Monitoring. Sci. Rep. 2026, 16, 8361. [Google Scholar] [CrossRef] [Scilit] [PubMed]
- Sawant, N.R.; Kumar, A.; Pant, S.; Kotecha, K. An IoT-Driven Machine Learning System for Real-Time Smart Crop Recommendation and Optimization in Precision Agriculture. Discov. Artif. Intell. 2026, 6, 194. [Google Scholar] [CrossRef] [Scilit]
- Hang, L.; Kim, D.H. Enhanced Model-Based Predictive Control System Based on Fuzzy Logic for Maintaining Thermal Comfort in IoT Smart Space. Appl. Sci. 2018, 8, 1031. [Google Scholar] [CrossRef] [Scilit]
- Khanghah, M.S.; Bonvin, A.; Moghaddam, F. IoT-Enabled Experimental Validation of Fuzzy Logic Control for Solar Thermal Collector Systems. Sol. Energy Adv. 2025, 5, 100125. [Google Scholar] [CrossRef] [Scilit]
- Sirisumrannukul, S.; Intaraumnauy, T.; Piamvilai, N. Optimal Control of Cooling Management System for Energy Conservation in Smart Home with ANNs-PSO Data Analytics Microservice Platform. Heliyon 2024, 10, e26937. [Google Scholar] [CrossRef] [Scilit] [PubMed]
- Demirezen, G.; Fung, A.S. Application of Artificial Neural Network in the Prediction of Ambient Temperature for a Cloud-Based Smart Dual Fuel Switching System. Energy Procedia 2019, 158, 3070–3075. [Google Scholar] [CrossRef] [Scilit]
- Rezvy, P.A.; Komanapalli, V.L.N. Investigation on the Role of Artificial Intelligence in Measurement System. IEEE Access 2025, 13, 96483–96502. [Google Scholar] [CrossRef] [Scilit]
- Aguilera, J.J.; Toftum, J.; Kazanci, O.B. Predicting Personal Thermal Preferences Based on Data-Driven Methods. E3S Web Conf. 2019, 111, 05015. [Google Scholar] [CrossRef] [Scilit]
- Luximon, A.; Chao, H.; Goonetilleke, R.S.; Luximon, Y. Theory and Applications of InfraRed and Thermal Image Analysis in Ergonomics Research. Front. Comput. Sci. 2022, 4, 990290. [Google Scholar] [CrossRef] [Scilit]
- Kim, J.H.; Jo, B.W.; Jo, J.H.; Kim, D.K. Development of an IoT-Based Construction Worker Physiological Data Monitoring Platform at High Temperatures. Sensors 2020, 20, 5682. [Google Scholar] [CrossRef] [Scilit] [PubMed]
- Kato, K.; Nishi, T.; Lee, S.; Li, L.; Evans, N.; Kiyono, K. Evaluating Heat Stress in Occupational Setting with No Established Safety Standards Using Collective Data from Wearable Biosensors. Sensors 2025, 25, 1832. [Google Scholar] [CrossRef] [Scilit] [PubMed]
- Silawarawet, K.; Trirattananurak, C.; Muksuwan, J.; Sangdao, S.; Panich, D.; Saadprai, S. Development of Wearable Heatstroke Warning System (HeatGuard): Design, Validation and Controlled-Environment Testing among Triathletes. Sensors 2026, 26, 2556. [Google Scholar] [CrossRef] [Scilit] [PubMed]
- National Institute for Occupational Safety and Health. NIOSH Criteria for a Recommended Standard: Occupational Exposure to Heat and Hot Environments; Technical Report 2016-106; U.S. Department of Health and Human Services: Washington, DC, USA, 2016. [Google Scholar] [CrossRef] [Scilit]
- Boobalan, S.; Gobinath, S.; Dharmalingam, A.; Jayaprakash, A.; Poovarasan, M.; Poovendan, K. An Integrated IoT LabVIEW Based Fuzzy-PLC Controller for Automation of Boiler. IOP Conf. Ser. Mater. Sci. Eng. 2020, 937, 012049. [Google Scholar] [CrossRef] [Scilit]
- Dwivedi, R.; Gupta, D.; Dwivedi, A.K. ColdFarmSens: A Smart IoT-Based Architecture for Analyzing and Regulating Greenhouse Conditions. Proc. Eng. Sci. 2025, 7, 2399–2412. [Google Scholar] [CrossRef] [Scilit]
- Jin, W.; Rezaeipanah, A. Dynamic Task Allocation in Fog Computing Using Enhanced Fuzzy Logic Approaches. Sci. Rep. 2025, 15, 18513. [Google Scholar] [CrossRef] [Scilit] [PubMed]
- Chancay, E.; Montaño, M.; Alvarez, M.A.; Novillo, F. Evaluación de Interferencias en Escenarios Urbanos Interiores en Bandas Inferiores a 6 GHz. Rev. TecnolÓGica-ESPOL 2024, 36, 44–56. [Google Scholar] [CrossRef] [Scilit]
- National Weather Service. What Is the Heat Index? Available online: https://www.weather.gov/ama/heatindex (accessed on 12 August 2026).

Disclaimer/Publisher’s Note: The statements, opinions and data contained in all publications are solely those of the individual author(s) and contributor(s) and not of MDPI and/or the editor(s). MDPI and/or the editor(s) disclaim responsibility for any injury to people or property resulting from any ideas, methods, instructions or products referred to in the content. |
© 2026 by the authors. Licensee MDPI, Basel, Switzerland. This article is an open access article distributed under the terms and conditions of the Creative Commons Attribution (CC BY) license.