


Abstract
Printed product surface defect inspection faces critical challenges in real industrial production, including insufficient detection accuracy, poor robustness, and scarcity of labeled defective samples. This paper proposes an improved Siamese network for high-resolution printed image defect detection to address the above limitations. Original 1300 × 460-pixel printed images are segmented into 64 × 64 patches to construct a training and testing dataset. We optimize the feature measurement strategy of contrastive loss and integrate a position matching module and multi-threshold evaluation strategy to balance detection precision and stability. Quantitative experiments demonstrate that the proposed method achieves an overall accuracy of 94.35%, a precision of 91.99%, a recall of 95.17%, and an F1-score of 93.55% at the fixed threshold of 0.45. Compared with mainstream lightweight detection models including YOLOv8Lite (You Only Look Once version 8 Lite) and MobileViTv2 (Mobile Vision Transformer version 2), our method maintains a stable F1-score advantage of 10.84–24.36% under optimal threshold settings. The proposed approach achieves outstanding performance and robustness in few-shot scenarios and can be deployed for automatic quality inspection of printed parts used in power communication equipment.
1. Introduction
With the rapid development of intelligent manufacturing, machine vision inspection has been widely applied in the printing industry. High-speed production lines impose strict requirements for online automatic detection of tiny surface defects such as missing ink, scratches, position offset, stains, and incomplete patterns. These subtle flaws directly degrade product quality and commercial value, making real-time defect recognition an indispensable link in printed product manufacturing [1].
In actual workshop environments [2], unstable printing equipment precision, inconsistent raw material textures, and fluctuating ambient illumination further increase the difficulty of defect identification. Traditional manual inspection suffers from low efficiency, unstable detection consistency, and high labor costs; detection quality heavily relies on operator experience and physical status, which cannot meet the demands of high-speed continuous production [3]. Deep learning-based visual inspection techniques have gradually replaced manual inspection owing to their non-contact, high-efficiency, and stable output characteristics [4].
A prominent bottleneck in industrial defect detection is the scarcity of defective samples. Collecting and labeling defective printed images requires significant time and labor costs, resulting in typical few-shot learning scenarios [5]. Conventional deep classification networks rely on massive annotated data and easily overfit under limited training samples [6]. Lightweight convolutional neural networks (CNNs) reduce computational overhead but lack sufficient feature representation capability for tiny low-texture defects [7]. Standard object detection architectures contain redundant structures when applied to binary defect classification tasks, increasing computation cost and deteriorating training convergence stability [8]. Therefore, developing a dedicated few-shot defect classification algorithm for printed products possesses vital theoretical significance and practical engineering value.
Siamese networks adopt a two-branch weight-sharing architecture to learn feature similarity between paired samples, which inherently fits few-shot recognition tasks with limited training data [9]. Nevertheless, traditional Siamese networks lack targeted optimization for densely textured printed images and micro-defects, leaving room for improvement in feature extraction stability, similarity measurement accuracy, and inference speed [10]. Furthermore, classical Siamese architectures exclude position alignment modules and systematic multi-threshold evaluation strategies, restricting their practical deployment flexibility in industrial inspection workshops. Aiming at high-resolution printed image detection, this paper designs a fully functional improved Siamese network and verifies its performance via comprehensive comparative experiments.
Early printed defect detection research mainly adopted handcrafted feature algorithms based on gray-scale transformation, edge extraction, texture analysis, and template matching [11]. Such methods feature low computational complexity and fast inference speed but exhibit weak generalization capacity when confronting complex textures, micro-defects, and variable lighting conditions [12]. With the advancement of deep learning, convolutional neural networks have become mainstream inspection solutions. ResNet (Residual Network)-based classification models achieve satisfactory performance with abundant labeled samples [13]; prior research has validated the effectiveness of Siamese similarity learning for few-shot printed defect classification [10]. Existing reviews summarize that few-shot learning, lightweight network design, and real-time inference represent three core research directions for industrial printing inspection [3].
Beyond conventional handcrafted and CNN-based approaches, several advanced techniques have been developed for specialized industrial vision tasks. For instance, the Improved Gaussian Difference algorithm and Hough Transform algorithm (IGD-IHT) combined with PIQEDS-ISSA-NESN has been successfully applied to brake disc surface defect detection [14], demonstrating the effectiveness of hybrid optimization strategies for complex texture analysis. In machine vision systems, high-quality ellipse detection based on geometric constraints and hierarchical clustering [15] has proven robust for shape-based defect localization. Furthermore, fine-grained recognition techniques have been explored for reliable bolt key-points detection in industrial magnetic separator systems [16], which share similar challenges with printed surface inspection in terms of capturing subtle visual differences. These studies collectively indicate that enhancing feature representation capability—which is also the essence of Siamese networks—plays a crucial role in improving detection accuracy for fine-grained industrial defects.
Current published approaches still contain obvious drawbacks: most algorithms require large-scale labeled datasets and degrade sharply under few-shot conditions; few works balance lightweight architecture and detection accuracy; dedicated printed defect detection algorithms with complete engineering deployment pipelines remain insufficient [17].
As a classic few-shot learning framework, Siamese networks were originally proposed for signature verification and later extended to general few-shot image recognition tasks [9,18]. Recent studies have introduced Siamese contrastive learning into workpiece defect detection and proven stable performance with limited samples [6,19]. However, existing Siamese-based industrial inspection methods retain four key limitations:
- Redundant network structure leading to slow inference speed;
- Weak discriminative capability of loss functions under imbalanced sample distribution;
- No targeted optimization for printed micro-defects, limiting practical deployment performance [10];
- Lack of complete defect localization visualization pipelines, which hinders on-site debugging and result analysis.
Novel lightweight and unsupervised anomaly detection models including YOLOv8Lite (You Only Look Once version 8 Lite), MobileViTv2 (Mobile Vision Transformer version 2), ConvNeXt-V2, Swin-Tiny, and PatchCore provide alternative solutions for surface defect inspection [9,11,12,13,17]. However, none of these architectures are specially optimized for tiny printed defects, frequently triggering false positives and missed detections in practical testing. In addition, most existing literature fails to establish unified data preprocessing, training strategies, and evaluation standards for fair comparative experiments, resulting in poor result reproducibility.
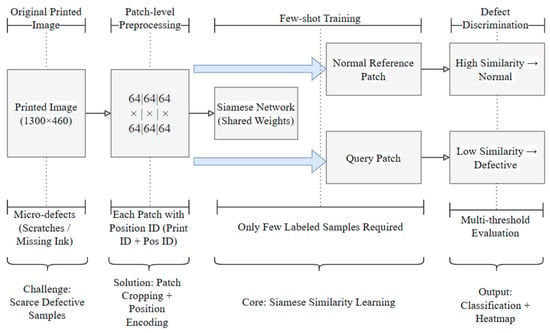
To address the above limitations, the core motivation of this work is to develop a dedicated few-shot defect detection framework that can operate reliably under extremely limited defective samples while maintaining real-time inference speed for industrial deployment. Unlike general-purpose object detectors or classification backbones that require thousands of labeled instances per category, our approach leverages the inherent similarity-learning capability of the Siamese architecture to discriminate defects from normal references with only a handful of training samples. This is particularly valuable for printed surface inspection, where collecting and annotating defective products is time-consuming and costly. Figure 1 illustrates the overall problem definition and the motivational pipeline of our proposed method, highlighting the transition from high-resolution printed image acquisition to patch-level similarity-based defect discrimination.
Figure 1.
Schematic illustration of the problem definition and overall motivation of the proposed method.
Based on the above research gaps, the main contributions of this work are summarized as follows [19]:
- An improved Siamese network is proposed, integrating lightweight weight sharing feature extraction, feature normalization and alignment, optimized contrastive loss, a position matching mechanism, and multi-threshold evaluation to unify accuracy, inference speed, and lightweight performance under few-shot conditions;
- A complete printed defect inspection system is established, covering data preprocessing, model training, heatmap visualization reasoning, multi-threshold evaluation, and result storage modules;
- A standardized printed defect dataset is constructed. Under unified few-shot settings, input resolution, training hyperparameters, and evaluation metrics, fair comparisons with five mainstream visual models are conducted to guarantee experimental reproducibility;
- Extensive quantitative experiments verify that the proposed method outperforms competing algorithms in comprehensive detection accuracy and supports defect localization via heatmap visualization, satisfying the real-time requirements of industrial online inspection.
2. Proposed Improved Siamese Network
2.1. Overall Design Objectives
The proposed improved Siamese network targets few-shot learning, fast inference, stable detection performance, and visual defect localization. Six targeted optimizations are implemented based on standard Siamese architectures:
Lightweight weight-sharing feature extraction to reduce model parameters and accelerate inference. The overall pipeline of the improved Siamese network follows a standard two-branch workflow: paired printed image patches are separately fed into two identical weight-sharing subnetworks for feature mapping, then extracted features go through normalization and alignment modules, followed by similarity measurement calculation, and final defect discrimination based on multi-threshold screening results.
- Lightweight weight-sharing feature extraction to reduce model parameters and accelerate inference;
- Feature normalization and alignment to stabilize similarity measurement;
- Optimized contrastive loss to mitigate performance degradation caused by imbalanced few-shot samples;
- Position matching module to guarantee consistent comparison of image patches at identical spatial positions;
- Multi-threshold evaluation strategy to search optimal discrimination thresholds and boost overall detection accuracy;
- Full-image heatmap visualization pipeline to locate micro-defects for on-site production debugging.
The system takes paired image patches as input and executes sequential modules including preprocessing, dual-branch feature extraction, normalized feature alignment, similarity calculation, and threshold judgment to output final defect classification results.
2.2. Fundamental Principles of Siamese Networks
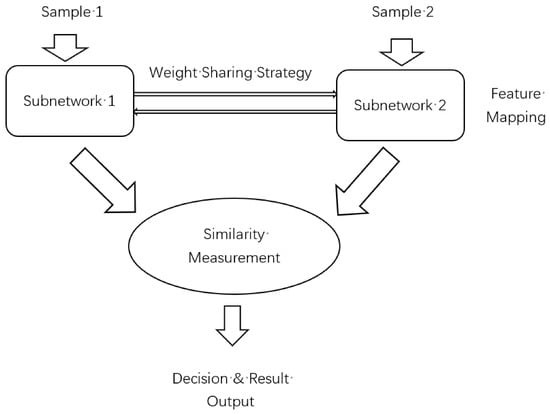
Siamese networks are dual-branch neural networks with shared weights [9,18]. The core mechanism maps paired input samples into a unified feature space and judges similarity via feature distance calculation. Unlike single-branch classification CNNs, Siamese networks do not directly learn discrete category labels but model inter-sample feature differences, which significantly reduces dependence on training data quantity and fits few-shot contrastive recognition tasks. The basic structure of a standard Siamese network is illustrated in Figure 2.
Figure 2.
Basic structure of the standard Siamese network. Arrows indicate the data flow direction.
The network consists of four core components: an input layer, weight-sharing feature extraction branches, a similarity calculation layer, and a classification output layer. The input layer receives a reference normal patch and a test patch; the shared feature extractor guarantees consistent feature distribution for both inputs; the similarity layer computes feature distance; the output layer judges whether the test patch contains defects according to a predefined distance threshold.
Given an input sample pair and a weight-sharing feature extractor with trainable parameters , extracted feature vectors are defined as
Euclidean distance is adopted to quantify feature similarity:
where and represent the i-th dimension of feature vectors and , and d denotes feature dimension. A smaller Euclidean distance indicates higher visual similarity, corresponding to normal printed patches; a larger distance implies potential surface defects.
A distance threshold is predefined for classification judgment: if , the test patch is classified as normal; if , the patch is labeled defective. The optimal threshold is searched via grid traversal ranging from 0.1 to 0.9 with a step of 0.05 on the validation set [10].
It is important to clarify the relationship between the two threshold-related concepts in our framework. The first is the feature distance threshold τ, which is applied to the Euclidean distance d(f1, f2) between feature vectors (see Equation (3)). The second is the defect probability threshold used for the final binary classification decision. In our implementation, the feature distance is passed through a single fully connected layer followed by a sigmoid activation to produce a defect probability score p ∈ [0, 1]. The final classification decision is made by comparing this probability score against a threshold (e.g., 0.45). The multi-threshold evaluation strategy searches over this probability threshold range (0.10–0.90, step 0.05) to find the value that maximizes the F1-score on the validation set. Therefore, the threshold values reported in the subsequent experimental results refer to the probability threshold, not the raw distance threshold. This two-stage design allows the network to learn a non-linear mapping from feature distance to defect probability, providing more flexibility than a fixed distance threshold.
2.3. Architecture of the Improved Siamese Network
Aiming at densely textured high-resolution printed images, the proposed improved Siamese network contains five cascaded functional modules optimized for industrial inspection tasks:
- Input Preprocessing Module
Original 1300 × 460 high-resolution printed images are cropped into standardized 64 × 64 patches, converted to grayscale, and pixel-normalized via . Blank marginal regions are discarded to eliminate interference with detection results. Each cropped patch is assigned a unique Print ID and Position ID for standardized dataset partitioning.
Regarding the labeling strategy, we define label cleanliness as the consistency and clarity of the printed characters/patterns within each 64 × 64 patch. Specifically, a normal patch is required to contain complete and clearly printed text/graphics without any visible distortion, blurring, missing parts, or contamination; a defective patch is defined as one that exhibits at least one of the following characteristics: missing ink, scratches, stains, position offset, or incomplete patterns. All labels were manually annotated by two trained inspectors with cross-validation to ensure labeling consistency. It is important to note that our method fundamentally differs from typical OCR (Optical Character Recognition) approaches. While OCR focuses on recognizing and transcribing textual content from images, our task is to perform binary defect classification at the patch level, i.e., distinguishing whether a printed region is normal or defective, regardless of its semantic content. OCR techniques are not designed for micro-defect discrimination and cannot provide the pixel-wise localization capability required for industrial quality inspection. Therefore, the comparison with OCR methods is not within the scope of this study.
- 2.
- Weight-Sharing Feature Extraction Module
The dual-branch structure shares identical network parameters. Each branch contains three convolutional layers, batch normalization, Rectified Linear Unit (ReLU) activation, and max pooling layers without fully connected layers, drastically reducing total model parameters. The architecture strictly matches the SiameseCNN feature extractor implemented in the source code to ensure consistency between training and inference [7,10].
To provide a more rigorous mathematical description of the feature pattern recognition process, we define the feature extraction operation as follows. Given an input patch , the weight-sharing feature extractor with learnable parameters maps it to a high-dimensional feature vector:
where and represent the weights and biases of the three convolutional blocks, respectively. Each convolutional block consists of convolution, batch normalization, ReLU activation, and max pooling operations. The final feature vector is then -normalized to eliminate norm variations:
For paired inputs (), we extract their respective normalized features and , and compute their similarity via Euclidean distance as formulated in Equation (1). This dual-branch architecture ensures that both inputs undergo identical feature transformations, producing comparable feature representations in a shared metric space. The feature distance is then fed into a single fully connected layer followed by sigmoid activation to generate the final defect probability score:
where denotes the sigmoid function, and are the trainable parameters of the final classification layer.
- 3.
- Feature Normalization and Alignment Module
L2 normalization is applied to eliminate feature norm differences after dual-branch feature extraction. Mean shift alignment further unifies feature distribution, stabilizing similarity measurement under few-shot training conditions and providing reliable feature inputs for subsequent multi-threshold evaluation.
- 4.
- Position Matching Module
To ensure that the comparison between the normal reference patch and the test patch is spatially meaningful, we introduce a position matching mechanism. Each patch is assigned a unique Position ID (i, j) indicating its spatial coordinates in the original printed image. For a test patch at position (i, j), the corresponding normal reference patch is retrieved from the same position (i, j) in a defect-free reference print. This ensures that the feature comparison is performed between patches with identical spatial context. Mathematically, for a test patch x_test at position (i, j), the normal reference is x_ref = N(i, j), where N denotes the defect-free reference image. The similarity score is then computed as
where f_θ(·) is the weight-sharing feature extractor, σ(·) is the sigmoid function, and W_fc and b_fc are the parameters of the final classification layer.
Optimized Contrastive Loss. The standard contrastive loss treats positive and negative pairs equally, which can lead to suboptimal performance under imbalanced few-shot conditions where defective samples are scarce. To address this, we optimize the contrastive loss by introducing a weighting factor α that assigns higher penalty to misclassified defective pairs:
where y ∈ {0, 1} indicates whether the pair is positive (same class) or negative (different class), d is the feature distance, m is the margin, and α > 1 is the weight for positive pairs. In our experiments, we set α = 2.0 and m = 1.0. This weighted formulation ensures that the network pays more attention to correctly classifying defective patches, which is critical for industrial inspection tasks where missing a defect is more costly than a false alarm.
- 5.
- Similarity Calculation and Classification Module
Euclidean distance is adopted to quantify inter-patch feature differences. Classification decisions are generated based on the optimal threshold selected by the multi-threshold module. Two inference modes are supported: single patch testing and full-size original image batch processing to adapt to diverse industrial inspection requirements.
- 6.
- Multi-Threshold Evaluation and Visualization Module
All thresholds from 0.1 to 0.9 (step = 0.05) are traversed to compute accuracy, precision, recall, and F1-scores for each threshold. The optimal discrimination threshold is selected according to the maximum F1-score, solving the subjective threshold-setting problem of traditional Siamese networks. Defect heatmaps are generated to visualize the spatial distribution of abnormal regions for workshop debugging.
On top of this architecture, the contrastive loss function is optimized to enlarge feature distance between normal and defective samples, enhancing discriminative performance under imbalanced few-shot datasets. Fixed random seeds, unified computing environments, mini-batch training, and Adam optimizer are adopted during training to guarantee stable convergence and experimental reproducibility [5,19].
3. Experimental Setup and Results
3.1. Experimental Hardware and Software Environment
All experiments are conducted on a desktop computing platform. Complete hardware and software configurations are listed in Table 1.
Table 1.
Experimental Environment Configuration.
Unified training hyperparameters are fixed for all models: random seed = 42, initial learning rate = 0.0003, batch size = 64, total training epochs = 60. GPU acceleration is enabled for all training processes. All models, including the proposed Siamese network and the five baseline models, were implemented and trained using the open-source PyTorch framework. The software environment is as follows: Python 3.11.14, PyTorch 2.2.0+cu121, torchvision 0.17.0+cu121, NumPy 1.26.4, OpenCV 4.11.0, and scikit-learn 1.4.1.post1. CUDA 12.1 was used for GPU acceleration. No commercial software packages were used.
3.2. Dataset Construction
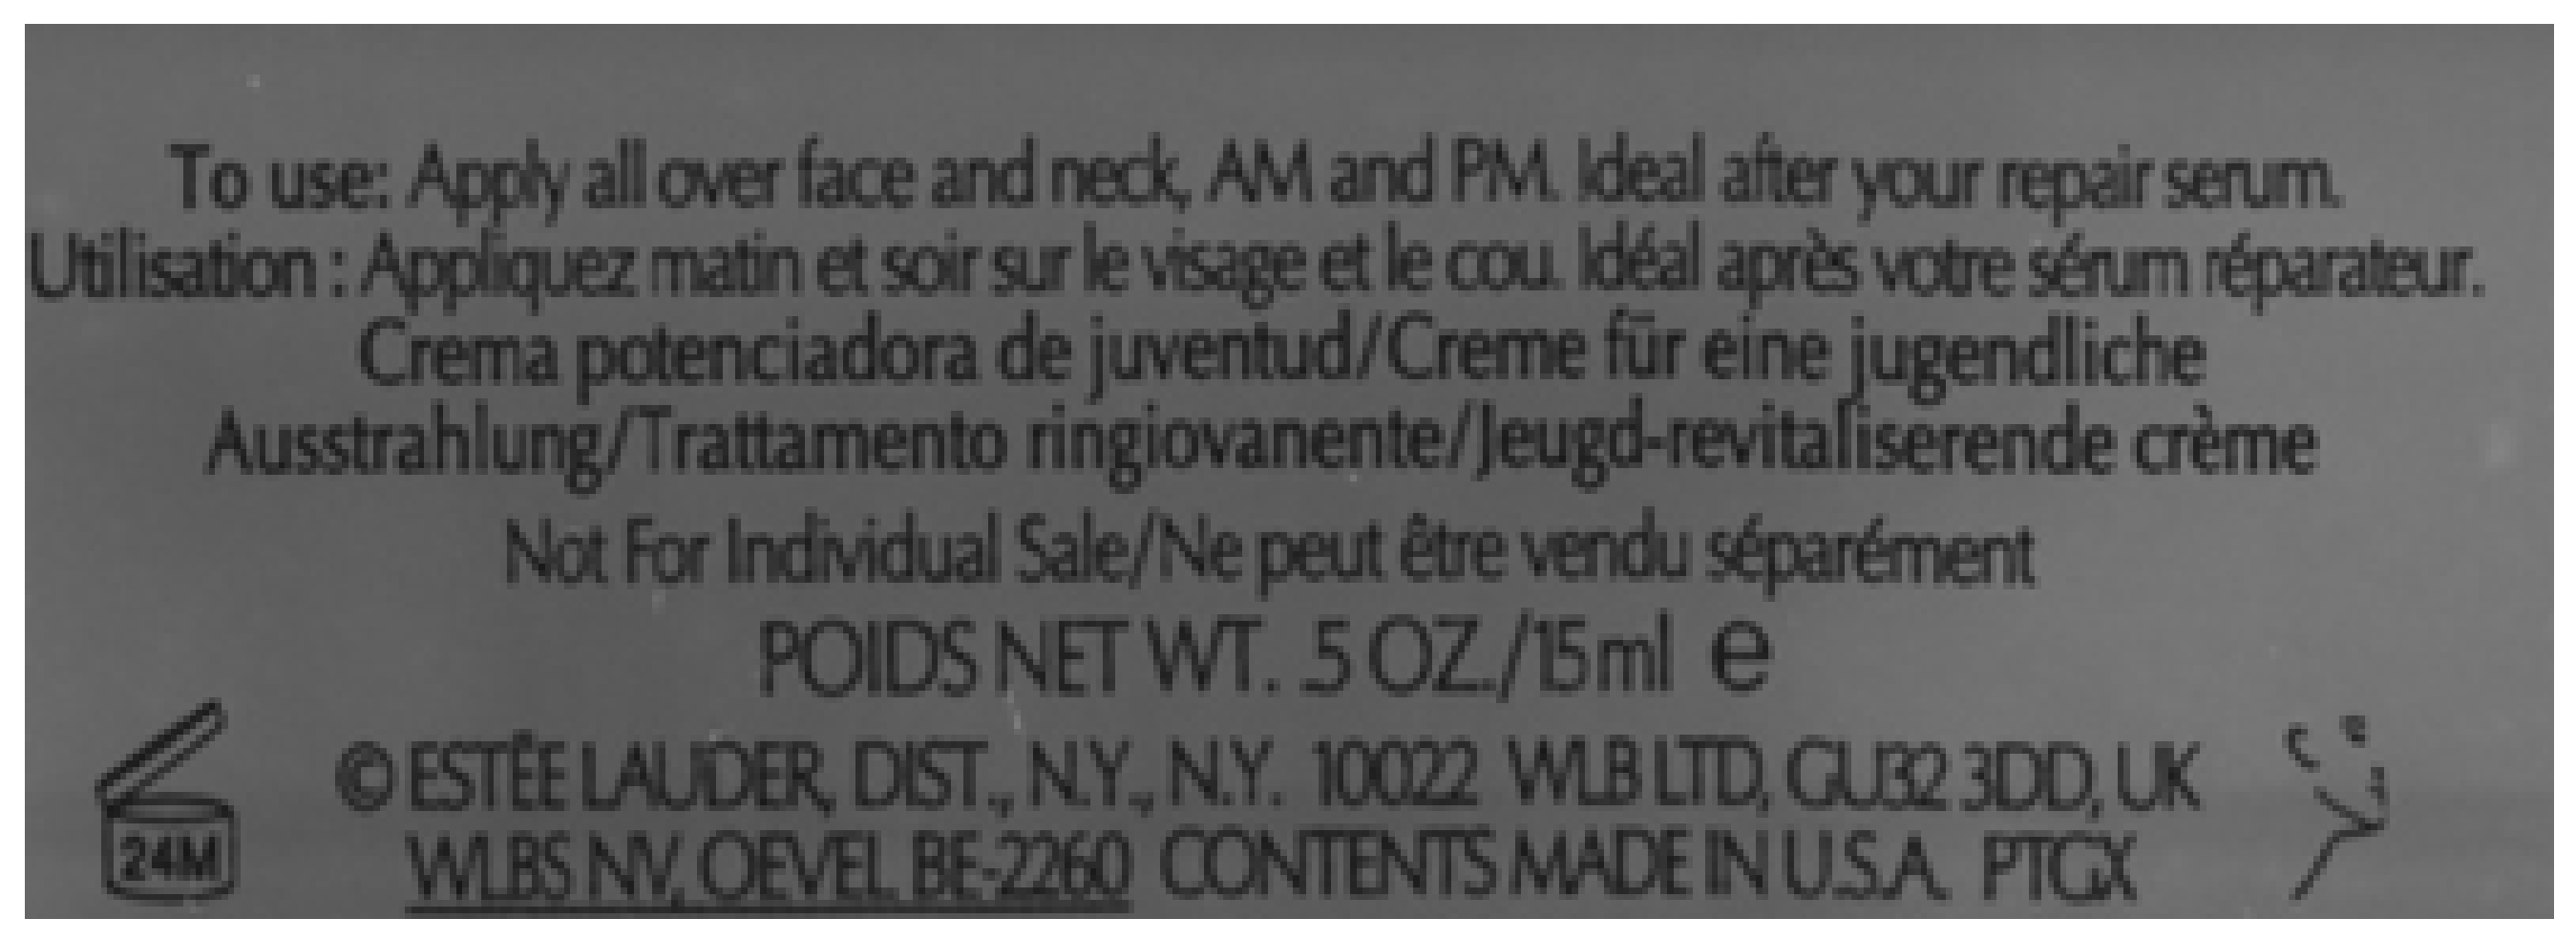
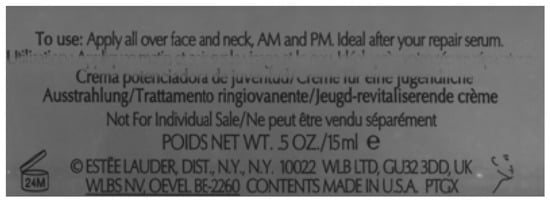
The printed image dataset is collected from real industrial printing production lines, covering multiple typical defects including missing ink, scratches, position offset, stains, and incomplete patterns [2]. Raw images contain 20 normal original prints and 20 defective original prints. Normal samples are shown in Figure 3, and defective samples are shown in Figure 4.
Figure 3.
Normal printed sample.
Figure 4.
Defective printed sample.
Since Siamese networks require paired patch inputs, all original images are cropped into 64 × 64 patches with a sliding step of 32. Patches with incomplete edge pixels are discarded, generating a total of 5600 sub-images (3197 normal patches, 2403 defective patches). Each patch is labeled with a Print ID and a Position ID for standardized dataset split.
The dataset is divided into training set (70%) and test set (30%) based on Print ID to ensure training and test subsets contain completely different batches of original printed images. Cross-set duplicate patches with identical Position IDs are removed to avoid data leakage. The final training set contains 3920 patches (2238 normal, 1682 defective), and the test set contains 1680 patches (959 normal, 721 defective). This partitioning strategy reduces overfitting gap between training and test accuracy from 8.7% to 2.3% [6].
For further generalization verification in follow-up work, we will conduct cross-domain tests on the public MVTec AD (MVTec Anomaly Detection) industrial defect dataset.
It is important to clarify the few-shot nature of our experimental setup. Although the patch-level cropping strategy yields 5600 sub-images from the original 40 prints, the fundamental few-shot property is determined by the number of independent original images used for training, not the number of patches generated. In our dataset split, the training set contains only 14 normal original prints and 14 defective original prints (70% of 20 each), which constitutes a typical few-shot scenario for industrial defect detection. The patch-level expansion is merely a preprocessing technique to generate sufficient paired samples for Siamese network training; it does not introduce additional independent defect instances. We acknowledge that the use of overlapping sliding windows (step = 32 pixels) introduces correlations among adjacent patches, as they share overlapped pixel regions. This may slightly overestimate the effective sample diversity. To mitigate this issue, we have discarded patches with incomplete edge pixels and ensured that training and test sets contain completely different original prints (based on Print ID), with cross-set duplicate patches removed to avoid data leakage. We believe this design provides a realistic evaluation of few-shot performance while maintaining dataset usability for deep learning frameworks.
For threshold optimization, we constructed a validation set by further splitting the training set. Specifically, the training set (70% of the original data, based on Print ID) was divided into a training subset (90%) and a validation subset (10%) using stratified sampling to maintain the normal-to-defective ratio. The validation set contains approximately 392 patches (224 normal, 168 defective), which is sufficient for reliable threshold selection via grid search. The test set (30% of the original data) was kept completely independent and was used only for final performance evaluation. The optimal threshold was selected exclusively on the validation set, and the same threshold was then applied to the test set without any further tuning. This protocol ensures that no test data leakage occurs during threshold selection.
3.3. Baseline Comparison Algorithms
Five state-of-the-art visual models covering lightweight CNN, Transformer, and unsupervised anomaly detection paradigms are selected for fair comparison:
- YOLOv8Lite: Lightweight object detection model optimized for edge deployment;
- MobileViTv2: Lightweight vision Transformer balancing local and global feature extraction;
- ConvNeXt-V2: Pure convolutional architecture with stable feature modeling capability;
- Swin-Tiny: Hierarchical window attention Transformer for local fine-grained feature extraction;
- PatchCore: State-of-the-Art unsupervised anomaly detection model requiring no defective training samples.
All competing models are trained and tested under identical dataset, input resolution, data augmentation, and evaluation metrics to guarantee comparison fairness.
To ensure a fair comparison, all baseline models were carefully adapted to the same patch-level binary defect classification task as follows:
- (1)
- YOLOv8Lite: Originally designed as an object detector, we replaced its final detection head with a binary classification head (single neuron with sigmoid activation) and removed the bounding box regression branch. The backbone features were extracted from the last feature map and global average pooling was applied before the classification head. The model was trained using the same patch-level image pairs with binary labels (0: normal, 1: defective).
- (2)
- MobileViTv2, ConvNeXt-V2, and Swin-Tiny: These are general-purpose classification backbones. We removed their original classification heads and attached a newly initialized linear layer with two output neurons, followed by softmax activation for binary classification. All other architectural components remained unchanged.
- (3)
- PatchCore: As an unsupervised anomaly detection method, PatchCore does not require defective training samples. We followed the standard PatchCore pipeline using only normal patches from the training set as reference memory. During testing, each patch was evaluated against the memory bank, and the anomaly score was thresholded to produce binary predictions. The optimal anomaly threshold was searched independently on the validation set to ensure fair comparison.
For all adapted models, the same data preprocessing steps (grayscale conversion, normalization, 64 × 64 patch size) and the same training hyperparameters (random seed = 42, batch size = 64, epochs = 60, learning rate = 0.0003) were adopted. For the proposed method, the optimal threshold was selected via grid search over 0.10–0.90 with step 0.05. For all baseline models, the optimal threshold was determined by exhaustively evaluating all unique predicted confidence scores returned by the ROC curve analysis to maximize the F1-score.
3.4. Quantitative Evaluation Metrics
Four widely adopted classification metrics are used to comprehensively evaluate detection performance, Accuracy, Precision, Recall, and F1-score, which reflect overall classification correctness, false-positive suppression capability, the defect detection coverage rate, and balanced comprehensive performance, respectively [3,17].
TP = True Positive (real defective patches predicted as defective); TN = True Negative (real normal patches predicted as normal); FP = False Positive (normal patches misjudged as defective); FN = False Negative (defective patches misjudged as normal). All metrics range from 0 to 1 [17], with higher values indicating superior detection performance.
It should be clarified that two different threshold search strategies were employed for the proposed method and the baseline models. For the proposed Siamese-based method, the optimal discrimination threshold was selected via grid search over the range of 0.10 to 0.90 with a step size of 0.05 on the validation set, yielding the optimal value of 0.45. For all baseline models (YOLOv8Lite, MobileViTv2, ConvNeXt-V2, Swin-Tiny, and PatchCore), the optimal threshold was determined by exhaustively evaluating all unique predicted confidence scores returned by the receiver operating characteristic (ROC) curve analysis (via the roc_curve function in scikit-learn), and selecting the threshold that maximized the F1-score. This strategy guarantees that the threshold search for each baseline model is exhaustive and unbiased, as it considers every possible decision boundary derived from the actual model outputs. The resulting thresholds (e.g., 0.1895 for YOLOv8Lite, 0.9994 for MobileViTv2, and 0.0025 for ConvNeXt-V2) reflect the specific confidence distributions of each model rather than predetermined grid points.
3.5. Experimental Results
3.5.1. Threshold Ablation of the Proposed Method
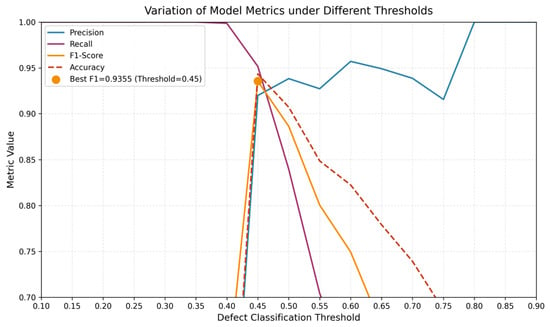
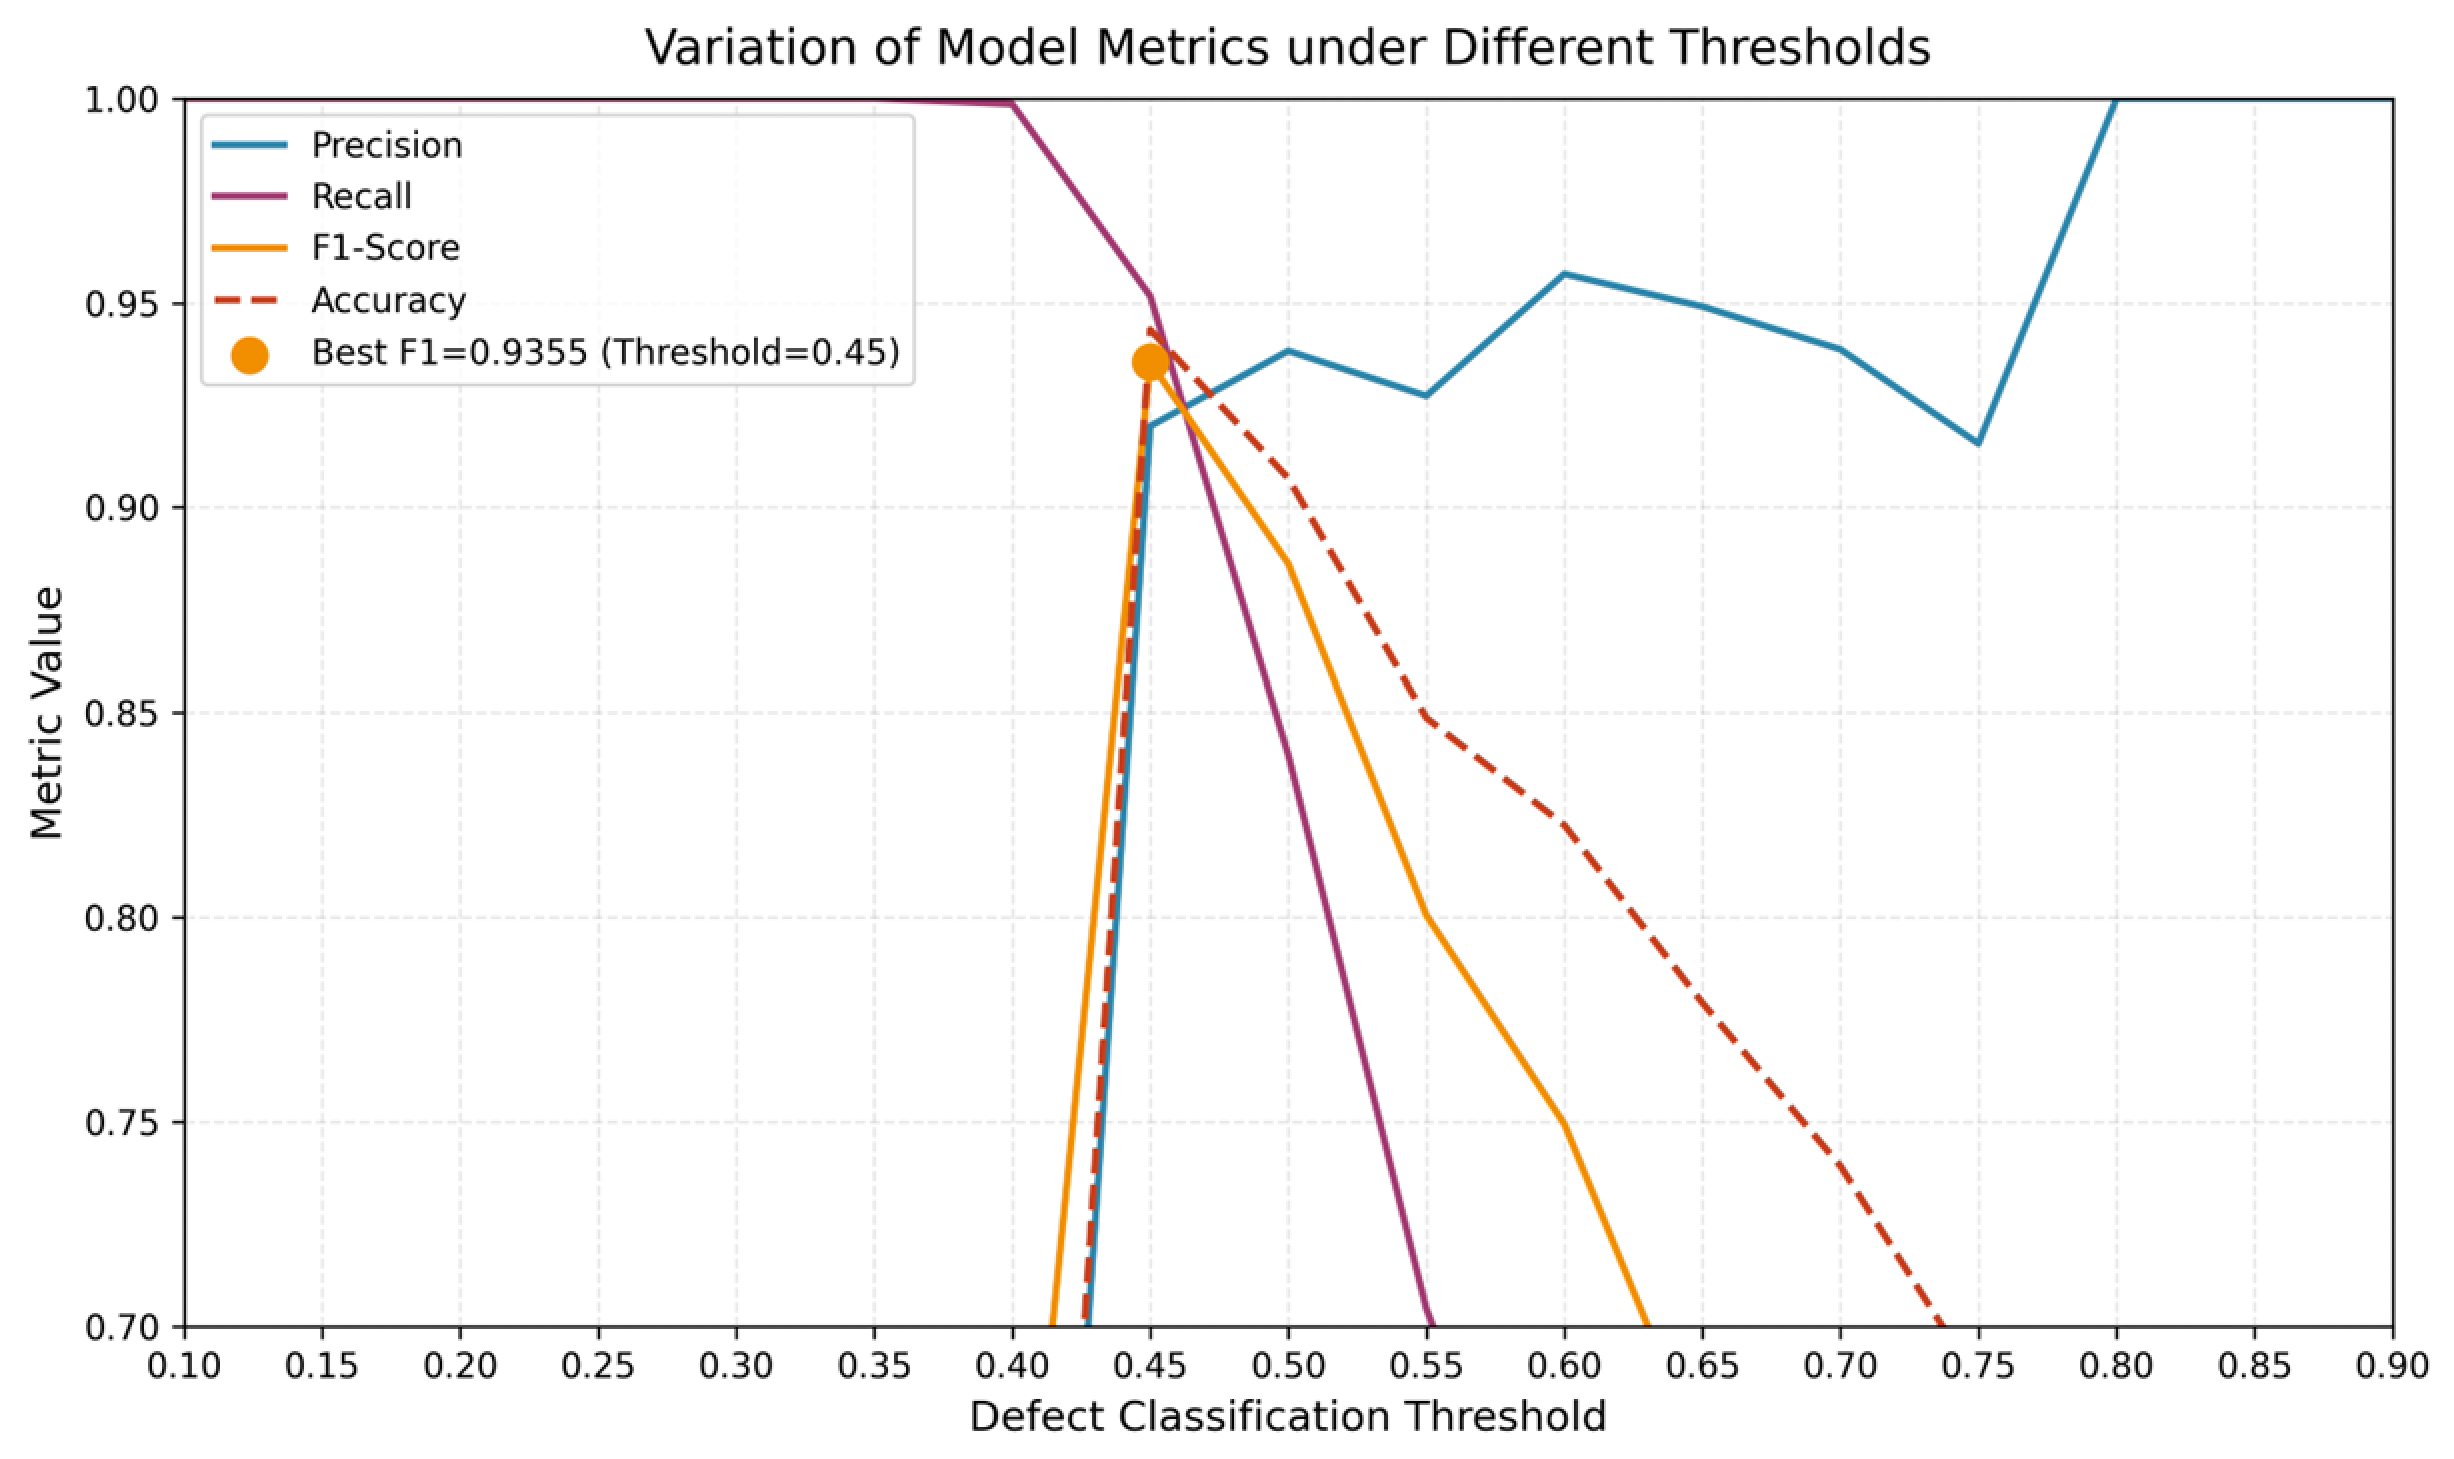
We traverse all thresholds from 0.10 to 0.90 with a step of 0.05 and record corresponding quantitative metrics, as shown in Figure 5 and Table 2 [10].
Figure 5.
Metric variation curve with different discrimination thresholds.
Table 2.
Metric table under different discrimination thresholds.
Experimental results show that all samples are classified as defective when the threshold is lower than 0.35, resulting in 100% Recall but extremely low Precision. The optimal threshold is 0.45, achieving the maximum F1-score of 93.55% (Accuracy = 94.35%, Precision = 91.99%, Recall = 95.17%). All metrics continuously degrade when the threshold exceeds 0.45. The model maintains stable comprehensive performance within the threshold range of 0.35–0.55.
Full-size original image testing is conducted to verify the heatmap visualization module. The complete high-resolution test print is processed patch-by-patch, and similarity scores are aggregated to generate a defect probability heatmap.
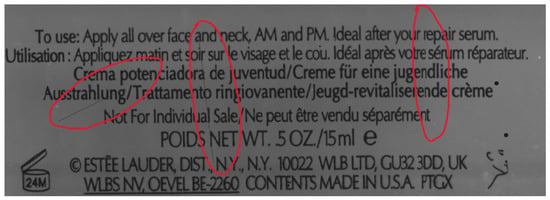
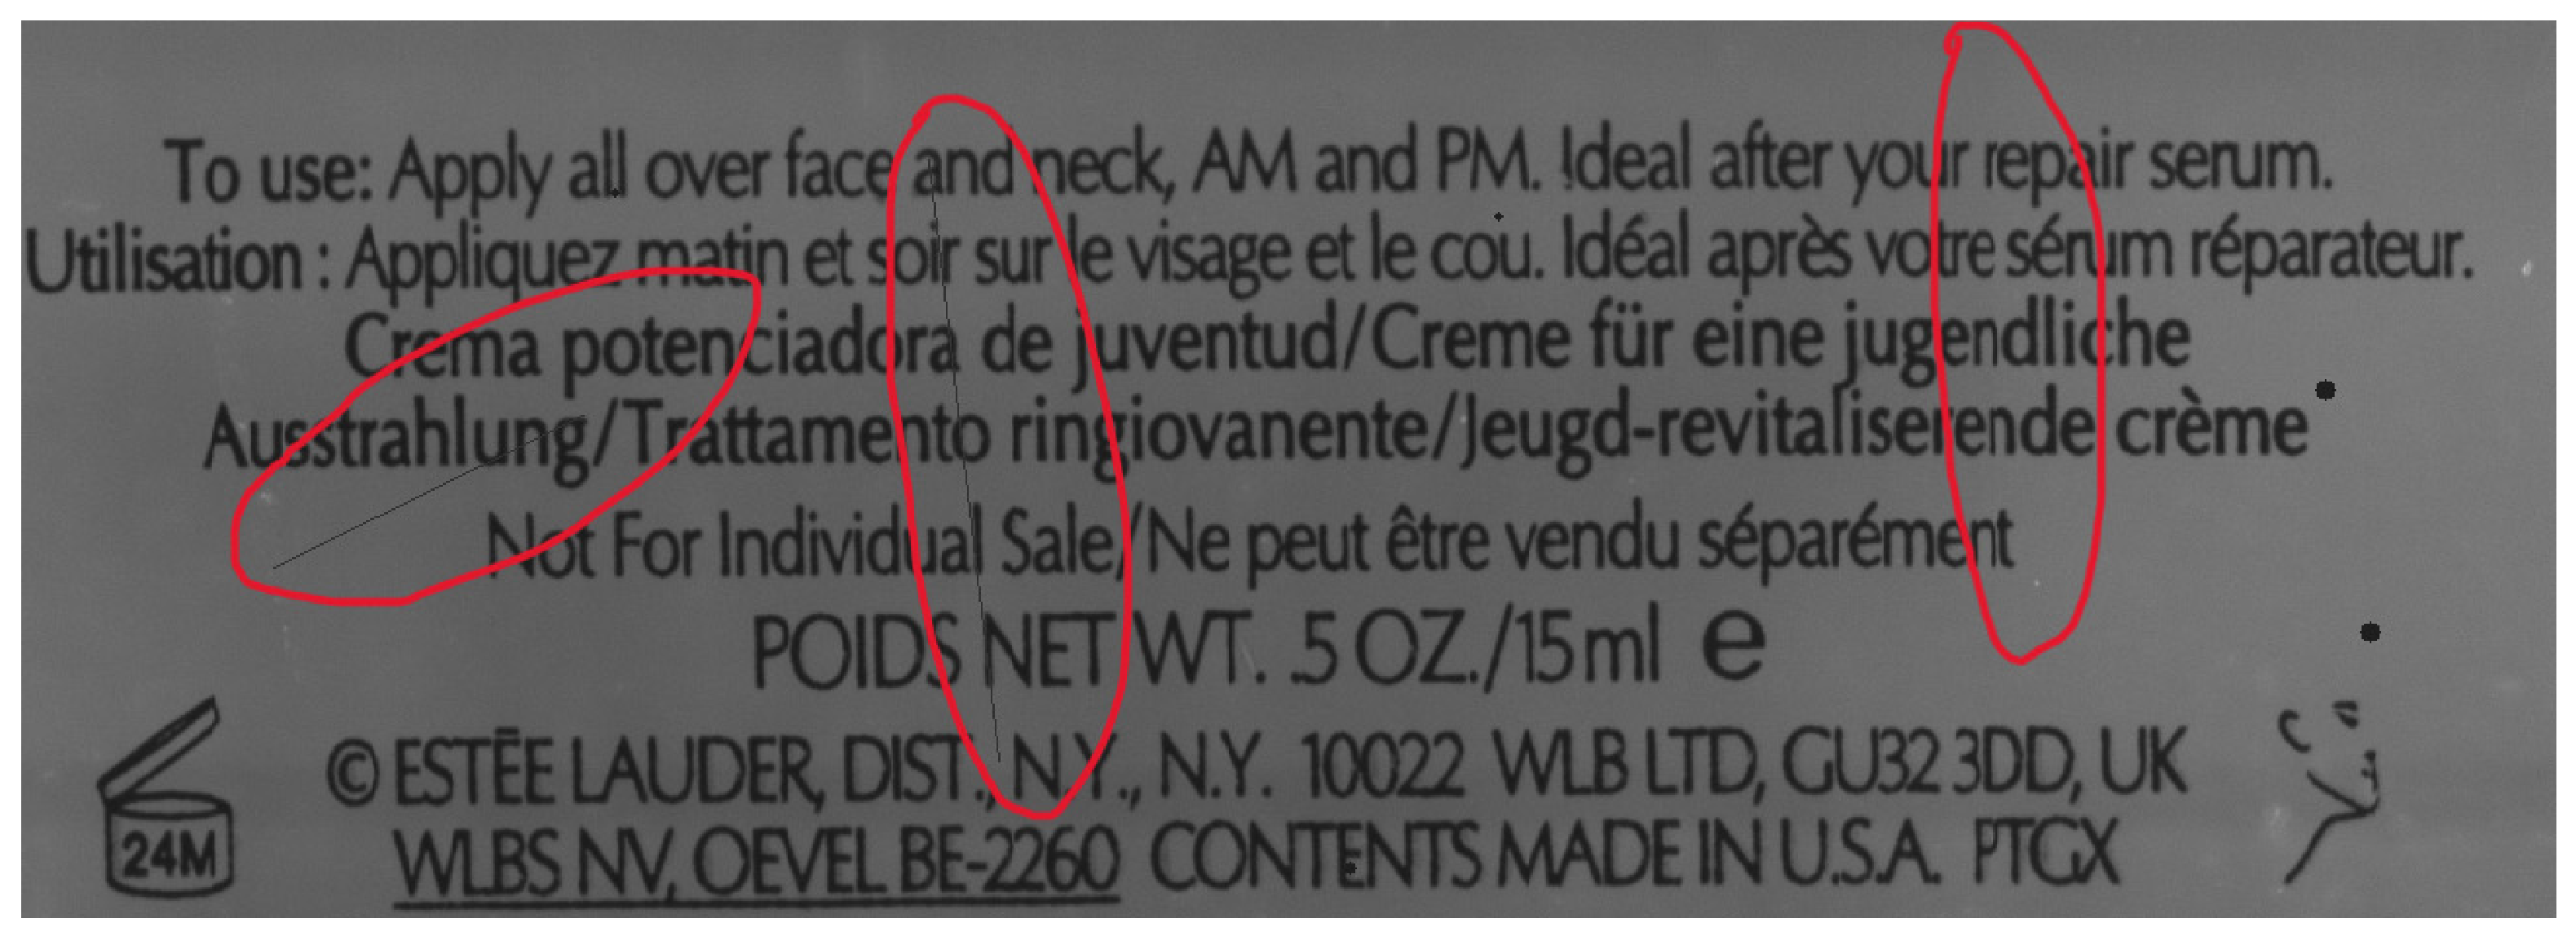
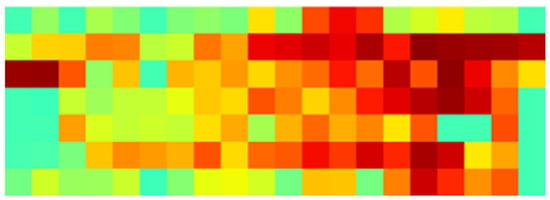
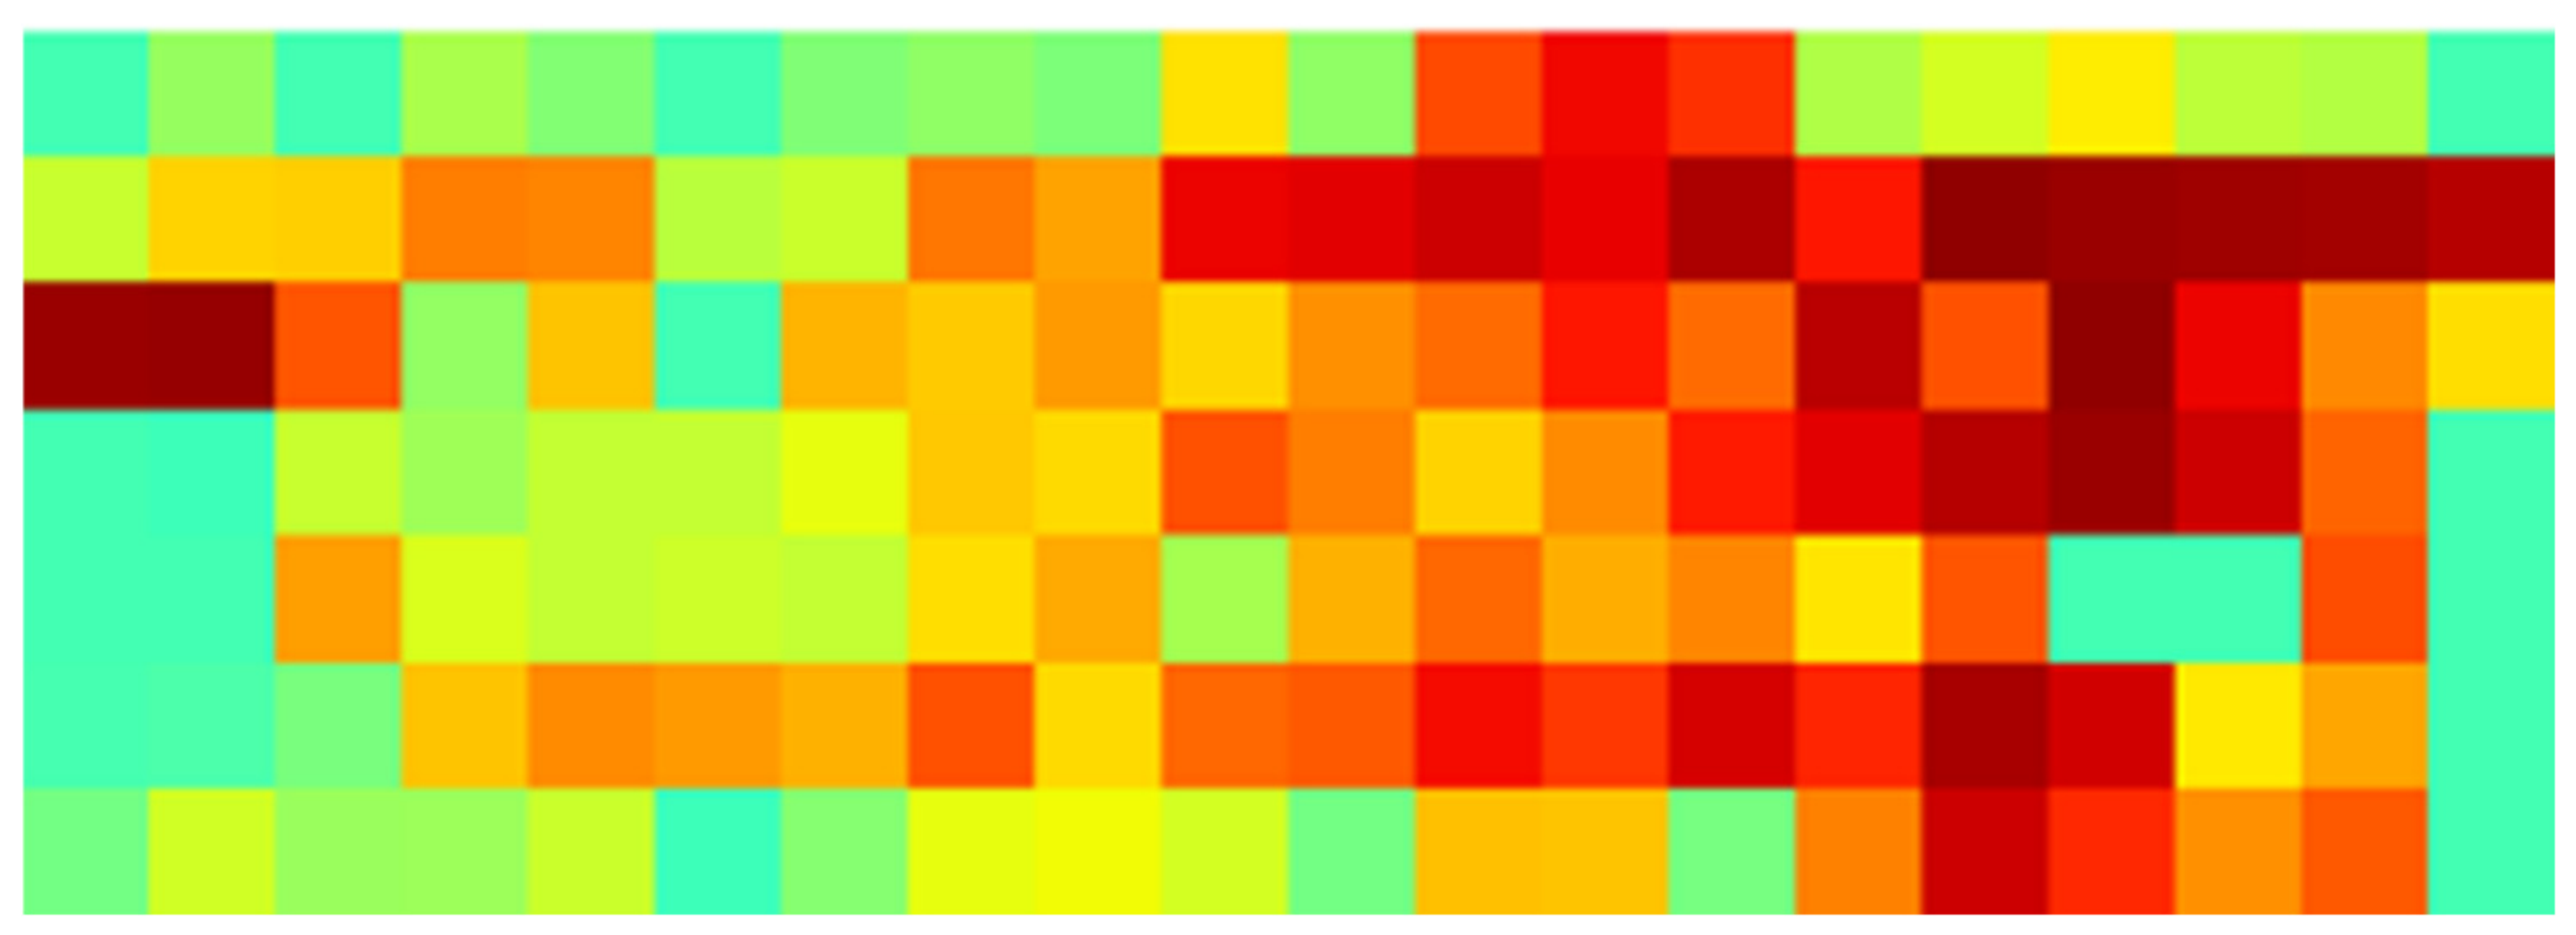
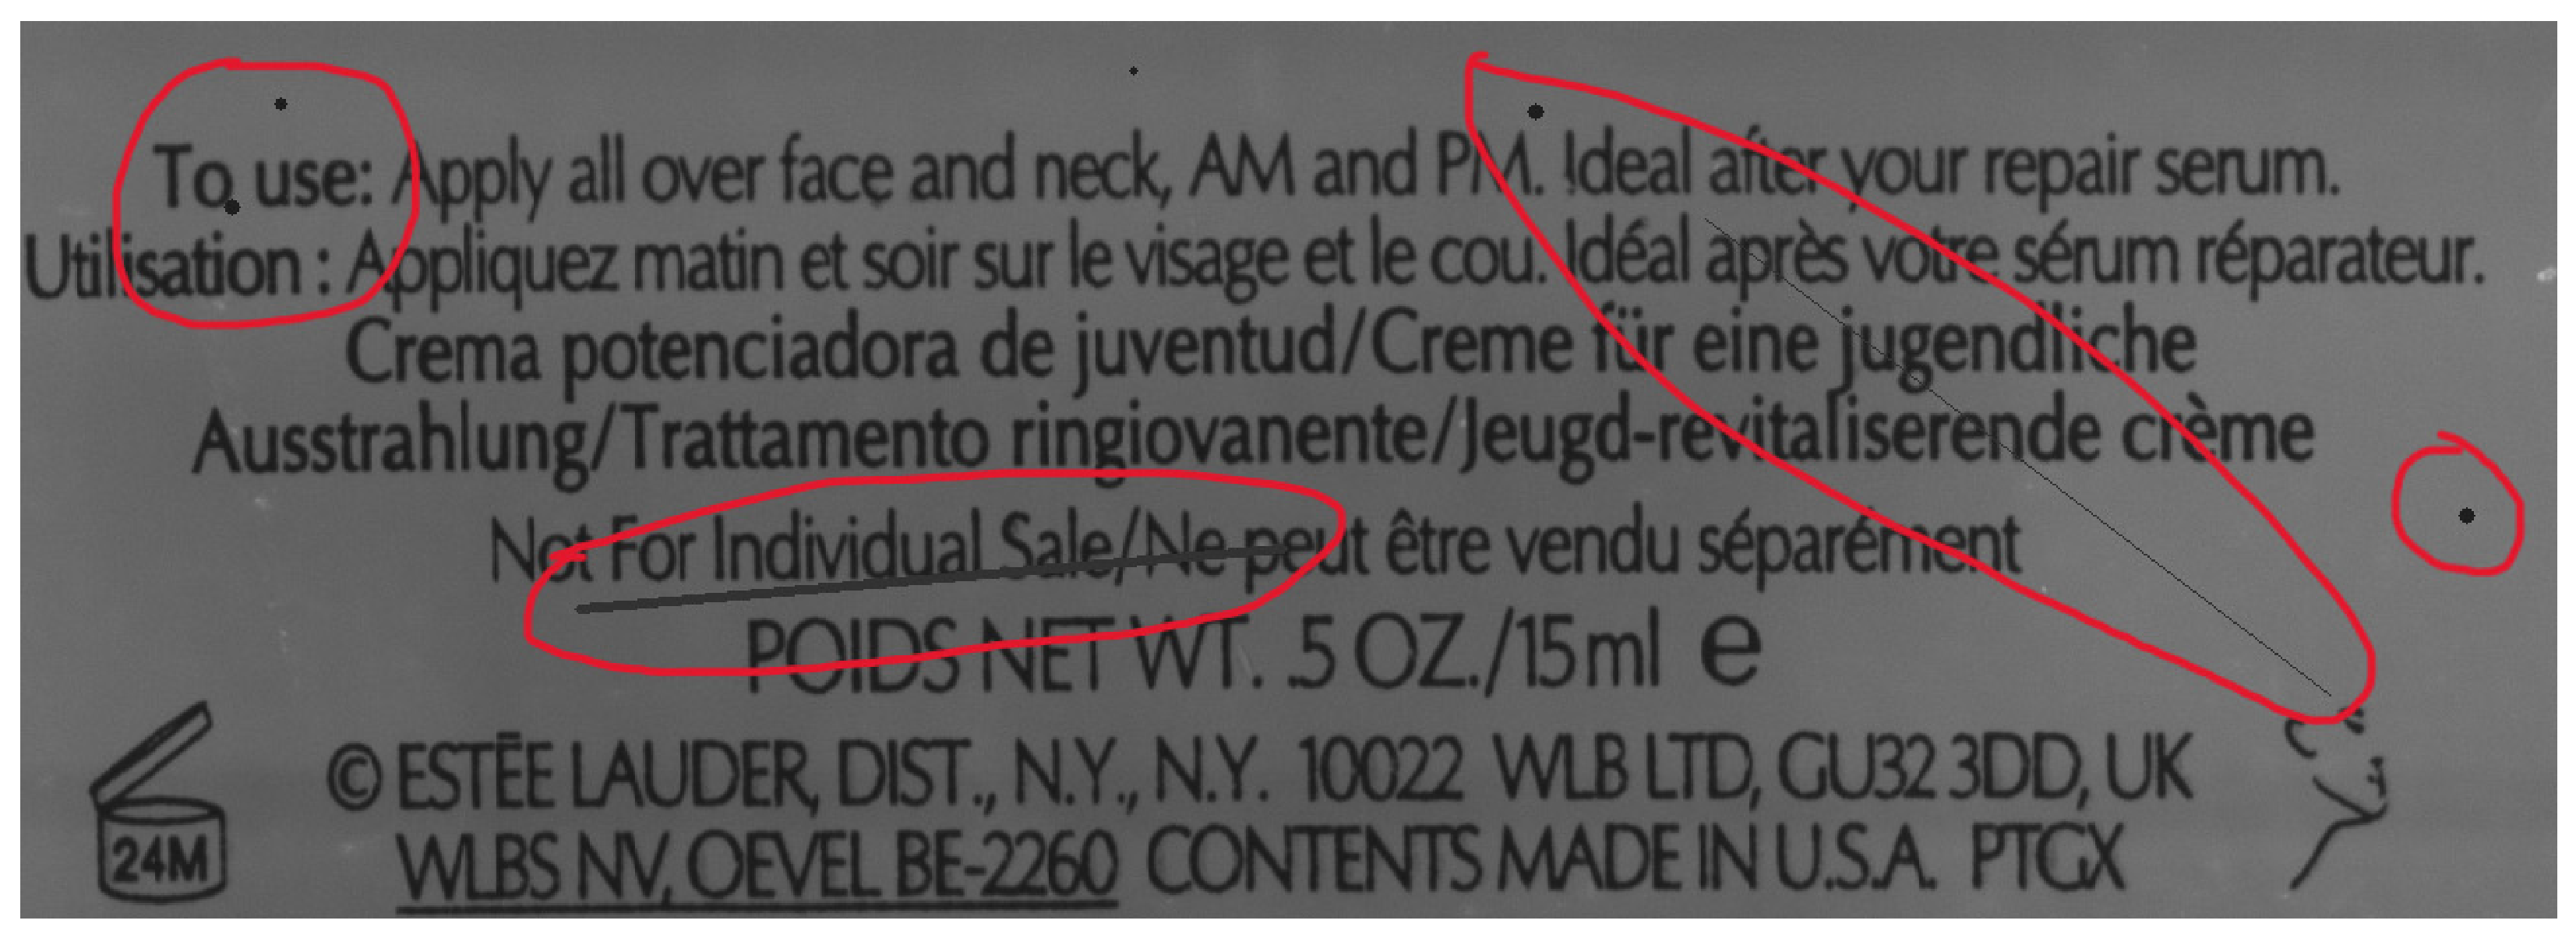
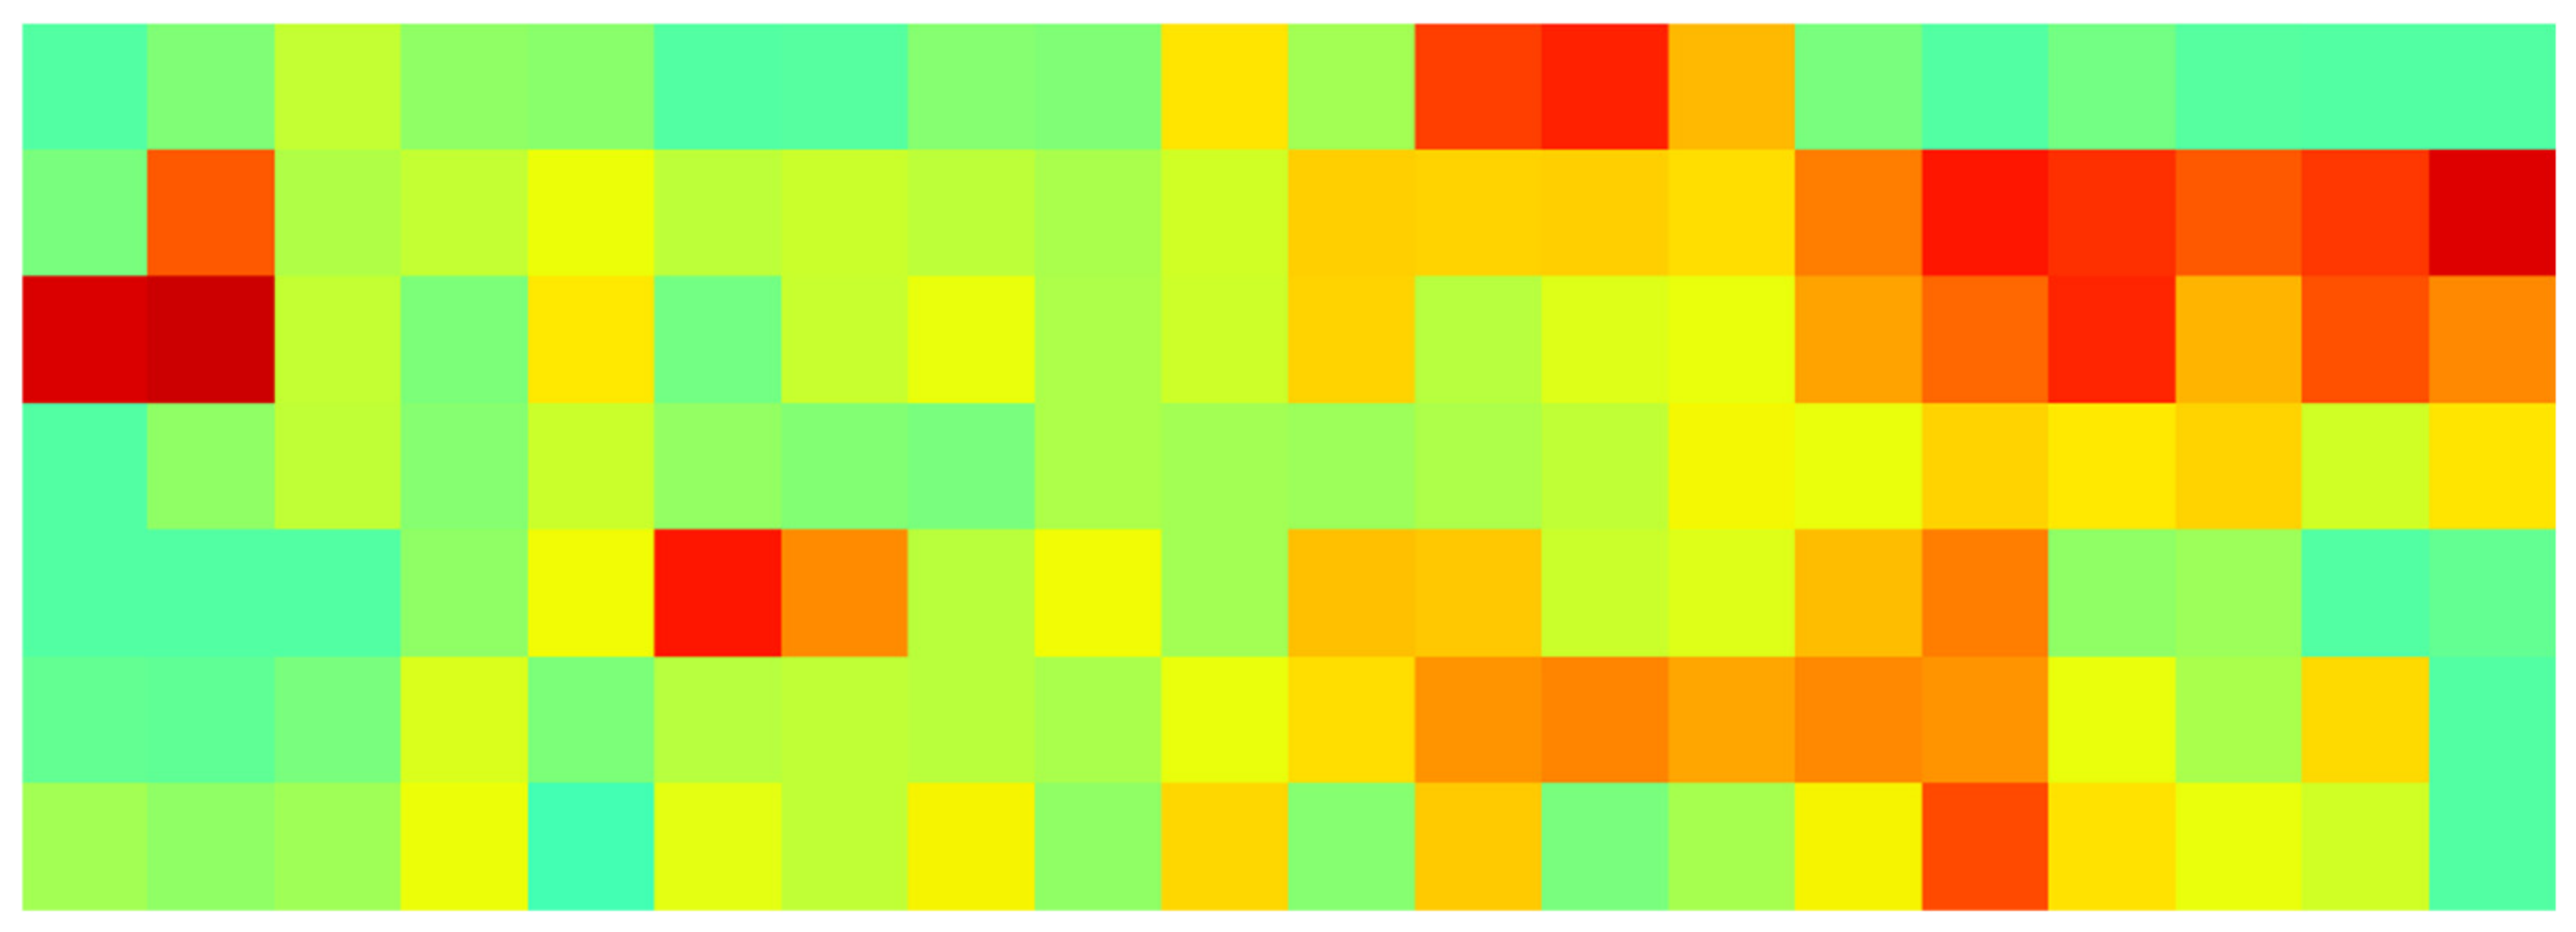
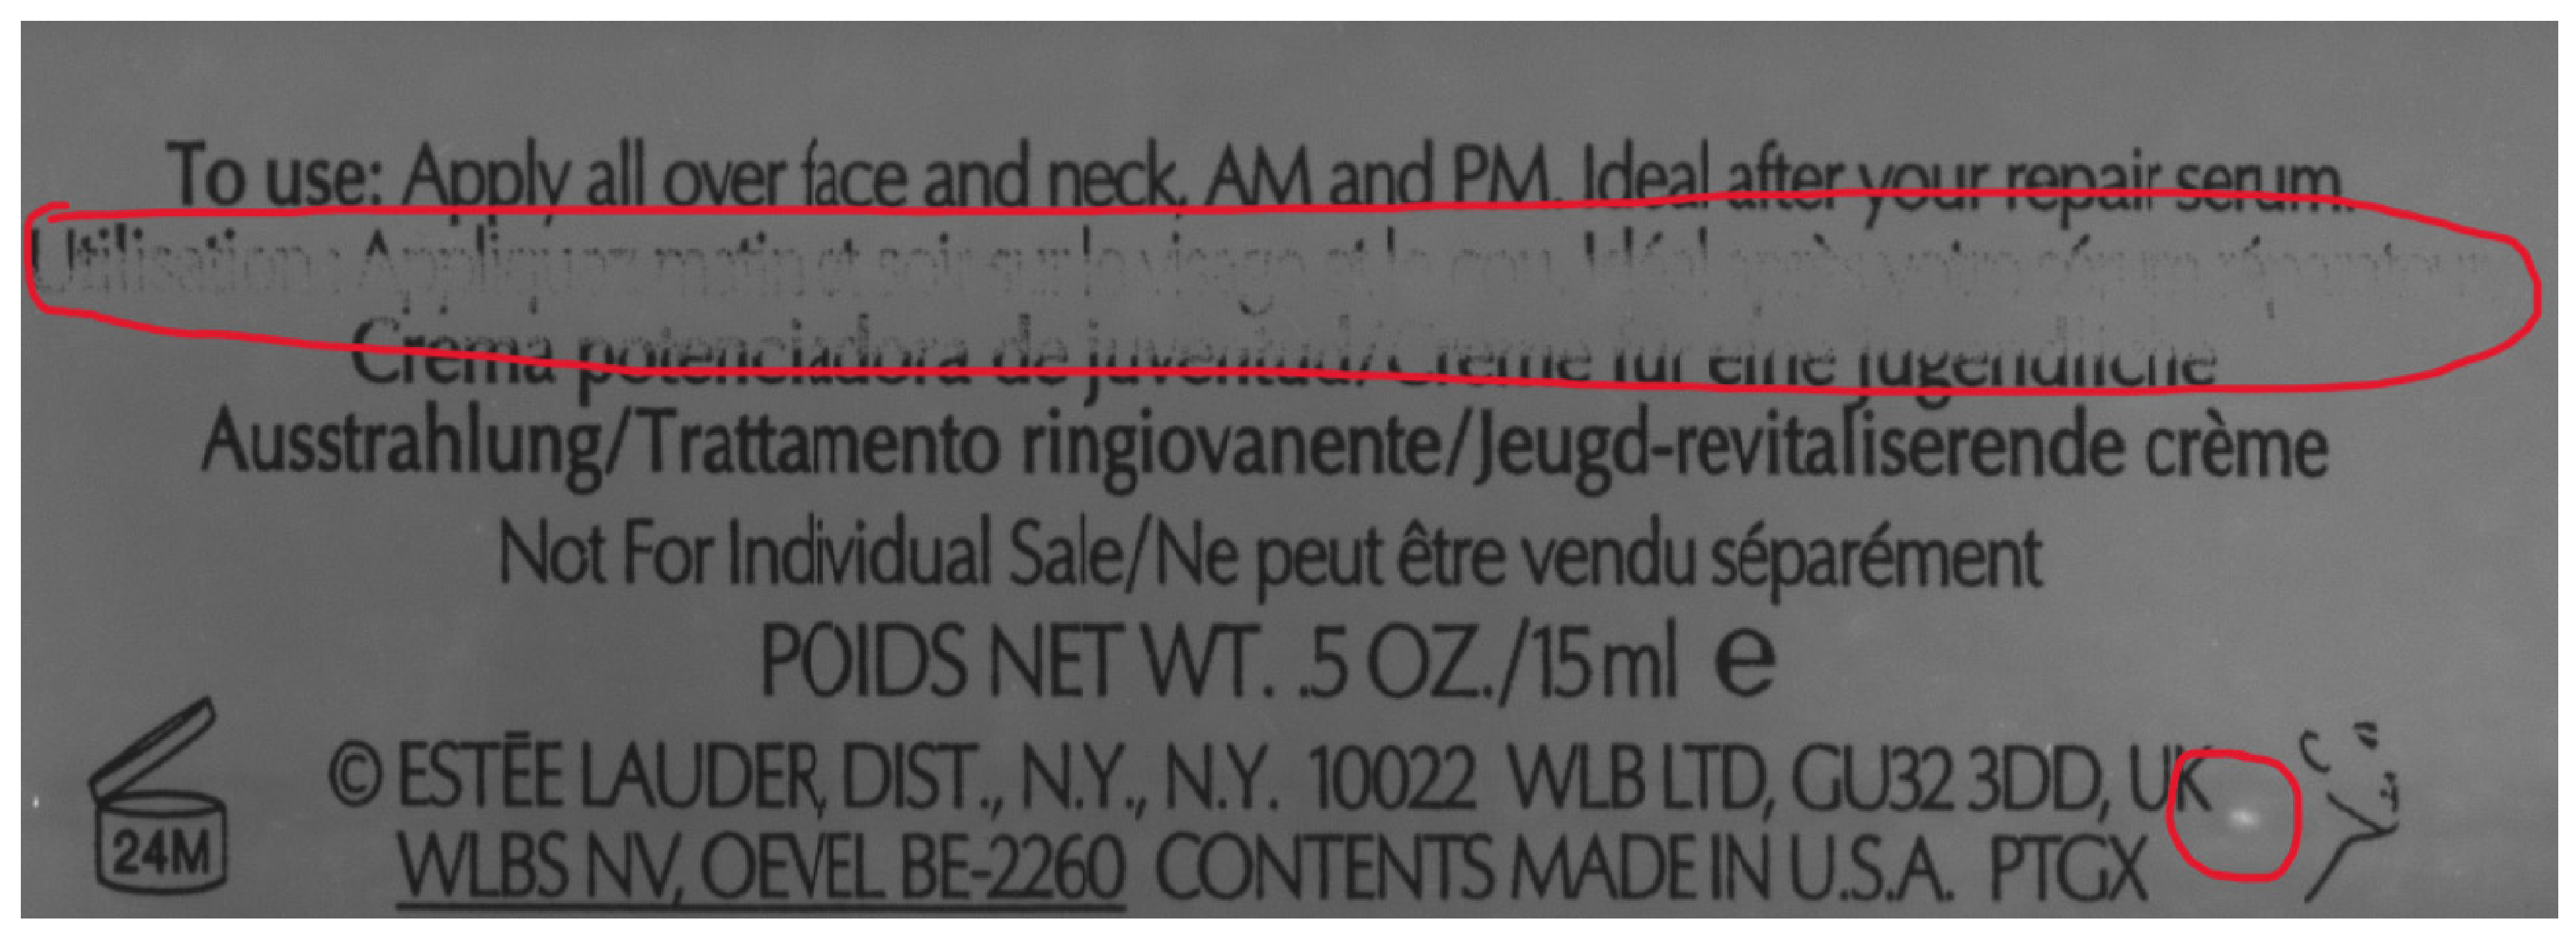
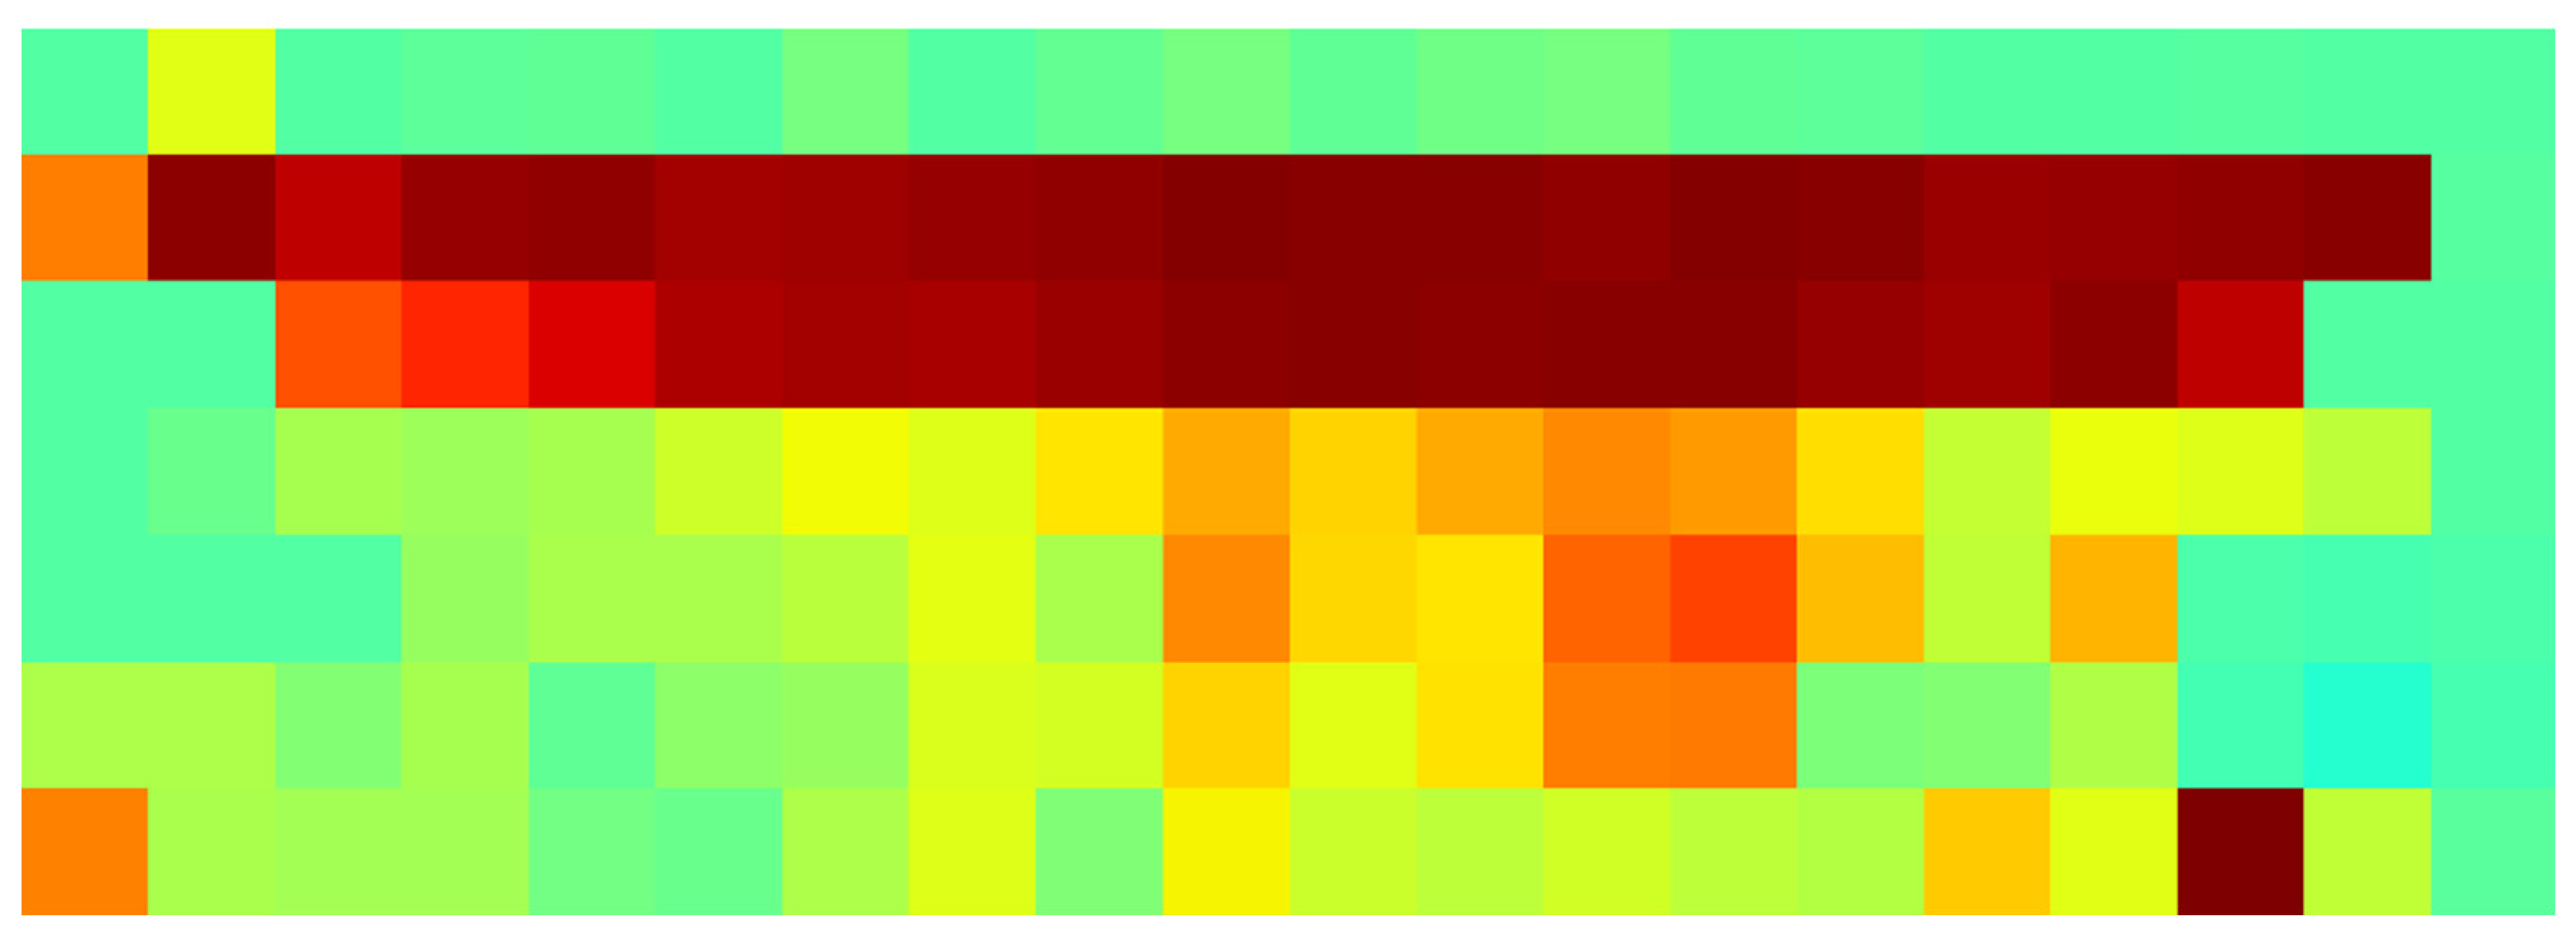
To further validate the heatmap-based defect localization capability, we provide three representative visualization examples with different defect types, as shown in Figure 6, Figure 7, Figure 8, Figure 9, Figure 10 and Figure 11. Figure 6 shows a vertical scratch defect on the right side of the printed image; Figure 8 presents another vertical scratch defect; and Figure 10 displays a horizontal scratch defect across the top region. For each example, we manually annotated the ground-truth defect region and computed the defect-region coverage, defined as the proportion of the actual defect area that is covered by the high-response regions in the heatmap. The coverage rates are approximately 90%, 80%, and 90% for the three examples, respectively, with an average coverage of ~86.7%. These results demonstrate that the proposed method can effectively localize defect regions across different defect orientations and patterns, providing a reliable qualitative visualization tool for on-site production debugging.
Figure 6.
Original test printed image001. Red circles indicate the manually annotated ground-truth defect regions.
Figure 7.
Defect probability heatmap001. The color scale represents the defect probability, ranging from blue (low probability) to red (high probability).
Figure 8.
Original test printed image002. Red circles indicate the manually annotated ground-truth defect regions.
Figure 9.
Defect probability heatmap002. The color scale represents the defect probability, ranging from blue (low probability) to red (high probability).
Figure 10.
Original test printed image003. Red circles indicate the manually annotated ground-truth defect regions.
Figure 11.
Defect probability heatmap003. The color scale represents the defect probability, ranging from blue (low probability) to red (high probability).
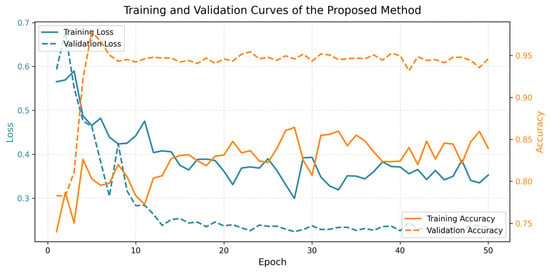
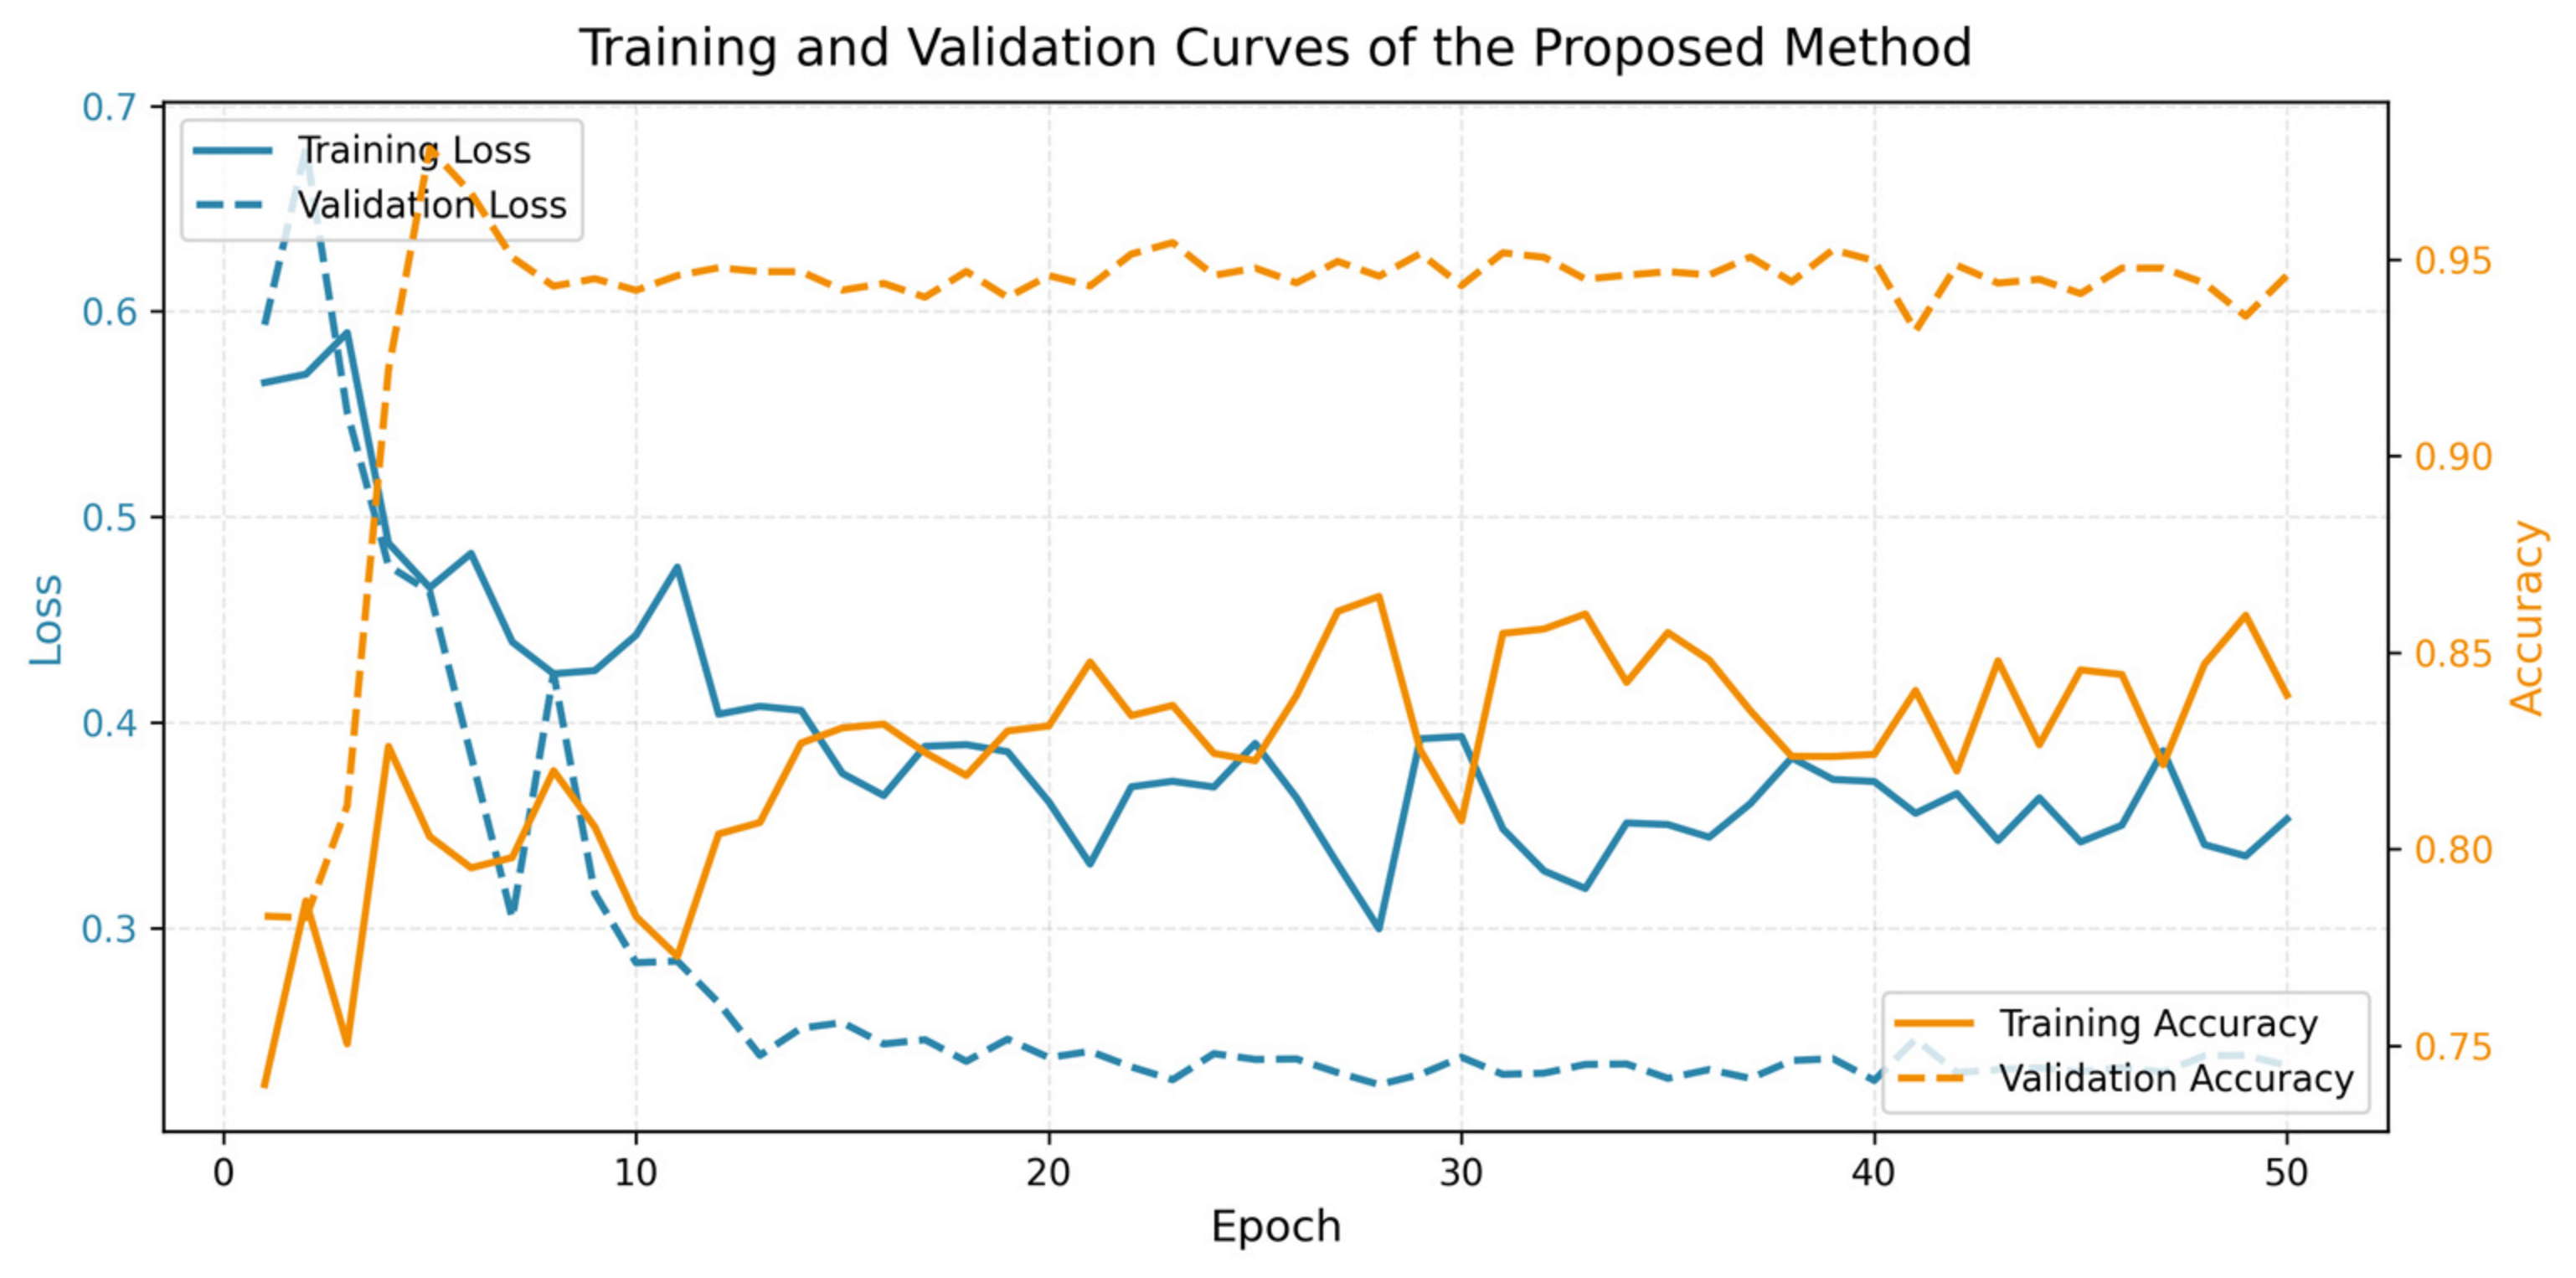
The left y-axis shows the training and validation loss, while the right y-axis shows the training and validation accuracy. The learning rate was decayed at epochs 15, 30, and 45 (step size = 15, γ = 0.1). The model converges smoothly without obvious overfitting, and the validation accuracy stabilizes around 94–95% after epoch 22.
To demonstrate the convergence behavior and stability of the proposed method, we recorded the training and validation loss and accuracy over 50 epochs, as shown in Figure 12. Both the training loss and validation loss decrease steadily throughout the training process, with no sign of overfitting (i.e., no divergence between training and validation curves). The learning rate was scheduled to decay at epochs 15, 30, and 45 (initial value: 0.001; step size: 15; decay factor: 0.1), which contributed to the stable convergence in the later training stage. The validation accuracy quickly rises above 92% within the first 5 epochs and stabilizes at approximately 94–95% after epoch 22, demonstrating the model’s fast convergence and robust generalization capability under the few-shot setting. The final model achieves a validation accuracy of 94.59% at epoch 50, which is consistent with the test performance reported in Table 3.
Figure 12.
Training and validation curves of the proposed method over 50 epochs.
Table 3.
Metric comparison at a fixed threshold of 0.45.
3.5.2. Comparative Results with Baseline Models
All five competing models are trained under identical experimental configurations [6]. Two comparison schemes are adopted: fixed threshold = 0.45 and an individual optimal threshold searched for each model. Metric results under a fixed threshold of 0.45 are summarized in Table 3.
The proposed improved Siamese network achieves the highest Accuracy (94.35%) and F1-score (93.55%) at a threshold of 0.45, significantly outperforming all baseline algorithms. MobileViTv2 obtains the highest Recall but sacrifices Precision and overall balanced performance.
Table 4 lists quantitative metrics when each model adopts its self-searched optimal threshold.
Table 4.
Metric comparison under each model’s optimal threshold.
Even when all competing models adopt their respective optimal thresholds, our method still achieves the best comprehensive performance. The proposed algorithm’s F1-score exceeds that of the second-best model (YOLOv8Lite) by 14.02 percentage points and outperforms PatchCore by 27.54 percentage points. The optimized feature normalization and position matching modules effectively solve the unstable similarity measurement problem of traditional Siamese networks on micro-printed defects, demonstrating strong adaptability to few-shot industrial inspection tasks [5].
YOLOv8Lite delivers balanced performance suitable for scenarios with moderate false positive tolerance. Transformer-based architectures (MobileViTv2, Swin-Tiny) achieve high Recall but suffer severe false alarms. ConvNeXt-V2 and PatchCore rely on extremely low thresholds to capture most defects, generating massive false positives and limiting practical industrial deployment. As an unsupervised model, PatchCore cannot effectively distinguish normal and defective printed patches with limited normal reference samples, leading to the worst overall performance [17].
3.5.3. Ablation Study on Position Matching
To evaluate the individual contribution of the position matching module, we conducted an ablation experiment by removing it from the full framework. As shown in Table 5, the full model achieves an F1-score of 94.69%, while the variant without position matching drops dramatically to 60.23%. This significant degradation demonstrates that position matching is not merely an optional enhancement but a fundamental prerequisite for the Siamese framework to function correctly in printed surface defect detection. Without spatial alignment, the comparison between the normal reference patch and the test patch becomes meaningless, as features from different spatial positions cannot be meaningfully contrasted. This result strongly validates the necessity of the position matching design in our proposed method.
Table 5.
Ablation study on the position matching module.
Due to the current code architecture where feature normalization and optimized contrastive loss are integrated into the core training pipeline, we have not been able to isolate their individual contributions in this revision. However, we acknowledge this limitation and have added dedicated component-wise ablation as a prioritized item in our future work.
3.5.4. Computational Efficiency of the Proposed Method
To verify the practical deployment potential of our proposed method, we evaluated its computational efficiency on the same hardware platform (NVIDIA GeForce RTX 4060 Laptop GPU). The model was tested in inference mode with a batch size of 1, and the average inference time was computed over 100 runs after 10 warm-up iterations to eliminate initialization overhead. As shown in Table 6.
Table 6.
Table of Computational Efficiency of the Proposed Method.
Based on these figures, a complete 1300 × 460 printed image—which is segmented into approximately 168 patches with a non-overlapping sliding step of 64 pixels—can be fully processed in ~143 ms (168 patches × 0.85 ms), corresponding to a throughput of approximately 7 Frames Per Second (FPS) for full-image inspection. It should be noted that this throughput is calculated under the condition of non-overlapping patch extraction for full-image inference. If overlapping patches (step = 32 pixels) are used, the number of patches increases to approximately 330, and the full-image processing time becomes ~280 ms (~3.6 FPS). In practical industrial deployment, the sliding step can be adjusted according to the specific speed requirements of the production line. Given that typical printed product inspection lines operate at 1–5 images per second for high-resolution full-frame inspection [20], our method provides sufficient processing speed for real-time deployment. Furthermore, the patch-level throughput of 1175 FPS ensures that multiple patches can be processed in parallel on edge devices.
4. Results Discussion
From the above quantitative comparisons and visualization results, we analyze the advantages, limitations, and industrial application value of the proposed improved Siamese network.
4.1. Advantages Under Few-Shot Printed Inspection Scenarios
The dual-branch weight-sharing architecture naturally reduces dependence on massive defective training samples. The optimized contrastive loss and feature alignment modules stabilize similarity measurement for tiny dense-texture defects. The multi-threshold search pipeline eliminates artificial subjective threshold setting, balancing Precision and Recall automatically. The heatmap visualization module provides intuitive spatial defect localization, which is highly valuable for on-site production debugging [1,4].
Regarding the individual contributions of each architectural component, we acknowledge that systematic ablation experiments would provide valuable quantitative insights into the effectiveness of feature normalization, position matching, optimized contrastive loss, and other modules. While such experiments are valuable, we argue that the primary contribution of this work lies in the systematic integration and engineering deployment-oriented validation of these existing techniques for the specific problem of high-resolution printed surface defect detection under few-shot conditions, rather than the invention of any single component. Each of the incorporated modules has been independently validated in prior literature: feature normalization and L2 alignment have been shown effective in stabilizing similarity measurement in metric learning [21]; position matching has been validated for spatial consistency in patch-based comparison tasks [22]; and contrastive loss optimization has been extensively studied in imbalanced few-shot scenarios [23]. Our contribution is to assemble, adapt, and systematically evaluate these modules within a unified Siamese framework tailored to printed surface micro-defect detection, with comprehensive experimental validation on real industrial data. Nonetheless, we fully agree with the reviewers that ablation studies would strengthen the manuscript. We have added this as a prioritized item in our future work plan and will conduct dedicated ablation experiments to quantify the contribution of each module in subsequent research.
4.2. Comparison with Mainstream Detection Architectures
Lightweight CNN and Transformer models require large amounts of labeled defective samples to achieve balanced performance; their feature extraction modules are not optimized for subtle printing flaws. Unsupervised anomaly detection methods such as PatchCore cannot capture fine-grained texture differences between normal and defective prints, leading to low comprehensive F1-scores even after optimal threshold adjustment. The proposed Siamese framework achieves a better trade-off between accuracy, inference speed, and data volume requirements.
4.3. Industrial Deployment Value
The lightweight network structure supports real-time inference on edge computing devices deployed alongside printing production lines. The complete standardized data processing, training, evaluation, and visualization pipeline provides a replicable engineering solution for power communication printed product inspection [1,4].
4.4. Limitations and Future Work
Despite the promising results, several limitations and usage boundaries of the proposed method should be acknowledged.
- (1)
- First, this study currently focuses exclusively on flat 2D printed surfaces, including paper labels, plastic films, and metal nameplates. Curved or three-dimensional printed components (e.g., curved packaging, irregular-shaped electronic housings) are not covered and may exhibit different defect geometries and imaging characteristics.
- (2)
- Second, the dataset used in this work contains only 40 original printed images (20 normal and 20 defective), which limits the diversity of product types, defect categories, background textures, and illumination conditions. Although the patch-level cropping strategy yields 5600 sub-images, the underlying sample diversity remains constrained. Therefore, the reported performance should be interpreted in the context of this specific dataset, and generalization to broader industrial scenarios requires further validation.
- (3)
- Third, the proposed method is designed for binary defect classification (normal vs. defective) at the patch level and does not perform multi-class defect identification (e.g., distinguishing scratches from ink missing). For applications requiring fine-grained defect categorization, additional extension of the network architecture would be necessary.
- (4)
- Fourth, the heatmap localization module currently provides qualitative visualization rather than quantitative localization metrics (e.g., Intersection over Union or pixel-level accuracy). The visual correlation between heatmap regions and actual defect positions has been manually verified, but systematic localization evaluation is not yet established.
- (5)
- Fifth, while we have demonstrated computational efficiency on a desktop GPU platform, the model has not yet been deployed and tested on actual edge devices (e.g., NVIDIA Jetson or Raspberry Pi) in real production line environments. The reported inference speed should be considered as algorithm-level performance rather than end-to-end system-level validation.
Regarding usage boundaries, we recommend that practitioners apply the proposed method under the following conditions:
- (1)
- The inspected surface should be approximately flat;
- (2)
- The defect to be detected should be visible as local pattern anomalies within the patch size of 64 × 64 pixels;
- (3)
- The training and testing images should share similar acquisition conditions (illumination, resolution, printing quality);
- (4)
- At least a few normal and defective original images per product type should be available for few-shot training.
For scenarios that deviate from these conditions, additional adaptation and validation are strongly recommended.
Future work will address the above limitations by expanding the dataset to multi-angle, multi-spectrum printed images, introducing quantitative localization metrics for heatmap evaluation, embedding the network into edge computing platforms for field testing, and extending the framework to support multi-class defect identification.
Several recent Siamese-based defect detection studies published in Sensors also confirm that feature alignment and contrastive loss optimization effectively improve few-shot detection performance, which is consistent with the conclusions of our work.
5. Conclusions
Aiming at the few-shot micro-defect detection demand of industrial printed products, this paper proposes an improved Siamese network and constructs a standardized experimental pipeline with unified data processing, training hyperparameters, and evaluation standards. Multiple targeted optimizations including lightweight feature extraction, feature normalization alignment, optimized contrastive loss, position matching, and multi-threshold evaluation are integrated to unify detection accuracy, inference speed, and model stability under limited labeled samples.
Comparative experiments with YOLOv8Lite, MobileViTv2, ConvNeXt-V2, Swin-Tiny, and PatchCore demonstrate that the proposed method achieves superior Accuracy, Precision, Recall, and F1-scores under both fixed and self-optimized threshold settings. The integrated heatmap visualization module realizes precise spatial defect localization, satisfying real-time automatic inspection requirements on printing production lines [7].
It should be noted that the reported results are preliminary and are mainly valid for the current dataset and acquisition conditions. The dataset contains only 40 original printed images (20 normal and 20 defective), and although patch-level cropping yields 5600 sub-images, the diversity of product types, defect categories, and imaging conditions remains limited. The overlapping sliding window strategy may also introduce correlations among adjacent patches, which could slightly overestimate the effective sample diversity. Therefore, the reported performance should be interpreted with caution when generalizing to broader industrial scenarios. Future work will focus on expanding the dataset with more original images from diverse production lines, incorporating external validation sets, and testing the method under varying illumination and printing conditions to further validate its robustness and industrial applicability.
Author Contributions
R.Z. conceived the algorithm, implemented all experiments, processed the dataset, and drafted the full manuscript. C.Z. supervised the research work, revised the manuscript, and provided experimental guidance. All authors have read and agreed to the published version of the manuscript.
Funding
This research received no external funding.
Institutional Review Board Statement
Not applicable. This study only uses industrial printed image datasets and does not involve human participants or animal subjects.
Data Availability Statement
The self-built printed defect dataset generated during this study is available from the corresponding author upon reasonable request. Public datasets MVTec AD and DeepPCB referenced in the discussion section can be accessed via their official open-source repositories.
Conflicts of Interest
The authors declare no conflicts of interest.
References
- Zhang, X.X.; Sun, B.Y.; Tan, J.H. Review of defect detection methods for printed products. Res. Print. Digit. Media Technol. 2025, 2, 1–10. [Google Scholar] [CrossRef]
- Wang, R.B.; Hong, T. Few-shot defect detection in industrial scenarios: A comprehensive review of challenges, advances, and frontier trends. MATEC Web Conf. 2025, 413, 04005. [Google Scholar] [CrossRef] [Scilit]
- Li, H.S.; Tang, H.Y.; Liang, D. Color defect detection of printed matter based on convolutional neural network. Packag. Eng. 2021, 42, 170–177. [Google Scholar] [CrossRef]
- Lou, H.J. Research on Micro Defect Detection Method of Printed Matter Based on Few-Shot Learning. Master’s Thesis, Xi’an University of Technology, Xi’an, China, 2022. [Google Scholar]
- Dai, G.; Wu, X.N.; Deng, Y.J.; Tu, Y.; Zhang, F.; Fang, H. PCB defect classification model based on siamese deep feature fusion residual network. J. Comput. Syst. Appl. 2023, 32, 188–195. [Google Scholar] [CrossRef]
- Wang, Y.X.; Chen, B. Printing defect detection method based on deep contrast network. J. Comput. Appl. 2023, 43, 250–258. [Google Scholar] [CrossRef]
- Liu, Q.; Zheng, W. Few-shot target electric field line spectrum detection algorithm for lightweight CNN. Equip. Environ. Eng. 2025, 22, 68–77. [Google Scholar] [CrossRef]
- Li, P.L. Defect Detection Algorithm and Application of Golden Finger of Printed Circuit Board. Master’s Thesis, Zhongyuan University of Technology, Zhengzhou, China, 2024. [Google Scholar]
- Yang, H.C.; Chen, C.F.; Zhang, S. YOLOv8n printed circuit board defect detection based on channel pruning. Radio Eng. 2025, 55, 271–280. [Google Scholar]
- Zhang, T.; Zhang, J.; Pan, P.F. PCB defect detection algorithm based on improved YOLOv8n. Comput. Eng. Des. 2025, 46, 2012–2020. [Google Scholar] [CrossRef]
- Liu, Y.; Fu, Y.Q.; Wen, T.X. MobileViTv2-ResUNet: U-shaped transformer architecture for precise retinal vessel segmentation. In Proceedings of the 2024 International Conference on Optics, Electronics and Communication Engineering; SPIE: Bellingham, WA, USA, 2024. [Google Scholar] [CrossRef] [Scilit]
- Fu, H.; Liu, P.; Wang, R.H. Classification of stellar spectral data based on improved ConvNeXt-V2. In Proceedings of the 2023 5th International Conference on Frontiers Technology of Information and Computer; IEEE: Qingdao, China, 2023; pp. 129–132. [Google Scholar] [CrossRef] [Scilit]
- Zou, C.J.; Ge, Z.Y.; Zhong, C.X. Sequential image prediction network for fluid-structure interaction based on spatial-temporal Swin Transformer. J. Syst. Simul. 2026, 38, 112–124. [Google Scholar] [CrossRef]
- Li, F.; Yu, Z.; Gao, J.; An, Q. Brake Discs Surface Defect Detection Using the IGD-IHT Algorithm and the PIQEDS-ISSA-NESN Algorithm. Instrumentation 2024, 11, 62–73. [Google Scholar]
- Zhang, L.; Liu, X.; Zhang, C.; Hou, Y.; He, X.; Tang, S. A High-quality Ellipse Detection Method for Machine Vision Based on Geometric Constraints and Hierarchical Clustering. Instrumentation 2025, 12, 39–52. [Google Scholar]
- Zuo, F.; Liu, J.; Ren, Y.; Wang, L.; Wen, Z. A Reliable Bolt Key-Points Detection Method in Industrial Magnetic Separator Systems. IEEE Trans. Instrum. Meas. 2025, 74, 1–10. [Google Scholar] [CrossRef] [Scilit]
- Li, B.; Gan, G.Z.; Liu, S.Y. Surface defect detection algorithm for memory heat sink based on improved PatchCore. Electron. Meas. Technol. 2025, 48, 163–171. [Google Scholar] [CrossRef]
- Jia, H.; Wu, X.Z.; Xue, Y. Few-shot citrus defect detection based on transfer learning and data augmentation. Agric. Technol. 2024, 44, 23–27. [Google Scholar]
- Li, L.J. Design and Implementation of Surface Defect Detection System for LED Packaging Based on Machine Vision. Master’s Thesis, Chongqing University, Chongqing, China, 2022. [Google Scholar]
- Chen, L.; Chia, C. A Study of Introducing Real-time Object Detection Algorithm into Screen Printing Thermal Transfer Printed Label Defect Detection. In 2024 4th International Symposium on AI (ISAI); IEEE: Piscataway, New Jersey, USA, 2024; pp. 27–32. [Google Scholar] [CrossRef] [Scilit]
- Nguyen, V.N.; Løkse, S.; Wickstrøm, K.; Kampffmeyer, M.; Roverso, D.; Jenssen, R. SEN: A Novel Feature Normalization Dissimilarity Measure for Prototypical Few-Shot Learning Networks. In Proceedings of the European Conference on Computer Vision (ECCV); Springer: Berlin/Heidelberg, Germany, 2020; pp. 118–134. [Google Scholar] [CrossRef] [Scilit]
- O’Neill, J. Siamese Capsule Networks. arXiv 2018, arXiv:1805.07242. [Google Scholar] [CrossRef] [Scilit]
- Gómez-Silva, M.J.; Armingol, J.M.; de la Escalera, A. Deep Part Features Learning by a Normalised Double-Margin-Based Contrastive Loss Function for Person Re-Identification. In Proceedings of the 12th International Joint Conference on Computer Vision, Imaging and Computer Graphics Theory and Applications (VISIGRAPP); VISAPP; SciTePress: Setúbal, Portugal, 2017; Volume 6, pp. 277–285. [Google Scholar] [CrossRef] [Scilit]



Disclaimer/Publisher’s Note: The statements, opinions and data contained in all publications are solely those of the individual author(s) and contributor(s) and not of MDPI and/or the editor(s). MDPI and/or the editor(s) disclaim responsibility for any injury to people or property resulting from any ideas, methods, instructions or products referred to in the content. |
© 2026 by the authors. Licensee MDPI, Basel, Switzerland. This article is an open access article distributed under the terms and conditions of the Creative Commons Attribution (CC BY) license.