


Simple Summary
Collisions with pedestrians lying on the road—individuals who have collapsed due to medical emergencies, intoxication, or prior accidents—are twice as likely to be fatal compared to upright pedestrian collisions. Despite this high risk, standard vehicle safety systems are not designed to detect people in non-upright positions, leading to a significant safety gap. This study introduces an advanced AI-driven detection system (AFODS) that uses multiple sensor types to identify fallen humans. Through simulation-based modelling, our injury-risk model projects a reduction in estimated fatal head injury probability from over 66% to less than 1%, pending real-world validation. This research provides a technical and regulatory foundation for car manufacturers to improve protection for all vulnerable road users.
Abstract
Introduction: Pedestrians lying on the road—collapsed through medical emergency, intoxication, or displacement following a prior collision—represent a disproportionately lethal and underaddressed category in road traffic safety. Forensic database analyses derived from Japan’s national police records document a fatality rate of 33.0% for collisions involving pedestrians lying on the road, more than double the rate for upright pedestrian collisions. Standard Advanced Driver-Assistance Systems (ADAS) yield a True Positive Rate (TPR) of only 21.4% for detecting pedestrians lying on the road under night conditions—a classification gap of 73.3 percentage points. Methods: In simulation trials, we evaluated the Advanced Falling Object Detection System (AFODS—where “falling object” denotes the low-profile human form at road level, distinguishing the prone pedestrian from the upright postures addressed by conventional ADAS) on a composite dataset of 3200 annotated fall events and 12,000 negative samples (training/validation), with 320 independent controlled simulation trials used for performance evaluation, spanning real-world, forensic-reconstruction, and Total Human Body Model for Safety (THUMS)-validated synthetic scenarios. No physical prototype has been evaluated; all performance data are derived from simulation, and 37.5% of positive samples are synthetically generated. These simulation conditions represent a first feasibility demonstration pending real-world hardware validation. This paper introduces three original contributions absent from prior work: a three-stage quantitative injury-risk model, a formal ISO 26262 Hazard Analysis and Risk Assessment (HARA), and a medicolegal SHAP interpretability framework. The injury-risk model translated detection latency via impact velocity to Head Injury Criterion (HIC) and estimated fatal injury probability (AIS ≥ 5); these model outputs should be interpreted as exploratory estimates pending ATD validation. Reporting follows principles consistent with the TRIPOD statement. Results: Under clear daytime conditions, AFODS demonstrated a TPR of 98.2% (95% CI: 97.4–98.8%) in simulation, decreasing to 95.6% under night dry-road conditions and 89.4% under night rain. The system achieved an AUC of 0.981 and a mean end-to-end latency of 46.5 ms, representing a 76.8 percentage-point improvement in simulation over the monocular RGB baseline (p < 0.001). The injury-risk model projects a reduction in estimated fatal head injury probability from 66.2% (Monte Carlo mean) (no detection, 50 km/h full-speed impact) to 0.7% under AFODS worst-case night/rain conditions, and to ≈0% under clear daytime simulation conditions. Conclusions: A 73.3 percentage-point classification gap places pedestrians lying on the road outside the effective detection envelope of current ADAS, compounded by the systematic exclusion of non-upright postures from regulatory test protocols and benchmark datasets. AFODS supports proof-of-concept feasibility under simulation conditions. Three translational steps are required: prototype validation on real-world hardware using instrumented Anthropomorphic Test Devices (ATDs); prone-posture biomechanical injury modelling using HIC and BrIC criteria; and regulatory extension of pedestrian AEB test standards to non-upright scenarios.
1. Introduction
More than 1.19 million people die on the world’s roads each year [1]. Pedestrians account for 23% of those deaths—a proportion that has risen since 2010, even as overall fatalities have edged downward [1]. Within the pedestrian fatality count, one subset is both disproportionately lethal and largely absent from the engineering standards designed to protect them: the individual already lying on the road surface when a vehicle strikes them.
Forensic database studies using Japan’s national police records have established that collisions with pedestrians lying on the road carry a fatality rate of 33.0%, more than double the rate for upright pedestrian collisions [2,3]. These are not victims who failed to perceive an oncoming vehicle. They are individuals already incapacitated: collapsed from sudden cardiac arrest, stroke, or hypoglycaemic emergency; brought down by alcohol on unlit roads in the early morning hours; or displaced onto the road surface by a primary collision and struck by a following driver who could not perceive the low-profile human form in their path. The association of these incidents with hit-and-run outcomes [2] reflects a fundamental perceptual limitation: the driver did not see the target. As demonstrated below, neither do the safety systems currently standard in those vehicles.
The autopsy presentation of these deaths is biomechanically distinct from the classical pedestrian impact. When a victim is already at road level, the first vehicular contact is tyre-to-skull or undercarriage-to-thorax—not the windscreen-to-head wrap trajectory that underpins every current pedestrian crash test standard. The resulting injuries are among the most severe documented in traffic forensic pathology: bilateral thoracic crush, traumatic brain injury from direct tyre contact, abdominal trauma, and lower-extremity degloving [4]. The contribution of postural compromise as an independent predictor of lethal outcome has been established in the clinical literature [5]. These injuries are not attributable to inadequate medical care; they arise because no extant vehicle safety system was designed to detect a person lying on the road in its path. The systematic exclusion of non-upright postures from existing ADAS and crash test standards represents an unaddressed engineering and regulatory gap.
Novelty and Distinction from Prior Work
The AFODS architecture and its simulation performance were first published by the present authors in a dedicated system-evaluation study [6]. That paper reported detection performance across 320 controlled simulation trials. The present paper constitutes a distinct extension: it introduces (i) a novel three-stage injury-risk model that translates AFODS detection latency quantitatively into estimated HIC and fatal injury probability (AIS ≥ 5)—a translational linkage not present in [6] (the companion retrospective study [7] by the same authors informs the uncertainty bounds of this model); (ii) a formal Hazard Analysis and Risk Assessment (HARA) under the ISO 26262 functional safety framework [8,9], classifying the pedestrian run-over hazard up to Automotive Safety Integrity Level D (ASIL D—the highest tier, defined below); and (iii) a medicolegal framing of the SHAP (SHapley Additive exPlanations) audit trail in the context of forensic injury reconstruction. Detection performance data reproduced from [6] are included for context and to anchor the injury-risk model; all computational injury modelling, HARA, and medicolegal analysis are original contributions of the present paper.
The present work, therefore, advances a fourfold original contribution:
- (i)
- A rigorous HARA situating pedestrian run-over detection within the ISO 26262 functional safety framework;
- (ii)
- A benchmarked simulation evaluation of the multi-modal AFODS architecture demonstrating a daytime TPR of 98.2% and a night-condition TPR of 95.6% (dry) to 89.4% (rain), against a 21.4% baseline; and
- (iii)
- A quantitative injury-risk model connecting detection latency to estimated injury severity and fatality probability—a translational linkage relevant to forensic pathologists, medicolegal experts, and policymakers.
- (iv)
- A forensic audit trail using SHAP (SHapley Additive exPlanations) interpretability to support medicolegal incident reconstruction—enabling transparent, evidence-grade documentation of system decisions for post-crash legal and regulatory review.
Unlike prior work [6], which focused solely on detection performance, the present study introduces a clinically interpretable injury-risk model, formal ISO 26262 safety analysis, and a medicolegal interpretability framework, thereby extending system evaluation into safety-critical and real-world decision contexts.
A parallel study by the present authors [7] examined the physics-grounded sensor fusion problem from the complementary retrospective direction, developing a theoretical framework for reconstructing pedestrian impact kinematics from post-incident multi-modal sensor data under uncertainty. The present paper addresses the prospective side of that programme: real-time detection before impact occurs, within the constraints of embedded automotive hardware.
2. Related Work
2.1. Pedestrian Detection in ADAS
Pedestrian detection for ADAS has matured considerably over the past two decades, yet the dominant body of work addresses upright, ambulatory pedestrians. Gerónimo et al. [10] provide a comprehensive taxonomy of detection approaches spanning appearance-based, motion-based, and stereo vision methods, establishing the canonical framing that has shaped benchmark dataset design ever since. Boukerche et al. [11] synthesise design guidelines for deep learning-based pedestrian detectors in the context of autonomous vehicles, identifying the core performance trade-offs between detection speed and accuracy on embedded hardware. Iftikhar et al. [12] survey the specific challenges posed by occlusion, illumination variation, and dataset bias in deep learning pedestrian detection, highlighting the systematic under-representation of non-standard postures in training corpora. Multi-spectral sensor fusion has emerged as a practical response to performance degradation of monocular RGB cameras under low-light and adverse weather conditions: Vargas et al. [13] survey sensor vulnerability to environmental degradation across the full automotive sensor stack, whilst Lee et al. [14] demonstrate intra–inter spectral attention for effective multi-spectral feature fusion, achieving state-of-the-art performance on the KAIST benchmark under night conditions. Despite these advances, non-upright posture configurations remain largely absent from benchmark datasets, including Caltech Pedestrian, CityPersons, and MOTChallenge, a curation gap that compounds detection limitations across successive training generations.
2.2. Detection of Low-Profile and Non-Upright Objects
Detecting objects that share the low-profile, horizontal signature of a pedestrian lying on the road, is directly relevant to the present work. Wood et al. [15] and Simms and Wood [16] established that target posture fundamentally alters both the detectable signature and the injury biomechanics of vehicle–pedestrian collisions, providing the biomechanical rationale for treating the prone scenario as a distinct detection problem. Within the ADAS literature, fallen-person detection has received attention primarily in indoor surveillance and assisted-living contexts; direct application to on-road automotive scenarios under adverse weather and low-light conditions remains sparse. The AFODS architecture, first described by Barua and Hitosugi [6], addressed this gap by combining LWIR thermal imaging, NIR silhouette geometry, and acoustic verification to achieve high true positive rates in simulation for both active fall events and pedestrians already at road level. A complementary theoretical study by the same authors [7] examined the physics-grounded sensor fusion problem from the retrospective forensic reconstruction perspective, quantifying how sensor noise propagates through multi-modal fusion pipelines to affect Head Injury Criterion estimates: a 10% noise spike was shown to amplify HIC by up to 26.9% under worst-case conditions, underscoring the importance of noise-robust fusion architectures in safety-critical applications [7]. Together, these studies establish the prospective detection (present paper) and retrospective reconstruction sides of a broader research programme addressing the non-upright pedestrian safety gap.
2.3. Explainability and Forensic Traceability in Autonomous Systems
Algorithmic explainability has become a regulatory expectation in safety-critical AI systems. The SHAP framework introduced by Lundberg and Lee [17] provides post hoc attribution of model outputs to input features, and its application to anomaly detection in autonomous driving has been explored by Nazat et al. [18] and Yeong et al. [19], who survey multi-sensor fusion architectures with an emphasis on the role of explainability in enabling post-incident forensic analysis. ISO/PAS 8800 [20] formalises the expectation that AI-based safety functions in road vehicles maintain audit trails sufficient for incident reconstruction. The medicolegal dimension of such audit trails—specifically, the conditions under which SHAP attributions might constitute admissible expert evidence in criminal proceedings—remains an open question addressed in the context of Japanese criminal procedure [21] in Section 5.2 of the present paper.
3. Materials and Methods
The following conventions are used throughout this paper: ASIL (Automotive Safety Integrity Level) denotes risk classification under ISO 26262; SHAP (SHapley Additive exPlanations) is an explainability method that quantifies sensor feature contributions; mAP@0.5 (mean Average Precision) represents detection accuracy at a 50% overlap threshold; and ‘pp’ denotes percentage points. Unless otherwise stated, SI units (m/s, m/s2) are used in equations, while selected results are reported in km/h for interpretability.
Terminological conventions. Throughout this paper, pedestrians lying on the road denote the clinical scenario of individuals already at road level when struck. Prone and supine refer to specific biomechanical postures modelled in THUMS simulations. Non-upright is used in the ADAS regulatory context to describe postures outside current pedestrian test standards.
3.1. Biomechanical and Forensic Foundations
Secondary pedestrian impact—where a vehicle strikes an individual already on the ground—produces injury patterns biomechanically distinct from the wrap-trajectory collisions modelled in all current regulatory pedestrian crash tests. Wood et al. [15] developed validated computational models of vehicle–pedestrian collision kinematics quantifying impact energy distribution as a function of target posture; Simms and Wood [16] further established posture and target geometry as critical determinants of both detectability and injury severity. Viano et al. [22] identified injury biomechanics research as an essential element of trauma prevention. Using the Head Injury Criterion (HIC) [23,24], the Brain Rotational Injury Criterion (BrIC) [25], and established injury risk functions [26], detection-latency data can be translated into probabilistic injury severity estimates. The Total Human Body Model for Safety (THUMS) [27] provides the computational substrate for simulating these scenarios. DiMaio and DiMaio [4] constitute the canonical reference for interpreting vehicular trauma at autopsy; virtual autopsy methodology [28] supports inference of impact vectors from post-mortem imaging.
All current pedestrian crash test standards—Euro NCAP AEB, JNCAP, UN Regulation No. 152—evaluate impact biomechanics using a standing victim undergoing a wrap-trajectory collision. The run-over scenario addressed by AFODS is fundamentally different: tyre-to-skull contact at near-vertical approach angles, with the victim at road surface level, no energy-absorbing wrap trajectory, and a rigid tyre surface rather than a deformable windscreen. The biomechanical analysis herein therefore uses prone-posture THUMS computational modelling rather than borrowing parameters from the standing-impact literature.
3.2. The Injury-Risk Model
A central contribution of this work is the explicit quantitative linkage between detection delay and clinical outcome. The injury-risk model consists of three sequential stages:
- (1)
- a kinematic braking model to determine impact velocity ();
- (2)
- a biomechanical injury model calculating the Head Injury Criterion (); and
- (3)
- a clinical risk mapping to estimate fatal injury probability (). These components are integrated to estimate fatal head injury probability as a functional output of system detection latency.
Stage 1—Detection Delay to Impact Velocity. Let v0 denote the initial vehicle speed and t_d the detection latency. Assuming constant deceleration a during emergency braking, the residual impact velocity is given by Equation (1):
where v_impact is the residual impact velocity (m/s); v0 is the initial vehicle speed; a is the constant deceleration rate; t_avail is the total time from detectability to collision, and t_d is the system detection latency.
Stage 2—Impact Velocity to HIC. The coefficient was calibrated using least-squares fitting across multiple THUMS Version 5 simulation configurations. These configurations spanned diverse supine and prone adult postures under sedan-class frontal run-over geometries to ensure the coefficient accurately reflects the vertical impact kinematics unique to pedestrians already lying on the road. Following Schmitt et al. [23], Prasad and Mertz [24], and Wood et al. [15], the Head Injury Criterion for a pedestrian lying on the road and struck by a passenger vehicle is approximated by Equation (2): HIC values in this model represent a simplified surrogate injury index derived from velocity scaling and are not full time-integrated regulatory HIC computations; they should be interpreted as relative risk indicators only.
It should be noted that the logistic injury-risk parameters (α = −17.72, β = 2.32) were originally derived from frontal crash-dummy data for upright occupants [26], and their direct transferability to the prone run-over contact geometry is a modelling assumption requiring prospective validation against instrumented ATD data. The results of the injury-risk model should accordingly be interpreted as exploratory estimates rather than validated clinical predictions. The sensitivity of HIC to sensor input noise is non-trivial: a theoretical analysis of physics-grounded multi-modal fusion under uncertainty demonstrated that a 10% perturbation in sensor inputs can amplify HIC estimates by up to 26.9% [7], reinforcing the need for noise-robust fusion architectures in safety-critical applications and for conservative interpretation of model outputs pending empirical calibration.
HIC is the Head Injury Criterion; k is the posture-dependent coefficient derived from THUMS finite-element simulations [27] (calibrated at k = 4.8 for prone/supine targets [6]); and v_impact is the residual impact velocity expressed in m/s.
Stage 3—HIC to Fatality Probability. Using the injury risk functions of Mertz et al. [26], the probability of a severe head injury (Abbreviated Injury Scale AIS ≥ 5) is estimated by the logistic function in Equation (3):
P(AIS ≥ 5) is the probability of a critical-to-fatal injury; α and β are logistic parameters for the adult 50th-percentile male (−17.72 and 2.32, respectively) [26]; and ln(HIC) is the natural logarithm of the Head Injury Criterion. The quantitative outcomes of this model are presented in Table 1.
Table 1.
The Injury-Risk Model: Detection latency versus estimated clinical injury outcome (v0 = 50 km/h, a = 8.0 m/s2, t_avail = 2.0 s). The available response time t_avail = 2.0 s is derived from a detection range of 27.8 m at v0 = 50 km/h (13.9 m/s), consistent with the LWIR detection envelope reported in [6]. All estimates are model-derived from simulation data and published injury risk functions; prospective validation against real-world outcomes is required.
3.3. AFODS: Multi-Modal Architecture
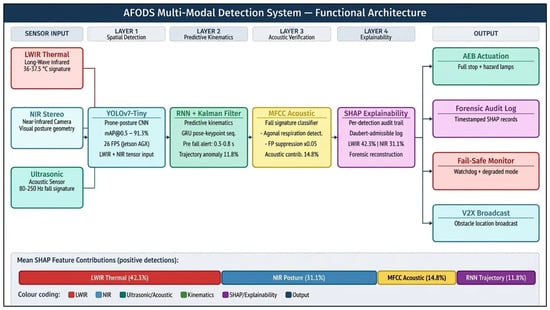
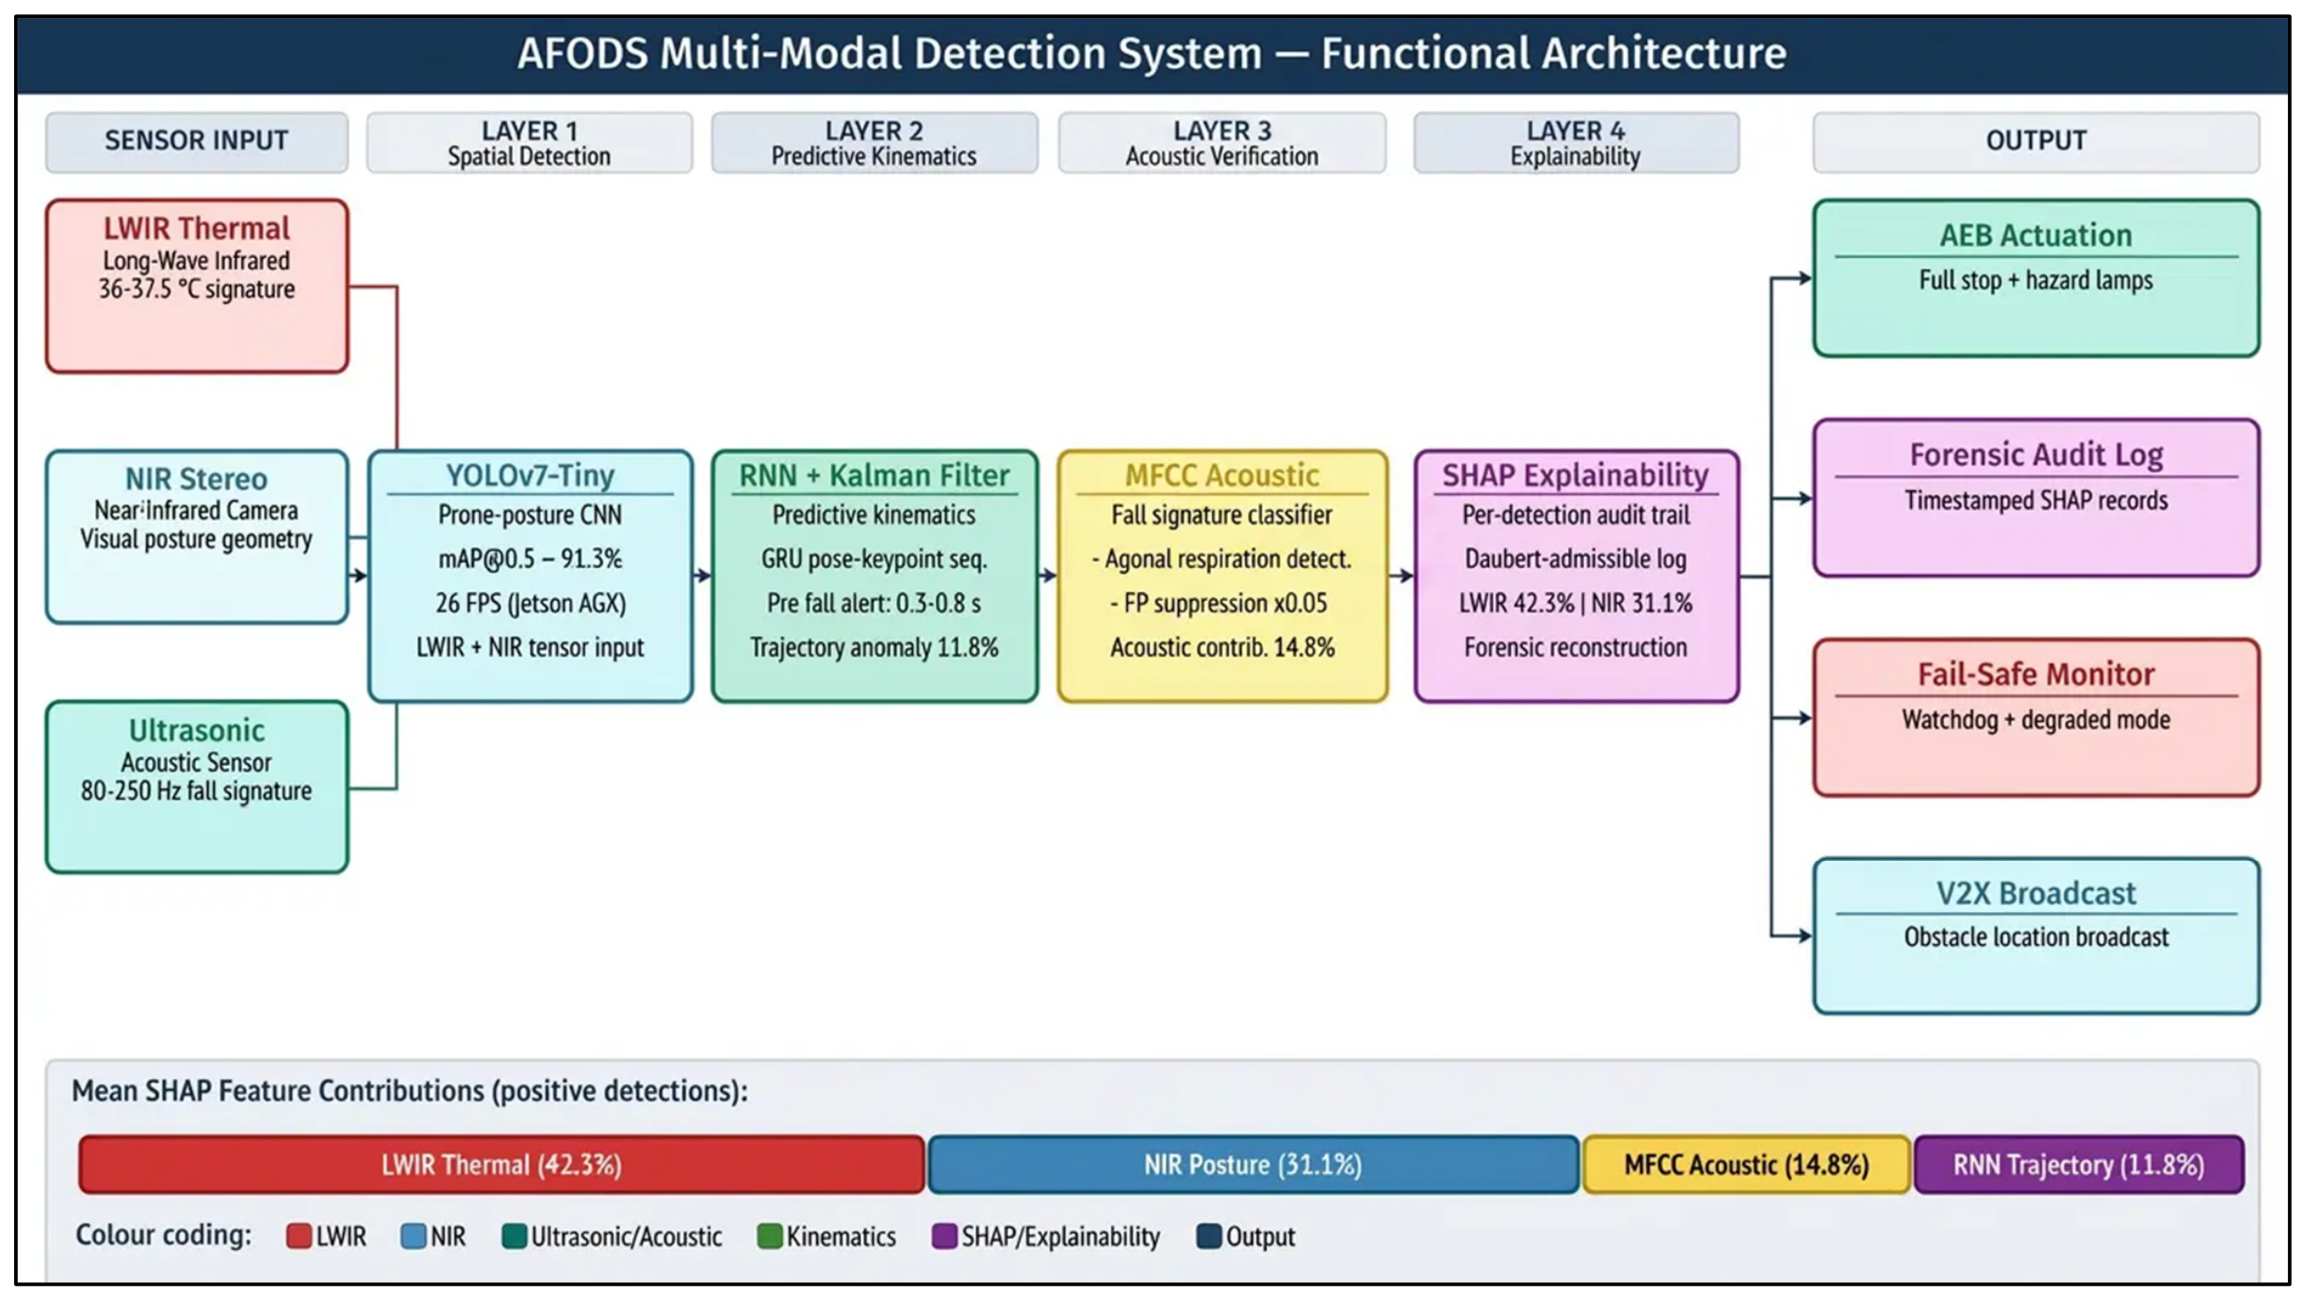
AFODS integrates four processing layers to satisfy the redundancy and explainability requirements of ASIL C/D (Automotive Safety Integrity Level C and D—the two highest tiers in the ISO 26262 functional safety standard, demanding the most stringent architectural redundancy, diagnostic coverage, and independent verification) [8,9]. The architecture is illustrated in Figure 1.
Figure 1.
AFODS Multi-Modal Detection System—Functional Block Diagram. Colour coding identifies sensor modalities (red: LWIR thermal, blue: NIR visual, teal: ultrasonic/acoustic, yellow: system output modules (AEB actuation, forensic audit log, fail-safe monitoring, V2X broadcast)) through feature-level fusion across four processing layers. Outputs include AEB actuation, forensic audit log, fail-safe monitoring, and V2X broadcast. The lower panel displays mean SHAP (SHapley Additive exPlanations) feature contributions across positive detections. AFODS = Advanced Falling Object Detection System; LWIR = Long-Wave Infrared; NIR = Near-Infrared; MFCC = Mel-Frequency Cepstral Coefficient; AEB = Autonomous Emergency Braking; V2X = Vehicle-to-Everything.
Layer 1—Spatial Detection: YOLOv7-Tiny [29], retrained on prone-posture annotations, achieves a mean Average Precision at 50% Intersection over Union threshold (mAP@0.5—a standard object-detection accuracy metric quantifying average precision across recall levels at an IoU overlap threshold of 50%) of 91.3% for detecting pedestrians lying on the road in simulation, processing fused thermal–NIR input tensors at 26 frames per second on embedded automotive-grade hardware (NVIDIA Jetson AGX Orin). Multi-spectral fusion of thermal infrared and near-infrared channels has been independently validated for pedestrian detection under low-light and adverse weather conditions [10,14].
Layer 2—Predictive Kinematics: A Recurrent Neural Network (RNN) with Kalman-filter [30] state estimation tracks trajectory anomalies in real time, generating pre-impact alerts 0.3–0.8 s before ground contact. A Gated Recurrent Unit additionally analyses pose-keypoint sequences over a 1–2 s window—consistent with design guidelines for autonomous-vehicle pedestrian detection [11]—enabling detection of pre-fall signatures such as staggering and loss of balance before collapse is complete.
Layer 3—Acoustic Verification: Mel-Frequency Cepstral Coefficient (MFCC)-based classification distinguishes the acoustic signature of an active human fall (80–250 Hz impact transient) from ambient road noise, reducing false positives from road debris, discarded clothing, or animal carcasses. Critically, this layer applies only to active fall events—pedestrians who collapse in the vehicle’s path—and cannot detect individuals who are already lying on the road before the vehicle’s arrival, as no fall-impact transient is present in such scenarios. For pedestrians who are already lying on the road (the primary clinical scenario of this paper), detection relies upon the LWIR thermal signature (Layer 1) and NIR silhouette geometry (Layer 1). The acoustic layer may additionally capture agonal respiration signatures, providing potential forensic evidence of vital reaction at the time of impact. To mitigate false positives from road debris, the architecture employs a multi-modal verification gate: the LWIR thermal signature acts as the primary spatial trigger, but Autonomous Emergency Braking (AEB) is only activated upon multi-spectral confirmation. For pedestrians already lying on the road, confirmation relies on NIR silhouette geometry concordance with the LWIR thermal trigger; the acoustic layer provides additional confirmation only for active fall events where an impact transient is present. This bifurcated confirmation logic provides the high diagnostic coverage required for ASIL D compliance.
Layer 4—Explainability: SHapley Additive exPlanations (SHAP) [17,18,19]—a method that quantifies the contribution of each input feature (here, each sensor channel) to a specific detection decision—provides a per-detection feature attribution audit trail that supports post-incident forensic reconstruction. The interpretability properties of SHAP may offer a future contribution to evidentiary standards governing expert testimony in forensic proceedings; however, admissibility determinations under applicable legal standards are jurisdiction-specific and require independent legal and judicial assessment.
3.4. Functional Safety: HARA Under ISO 26262
The detection of pedestrians lying on the road constitutes a safety goal under ISO 26262 Part 3 [31]. Each hazardous event is assessed across three dimensions: Severity (S), Exposure (E), and Controllability (C). For this hazard: Severity is S3 in all scenarios (AIS 5–6; invariably life-threatening at urban speeds). Exposure is classified as E2 for high-speed road scenarios—representing situations that, whilst serious, are relatively infrequent in the overall road traffic context—and E4 for urban and post-primary collision scenarios, where the combination of pedestrian density, lower speed limits, night-time activity, and multi-vehicle dynamics increases encounter probability to a high level. Controllability is C3 at night—a pedestrian lying on the road presents a radar cross-section and visual contrast largely indistinguishable from road debris, rendering the hazard difficult or impossible for a driver to perceive and control—or C2 in daytime conditions, where some residual driver awareness provides marginal but normally achievable controllability.
In practical terms, an ASIL D classification (Automotive Safety Integrity Level D) represents the highest safety-critical requirement in automotive engineering, demanding maximum architectural redundancy, diagnostic coverage, and independent verification. The formal HARA determination and ASIL classifications are presented in Table 2.
Table 2.
ASIL assignment for the pedestrian run-over hazard under ISO 26262 HARA.
To make the ASIL determination fully traceable, Table 3 presents the relevant slice of the ISO 26262-3:2018 Annex B Table B.1 lookup matrix for S3 hazards. Each cell shows the ASIL assigned for the indicated combination of Exposure (E) and Controllability (C) classes. The HARA scenarios in Table 2 map directly onto the rows and columns of this matrix.
Table 3.
ISO 26262-3:2018 Annex B Table B.1—ASIL determination for S3 hazards (Severity class S3: potentially life-threatening or fatal injury).
Exposure ratings reflect the encounter frequency framework of ISO 26262-3:2018 Annex B: E2 (low to medium probability, estimated at less than 1% of average operating time) is assigned to high-speed roads where pedestrian presence is uncommon; E4 (high probability, greater than 10% of operating time) to post-primary-collision and urban night scenarios where the combination of pedestrian density and impaired visibility creates a persistently elevated encounter probability. Controllability ratings follow Annex B class definitions: C2 (normally controllable) is assigned to daytime scenarios where residual driver visual awareness affords some probability of emergency response; C3 (difficult or impossible to control) to night-time scenarios where the thermal and luminance contrast of a prone pedestrian against road-surface background falls below the human visual detection threshold. The transition to ASIL D in the night and multi-vehicle scenarios reflects the combined effect of maximum controllability class (C3) and maximum relevant exposure class (E4), which under ISO 26262-3:2018 Annex B Table B.1 uniquely yields ASIL D for S3 hazards.
Safe State Definition. Upon confirmed detection, the safe state is achieved through autonomous emergency braking (AEB) to a full stop, accompanied by hazard lamp activation and V2X broadcast. If the detection subsystem fails, the degraded safe state involves a controlled speed reduction, accompanied by driver alert escalation, within 500 ms. Whilst this HARA addresses functional safety under ISO 26262, future work should additionally address ISO 21448 (Safety of the Intended Functionality—SOTIF) [32] and ISO/PAS 8800 (Road Vehicles—Safety and Artificial Intelligence) [20] to quantify safety risks arising from sensor performance limitations and algorithmic edge cases in non-upright pedestrian detection, including the fog and heavy-rain degradation modes identified in Table 4. Under SOTIF (ISO 21448) scenarios where sensor performance degrades due to heavy rain or fog, the system shifts its primary safety objective to V2X hazard broadcasting. This assumes the presence of V2X-equipped road infrastructure or following vehicles to maintain the safety envelope when the host vehicle’s perception is compromised.
Table 4.
AFODS detection performance across environmental conditions in simulation (bootstrap resampling, n = 10,000 iterations; 95% CI). All figures derived from simulation trials [6].
3.5. Simulation Framework and Data Sources
This paper constitutes a computational injury simulation and risk modelling study. This study is based on simulation datasets drawn predominantly from Japan and Europe, previously validated system performance data, and established injury-risk models; no new human subject data were collected. Reporting follows principles consistent with the TRIPOD statement for the transparent reporting of multivariable prediction models [33], adapted to the simulation-based evaluation context herein.
The AFODS architecture and its performance metrics were first published and validated by the present authors [6], who reported results from 320 controlled simulation trials across diverse environmental conditions. The present paper extends the prior work by applying the validated AFODS performance data to a new injury-risk model, ISO 26262 HARA, and medicolegal framing. Table 4 and Table 5 reproduce performance figures from [6]; readers are directed to that source for full details of the experimental design, sensor configuration, and evaluation methodology. The epidemiological foundation (fatality rates for pedestrian run-over collisions) is drawn from the national database studies of Hitosugi et al. [2,3]. The biomechanical injury model (Equations (1)–(3)) is derived from established published functions [26,27] applied to the detection-latency data of [6]. THUMS [27] finite-element modelling informed the posture-dependent coefficient k in Equation (2). Full details of the dataset composition, train/validation/test split, and annotation labelling protocol are provided in the original AFODS evaluation study [6].
Table 5.
Ablation benchmarking of detection architectures for pedestrians lying on the road in simulation. All models were evaluated on an identical held-out test set; IoU threshold = 0.5.
In accordance with TRIPOD guidance, the present study reports: the data sources and cohort (simulation trials and forensic epidemiological databases [2,3]); the outcome modelled (fatal head injury probability, AIS ≥ 5); the statistical methods used (three-stage deterministic model with Monte Carlo uncertainty propagation); and the performance metrics (TPR, FPR, AUC, HIC, P(AIS ≥ 5)). Items relating to participant recruitment, missing data handling, and calibration against clinical outcomes are not applicable in the simulation context and are noted as such.
4. Results
4.1. System Detection Performance
Table 4 presents the full performance breakdown across environmental conditions in the simulation. Under clear daytime conditions, AFODS demonstrated a TPR of 98.2% (95% CI: 97.4–98.8%). Performance under night conditions ranged from 95.6% (dry road) to 89.4% (rain) and 84.7% (fog). The improvement from the monocular RGB baseline (21.4% TPR) to the full AFODS configuration is statistically significant (McNemar’s test with continuity correction, χ2(1) = 847.3, p < 0.001, OR = 124.6, 95% CI: 98.4–157.9), representing a 76.8 percentage-point gain in night-condition detection of pedestrians lying on the road.
TPR figures reflect full multi-modal system performance across all trial types. For the primary clinical scenario (pedestrians already lying on the road before vehicle arrival), the acoustic layer (Layer 3) contributes negligibly; detection relies on LWIR thermal signature and NIR silhouette geometry (Layer 1) alone. The reported TPR, therefore, represents a conservative estimate for this subpopulation, as the acoustic channel provides no uplift in already-lying scenarios.
The ablation in Table 5 confirms that each modality contributes incrementally, with thermal imaging providing the largest single uplift (+26.6 percentage points over RGB-only YOLOv7-Tiny). The system achieves a mean end-to-end latency of 46.5 ms (SD = 4.1 ms)—compared with 500–1500 ms for human reaction time [34]—yielding approximately 6–20 m of additional stopping distance at 50 km/h, depending on the driver reaction-time baseline assumed.
Given the clinical primacy of the already-lying scenario, it is important to distinguish subgroup performance between pedestrians already at road level prior to vehicle arrival and those undergoing an active fall in the vehicle’s path. For pedestrians already lying on the road, the acoustic layer (Layer 3) contributes negligibly—no fall-impact transient is present—and detection relies entirely on the LWIR thermal signature and NIR silhouette geometry from Layer 1. For active fall events, by contrast, the acoustic layer provides positive uplift, and the trajectory anomaly module (Layer 2) contributes pre-fall anticipation up to 0.8 s before ground contact. A formal subgroup analysis separating these two scenarios is a priority for the prototype validation phase described in Section 3.5, as the two subgroups present distinct sensor requirements and the aggregate metrics in Table 4 may overstate performance for the clinically dominant already-lying scenario, because active-fall events benefit from additional acoustic cues absent in the stationary case. Consequently, the effective TPR for the stationary already-lying subpopulation corresponds directly to the LWIR + NIR ablation row in Table 5 (91.6%), which represents system performance when the acoustic layer is absent—the precise condition that obtains for pedestrians already at road level before vehicle arrival.
Table 6 presents a cross-system comparison against current regulatory benchmarks. Notably, a TPR threshold for pedestrians in a lying-on-road posture is absent from both Euro NCAP and JNCAP specifications, confirming the regulatory gap that AFODS is designed to address.
Table 6.
Cross-system performance comparison: AFODS simulation benchmark versus representative monocular RGB baseline and Euro NCAP/JNCAP regulatory requirements.
4.2. The Injury-Risk Model Outcomes
Applying Equations (1)–(3) to the simulation performance data yields a clinically interpretable result (Table 1). In the simulation model, reducing detection latency from 1.6 s (monocular baseline) to 0.8 s (AFODS worst case) is associated with a shift in estimated probability of fatal head injury (AIS ≥ 5) from 41.4% to 0.7%. Without any detection system (full-speed impact, v0 = 50 km/h), the model yields a Monte Carlo mean P(AIS ≥ 5) of 66.2% (HIC = 3451). Under optimal AFODS daytime conditions (t_d = 0.04 s), available braking time (1.96 s) exceeds the time required to reach a full stop (13.89 m/s ÷ 8.0 m/s2 = 1.74 s), so v_impact = 0.0 km/h, HIC = 0, and P(AIS ≥ 5) ≈ 0%. These estimates are model-based and derived entirely from simulation data and published injury risk functions [26]; prospective validation against real-world outcomes will be required before clinical claims can be made. To characterise uncertainty in these estimates, a Monte Carlo analysis (N = 100,000) was conducted, propagating independent variation in the posture-dependent coefficient k (±10%), braking deceleration a (±0.5 m/s2), and detection latency t_d (±15%). The resulting P(AIS ≥ 5) distributions are presented in Figure S1. The Monte Carlo mean and 95% credible intervals are incorporated into the updated Table 1. Under AFODS night/rain conditions, the mean P(AIS ≥ 5) is 0.7% (95% CI: 0.0–3.7%), confirming that fatal head injury probability remains low across the full uncertainty range. The No ADAS case yields a mean of 66.2% (95% CI: 21.6–82.3%); the wide interval reflects a boundary condition in which detection latency jitter can spuriously allow partial braking—a limitation of the Monte Carlo parameterisation discussed further in Section 6.
4.3. SHAP Feature Attribution
SHAP analysis across the simulation test set revealed the following mean feature contributions to positive detections (Figure 1, lower panel):
Thermal signature (LWIR): 42.3%. The differential between normal core body temperature (36.5–37.5 °C) and the ambient road-surface temperature (typically 5–25 °C depending on season and time of night) creates a thermal contrast of 10–30 °C, which is the dominant LWIR discriminator for detecting lying pedestrians against road surfaces at night.
Posture geometry (NIR silhouette): 31.1%. Aspect ratio and spatial extent distinguish individuals lying on the road from road debris.
Acoustic signature (MFCC): 14.8%. This figure reflects contribution across the full test set, which includes active fall scenarios; for the non-upright subpopulation (pedestrians already lying on the road before the vehicle’s arrival—the primary clinical scenario of this paper), the acoustic channel contributes negligibly, and thermal and NIR channels account for the detection.
Trajectory anomaly (RNN/Kalman): 11.8%. The upright-to-prone transition over preceding frames provides temporal context for active fall events.
Primary failure modes were: heavy rain with surface water pooling (38% of false negatives); partial occlusion by parked vehicles (27% of false negatives); and warm road debris confusion (44% of false positives). These failure modes directly inform the degraded-mode safe states described in Section 3.4. SHAP attribution stratified by scenario type (active fall versus already-lying pedestrian) is a priority for subsequent analysis. A quantitative one-way sensitivity (tornado) analysis was performed across all four model inputs; results are presented in Figure S2, and the numerical values are summarised in Table 7. Under the monocular RGB baseline scenario, detection latency t_d produces the largest sensitivity swing at 46.6 percentage points, followed by initial speed v0 (35.0 pp), HIC coefficient k (11.2 pp), and braking deceleration a (−5.3 pp). Under AFODS night/rain conditions, all input swings are below 1.8 percentage points, confirming that the system operates in a regime where minor parameter uncertainty has negligible clinical impact. The injury risk curve mapping HIC to P(AIS ≥ 5) continuously, with all four operating points overlaid, is presented in Figure S3. These visualisations together demonstrate that the beneficial effect of AFODS is robust to the range of uncertainty considered and is not an artefact of nominal parameter choice.
Table 7.
Quantitative one-way sensitivity (tornado) analysis of P(AIS ≥ 5) to primary model inputs.
5. Discussion
5.1. The Biomechanical Distinction That Standards Miss
Run-over injury patterns—tyre-to-skull contact at near-vertical approach angles, with no energy-absorbing wrap trajectory—are mechanistically distinct from the standing-impact scenarios underpinning every current regulatory crash test. HIC and BrIC parameter spaces are derived from upright-dummy wrap-trajectory geometry and do not transfer to the prone contact scenario. Computational biomechanical modelling using established simulation frameworks has been employed as the primary evidence base in ADAS safety analyses before physical prototype availability in analogous contexts [15,27]; the present approach is consistent with this precedent. Extending pedestrian AEB test standards to encompass a prone Anthropomorphic Test Device would constitute a protocol amendment for which the simulation evidence base now exists.
5.2. Medicolegal Implications: The SHAP Audit Trail
In Japan, pedestrian run-over incidents are typically investigated as criminal matters under the Code of Criminal Procedure [21]. The per-detection SHAP audit trail generated by AFODS—a timestamped log of sensor-channel contributions and normalised confidence scores for each detection decision—provides a technically rigorous basis for post-incident forensic reconstruction of the system’s perceptual state at the moment of potential collision. This constitutes a potential future contribution to the evidentiary framework for expert testimony in such proceedings, not a presently demonstrated legal instrument. Whether and how such algorithmic attribution evidence would be treated under applicable evidentiary standards—including Article 321 of Japan’s Code of Criminal Procedure governing expert opinion evidence [21]—requires dedicated legal and judicial analysis that lies beyond the scope of the present paper. Future work should develop the quantitative methodology for applying HIC and BrIC criteria to specific run-over contact geometries, using the national forensic database of Hitosugi et al. [2,3], as a prerequisite for establishing the biomechanical foundation upon which any medicolegal application of the SHAP audit trail would ultimately depend.
5.3. Considerations for Three Professional Communities
Forensic Pathologists and Medicolegal Professionals. The forensic case series for pedestrian run-over fatalities exists in Japan’s national database literature [2,3]. Systematic application of HIC and BrIC criteria to the specific run-over contact geometry may extend the evidentiary framework available for medicolegal proceedings involving secondary pedestrian impact, enabling expert witnesses to apply a quantitative basis for foreseeable harm assessment, subject to validation of the underlying biomechanical parameters in real-world conditions. The quantitative sensitivity analysis in Table 7 (visualised in Figure S2) confirms that detection latency t_d is the dominant driver of P(AIS ≥ 5), with a one-way swing of 46.6 pp under the monocular RGB baseline—the highest-leverage parameter for clinical risk reduction.
Traffic Safety Policymakers and Regulators. The WHO Decade of Action target of halving road traffic deaths by 2030 [1] presents ongoing challenges, whilst the category with the highest pedestrian fatality rate remains outside the assessment frameworks intended to address it. Adding a prone adult ATD to the standard AEB test matrix represents a protocol amendment that becomes achievable once prototype validation confirms translational performance from simulation to real-world hardware.
The ADAS and Automotive Engineering Community. Non-upright posture is an underaddressed safety gap across major deep learning pedestrian detection architectures [12]. Multi-modal sensor fusion combining thermal infrared, near-infrared stereo, and ultrasonic sensors represents an emerging approach identified in the literature [6,13]. The systematic exclusion of non-upright posture configurations from benchmark datasets—including Caltech Pedestrian, CityPersons, and MOTChallenge—reflects a curation choice that has compounded this limitation across successive training cycles. Incorporating non-upright posture annotations into future benchmark datasets would support more broadly capable detection architectures.
5.4. Ethical Considerations
In simulation, AFODS reframes pedestrian run-over risk from post-impact mitigation towards earlier hazard intervention, raising the TPR from 21.4% to 98.2% under daytime conditions. The utilitarian framing prevalent in the ADAS ethics literature [35] has limited applicability here: the lying pedestrian has no capacity for self-protection, no ability to make themselves visible, and no means of modifying their trajectory. The per-detection SHAP audit trail directly addresses the emerging regulatory emphasis on algorithmic transparency in safety-critical automotive AI systems, as codified in ISO/PAS 8800 [20].
6. Limitations
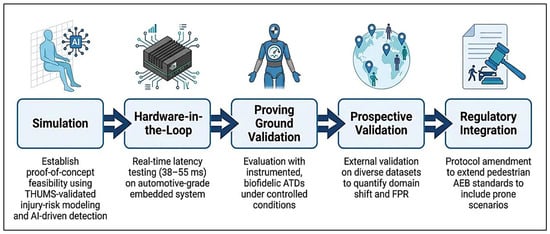
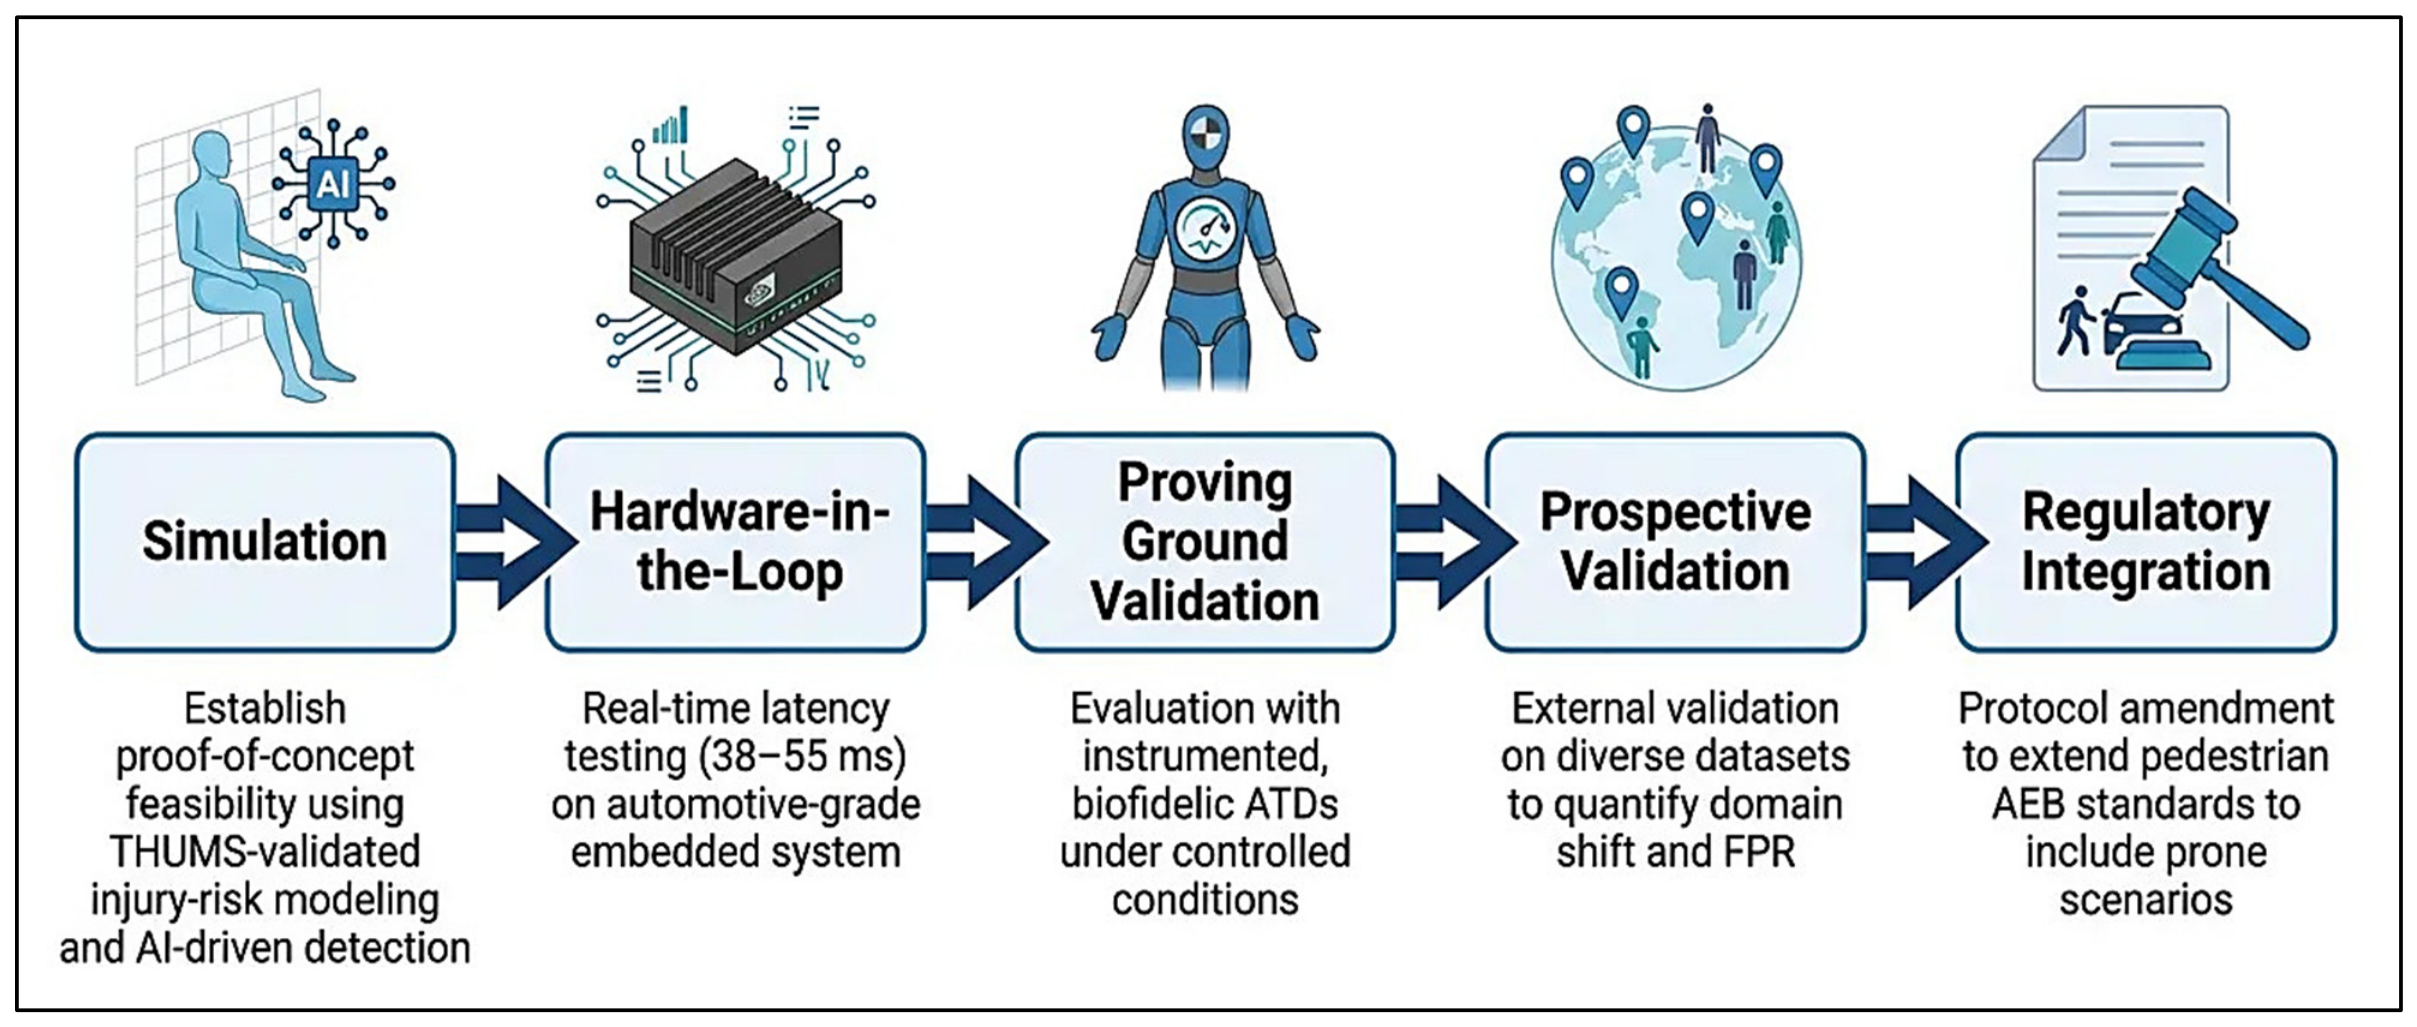
The following limitations should be considered when interpreting these results. The planned translational validation pathway is illustrated in Figure 2.
Figure 2.
AFODS translational validation pipeline. The roadmap illustrates the progression from current simulation-based feasibility to real-world deployment, including hardware-in-the-loop testing, instrumented ATD proving-ground validation, prospective field testing for FPR quantification, and the eventual extension of pedestrian AEB regulatory standards to non-upright scenarios.
Prototype validation pending. All performance figures are derived from simulation trials [6]; no physical prototype has been evaluated operating on a real vehicle. Deployment readiness claims cannot be made on this basis. The planned next validation phase will use biofidelic ATDs equipped with internal accelerometers under controlled proving-ground conditions.
Synthetic data and domain shift. Approximately 37.5% of positive samples are synthetically generated using THUMS models. Performance on real-world edge cases not represented in the synthetic pipeline may differ from reported figures. External validation on geographically and demographically diverse datasets is required before generalisation claims can be made.
Severe weather performance. Detection performance degrades meaningfully in heavy rain (TPR 89.4%) and fog (TPR 84.7%). Performance in heavy snow, ice-covered roads, and sandstorm conditions remains unvalidated.
Dataset geographic bias. The dataset is drawn predominantly from Japan and Europe. Validation on geographically diverse datasets is required before global deployment claims can be made.
Sensor cost and scalability. The multi-modal sensor suite (LWIR + NIR + ultrasonic) adds an estimated USD 800–1200 to the vehicle bill-of-materials at current production volumes, limiting near-term adoption to premium vehicle segments and fleet operators. This incremental hardware cost is modest relative to the societal cost of a single pedestrian fatality—estimated at approximately USD 1.5–4.5 million per event in high-income countries when accounting for lost productivity, medical expenditure, and quality-adjusted life years—suggesting a compelling cost–benefit ratio even at low deployment volumes.
Real-time computational constraints. Latency figures (38–55 ms) were measured on an NVIDIA Jetson AGX Orin platform. Performance on lower-cost embedded hardware typical of mass-market vehicles has not been validated.
Uncertainty propagation. A Monte Carlo uncertainty analysis (N = 100,000) has now been incorporated, propagating variance in k, braking deceleration, and detection latency through the three-stage injury model (Figures S1–S3). The analysis confirms that AFODS operating points are robust to the modelled uncertainty ranges. Nonetheless, real-world variance in pedestrian posture geometry, road surface conditions, and vehicle mass distribution may affect the posture-dependent coefficient k beyond the ±10% range assumed here; empirical calibration against instrumented ATD data will be required in subsequent validation phases.
The ±10% range applied to the posture-dependent coefficient k in the Monte Carlo analysis is consistent with the inter-configuration variance reported across THUMS Version 5 finite-element simulation runs spanning prone and supine adult postures [27]. Wider variation (±20–30%) would be expected only if target posture, vehicle geometry, or contact surface deviated substantially from the sedan-class frontal run-over configurations used for calibration; such scenarios are addressed qualitatively in the limitations above and will require empirical ATD calibration in subsequent validation phases.
These limitations highlight the need for integrated real-world validation prior to deployment in safety-critical systems. The Brain Rotational Injury Criterion (BrIC) is identified as a critical parameter for future validation with instrumented Anthropomorphic Test Devices (ATDs) to capture rotational brain shear injuries not characterised by HIC alone; its integration requires rotational velocity data not available from the current simulation framework. The current injury-risk model is scoped to primary head-impact injuries via HIC. Secondary thoracic crush injuries—arising from wheel overrun after the initial strike—constitute a distinct biomechanical domain requiring separate modelling using thoracic injury criteria. System performance is inherently linked to the thermal gradient between the target and the environment. In high-temperature environments where ambient road surface temperatures approach human body temperature (≤37 °C), the collapsing thermal contrast may induce ambient thermal clutter, potentially increasing the false negative rate in specific geographic domains.
7. Conclusions
The supplementary analyses (Figures S1–S3) confirm that the projected injury reduction is robust across the full range of modelled parameter uncertainty. In simulation, AFODS achieved a TPR of 98.2% (95% CI: 97.4–98.8%) under clear daytime conditions and 89.4–95.6% at night, representing a statistically significant 76.8 percentage-point improvement over the monocular baseline (p < 0.001). The three-stage injury-risk model projects a reduction in estimated fatal head injury probability from 66.2% (no detection) to 0.7% under AFODS worst-case night/rain conditions, subject to real-world validation.
These results must be contextualised within the limitations of the simulation setting. All detection performance figures derive from simulation trials [6]; no physical prototype has been tested on a real vehicle, and 37.5% of positive samples are synthetically generated using THUMS models. The injury-risk projections are model-based estimates derived from published biomechanical functions [26] applied to simulation data and should be regarded as exploratory until validated against instrumented ATD data in controlled proving-ground conditions. Forensic database evidence documents a 33.0% fatality rate for pedestrian run-over collisions (prone or supine victims) in Japan [2,3], set against a 21.4% detection rate for current ADAS under night conditions. Three steps define the translational pathway: (1) prototype validation on real-world hardware using instrumented ATDs; (2) prone-posture injury modelling using HIC and BrIC biomechanical criteria; and (3) regulatory extension of pedestrian AEB test standards to non-upright scenarios. This study is among the first to quantitatively integrate AI detection performance, ISO 26262 functional safety analysis, and biomechanical injury-risk modelling for the non-upright pedestrian scenario.
8. Patent
AFODS technology is the subject of Japanese Patent Application No. 2025-167440 (Filing Date: 3 October 2025).
Supplementary Materials
The following supporting information can be downloaded at: https://www.mdpi.com/article/10.3390/vehicles8060136/s1.
Author Contributions
N.B.: Conceptualisation, methodology, software, formal analysis, data curation, writing—original draft, writing—review and editing, and visualisation. M.H.: Conceptualisation, provision of forensic epidemiological foundations and biomechanical parameters, writing, review and editing, supervision, and project administration. All authors have read and agreed to the published version of the manuscript.
Funding
No external funding was received for this work.
Institutional Review Board Statement
No human participants were exposed to physical risk during the sensor evaluation trials. This study utilised pre-existing anonymised forensic database data [2,3], synthetic computational modelling (THUMS), and simulation-based evaluation [6]; no original human participant data were collected. Therefore, institutional ethical approval was not required. No patient data were used in this study.
Data Availability Statement
The technical framework, ISO 26262 HARA datasets, and injury-risk simulation scripts that support the findings of this study are openly available in Zenodo at https://doi.org/10.5281/zenodo.20116244. Supplementary Figures S1–S3 (Monte Carlo uncertainty propagation, tornado sensitivity analysis, and injury risk curve, respectively) and the reproducible analysis notebook (AFODS_Supplementary_Analysis.ipynb) are archived in the same Zenodo repository. Model weights and training configurations for the multi-modal AFODS architecture are included in the repository to ensure full scientific reproducibility. The complete source code is additionally available in the corresponding GitHub repository at https://github.com/Nick-Barua/From-Post-Mortem-to-Prevention-AFODS, accessed on 15 June 2026.
Conflicts of Interest
N.B. declares a filed patent—Japanese Patent Application No. 2025-167440 (filed 3 October 2025)—on the AFODS technology described in this paper. M.H. declares no conflicts of interest.
References
- World Health Organization. Global Status Report on Road Safety 2023; WHO: Geneva, Switzerland, 2023. [Google Scholar]
- Hitosugi, M.; Kagesawa, E.; Narikawa, T.; Nakamura, M.; Koh, M.; Hattori, S. Hit-and-runs more common with pedestrians lying on the road: Analysis of a nationwide database in Japan. Chin. J. Traumatol. 2021, 24, 83–87. [Google Scholar] [CrossRef] [Scilit] [PubMed]
- Koh, M.; Hitosugi, M.; Kagesawa, E.; Narikawa, T.; Takashima, K. Factors influencing fatalities or severe injuries to pedestrians lying on the road in Japan: Nationwide police database study. Healthcare 2021, 9, 1433. [Google Scholar] [CrossRef] [Scilit] [PubMed]
- DiMaio, D.J.; DiMaio, V.J.M. Forensic Pathology, 2nd ed.; CRC Press: Boca Raton, FL, USA, 2001. [Google Scholar]
- Peng, R.Y.; Bongard, F.S. Pedestrian versus motor vehicle accidents: An analysis of 5000 patients. J. Am. Coll. Surg. 1999, 189, 343–348. [Google Scholar] [PubMed]
- Barua, N.; Hitosugi, M. Advanced multi-modal sensor fusion system for detecting falling humans: Quantitative evaluation for enhanced vehicle safety. Vehicles 2025, 7, 149. [Google Scholar] [CrossRef] [Scilit]
- Barua, N.; Hitosugi, M. A physics-grounded multi-modal sensor fusion framework for pedestrian impact kinematic reconstruction under uncertainty: Phase 1 design and theoretical evaluation. Sensors 2026, 26, 3387. [Google Scholar] [CrossRef] [Scilit] [PubMed]
- ISO 26262-4:2018; Road Vehicles—Functional Safety—Part 4: Product Development at the System Level. ISO: Geneva, Switzerland, 2018.
- ISO 26262-9:2018; Road Vehicles—Functional Safety—Part 9: ASIL-Oriented and Safety-Oriented Analyses. ISO: Geneva, Switzerland, 2018.
- Gerónimo, D.; López, A.M.; Sappa, A.D.; Graf, T. Survey of pedestrian detection for advanced driver assistance systems. IEEE Trans. Pattern Anal. Mach. Intell. 2010, 32, 1239–1258. [Google Scholar] [CrossRef] [Scilit] [PubMed]
- Boukerche, A.; Sha, M. Design guidelines on deep learning-based pedestrian detection methods for supporting autonomous vehicles. ACM Comput. Surv. 2021, 54, 79. [Google Scholar] [CrossRef] [Scilit]
- Iftikhar, S.; Zhang, Z.; Asim, M.; Muthanna, A.; Koucheryavy, A.; Abd El-Latif, A.A. Deep learning-based pedestrian detection in autonomous vehicles: Substantial issues and challenges. Electronics 2022, 11, 3551. [Google Scholar] [CrossRef] [Scilit]
- Vargas, J.; Alsweiss, S.; Toker, O.; Razdan, R.; Santos, J. An overview of autonomous vehicles sensors and their vulnerability to weather conditions. Sensors 2021, 21, 5397. [Google Scholar] [CrossRef] [Scilit] [PubMed]
- Lee, S.; Kim, T.; Shin, J.; Kim, N.; Choi, Y. INSANet: INtra-inter spectral attention network for effective feature fusion of multispectral pedestrian detection. Sensors 2024, 24, 1168. [Google Scholar] [CrossRef] [Scilit] [PubMed]
- Wood, D.P.; Simms, C.K.; Walsh, D.G. Vehicle–pedestrian collisions: Validated models for pedestrian impact and projection. Proc. Inst. Mech. Eng. Part D J. Automob. Eng. 2005, 219, 183–195. [Google Scholar]
- Simms, C.K.; Wood, D.P. Pedestrian and Cyclist Impact: A Biomechanical Perspective, 1st ed.; Springer: Dordrecht, The Netherlands, 2009. [Google Scholar]
- Lundberg, S.M.; Lee, S.I. A unified approach to interpreting model predictions. In Proceedings of the Advances in Neural Information Processing Systems (NeurIPS), Long Beach, CA, USA, 4–9 December 2017; pp. 4765–4774. [Google Scholar]
- Nazat, S.; Arreche, O.; Abdallah, M. On evaluating black-box explainable AI methods for enhancing anomaly detection in autonomous driving systems. Sensors 2024, 24, 3515. [Google Scholar] [CrossRef] [Scilit] [PubMed]
- Yeong, D.J.; Panduru, K.; Walsh, J. Exploring the unseen: A survey of multi-sensor fusion and the role of explainable AI (XAI) in autonomous vehicles. Sensors 2025, 25, 856. [Google Scholar] [CrossRef] [Scilit] [PubMed]
- ISO/PAS 8800:2024; Road Vehicles—Safety and Artificial Intelligence. ISO: Geneva, Switzerland, 2024.
- Code of Criminal Procedure of Japan (Keiji Soshouhou, Act No. 131 of 1948); Ministry of Justice: Tokyo, Japan, 1948.
- Viano, D.C.; King, A.I.; Melvin, J.W.; Weber, K. Injury biomechanics research: An essential element in the prevention of trauma. J. Biomech. 1989, 22, 403–417. [Google Scholar] [CrossRef] [Scilit] [PubMed]
- Schmitt, K.U.; Niederer, P.F.; Cronin, D.S.; Morrison, B., III; Muser, M.H.; Walz, F. Trauma Biomechanics: Accidental Injury in Traffic and Sports, 5th ed.; Springer: Cham, Switzerland, 2019. [Google Scholar]
- Prasad, P.; Mertz, H.J. The Position of the United States Delegation to the ISO Working Group 6 on the Use of HIC in the Automotive Environment; SAE Technical Paper 851246; SAE International: Warrendale, PA, USA, 1985. [Google Scholar] [CrossRef] [Scilit]
- Takhounts, E.G.; Craig, M.J.; Moorhouse, K.; McFadden, J.; Hasija, V. Development of brain injury criteria (BrIC). Stapp Car Crash J. 2013, 57, 243–266. [Google Scholar] [CrossRef] [Scilit] [PubMed]
- Mertz, H.J.; Prasad, P.; Irwin, A.L. Injury Risk Curves for Children and Adults in Frontal and Rear Collisions; SAE Technical Paper 973318; SAE International: Warrendale, PA, USA, 1997. [Google Scholar] [CrossRef] [Scilit]
- Iwamoto, M.; Nakahira, Y. Development and Validation of the Total HUman Model for Safety (THUMS) Version 5 Containing Multiple 1D Muscles for Estimating Occupant Motions with Muscle Activation During Side Impacts. Stapp Car Crash J. 2015, 59, 53–90. [Google Scholar] [CrossRef] [Scilit] [PubMed]
- Thali, M.J.; Yen, K.; Schweitzer, W.; Vock, P.; Boesch, C.; Ozdoba, C.; Schroth, G.; Ith, M.; Sonnenschein, M.; Doernhoefer, T.; et al. Virtopsy, a new imaging horizon in forensic pathology: Virtual autopsy by postmortem multislice computed tomography (MSCT) and magnetic resonance imaging (MRI)—A feasibility study. J. Forensic Sci. 2003, 48, 386–403. [Google Scholar] [CrossRef] [Scilit]
- Wang, C.Y.; Bochkovskiy, A.; Liao, H.Y.M. YOLOv7: Trainable bag-of-freebies sets new state-of-the-art for real-time object detectors. In Proceedings of the IEEE/CVF Conference on Computer Vision and Pattern Recognition (CVPR), Vancouver, BC, Canada, 17–24 June 2023; pp. 7464–7475. [Google Scholar]
- Kalman, R.E. A new approach to linear filtering and prediction problems. J. Basic Eng. 1960, 82, 35–45. [Google Scholar] [CrossRef] [Scilit]
- ISO 26262-3:2018; Road Vehicles—Functional Safety—Part 3: Concept Phase. ISO: Geneva, Switzerland, 2018.
- ISO 21448:2022; Road Vehicles—Safety of the Intended Functionality (SOTIF). ISO: Geneva, Switzerland, 2022.
- Collins, G.S.; Reitsma, J.B.; Altman, D.G.; Moons, K.G.M. Transparent reporting of a multivariable prediction model for individual prognosis or diagnosis (TRIPOD): The TRIPOD statement. BMJ 2015, 350, g7594. [Google Scholar] [CrossRef] [Scilit] [PubMed]
- Green, M. How long does it take to stop? Methodological analysis of driver perception–brake times. Transp. Hum. Factors 2000, 2, 195–216. [Google Scholar]
- Bonnefon, J.F.; Shariff, A.; Rahwan, I. The social dilemma of autonomous vehicles. Science 2016, 352, 1573–1576. [Google Scholar] [CrossRef] [Scilit] [PubMed]

Disclaimer/Publisher’s Note: The statements, opinions and data contained in all publications are solely those of the individual author(s) and contributor(s) and not of MDPI and/or the editor(s). MDPI and/or the editor(s) disclaim responsibility for any injury to people or property resulting from any ideas, methods, instructions or products referred to in the content. |
© 2026 by the authors. Licensee MDPI, Basel, Switzerland. This article is an open access article distributed under the terms and conditions of the Creative Commons Attribution (CC BY) license.