1. Introduction
Driver monitoring has become an essential component of modern automotive safety systems due to the need to reduce accidents associated with fatigue, distraction, and reduced vigilance. Among the available driver-state indicators, head pose, head motion, gaze behavior, and facial activity are particularly informative, since changes in posture, visual attention, and corrective movements may precede a clear decline in alertness or performance. Consequently, driver monitoring has been extensively studied using visible-spectrum imaging, geometric head-tracking methods, optical flow-based motion analysis, and model-based facial tracking approaches [
1,
2,
3,
4,
5,
6].
Classical vision-based approaches demonstrated promising performance under controlled conditions, including elliptical head tracking, motion-regularized face tracking, three-dimensional head pose estimation, and camera-based monitoring of head and eye motion [
2,
3,
4,
5,
6]. More recent studies have extended this direction toward real-time embedded systems, driver activity recognition, multi-task fusion algorithms, and deep learning-based monitoring of gaze, eyes, mouth, and head position [
7,
8,
9,
10,
11,
12,
13]. In addition to camera-only systems, other driver monitoring solutions have included orientation sensors and multimodal sensing strategies for tracking driver behavior and driver state [
13,
14]. However, despite substantial progress, visible-spectrum systems remain inherently sensitive to illumination variability, shadows, reflections, and rapid lighting transitions, which are unavoidable in real automotive environments. Even during daytime driving, sunlight angle, roadside occlusions, and cabin reflections can reduce robustness, while night-time operation introduces further limitations due to poor illumination and glare.
To address these limitations, alternative non-visible sensing modalities have been explored. Near-infrared (NIR) systems have been used for gaze detection, eye localization, and contactless in-vehicle vital sign monitoring, showing that non-visible sensing can improve robustness under challenging lighting conditions [
10,
11]. Long-wave infrared (LWIR) thermal imaging represents another important alternative because it captures emitted thermal radiation rather than reflected visible light. As a result, thermal imaging is inherently less dependent on ambient illumination and can remain informative during both day and night operation. Beyond geometric visibility, thermal imagery can also provide surface temperature-related information linked to physiological processes such as blood perfusion, respiration, stress, workload, and thermoregulation, making this modality relevant to driver state monitoring [
15,
16,
17,
18,
19,
20,
21,
22,
23,
24].
Several previous studies have investigated thermal imaging approaches in relation to driver monitoring, including respiration monitoring, facial temperature variation, thermal correlates of drowsiness, and infrared-based assessment of driver workload [
16,
17,
18,
19,
20,
21,
22,
23,
24]. Thermal facial features have been used in simulator-based drowsiness studies, while more recent work has combined thermal imagery with machine learning for driver vigilance or workload classification [
17,
18,
19,
20,
21,
22,
23]. At the same time, research on forehead skin temperature has shown that thermal variations may accompany changes in alertness and physiological condition [
21]. These findings support the broader relevance of thermal facial observation for driver state-related applications. However, such studies do not necessarily constitute direct validation of a deployable driver monitoring workflow under real in-vehicle conditions, especially when low-cost consumer-grade devices are considered.
Despite its advantages, facial observation and tracking in the LWIR domain remain challenging. Compared with visible-light images, thermal images typically exhibit lower spatial resolution, reduced texture detail, and limited contrast between adjacent regions due to relatively small temperature gradients. As a result, feature descriptors and tracking algorithms originally developed for visible imagery, such as scale-invariant feature transform (SIFT), may perform less reliably when applied directly to thermal data [
25]. In addition, consumer-grade mobile thermal cameras often operate through smartphone-based application environments, provide displayed temperature information rather than raw radiometric export, and impose practical constraints on reproducibility, post-processing, and (ROI) definition. These limitations are particularly important when the goal is not simply qualitative observation but stable frame-based analysis under realistic driving conditions.
In parallel with the sensing modality itself, the in-vehicle thermal environment also affects driver comfort and alertness. Cabin temperature, airflow, and thermal microclimate can influence skin temperature and thermoregulation, which may in turn affect the interpretation of facial thermal measurements. This means that thermal observations obtained in a vehicle cabin should be evaluated not only from the perspective of sensor visibility but also with regard to environmental consistency and repeatability across sessions.
Against this background, the present study evaluates whether a compact consumer-grade mobile LWIR camera can provide sufficiently stable and repeatable facial thermal observations in a real automotive cabin. The focus is placed on geometric visibility, cross-session repeatability, and temporal consistency of a manually assisted forehead-ROI workflow. As a prerequisite for future driver state inference, the present work is intentionally limited to signal-level feasibility validation rather than behavioral or drowsiness-specific analysis. The contribution of this study lies in its structured assessment of whether an app-based low-cost LWIR workflow can preserve adequate facial thermal consistency for ROI-based monitoring under realistic in-vehicle conditions.
2. Materials and Methods
To avoid over-interpretation, the present work was positioned as a feasibility-level investigation focused on sensor deployment, data stability, and quantitative thermal observation under real driving conditions, rather than as a validated drowsiness classification study.
2.1. Experimental Setup
The experimental study was conducted in a passenger vehicle under real-world driving conditions. Prior to data acquisition, the cabin air temperature was stabilized in order to ensure thermal comfort and to reduce variability in the driver’s infrared signature caused by transient environmental changes. This procedure was intended to minimize external thermal influences and improve the consistency of thermal observations across sessions.
The experimental campaign consisted of six driving sessions, each with a fixed duration of 60 min, conducted on separate days under comparable real-world driving conditions. All sessions were performed in the morning and followed similar routes characterized by relatively steady traffic flow and limited external disturbances. Driving speed varied between 60 and 90 km/h throughout each 60 min session. Two adult participants were included in this study. Participant I was a 39-year-old male, and Participant II was a 37-year-old male. Both participants were healthy and reported no acute illness over the measurement period.
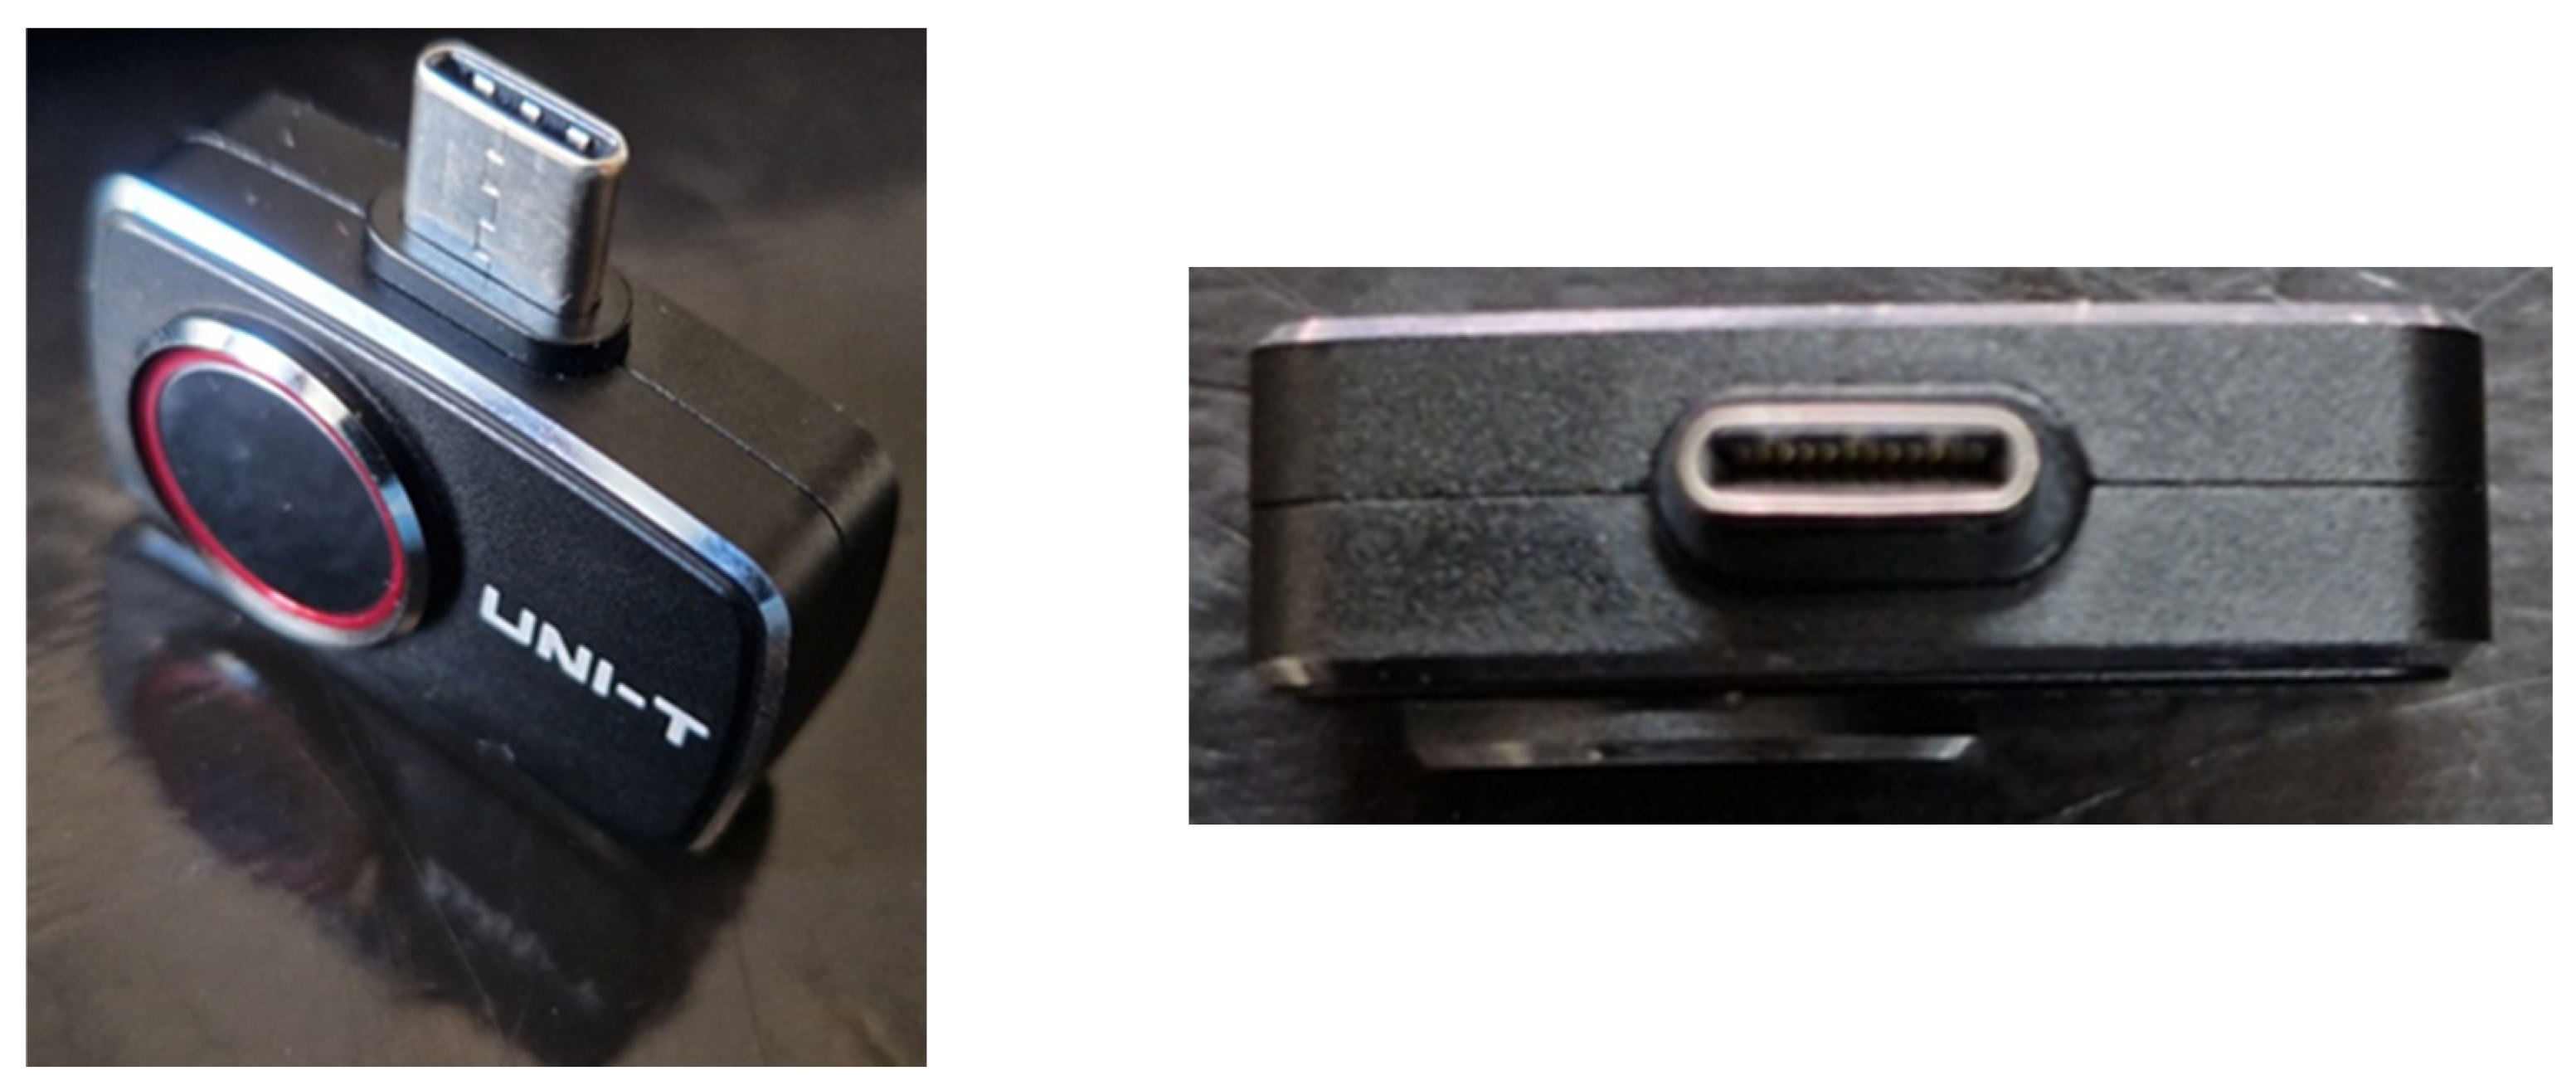
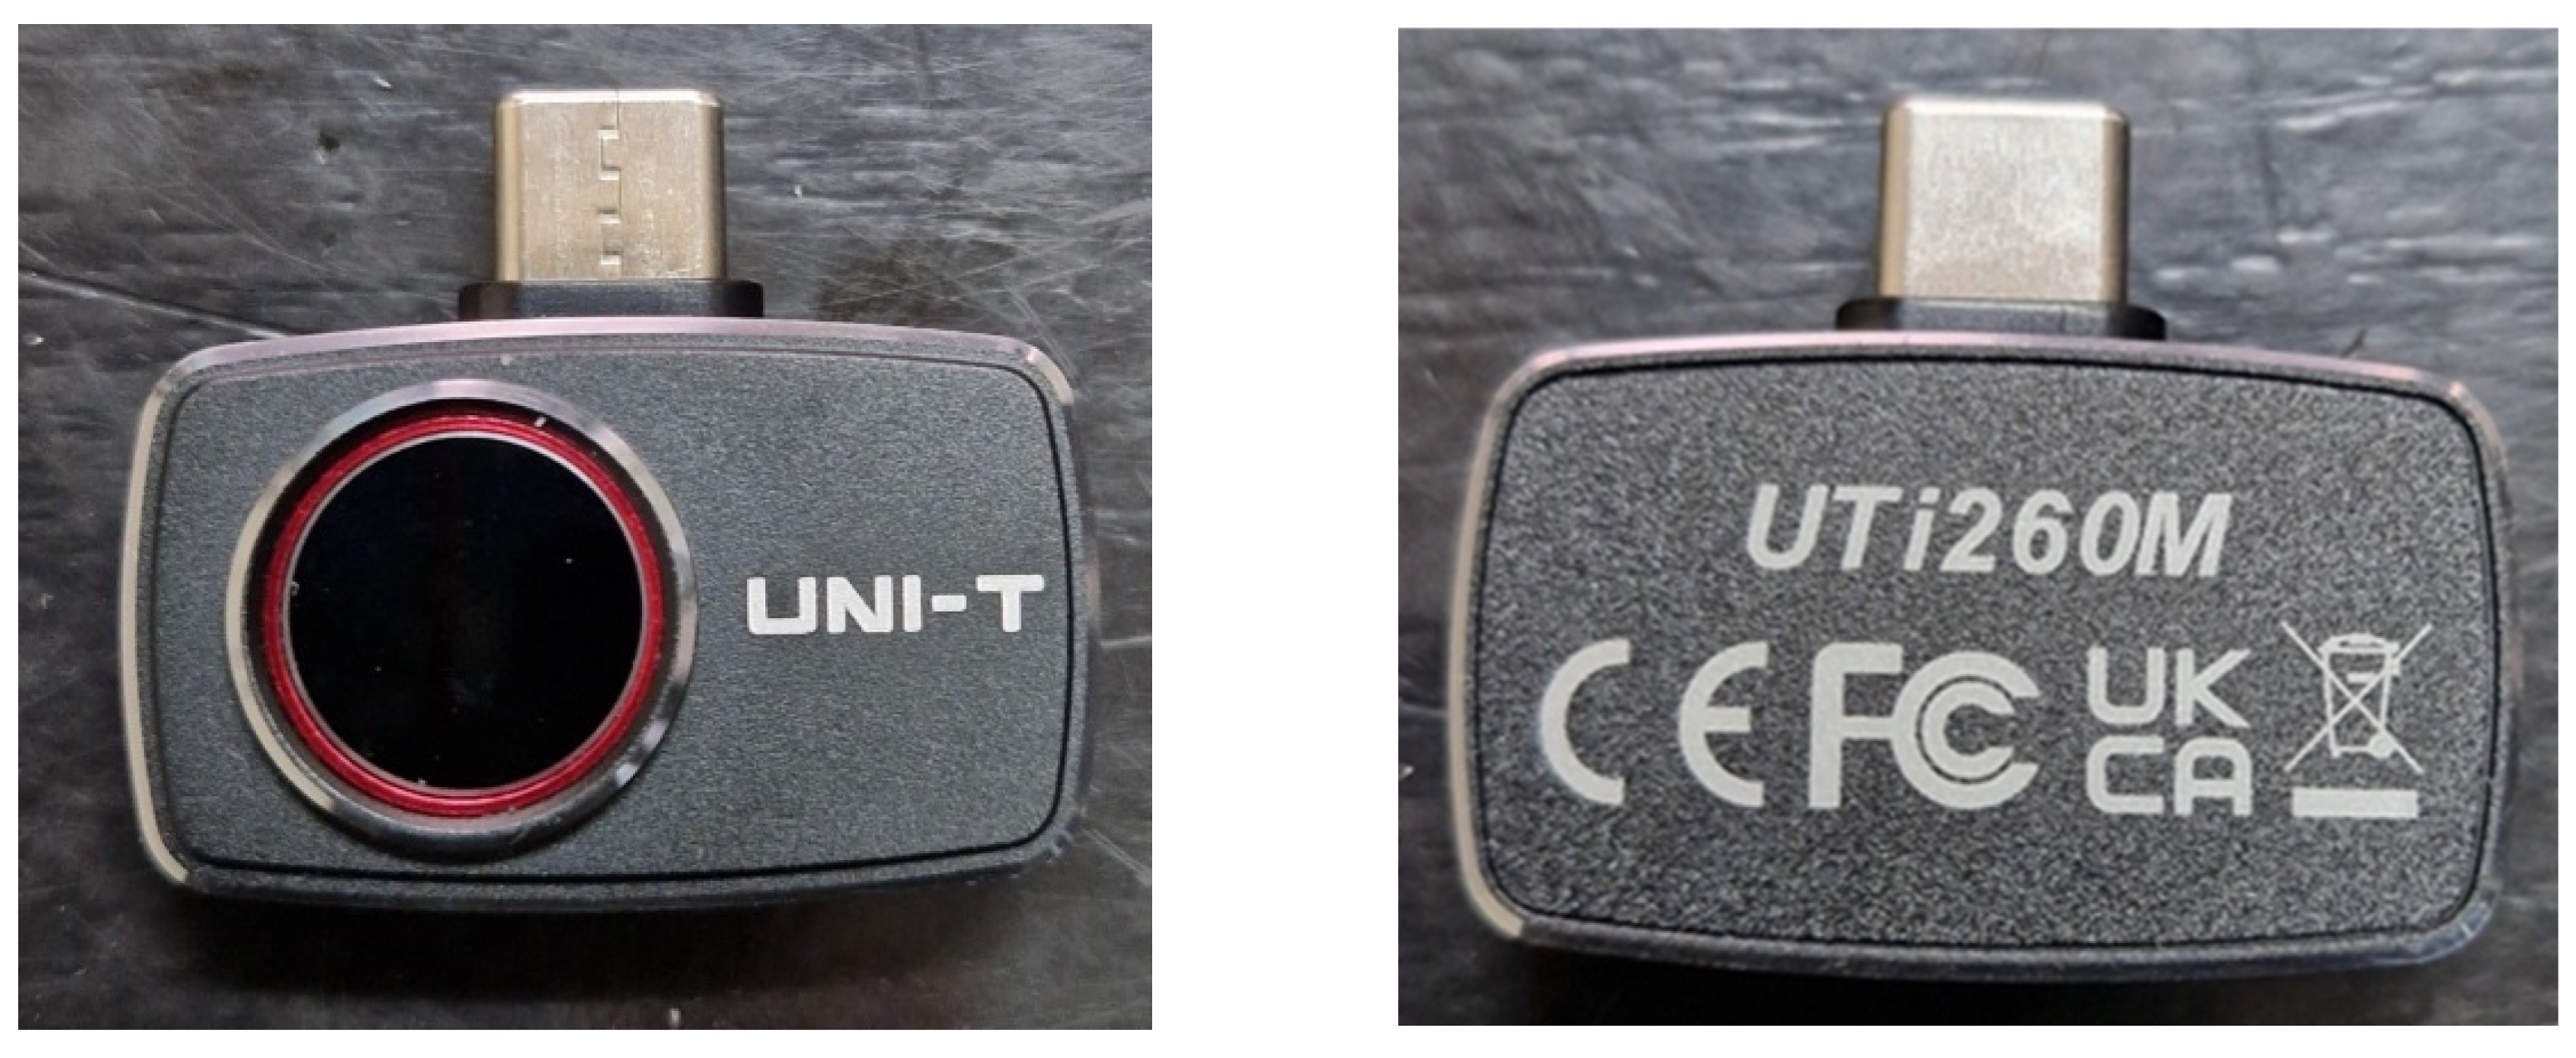
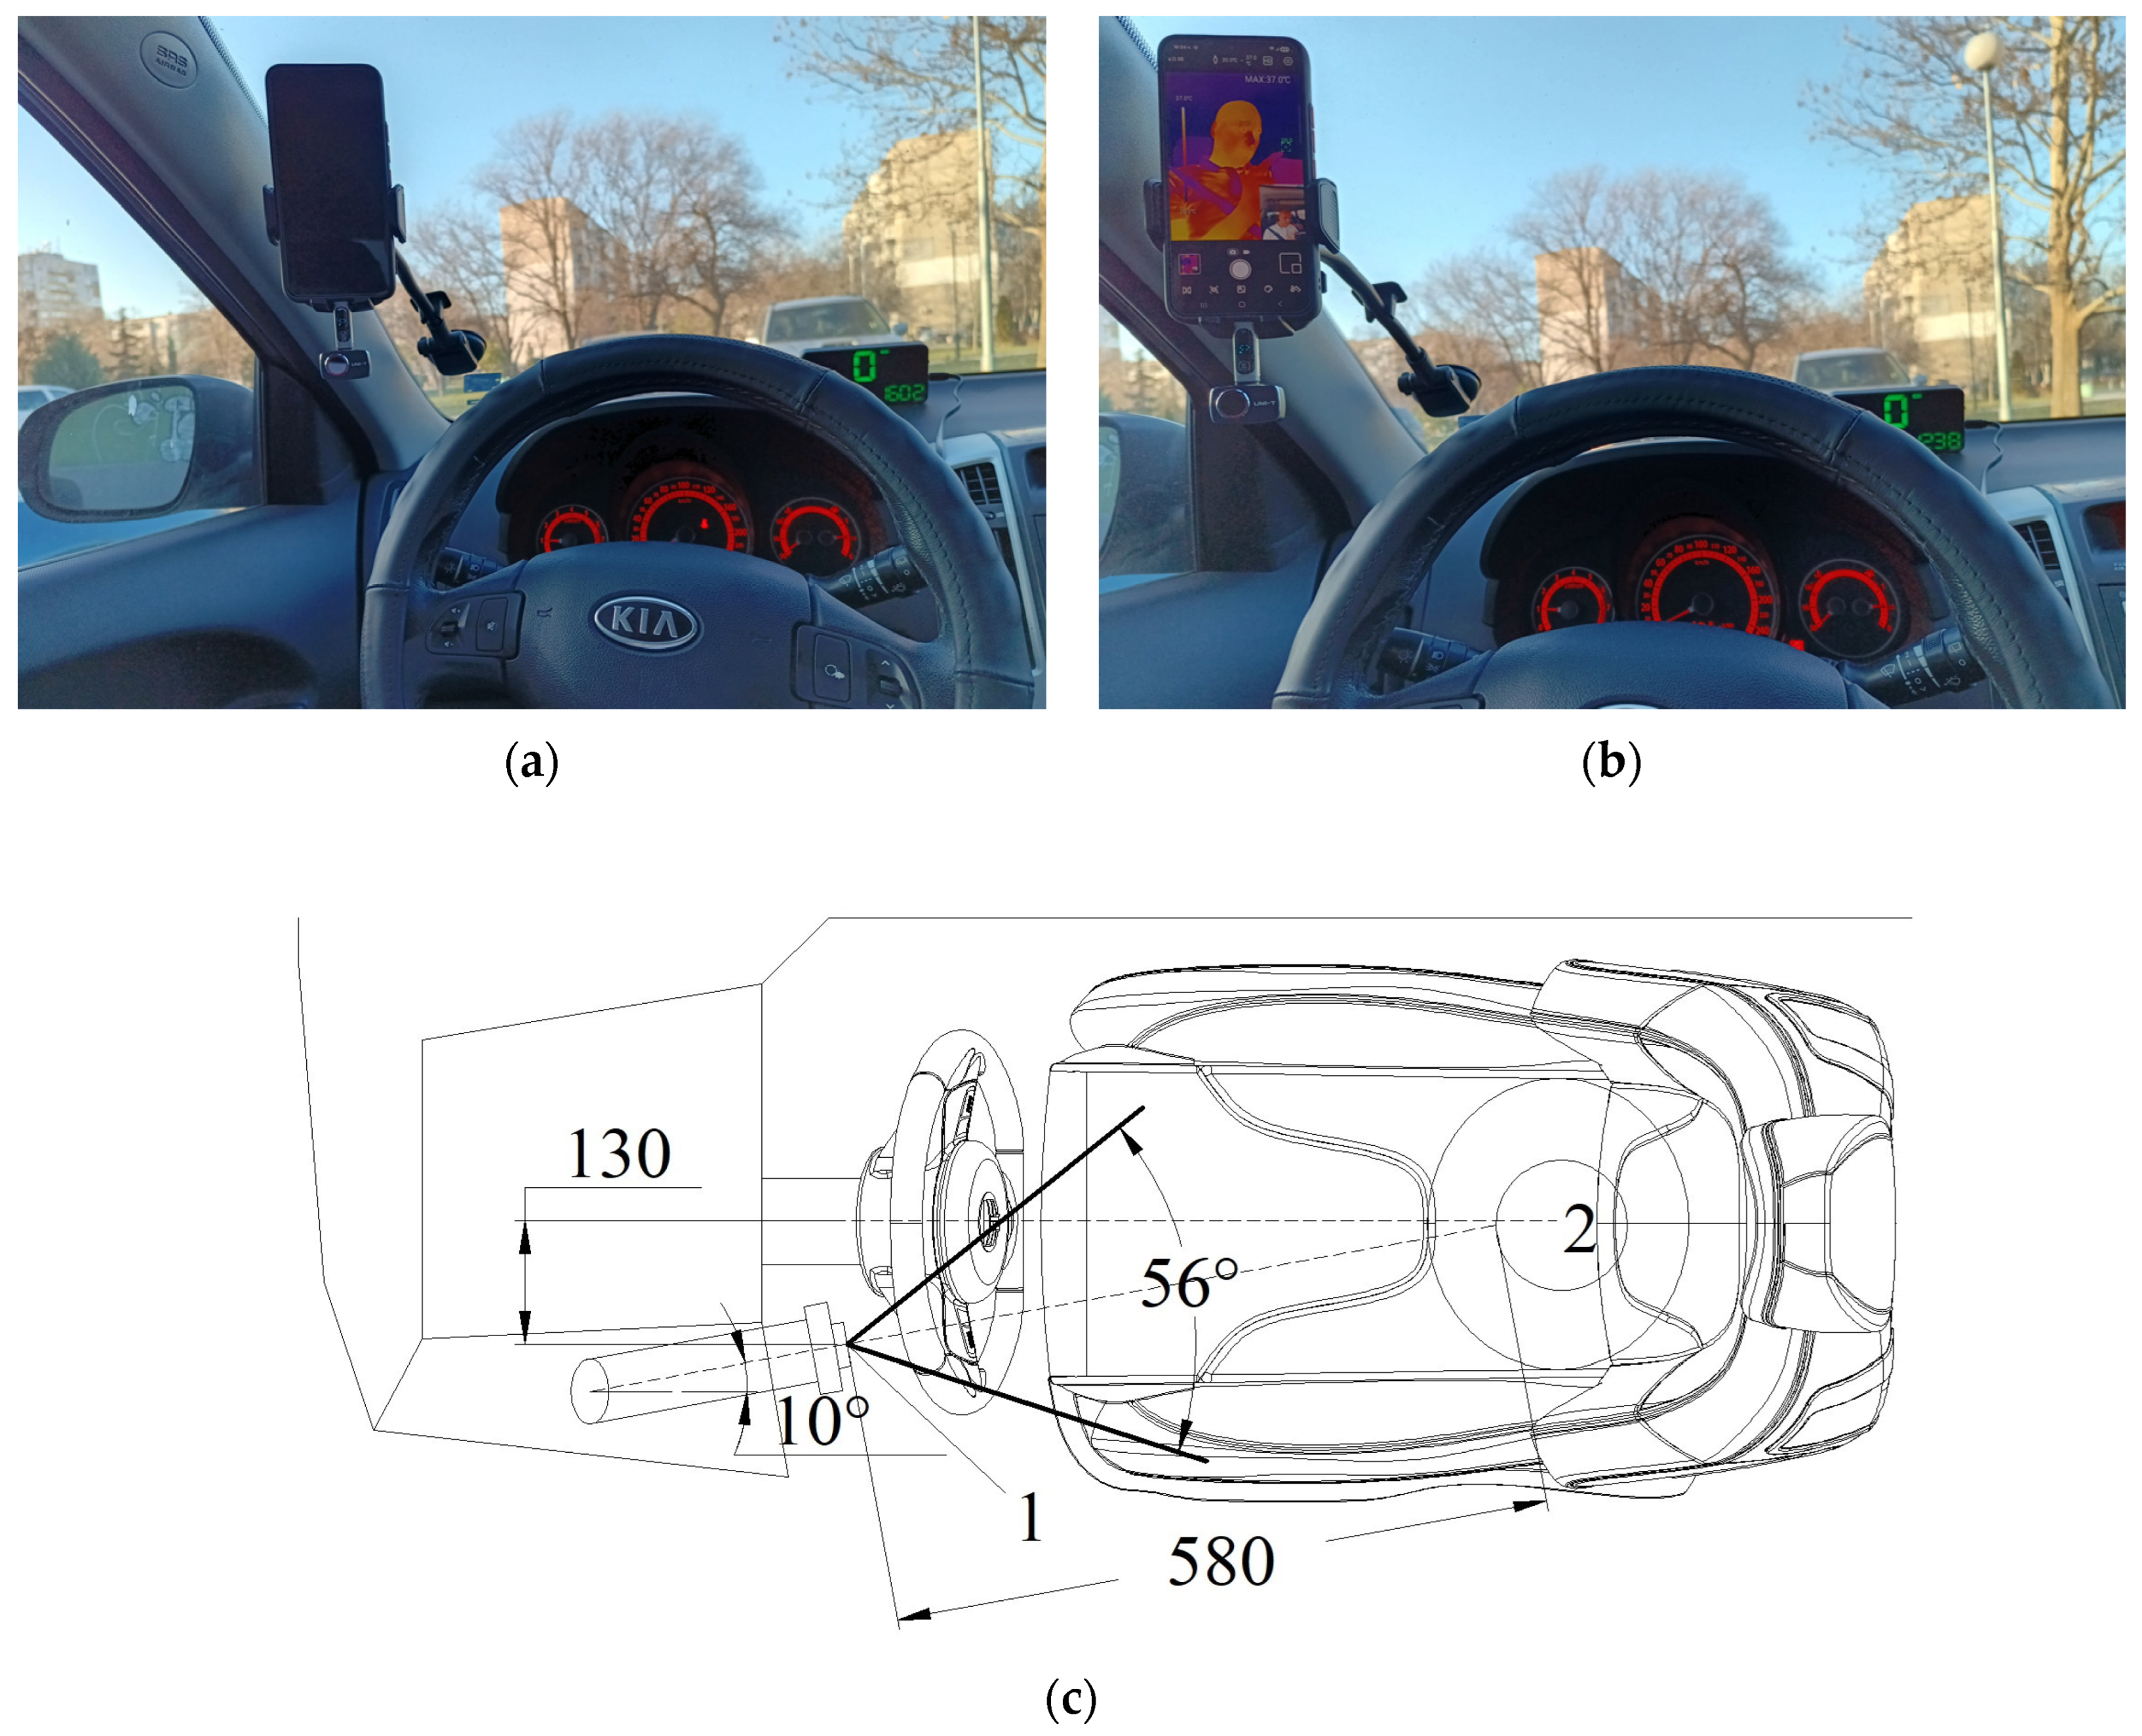
Thermal video of the driver was recorded using a compact handheld long-wave infrared (LWIR) thermal camera (UTi260M by Uni-Trend Technology Co., Ltd. Located in Dongguan City, China. The camera was operated using the UNI—T Thermal Mobile smartphone application). The camera was positioned so as to maintain a clear and consistent field of view of the driver’s head and upper torso throughout the driving session without interfering with normal driving behavior. The camera field of view was defined by a cone with an apex angle of 56°. Orientation and distance were kept fixed to minimize geometric variation in the recorded thermal patterns. The camera mounting configuration inside the vehicle cabin is illustrated in
Figure 1.
The driving task was performed on a long, uniform road segment selected to induce relatively monotonous driving conditions. This choice was made in order to ensure extended steady-state driving exposure under comparable operational constraints. Thermal video data were acquired continuously during each session at a frame rate of 25 Hz through the smartphone application environment.
2.2. Thermal Imaging Device
The UTi260M is a mobile LWIR thermal imaging module designed for smartphone-based operation. It employs an uncooled vanadium oxide microbolometer detector with a spatial resolution of 256 × 192 pixels and a spectral response in the 8–14 μm wavelength range. The device supports temperature measurements from −20 °C to 550 °C and provides enhanced accuracy in the human body temperature range, shown in
Table 1.
Thermal images are displayed using selectable color palettes and include real-time temperature mapping, point and area measurements, and automatic tracking of maximum and minimum temperature values. Due to its compact size and consumer-grade design, the device represents a cost-effective alternative to industrial thermal cameras commonly used in automotive research.
2.3. Data Acquisition and Preprocessing
The UTi260M camera was used through its smartphone-based application environment, which provided thermal image visualization and surface temperature display functions but did not provide access to raw detector-level radiometric data for the present workflow. Accordingly, the present study was based on app-displayed thermal imagery and manually positioned temperature windows rather than on native radiometric frame export.
Thermal observations were processed offline using a sampled-frame feasibility workflow rather than exhaustive frame-by-frame annotation of the entire 25 Hz dataset. Single representative frames were extracted at 5 min intervals from each 60 min session, yielding 12 sampled analysis frames per session and 72 sampled frames in total across all six sessions.
For each selected frame, the forehead temperature window was positioned manually for the corresponding driver in the upper frontal facial region above the periorbital area and below the hairline, while avoiding obvious background inclusion and peripheral non-target regions. This manual placement was used deliberately in order to avoid losing the target forehead zone in low-resolution LWIR imagery. ROI placement was performed by a single operator throughout the dataset in order to maintain internal consistency of the manually assisted workflow.
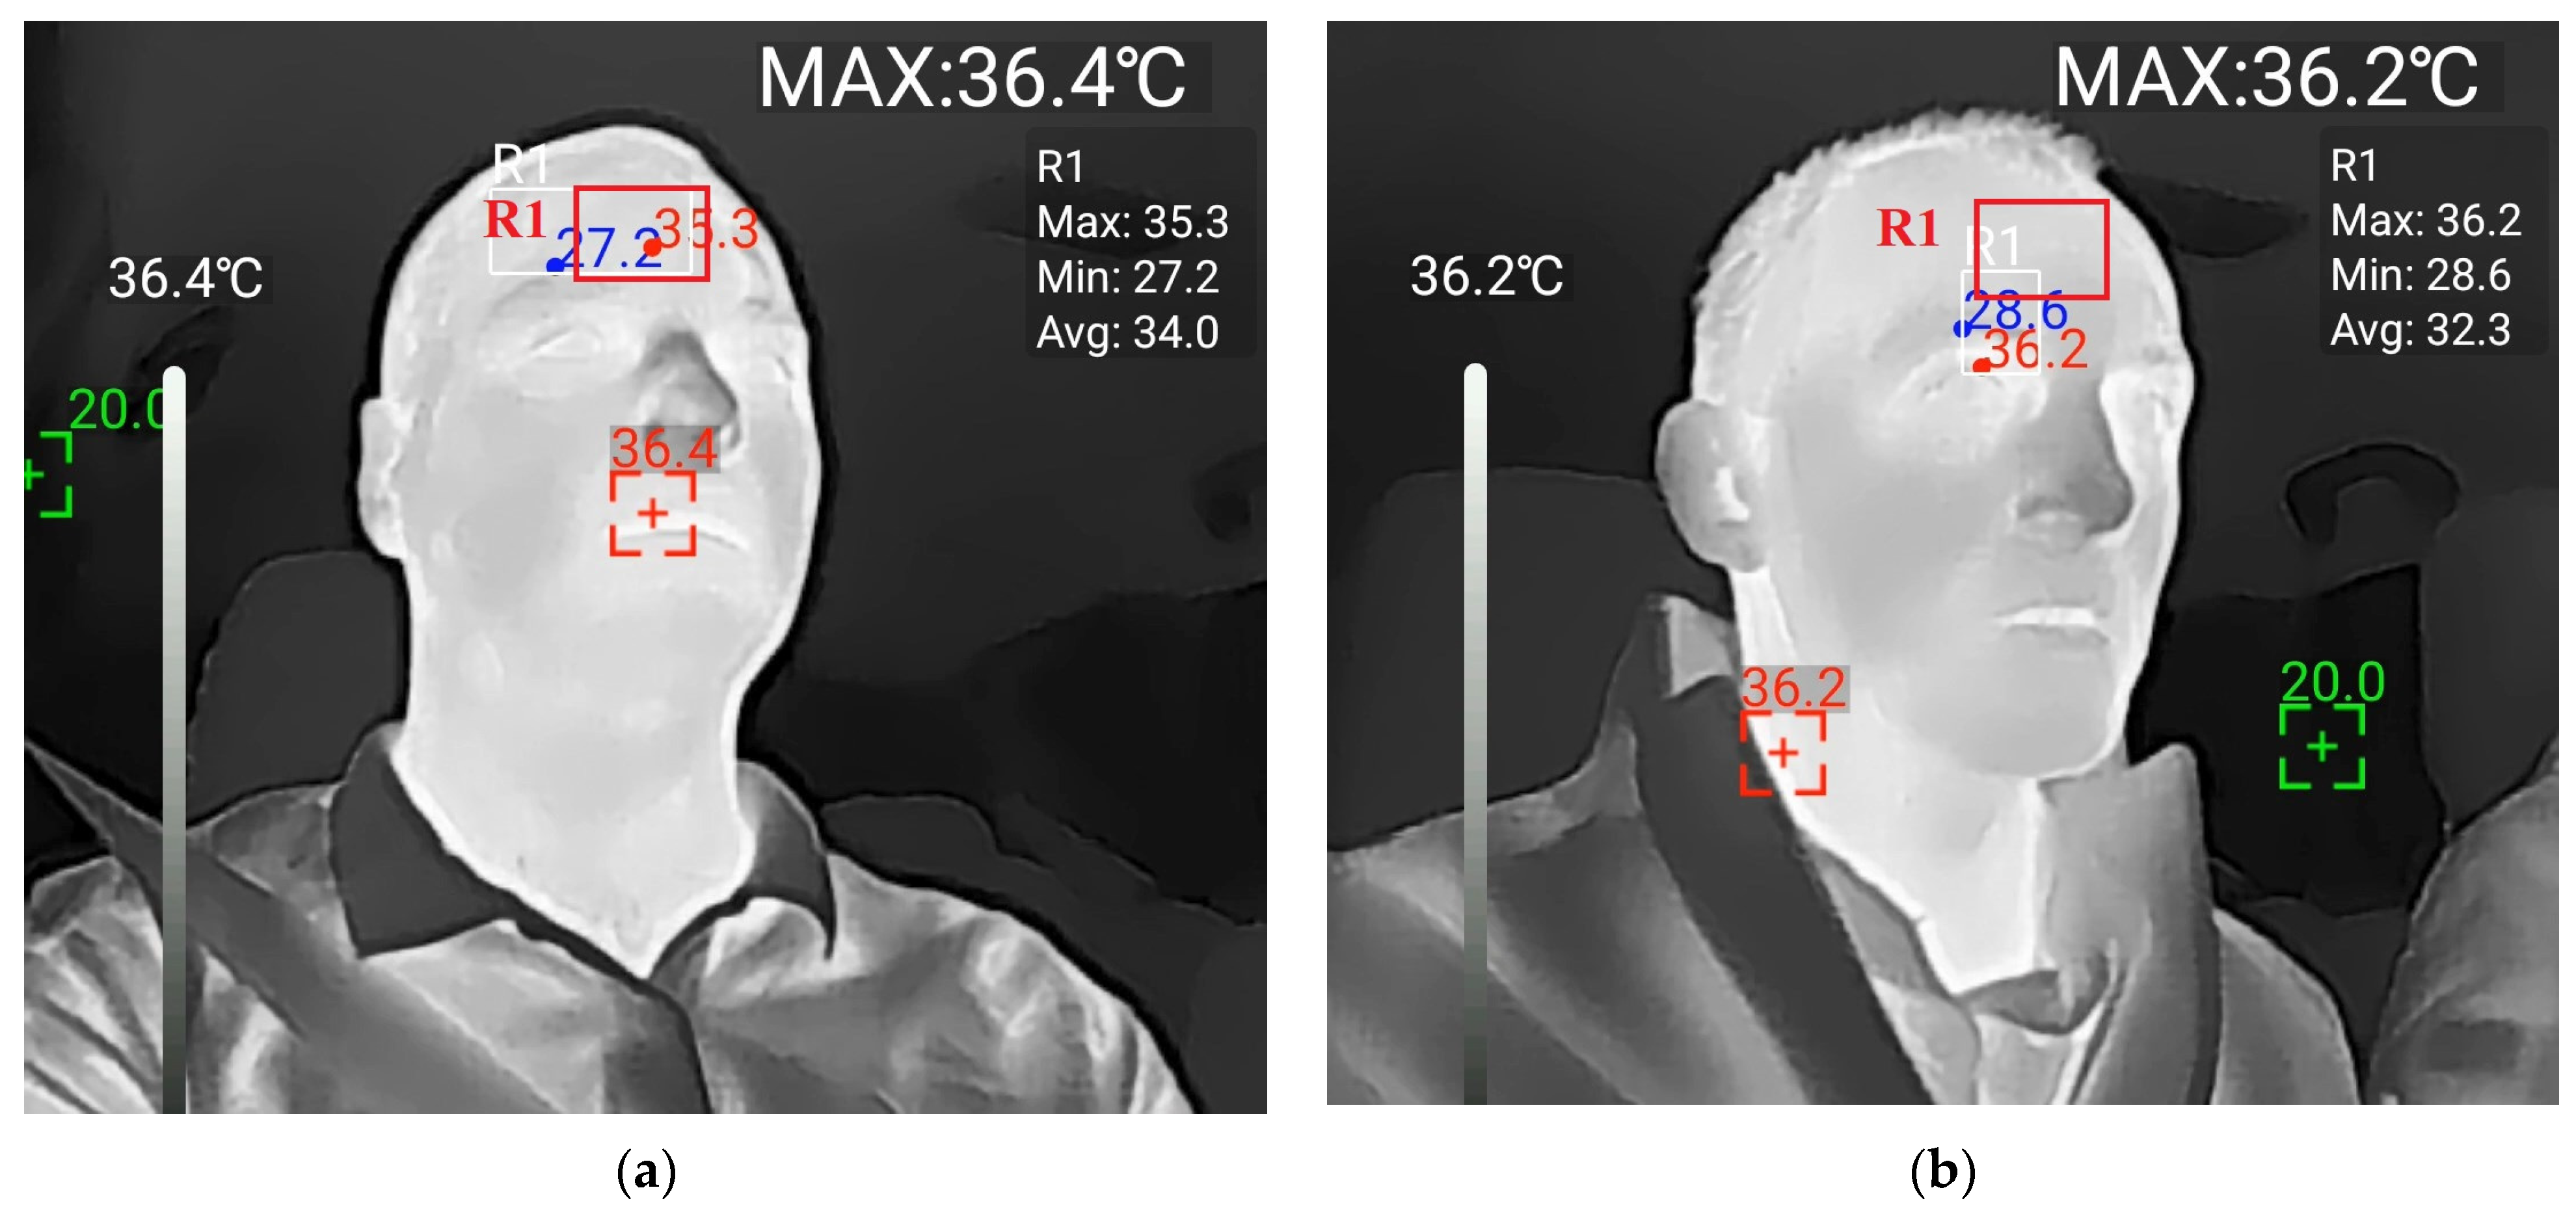
Representative thermal frames showing manual placement of the forehead ROI (R1) used for ROI-based extraction are provided in
Figure 1.
The key specifications of the thermal imager are summarized in
Table 1, while the physical configuration and camera placement within the vehicle are illustrated in
Figure 2 and
Figure 3.
Natural vehicle vibration and subtle head micro-movements were present during real driving. To reduce obvious motion-related artifacts in the quantitative feasibility-level analysis, only frames with visually stable facial capture and clearly preserved forehead-region visibility were selected.
Because raw radiometric detector data were not available, frame-based temperature interpretation was limited to the thermal information displayed by the smartphone application. Therefore, the reported temperature-derived values should be interpreted as approximate workflow-level measurements rather than as fully validated detector-level radiometric data.
2.4. Analysis Strategy
The analysis focused on evaluating thermal signal stability, ROI-based temperature consistency, and cross-session repeatability under repeated real-driving sessions. Observable posture changes were considered only qualitatively as contextual observations and were not quantified in the present study.
The quantitative analysis was based on sampled ROI-derived temperature metrics, including center-point, mean, maximum, and minimum values within the forehead temperature window. In addition, within-session stability was assessed using the ROI mean slope and coefficient of variation, whereas inter-session comparison was evaluated using Pearson correlation and root mean square error (RMSE) of the mean ROI trajectories.
Rather than implementing automated classification or detection algorithms, this study adopted a feasibility-oriented approach. The objective was to evaluate whether a consumer-grade mobile LWIR camera could deliver sufficiently stable thermal observations to support future development of non-contact driver monitoring and alerting systems under real driving conditions.
2.5. Frame-Based Thermal Consistency Assessment
Because the camera workflow used in the present study did not provide raw detector-level radiometric frame export, the analysis was limited to app-displayed thermal imagery and manually positioned temperature windows. Accordingly, the assessment focused on practical frame-level consistency of the thermal facial representation, preservation of the forehead-region thermal pattern, and repeatability of sampled ROI-based temperature observations across sessions.
A pixel-wise temperature interpretation was derived from the displayed thermal image and its associated color scale when required for ROI-based analysis. In this context, the extracted temperature-related values should be interpreted as approximate workflow-level measures rather than strict detector-calibration quantities.
This quantitative framework was intentionally selected to evaluate feasibility-level thermal repeatability and temporal consistency under a practical app-based consumer imaging workflow without relying on unsupported detector-level calibration assumptions.
3. Results
3.1. Workflow-Level Thermal Frame Consistency
Table 2 summarizes the sampled-frame thermal analysis workflow used in the present study. Because the UTi260M camera was operated through its smartphone application environment and did not provide raw detector-level radiometric frame export, the present analysis was intentionally limited to workflow-level thermal frame consistency rather than strict detector-calibration metrics.
The app-displayed thermal frames provided sufficiently stable facial visibility and preserved forehead-region thermal representation to support manually assisted ROI placement, cross-session frame comparison, and the sampled temporal analyses reported in the following sections. Accordingly, this study focuses on feasibility-level consistency of the practical mobile thermal imaging workflow rather than on full radiometric sensor characterization.
3.2. Environmental and Session Control Conditions
All driving sessions were conducted under controlled and comparable environmental conditions. A total of six sessions (S1–S6) were performed in the morning hours, each with a duration of 60 min. None of the sessions were conducted after a workday, thereby helping to maintain comparable baseline conditions across recordings.
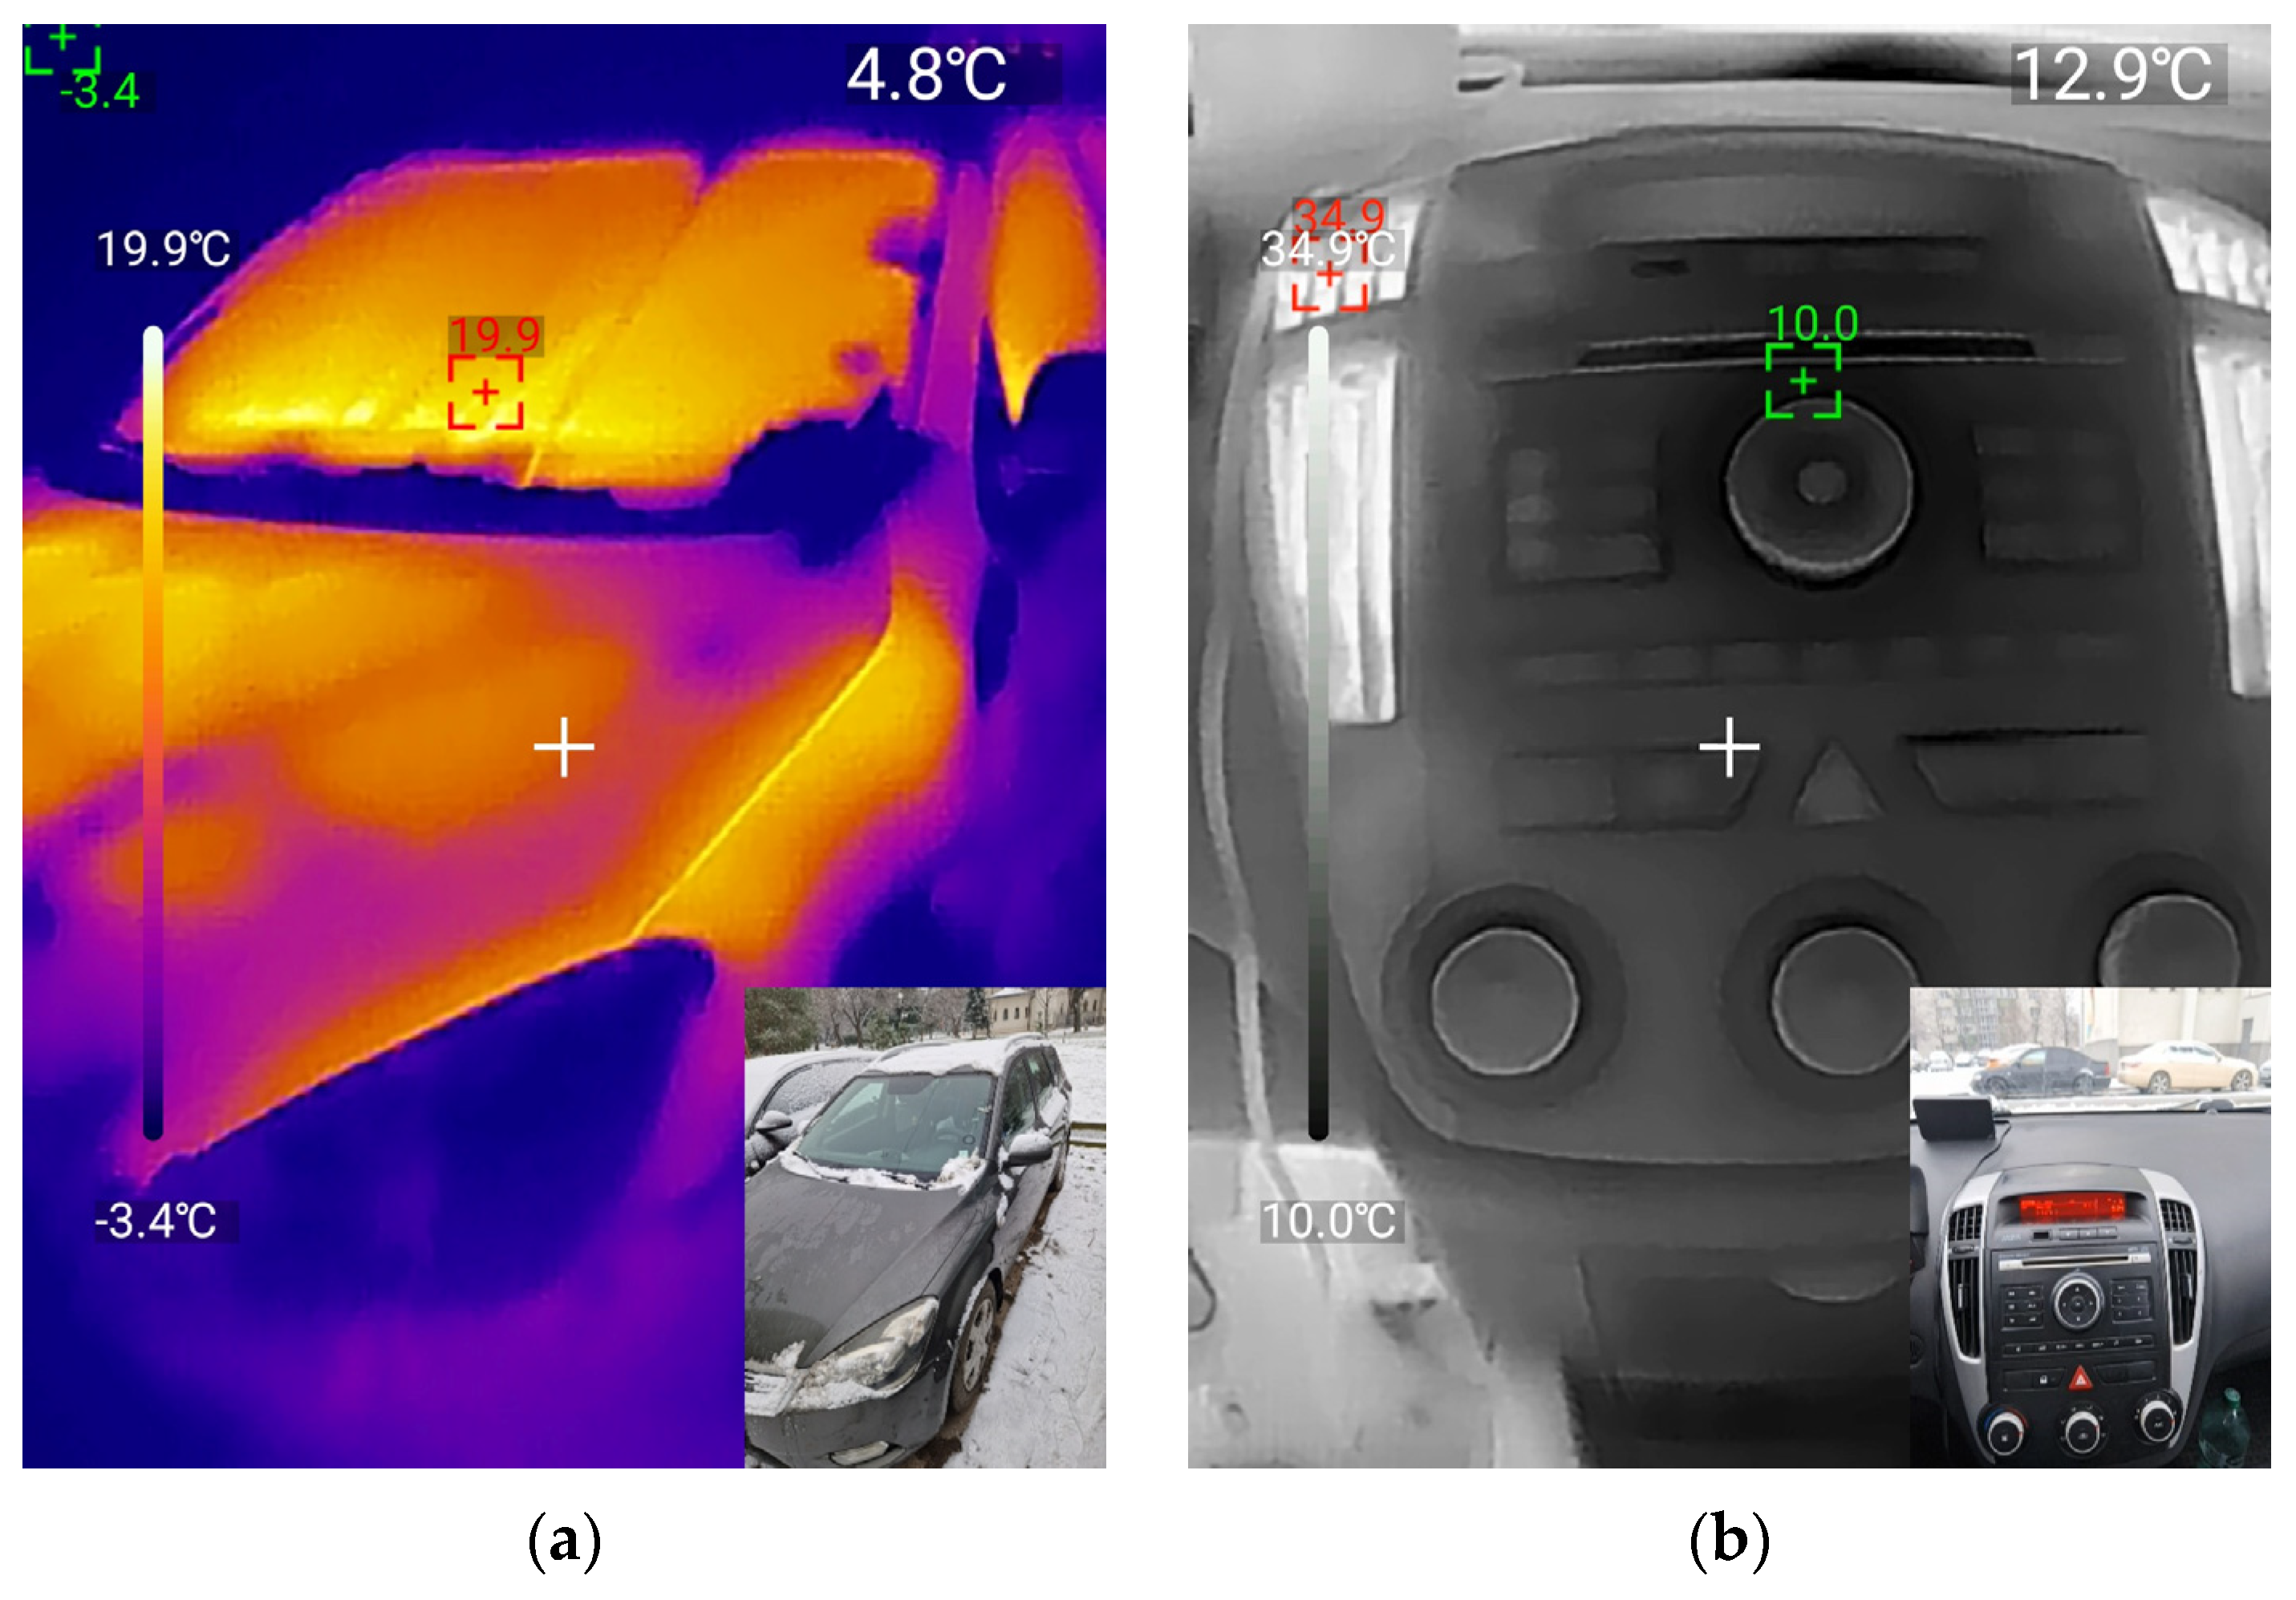
The environmental boundary conditions were documented using thermal imaging of both the external vehicle surface and the interior cabin. Representative images are shown in
Figure 4. During the experimental sessions, the outdoor temperature ranged between −1 °C and 0 °C, while the cabin temperature was stabilized at approximately 23 °C.
A summary of contextual and environmental parameters is provided in
Table 3. The documented thermal gradient between exterior winter conditions and the stabilized cabin environment confirms that the measurements were obtained under controlled and reproducible thermal conditions.
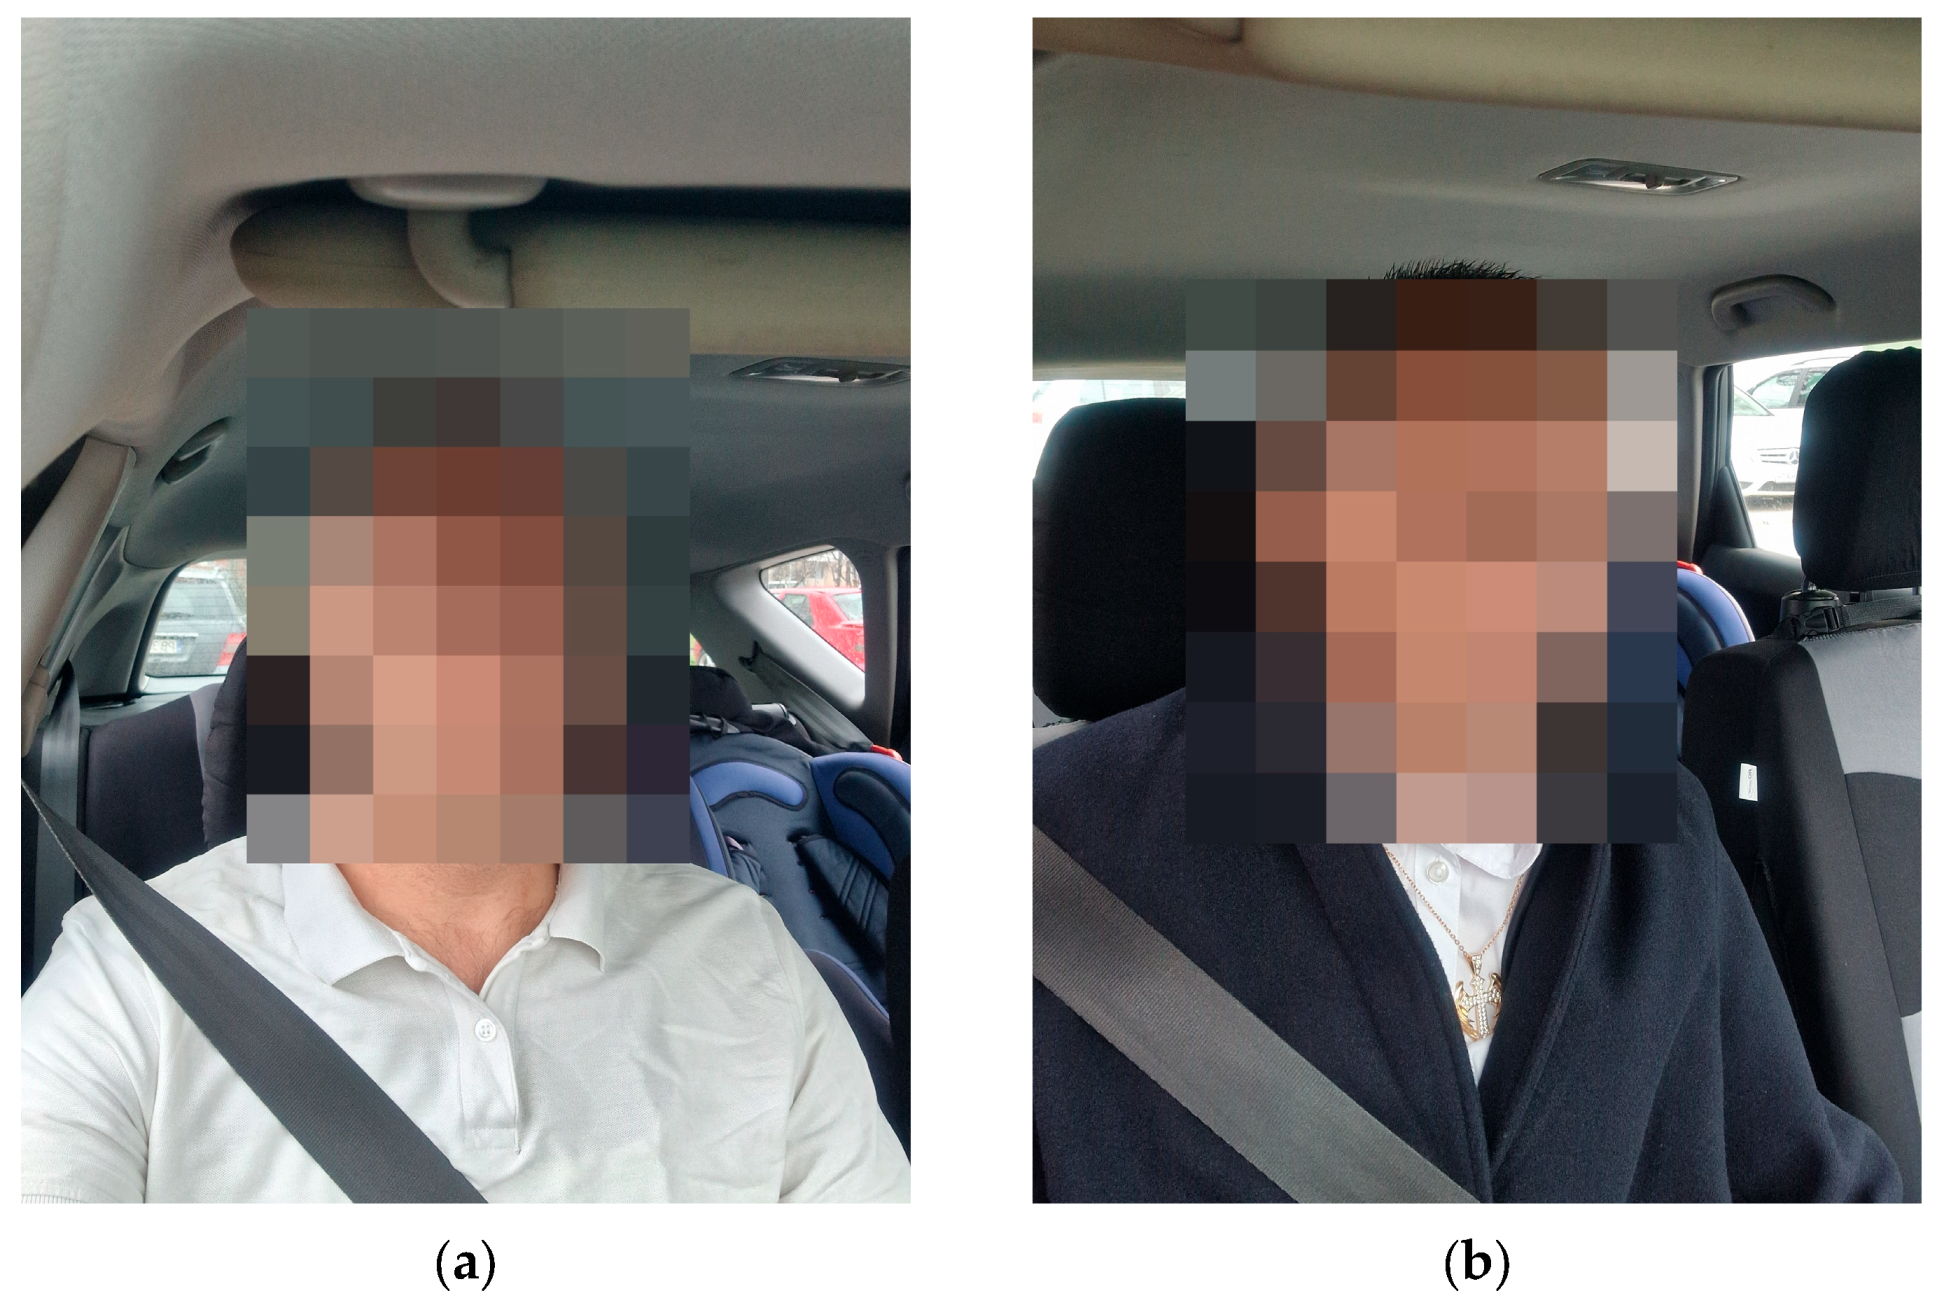
Representative RGB frontal frames for Participant I and Participant II are shown in
Figure 5. These images were acquired using the same mobile device in visible-spectrum mode with the thermal sensor disabled. This figure illustrates the frontal head geometry, facial proportions, and baseline posture under identical camera placement and cabin conditions. This RGB modality serves as a geometric reference for subsequent cross-modal comparison with the LWIR recordings.
Together, these observations establish a geometric and environmental baseline for the subsequent thermal consistency analysis.
3.3. Controlled Pose Sequences—Participant I
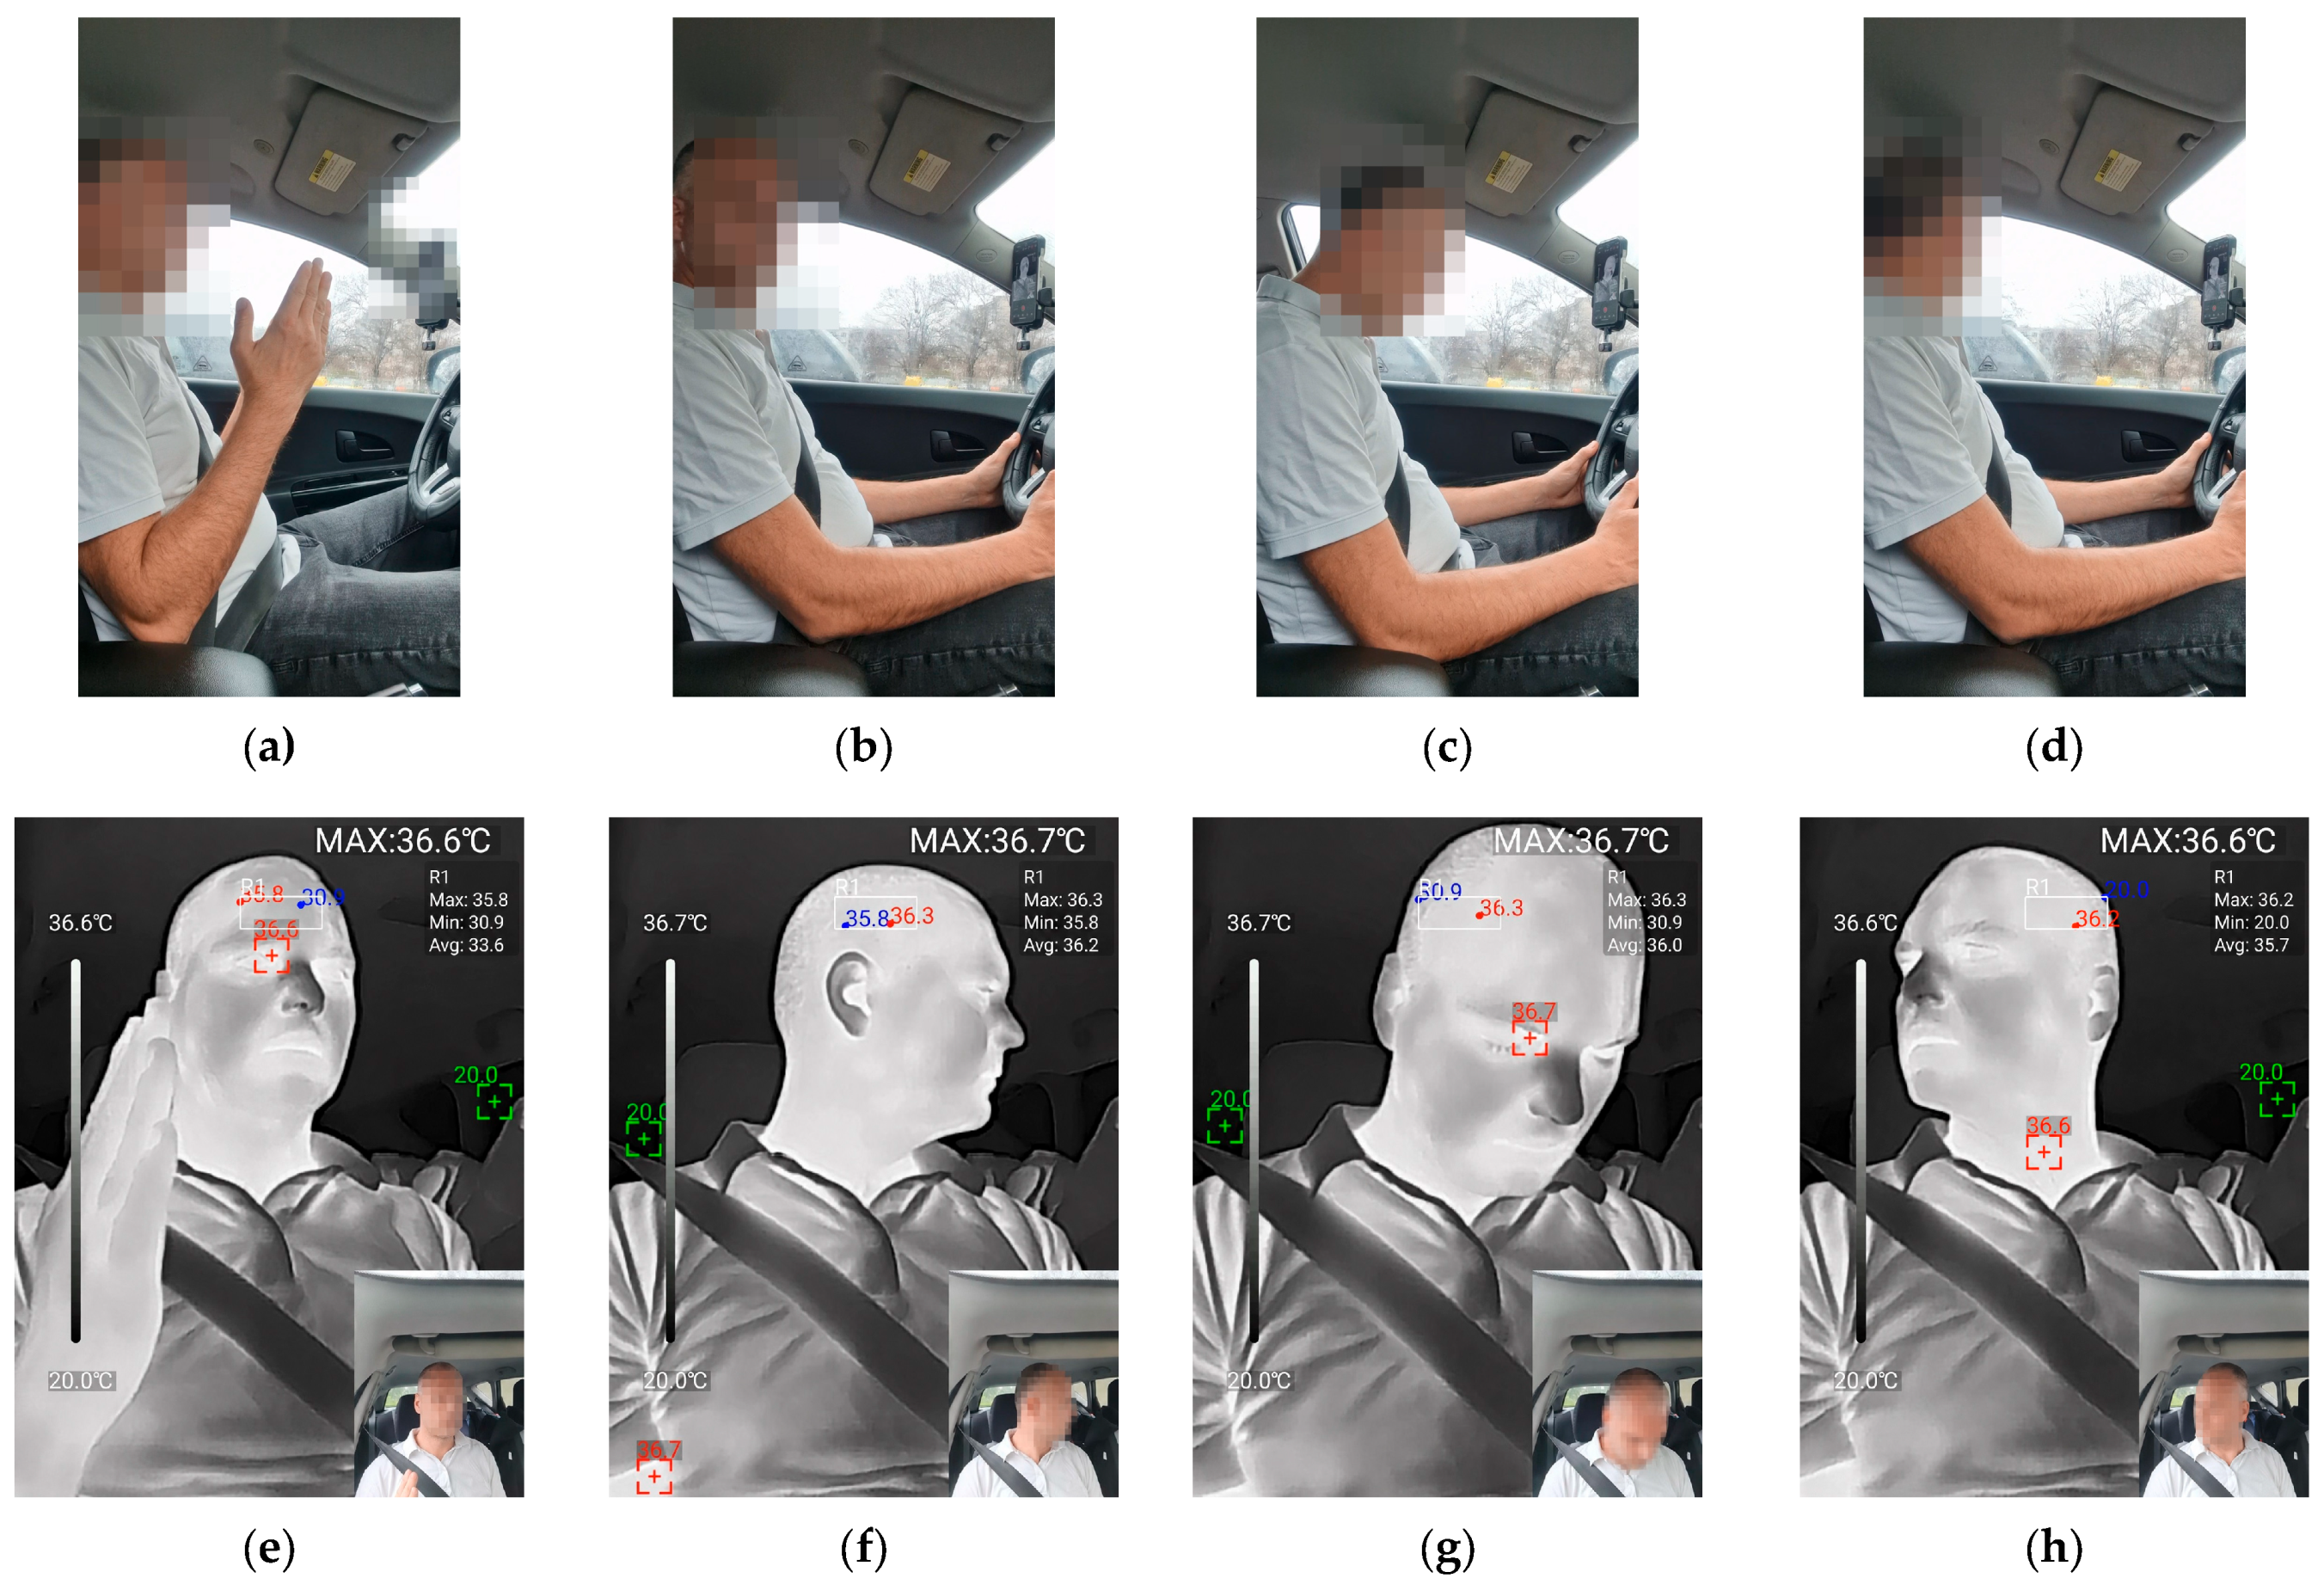
Figure 6 presents synchronized RGB (top row) and LWIR (bottom row) frames for Participant I under controlled stationary conditions. Each RGB image is paired with the corresponding thermal frame acquired at the same time point. Subfigure pairs (a–e), (b–f), (c–g), and (d–h) represent corresponding head configurations recorded simultaneously in visible and thermal modalities.
The sequence includes neutral posture, lateral yaw rotations, and downward pitch inclination. The RGB frames provide a geometric reference view, while the LWIR frames show consistent thermal facial representation and corresponding centroid displacement. The visual correspondence between paired subfigures confirms cross-modal geometric coherence under stationary vehicle conditions.
3.4. Mid-Session Thermal Stability—Participant I
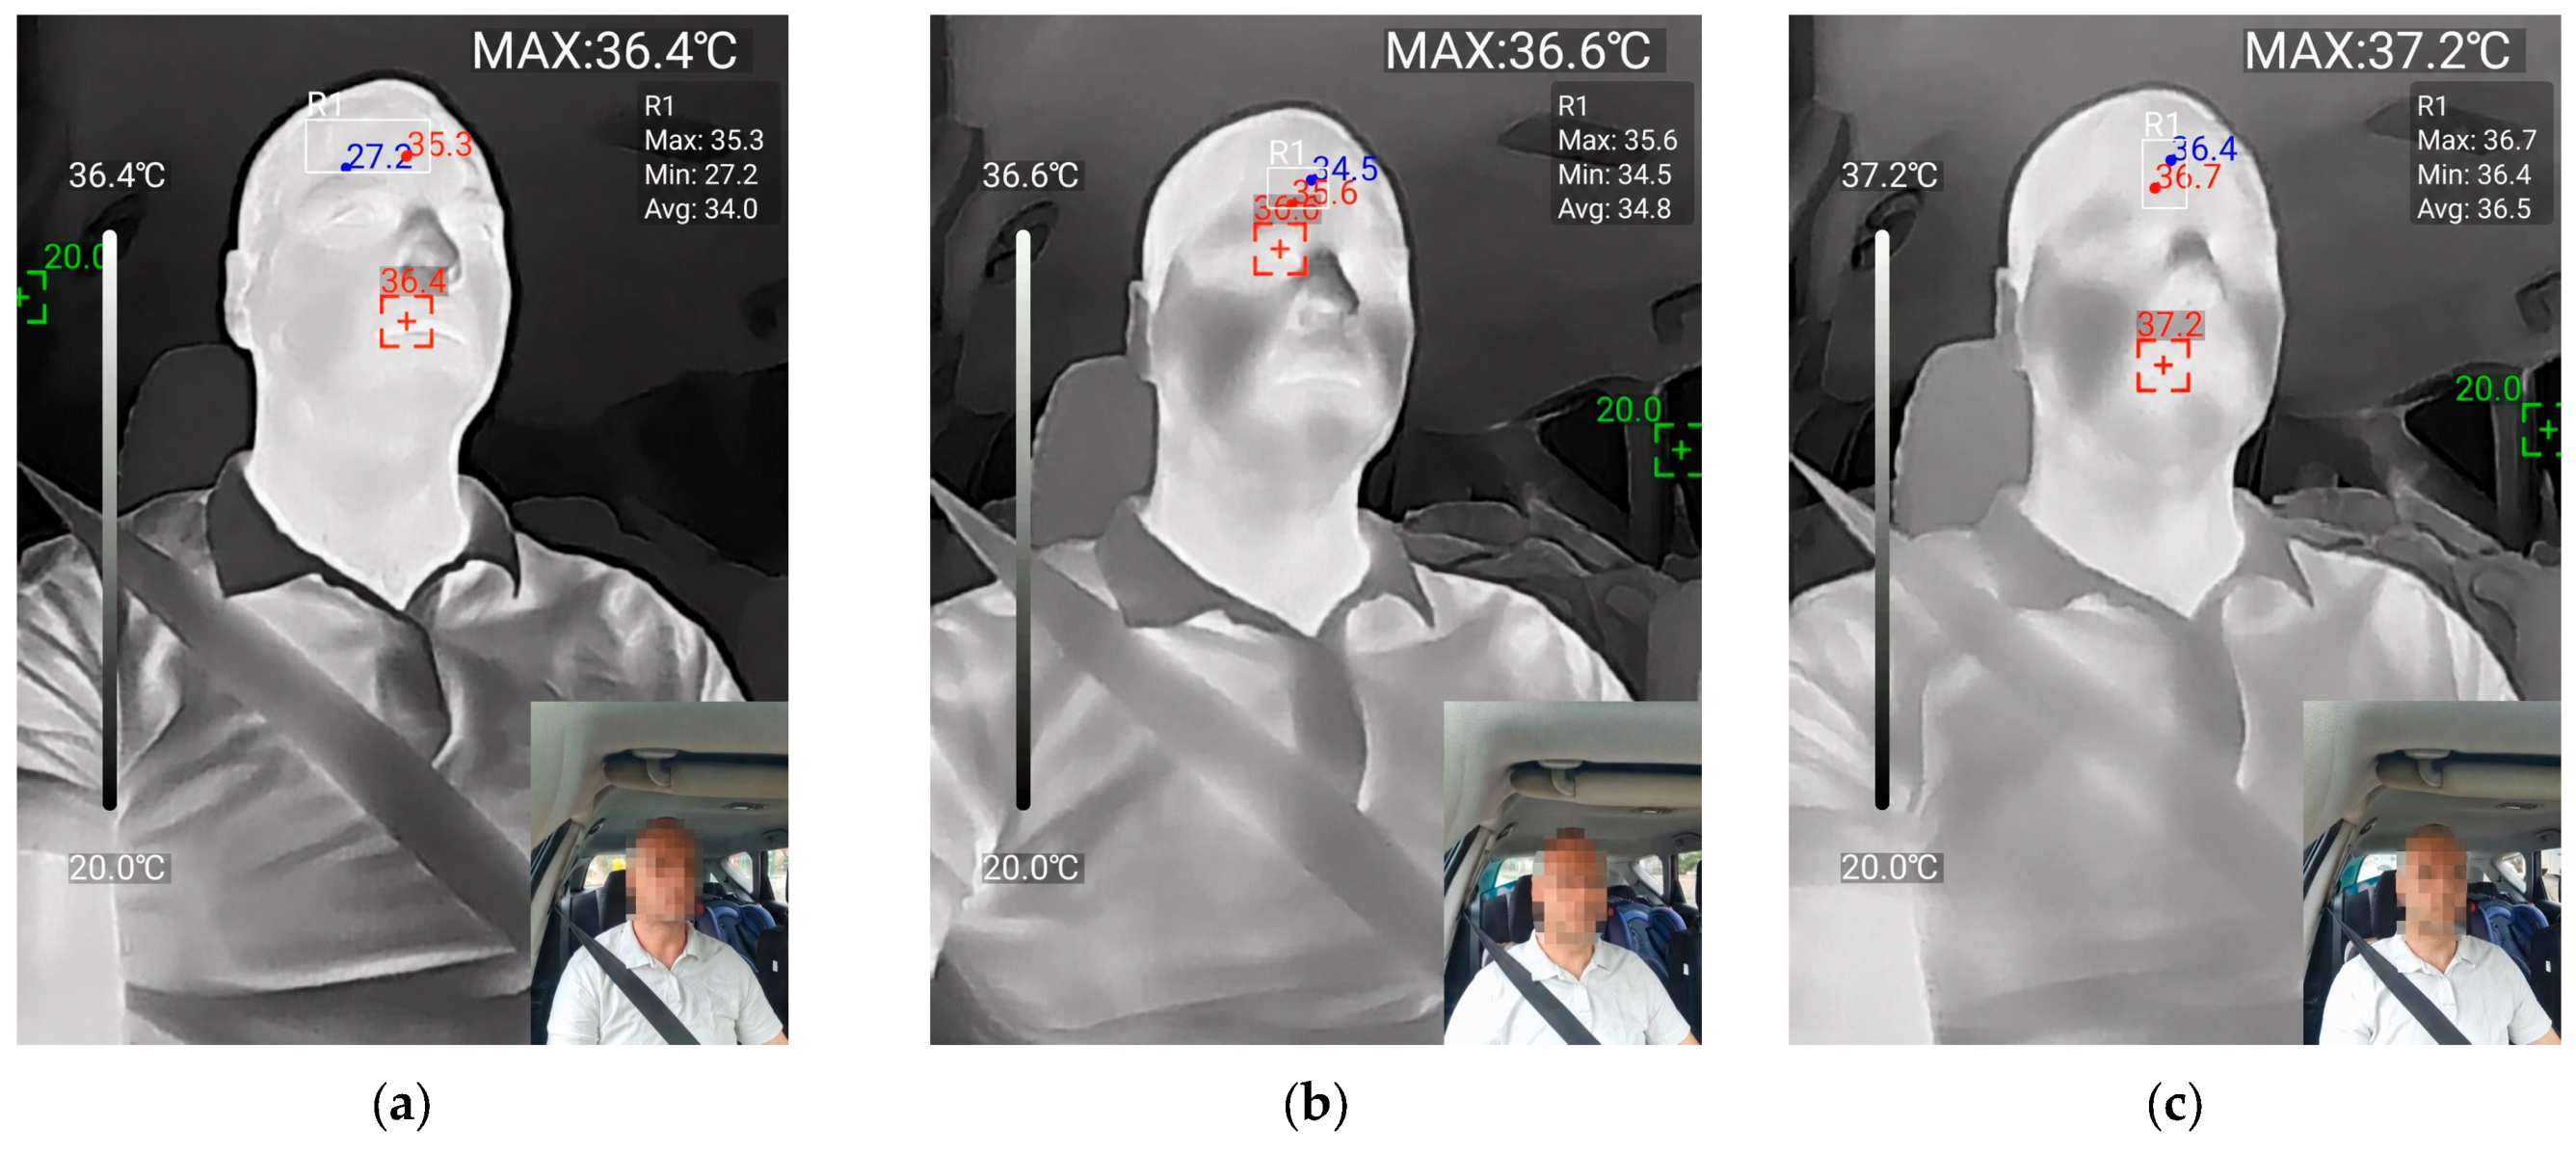
Figure 7 presents representative LWIR frames of Participant I acquired at the midpoint of each of the three driving sessions. The images were extracted at comparable time points to evaluate thermal consistency under similar cabin conditions.
Despite minor variations in maximum recorded temperature values (36.4 °C, 36.6 °C, and 37.2 °C), the spatial facial temperature distribution remains consistent across sessions. The relative thermal gradients between the forehead, nasal region, and background surfaces are preserved.
The uniform appearance of facial contours and the absence of obvious structural artifacts indicate stable thermal representation across separate recording days.
These observations support the repeatability of the LWIR workflow under repeated real-vehicle deployment conditions.
3.5. Mid-Session Thermal Stability—Participant II
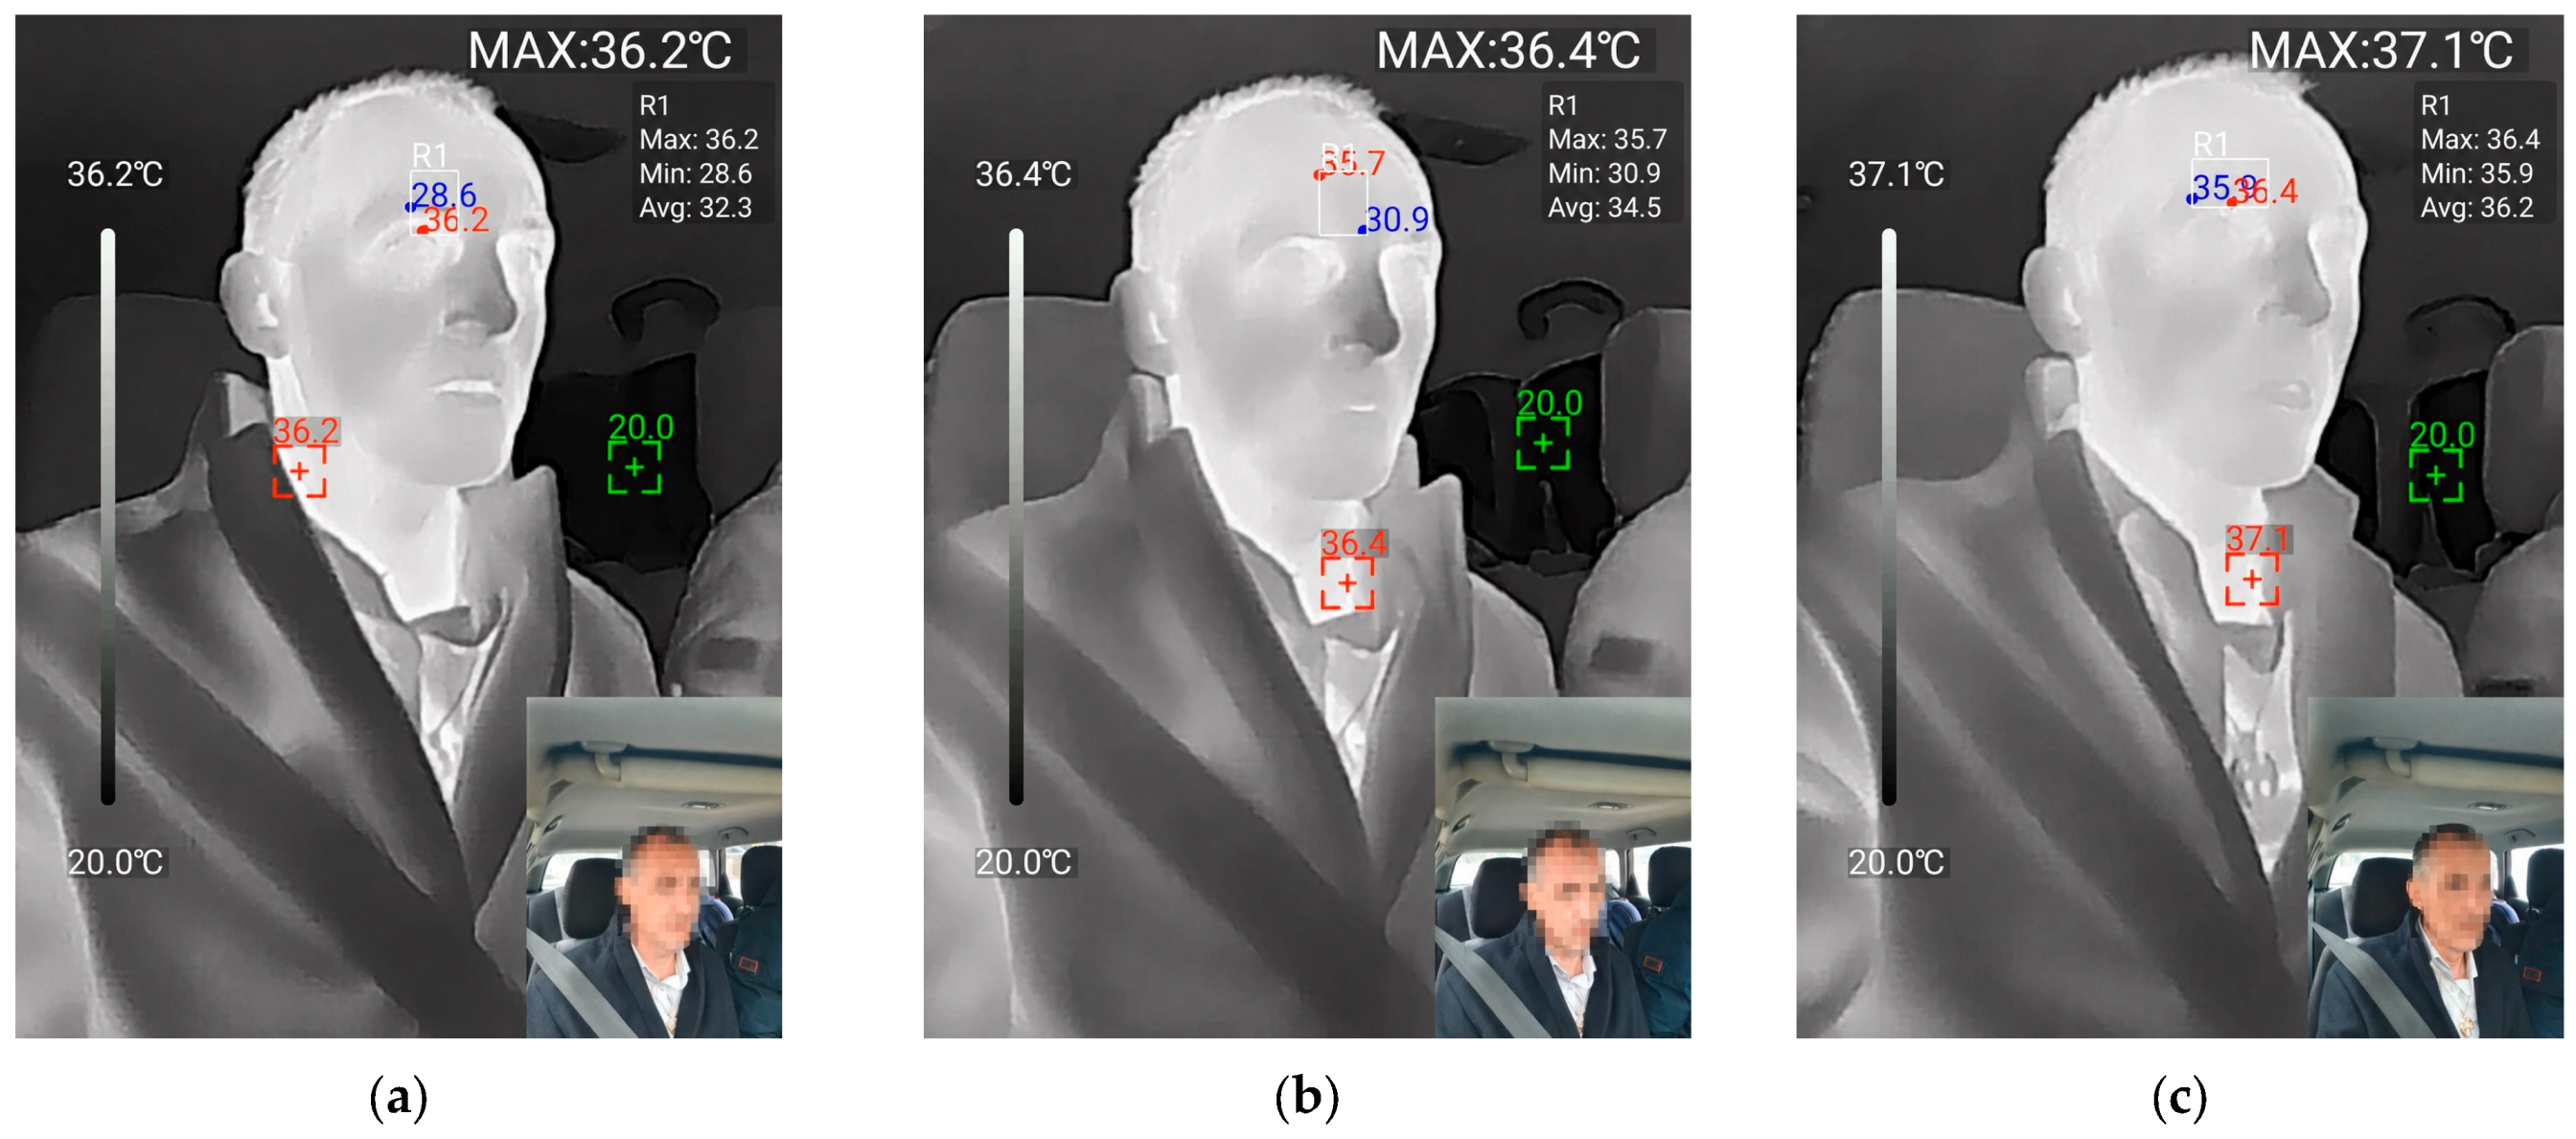
Figure 8 presents representative LWIR frames of Participant II extracted at the midpoint of each of the three independent driving sessions. The images were selected at comparable time points to assess cross-session repeatability of facial thermal distribution.
The maximum recorded temperatures across sessions (36.2 °C, 36.4 °C, and 37.1 °C) show minor variation, while the spatial distribution of the facial thermal gradients remains structurally consistent. The forehead, nasal, and periorbital regions exhibit stable relative intensity patterns.
No abrupt structural artifacts or contour distortions are visible in the selected frames. The preserved facial contours across recording days indicate repeatable thermal representation under comparable in-vehicle conditions.
The comparable cross-session stability observed for both participants in
Figure 7 and
Figure 8 supports the repeatability of the mobile LWIR workflow under repeated real-world deployment conditions.
3.6. Temporal Thermal Evolution—Participant I
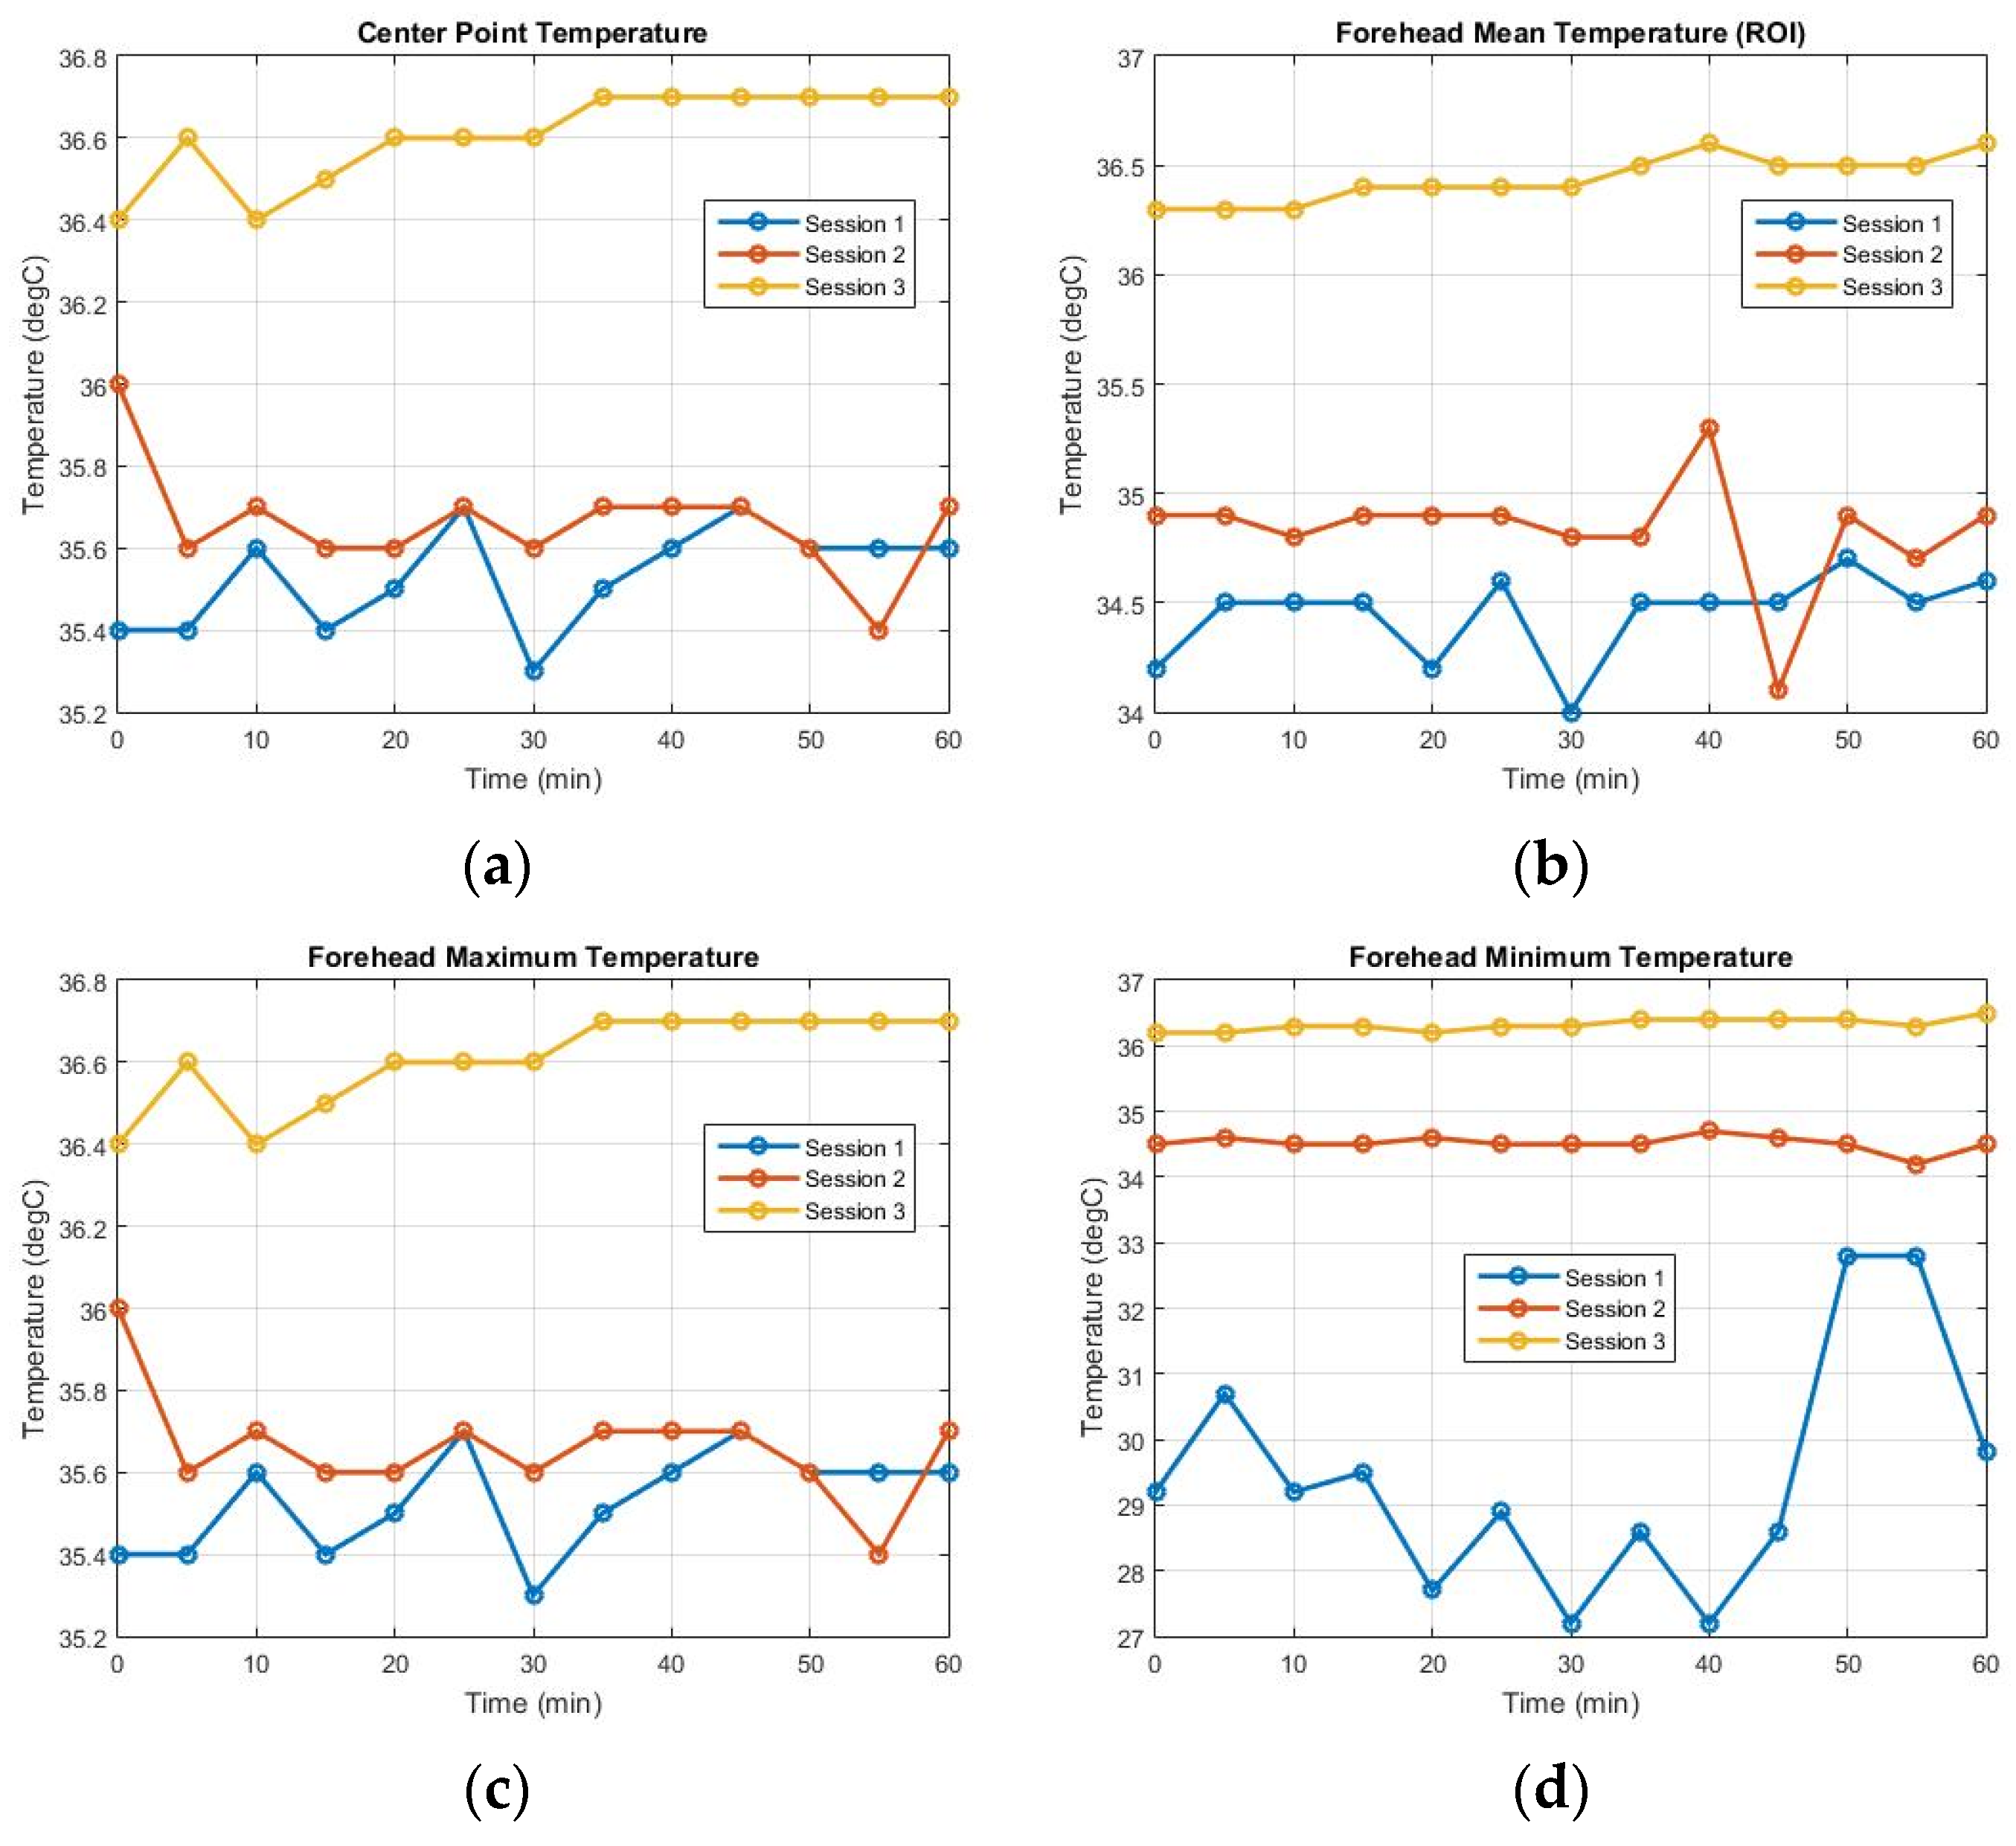
Figure 9 presents the temporal evolution of selected thermal metrics for Participant I across three independent driving sessions. The analyzed parameters include center-point temperature, mean forehead temperature within the defined ROI, maximum forehead temperature, and minimum forehead temperature. The reported time series were generated from single sampled frames extracted at 5 min intervals from the continuous 25 Hz recordings.
Across all sessions, the center-point temperature (
Figure 9a), central point, remains within a relatively narrow range, with gradual fluctuations over the 60 min duration. No abrupt temperature discontinuities or progressive drift behavior are observed.
The mean forehead temperature (
Figure 9b) (ROI) shows moderate temporal variation. Session 2 includes an isolated decrease between approximately 20 and 30 min. Given the manually positioned ROI workflow, sampled-frame analysis, and display-based temperature interpretation, this event is interpreted conservatively as a likely frame-level measurement anomaly related to ROI sensitivity or partial peripheral inclusion rather than as robust evidence of a physiological forehead temperature decrease of such magnitude.
The maximum forehead temperature values (
Figure 9c), forehead max, follow trends consistent with the center-point measurements, indicating stable upper-bound thermal response across sessions. The minimum forehead temperature values (
Figure 9d), forehead min, show greater variability than the mean and maximum ROI metrics. This is expected because the minimum value is particularly sensitive to localized cooling, small ROI boundary shifts, and intermittent inclusion of cooler peripheral pixels. Although frames with obvious motion artifacts were excluded during manual selection, minor residual effects related to natural driving vibration and subtle facial micro-movements may still have contributed to the increased variability of the minimum-temperature signal.
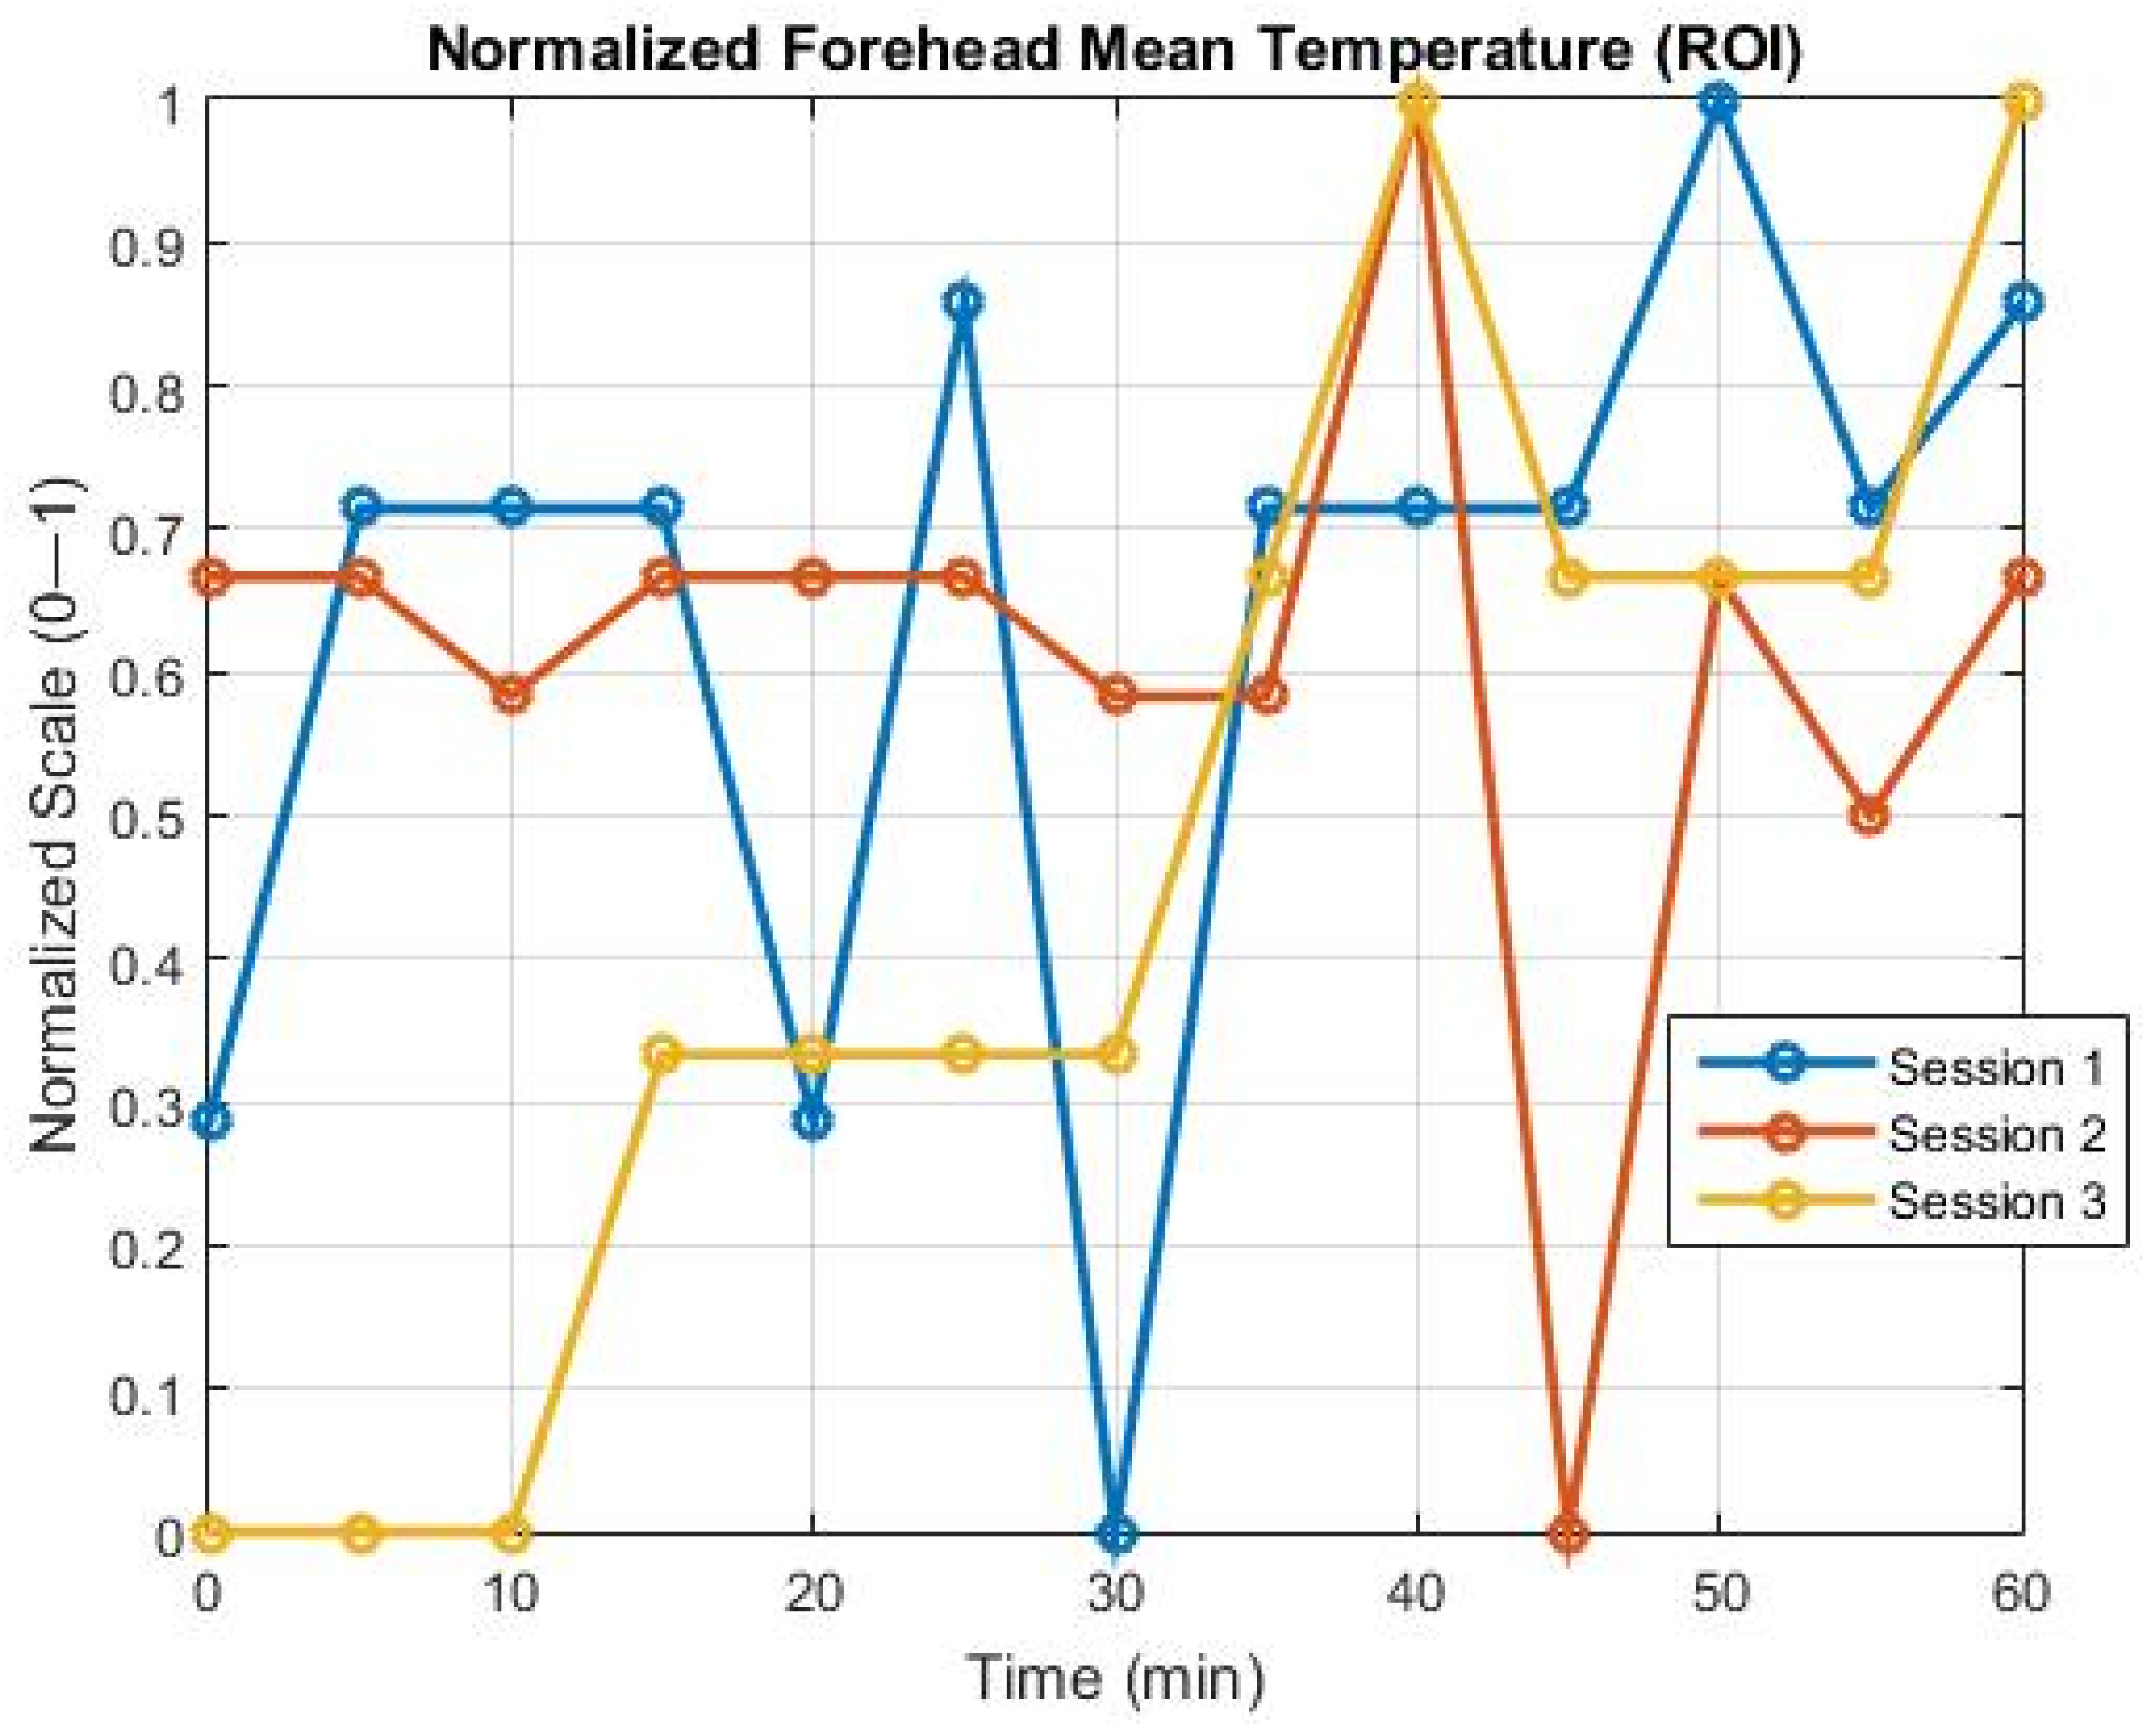
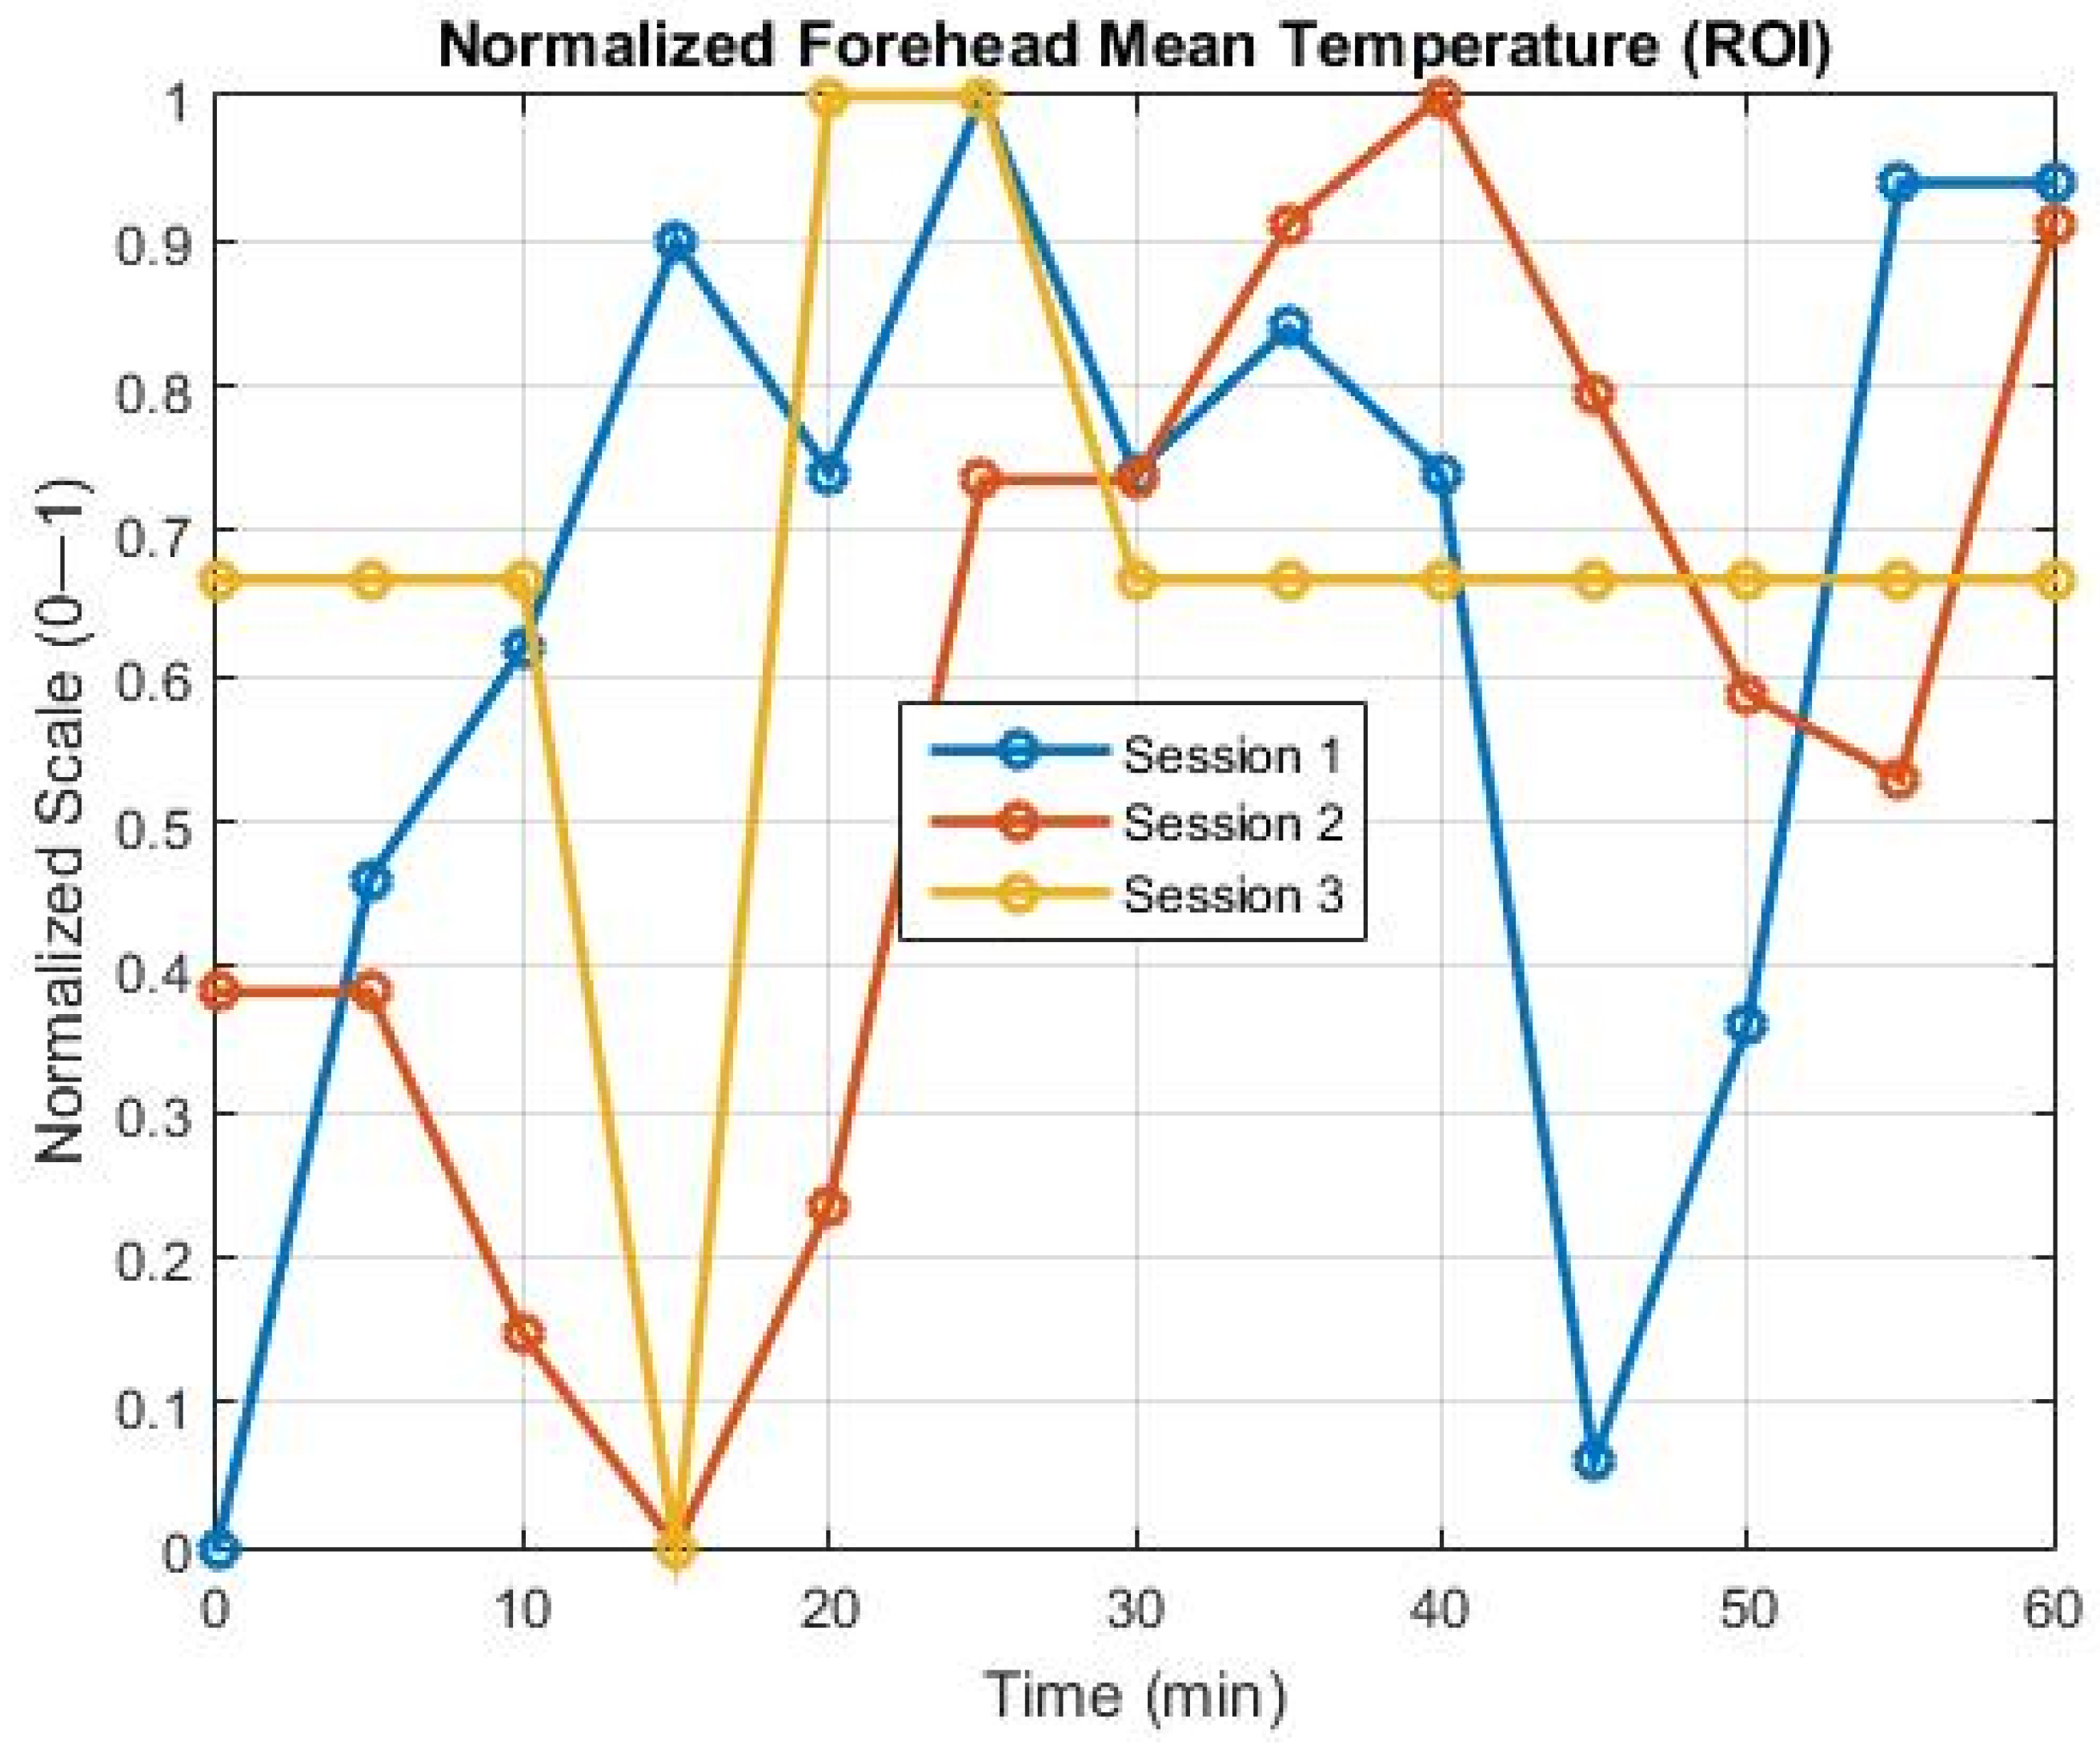
To facilitate inter-session comparison, the normalized forehead temperature trends are shown in
Figure 10. Normalization reduces absolute offsets and highlights relative temporal dynamics. The general progression across sessions demonstrates comparable trend behavior without structural divergence.
Together, these results indicate stable temporal thermal behavior across repeated deployments under comparable driving conditions.
3.7. Temporal Thermal Evolution—Participant II
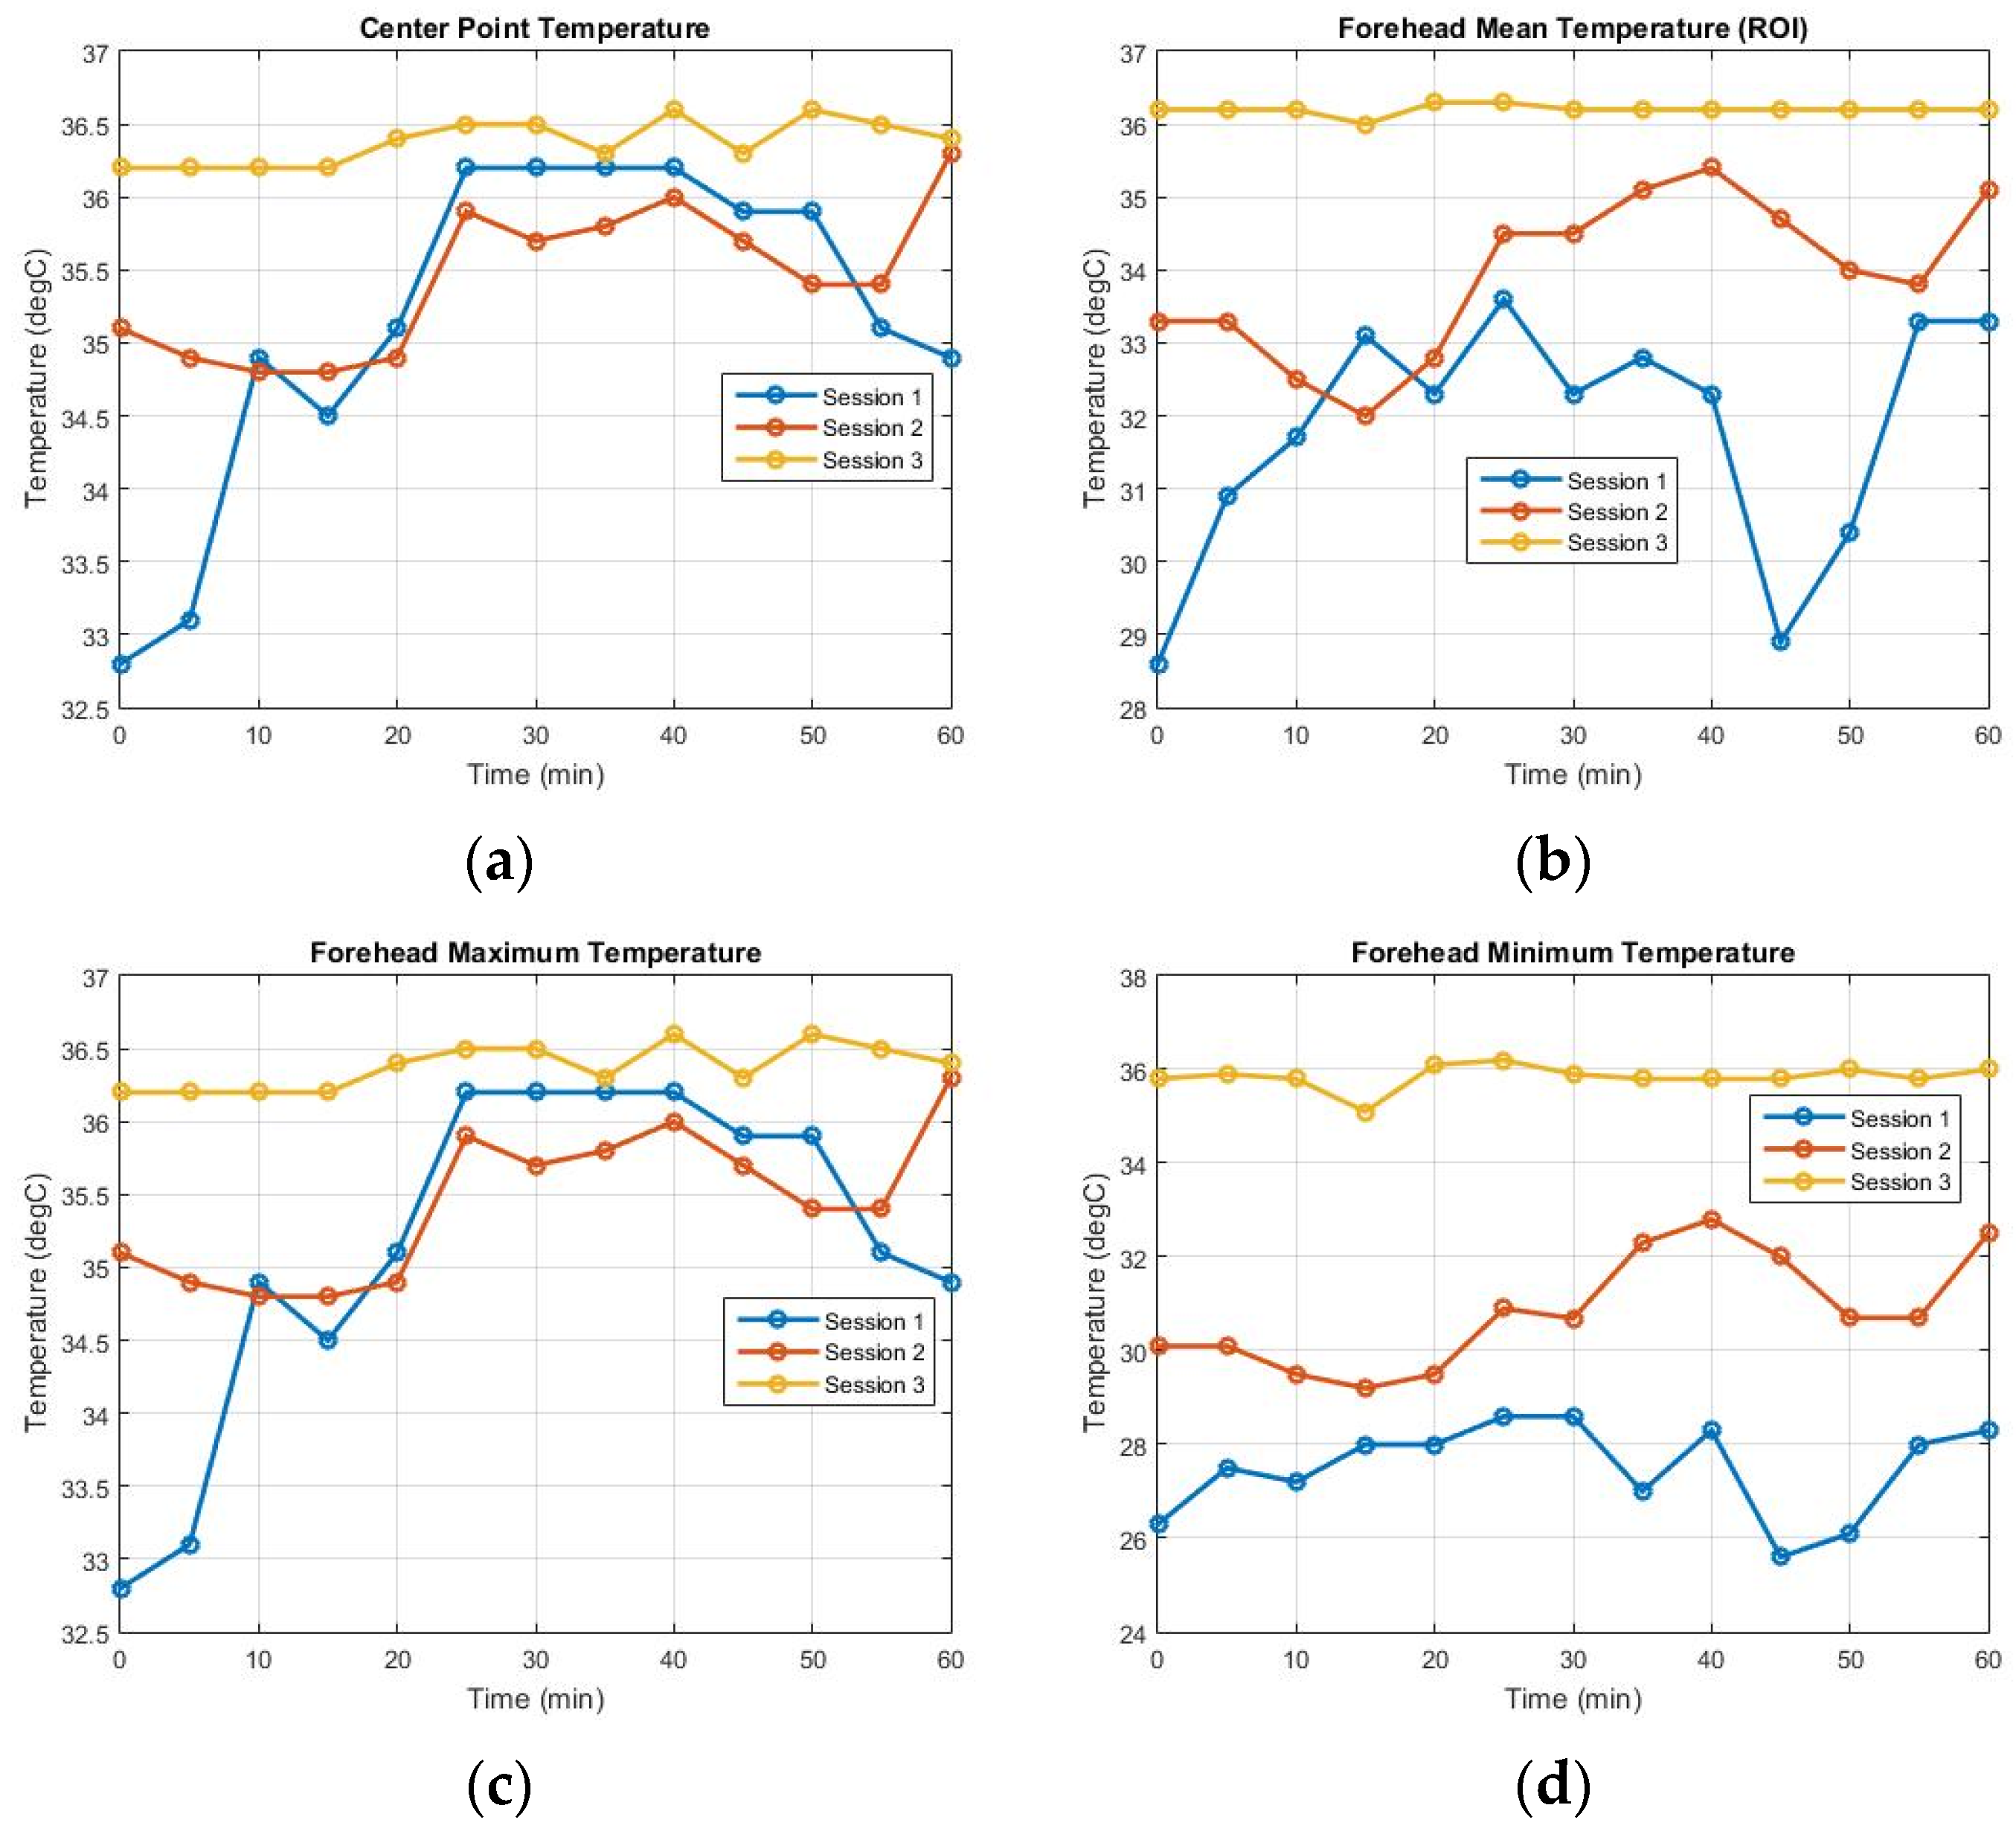
Figure 11 presents the temporal evolution of thermal metrics for Participant II across three independent driving sessions. The analyzed parameters include center-point temperature, mean forehead temperature within the defined ROI, maximum forehead temperature, and minimum forehead temperature. As in the case of Participant I, the reported time series were generated from single sampled frames extracted at 5 min intervals from the continuous 25 Hz recordings.
The center-point temperature (
Figure 11a), central point, demonstrates gradual temporal variation without abrupt discontinuities or unstable oscillatory behavior. Although initial temperature levels differ between sessions, the overall progression remains smooth and structurally consistent.
The mean forehead temperature within the ROI (
Figure 11b), forehead mean, exhibits a moderate inter-session offset while maintaining coherent trend evolution over time. Session-dependent differences appear primarily as vertical shifts rather than as structural divergence in temporal dynamics. The maximum forehead temperature values (
Figure 11c), forehead max, follow patterns consistent with the center-point measurements, indicating stable upper-bound response across sessions.
The minimum forehead temperature values (
Figure 11d), forehead min, display greater variability than the mean and maximum metrics. As for Participant I, this behavior is expected because the minimum value is more sensitive to localized cooling, minor posture changes, and transient ROI boundary displacement. After normalization to a 0–1 scale, the relative temporal dynamics across sessions become more directly comparable, as shown in
Figure 12. The normalized trends indicate preserved temporal structure without evidence of progressive instability.
These observations support the repeatable temporal behavior of the LWIR workflow under comparable operating conditions.
The within-session analysis summarized in
Table 4 demonstrates low temporal variability across all sessions. The coefficient of variation remained below 5.2% for both participants, indicating stable intra-session thermal behavior. ROI mean temperature slopes ranged from 0.0003 to 0.0365 °C/min, corresponding to gradual and bounded temperature changes over the 60 min recordings. No uncontrolled drift or abrupt instability was observed.
The inter-session comparison results are presented in
Table 5. Pearson correlation values of mean ROI signals ranged from −0.02 to 0.40, indicating differing absolute temporal patterns across recording days. Root mean square error values ranged between 1.45 °C and 4.67 °C, reflecting baseline temperature offsets rather than structural instability.
Within-session stability, as assessed by the coefficient of variation and ROI mean slope (
Table 4), indicates that the sampled thermal measurements remained stable within individual sessions. By contrast, the inter-session Pearson correlation values in
Table 5 quantify similarity between temporal trajectories recorded on different days and should not be interpreted as direct evidence of sensor stability. The modest correlation values more plausibly reflect day-to-day physiological and contextual baseline variation between sessions.
4. Discussion
The present study evaluated the feasibility, repeatability, and temporal stability of a low-cost long-wave infrared (LWIR) thermal imaging workflow for in-vehicle driver monitoring under real operating conditions. The experimental design incorporated controlled posture validation (
Figure 5 and
Figure 6), cross-session repeatability analysis (
Figure 7 and
Figure 8), and sampled time-series thermal evolution across three independent sessions for each participant (
Figure 9,
Figure 10,
Figure 11 and
Figure 12). Taken together, these components provide a multi-layer feasibility framework for assessing whether a consumer-grade mobile LWIR system can preserve sufficient facial thermal consistency for ROI-based monitoring in a real automotive cabin.
4.1. Validation of Camera Position and ROI Stability
Figure 5 and
Figure 6 confirm that the selected mounting configuration ensured consistent visibility of the facial ROI across multiple head orientations and posture variations. The comparison between RGB and LWIR images demonstrates that the forehead region remained within the measurement field under the tested pose changes.
The stationary validation condition shown in
Figure 5 and
Figure 6 reduced motion-related confounding factors and allowed the geometric stability of the measurement setup to be assessed more directly. The preserved thermal contrast across the tested poses indicates that the manually positioned forehead window was not critically dependent on minor head rotations. This supports the geometric suitability of the selected camera placement for feasibility-level facial thermal monitoring inside the vehicle cabin.
4.2. Cross-Session Repeatability
Figure 7 and
Figure 8 present representative mid-session thermal frames for both participants across three independent recording days. For both drivers, the facial thermal patterns remained visually coherent, and the maximum displayed temperatures remained within biologically plausible facial ranges. The observed variation between sessions appeared primarily as modest differences in absolute thermal levels rather than as structural distortion of the facial thermal pattern.
Importantly, no persistent hotspot displacement, major contour deformation, or obvious frame-level failure was observed in the representative mid-session images. This supports the interpretation that the app-based LWIR workflow preserved repeatable facial thermal representation across repeated driving sessions performed under comparable environmental conditions.
4.3. Temporal Stability of Thermal Metrics
The time-series results shown in
Figure 9,
Figure 10,
Figure 11 and
Figure 12 provide additional insight into the temporal behavior of the sampled ROI-derived thermal metrics. For both participants, the center-point and mean forehead temperature trajectories remained generally smooth over the 60 min sessions, while maximum values followed similar upper-bound behavior. Minimum values displayed greater fluctuation, which is expected given their higher sensitivity to localized cooling, ROI-edge effects, and minor frame-level placement variation.
For Participant I, an isolated decrease was observed in the mean forehead ROI signal during Session 2. Given the manually assisted ROI workflow, sampled-frame analysis, and app-based temperature interpretation, this event is most appropriately treated as a likely measurement anomaly related to ROI sensitivity or partial peripheral inclusion, rather than as strong evidence of a physiological forehead temperature decrease of such magnitude. This interpretation is consistent with the general stability of the remaining temporal trajectories.
Normalized ROI trends (
Figure 10 and
Figure 12) further indicate that despite differences in absolute temperature levels between sessions, the relative temporal patterns remained broadly comparable. Within-session stability, as assessed by the ROI mean slope and coefficient of variation (
Table 4), supports the conclusion that the sampled thermal measurements remained stable within individual sessions. By contrast, the inter-session Pearson correlation values in
Table 5 quantify similarity between trajectories recorded on different days and should not be interpreted as direct evidence of sensor stability. The modest correlations are more plausibly explained by day-to-day physiological and contextual baseline variation, including pre-drive thermal adaptation, clothing insulation, initial physiological state, and small cabin microclimate differences.
4.4. Sensor Performance Under Real Driving Conditions
Unlike laboratory-only validation studies, the present work included real in-vehicle measurements under prolonged driving exposure. The thermal workflow operated under varying head orientations, natural posture adjustments, a realistic cabin environment, and an extended monitoring duration. Despite these uncontrolled micro-variations, the sampled thermal observations remained interpretable and sufficiently stable for manually assisted ROI-based analysis.
Accordingly, the present findings suggest that the examined low-cost LWIR workflow can support feasibility-level facial thermal monitoring under realistic automotive conditions. At the same time, this study does not claim deployable automated driver state classification or full radiometric validation. Rather, it demonstrates that a practical consumer-grade thermal workflow can preserve useful facial thermal consistency for exploratory monitoring applications.
4.5. Scientific Contribution and Novelty
The novelty of the present work lies primarily in its structured validation methodology rather than in the hardware itself. This study contributes a multi-layer feasibility framework combining geometric validation, cross-session repeatability, and temporal consistency assessment for a manually assisted forehead-ROI workflow in a real automotive environment.
Whereas many previous studies have focused on drowsiness classification, algorithmic detection, or multimodal driver state inference, the present work addresses an earlier prerequisite question: whether a compact consumer-grade LWIR workflow can preserve sufficient facial thermal consistency to justify future higher-level driver-monitoring development. In this sense, the contribution of this study is methodological. It does not establish a deployable driver state classifier, but it does provide evidence that a manually assisted consumer-grade LWIR workflow can support feasibility-level ROI-based thermal monitoring under controlled real driving conditions.
4.6. Limitations
The present study was limited to two healthy adult male participants of similar age. Therefore, the findings cannot be generalized to broader driver populations without further validation across different ages, sexes, facial morphologies, facial hair conditions, eyewear use, health states, and other subject-specific factors that may influence apparent facial thermal patterns.
All sessions were conducted during winter mornings under relatively stable environmental conditions, with outdoor temperatures between approximately −1 °C and 0 °C and a cabin temperature stabilized at approximately 23 °C. These conditions do not represent the full range of in-vehicle thermal environments, such as summer solar loading, rapidly varying cabin thermal fields, or direct HVAC airflow toward the face.
A further limitation is that the forehead temperature window was positioned manually for each selected frame. This manually assisted workflow was intentionally used to avoid losing the target region in low-resolution LWIR imagery, but it is labor-intensive and does not represent a fully automated driver monitoring system. Future work should evaluate the influence of automated face and ROI tracking, including possible boundary jitter and frame-to-frame instability.
In addition, the present workflow did not provide access to raw detector-level radiometric data. Accordingly, the reported temperature-derived values and image stability descriptors should be interpreted as app-based workflow-level measures rather than as strict radiometric calibration metrics or native-sensor noise parameters.
5. Conclusions
This study indicates that the examined low-cost LWIR workflow can provide sufficiently stable, repeatable, and temporally consistent facial thermal observations under realistic in-vehicle conditions.
Geometric validation confirmed that the selected camera placement ensured reliable visibility of the forehead ROI across multiple head orientations and posture changes. Cross-session analysis showed that facial thermal distributions remained structurally consistent without major distortion. Sampled time-series evaluation revealed generally smooth temporal evolution of center-point and ROI-based temperature metrics over 60 min sessions, with no evidence of progressive within-session instability.
Although minor inter-session offsets were observed, normalized analysis confirmed preservation of relative temporal behavior, indicating that the observed variation is more consistent with baseline session offsets than with structural sensor instability. This study therefore supports the feasibility of using a manually assisted consumer-grade LWIR workflow for ROI-based facial thermal monitoring in a real automotive cabin.
The contribution of this work lies in its structured feasibility methodology rather than in hardware innovation. By combining geometric validation, cross-session repeatability, and temporal consistency assessment under realistic driving conditions, this study provides a methodological foundation for future development of thermal-based driver monitoring approaches.
Future research should expand the participant cohort, include more diverse environmental conditions, and integrate automated ROI tracking in order to further evaluate robustness, generalizability, and practical scalability.