


Abstract
Traffic calming devices (TCMs) are widely implemented to reduce urban vehicle speeds; however, their influence on drivers’ direct control inputs remains underexplored. This study examines how drivers redistribute braking, throttle and steering inputs in the presence of speed cushions, extending driver–infrastructure interaction assessment beyond speed-only metrics. A driving simulator reproduced an urban corridor in Messina (Italy). Twenty-five drivers completed three scenarios: baseline without traffic calming (No TCM), daytime with speed cushions and nighttime with speed cushions. Cushion colour (red/blue) and width (1.5, 1.8, 2.1 m) were varied. Vehicle telemetry was analyzed using repeated-measures ANOVA with corrected post hoc tests and partial η2 as effect size. The analysis was complemented by paired within-subject comparisons, bootstrap confidence intervals and additional transient indicators computed on travelled-distance windows to support transparent effect interpretation without replacing the RM-ANOVA framework. Compared with No TCM, speed cushions increased mean braking (+224% Day, +372% Night) and reduced the mean normalized throttle input by approximately 55%, with stronger braking at night. Width primarily influenced throttle release and steering corrections, whereas colour modulated braking under reduced visibility. Despite limitations related to sample size and simulation, the findings provide actionable evidence for contexts where cushion width and colour are not standardized.
1. Introduction
In recent decades, urban policies have increasingly focused on enhancing road safety by implementing targeted interventions aimed at reducing vehicle speed. Given the widely recognized association between operating speed, crash severity and fatality risk in an urban environment [1], effective speed mitigation is particularly critical in areas characterized by a high concentration of vulnerable road users [1,2].
Traffic calming devices, such as speed humps, speed cushions, raised pedestrian crossings, chicanes and traffic islands [2,3,4], have been reported to reduce crash frequency, primarily through their impact on vehicle speed [5]. However, these measures are not intended to influence speed alone. By introducing physical constraints or perceived discomfort, traffic calming devices can also generate secondary effects on driving style and decision-making processes, indirectly modifying drivers’ behaviour.
Previous research has investigated driver behaviour in the presence of different types of vertical traffic calming measures. Abdulmawjoud et al. [6], for example, analyzed flat-topped humps and single and double bumps installed on arterial roads, reporting substantial speed reduction. Their results showed 85th-percentile speeds decreasing to approximately 12 km/h at flat-topped humps, with peak deceleration values of up to approximately 1.20 m/s2 observed in proximity to the calming measures, highlighting the pronounced influence of such devices on longitudinal driving behaviour.
The study of traffic calming interventions in real-world environments remains challenging. Urban traffic systems are shaped by dynamic and interacting variables, including traffic demand, environmental conditions and infrastructure characteristics, which are difficult to replicate across analyses. Moreover, the range of physical configurations that can be tested is often constrained by logistical limitations related to installation procedures, production costs and safety requirements [4].
The use of driving simulators combined with digital design techniques represents a valuable methodological alternative. Simulator-based experiments allow high experimental repeatability while enabling the evaluation of multiple design configurations under controlled conditions and at reduced cost and time. This approach supports the safe and systematic investigation of user–infrastructure interactions and facilitates the assessment of design solutions prior to real-world implementation [7,8].
2. Literature Review
2.1. Traffic Calming Measures and Speed Control Effects
In urban and residential environments, areas typically characterized by a higher concentration of vulnerable road users, traffic calming measures (TCMs) are physical interventions designed to reduce vehicle speed and, consequently, improve road safety.
Numerous studies have demonstrated that the implementation of traffic calming measures [9] is associated with a significant reduction in traffic crashes, including fatal incidents [2,10]. This safety benefit is largely attributed to the speed reductions induced by the presence of these devices [11,12].
However, such effects tend to be localized when using concentrated interventions, such as speed humps [13] or raised pedestrian crossings [14,15], which nonetheless provide critical protection for vulnerable users, particularly pedestrians.
Over time, researchers and practitioners have explored the evolution of traffic calming strategies that respond more flexibly to the operational challenges of urban contexts, such as the circulation of emergency vehicles and public transport, which should ideally remain unaffected by speed-reducing devices [16].
Among the solutions tailored for selective interaction with target vehicle classes, Berliner cushions (or speed cushions) have emerged as a particularly effective measure for reducing vehicle speeds [17,18]. Due to their specific geometry, Berliner cushions can be strategically implemented to avoid interference with vehicles operating in dedicated lanes, such as buses or ambulances, an advantage not shared by full-width interventions like speed humps or raised crossings. This selective effect makes them especially suitable for deployment in urban settings where preserving traffic fluidity for certain user groups is critical, as highlighted in several studies [13,19].
A study conducted in Lithuania [2] reported substantial reductions in crashes, injuries and fatalities following the implementation of vertical traffic calming measures.
Among such measures, speed cushions have gained increasing attention as a viable solution in urban areas characterized by a high density of vulnerable road users. These devices are specifically engineered to reconcile two often conflicting objectives: on the one hand, to reduce vehicle speeds [16,17], and on the other, to maintain unimpeded access for emergency and service vehicles. This is made possible by their geometry and dimensional properties, which allow such vehicles to bypass the cushions when installed outside of designated emergency or priority lanes.
Similarly, a comparative investigation of traffic calming devices [9], installed in different but comparable urban areas, highlighted their effectiveness in reducing vehicle speeds. In particular, speed humps and speed cushions were shown to be highly efficient: in zones with a speed limit of 25 mph, they yielded an average operating speed of approximately 10 mph, confirming the capacity of both devices to achieve substantial speed reductions. Moreover, speed cushions influenced driver’s trajectory choices, with many drivers either centering their path over the device or traversing it with a single lateral pair of wheels. However, significant differences emerged in lane-keeping behaviour: certain configurations, especially when cushions were placed centrally between two lanes, prompted drivers to cross into the opposing lane in order to align their trajectory with the cushion’s centerline. This finding suggests the need for carefully planned placement strategies and for systematically evaluating driver behaviour in relation to different device configurations, to ensure that safety benefits are not offset by unintended manoeuvres.
Another case study conducted in Bari [17] investigated the performance of speed cushions at three installation sites, each with a different length (3.2 m, 2.7 m and 2.2 m), while maintaining a constant width of 1.7 m. The results indicated reductions in vehicle speeds ranging from 35% to 45%, corresponding to decreases of approximately 6 to 10 km/h depending on cushion length. These findings suggest that longer cushions are associated with smaller speed reductions.
2.2. Driving Simulators as a Tool for Evaluating Traffic Calming Measures
Driving simulators have been increasingly recognized in the literature as effective tools for evaluating infrastructural interventions, particularly in an urban environment where replicating hazardous or complex traffic scenarios in real life would pose safety risks. Their ability to reproduce critical situations in a safe, controlled, and fully repeatable environment offers a solid experimental foundation for testing traffic calming devices in urban and residential settings.
Notably, while absolute differences in driving speed between real and simulated environments have been observed, recent studies confirm that relative behavioural patterns remain consistent across both contexts. This consistency supports the relative validity of driving simulators in replicating driver responses to traffic calming interventions [20].
Furthermore, validation research has shown that the reliability of simulator-based experimental studies does not depend solely on the visual or physical fidelity of the virtual environment [21]. Simulator-based studies can provide robust and interpretable results when the simulator is well suited to the driving behaviours and performance measures under investigation. In particular, previous studies have shown that behavioural validity is not determined by physical fidelity alone, and that relative validity is often adequate when the aim is to compare experimental conditions rather than to reproduce exact on-road values [21,22].
In this regard, another recent study [23] demonstrated that driving simulators can effectively reproduce drivers’ physiological responses under cognitively demanding conditions. This supports the functional validity of simulators in replicating driver behaviour in high load scenarios, such as those involving the experimental evaluation of traffic calming measures.
Recent evidence confirms the growing centrality of driving simulators in road safety research. A comprehensive bibliometric and narrative review [24] analyzed simulator-based studies and highlighted their expanding role in examining driver behaviour across domains including traffic calming and infrastructure design. The review emphasizes that simulators provide controlled, safe and repeatable experimental environments. It also highlights the ongoing debate on simulator validity, suggesting that validity should be considered in relation to the specific behavioural constructs under investigation rather than solely in terms of physical fidelity. The present study adopts a control-oriented behavioural approach, focusing on relative changes in driver command allocation (brake, throttle and steering) and transient perturbation indicators, consistent with contemporary simulator validation frameworks.
2.3. Gaps in the Literature on Speed Cushions
To the best of the authors’ knowledge, the effectiveness of traffic calming devices depends not only on their presence but also on their design characteristics and integration within the urban context [25,26].
Available studies indicate that speed cushions are effective in reducing average speeds and crash rates [16,17,18,27]. However, existing literature suggests that harmonized technical standards are still limited, particularly with regard to geometric and visual characteristics such as width and surface colour [28].
In several countries (including the United States, France, the United Kingdom and Switzerland) speed cushions are included in road design guidelines, where minimum and maximum values for height or length are often specified. However, width and surface patterning are typically defined with greater flexibility, allowing for substantial variability in implementation. While several studies report standardized or nearly fixed widths (e.g., 1.70–2.10 m), the role of width as an independent design variable remains largely underexplored. In contrast, Italy currently lacks official standards for the application of speed cushions in ordinary road infrastructure, limiting their use to experimental installations under ministerial authorization [29,30,31,32,33,34,35,36].
In addition, most previous investigations have primarily focused on speed-related outcomes, but, from a vehicle-oriented perspective, analyzing drivers’ direct control responses to traffic calming devices may offer complementary information to traditional speed-based assessments. In particular, the statistical characterization of braking, throttle and steering inputs can contribute to a deeper understanding of human–vehicle interaction in constrained urban environments, potentially informing future approaches to the integration of traffic calming strategies within vehicle system development.
This study explicitly focuses on control adaptation and driver command allocation and interprets results as relative behavioural trends within a controlled simulator environment.
3. Methodology
3.1. Experimental Design
This study was designed to quantify drivers’ control responses to speed cushions under controlled and repeatable conditions. The experimental workflow consisted of two stages: a simulator-based driving campaign and post-processing and statistical analysis of vehicle telemetry.
We used a static driving simulator to minimize on-road safety risks and hold geometry, lighting and device placement constant across drivers. It was also done to enable a systematic evaluation of multiple device configurations within limited time and cost constraints. A comparable field campaign would have required manufacturing or procuring multiple cushion variants (e.g., different widths and colours), obtaining installation permits and conducting repeated measurements under variable and difficult-to-control traffic and lighting conditions. In contrast, the simulator environment allowed the same roadway geometry and driving task to be reproduced identically across participants and scenarios, while recording high-resolution vehicle telemetry (e.g., pedal and steering inputs) for subsequent analysis.
Although the simulator does not reproduce full vehicle dynamics, vertical acceleration profiles or whole-body motion cues associated with real cushion traversal, the analysis targets relative behavioural validity, namely consistent differences in control allocation across conditions. This interpretation is consistent with previous simulator validation research, which distinguishes absolute validity from relative validity and indicates that simulators may reproduce behavioural patterns across experimental conditions even when absolute numerical correspondence with on-road driving is not achieved [20]. More broadly, systematic evidence shows that simulator validity is measure- and task-dependent, and that the relationship between simulator fidelity and behavioural validity is not straightforward [21]. Therefore, the present simulator was used as a comparative tool to assess within-subject differences in control allocation rather than to estimate absolute on-road values of braking, throttle or steering responses. The setup includes active steering force feedback and adjustable pedal resistance, providing moderated haptic cues during manoeuvres. While these cues cannot replicate real suspension dynamics or full-body vibration, they enhance control realism beyond a purely visual simulation. Accordingly, the results should be interpreted as controlled comparative evidence on driver control adaptation.
A within-subject design was implemented. Each participant drove the same corridor under three scenarios: a baseline scenario called “No TCM” (corridor without traffic calming devices), Daytime (corridor with speed cushions under daytime visibility), and Nighttime (corridor with speed cushions under nighttime visibility).
Within the Daytime and Nighttime scenarios, six speed cushion configurations were tested by combining colour (blue and red) and width (1.5 m, 1.8 m and 2.1 m).
This structure enables a scenario-level comparison against baseline and a direct comparison among devices.
3.2. Simulation Environment and Roadway Model
3.2.1. Driving Simulator
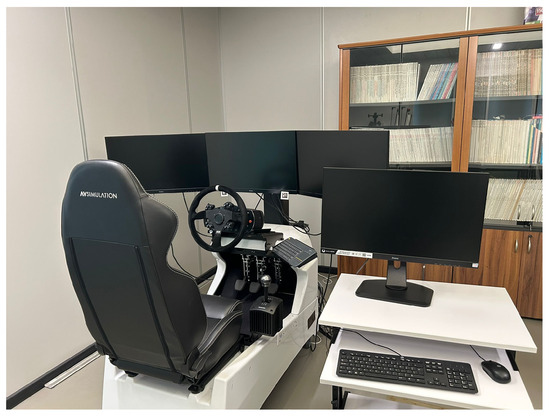
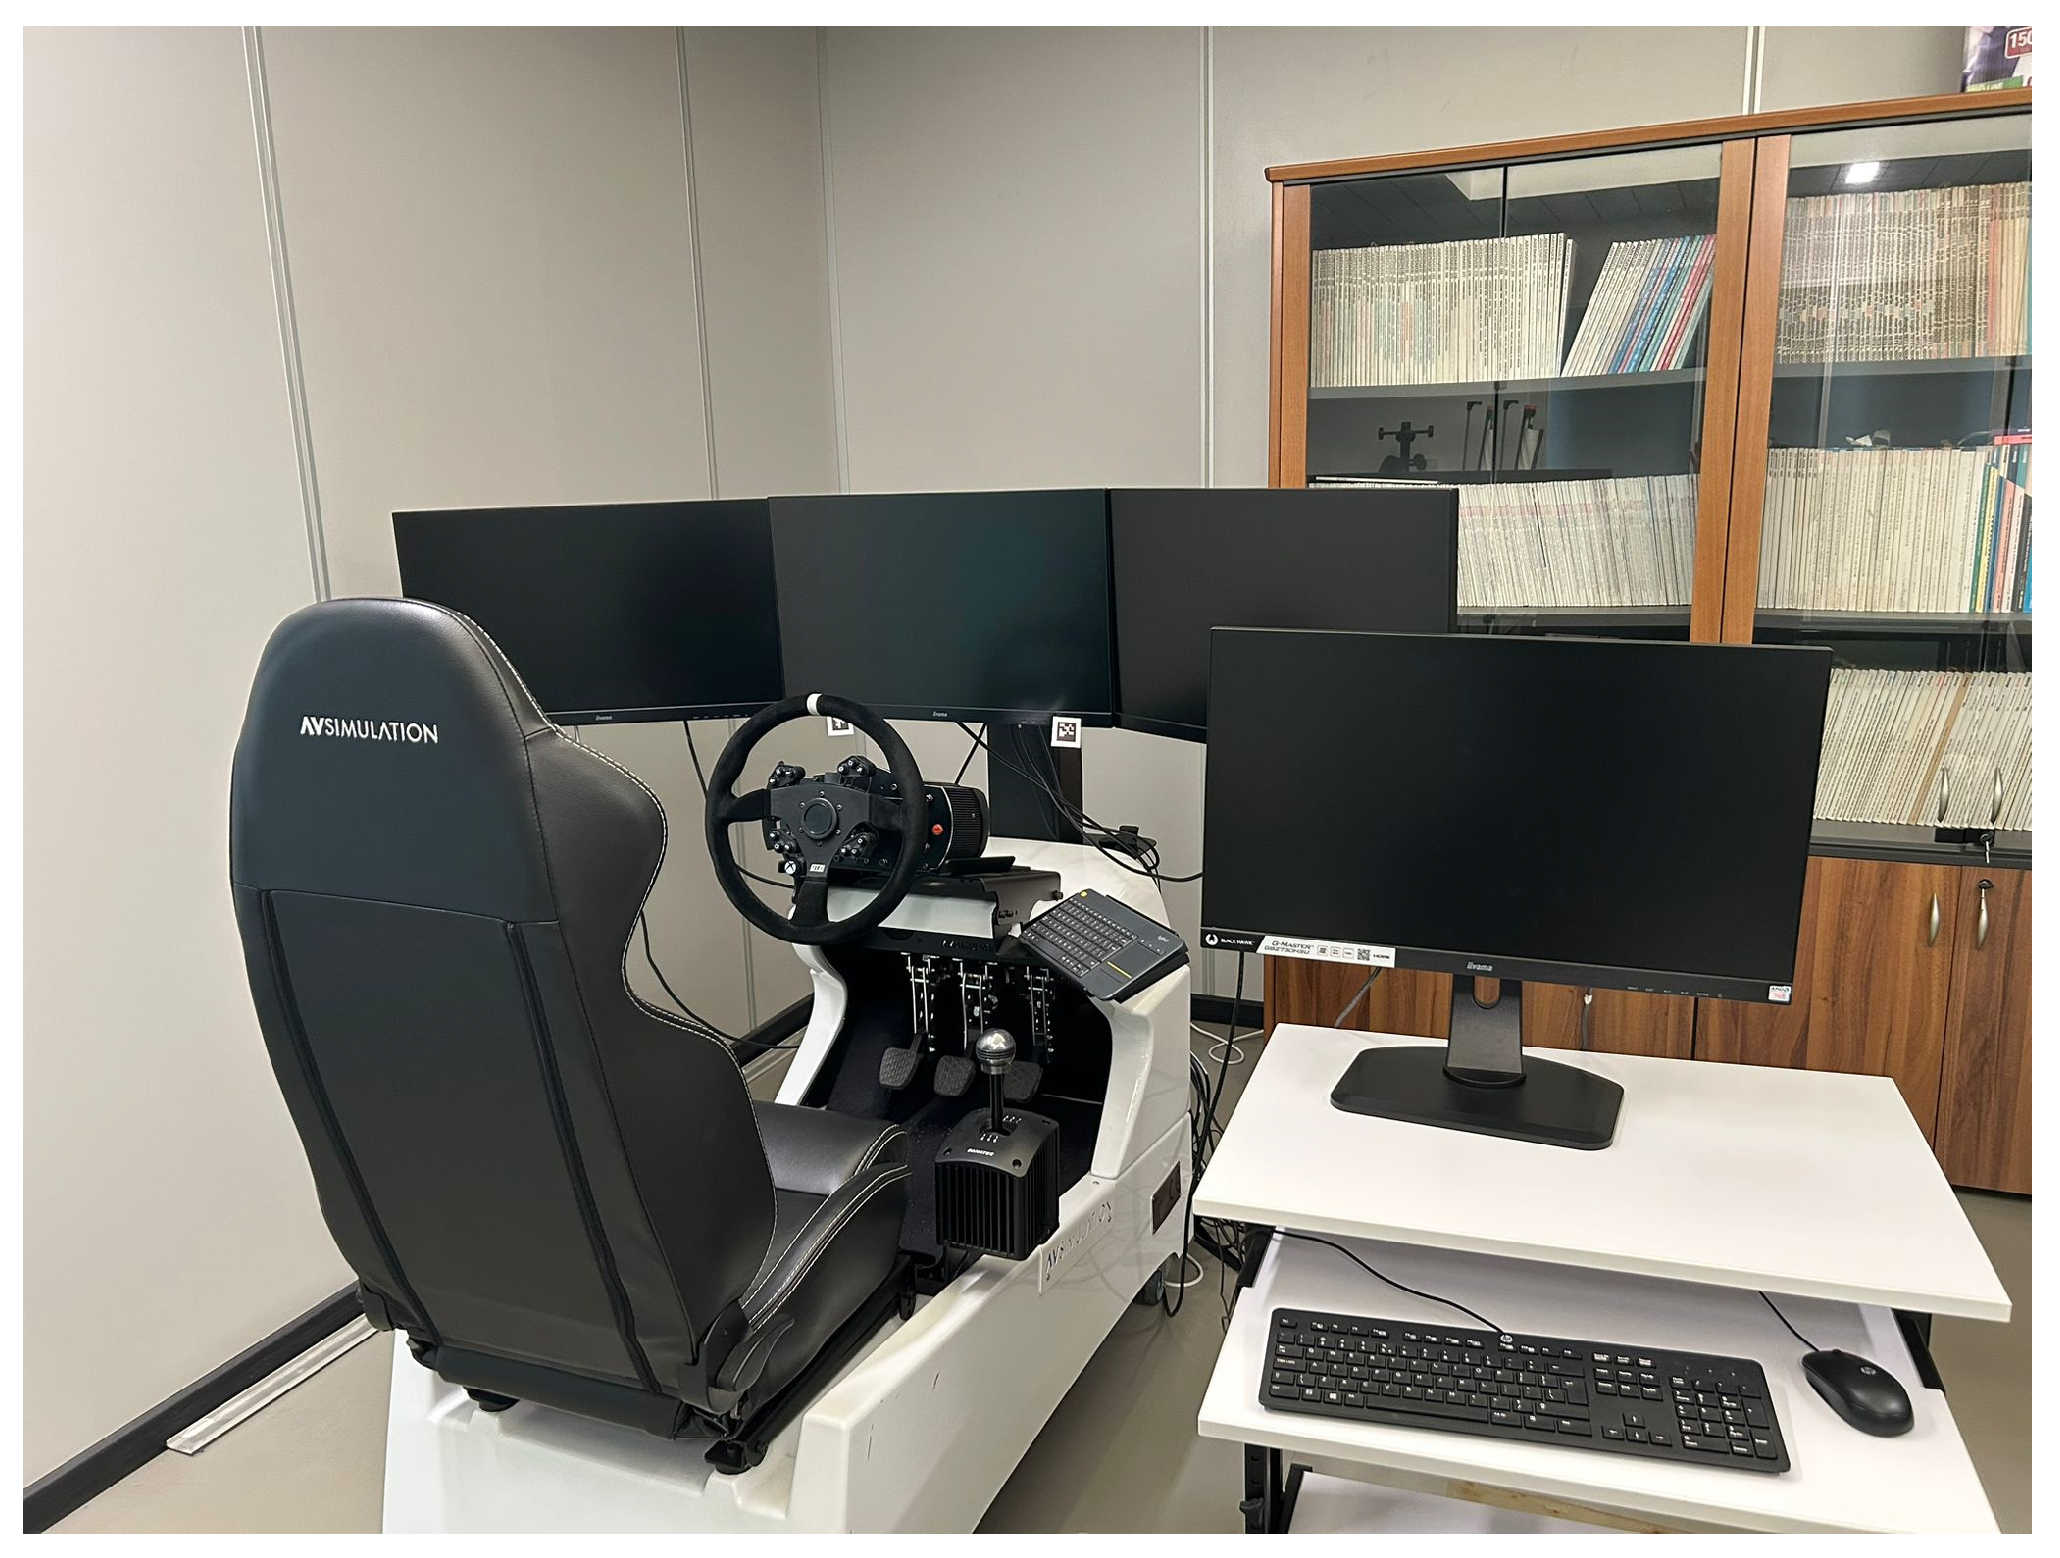
The experiment was conducted at the Digital Laboratory for Road Safety (DiLaRS), University of Messina, using a compact static driving simulator (Figure 1).
Figure 1.
Simulator set-up.
It is a compact, static simulator featuring an ergonomic driver seat, conventional vehicle controls (clutch, brake and throttle pedals with manually adjustable passive force feedback, coupled with a manual gearbox) and a steering wheel equipped with an active force feedback system. The forward visual scenario is rendered across three integrated monitors. The simulation software utilized was Scaner Studio® rel. 2024, a comprehensive suite enabling full control over the driving environment, including vehicle dynamics, road geometry, pavement properties, traffic conditions, and environmental parameters. Furthermore, the software facilitates the recording of telemetry data encompassing variables such as spatial position, velocity, multi-axis acceleration, pedal and steering inputs, steering rotation rate, and the vehicle’s lateral position relative to lane markings or other reference points. All data can be visualized graphically and exported for external analysis. Additionally, the software allows for the programming of specific driving events using the Python rel. 3.10 programming language.
3.2.2. Virtual Road Corridor
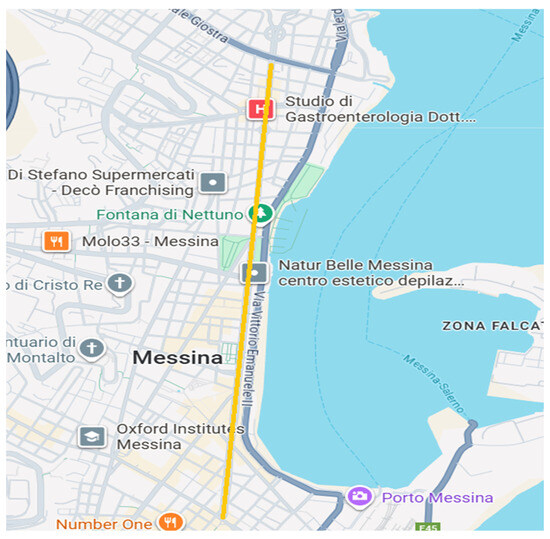
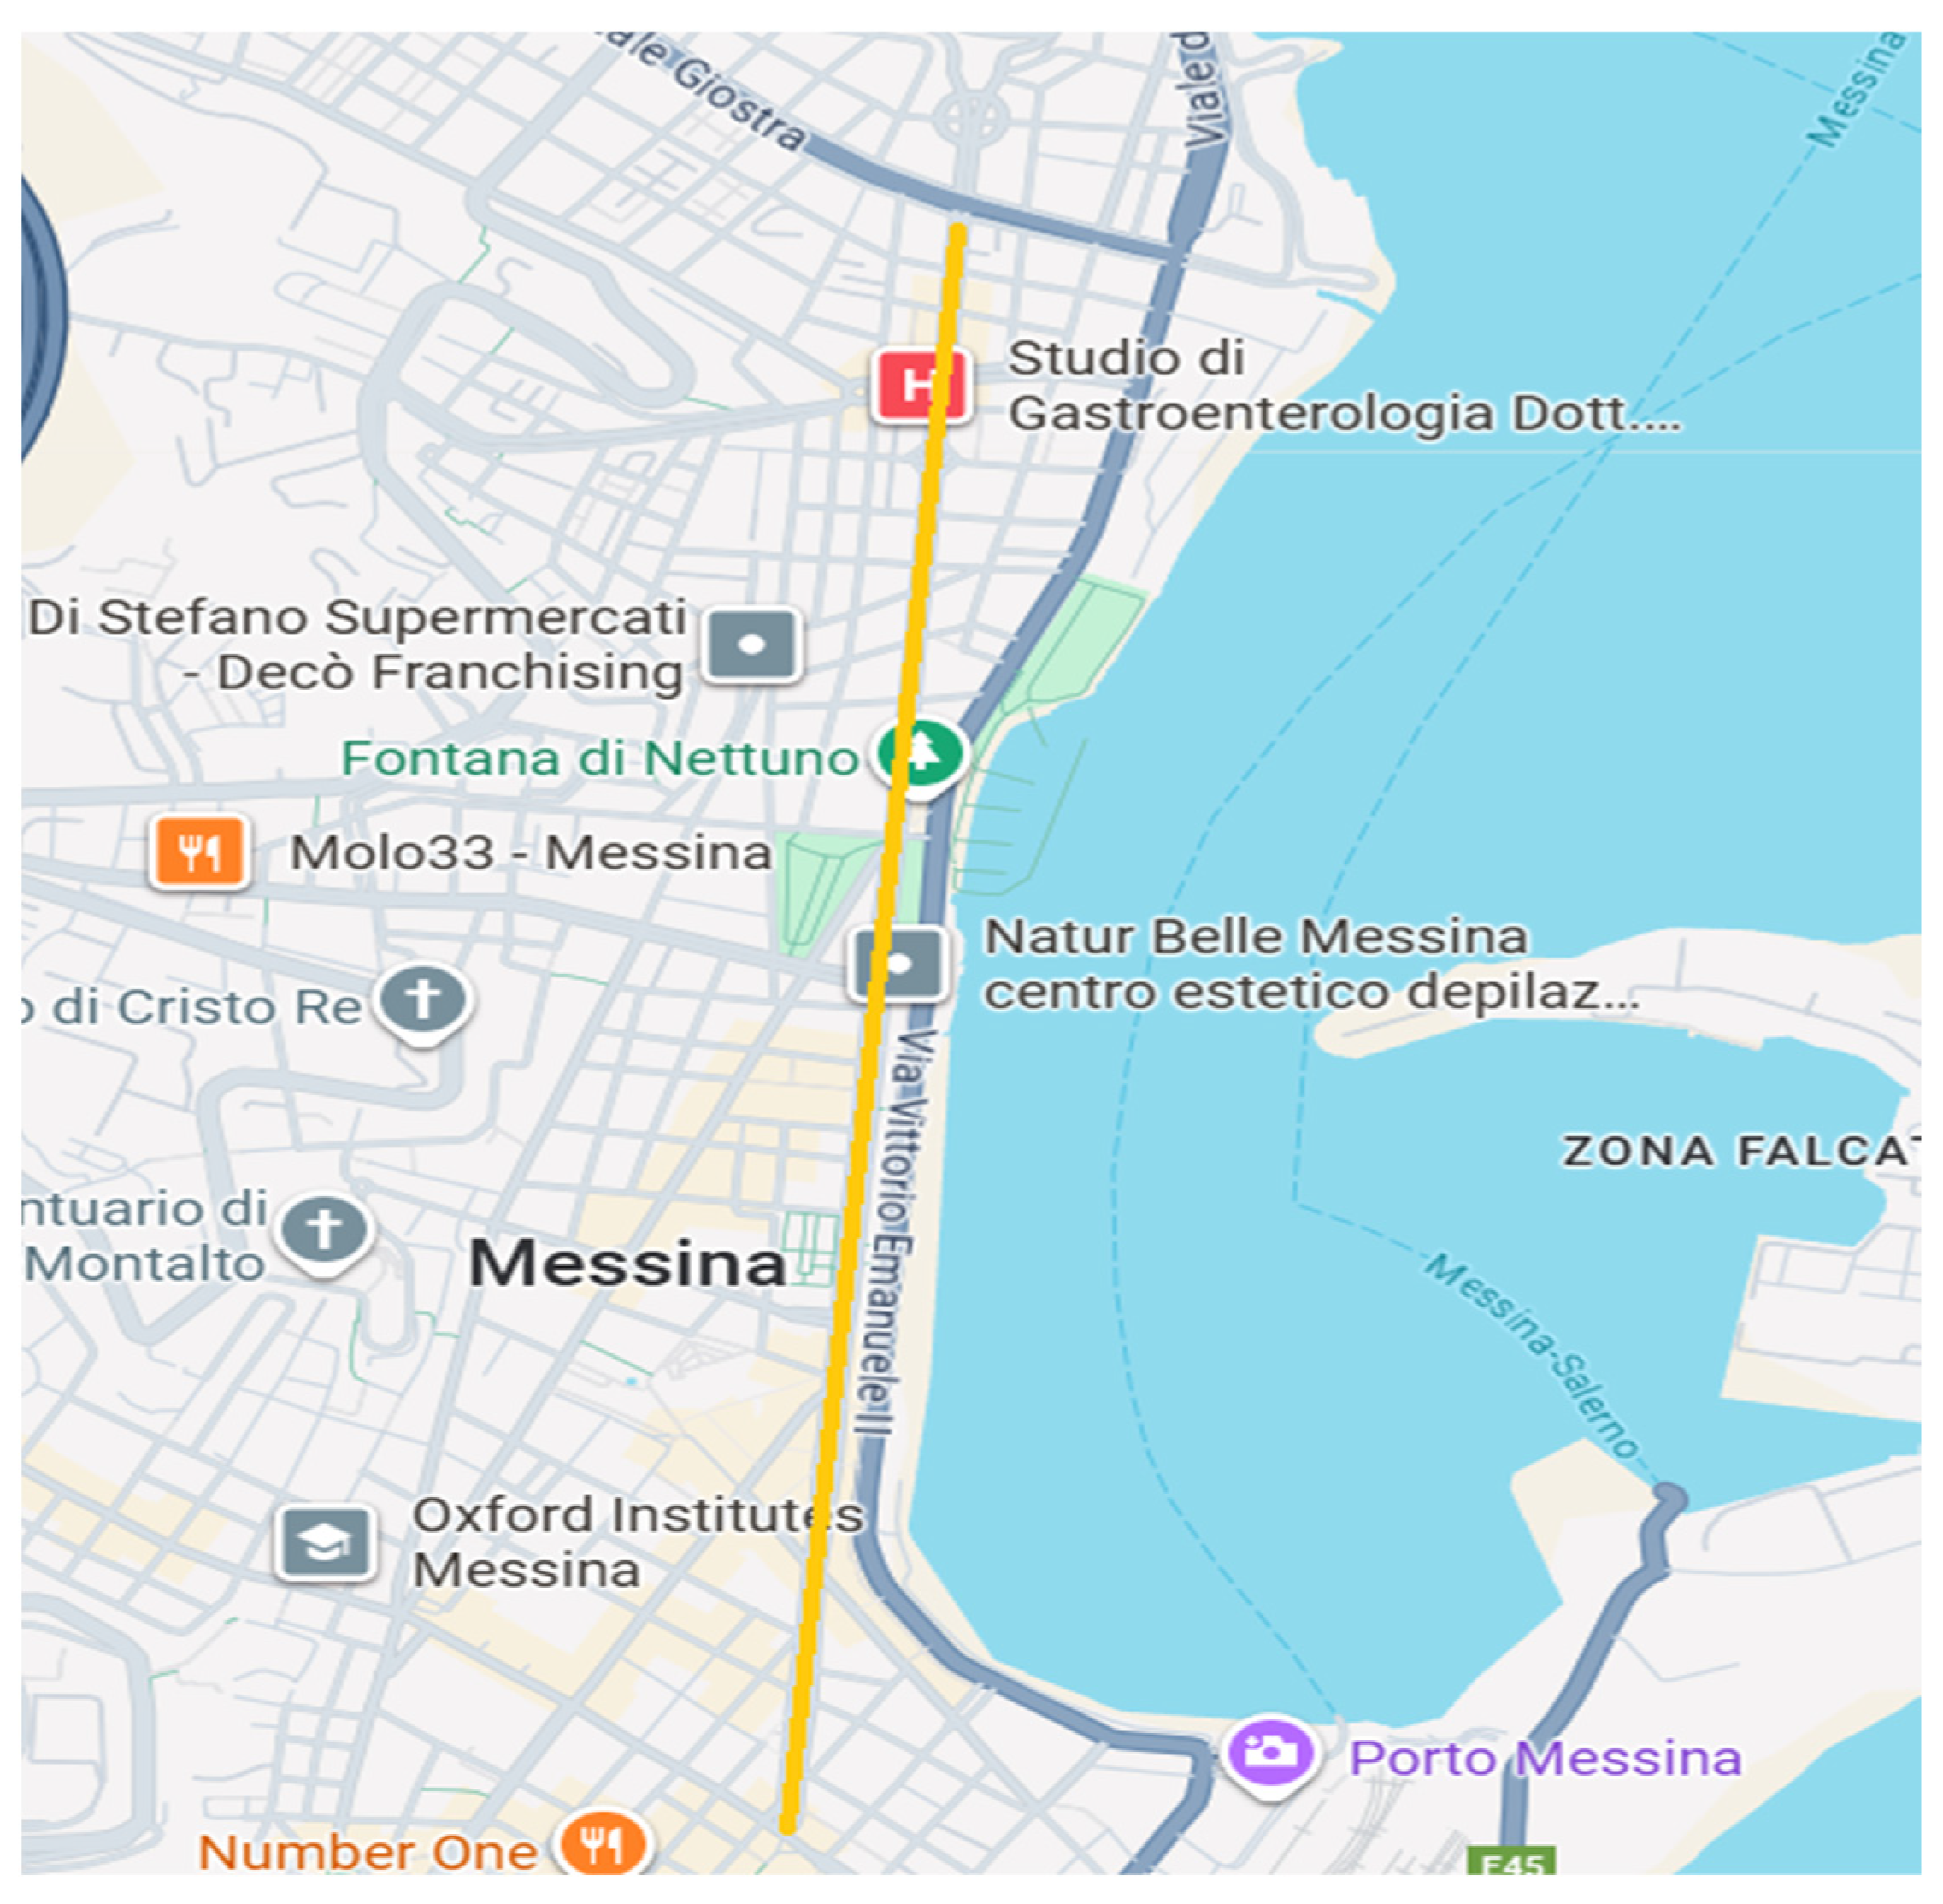
The experimental trial was conducted on a virtual reconstruction of Via Garibaldi in the city of Messina, a roadway notable for recording the highest number of accidents within the urban area (Figure 2).
Figure 2.
Top view of the road artery segment reproduced in the driving simulator, highlighted in yellow and derived from Google Maps® (https://maps.google.com).
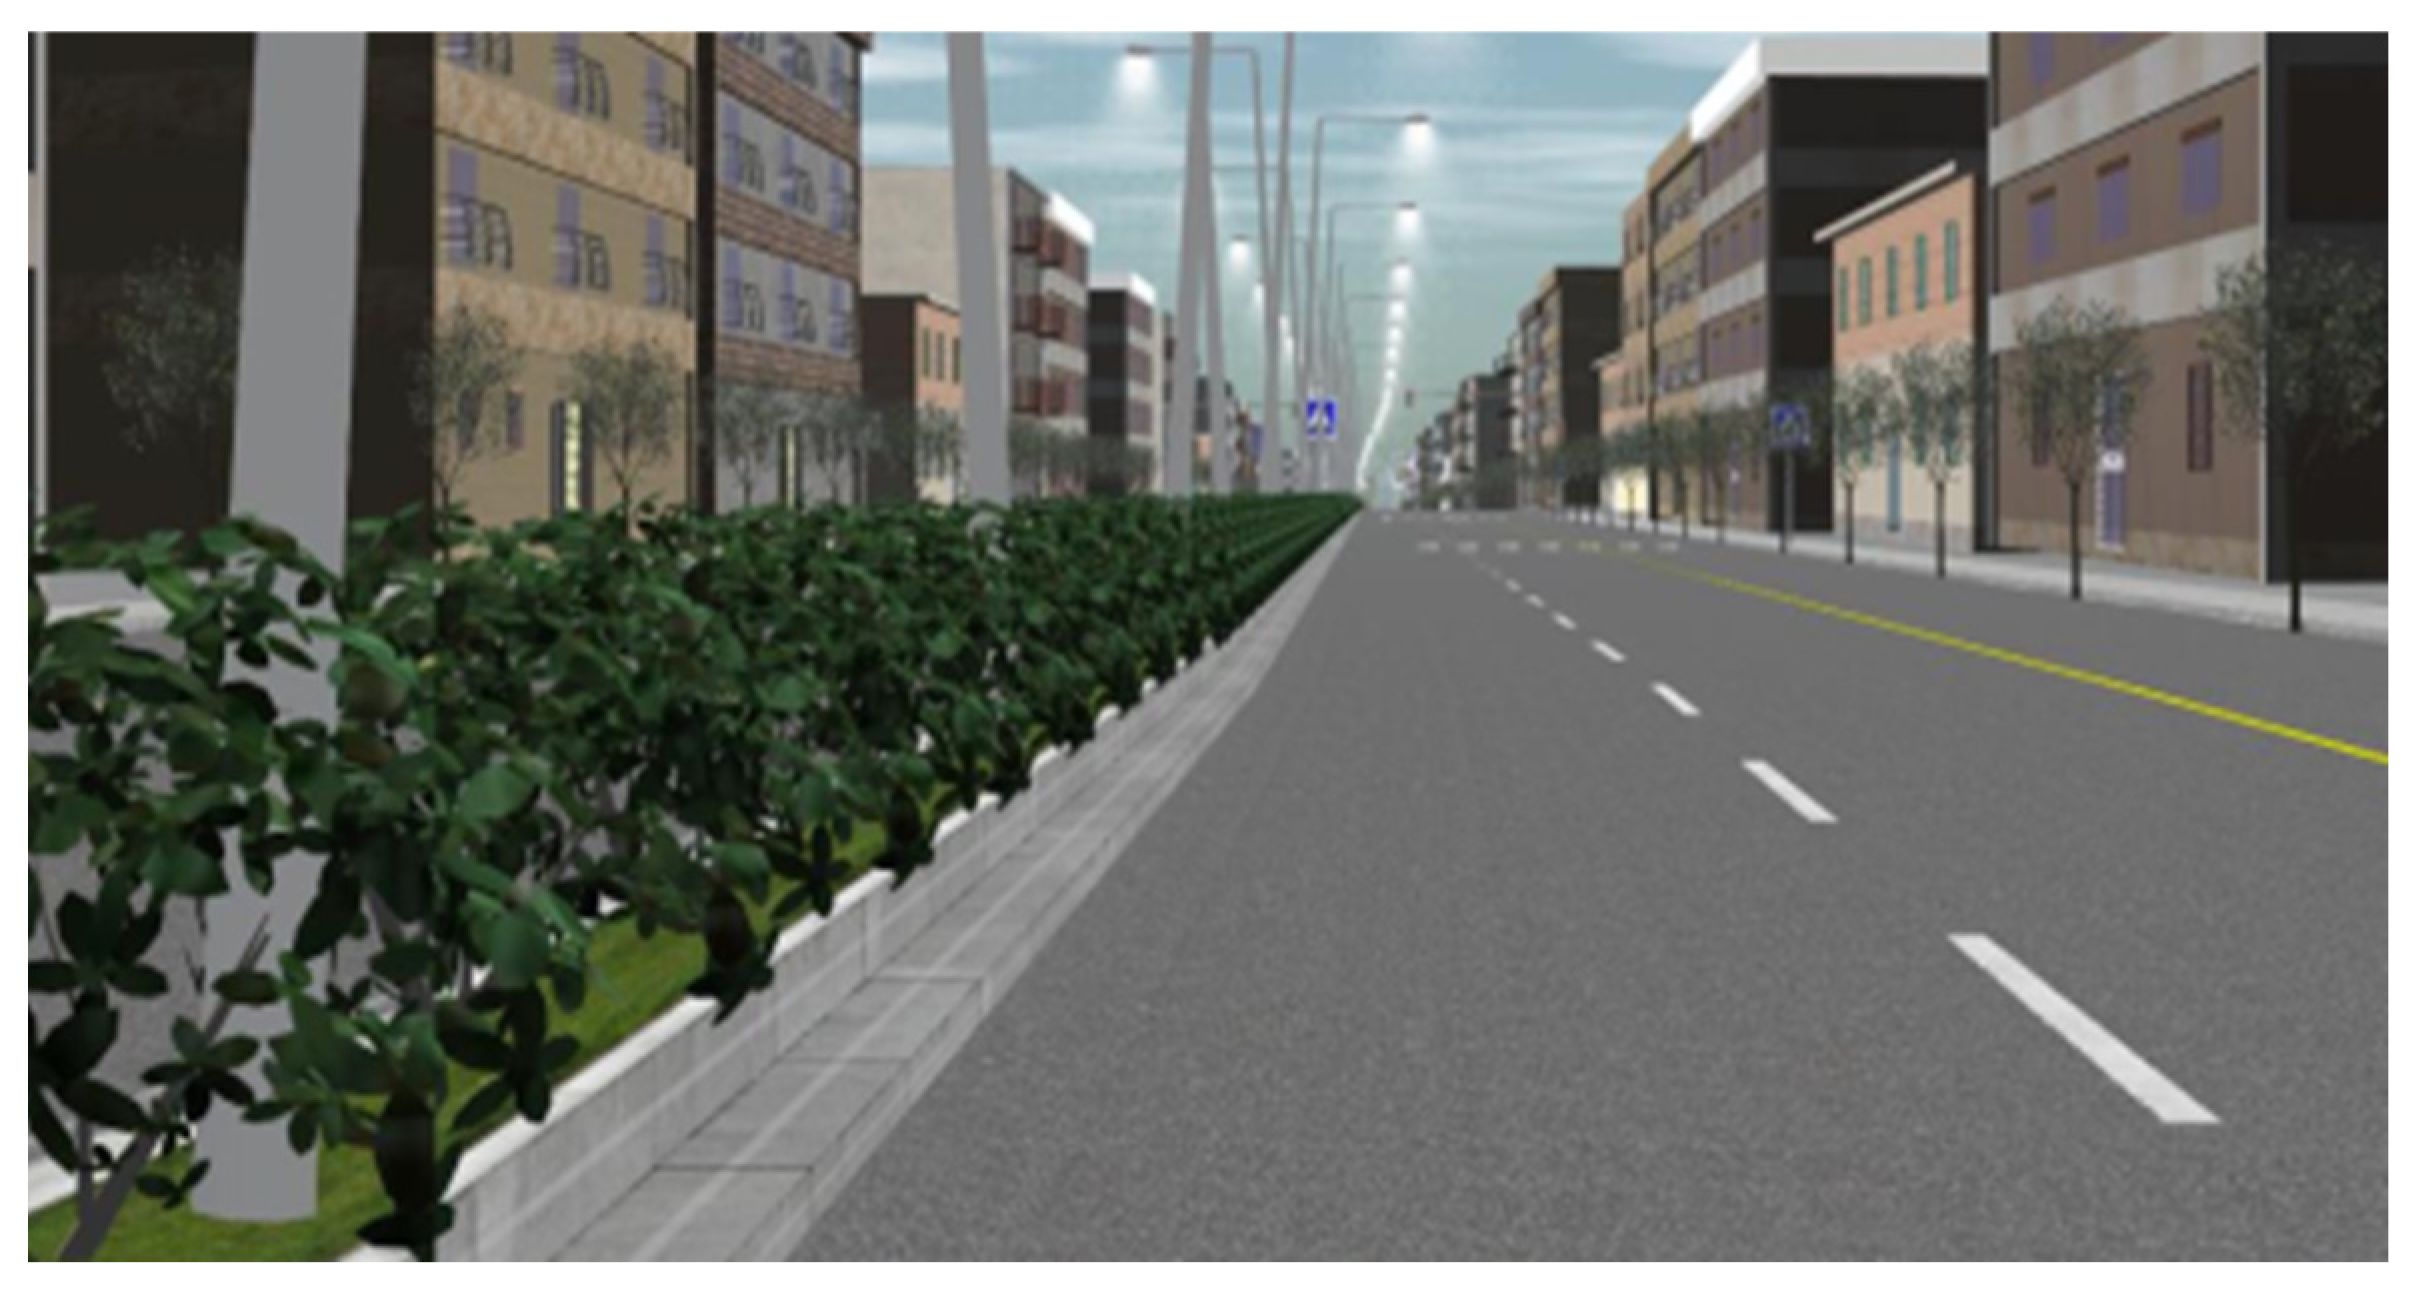
The road environment was modelled using Scaner Studio® software. The reconstructed route spans approximately 2200 m in a straight alignment and features a divided carriageway separated by a planted median. Its cross-section consists of three lanes per direction: the rightmost lane is designated for public transport and emergency use, while the remaining two are general-purpose lanes (Figure 3).
Figure 3.
Simulation view. “Via Giuseppe Garibaldi” road layout, with two standard lanes and one dedicated lane per direction of travel, with a central median.
Via Garibaldi is intersected by several side streets, all of which are signalized intersections.
Speed cushions were distributed along the entire length of the track, ensuring they did not interfere with intersections. They were installed exclusively within the general-purpose lanes, consistent with the intent to avoid restricting emergency/public transport operation.
3.2.3. Device Design and Placement
Speed cushions were defined based on values reported in the literature and on ranges indicated in international guidelines. The geometric parameters adopted for the experimental devices are summarized in Table 1 (reference ranges) and Table 2 (tested configuration).
Table 1.
Regulatory framework for the dimensional design of speed cushions.
Table 2.
Experimental speed cushions’ configuration.
Height was selected to remain consistent with typical guideline ranges, while length was kept constant across the six devices to isolate the effects of width and colour on driver control responses. The three tested widths were selected to span the range of values reported in international guidance and previous applications, while also including a narrower experimental configuration. In particular, 1.8 m was adopted as an intermediate reference value consistent with commonly reported guideline ranges, whereas 2.1 m represents the upper value indicated in Table 1. The 1.5 m configuration was intentionally included as a narrower design alternative to test the behavioural effect of increased lateral clearance and reduced transverse occupation, which is relevant in contexts where speed cushion dimensions are not yet fully standardized. All devices were modelled with consistent visual marking to ensure that colour was the intended perceptual manipulation.
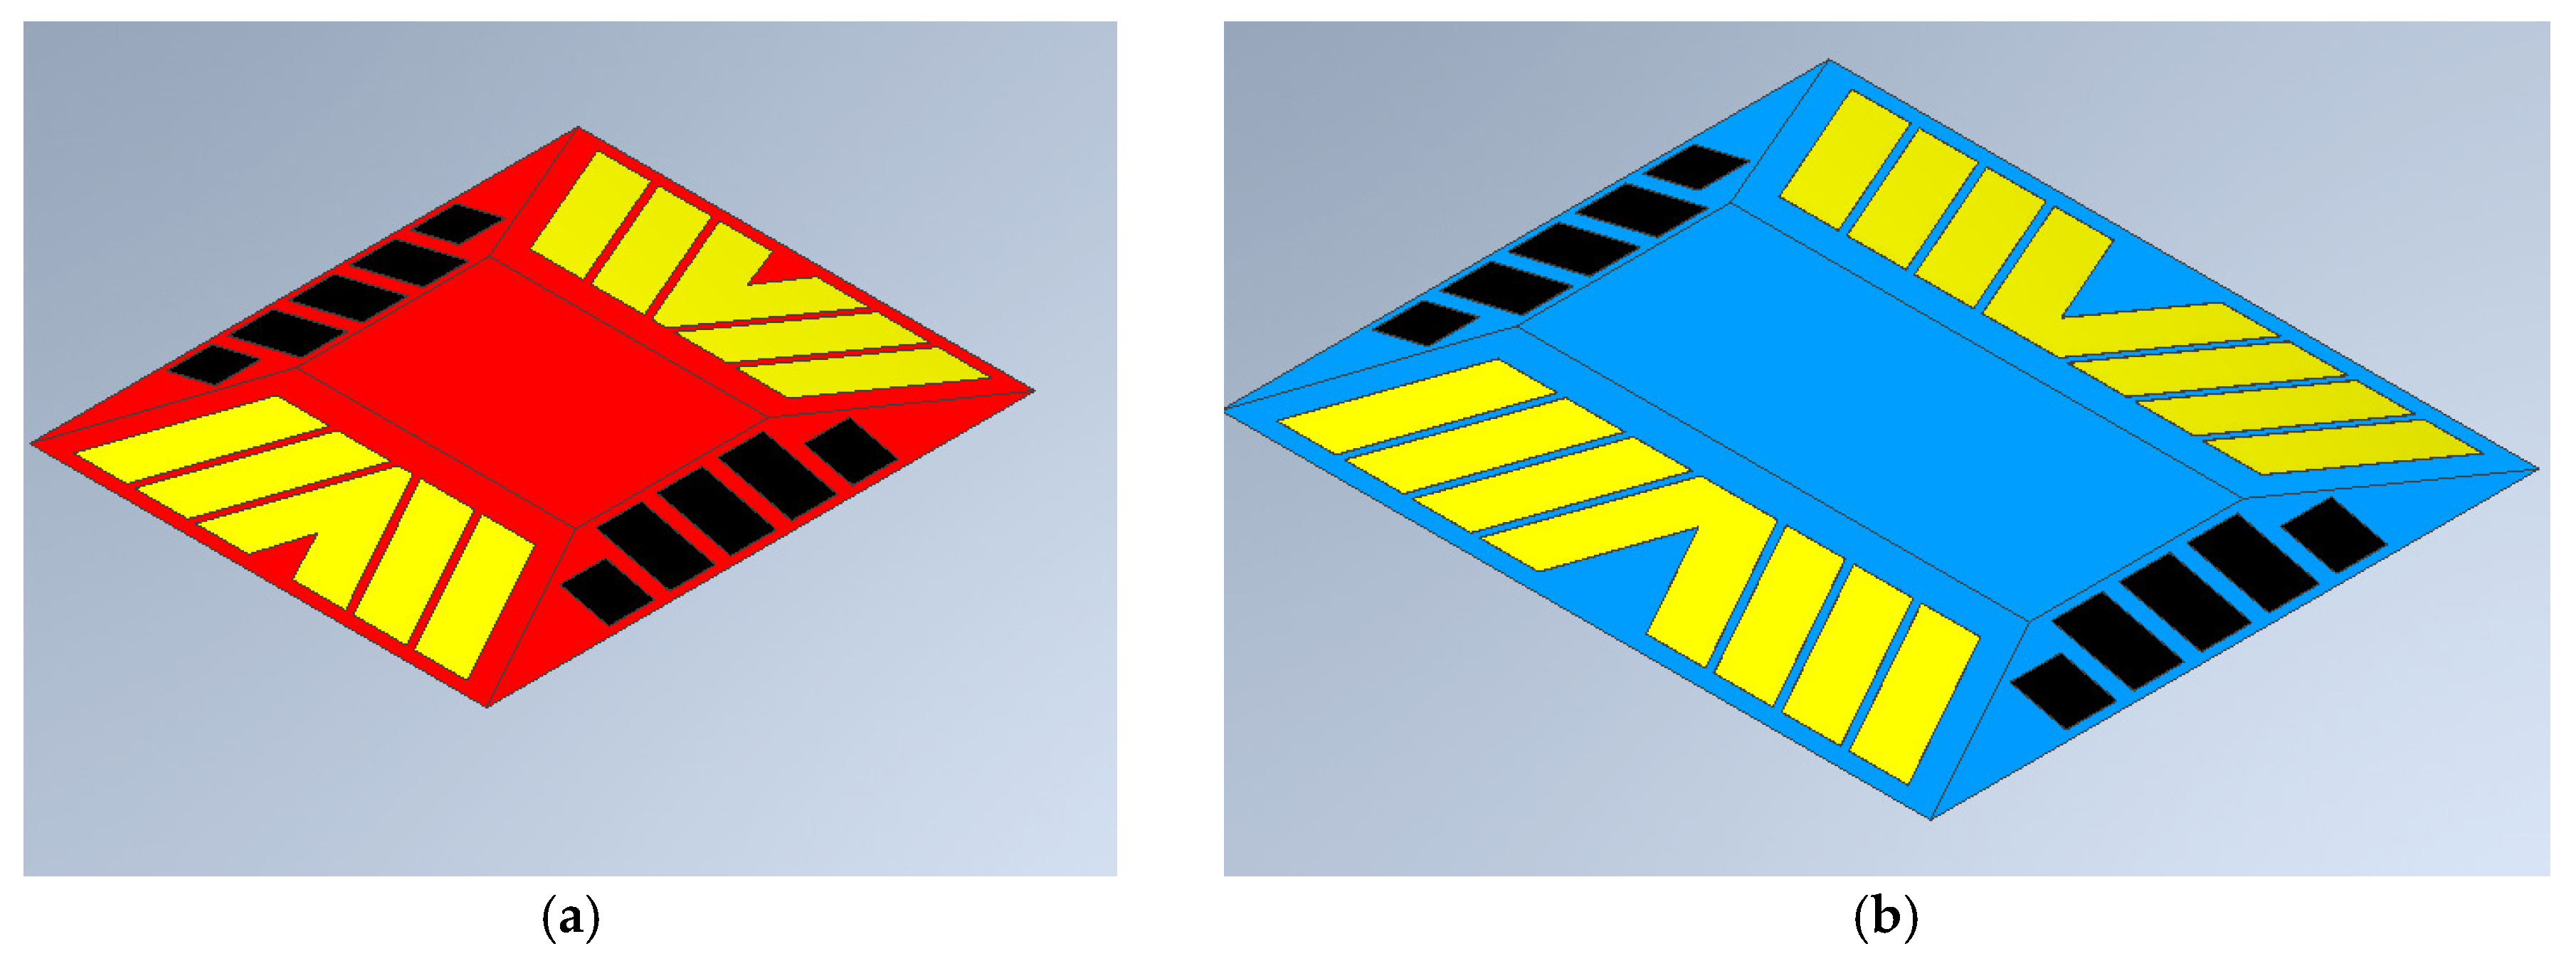
A representation of the cushions is shown in Figure 4.
Figure 4.
Representation of the cushions referred to as R1 (a) and B3 (b), characterized by standard length and height dimensions (1.8 × 0.07 m) and widths of 1.5 m and 2.1 m, respectively; the colouring reflects the structure of commercially available products, both in the primary hue (red or blue) and in the front retroreflective bands.
The distance of each cushion from the simulation start point is detailed in Table 3.
Table 3.
Speed cushions’ distance from origin.
These distances were deliberately selected to avoid inducing any memorization or learning effects among participants [37]. This approach ensures that observed driving behaviour can be attributed solely to the geometric and chromatic characteristics of the immediate speed cushion encountered, rather than being influenced by the previous one.
Background traffic (surrounding vehicles and pedestrians) was intentionally excluded to maximize internal validity and isolate infrastructure effects on control inputs. This choice reduces ecological validity: therefore, results should be interpreted as controlled, infrastructure-centred behavioural adaptation patterns rather than as full traffic-system performance estimates.
3.3. Participants and Experimental Procedure
3.3.1. Participants
Twenty-five licensed drivers participated in the simulator experiment. The participant sample, consisting of 25 licensed drivers (44% females, 56% males) with an age range of 19–41 years, was subject to “pre” and “post” drive questionnaires.
Questionnaire data revealed an average participant age of 29.64 years. All participants held a valid category B driving licence for passenger cars, which was required for the experimental vehicle. Among them, 9 participants also held a motorcycle driving licence and one participant possesses an additional driving licence category. Only one participant had fewer than 20 points on their driving licence; however, the score remained within the 10–19-point range, indicating no severe penalties. To reduce risk and improve data quality, participants reporting prior episodes of simulator sickness were excluded during recruitment. Each participant was assigned an anonymous alphanumeric identifier to ensure privacy and traceability during data processing.
The study was conducted in accordance with the Declaration of Helsinki and received approval from the Ethics Committee of Messina (AOU “G. Martino”, Deliberation No. 786, 16 May 2024). All participants provided written informed consent prior to participation.
3.3.2. Procedure
The participant sample was subject to a stringent protocol summarized as follows:
- Administration of “pre” and “post” drive questionnaires.
- A drive on a training road (the duration of which was subjectively determined based on individual driver proficiency, typically 8–10 min, until participants reported being comfortable).
- Test drives: completion of three experimental scenarios (No TCM, Daytime, Nighttime) on the same corridor.
Day and Night were identical in roadway geometry and device placement, differing only in lighting conditions. Scenario order was counterbalanced across participants (approximately half starting with Daytime and half with Nighttime), with No TCM performed first for all participants.
3.4. Data Collection and Variable Definition
Vehicle telemetry was recorded in Scaner Studio® and exported as “.csv” files for post-processing. Signals were sampled at 10 Hz.
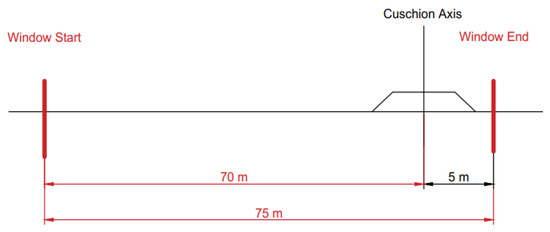
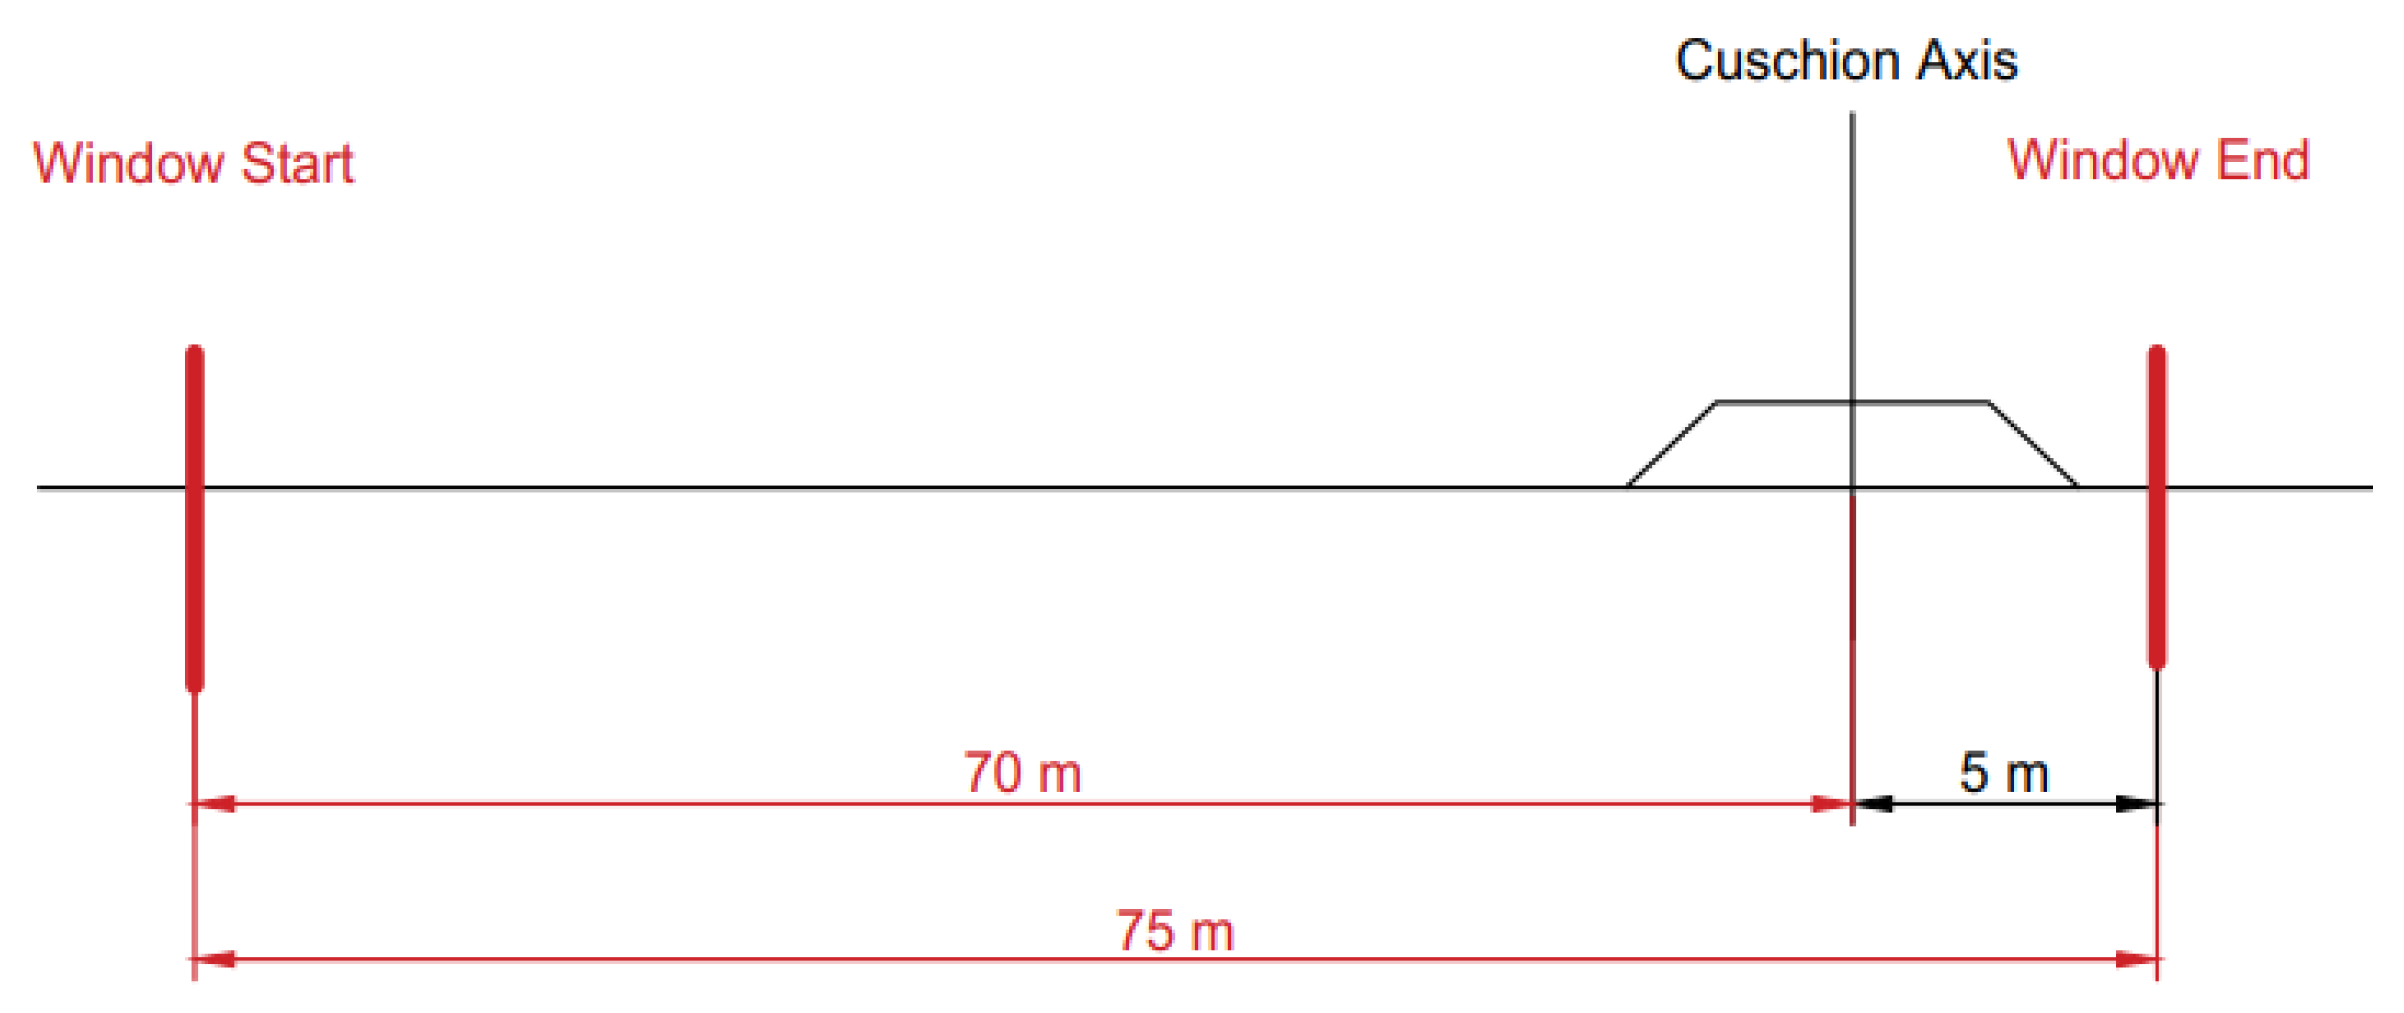
For each cushion, telemetry was extracted over a fixed 75 m travelled-distance window referenced to the cushion axis, extending 70 m upstream and 5 m downstream (Figure 5). The window captures the approach, traversal and immediate recovery phases, ensuring inclusion of manoeuvre completion.
Figure 5.
Schematic definition of the 75 m window.
While traffic calming studies often focus on speed, speed alone does not fully describe driver–vehicle interaction. Therefore, three control-oriented metrics were computed within each 75 m window:
- Mean brake input (MeanBrake): average brake pressure (daN);
- Mean throttle input (MeanThrottle): average normalized throttle pedal signal within the 75 m window (dimensionless, range 0–1);
- Maximum steering angle (MaxSteeringAngle): peak absolute steering wheel angle (degrees).
These variables represent direct driver commands and capture longitudinal and lateral control adaptations induced by the device. All three variables are directly obtained from simulator telemetry and therefore describe driver command signals rather than physical vehicle outputs.
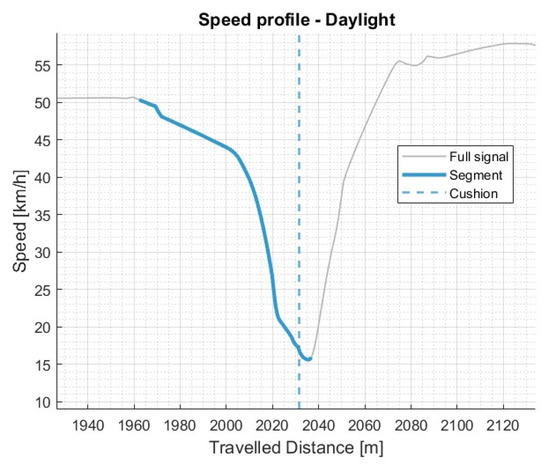
The 75 m window was selected as an operational analysis window after preliminary inspection of the telemetry profiles. The 70 m upstream portion was intended to include the anticipatory phase of driver response, including throttle release, braking onset and steering adjustment before reaching the cushion. The 5 m downstream portion was included to capture the physical crossing and immediate recovery phase, while avoiding the longer post-device acceleration phase, which may be influenced by factors unrelated to the direct interaction with the cushion. Using a travelled-distance window rather than a time window ensured that the same roadway portion was analyzed for all drivers, devices and scenarios. As illustrated in Figure 6, the selected window captures the main speed-control response associated with the cushion approach and traversal in the experimental data.
Figure 6.
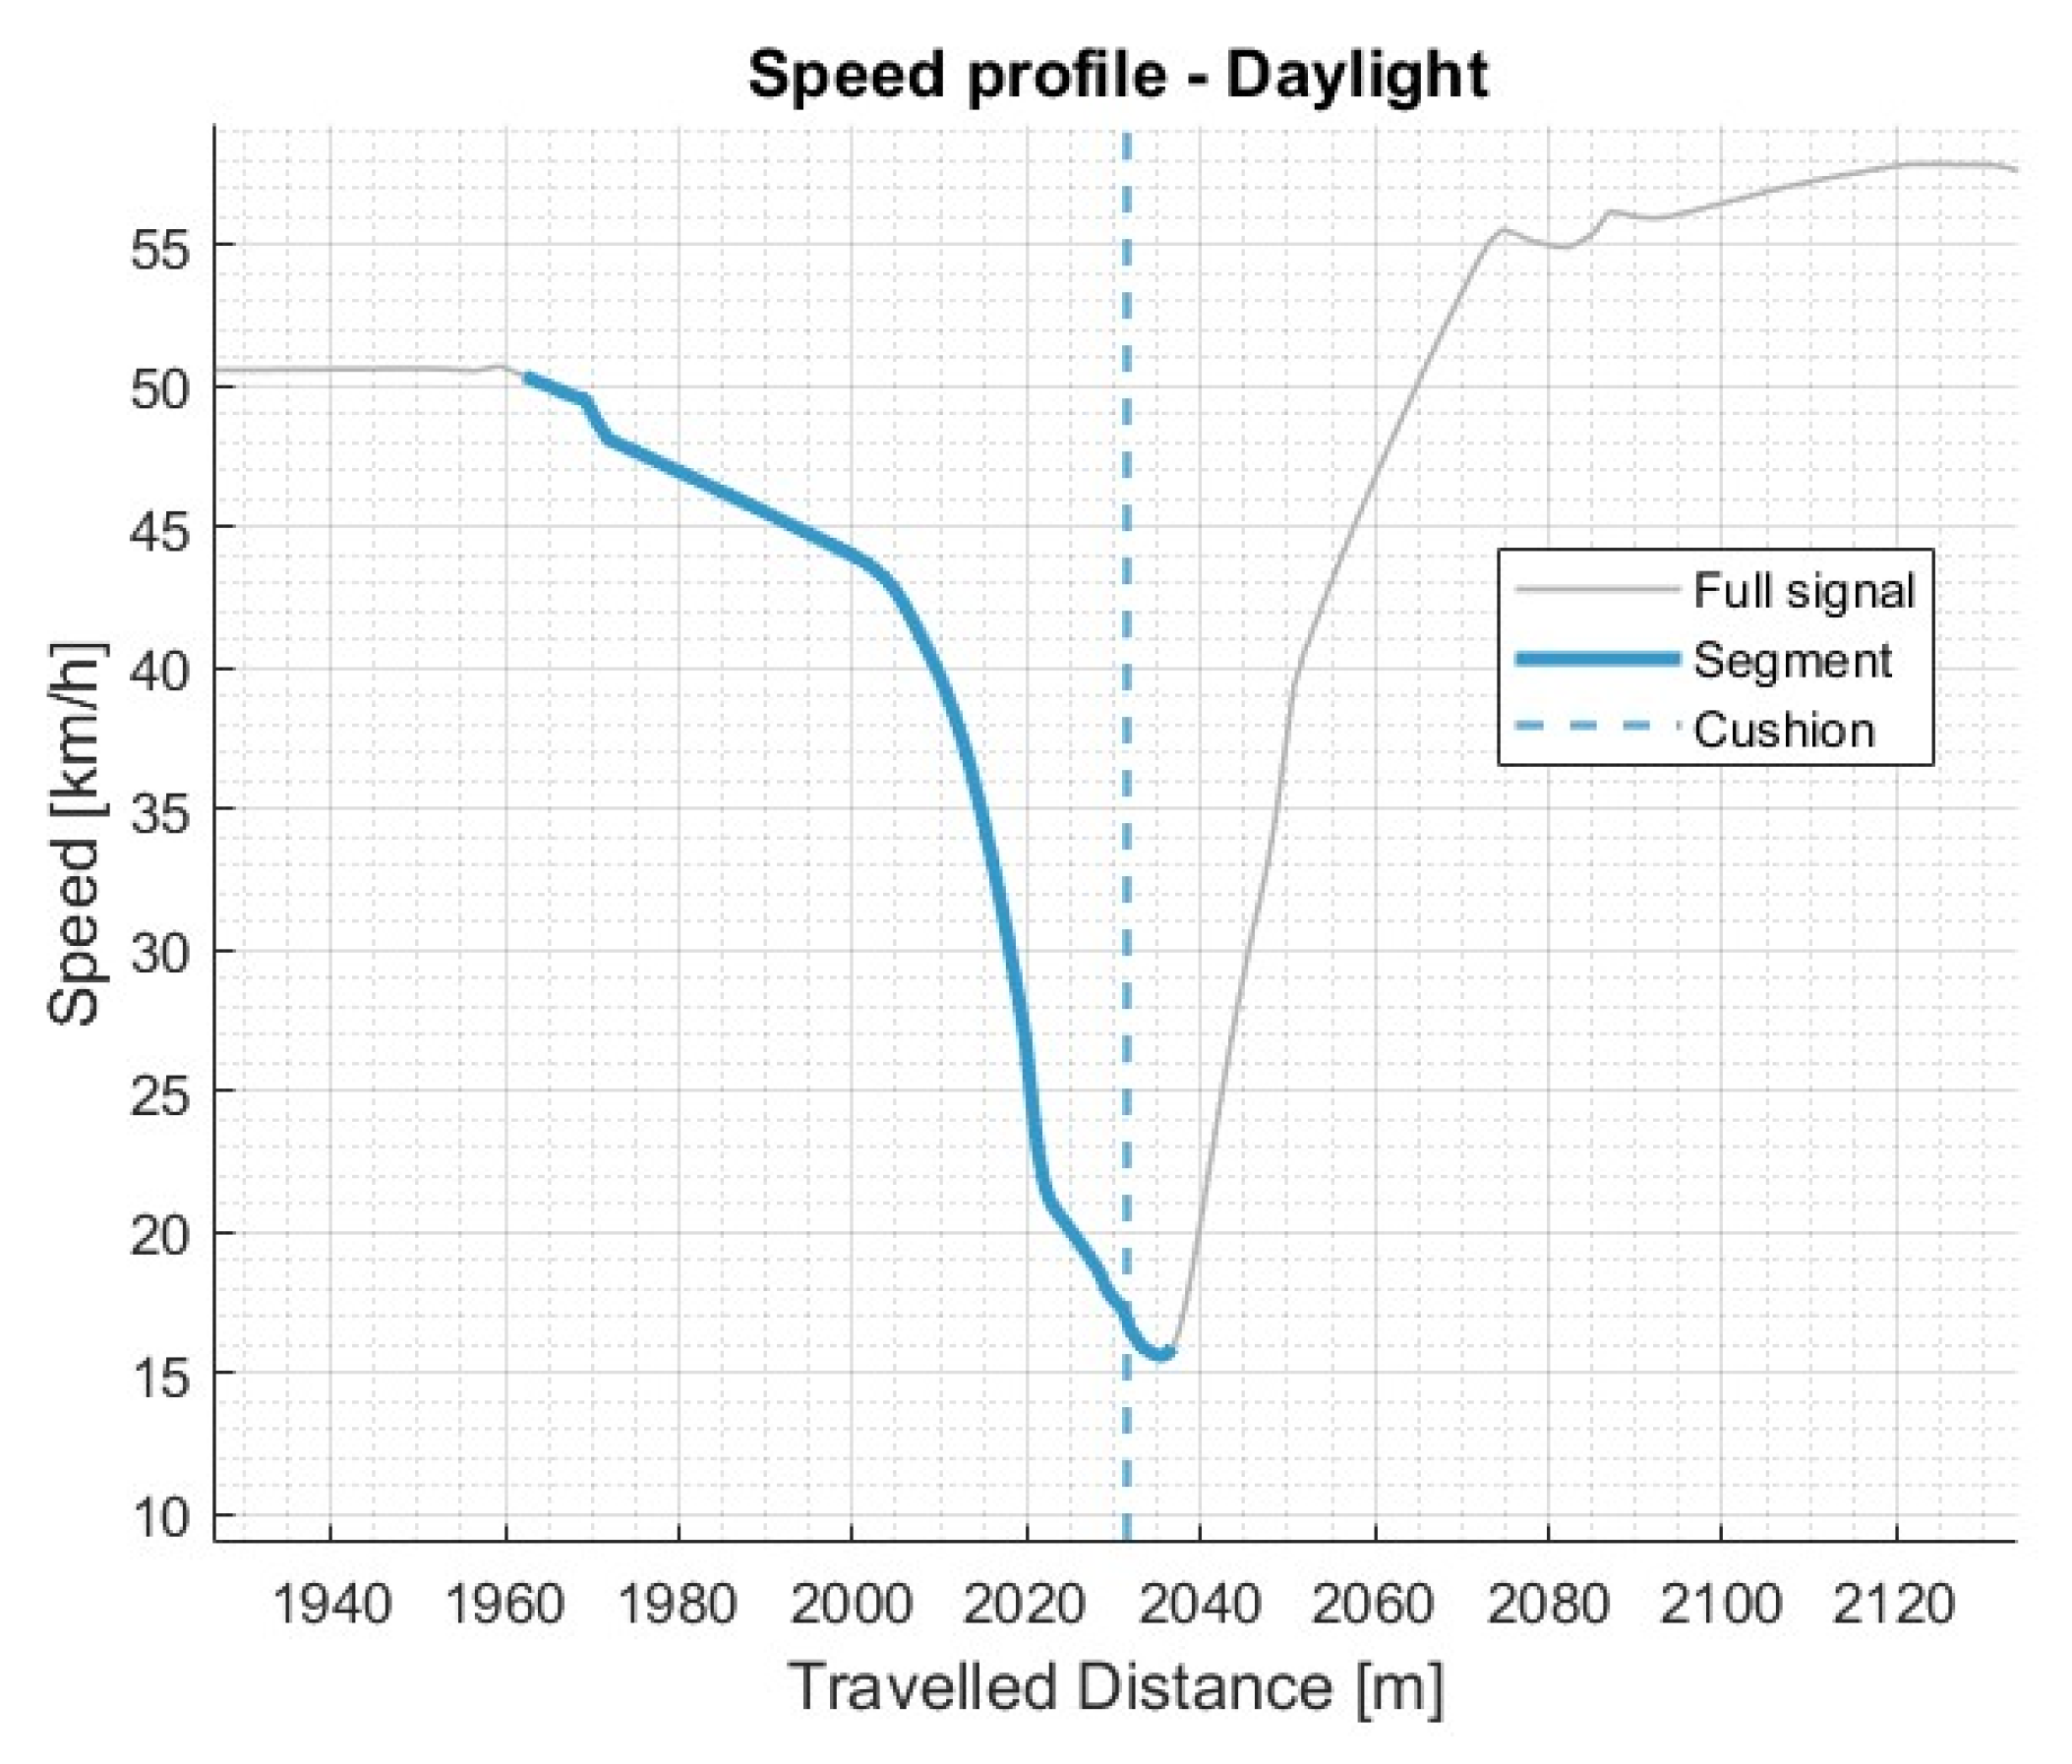
Speed profile of participant AC000000 under daytime driving conditions. The acquisition window previously defined is highlighted in light blue, while the vertical dashed lines indicate the exact position of the speed cushions. In the example shown, the R3 cushion is considered.
In addition to these primary control metrics, complementary transient and stability indicators were computed on fixed travelled-distance windows to represent response dynamics and evaluate temporal patterns. The complementary indicators included
- Mean speed value (Speed_mean).
- Root Mean Square of Steering angle (Steer_rms).
- Root Mean Square of longitudinal jerk (Jerk_rms), that is, the time derivative of acceleration computed within the acquisition window, representing the intensity of transient longitudinal perturbations during approach and traversal.
- Standard deviation of lateral offset from the lane centre (LaneGap_std), computed over the window, representing lateral stability and trajectory dispersion during device interaction.
These indicators were used for descriptive reporting and paired robustness checks and did not replace the RM-ANOVA inferential framework.
In this study, the term “control-oriented metrics” refers to telemetry-derived driver command variables, namely brake, throttle and steering inputs, used to characterize driver control adaptation. The expression “driver command allocation” refers to the redistribution of control effort across these inputs in response to the presence of speed cushions. The complementary indicators (Speed_mean, Steer_rms, Jerk_rms and LaneGap_std) are derived window-based descriptors used for descriptive reporting and robustness checks, and do not replace the primary RM-ANOVA inferential framework.
An example of the speed profile over a portion of a driving session is therefore reported in Figure 6, with a particular emphasis on the effective acquisition window (highlighted in blue).
3.5. Statistical Analysis
Two repeated-measures ANOVA (RM-ANOVA) models were applied to the telemetry-derived metrics.
A first RM-ANOVA tested the within-subject factor scenario (No TCM vs. Day vs. Night). This model quantified the overall effect of introducing speed cushions relative to baseline and assessed whether lighting conditions modulated driver control responses.
A second RM-ANOVA excluded the baseline condition and tested the within-subject factors: colour (red vs. blue), width (1.5 m vs. 1.8 m vs. 2.1 m) and scenario (Day vs. Night). This model compares cushion configuration directly and evaluates potential interaction effects (e.g., whether colour effects depend on lighting).
Analyses were performed in MATLAB rel. 2025 using filtrm and ranova. Repeated-measures ANOVA assumptions were verified. For RM-ANOVA, p-values are reported as provided by statistical analysis. Sphericity was tested using Mauchly’s test; no violations were detected. Greenhouse–Geisser corrections would have been applied otherwise. Post hoc paired comparisons were conducted with Holm correction and multiple comparisons on estimated marginal means were performed with Tukey adjustment. Effect magnitudes were reported using partial η2, to complete significance testing with practical relevance.
Although the sample size (n = 25) may appear limited, effect sizes (partial η2) were systematically reported to complement p-values and to assess practical significance. Several effects exhibited large effect size (ηp2 > 0.14) indicating robust behavioural modulation despite the moderate sample size [38,39]. Nonetheless, statistical power considerations suggest that small interaction effects should be interpreted cautiously and warrant replication with larger samples.
Raw telemetry was aggregated into a long-format table (Table 4), in which each row represents one participant, one device and one scenario observation.
Table 4.
Input data structure for RM-ANOVA.
To improve analytical transparency, descriptive statistics and graphical summaries were generated for all variables. Complementary transient and stability metrics were additionally inspected through paired within-subject comparisons to confirm the direction and consistency of RM-ANOVA results.
4. Results
4.1. Scenario-Level Analysis (ANOVA 1)
Two repeated-measures ANOVA models were applied; ANOVA 1 evaluated the within-subject factor scenario (No TCM, Day, Night) to quantify overall changes in driver control inputs due to the presence of speed cushions and to assess potential differences between daytime and nighttime visibility conditions.
Table 5, Table 6 and Table 7 report statistics (mean/maximum value and % versus baseline) and post hoc paired comparisons corrected using Holm and Tukey procedures. RM-ANOVA p-values are reported (peff) as provided by the analysis output.
Table 5.
ANOVA 1—RM-ANOVA and post hoc results for brake.
Table 6.
ANOVA 1—RM-ANOVA and post hoc results for Throttle.
Table 7.
ANOVA 1—RM-ANOVA and post hoc results for steering angle.
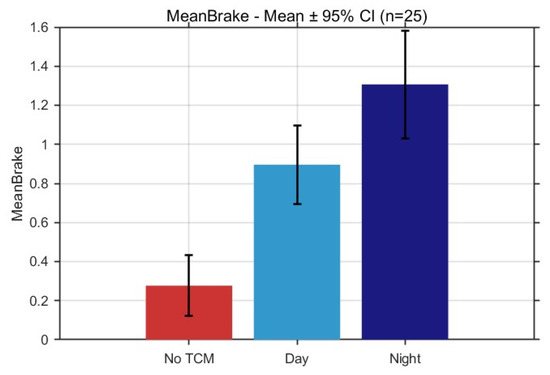
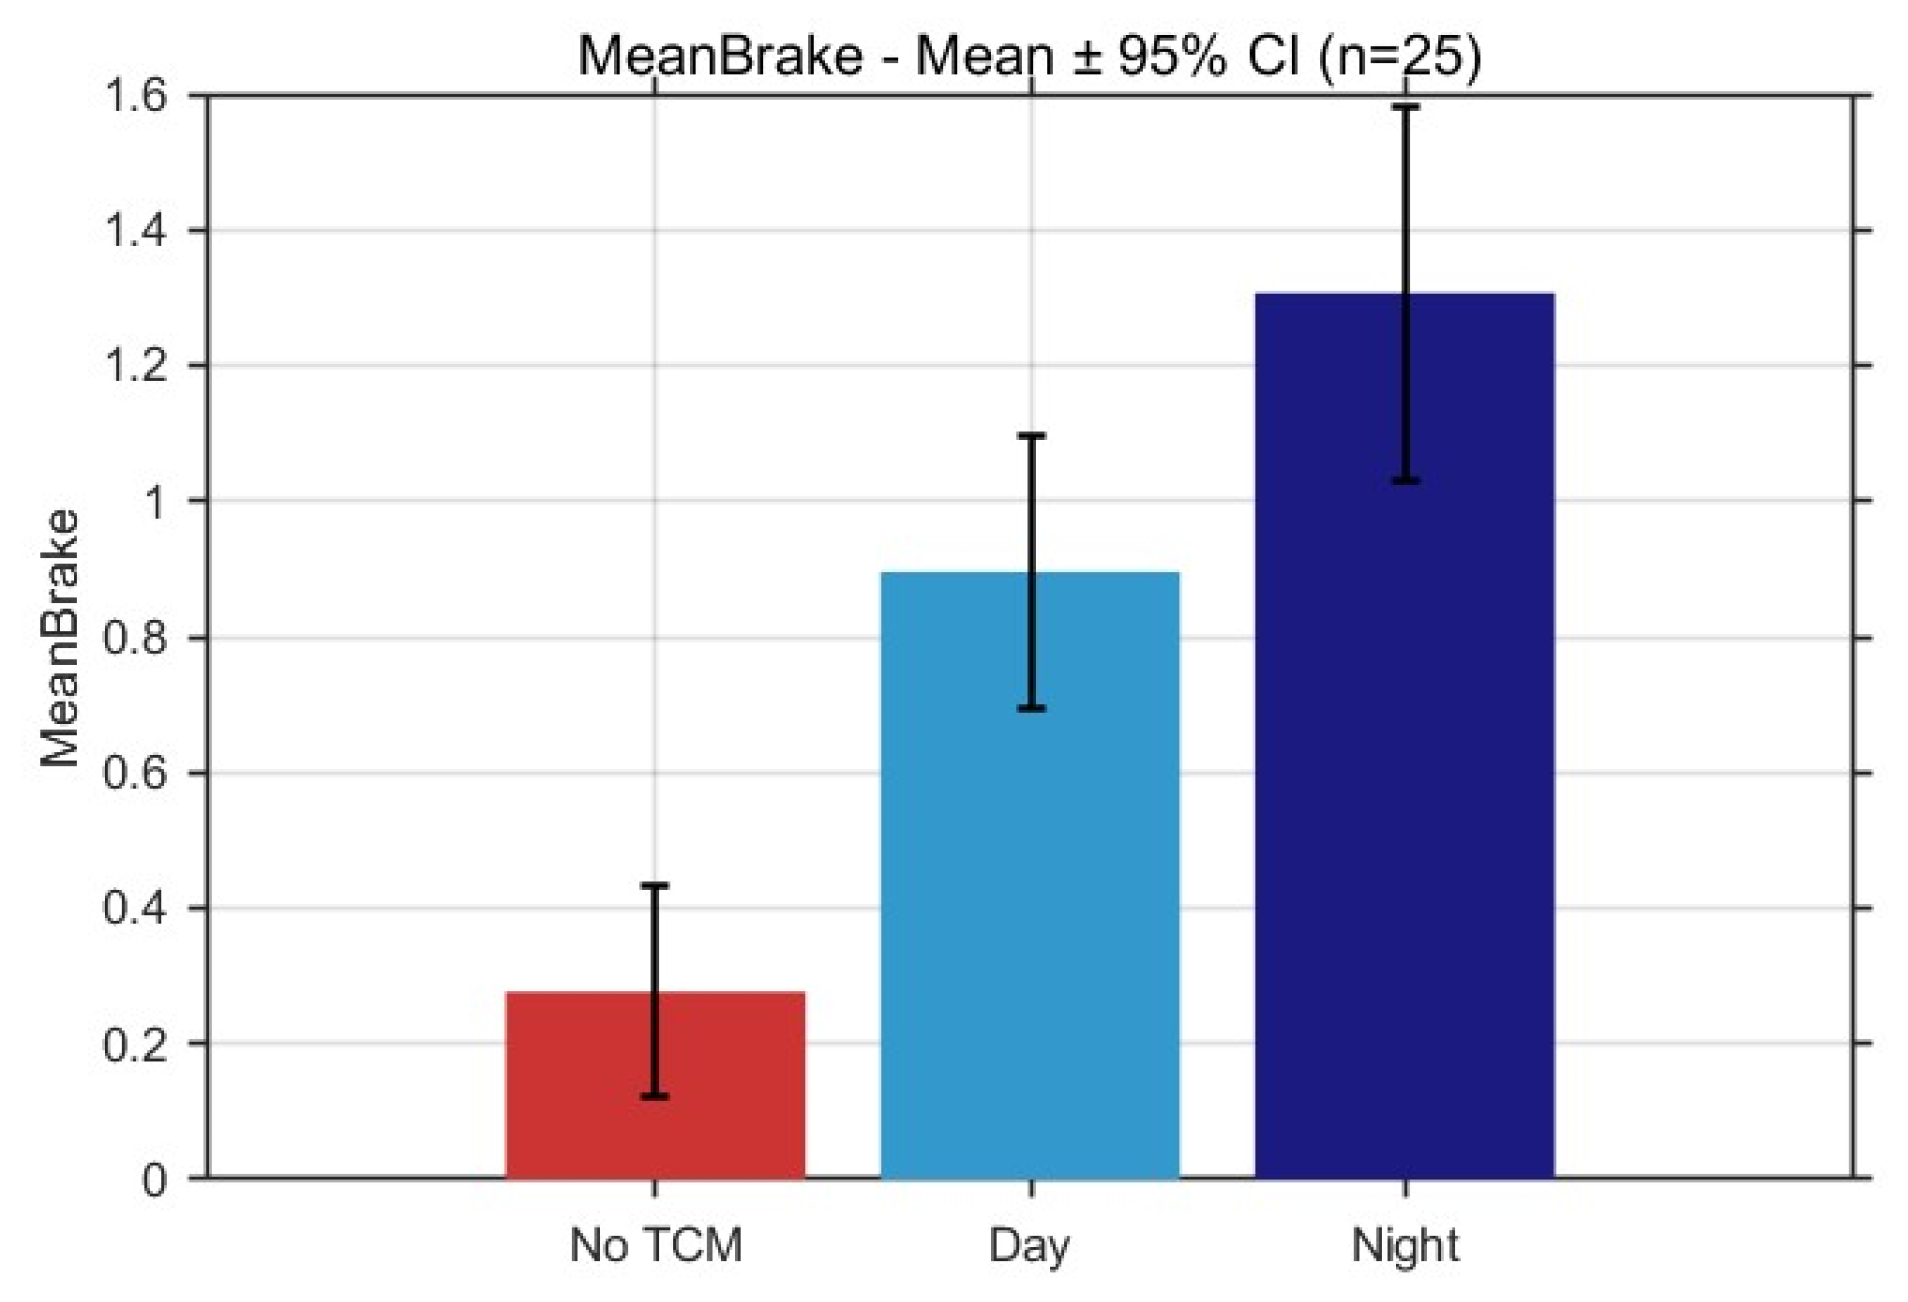
Brake, evaluated as the mean value over the acquisition window, differed significantly across scenarios: F(2,48) = 27.207, peff = 1.13 × 10⁻⁷, ηp2 = 0.53.
Relative to baseline (Table 5), Mean Brake increased under both Day and Night condition, with significant post hoc differences versus No TCM according to both Holm and Tukey adjusted comparisons.
In particular, mean braking increased by approximately 224% in the Day scenario and 372% in the Night scenario relative to No TCM (Table 5).
A significant difference between Day and Night was also observed (pHolm = 0.002, pTukey = 0.005), indicating a stronger braking response under reduced visibility.
Figure 7 illustrates the mean values and 95% confidence intervals across scenarios. The non-overlapping confidence intervals between baseline and cushion conditions visually support the statistical evidence of substantial behavioural modulation.
Figure 7.
Mean Brake (±95% CI) across scenarios (n = 25).
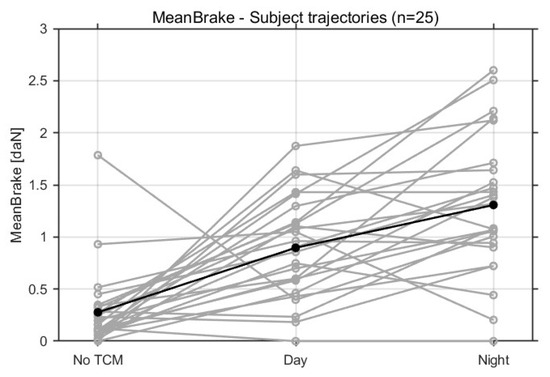
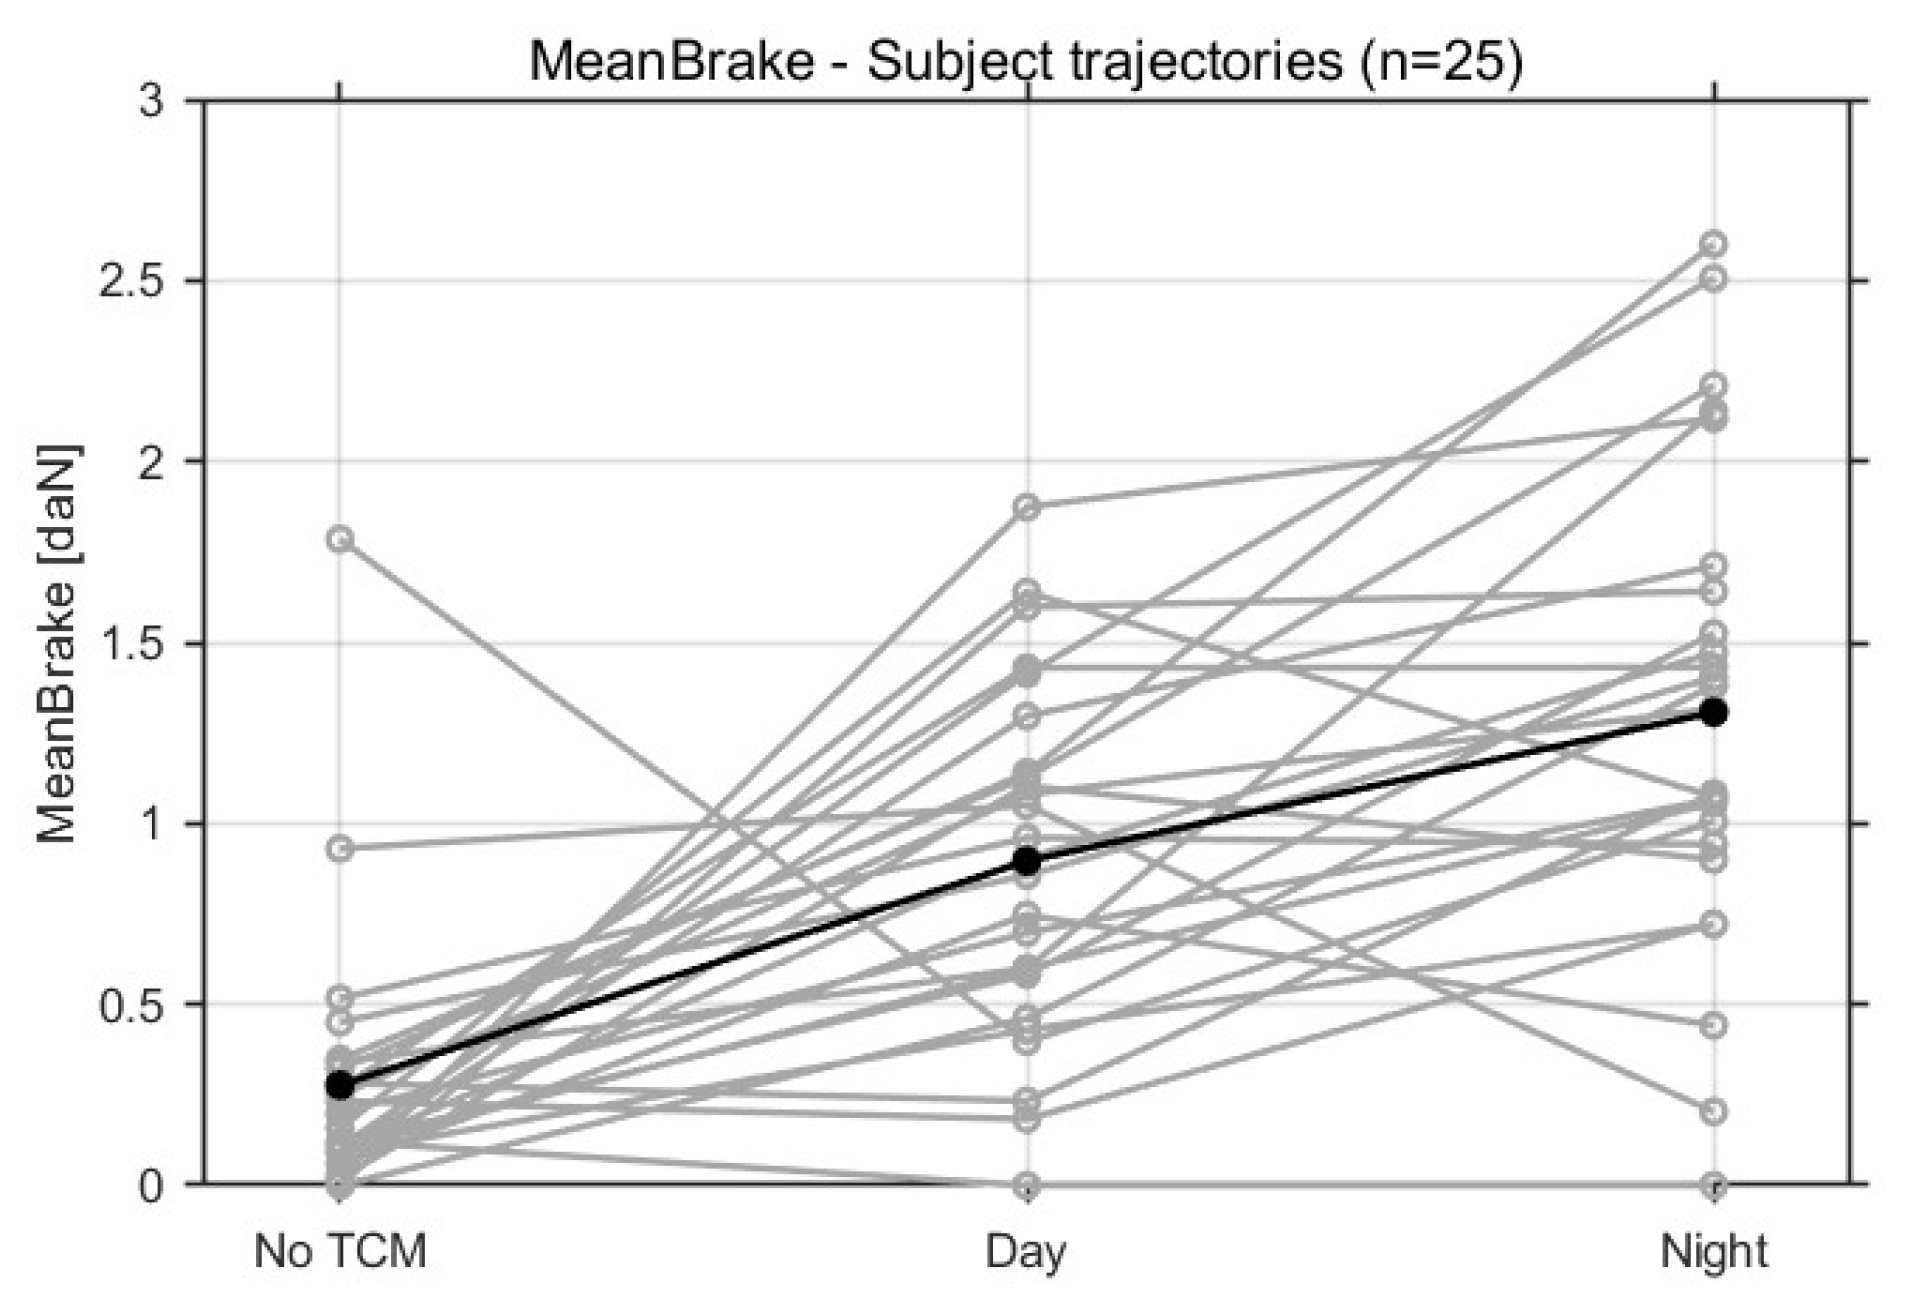
Figure 8 reports individual within-subject trajectories. A consistent upward trend from No TCM to Day and Night conditions is observable in the majority of participants, confirming that the effect is not driven by isolated outliers but reflects systematic within-subject adaptation.
Figure 8.
Within-subject trajectories of Mean Brake across scenarios (n = 25).
Analogous descriptive and within-subject visual inspections were conducted for the other primary control variables included in ANOVA 1 (Mean Throttle input and Max Steering Angle), yielding consistent directional patterns and supporting the robustness of the reported effects. For conciseness, only the representative results for Mean Brake are illustrated.
Mean throttle input, evaluated over the acquisition window, differed significantly across scenarios: F(2,48) = 34.586, peff = 5.36 × 10⁻⁸, ηp2 = 0.59.
Table 6 shows that mean throttle input decreased relative to baseline in both Day and Night conditions, corresponding to reductions of approximately 55% and 58%, respectively, relative to No TCM. Table 6 also reports significant post hoc differences versus No TCM.
Steering Angle, evaluated as the maximum value over the acquisition window, differed significantly across scenarios: F(2,48) = 19.531, peff = 1.48 × 10⁻⁶, ηp2 = 0.45.
Relative to baseline (Table 7) “Max steering angle” increased in Day and Night conditions, with significant post hoc differences versus No TCM according to both Holm and Tukey adjusted comparisons. No significant Day vs. Night difference was observed (pHolm = 0.145, pTukey = 0.306).
Residual diagnostics did not show patterns indicating major departures from model assumptions across the analyzed metrics.
4.2. Device-Level Effects (ANOVA 2)
ANOVA 2 was designed to exclude the baseline condition to evaluate the within-subject factors colour, width and scenario, including interaction terms. Table 8 reports RM-ANOVA outcomes for each dependent variable.
Table 8.
ANOVA 2—RM-ANOVA three-way results.
For brake, significant main effects of colour and scenario were observed, together with significant width × scenario and colour × width × scenario interactions (Table 8), indicating that braking response depends on the combined influence of device characteristics and visibility conditions.
For throttle, the dominant effect was associated with width, as reflected by a significant main effect and a strong width × scenario interaction (Table 8), while colour did not emerge as a significant standalone factor.
For steering angle, a significant main effect of width was found, whereas colour and scenario did not show statistically significant effect (Table 8).
To support the interpretation of the significant colour × width × scenario interactions observed for MeanBrake and MeanThrottle, simple-effect decompositions were added and are reported in Table 9. These adjusted comparisons clarify which scenario and device configurations contributed to the omnibus ANOVA results.
Table 9.
Simple-effect decomposition of significant colour × width × scenario interactions.
For MeanBrake, the colour effect was not significant in the Day scenario, whereas it became significant in the Night scenario. Width-related differences were mainly associated with contrasts involving the narrowest configuration, with stronger differences under Night conditions.
For MeanThrottle, the colour effect was also not significant in Day but was significant in Night. Width-related differences were again mainly driven by contrasts involving the narrowest configuration, with an additional significant difference between the intermediate and widest configurations under Night. Overall, these results indicate that the significant three-way interactions were configuration-specific and should not be interpreted as uniform colour or width effects across all scenarios.
To further clarify the practical interpretation of the significant width effect on MaxSteeringAngle, Tukey-adjusted post hoc contrasts were also inspected. MaxSteeringAngle was higher for d1 than for d2 (MeanDiff = 0.473 deg, 95% CI [0.023, 0.923], pTukey = 0.038) and higher for d1 than for d3 (MeanDiff = 0.711 deg, 95% CI [0.078, 1.343], pTukey = 0.026), whereas the d2–d3 contrast was not significant (MeanDiff = 0.238 deg, 95% CI [−0.131, 0.606], pTukey = 0.261). This additional information makes the width-related trend clearer: the main change occurs between the narrowest cushion and the two wider configurations, while the 1.8 m and 2.1 m widths do not differ significantly for steering.
4.3. Complementary Control-Dynamic Analysis
ANOVA analyses were complemented with dynamic analysis that confirmed strong reductions in speed on windows and increased transient perturbations during approach/traversal, consistent with the direction of RM-ANOVA effects.
Table 10 summarizes the four most informative complementary metrics and the transient perturbation indicator.
Table 10.
Paired user–event matched comparisons on windows.
5. Discussion
5.1. Contribution Beyond Speed-Based Evaluations
Traffic calming measures are commonly assessed through speed-related indicators because operating speed is strongly linked to crash risk and injury severity. Although speed remains a fundamental variable, it does not fully capture how drivers adapt their control strategies when interacting with infrastructural constraints.
In line with the gaps identified in the literature review, the present study extends conventional evaluations by analyzing drivers’ direct control inputs (namely braking, throttle and steering commands) as indicators of human–vehicle interaction when encountering speed cushions. By adopting control-oriented metrics derived from vehicle telemetry, this work complements speed-based analyses and provides additional insight into how drivers redistribute longitudinal and lateral control effort in response to traffic calming interventions.
To support interpretability beyond summary means, phase-sensitive indicators computed on fixed travelled-distance windows were additionally inspected. These supplementary metrics (Speed_mean, Steer_rms, Jerk_rms and LaneGap_std) were used for descriptive reporting and robustness checks and did not replace the RM-ANOVA inferential framework.
5.2. Scenario-Level Adaptation of Driver Controls
The scenario-level analysis (ANOVA 1) showed systematic changes in driver control behaviour when speed cushions were introduced.
Mean Brake increased markedly under both Day and Night conditions relative to baseline driving without speed cushions, with a significantly stronger response observed. At night this result indicates that braking demand is linked not only to the physical presence of the device but also to visibility conditions, suggesting increased uncertainty in the interaction with the device as lighting conditions change.
Mean Throttle decreased substantially in both Day and Night scenarios compared to baseline, with no significant difference between visibility conditions. This finding shows that speed cushions induce a generalized reduction in throttle input, largely independent of lighting conditions.
Max Steering Angle also increased relative to baseline in both Daytime and Nighttime conditions, without significant difference between the two conditions. This result is consistent with the interpretation that lateral control adjustments are primarily driven by the geometric constraint imposed by the device rather than by perceptual factors related to visibility.
Complementary analyses were consistent with RM-ANOVA directionality, showing large speed reduction within the interaction window and increased transient perturbation.
In practice, drivers respond by shifting control effort from throttle to braking and steering when cushions are present. These findings are relevant to urban road safety because they show not only that drivers slow down near speed cushions, but also how they slow down and steer through them.
5.3. Role of Device Design Parameters: Width Versus Colour
The device-level analysis (ANOVA 2) clarifies how specific design attributes influence different control channels.
Throttle behaviour (Mean Throttle) was predominantly associated with cushion width, as reflected by a strong main effect of width and a significant width × scenario interaction. This result indicates that wider cushions more strongly discourage throttle use, with an effect that varies depending on visibility conditions.
Steering behaviour (Max Steering Angle) was also primarily influenced by width, while colour and scenario did not emerge as significant standalone factors. This result suggests that lateral control demand is primarily driven by geometric constraints rather than by visual appearance.
In contrast, braking behaviour (Mean Brake) showed significant sensitivity to colour and scenario, together with relevant interaction effects involving width. This pattern suggests that braking response is influenced not only by geometry, but also by perceptual cues and their interaction with visibility conditions.
Overall, these results highlight a functional differentiation among control channels: throttle and steering responses are mainly geometry-driven, whereas braking is additionally modulated by perceptual and contextual factors.
5.4. Selective Interaction and Operational Compatibility in Urban Traffic Calming
In recent years, traffic calming strategies have increasingly adapted to the evolving operational requirements of urban traffic systems. In central urban corridors, where a substantial flow of emergency vehicles and public transport is expected, targeted solutions become necessary in order to avoid introducing delays for vehicle categories that should ideally not be affected by speed-reducing measures. Within this context, speed cushions have been widely proposed as selective traffic calming devices, primarily interacting with passenger cars while allowing wider-track vehicles to traverse them with reduced discomfort or delay.
This interpretation is consistent with previous studies describing speed cushions as measures intended to reconcile speed mitigation with operational compatibility in urban corridors. The present findings provide additional insight into this selective interaction mechanism from a driver–vehicle control perspective.
The strong association between cushion width and throttle modulation, together with the effect of width on steering corrections, indicates that geometric design parameters directly shape how drivers adapt their control strategy when negotiating the device. Wider cushions were associated with stronger throttle release and braking responses, while narrower configurations elicited larger peak steering adjustments, suggesting different forms of control adaptation depending on the available lateral clearance.
From an operational standpoint, these results align with the rationale underlying speed cushion adoption in corridors where emergency vehicle circulation and public transport efficiency must be preserved (as urban corridors). A geometry that discourages aggressive throttle use without inducing excessive steering corrections may reduce speed while maintaining trajectory stability, potentially limiting lateral encroachments that could interfere with adjacent lanes or priority vehicles. Conversely, configurations that require pronounced steering inputs may increase local manoeuvring demand, which could be undesirable in constrained or mixed-traffic urban environments.
Although emergency and public transport vehicles were not simulated, the present results provide passenger-car control-level evidence on how drivers adapt to cushion geometry and appearance. The geometric principle underlying selective interaction with wider-track vehicles has been described in previous technical literature (e.g., ref. [16]); however, operational impacts under the specific configurations tested here should be verified through dedicated multi-vehicle simulations and field campaigns before drawing system-level conclusions.
5.5. Visibility Effects and Perceptual Modulation
The stronger braking response observed under nighttime conditions at the scenario level, together with the colour-related effects identified in the device-level analysis, suggests a role of perceptual modulation in braking behaviour.
In this context, surface coloration may act as a perceptual enhancer, influencing risk appraisal rather than altering the physical interaction between vehicle and infrastructure.
Colour cannot affect vehicle dynamics here; its effect is behavioural (risk expectancy) and it appears strongest under reduced visibility.
The supplementary stability indicator LaneGap_std showed a modest increase at night relative to baseline, suggesting modest visibility-related modulation of lateral dispersion during the interaction phase, whereas daytime comparisons did not show a systematic increase after correction.
5.6. Vehicle-Oriented Perspective: Control Inputs as Human–Vehicle Interaction Indicators
The main contribution of this study lies in the quantitative characterization of how infrastructural elements shape drivers’ direct control input. From this perspective, the effectiveness of a traffic calming measure should not be interested solely in terms of speed reduction, but also in relation to how driver control strategies are modified. While reducing speed is desirable, pronounced changes in control behaviour may require careful design and placement considerations to avoid unintended effects on driving behaviour.
Braking force, throttle opening and steering angle provide a compact, vehicle-centred description of the driver–vehicle control loop under urban constraints. These metrics offer an alternative representation of driver workload and behavioural adaptation that is directly relevant to vehicle-focused research, without assuming any specific level of automation.
The aim is not to redefine traffic calming effectiveness in planning terms, but to provide vehicle-centred evidence on how infrastructure-induced constraints are translated into driver control actions. Such evidence may support future studies addressing human-centred vehicle system design, driver assistance calibration and the integration of infrastructural constraints into vehicle development processes.
In line with contemporary simulator validation frameworks, the present study interprets findings primarily as relative behavioural trends (control allocation and transient perturbations) under controlled conditions, rather than an absolute on-road dynamic equivalence.
5.7. Methodological Considerations
Before statistical analysis, telemetry data were summarized at the participant level within each experimental condition. This approach ensures that each participant contributes equally to the results, regardless of the number of raw samples recorded.
Descriptive statistics are provided to illustrate the data, whereas statistical conclusions are based exclusively on repeated-measures ANOVA and corrected post hoc tests. Graphs and summary values are therefore used for interpretation, not for determining statistical significance.
To improve analytical transparency, the RM-ANOVA results were complemented by within-subject paired comparisons on windows, reported as mean differences with 95% confidence intervals and Holm-corrected p-values. These checks were used to confirm direction and consistency of effects without altering the primary inferential framework.
5.8. Limitations and Future Research Directions
This study is based on driving simulator experiment involving a limited sample size and a single urban corridor.
The corridor-specific geometry and traffic context may limit direct transferability to other road types or cities. The selected segment represents a high vehicle–pedestrian crash location within Messina and was adopted as a contextually relevant case study.
The sample size (n = 25) limits sensitivity to small effects and higher-order interactions. Although several effects exhibited moderate to large effect sizes, subtle interaction patterns should be interpreted cautiously and warrant replication with larger and more heterogeneous samples.
The use of a static simulator strengthens experimental control but does not fully reproduce vertical acceleration feedback, full-body motion cues or real-world risk perception; therefore, results should be interpreted primarily in terms of relative behavioural adaptation rather than absolute dynamic equivalence with on-road conditions. Accordingly, a fidelity-related bias in the magnitude of the observed braking, throttle or steering responses cannot be completely excluded, and future work should include motion-based simulation or on-road validation.
Background traffic was excluded to reduce confounding effects on control inputs, strengthening internal validity while reducing the realism of real-world traffic conditions. Future work should incorporate controlled traffic interactions to assess robustness under more naturalistic conditions.
Only one vehicle category (passenger car) was modelled. The selective operational compatibility of speed cushions for buses/ambulances should be verified in multi-vehicle simulation and field measurements before system-level conclusions are drawn.
While the main ANOVA focused on three primary control variables, additional transient and stability indicators (Speed_mean, Steer_rms, Jerk_rms, LaneGap_std) were included as supplementary evidence; future studies could further expand the metric set (e.g., speed variance, comfort-related accelerations, lane encroachment events under interaction and workload proxies).
Future research should therefore investigate additional road layouts, include controlled traffic interactions, extend the analysis to different vehicle types and driver populations, and perform on-road validation to assess the generalisability of the observed control-level patterns.
6. Conclusions
This study investigated human–vehicle interaction in the presence of traffic calming devices, with specific focus on speed cushions, adopting a control-oriented perspective that goes beyond conventional speed-based evaluations.
Through a simulator-based experimental campaign reproducing a real urban corridor and by analyzing vehicle telemetry data, driver interactions with three fundamental control channels were examined: braking, throttle and steering.
The introduction of speed cushions alone produced systematic changes in vehicle control. Mean braking increased markedly under both daytime and nighttime conditions compared to the baseline scenario without devices, with a more pronounced increase observed at night. Mean throttle input decreased consistently in both visibility conditions, with no significant difference between day and night. Maximum steering angle also increased in the presence of cushions, indicating larger lateral corrections relative to driving without devices, again without significant modulation attributable to visibility.
Analysis showed that different control channels respond to different determinants. Cushion width emerged as the dominant factor affecting throttle modulation and steering corrections, with particularly strong interactions with scenario. Braking behaviour was instead sensitive to both scenario and surface colour, as well as to interactions involving width, indicating that braking response is influenced not only by geometry but also by perceptual and contextual components.
Overall, the results show a relevant design trade-off in contexts where cushion width and colour are not fully standardized. Wider configurations tend to discourage throttle use more effectively and to amplify braking response, whereas narrower configurations require larger steering corrections. Surface colour, while not directly affecting vehicle dynamics, appears to act as a potential modulator of driver behaviour.
Complementary metrics computed on travelled-distance windows corroborated the RM-ANOVA trends by showing large speed reductions during the interaction phase and increased transient perturbations and, at night, modestly higher lateral dispersion. These supplementary analyses support transparent effect interpretation without replacing the primary RM-ANOVA inferential framework.
From an urban road safety perspective, these control adaptations should be interpreted as safety-relevant behavioural mechanisms. The observed reductions in throttle input and mean speed are consistent with the expected role of traffic calming devices in lowering kinetic energy and potential impact severity, particularly in areas with vulnerable road users. However, the simultaneous increases in braking, jerk and steering corrections indicate that speed cushions may also introduce transient control perturbations. These effects suggest that speed cushion design should aim not only to reduce speed, but also to promote smooth and predictable driver responses under different visibility conditions.
The Day and Night scenarios were generated using the simulator software settings, which allowed the driving environment to be rendered under daytime and nighttime conditions. These settings were selected to reproduce two distinct visual conditions within the same roadway geometry and device layout. However, no independent photometric characterization of the simulator scene was performed, and luminance or illuminance levels at the driver viewpoint were not instrumentally measured. Consequently, Day–Night differences should be interpreted as effects associated with the simulated visual condition. Future simulator studies should report luminance or illuminance values to better quantify the relationship between lighting conditions, visual perception and driver control responses.
This study is subject to limitations related to sample size, the analysis of a single urban corridor and the simulated nature of the experiment. Future research should consider scenarios with controlled traffic interactions, different road layouts and vehicle types, as well as on road validation, to assess the robustness and generalisability of the observed control patterns.
Author Contributions
Conceptualization, methodology, software, validation, formal analysis, investigation, resources, data curation, writing—original draft preparation: all authors have participated in equal measure. All authors have read and agreed to the published version of the manuscript.
Funding
This work has been funded by the European Union (NextGeneration EU), through the MUR-PNRR project SAMOTHRACE (ECS00000022).
Data Availability Statement
The data presented in this study are available upon reasonable request from the corresponding author (O.P.). The data are not publicly available due to privacy and ethical restrictions related to driving behaviour experiments involving human participants.
Conflicts of Interest
The authors declare no conflicts of interest.
References
- Bonanomi, L. Le Temps des Rues: Vers un Nouvel Aménagement de L’espace Rue; IREC: New York, NY, USA, 1990. [Google Scholar]
- Jateikiene, L.; Andriejauskas, T.; Lingyte, I.; Jasiuniene, V. Impact Assessment of Speed Calming Measures on Road Safety. Transp. Res. Procedia 2016, 14, 4228–4236. [Google Scholar] [CrossRef] [Scilit]
- Distefano, N.; Leonardi, S. Evaluation of the benefits of traffic calming on vehicle speed reduction. Civ. Eng. Archit. 2019, 7, 200–214. [Google Scholar] [CrossRef] [Scilit]
- Magkafas, F.; Fountas, G.; Anastasopoulos, P.C.; Basbas, S. Beyond Speed Reduction: A Systematic Literature Review of Traffic-Calming Effects on Public Health, Travel Behaviour, and Urban Liveability. Infrastructures 2025, 10, 147. [Google Scholar] [CrossRef] [Scilit]
- Pérez-Acebo, H.; Ziólkowski, R.; Linares-Unamunzaga, A.; Gonzalo-Orden, H. A Series of Vertical Deflections, a Promising Traffic Calming Measure: Analysis and Recommendations for Spacing. Appl. Sci. 2020, 10, 3368. [Google Scholar] [CrossRef] [Scilit]
- Abdulmawjoud, A.A.; Jamel, M.G.; Al-Taei, A.A. Traffic flow parameters development modelling at traffic calming measures located on arterial roads. Ain Shams Eng. J. 2021, 12, 437–444. [Google Scholar] [CrossRef] [Scilit]
- Zhang, Y.; Shao, Y.; Shi, X.; Ye, Z. A Testing and Evaluation Method for the Car-Following Models of Automated Vehicles Based on Driving Simulator. Systems 2024, 12, 298. [Google Scholar] [CrossRef] [Scilit]
- Zhang, S.; Zhao, C.; Zhang, Z.; Lv, Y. Driving simulator validation studies: A systematic review. Simul. Model. Pract. Theory 2025, 138, 103020. [Google Scholar] [CrossRef] [Scilit]
- Johnson, L.; Nedzesky, A.J. A Comparative Study of Speed Humps, Speed Slots and Speed Cushions. In Proceedings of the ITE Annual Meeting Compendium, Lake Buena Vista, FL, USA, 1–4 August 2004. [Google Scholar]
- Juhász, M.; Koren, C. Getting an Insight into the Effects of Traffic Calming Measures on Road Safety. Transp. Res. Procedia 2016, 14, 3811–3820. [Google Scholar] [CrossRef] [Scilit]
- Kosakowska, K. Evaluation of the impact of speed bumps on the safety of residents-selected aspects. Transp. Res. Procedia 2022, 60, 418–423. [Google Scholar] [CrossRef] [Scilit]
- Vaitkus, A.; Čygas, D.; Jasiūnienė, V.; Jateikienė, L.; Andriejauskas, T.; Skrodenis, D.; Ratkevičiūtė, K. Traffic calming measures: An evaluation of the effect on driving speed. Promet-Traffic Transp. 2017, 29, 275–285. [Google Scholar] [CrossRef] [Scilit]
- Pau, M.; Angius, S. Do speed bumps really decrease traffic speed? An Italian experience. Accid. Anal. Prev. 2001, 33, 585–597. [Google Scholar] [CrossRef] [Scilit]
- Gonzalo-Orden, H.; Pérez-Acebo, H.; Unamunzaga, A.L.; Arce, M.R. Effects of traffic calming measures in different urban areas. Transp. Res. Procedia 2018, 33, 83–90. [Google Scholar] [CrossRef] [Scilit]
- Loprencipe, G.; Moretti, L.; Pantuso, A.; Banfi, E. Raised Pedestrian Crossings: Analysis of Their Characteristics on a Road Network and Geometric Sizing Proposal. Appl. Sci. 2019, 9, 2844. [Google Scholar] [CrossRef] [Scilit]
- Berthod, C.; Leclerc, C. Traffic Calming in Québec: Speed Humps and Speed Cushions. J. Civ. Eng. Archit. 2013, 7, 456–465. [Google Scholar]
- Berloco, N.; Coropulis, S.; Intini, P.; Ranieri, V. Effects of Berlin speed cushions in urban restricted speed zones: A case study in Bari, Italy. Transp. Res. Procedia 2022, 60, 180–187. [Google Scholar] [CrossRef] [Scilit]
- Berloco, N.; Coropulis, S.; Garofalo, G.; Intini, P.; Ranieri, V. Analysis of the Factors Influencing Speed Cushion Effectiveness in the Urban Context: A Case Study Experiment in the City of Bari, Italy. Sustainability 2023, 15, 6352. [Google Scholar] [CrossRef] [Scilit]
- Öz, E.; Küçükkelepçe, O.; Kurt, O.; Çavuş, A.C. Effect of Speed Humps on Ambulance Delay. Cureus 2023, 15, e33722. [Google Scholar] [CrossRef] [Scilit]
- Godley, S.T.; Triggs, T.J.; Fildes, B.N. Driving simulator validation for speed research. Accid. Anal. Prev. 2002, 34, 589–600. [Google Scholar] [CrossRef] [Scilit]
- Wynne, R.A.; Beanland, V.; Salmon, P.M. Systematic review of driving simulator validation studies. Saf. Sci. 2019, 117, 138–151. [Google Scholar] [CrossRef] [Scilit]
- Klüver, M.; Herrigel, C.; Heinrich, C.; Schöner, H.P.; Hecht, H. The behavioral validity of dual-task driving performance in fixed and moving base driving simulators. Transp. Res. Part F Traffic Psychol. Behav. 2016, 37, 78–96. [Google Scholar] [CrossRef] [Scilit]
- Chen, L.; Fang, J.; Li, J.; Xie, J. Research on the Effectiveness of Driving Simulation Systems in Risky Traffic Environments. Systems 2025, 13, 329. [Google Scholar] [CrossRef] [Scilit]
- Hussain, M.; Muladilijiang, B.; Shi, J.; Amjad, P.; Albrecht, M.A.; Etikaf, H.; Razi, H.; Teresa, S. Driving Simulator-Based Driving Behavioural Research: A Bibliometric and Narrative Review Providing Key Insights for New and Emerging Researchers. Vehicles 2026, 8, 32. [Google Scholar] [CrossRef] [Scilit]
- Rahman, F.; Joewono, T.B.; Al Masum, S. Application of Traffic Calming Devices in Developing Countries: Learning Lesson from Bangladesh. J. Transp. Technol. 2018, 8, 119–135. [Google Scholar] [CrossRef]
- Majer, S.; Sołowczuk, A. Traffic Calming Measures and Their Slowing Effect on the Pedestrian Refuge Approach Sections. Sustainability 2023, 15, 15265. [Google Scholar] [CrossRef] [Scilit]
- Sabi Boun, S.; Janvier, R.; Jean Marc, R.E.; Paul, P.; Senat, R.; Demes, J.A.; Burigusa, G.; Chaput, S.; Maurice, P.; Druetz, T. Environmental measures to improve pedestrian safety in low- and middle-income countries: A scoping review. Glob. Health Promot. 2024, 31, 44. [Google Scholar] [CrossRef] [Scilit]
- Chang, K.N.; Nolan, M.; Nihan, N.L. Developing Design Standards for Speed Cushions. Transp. Res. Rec. 2007, 2030, 22–28. [Google Scholar] [CrossRef] [Scilit]
- Centre Etude Transports Urbain. Méthodologie et Recommandations: Guide Zon; Centre Etude Transports Urbain: Bagneaux, France, 1992.
- Department for Transport (DfT). Traffic Calming. Local Transport Note 1/07; TSO: Norwich, UK, 2007.
- Delaware Department of Transportation (DDT). Delaware Traffic Calming Design Manual. 2012. Available online: https://trid.trb.org/View/1238089 (accessed on 30 June 2025).
- Layfield, R.; Parry, D. TRL|Traffic Calming—Speed Cushion Schemes; Transport Research Laboratory: London, UK, 1998. [Google Scholar]
- Italian Ministry of Infrastructure and Transport. Registro Ufficiale U. 0006968: Sperimentazione di Dispositivi di Moderazione Delle Velocità Denominati “Cuscini Berlinesi” su Strade Urbane del Comune di Bari [Official Register No. U. 0006968: Experimental Use of Speed Moderation Devices Called “Berlin Cushions” on Urban Roads in the Municipality of Bari]; Italian Ministry of Infrastructure and Transport: Rome, Italy, 2019.
- Italian Republic. Decreto Legislativo 30 Aprile 1992, n. 285: Nuovo Codice Della Strada [Legislative Decree No. 285 of 30 April 1992: New Highway Code]; Gazzetta Ufficiale della Repubblica Italiana, Serie Generale, No. 114, 18 May 1992; Version in Force on 13 March 2025; Italian Republic: Rome, Itay, 2025.
- n. 495 Decreto del Presidente Della Repubblica 16 Dicembre 1992, “Regolamento di Esecuzione e di Attuazione del Nuovo Codice Della Strada., 1992; Vigente al 13-3-2025,”. 1992. Available online: https://www.altalex.com/documents/codici-altalex/2013/08/30/regolamento-di-esecuzione-e-di-attuazione-del-codice-della-strada (accessed on 20 January 2026).
- Ispettorato Generale Per La Circolazione E La Sicurezza Stradale. Piani Della Sicurezza Stradale Urbana—Linee Guida per la Redazione; Circolare Numero 3698, Allegato Due; Ispettorato Generale Per La Circolazione E La Sicurezza Stradale: Rome, Italy, 2001.
- Treiber, M.; Helbing, D. Memory effects in microscopic traffic models and wide scattering in flow-density data. Phys. Rev. E Stat. Nonlinear Soft Matter Phys. 2003, 68, 046119. [Google Scholar] [CrossRef] [Scilit] [PubMed]
- Cohen, J. Statistical Power Analysis for the Behavioral Sciences; Academic Press: Cambridge, MA, USA, 1977. [Google Scholar] [CrossRef] [Scilit]
- Lakens, D. Calculating and reporting effect sizes to facilitate cumulative science: A practical primer for t-tests and ANOVAs. Front. Psychol. 2013, 4, 62627. [Google Scholar] [CrossRef] [Scilit] [PubMed]

Disclaimer/Publisher’s Note: The statements, opinions and data contained in all publications are solely those of the individual author(s) and contributor(s) and not of MDPI and/or the editor(s). MDPI and/or the editor(s) disclaim responsibility for any injury to people or property resulting from any ideas, methods, instructions or products referred to in the content. |
© 2026 by the authors. Licensee MDPI, Basel, Switzerland. This article is an open access article distributed under the terms and conditions of the Creative Commons Attribution (CC BY) license.