


Abstract
Braking drag is a typical fault of brake systems, and clarifying the correlation mechanism between vehicular working conditions and braking drag is critical for brake design improvement. Based on fluid mechanics and contact mechanics, this paper establishes a dynamic model for braking drag mechanism analysis, combined with the return mechanism and force-bearing state of brake pistons. Firstly, a commercial vehicle brake system dynamic model is built via Amesim, and piston sliding resistance is identified as the key factor leading to insufficient piston retraction through user operational data analysis. Subsequently, a fluid-structure interaction-based dynamic coupling model of drag mechanism is established, typical braking conditions are extracted via K-means clustering, and piston friction, displacement and drag torque are solved with the system model outputs as inputs. Finally, drag-prone working conditions are determined, and the disc brake drag mechanism is revealed. The results show that piston sliding resistance is the primary factor in braking drag; medium-low speed prolonged braking has high drag susceptibility; and the seal contact area is in mixed lubrication, with contact pressure and friction dominated by asperity shear stress. This work enables accurate identification of drag-prone conditions, providing guidance for brake system optimization.
1. Introduction
Commercial vehicles frequently brake during operation, making them prone to brake drag [1]. Brake drag is defined as residual contact between the brake disc and friction pads after the brake pedal is released, generating drag torque which causes continuous braking during vehicle operation [2,3]. The presence of brake drag increases vehicle driving resistance, shortens range, accelerates brake wear, reduces service life [4,5,6,7,8], and seriously endangers driving safety. To address this issue, clarifying the mechanism of brake drag is crucial. Current research on its mechanism primarily relies on drag dynamic models and bench tests.
The motion relationships between components during brake operation are complex, requiring model simplification. The brake is simplified into a mass-spring system in many studies [9,10]. Tan Shunan et al. [11] developed a drag dynamic model based on fundamental drag mechanics formulas, considering caliper stiffness, friction pad stiffness, and sealing ring characteristics. Zhang Lu et al. [12] proposed that increased piston retraction facilitates earlier separation of the brake disc and pads, reducing drag torque. Wang Yukun et al. [13] significantly improved drag torque by optimizing the compression amount of the friction pad assembly. Sun Meng et al. [14] proposed a specially shaped sealing structure, analyzed the failure of the sealing ring from the perspective of reliability, and provided a new perspective on research on brake drag.
Bench tests on disc brakes show that increasing brake clearance [15] and piston retraction distance reduces drag torque but increases caliper fluid demand and brake pedal travel [16,17]. Installing springs [18] or greasing guide pins [19] also reduces drag torque. However, springs increase caliper fluid demand and brake response time, compromising safety [20] and greasing guide pins is time-limited.
In the literature, key influencing factors are identified, critical brake components are analyzed using fluid mechanics and contact mechanics, and effective technical approaches to address brake drag are provided, with studies having been based on fundamental brake drag formulas. However, brake drag is closely linked to operating conditions, and the application of dynamic working conditions has become widespread in various fields [21,22,23,24,25]. Yuhao Huang et al. [26] took a wind turbine drivetrain as a research object and combined the K-means clustering algorithm to verify that dynamic working conditions can more accurately reveal dynamic characteristics. Drawing on this idea, this paper takes the hydraulic disc brake of commercial vehicles as the research object, and introduces dynamic working conditions into the analysis of braking drag mechanism. The specific technical route is as follows:
- (1)
- Combined with the statistical analysis of user operational fault data, piston sliding resistance is identified as the core factor leading to insufficient piston retraction, and the dynamic model of the commercial vehicle brake system is established through the Simcenter Amesim 2020.1 software;
- (2)
- Based on fluid mechanics and contact mechanics, combined with the return mechanism and force-bearing state of the brake piston, a dynamic model for braking drag mechanism analysis is established.
- (3)
- From the perspective of fluid–structure interaction in the seal contact area, a dynamic coupling model of the drag mechanism is established, and typical braking conditions are extracted from extensive user operational data through the K-means clustering algorithm.
- (4)
- The time-history data of piston velocity and sealing pressure output by the dynamic model of the commercial vehicle brake system are taken as the input of the dynamic coupling model of the drag mechanism in order to solve the reciprocating friction force, retraction displacement of the piston and system drag torque under different working conditions.
- (5)
- Taking the drag threshold specified in industry standards as the evaluation index, the types of working conditions prone to induce braking drag are determined and the occurrence mechanism of disc brake drag is revealed, which provides theoretical support for the optimal design of brake systems.
2. Dynamic Model of Disc Brake System and Factors Inducing Braking Drag
A dynamic model of the disc braking system is established to obtain its dynamic response, which will be employed as actuation conditions to analyze braking drag. A mechanical analysis model of the disc brake is established to theoretically deconstruct the various forces that generate drag torque and a statistical analysis of user operational data is performed to identify the core cause of brake drag from among the theoretical factors that generate drag torque.
2.1. Dynamic Model of Disc Brake System
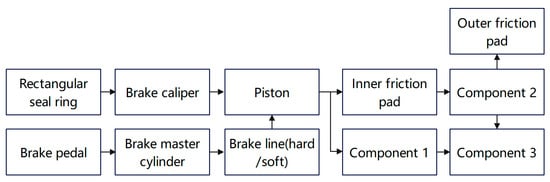
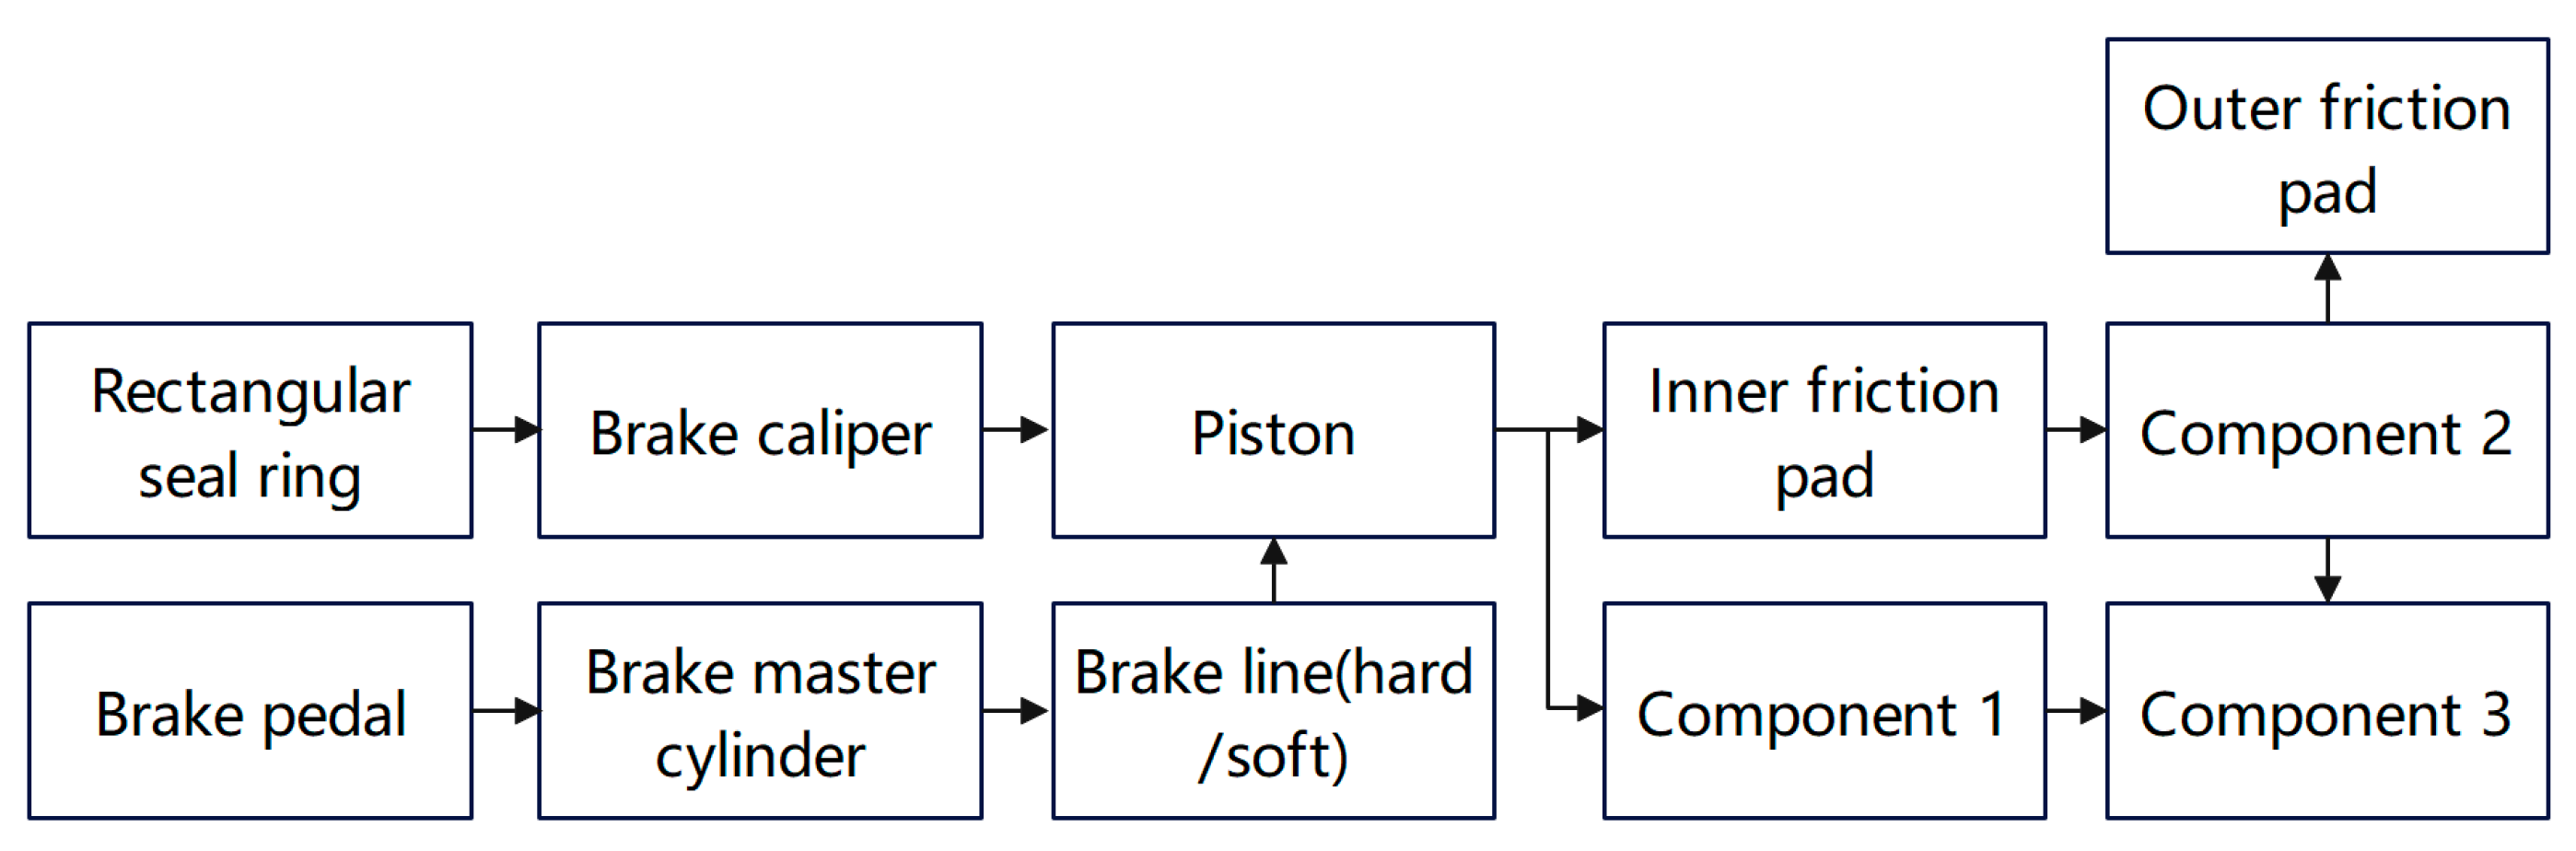
Simulations were conducted using the existing dynamic model of the disc braking system from the research group [27]. Figure 1 is a simplified schematic diagram of the dynamic model of this disc brake system, which is used to simulate the entire brake transmission process from the pedal to the brake [28]. The braking force is transmitted along the path of the pedal, master cylinder piston, brake lines, brake piston, and finally to the friction pads to achieve vehicle braking.
Figure 1.
Dynamic model of disc brake system (Component 1. Module for simulating caliper deformation; Component 2. Module for simulating contact force, clearance, and wear; Component 3. Module for calculating braking torque).
In the model, the main parts of the brake system are employed and simplified. Explanations are provided as follows:
- (1)
- The brake master cylinder is simplified to a single-chamber type, with its main function being to generate brake fluid pressure.
- (2)
- The brake lines are categorized into hard and soft types. The brake fluid pressure causes deformation in the soft lines during transmission.
- (3)
- The rectangular sealing ring in the brake wheel cylinder is modeled as a suitable spring to simulate its return action.
- (4)
- Component 1 is designed to simulate caliper deformation. That is, the brake caliper is divided into two identical mass blocks connected by a spring; the stiffness of the brake caliper is simulated using the spring to model the brake caliper’s deformation.
- (5)
- Component 2 is designed to simulate the contact force, clearance, and wear of the brake. The single-side brake clearance is set to 0.12 mm. When the friction pad’s displacement exceeds this clearance, the pad makes braking contact with the disc, and the contact stiffness is simulated using a spring to calculate the contact force. The wear of the friction pads can be simulated by adjusting the brake clearance.
- (6)
- Component 3 is employed to calculate the braking torque of the brake, which takes the contact force from Component 2 as an input.
This model takes pedal speed and brake fluid pressure as inputs to obtain the piston’s motion speed and sealing pressure. The model parameters of the brake system model are shown in Table 1.
Table 1.
Parameters of the brake system model.
2.2. Mechanical Analysis of Braking Drag
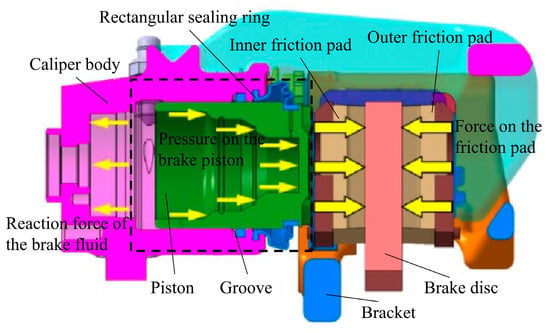
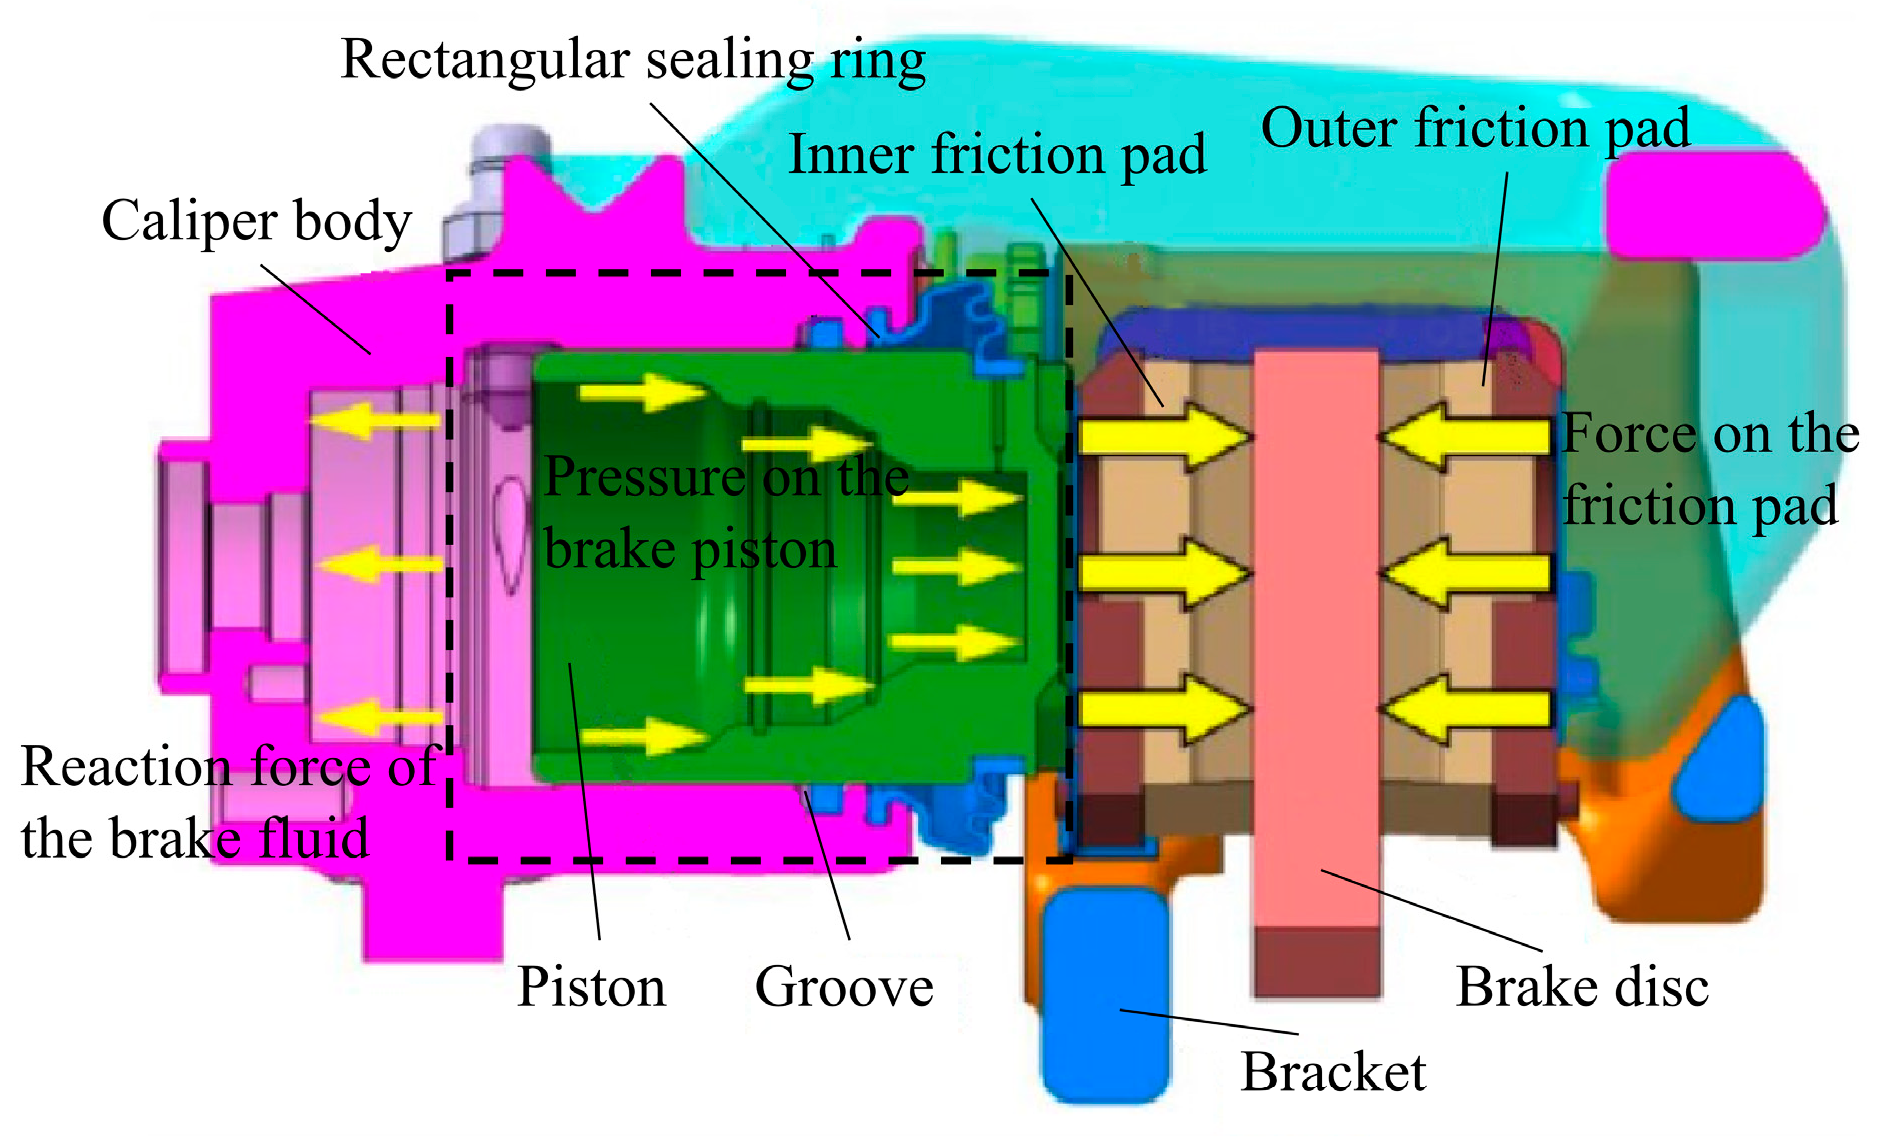
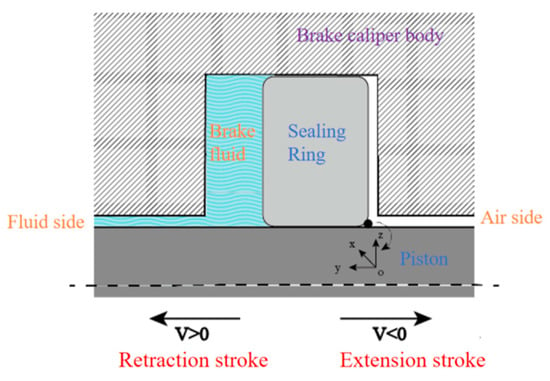
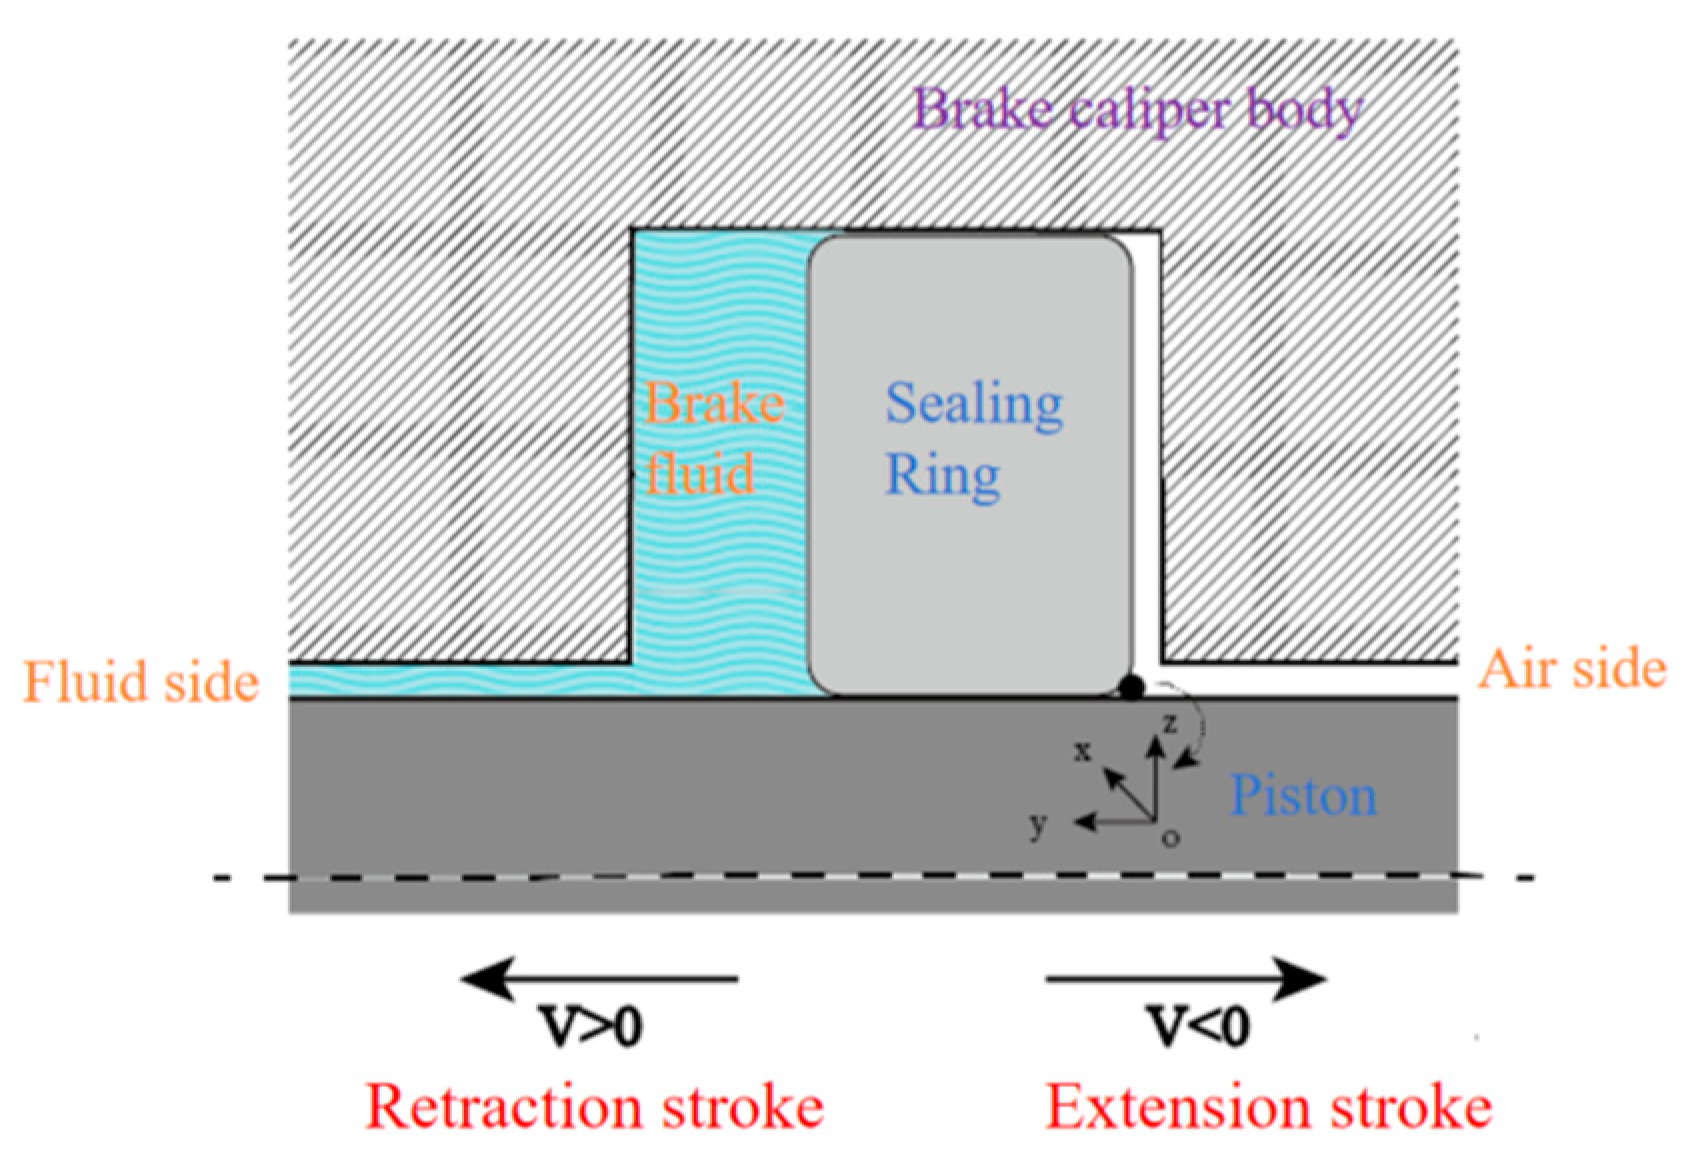
The mechanical analysis model is employed to analyze the various forces that cause brake drag and their interrelationships, in order to determine the key factors that produce drag torque. The structural diagram of the disc brake, including the brake wheel cylinder, is shown in Figure 2. The brake wheel cylinder consists of components such as cylinder body, piston, return spring, and sealing ring. Among them, cooperation between the piston and the sealing ring is crucial for achieving sealing and brake fluid pressure transmission. The area within the dashed box is the sealed contact area formed by the piston and the rectangular sealing ring.
Figure 2.
Structural diagram of disc brake.
The braking process includes an extension stroke and a retraction stroke, and the retraction is driven by the restoring force. The restoring force of the brake piston comes from the elastic deformation of the sealing ring, and its retraction capability is related to static and dynamic sealing mechanisms [29,30]. If the frictional force on the piston is greater than the restoring force provided by the sealing ring, the friction pad and the brake disc will remain in continuous contact, generating residual resistance, which in turn creates drag torque, causing braking drag [31].
To identify the main influencing factors of brake drag at the macro-mechanical level, a simplified calculation model based on the classic Coulomb dry friction law is established, which is only applicable to the qualitative analysis of the formation mechanism of brake drag torque at the macro-vehicle level of the disc brake. Drag torque can be expressed as the residual braking torque between the friction pad and the brake disc [10], as shown in Equation (1):
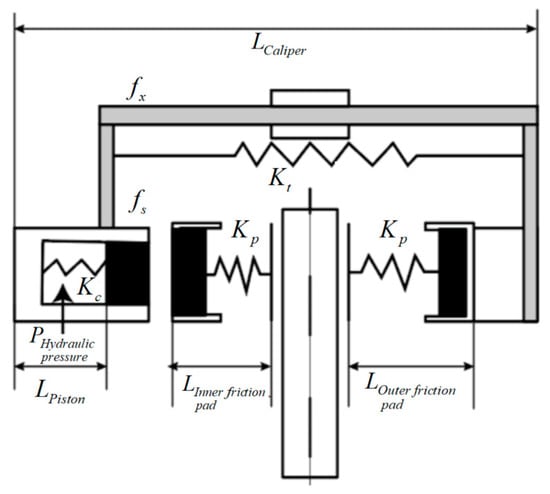
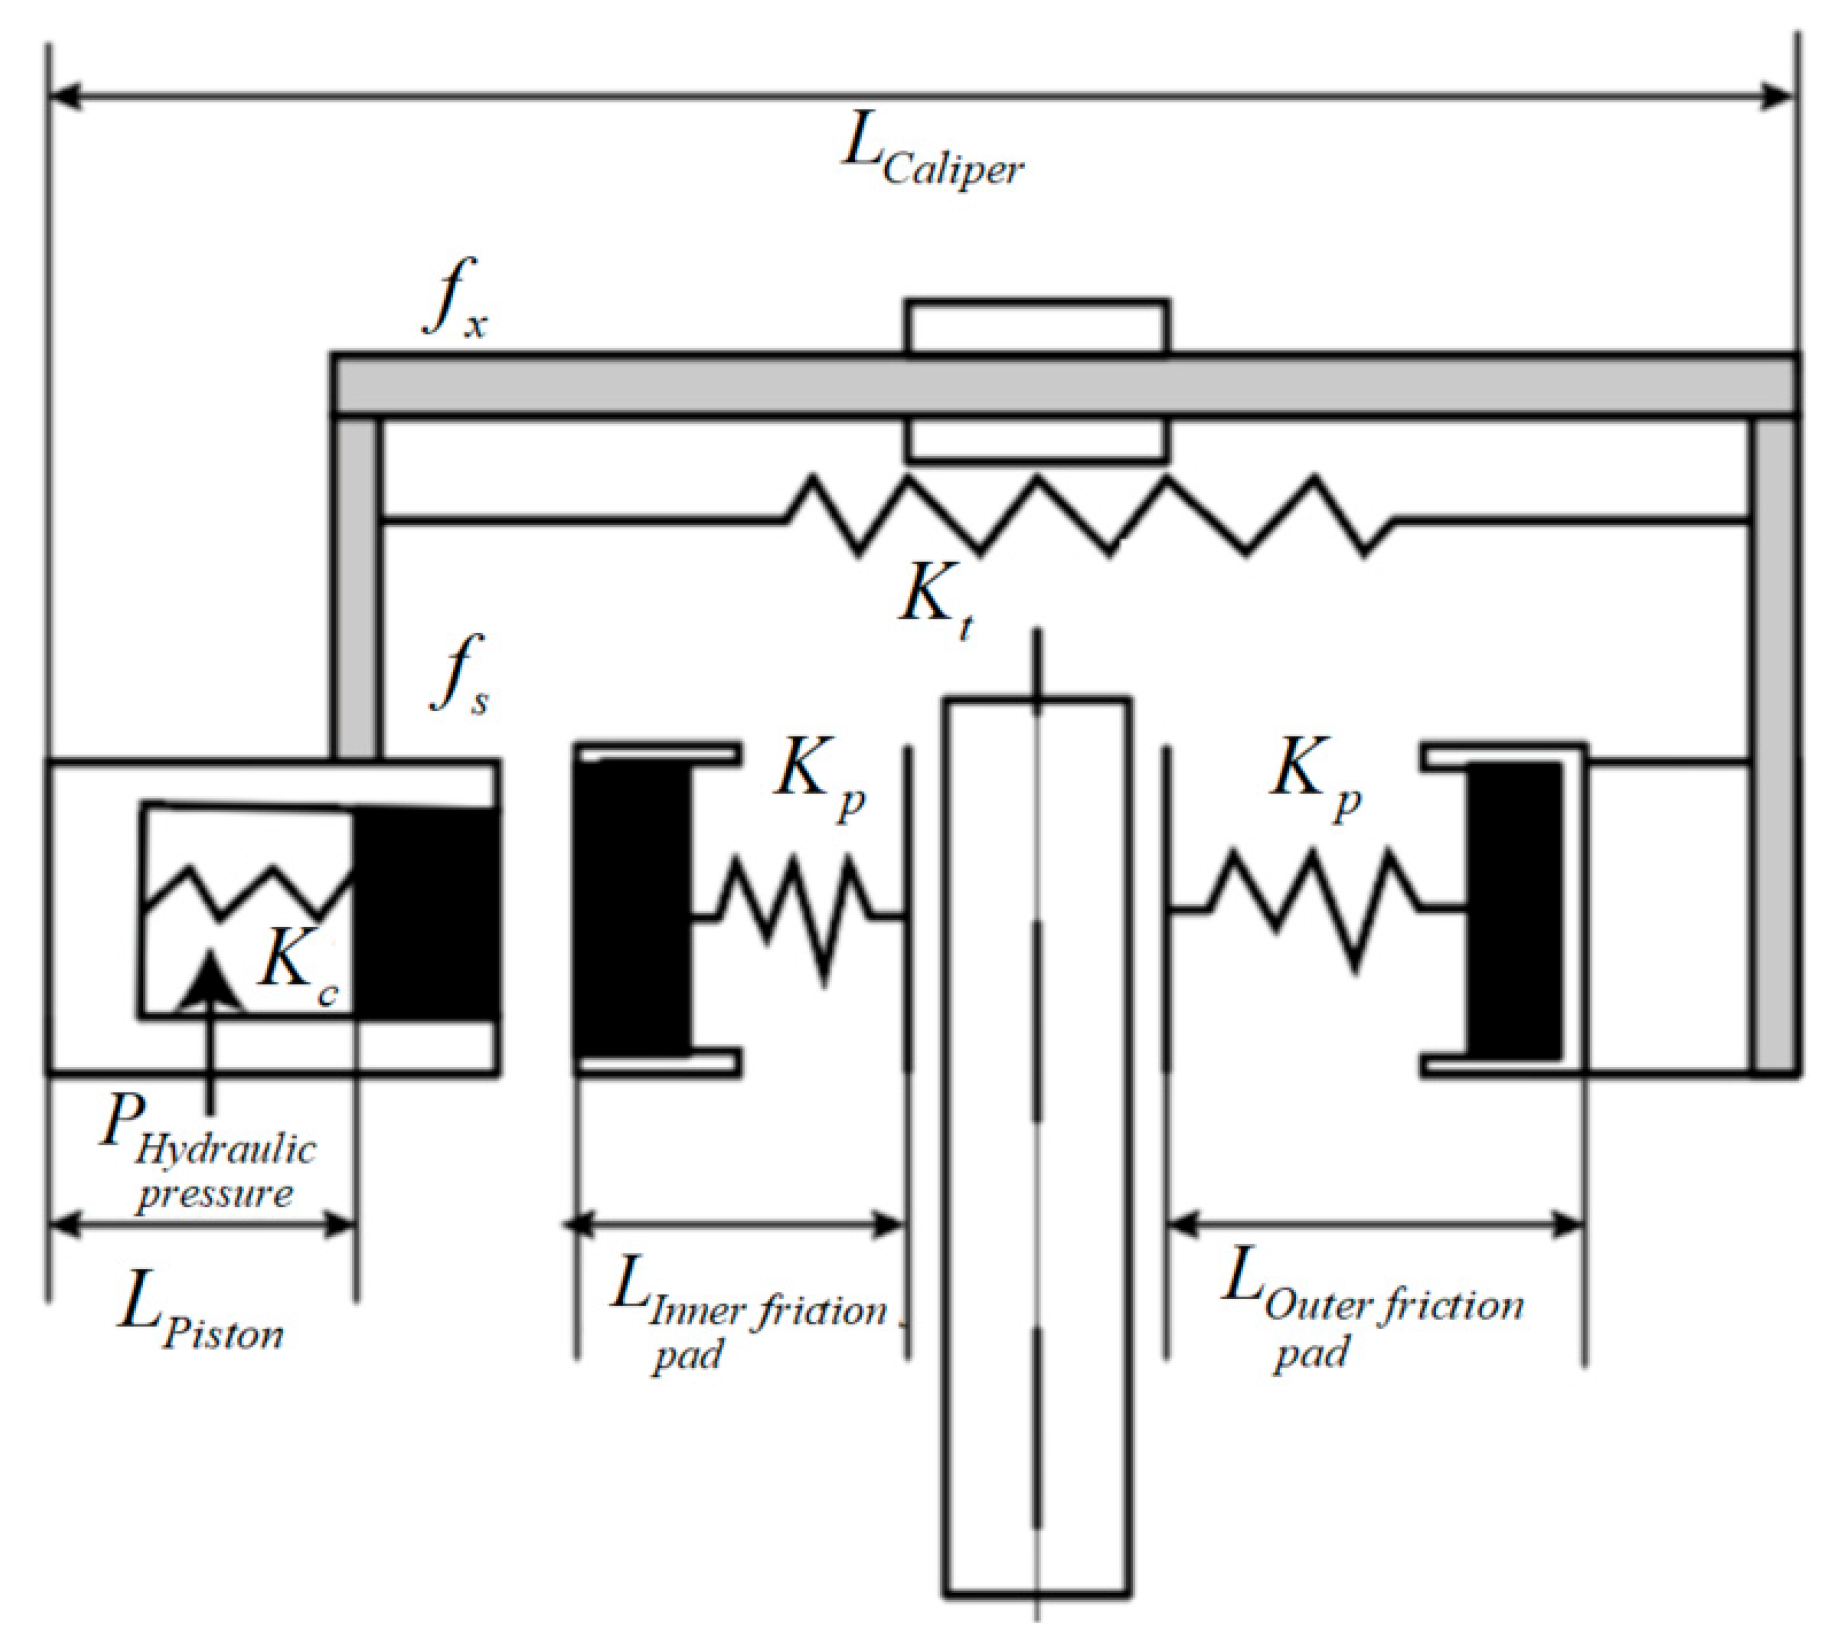
where Fμ denotes the residual friction force, Re denotes the effective braking radius, μ denotes the friction coefficient, and Fs denotes the normal force between the friction pad and the brake disc. Based on the drag torque calculation formula and the brake’s working process, the mechanical analysis model for the disc brake is established according to Figure 2, as shown in Figure 3.
Figure 3.
Mechanical analysis model of disc brake.
The stiffnesses of various components are represented using spring stiffness. Kt, Kc, and Kp denote the stiffnesses of the caliper, sealing ring, and friction pad, respectively; fs denotes the sliding resistance of the friction pad in its groove; and fx denotes the sliding resistance of the guide pin. During braking, Lcaliper denotes the elastic deformation of the brake caliper; Lpiston denotes the elastic deformation of the rectangular sealing ring caused by piston movement; and Lpad denotes the elastic deformation of the friction pad.
When the brake is released, the residual normal force between the friction pad and the brake disc consists of the residual elastic force from component deformation and sliding resistance, as shown in Equation (2):
where denotes the residual elastic force, denotes the piston retraction, denotes the caliper deformation, denotes the pad deformation.
The key parameters used in the mechanical analysis model for brake drag torque are shown in Table 2.
Table 2.
Key parameters of the mechanical model for brake drag torque.
2.3. Factors Inducing Braking Drag
Through statistical analysis of the user operation data from a certain type of commercial vehicle disc brake, the core fault modes of the target vehicle’s brakes and the key inducements of brake drag can be clarified, providing statistical support for subsequent mechanism modeling. The brake fault feedback data used were provided by the manufacturer’s after-sales service department, covering the periods from December 2020 to January 2021 and from August 2021 to September 2021 and including the driving fault feedback data of 446 light commercial vehicles on urban roads.
To ensure the objectivity and reliability of the statistical fault results, this paper introduces reliability engineering theory to carry out distribution fitting verification of the fault interval mileage of brake drag. The two-parameter Weibull distribution is adopted to fit the fault interval mileage, and the rationality of the distribution fitting is verified by Pearson χ2 tests [32,33,34]. Through calculation, the Mean Time Between Failures (MTBF) of brake drag faults in the target vehicle is 19,900 km, which is highly consistent with the distribution characteristic of faults related to poor piston return, which are concentrated around 20,000 km in the fault data, fully verifying the effectiveness of the statistical model.
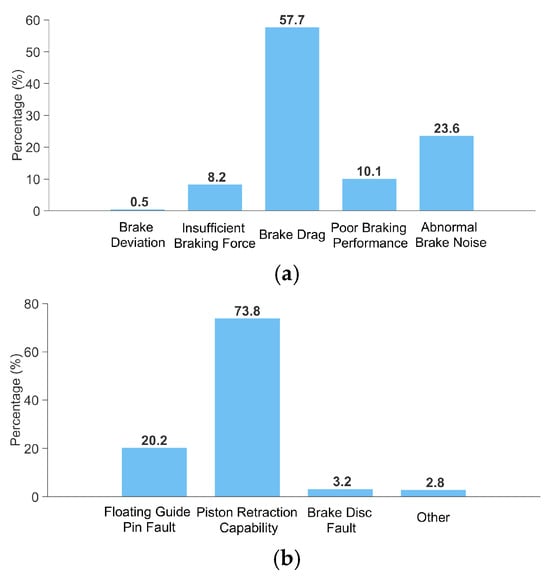
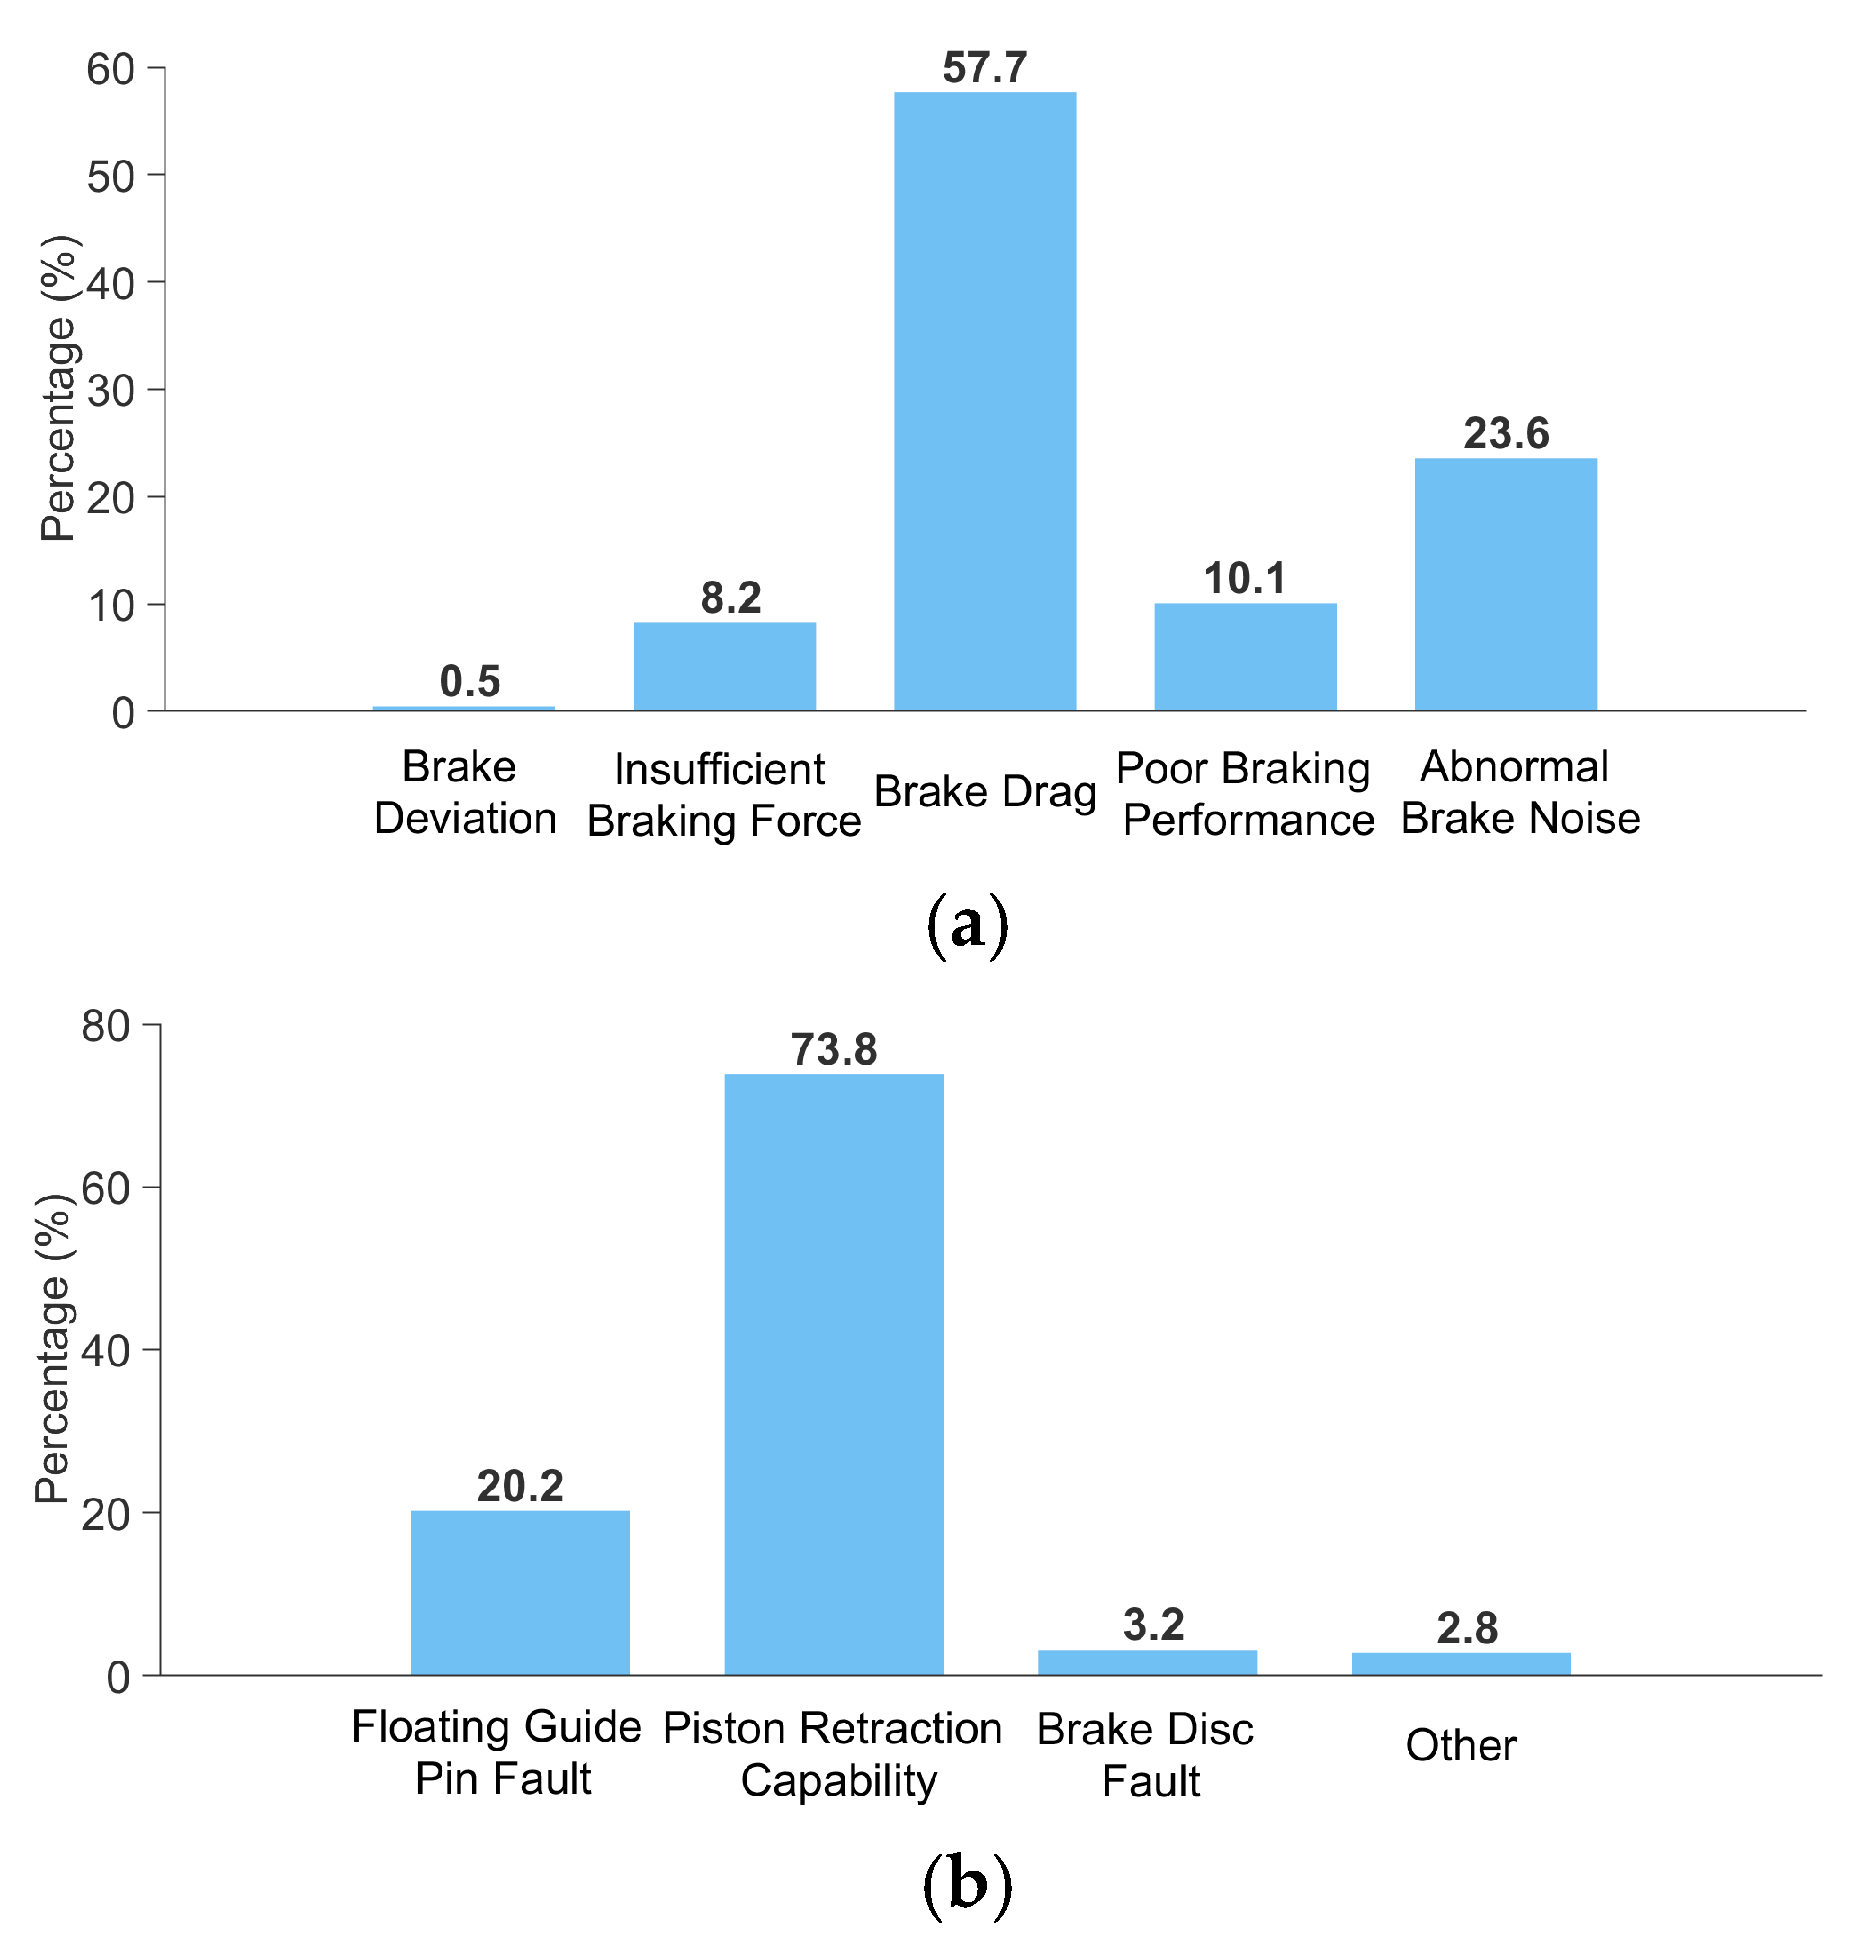
To extract the main influencing factors from the fault information, first, to complete preliminary classification, fault samples unrelated to the disc brake are eliminated according to the fault information records of maintenance stations. Subsequently, the preliminary screening results are standardized and calibrated with reference to the standard definition of brake system faults in QC/T 592-2013 “Performance Requirements and Bench Test Methods for Hydraulic Brake Caliper Assembly” [35]. Finally, disc brake faults are classified into five core modes: brake deviation, insufficient braking force, poor braking efficiency, brake noise, and brake drag. Statistical analysis completed based on the above determination criteria shows that brake drag is the primary fault mode of the target vehicle, accounting for 57.7%, as shown in Figure 4a; floating guide pin failure and poor brake piston return are the two core inducements, accounting for 20.2% and 73.8% of the total brake drag faults respectively, as shown in Figure 4b.
Figure 4.
Statistical results of fault modes and factors inducing braking drag. (a) Statistical results of the proportion of brake fault modes. (b) Statistical results of factors inducing braking drag.
From the mathematical model of drag torque established in Section 2.2, it can be determined that the key variables affecting the residual normal force between the friction pad and the brake disc include: piston return stroke, caliper deformation, friction pad deformation, friction pad sliding resistance, and guide pin sliding resistance. Combined with the fault statistical results in this section, it is further clarified through the factor classification method that insufficient piston return capacity is the primary main controlling factor in the brake drag of the target vehicle, while piston sliding resistance is the core secondary factor leading to poor piston return. To further accurately analyze the generation mechanism of piston sliding resistance, compensate for the limitations of the macroscopic simplified Coulomb friction model in Section 2.2, and quantify the variation laws of piston sliding resistance and return characteristics under dynamic braking conditions, this paper establishes a dynamic model for the sealed contact area in the brake wheel cylinder to carry out research on the brake drag mechanism under dynamic braking conditions.
3. Dynamic Model for Analyzing the Braking Drag Mechanism
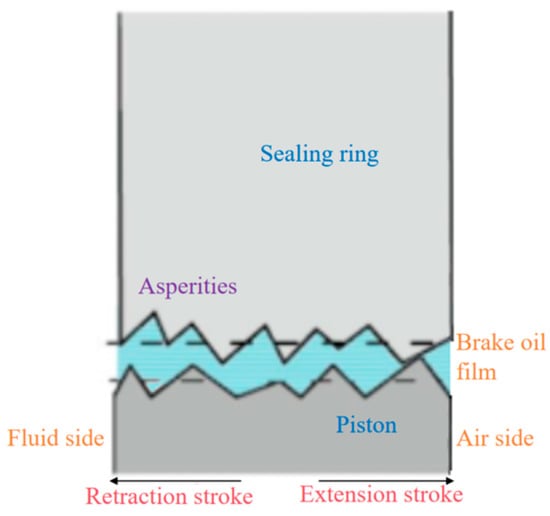
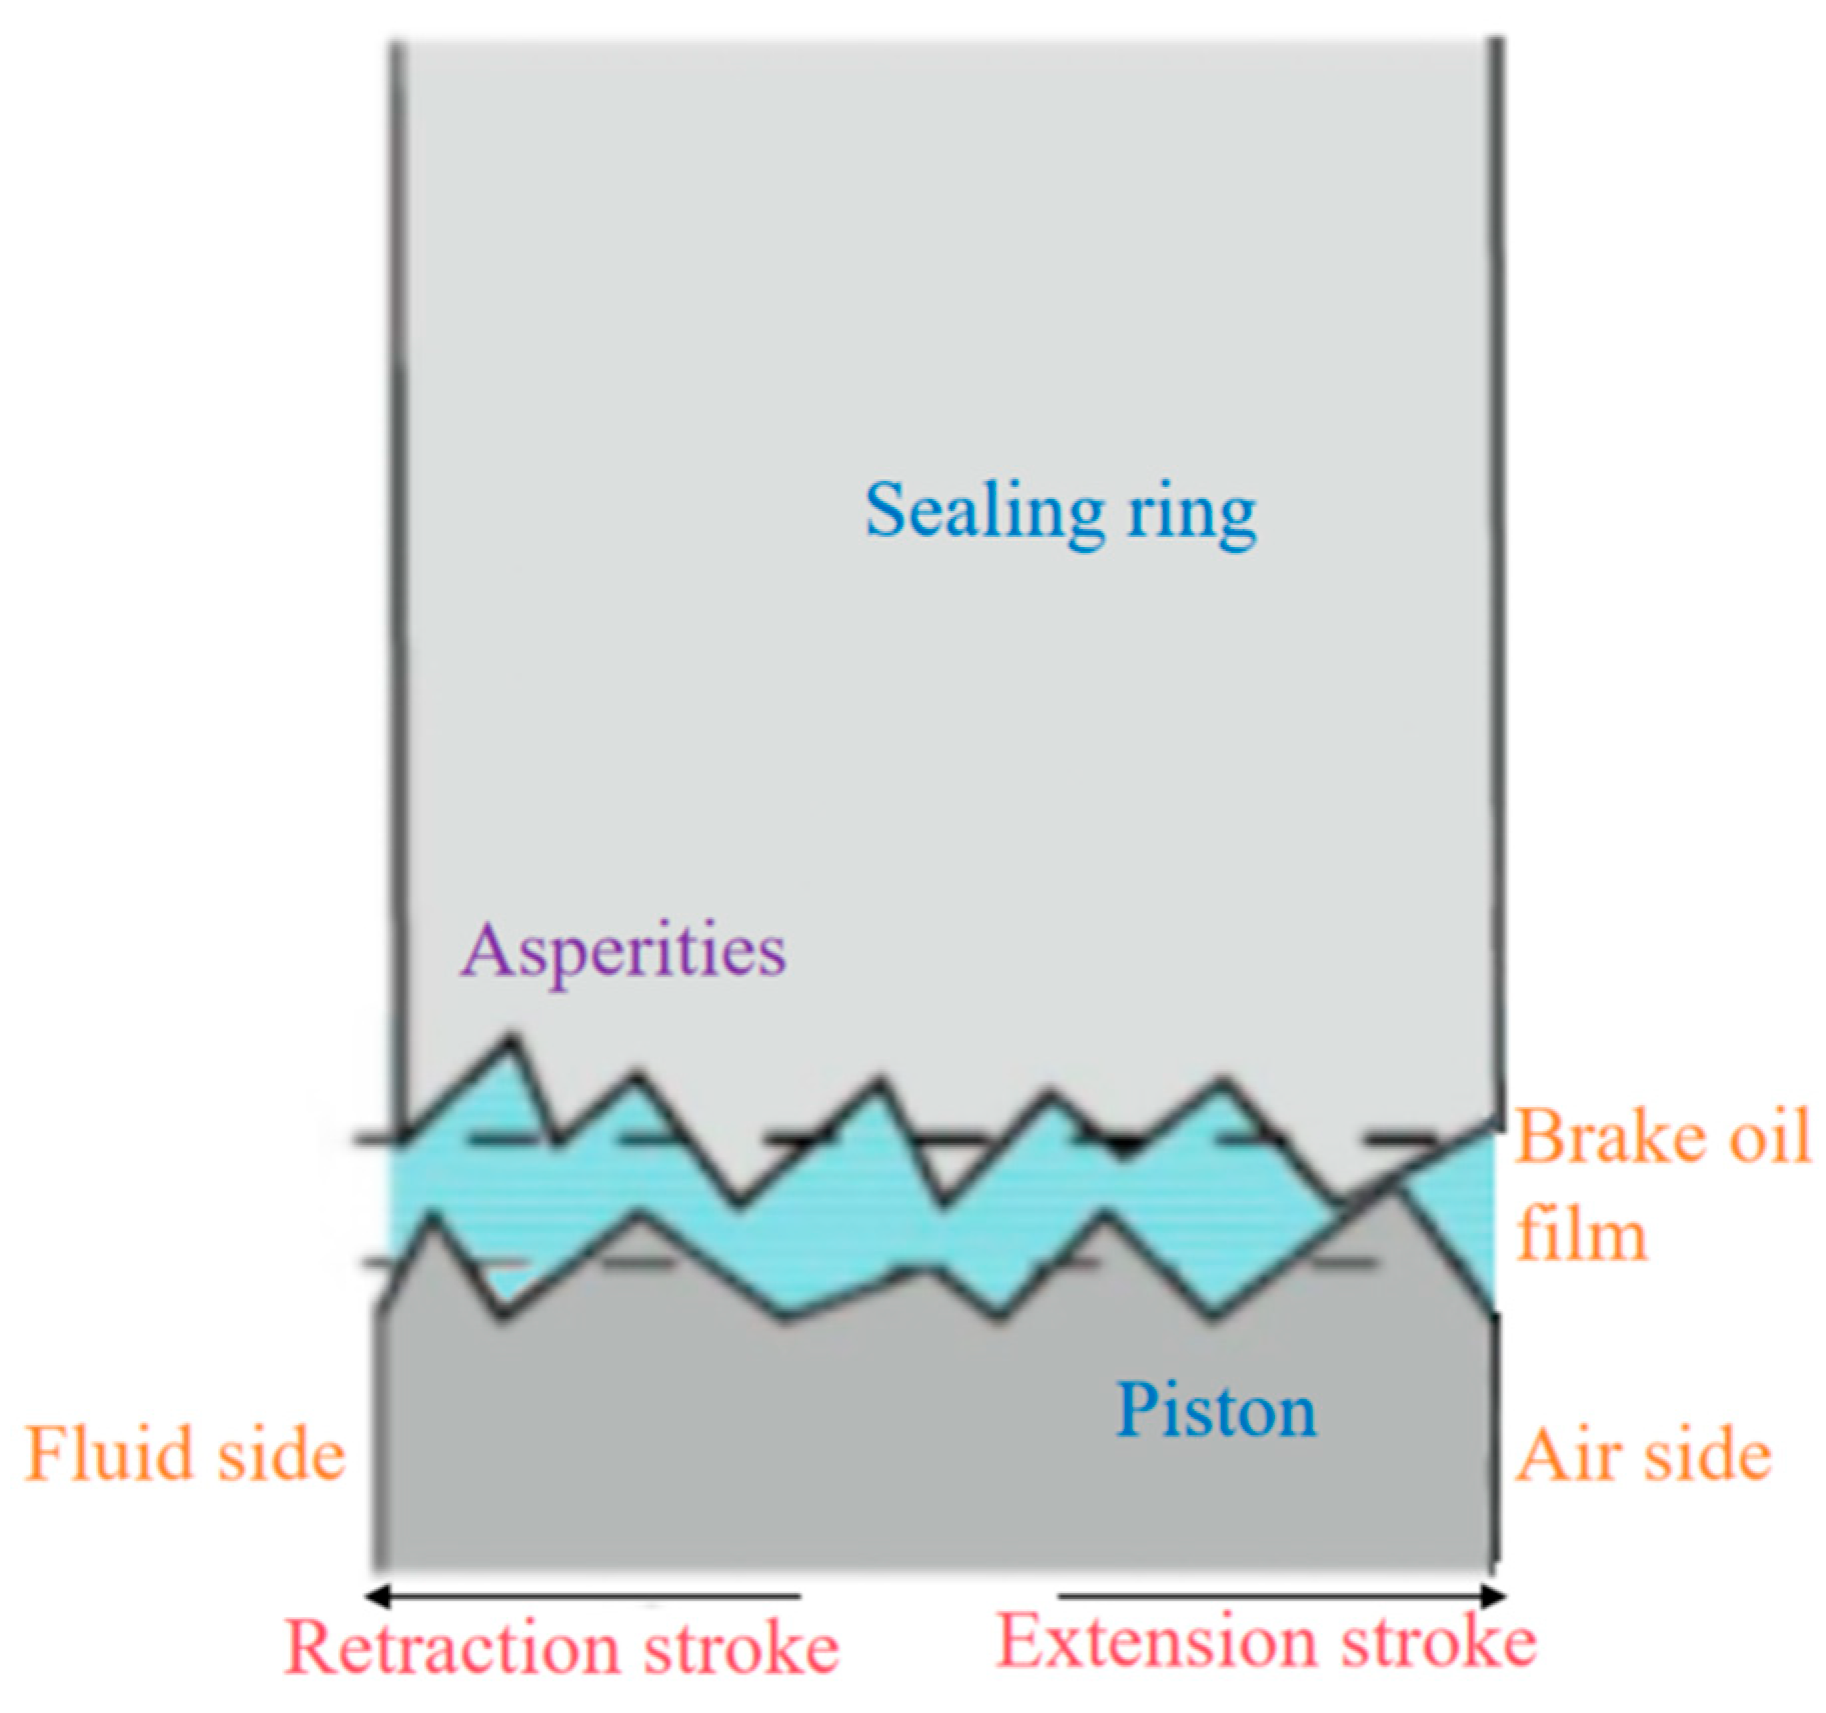
Insufficient piston retraction is directly caused by insufficient piston sliding resistance. In an actual piston sealing system, the sealed contact area is in a state of mixed lubrication, where various forms of wear exist, influenced by the surface roughness of the sealing ring, relative motion speed, oil film thickness, and brake fluid pressure, leading to constantly changing friction. Therefore, focusing on the sealed contact area shown in Figure 5, an accurate dynamic model of brake drag is established from the perspective of fluid–structure interaction to precisely calculate the piston’s motional friction and analyze its retraction capability.
Figure 5.
Sealed contact area of the rectangular sealing ring.
The piston sealing system’s characteristics are primarily determined by the piston, sealing ring, brake fluid, and braking condition parameters. The working condition parameters are extracted from typical braking conditions obtained through a specific clustering method for users’ dynamic braking conditions dataset. The material parameters of the sealing system are shown in Table 3.
Table 3.
Parameters of the wheel cylinder piston sealing system.
The elastic modulus of the sealing ring in Table 3 is expressed as a continuous function E(T) varying with the temperature T, with the expression: E(T) = −0.01364⋅T + 7.1717, applicable to the temperature range of 23 °C ≤ T ≤ 135 °C. This fitting formula is calibrated based on three sets of measured elastic moduli at 23 °C, 30 °C and 135 °C. These temperatures are selected according to the physical properties of the brake fluid and actual braking conditions [36,37]: 23 °C represents the ambient temperature when the vehicle is in a non-braking state; 30 °C corresponds to low-intensity braking; and 135 °C corresponds to high-intensity braking.
To ensure all necessary elements for the analysis are included, the following assumptions are proposed:
- (1)
- The brake fluid in the sealing area is in a laminar flow state, with no relative motion at the surfaces of the sealing ring and the piston.
- (2)
- The thickness of the brake fluid film is on the micrometer scale.
- (3)
- Fluid inertial effects, viscous effects on the inner surface of the sealing ring, and dynamic effects between asperities are ignored.
- (4)
- The density function of the contact surface roughness follows a normal distribution.
- (5)
- The brake disc is assumed to be in an ideal wear-free state, and the macro effect of brake disc/pad wear on braking drag is simulated by adjusting the brake clearance. This simplified treatment assumes uniform wear, ignoring the dynamic evolution of brake disc surface topography, the influence of wear particles, and the degradation of brake fluid lubrication performance caused by wear.
3.1. Coupling Relationship of the Dynamic Model
Gaussian distribution is used to model the roughness profile of the brake piston and sealing ring surfaces. When the brake piston reciprocates within the sealing ring, the interaction between their rough surfaces causes friction and wear [38]. The gap in the contact area is filled with brake fluid, forming a fluid film that provides lubrication. The two aspects are dynamically coupled and jointly affect the contact state of the rectangular sealing ring, as illustrated in Figure 5. Based on the film thickness ratio, the piston sealing system can be considered to be in a state of mixed lubrication, with both boundary lubrication and fluid lubrication coexisting [39]. Changes in the oil film thickness and contact surface roughness affect the sealing ring and piston surfaces, causing micro-elastic deformation in the radial direction. This alters the contact width of the sealing ring, ultimately influencing the friction force in the contact area.
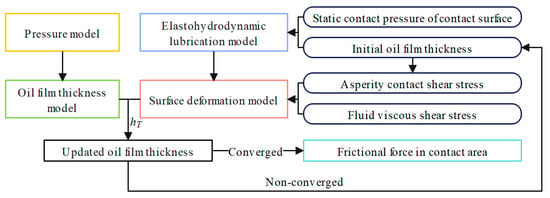
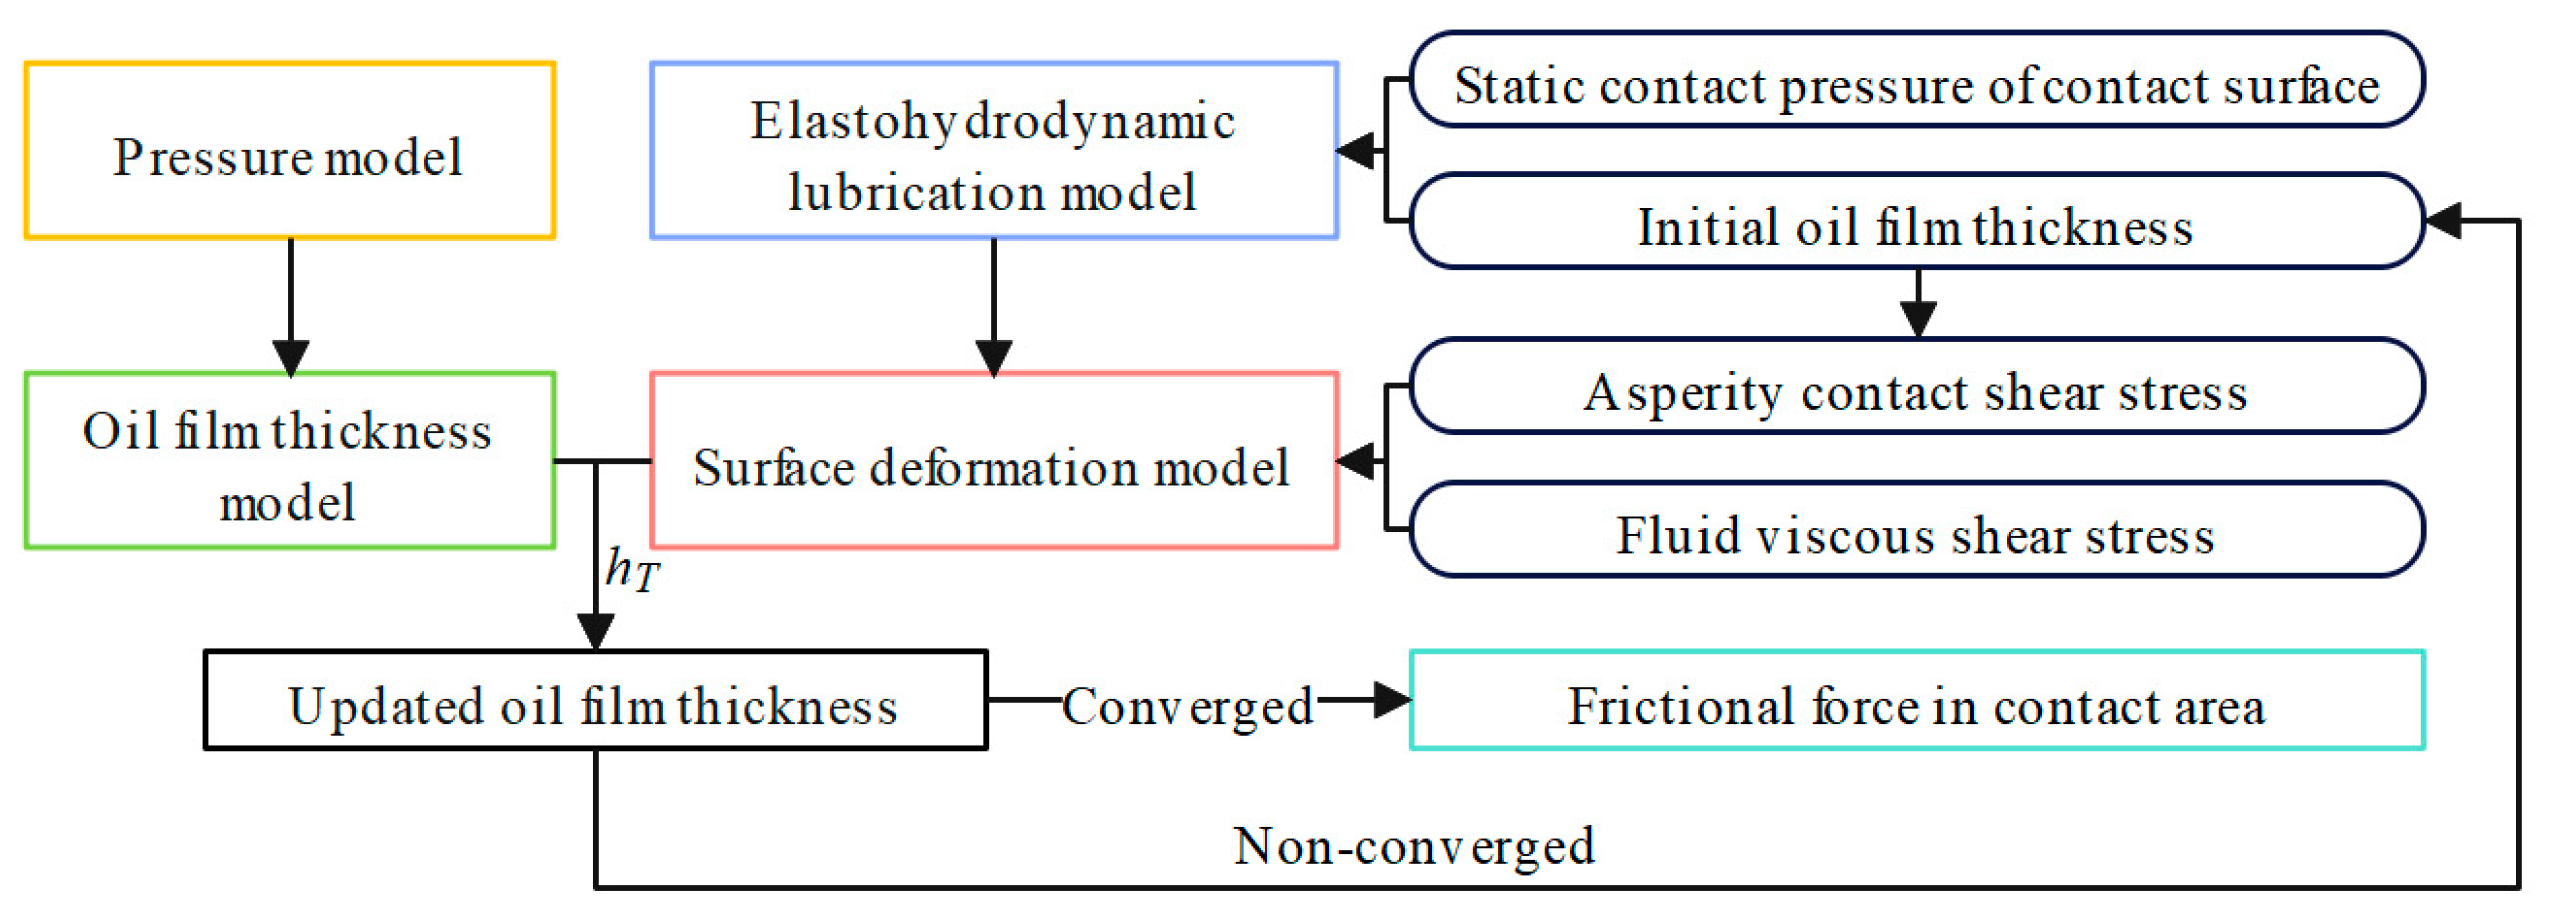
A dynamic model of brake drag is established to analyze its force characteristics, focusing on the sealed contact area between the piston and the sealing ring [40]. This model primarily includes: an elastohydrodynamic lubrication model considering contact surface roughness; a rough surface contact pressure model; a micro-elastic deformation model of the sealing contact surface; an oil film thickness model of the sealing contact surface; and a friction force calculation model for the sealing contact surface. The coupling relationship between these models is shown in Figure 6.
Figure 6.
Coupling relationship of the dynamic model of the brake drag mechanism.
3.2. Elastohydrodynamic Lubrication Model Considering Surface Roughness Topography
In the sealed contact area, a two-dimensional Reynolds equation is constructed to describe the dynamic changes in the brake fluid. The Reynolds equation is used to solve for the oil film pressure, providing a basis for calculating the fluid viscous shear stress and the oil film thickness.
A coordinate system for the sealing system structure is established, with the origin at the intersection of the piston and the extension line of the sealing ring’s air side. The circumferential, axial, and radial coordinates are represented by x, y, and z, respectively, as shown in Figure 7. Then, the Reynolds equation is transformed and non-dimensionalized as follows:
where pcyl is the brake fluid pressure, p is the local static pressure of the sealed fluid, h is the nominal oil film thickness, h0 is the average oil film thickness, W is the contact width of the sealing ring, L is the inner diameter circumference of the sealing ring, V is the relative velocity, η is the brake fluid viscosity, ca and cb are fluid constants, and α is the pressure–viscosity coefficient. The relative velocity is positive when the brake piston is on its retraction stroke and negative on its extension stroke.
Figure 7.
Three-dimensional coordinate system of the sealing structure of the rectangular sealing ring.
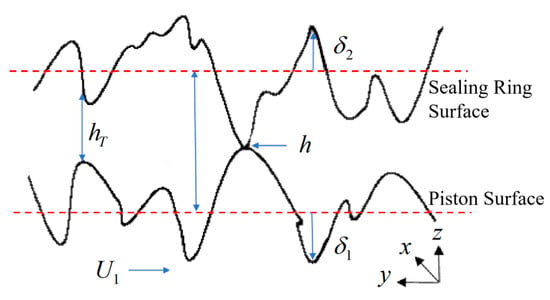
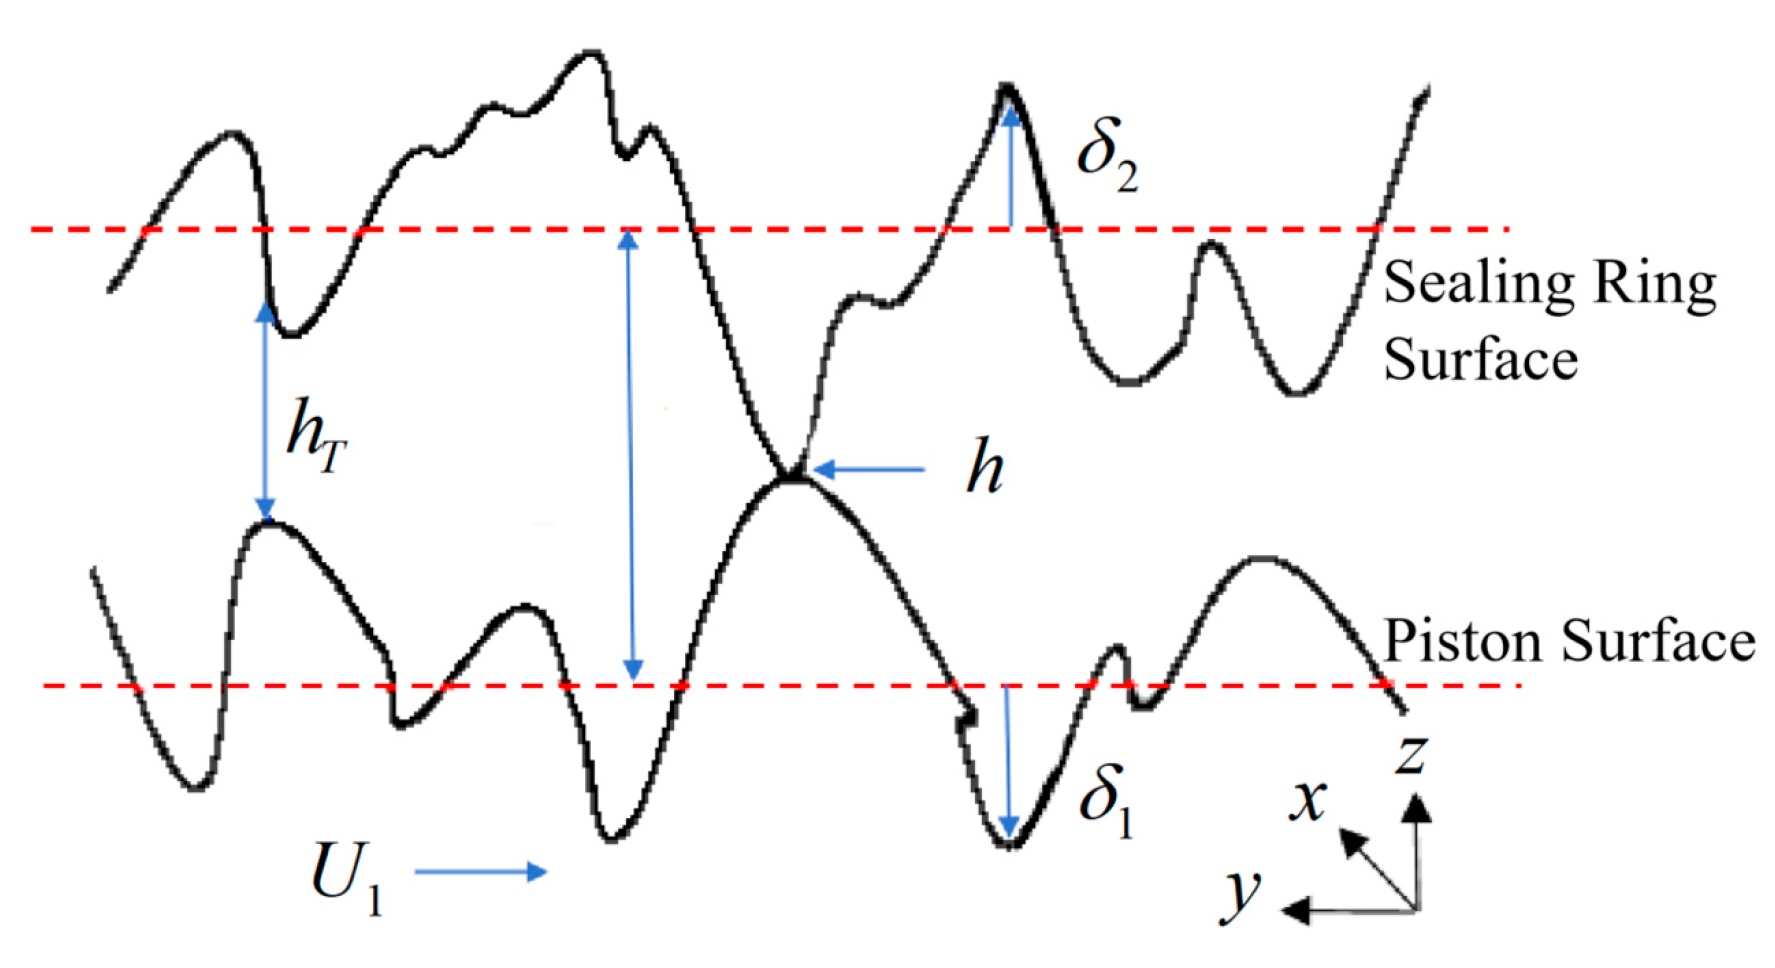
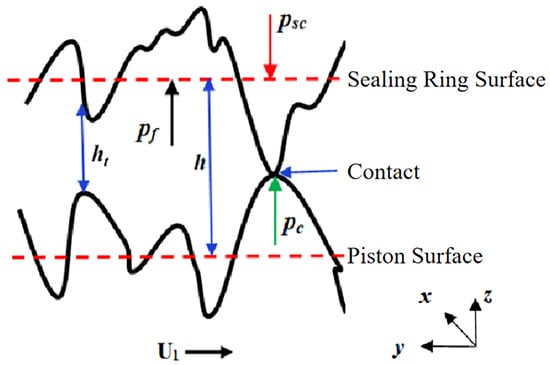
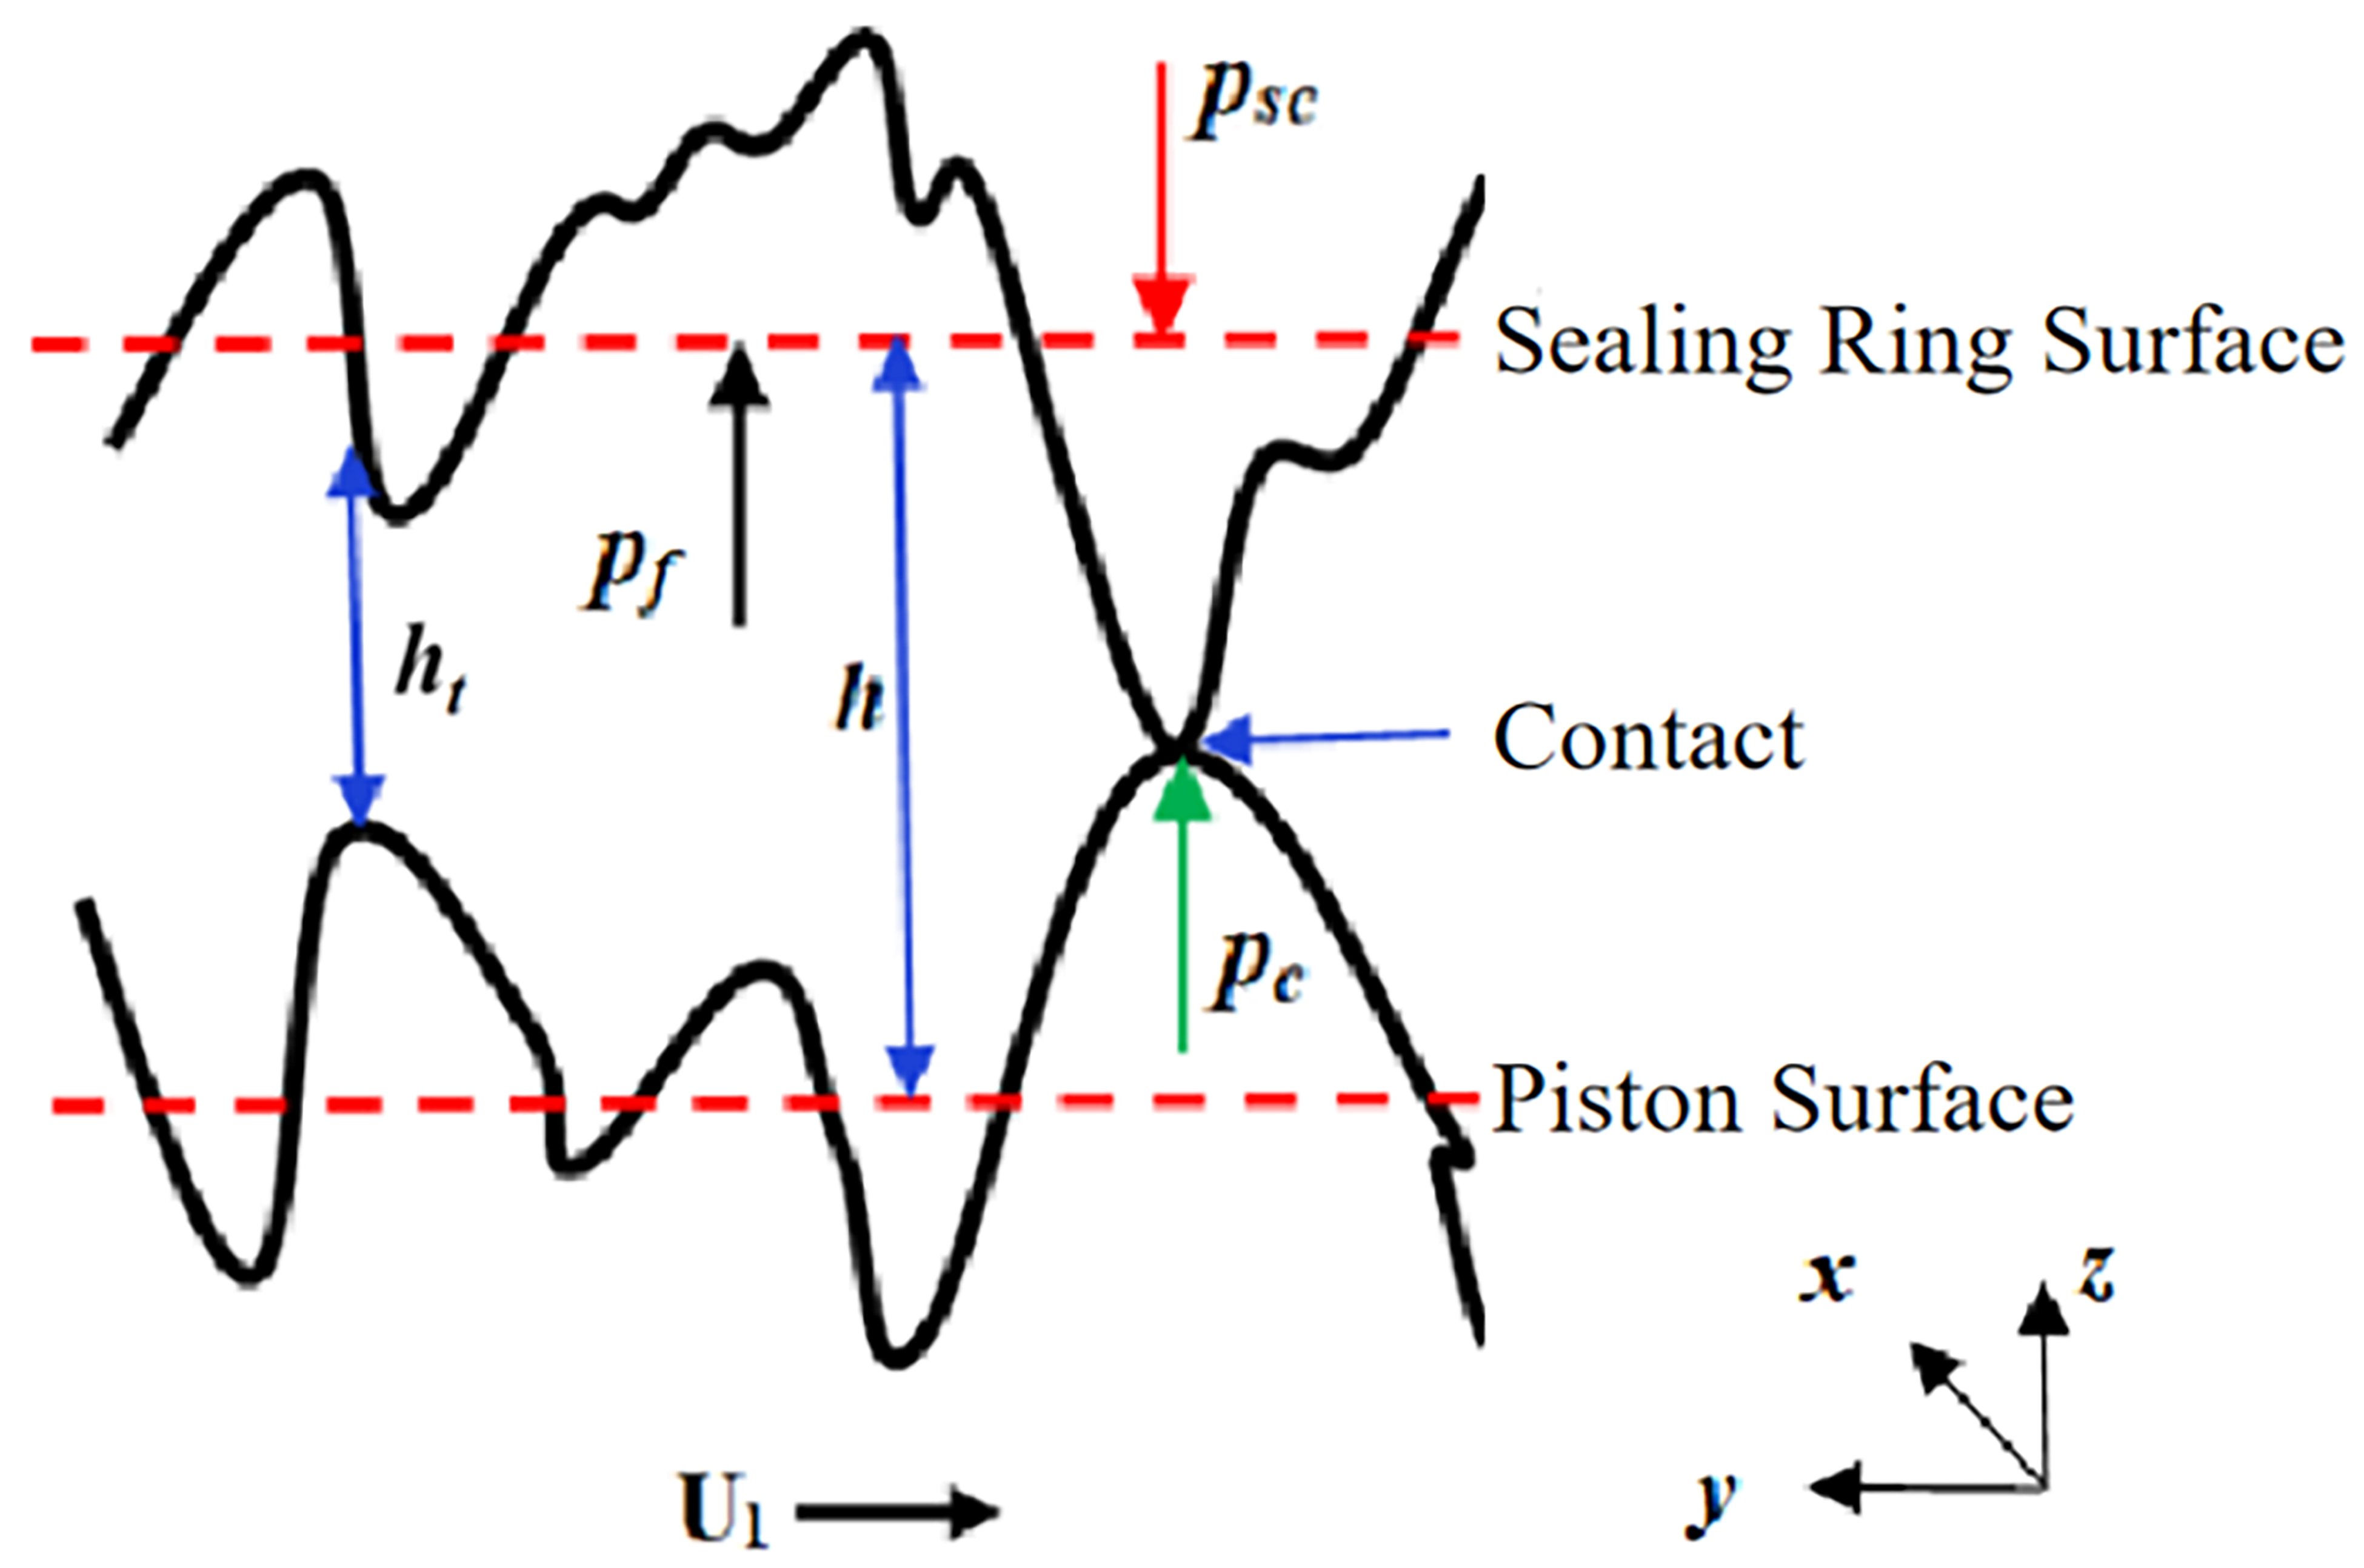
The brake fluid film thickness is affected by the surface roughness. When sliding occurs, the asperities on the rough surfaces undergo contact deformation. The distribution of brake fluid film thickness on the rough surfaces in the sealed contact area is shown in Figure 8.
Figure 8.
Oil film thickness distribution on rough contact surfaces.
In the figure, the distance from the asperity on the sealing ring surface to its baseline is δ1, the distance from the asperity on the piston surface to its baseline is δ2, the distance between the two baselines is the nominal film thickness h, the distance between the two surfaces is the actual oil film thickness hT, and the velocity of the piston surface is U1, which has a value of V. Thus, the actual oil film thickness for the rough surface is
3.3. Rough Surface Contact Pressure Model
The sealed contact area is in a mixed lubrication state. According to mixed lubrication theory [41], when the film thickness ratio is less than 3, the asperities of the two rough surfaces come into contact, generating contact pressure. The G–W contact model is used to calculate the contact pressure, where the piston is treated as an ideal surface. It should be noted that the G–W model is based on the assumption of an isotropic rough surface, which has certain limitations for an anisotropic surface of a directionally machined piston and will introduce a small systematic error into the absolute value calculation of contact pressure. However, this error has a negligible impact on the relative variation law of the interface friction characteristics under different working conditions, which is the core focus of this study. The asperity contact pressure is calculated using this contact model, from which the asperity contact shear stress is derived, providing a basis for calculating the micro-deformation of the sealing ring surface in the next step [42].
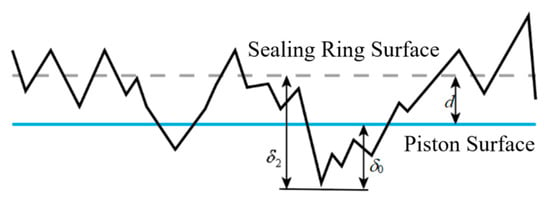
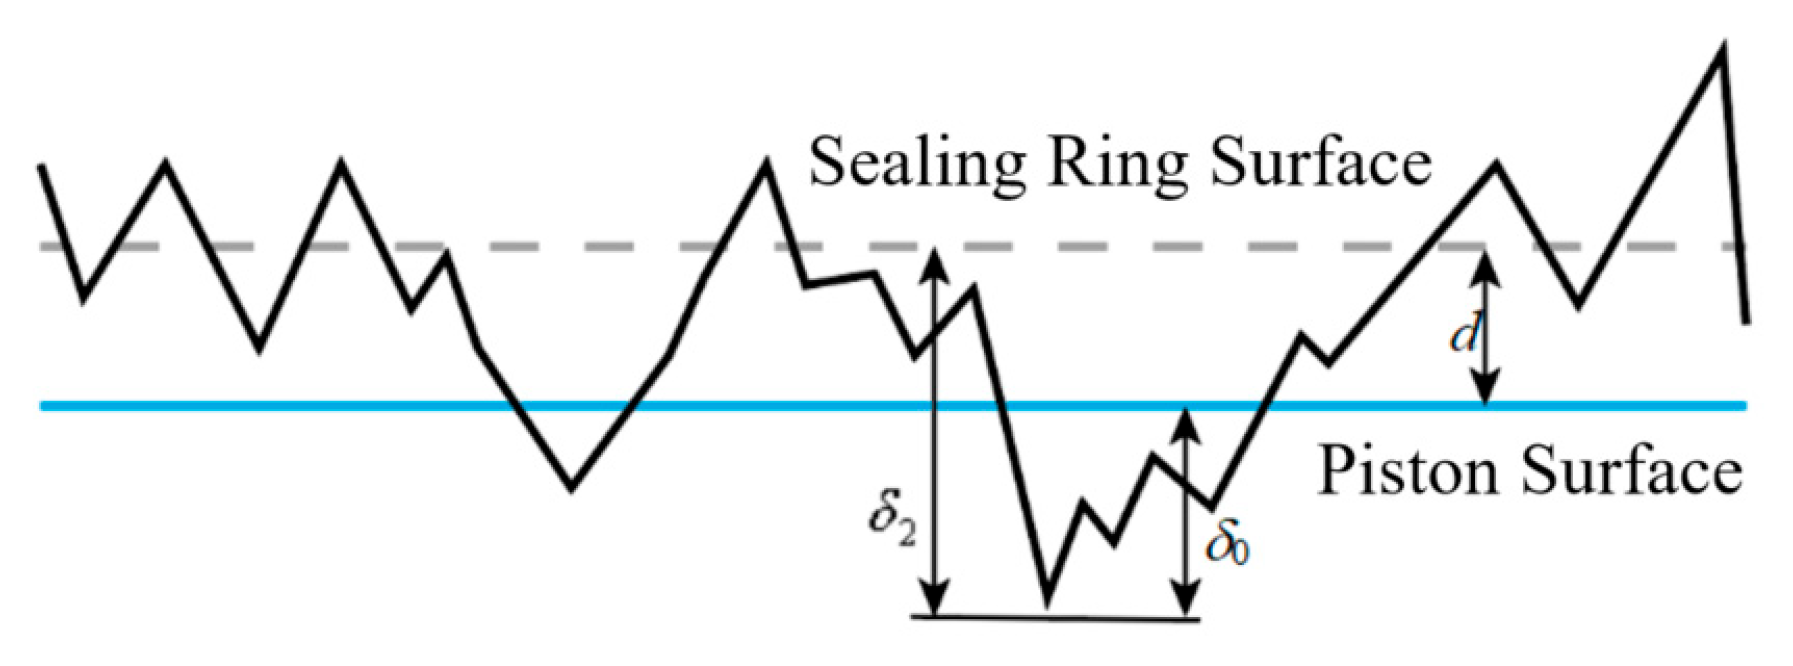
The contact between the rough surface of the sealing ring and the piston surface is schematically shown in Figure 9. The dashed line represents the theoretical sealing ring surface, the solid line represents the piston surface, and the jagged line represents the actual sealing ring surface. δ2 is the distance from an asperity to the sealing ring’s baseline and δ0 is the asperity deformation.
Figure 9.
Contact condition between rough surface of sealing ring and piston surface.
According to Hertzian theory [43], the expressions for the area Ai and contact force Fi of a single deformed asperity are
Subsequently, the asperity contact pressure pc of the sealing ring and the asperity contact shear stress τc are obtained:
where R is the radius of curvature of a single asperity, is the asperity deformation, E′ is the composite elastic modulus, ER and ES are the elastic moduli of the piston and sealing ring, and are the Poisson’s ratios of the piston and sealing ring, σ is the composite surface roughness, , σ1 is the surface roughness of the sealing ring, σ2 is the surface roughness of the piston, and fc is the dry friction coefficient. The negative sign indicates that the direction of the shear stress is opposite to the direction of motion.
3.4. Micro-Elastic Deformation Model of the Sealing Contact Surface
Within the sealed contact area, both the sealing ring and piston surfaces are affected by disturbance pressures from the contact interface, which are caused by oil film pressure and sealing ring roughness. This leads to micro-deformations in the radial directions on both surfaces. In terms of material properties, the sealing ring is the main component undergoing micro-deformation. However, to more accurately solve for the contact surface micro-deformation, calculation of the piston surface micro-deformation cannot be neglected. To calculate the micro-deformations of the hard piston surface and the flexible sealing ring surface based on the properties of the two types of materials, it is necessary to model their deformation mechanisms separately. This provides the initial values for the subsequent oil film thickness calculation.
A rectangular grid is used to discretize the entire sealed contact area, with each node having a unique identifier (i, j). The normal pressure pij at node (i, j) in the sealing area produces an elastic micro-deformation at (k, l):
In Equation (12), is the elastic influence coefficient matrix, representing the deformation at node (k, l) caused by a unit pressure at node (i, j). Its expression is given in Equation (13):
In Equation (13), x′, y′ are the coordinates of the point of force application, and x, y are the coordinates of the point of deformation.
To avoid the issue of the function in Equation (13) being discontinuous at point (x, y), the sealed contact surface is transformed into a rectangular discrete area, as shown in Equation (14):
In Equation (14), a and b are half the width and length of the rectangular element in the calculation domain, respectively, with and .
The expressions for elastic micro-deformation influenced by shear stress are shown in Equations (15) and (16):
Using the principle of superposition for small deformations, the micro-deformations are added to obtain the total micro-elastic deformation of the rough piston surface, as expressed in Equation (17):
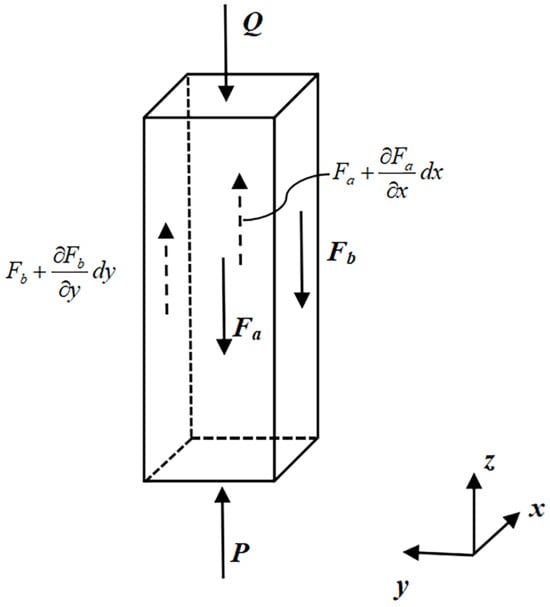
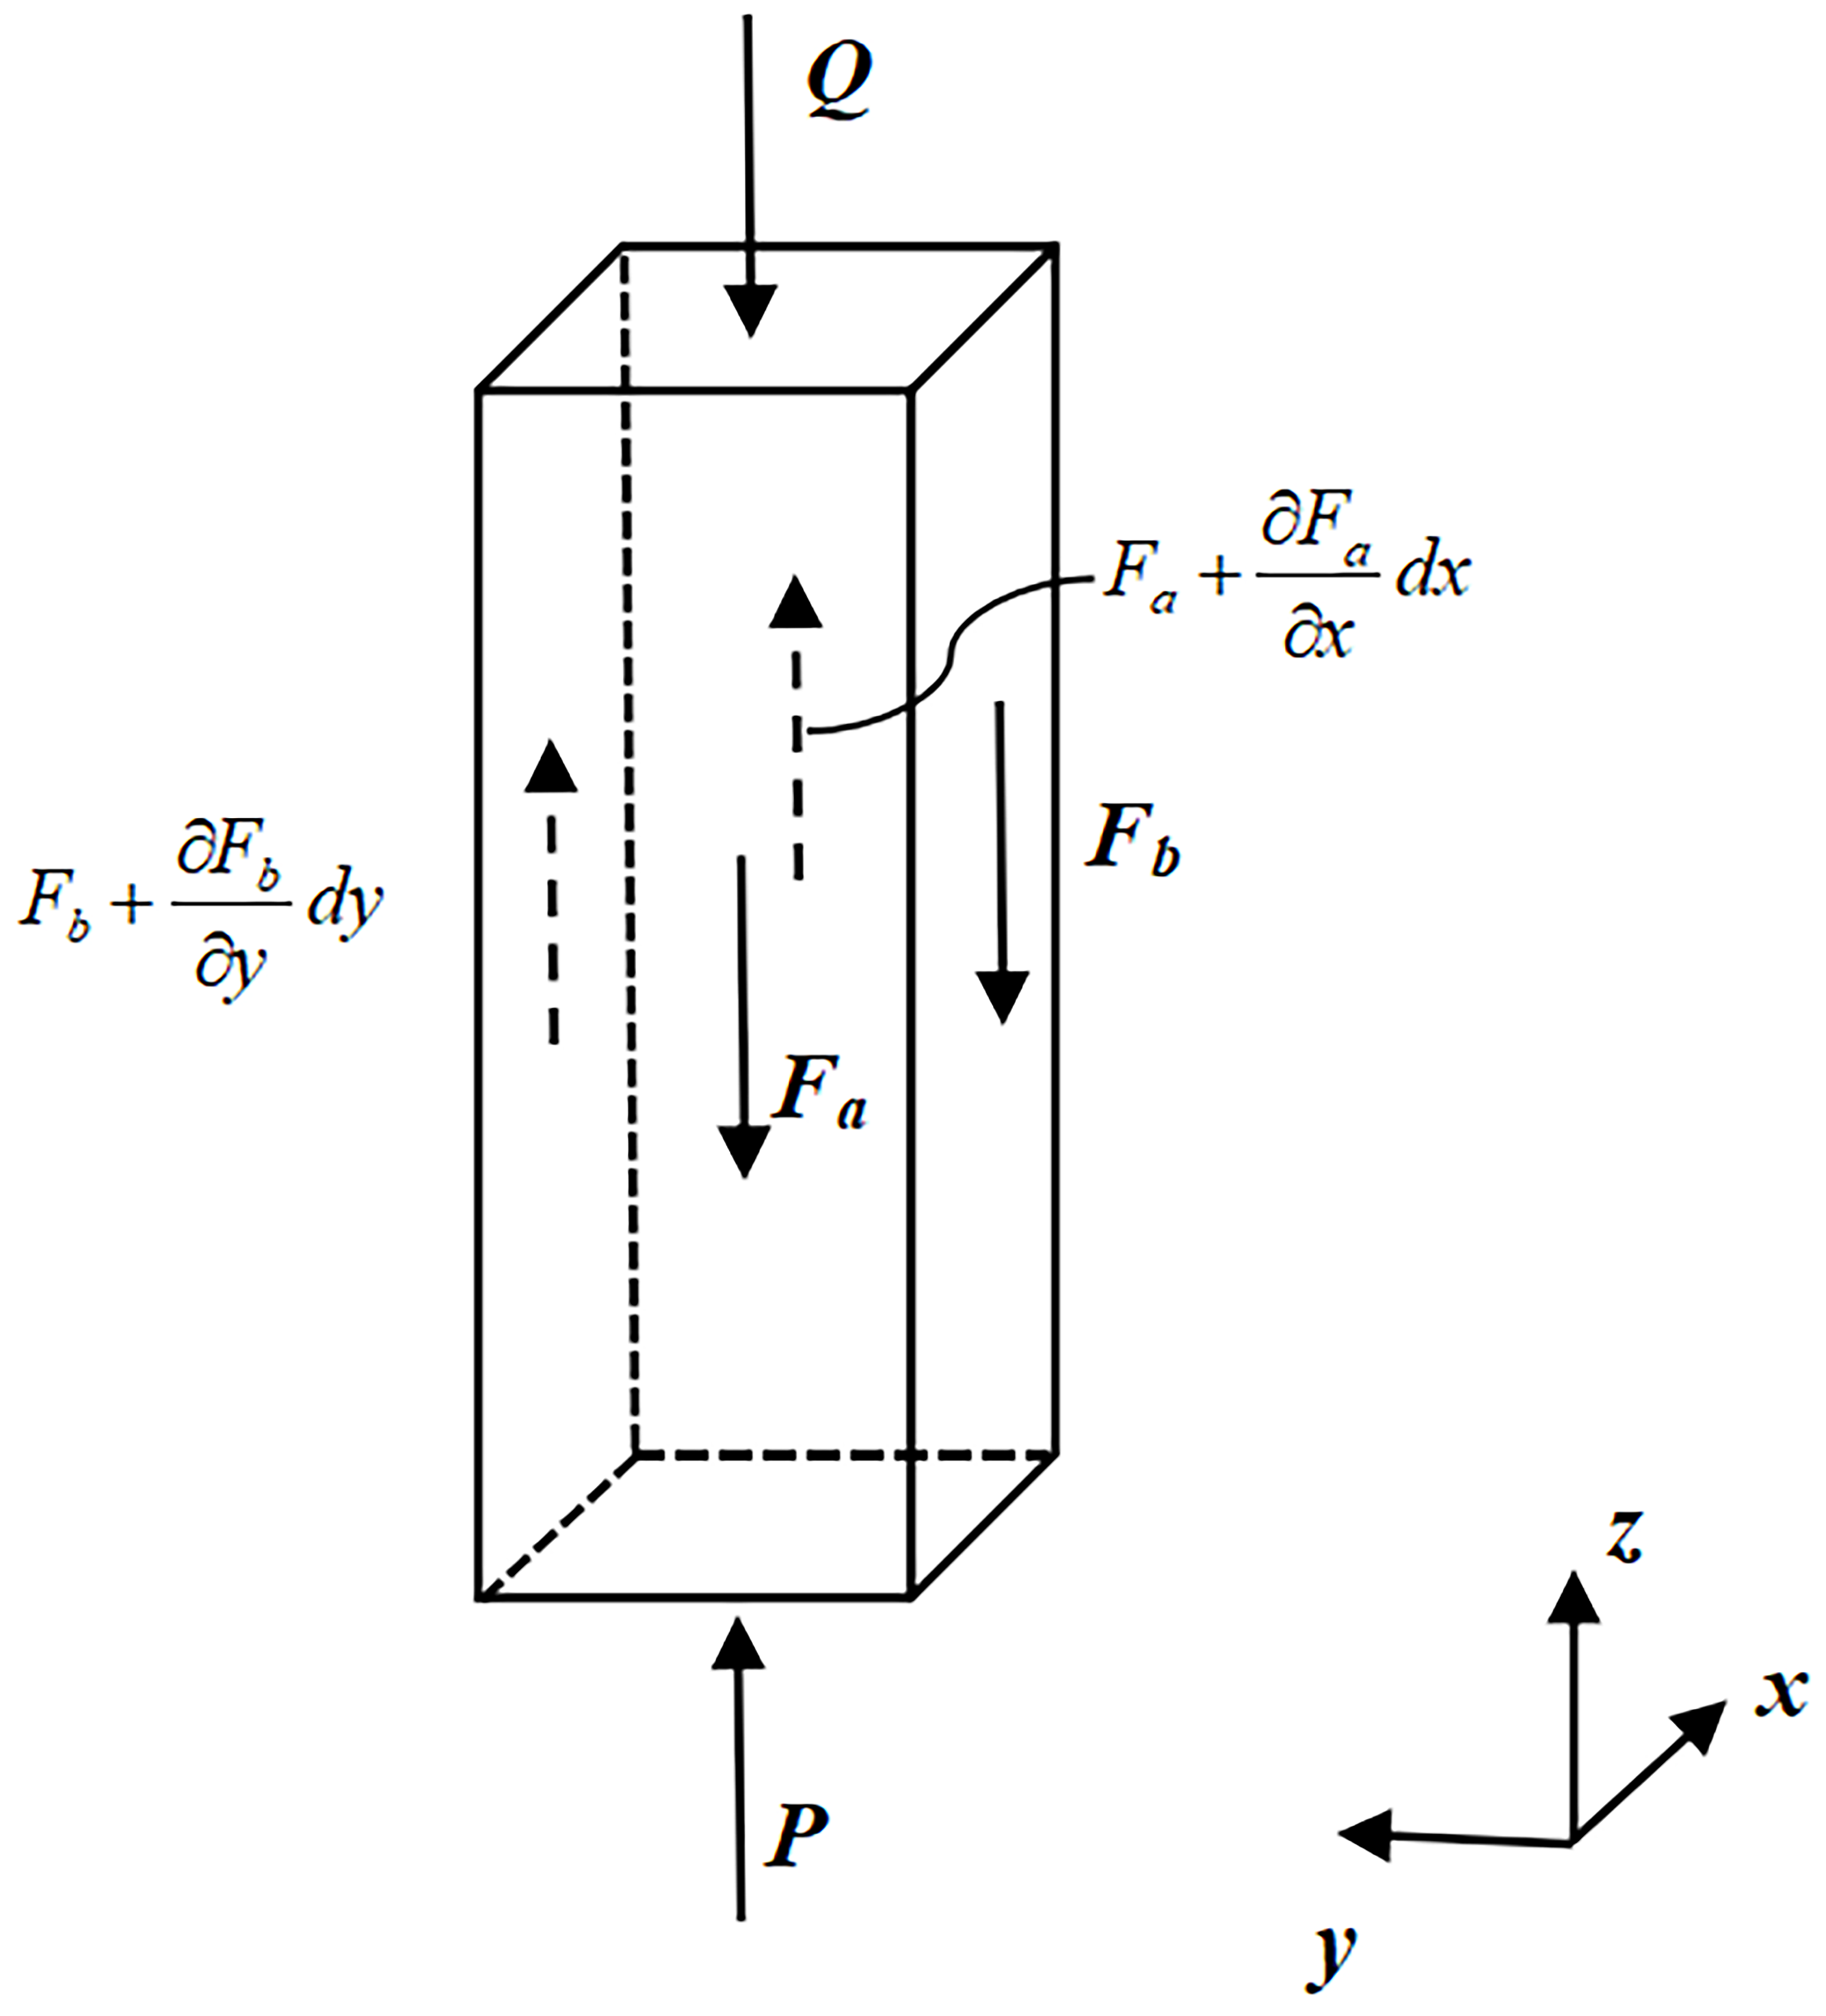
Since the elastic half-space assumption is not applicable to the soft rectangular sealing ring, the main body of the seal is divided into rectangular blocks of size dx × dy × b1 perpendicular to the y-axis. A schematic of the forces is shown in Figure 10. b1 is the thickness of the seal, P is the pressure at the contact between the seal and the piston, Q is the pressure at the contact between the seal and the brake caliper cavity, and Fa and Fb are the shear forces.
Figure 10.
Force condition of micro-unit of sealing ring in contact area.
In Equation (18), Gseal is the shear modulus of the sealing ring, uz is the micro-deformation of the rectangular block surface, and psc is static contact pressure.
In Equation (19), Eseal is the elastic modulus of the sealing ring, μseal is the Poisson’s ratio of the sealing ring, αseal is the thermal expansion coefficient of the sealing ring, Δθ is the temperature difference between the operating and initial temperatures, εy is the circumferential strain of the sealing ring, εz is the vertical strain, and pcyl is the brake fluid pressure.
The equilibrium equation for forces normal to the z-axis is as follows:
In Equation (20), useal is the micro-deformation of the sealing ring surface, Srod is the asperity height on the piston surface, and is the radial elastic deformation of the piston surface caused by brake pressure and temperature, as expressed in Equation (21):
where Drod is the outer diameter of the piston, drod is the inner diameter of the piston, αrod is the thermal expansion coefficient of the piston, is the operating temperature, and is the initial temperature. By introducing the dimensionless variable U = useal/h0 and discretizing Equation (20), the micro-deformation of the sealing ring surface is obtained.
3.5. Oil Film Thickness Model Considering Wear Depth
The oil film thickness and the wear on the sealing ring surface mutually influence each other and tend toward a dynamic equilibrium due to the dynamic coupling of lubrication and wear in the sealed contact area. The calculation of the friction force can proceed after the friction and wear reach a dynamic equilibrium, and the oil film thickness meets the convergence criteria.
A schematic of the forces on the rough surface is shown in Figure 11. The oil film thickness ht is the sum of the initial oil film thickness hs and the asperity deformation hdef after applying force. The oil film pressure pf and asperity contact pressure pc within the sealed contact area are in dynamic equilibrium with the static contact pressure psc.
Figure 11.
Force condition of sealed contact surface.
The expression for oil film thickness is
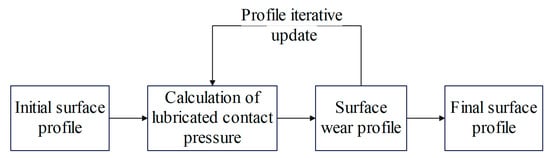
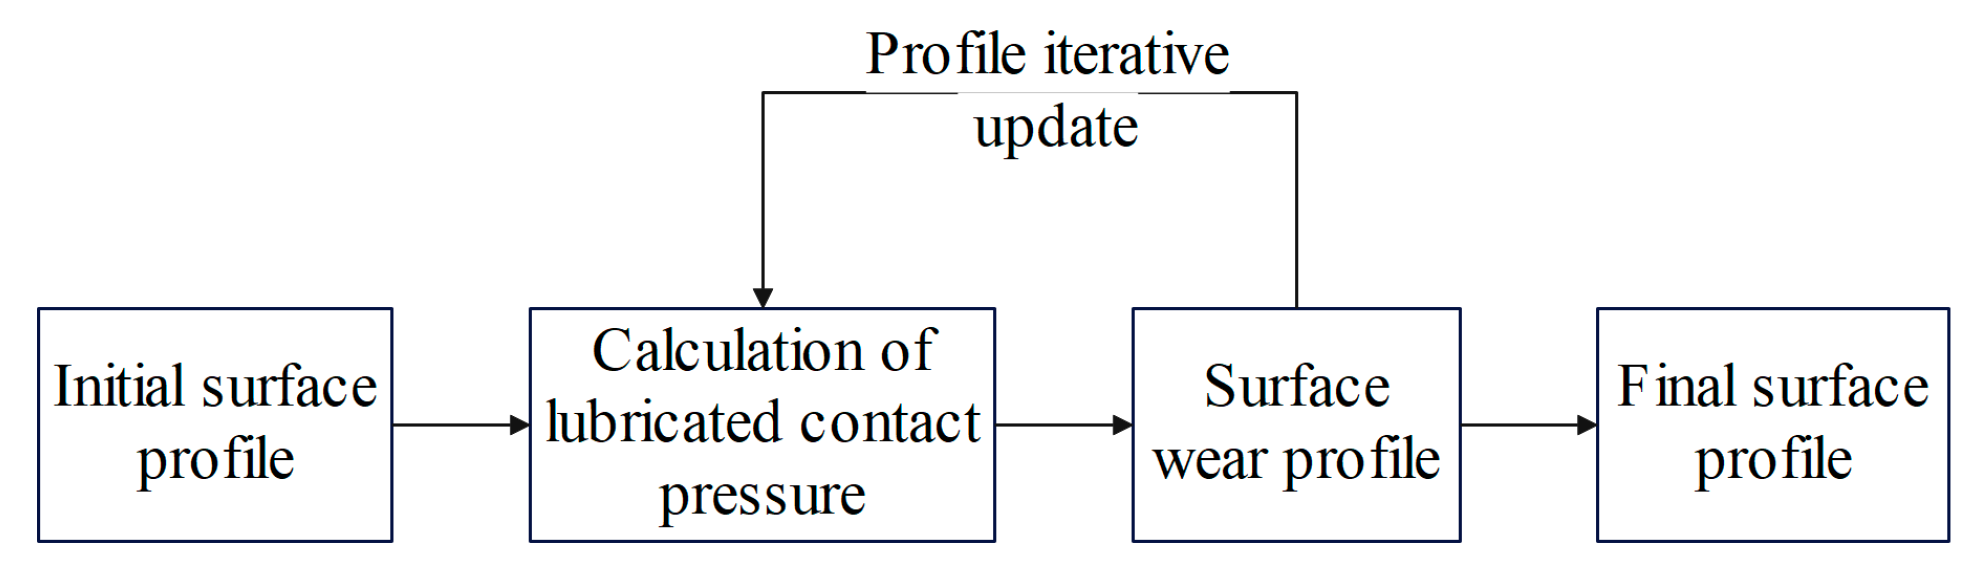
A new surface roughness profile is obtained by subtracting the wear depth calculated in each iteration from the original surface roughness profile. The specific process is shown in Figure 12:
Figure 12.
Calculation flow chart of dynamic wear on rough surface in contact area.
According to Archard’s wear model [44], the wear depth per iteration is calculated by
In Equation (25), kw is the dynamic wear coefficient, and Hm is the surface hardness of the sealing ring.
The dynamic wear coefficient is related to the film thickness ratio , and can be described as a function of the dry friction wear coefficient k0, as shown in Equation (26):
The expression for the wear depth after each time interval is
The oil film thickness including the wear correction amount is
is the deformation of the piston surface under the installation pressure of the sealing contact surface.
3.6. Friction Force Calculation Model of the Sealing Contact Surface
When calculating the friction force in the reciprocating sealing contact area of the piston, the following boundary conditions are met:
The pressure on the fluid side (left) of the sealed contact area is the brake fluid pressure pcyl, and the pressure on the air side (right) is set to 0.
The viscous shear stress of the fluid is (h > 0)
The contact shear stress of the surface asperities is (h = 0)
When calculating the friction force, the actual contact width of the sealing ring Wc must also be considered.
where is the brake fluid viscosity, V is the relative velocity, is the axial strain of the sealing ring, and is the root of Equation (34).
where r is the chamfer radius of the sealing ring and is the vertical strain of the sealing ring.
The friction force in the contact area is
4. Solving Process and Validation of Dynamic Models
4.1. Solving Process and Flowchart
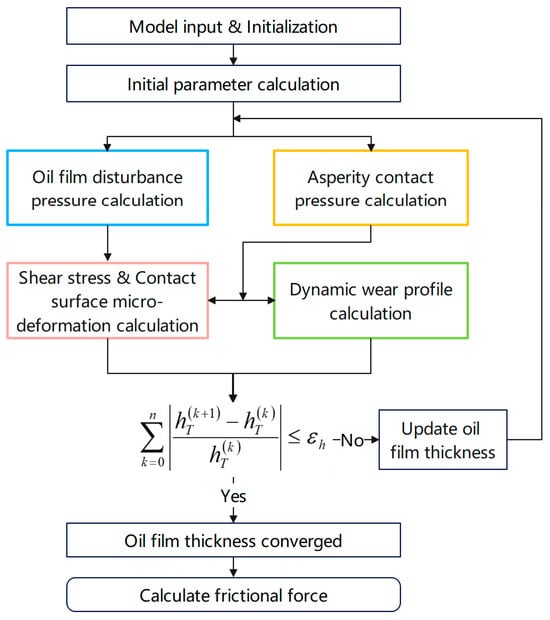
To solve the dynamic model of the brake drag mechanism, the sealed contact area between the piston and the sealing ring is first discretized into a 40 × 20 two-dimensional grid. Then, the finite difference method is used to solve the numerical values at each grid node, and finally, a cumulative summation is performed. The key solving process are introduced as Figure 13:
Figure 13.
Calculation flowchart of the dynamic model of the brake drag mechanism.
- (1)
- First, the interpolated data for piston velocity and sealing pressure, obtained from the dynamic model of the braking system, is used as input for the dynamic model of the brake drag mechanism. The surface of the sealed contact area is modeled using a Gaussian distribution.
- (2)
- Second, the static contact pressure of the contact surface is calculated according to Equation (19), and the initial oil film thickness is calculated according to Equation (22). The results are then substituted into the Reynolds equation to obtain the oil film disturbance pressure.
- (3)
- Concurrently, the G–W contact model is used in conjunction with the nominal oil film thickness to calculate the asperity contact pressure.
- (4)
- Then, the viscous shear stress of the fluid and the contact shear stress of the asperities are calculated according to Equations (31) and (32). These shear stresses are substituted into the micro-elastic deformation equations to calculate the micro-deformation of the contact surface.
- (5)
- Simultaneously, the asperity contact pressure is input into the wear model to calculate the dynamic wear profile.
- (6)
- Finally, the wear depth and the elastic micro-deformation values of the piston and sealing ring are substituted into Equation (28) to calculate the final actual oil film thickness based on the initial oil film thickness.
If the result converges, the friction force in the contact area is calculated; otherwise, the loop is repeated until the oil film thickness converges.
The successive over-relaxation (SOR) method [45] is used to correct the film thickness (i.e., the inner loop) to ensure the convergence of the brake fluid film thickness. Its formula is shown in Equation (36).
In Equation (36), is the film thickness value of the current iteration, is the value from the previous iteration, and is the value for the next time step obtained after relaxation combining the current and previous iteration values. The relaxation factor is = 1.59 and the convergence criterion is = 1 × 10⁻⁴.
4.2. Model Validation
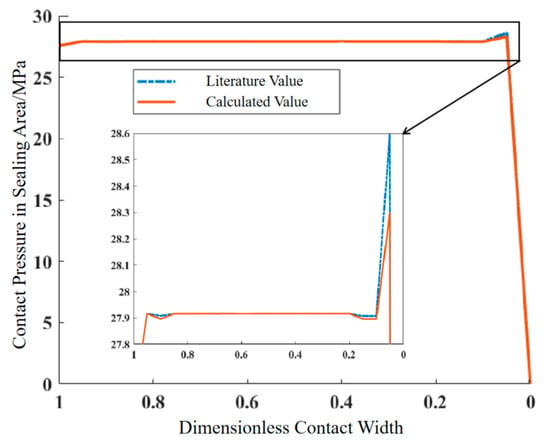
The contact pressure in the sealing area is solved using the same working condition parameters as in the numerical model of Professor George K. Nikas [46] to verify the correctness of the dynamic model of the brake drag mechanism and the numerical calculation method. A comparison between the calculated results and the results from the literature is shown in Figure 14. It can be seen that the average error for the contact pressure at various points in the sealing area is 0.118%, which verifies the correctness of the established model.
Figure 14.
Comparison of contact pressure in the sealed contact area.
5. Confirmation and Characteristics Analysis of Dragging Brake Conditions
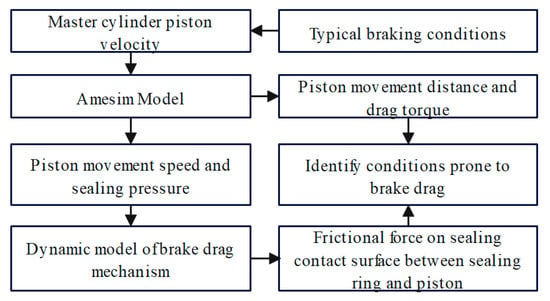
Typical braking conditions, which are extracted from the users’ dynamic braking conditions dataset, are used to clarify the correlation between brake drag and braking conditions. The braking conditions associated with brake drag were identified with the dynamic model of the brake drag mechanism, and the characteristics of these drag-prone conditions were analyzed. The specific analysis flow is shown in Figure 15:
Figure 15.
Calculation flow chart for brake drag working conditions.
As shown in the figure, first, the typical braking conditions are converted into the master cylinder piston’s velocity through pedal ratio conversion. This is input into the Amesim model to calculate piston displacement, drag torque, piston velocity, and brake fluid sealing pressure. Then, the piston velocity and sealing pressure are inputted into the dynamic model of the brake drag mechanism to simulate the friction force between the sealing ring and the piston’s sealed contact surface, which is the piston’s sliding resistance. Finally, the conditions prone to drag are identified by combining the piston displacement, drag torque, and piston sliding resistance.
5.1. Typical Braking Conditions
Typical braking conditions are derived from the real-vehicle user operation data from the target vehicle. The raw data are collected via the on-board CAN bus at a sampling frequency of 5 Hz, covering core parameters including vehicle speed, acceleration, brake pedal stroke, and brake master cylinder pressure, with a total effective driving duration of 571.34 h. First, the raw data undergo resampling, T4253H filtering for noise reduction, and outlier elimination. Then, driving segments are divided into braking segments, non-braking segments, and idling segments based on vehicle speed and acceleration, and the specific criteria are shown in Table 4.
Table 4.
Driving state division criteria.
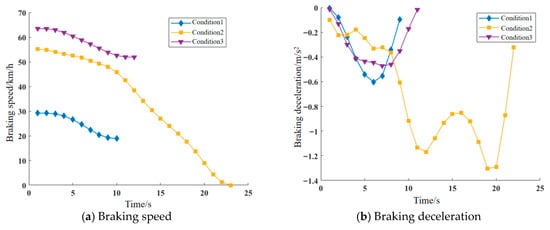
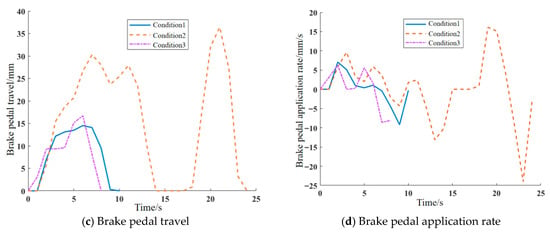
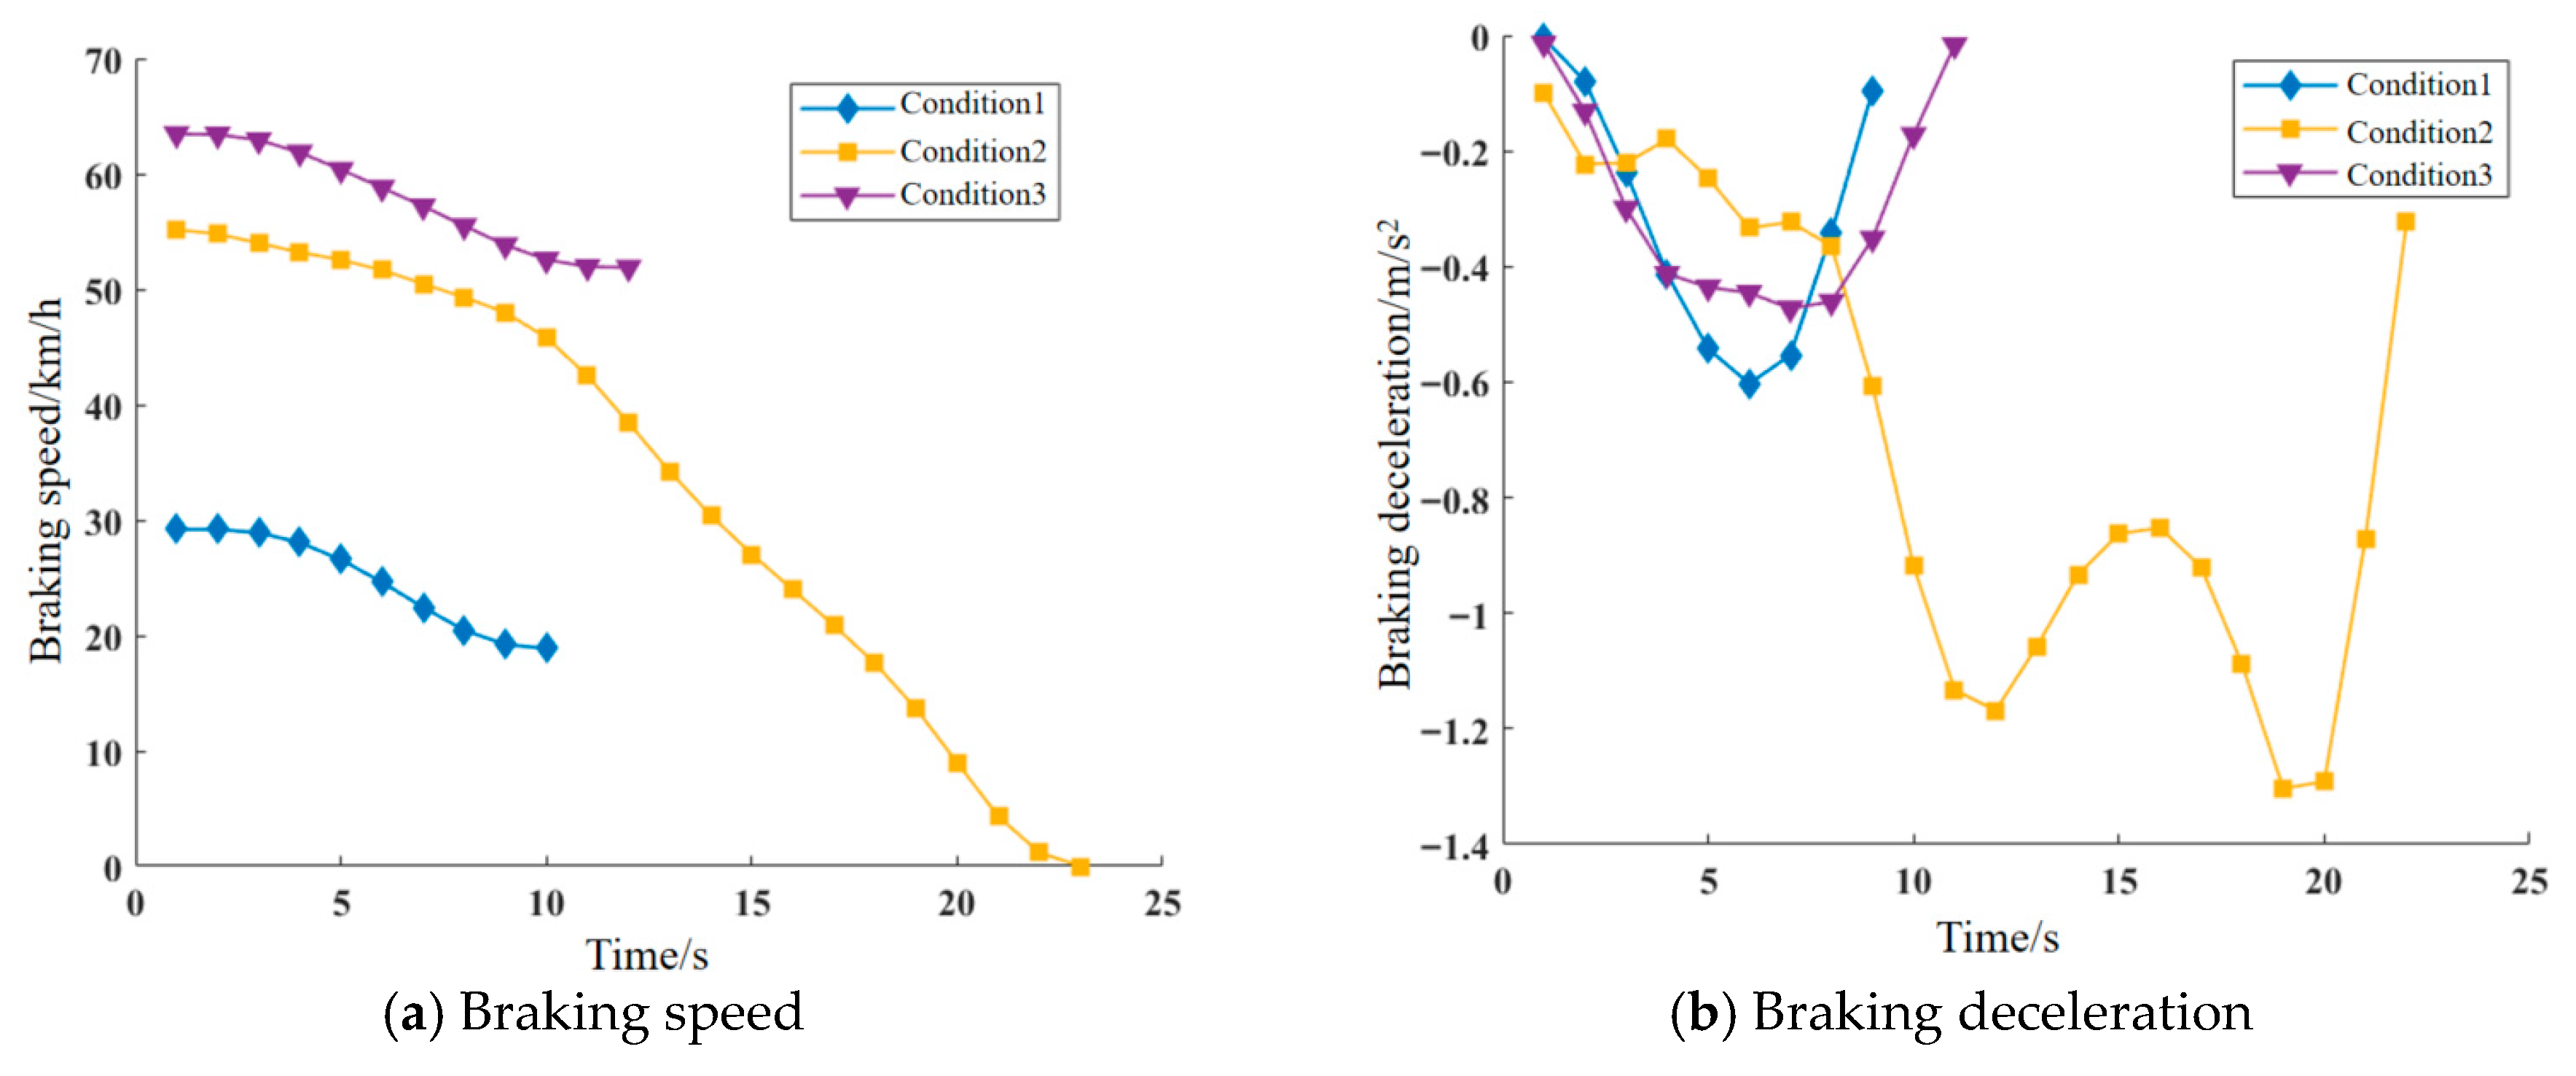
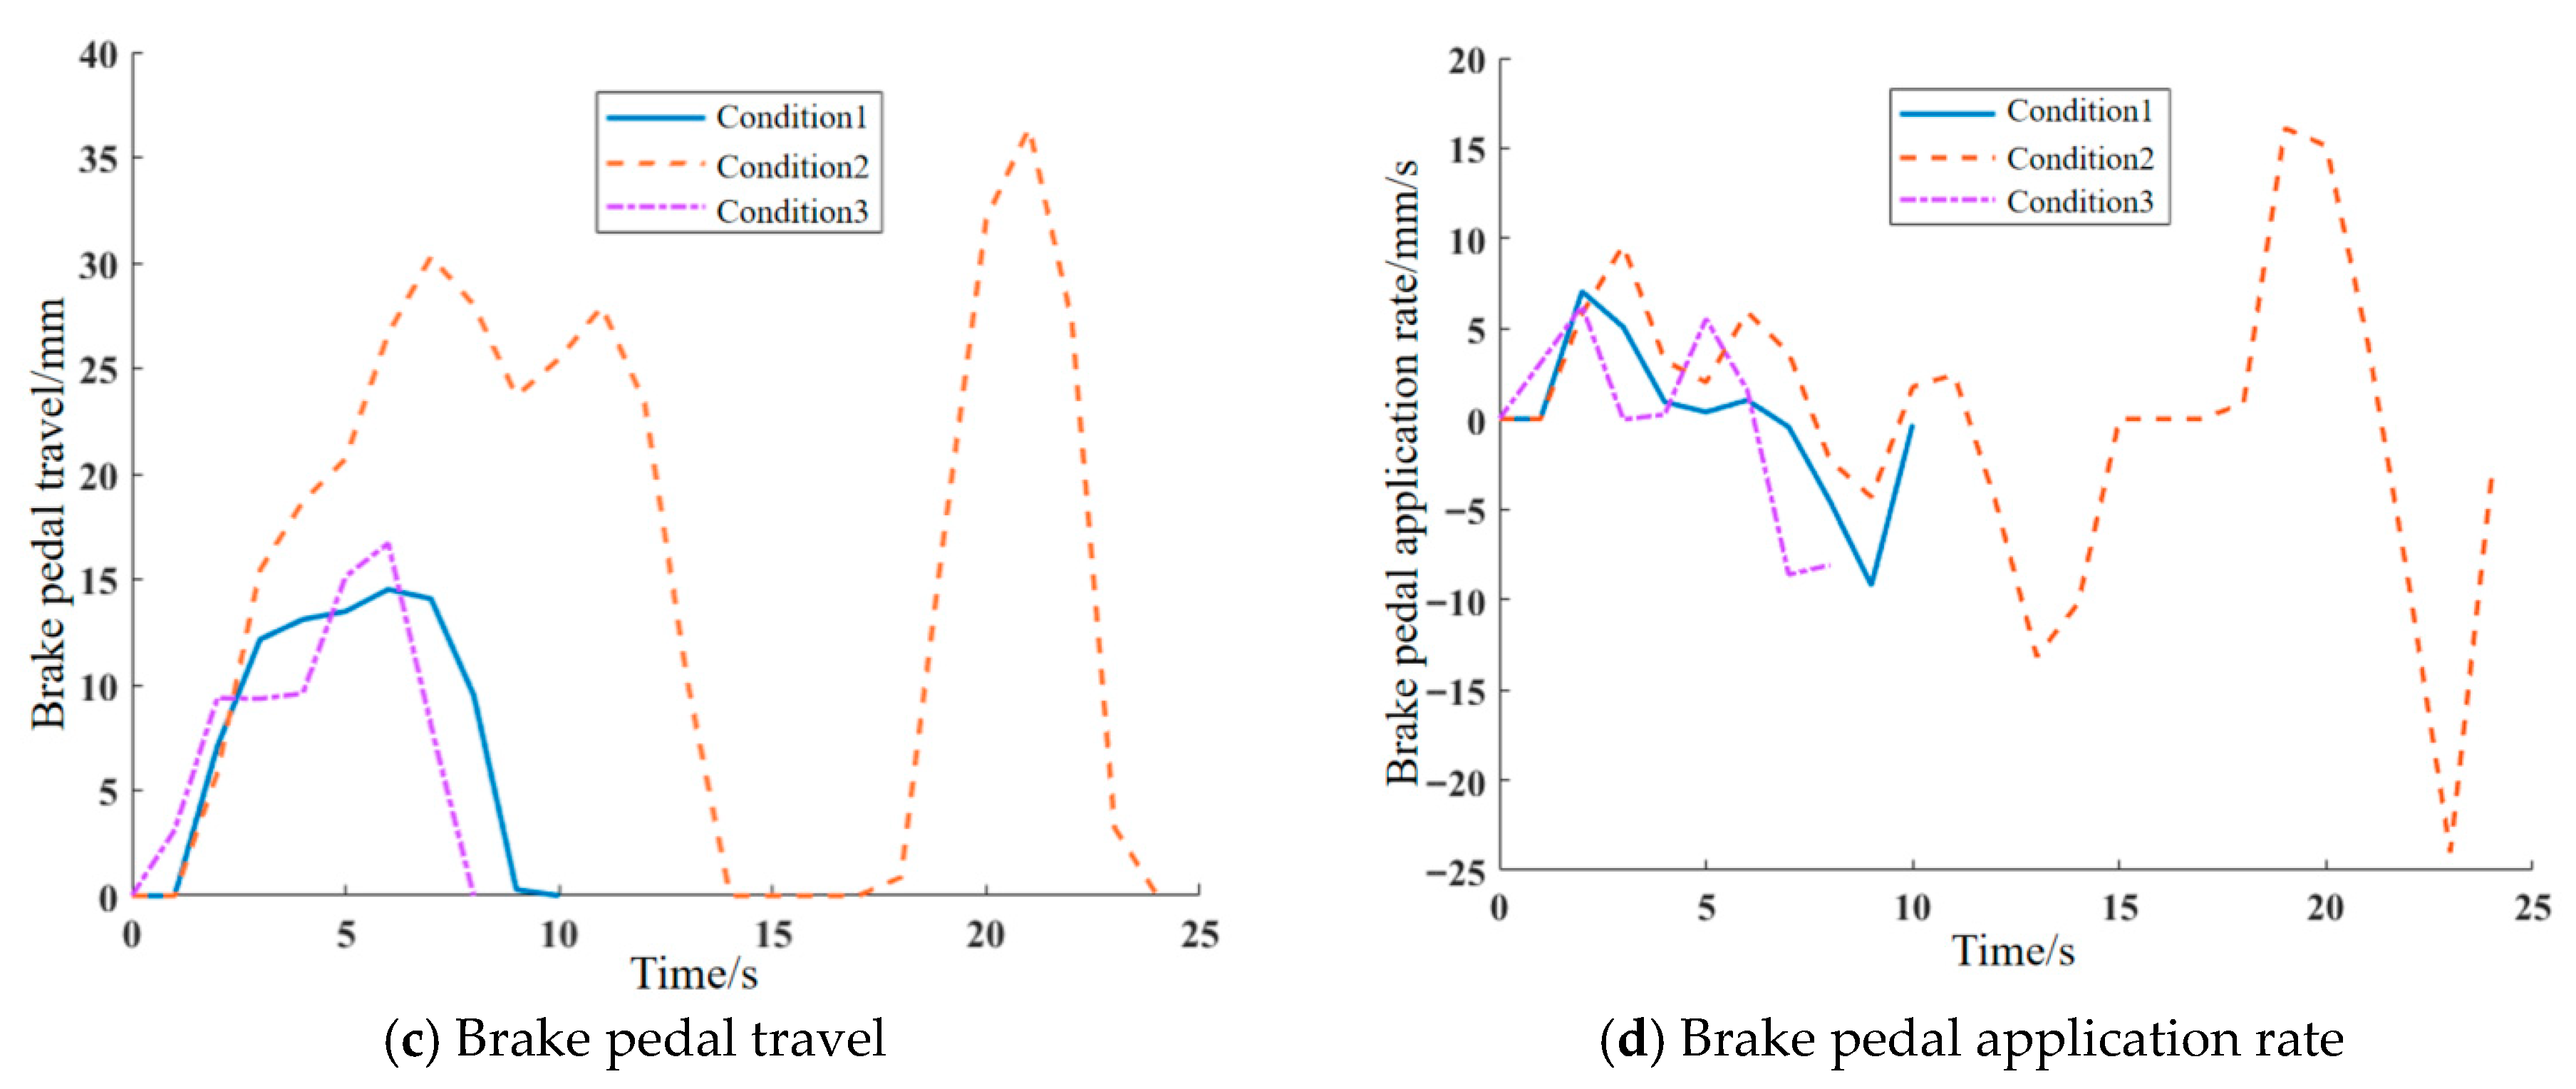
Next, 40,100 effective braking segments are extracted from the preprocessed data via a MATLAB R2020b-coded program, with a total braking duration of 148.98 h, accounting for 26.07% of the total driving duration. Then, 15 feature parameters including speed category, variable speed category, and pedal category are constructed to form a 40,100 × 15 matrix. Principal component analysis (PCA) is then used to reduce it to 3 dimensions. With a cumulative contribution rate of principal component eigenvalues of 85% as the critical value, the final 3 principal components retain 85.5% of the original data information and can replace the original data for subsequent analysis. Finally, the K-means clustering algorithm, a mature and widely used unsupervised learning algorithm in vehicle working conditions construction, is adopted to classify the dimensionality-reduced effective segments. After calculation using the Calinski–Harabasz (CH) index, the optimal number of clusters is determined to be 3 [47,48]. Therefore, the segments are divided into 3 types of typical braking conditions. The main characteristic parameters include braking speed, braking deceleration, brake pedal travel, and brake pedal application rate, as shown in Figure 16.
Figure 16.
Typical segments of working conditions.
The characteristic parameters of the three typical braking conditions are shown in Table 5.
Table 5.
Characteristic parameters of the three typical braking conditions.
From the table above, Condition 1 is characterized by a low initial braking speed, short braking time, slow braking deceleration, and small speed range. This indicates that the vehicle is moving slowly, and the driver’s operating style is light with slow application/release of the brake. Condition 1 is defined as a low-speed, light-braking condition. Condition 2 has a relatively high initial braking speed, long braking time, long braking distance, high braking deceleration, and large speed range. This suggests the vehicle is traveling at a faster speed, and the driver exhibits continuous pedal application/release behavior. Condition 2 is defined as a medium-to-low speed, prolonged-braking condition. Condition 3 features a high initial braking speed, relatively long braking time, long braking distance, slow braking deceleration, and a large speed range. This indicates the vehicle is moving fast, and the driver’s operating style is slow application and fast release. Condition 3 is defined as a medium-to-high speed, short-braking condition.
As shown in Table 5, the three typical braking conditions obtained by K-means clustering have significant differences in braking intensity, driver operation characteristics and braking duration. The specific characteristics of each condition are as follows:
- (1)
- Condition 1: The initial braking speed is 29.20 km/h, the speed range is only 10.33 km/h, the maximum deceleration is 0.60 m/s2, the average pedal rate is 2.90 mm/s, and the braking duration is 9.48 s. It is characterized by low initial speed, small speed variation, low braking intensity, and slow and gentle brake pedal operation, which corresponds to the frequent light braking scenario of a vehicle in urban low-speed driving. This condition is defined as a low-speed, light-braking condition.
- (2)
- Condition 2: The initial braking speed is 55.15 km/h, the vehicle decelerates to 0 after braking, with a speed range of 55.15 km/h, the maximum deceleration reaches 1.30 m/s2 (the highest among the three conditions), the maximum pedal travel is 36.39 mm, the average pedal rate is 6.04 mm/s, and the braking duration is up to 22 s. It is characterized by medium initial speed, full deceleration to stop, high braking intensity, continuous pedal operation, and long braking duration, which corresponds to the continuous braking scenario of a vehicle in suburban medium-speed driving. The long-duration high-load braking process will significantly affect the friction characteristics of the piston–seal interface, which is the key focus of this brake drag study. This condition is defined as a medium-to-low speed, prolonged-braking condition.
- (3)
- Condition 3: The initial braking speed is 63.46 km/h (the highest among the three conditions), the speed range is only 11.57 km/h, the maximum deceleration is 0.47 m/s2 (the lowest among the three conditions), the average pedal rate is 4.47 mm/s, and the braking duration is 12.74 s. It is characterized by high initial speed, small speed variation, ultra-low braking intensity, and slow brake application and fast release operation, which corresponds to the slight speed adjustment braking scenario of a vehicle in high-speed driving. This condition is defined as a medium-to-high speed, short-braking condition.
5.2. Confirmation of Typical Braking Conditions-Induced Braking Drag
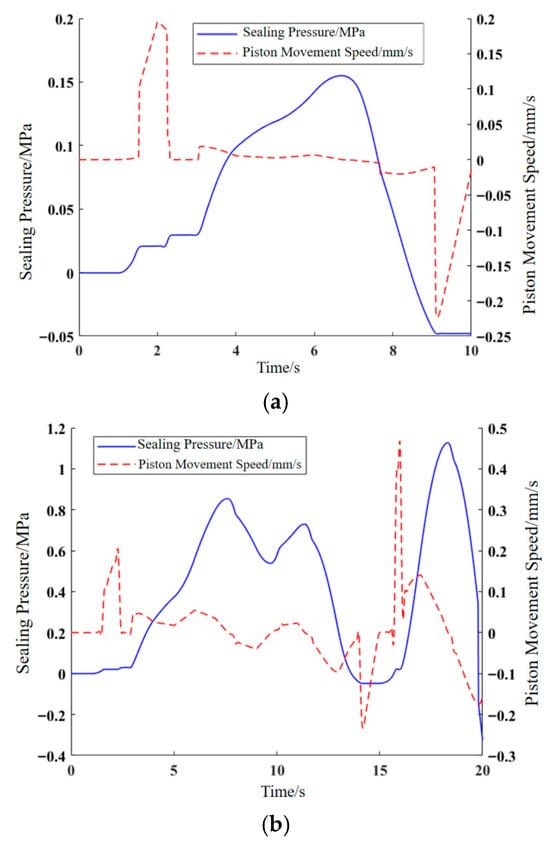
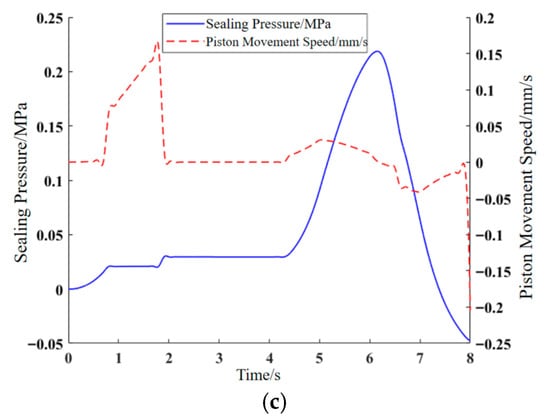
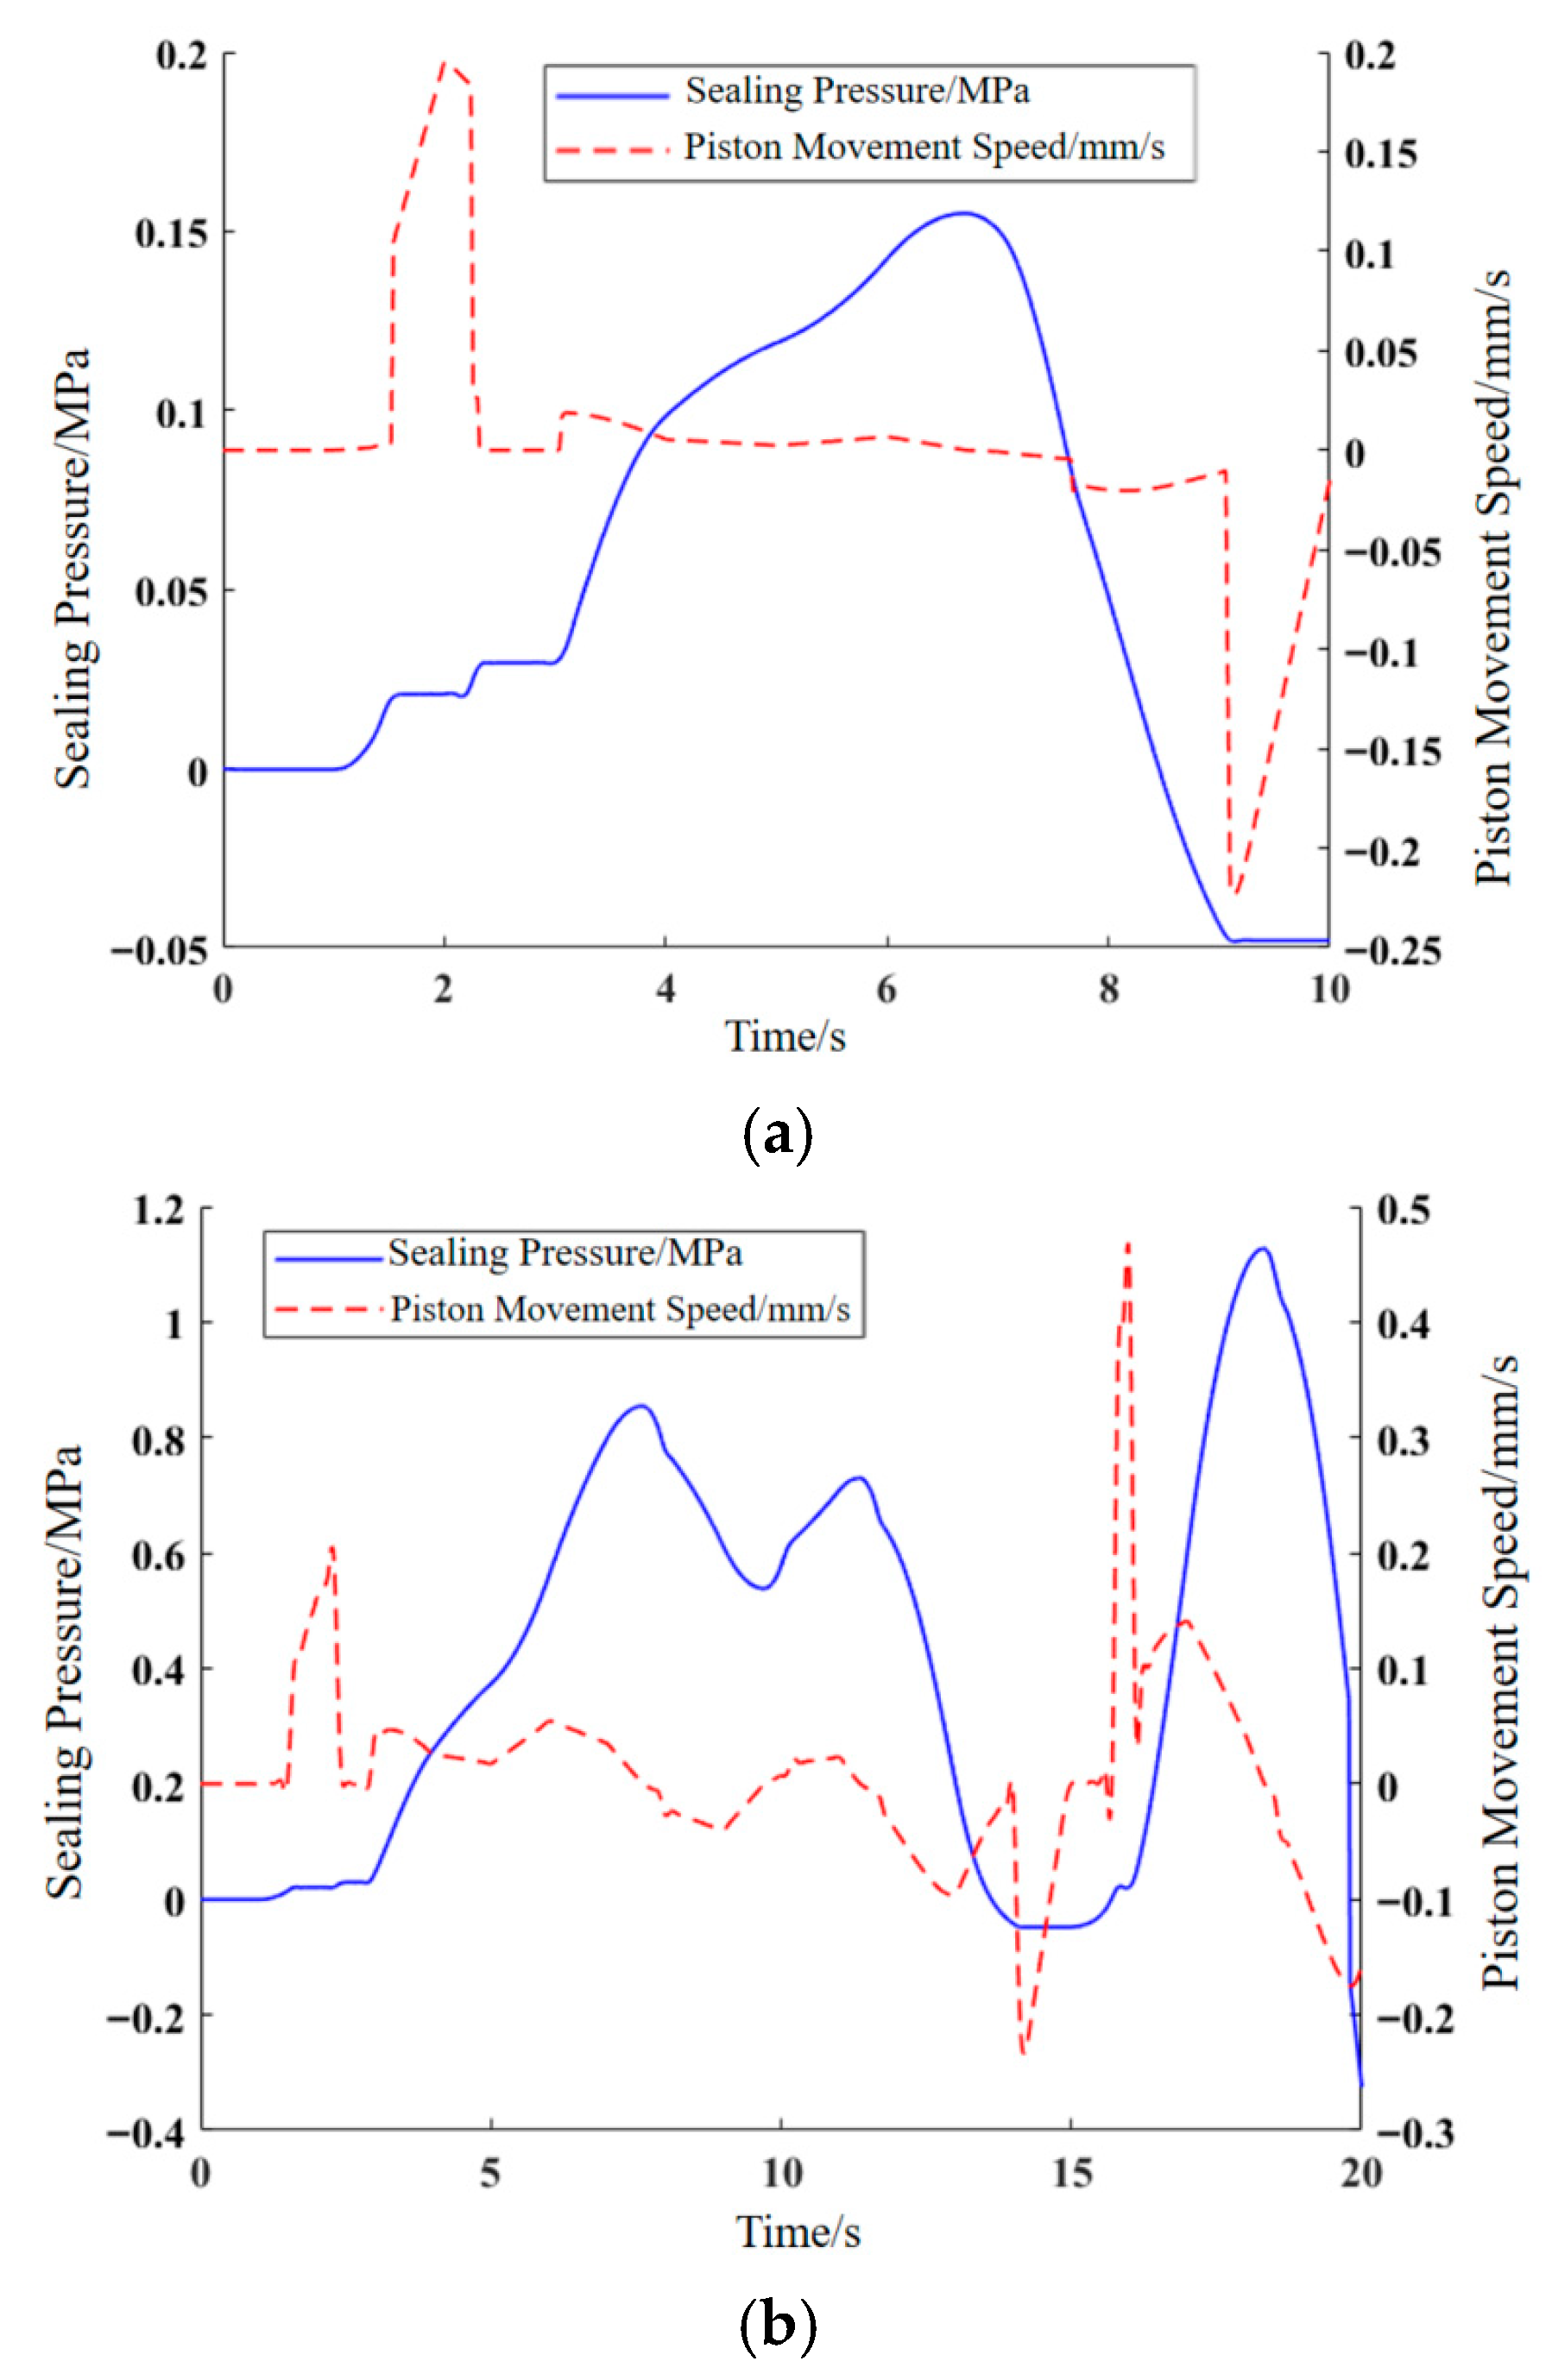
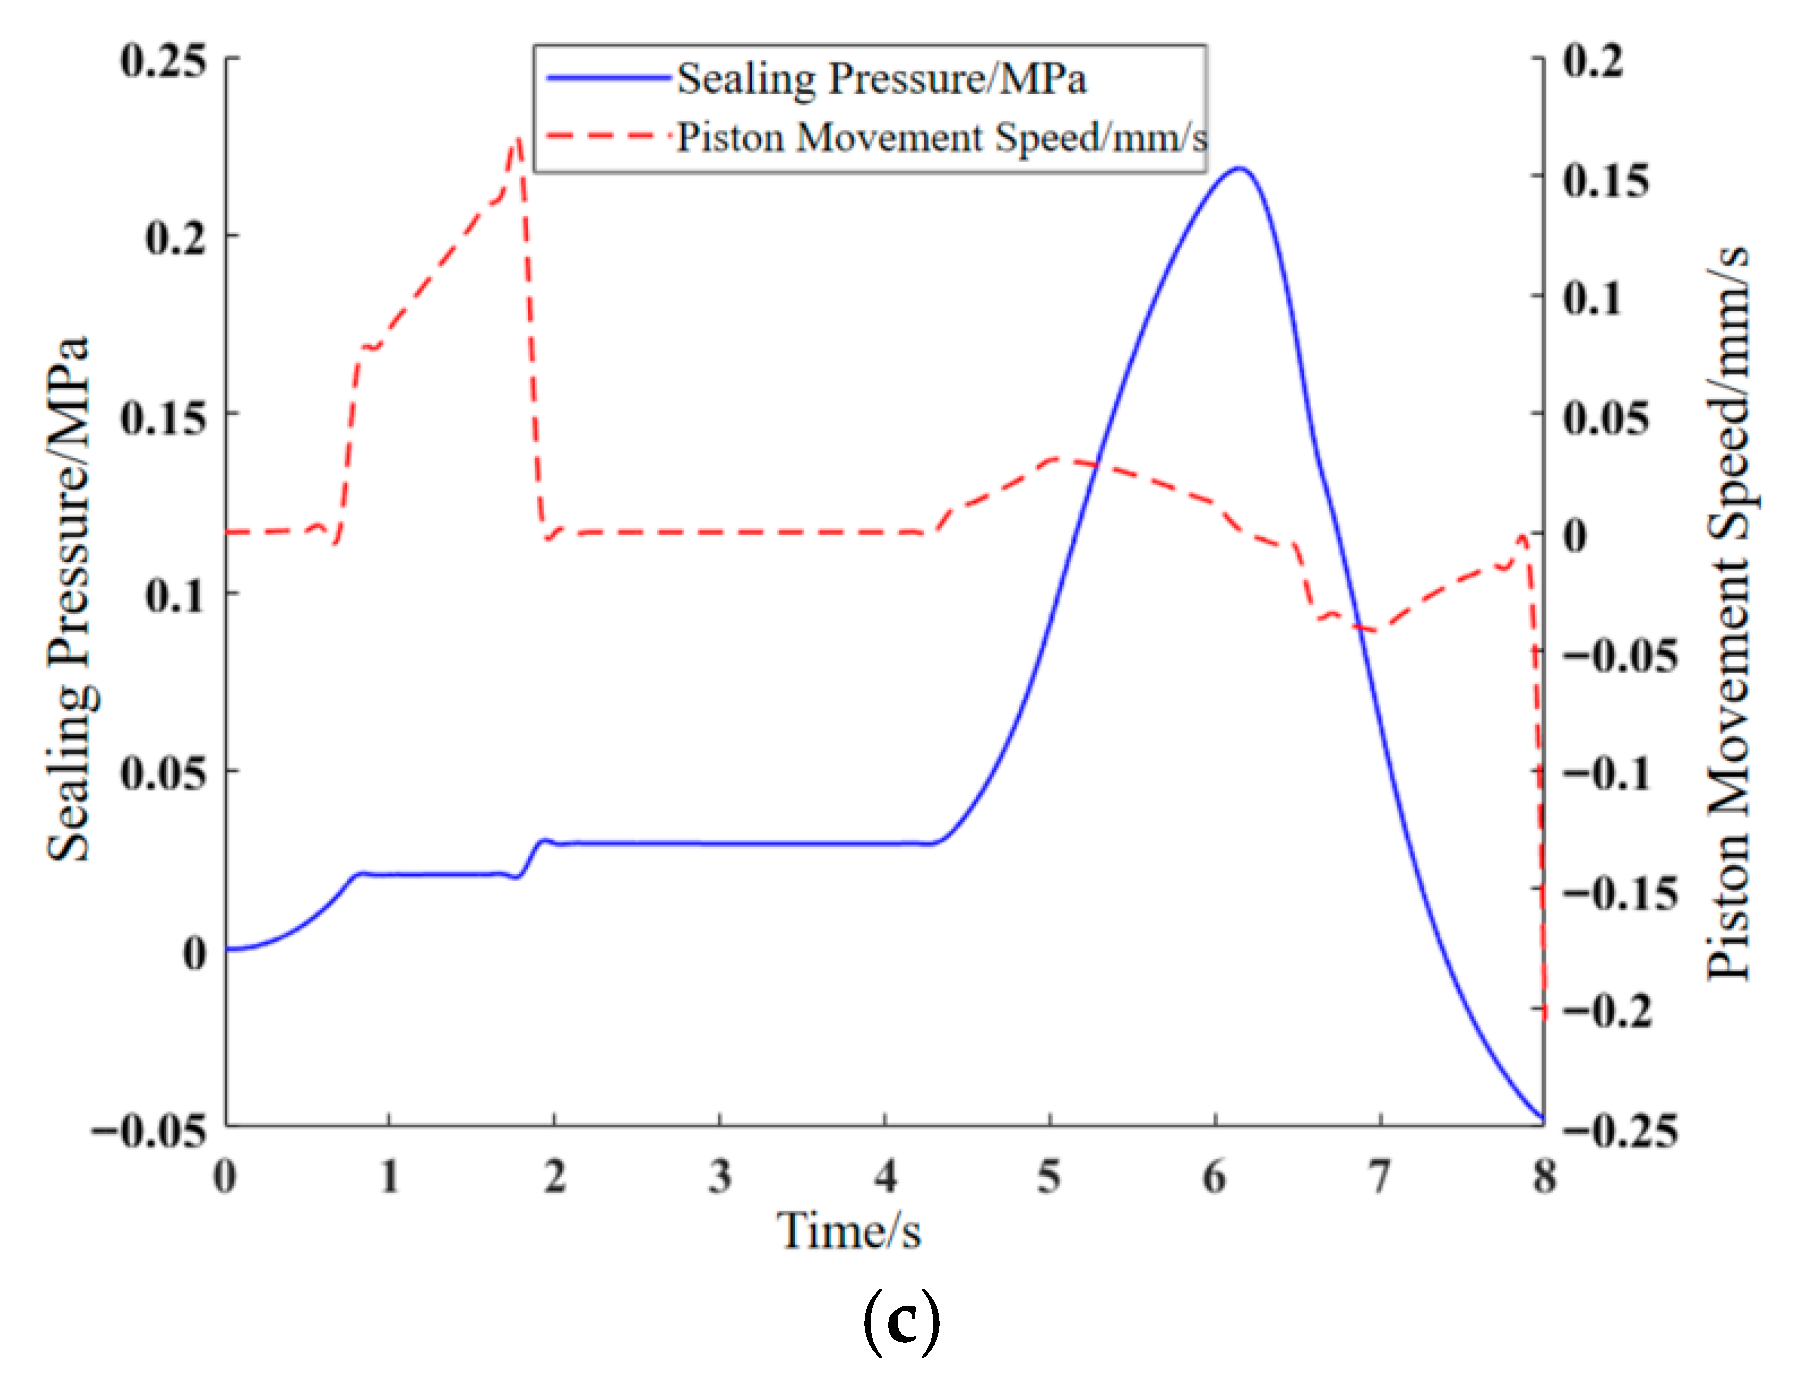
The master cylinder piston velocity is obtained by converting the brake pedal application rate from the typical braking conditions using the pedal ratio. This is used as the input signal for the master cylinder, which in turn yields the caliper piston velocity and the fluid sealing pressure within the caliper cavity, as shown in Figure 17.
Figure 17.
Time-history data of piston velocity and sealing pressure under typical brake working conditions. (a) Condition 1: Low-speed, light-braking condition; (b) Condition 2: Medium-to-low speed, prolonged-braking condition; (c) Condition 3: Medium-to-high speed, short-braking condition.
From Figure 17, it can be observed that in the low-speed, light-braking condition (Condition 1), the piston is in its extension stroke from 0 to 6.72 s and in its retraction stroke from 6.74 s to 10 s, completing one reciprocating cycle. During this time, the sealing pressure is negative from 0 to 1.08 s and 8.48 s to 10 s, in a pressurized state from 1.1 s to 6.72 s (extension stroke), and in a depressurized state from 6.74 s to 8.46 s (retraction stroke). In the medium-to-low speed, prolonged-braking condition (Condition 2), the piston undergoes two reciprocating cycles. In the medium-to-high speed, short-braking condition (Condition 3), the piston completes one reciprocating cycle. In summary, Conditions 1 and 3 each involve one reciprocating cycle, while Condition 2 involves two.
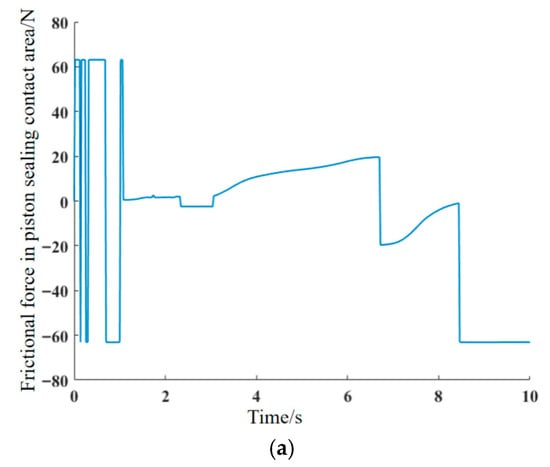
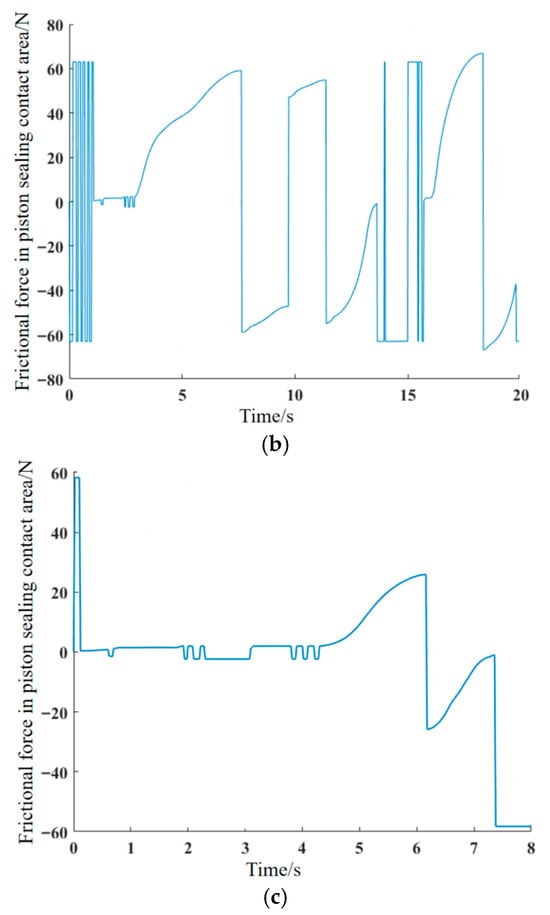
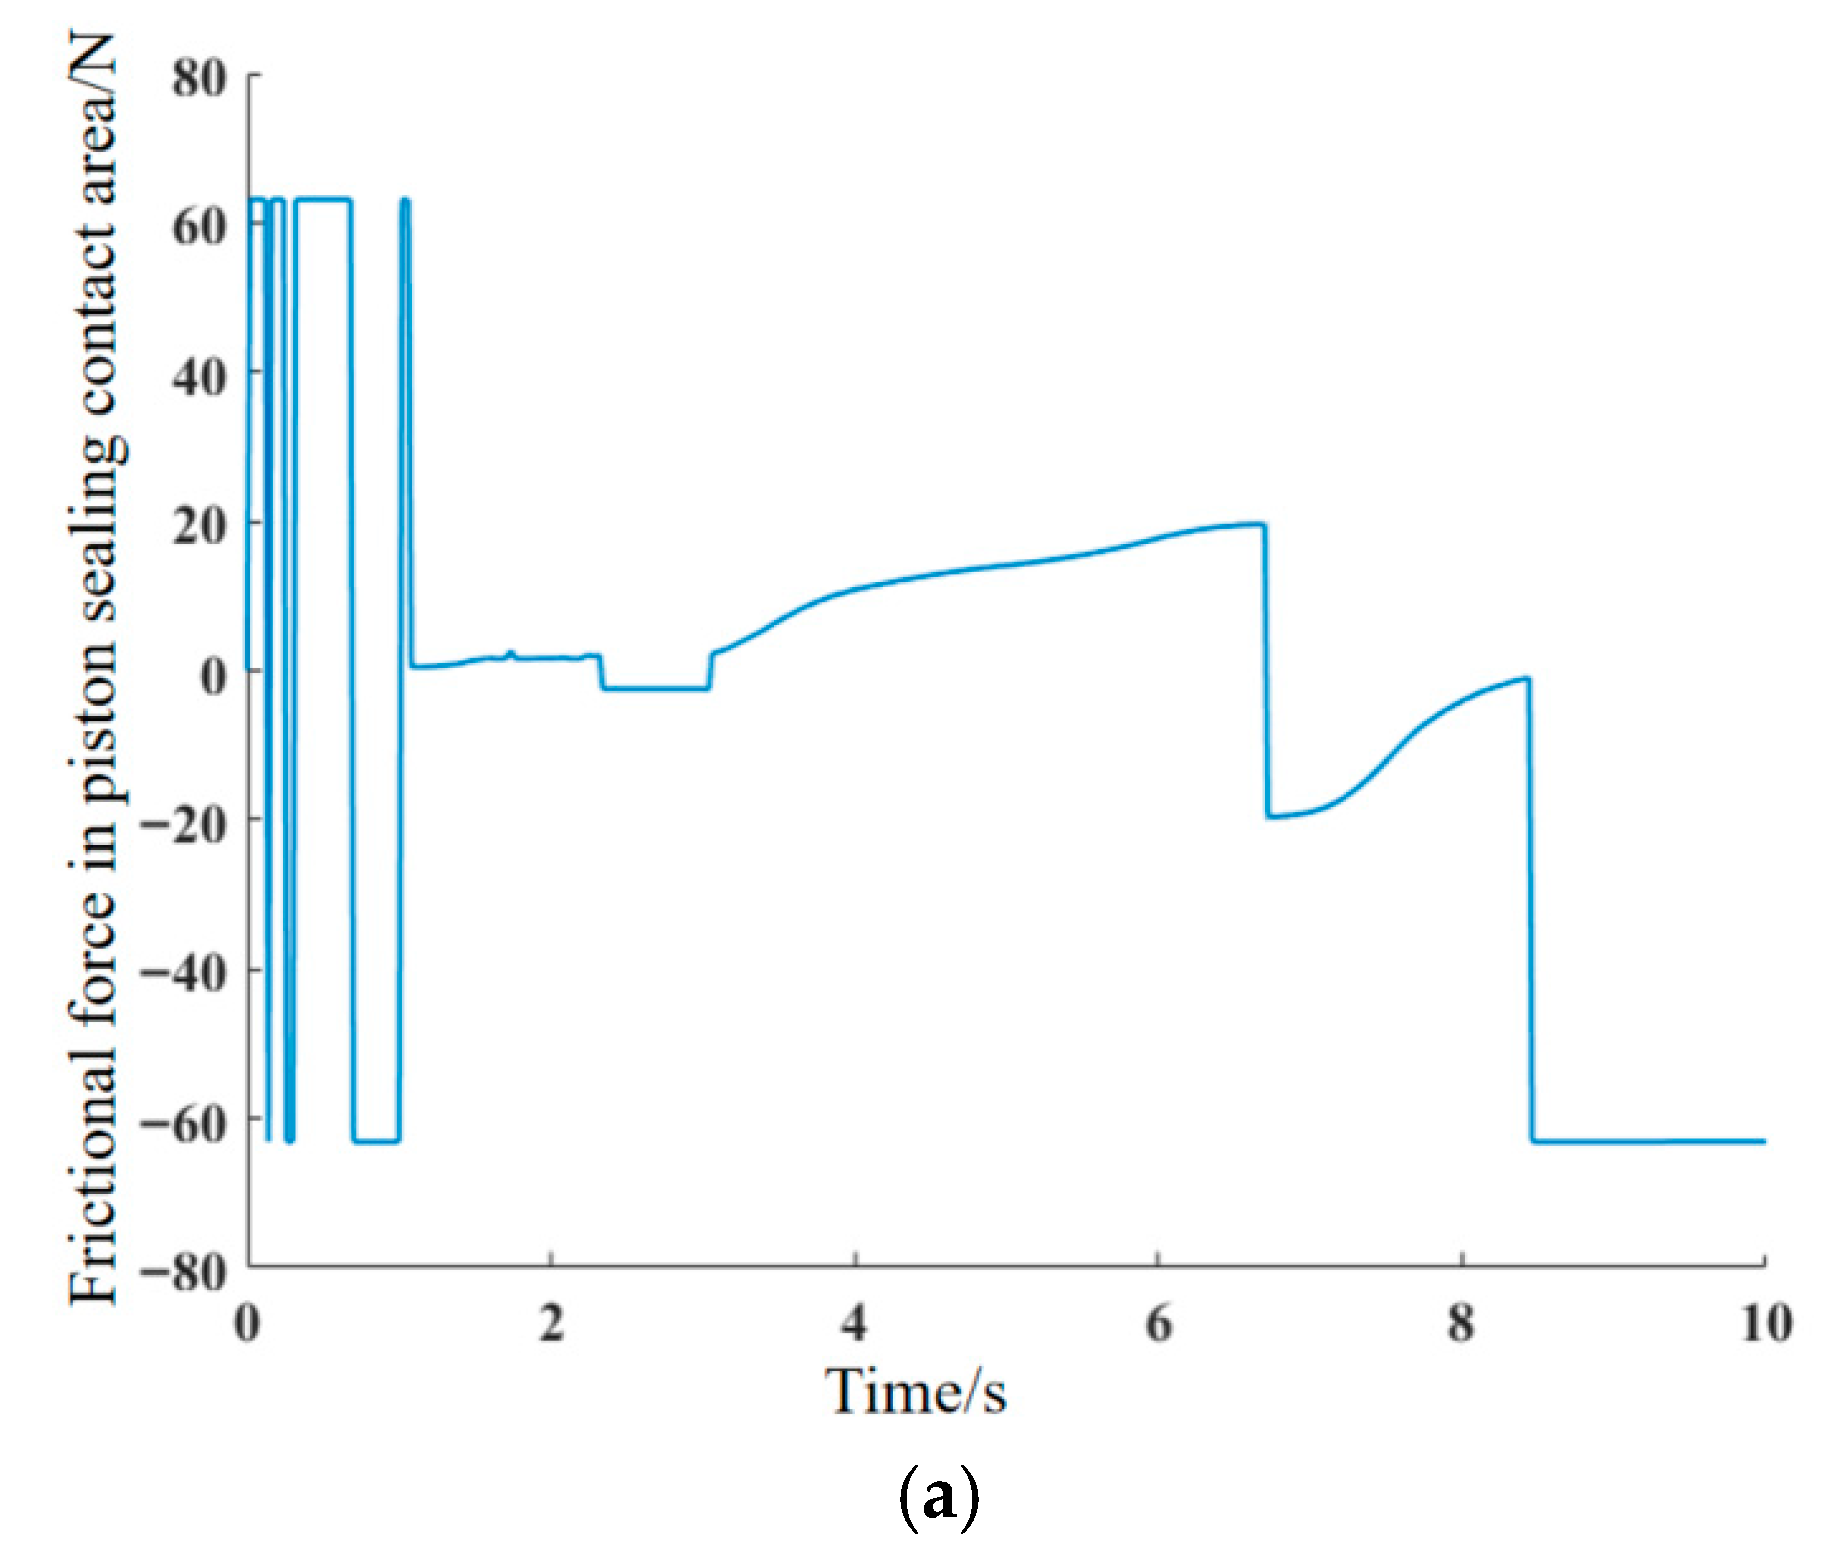
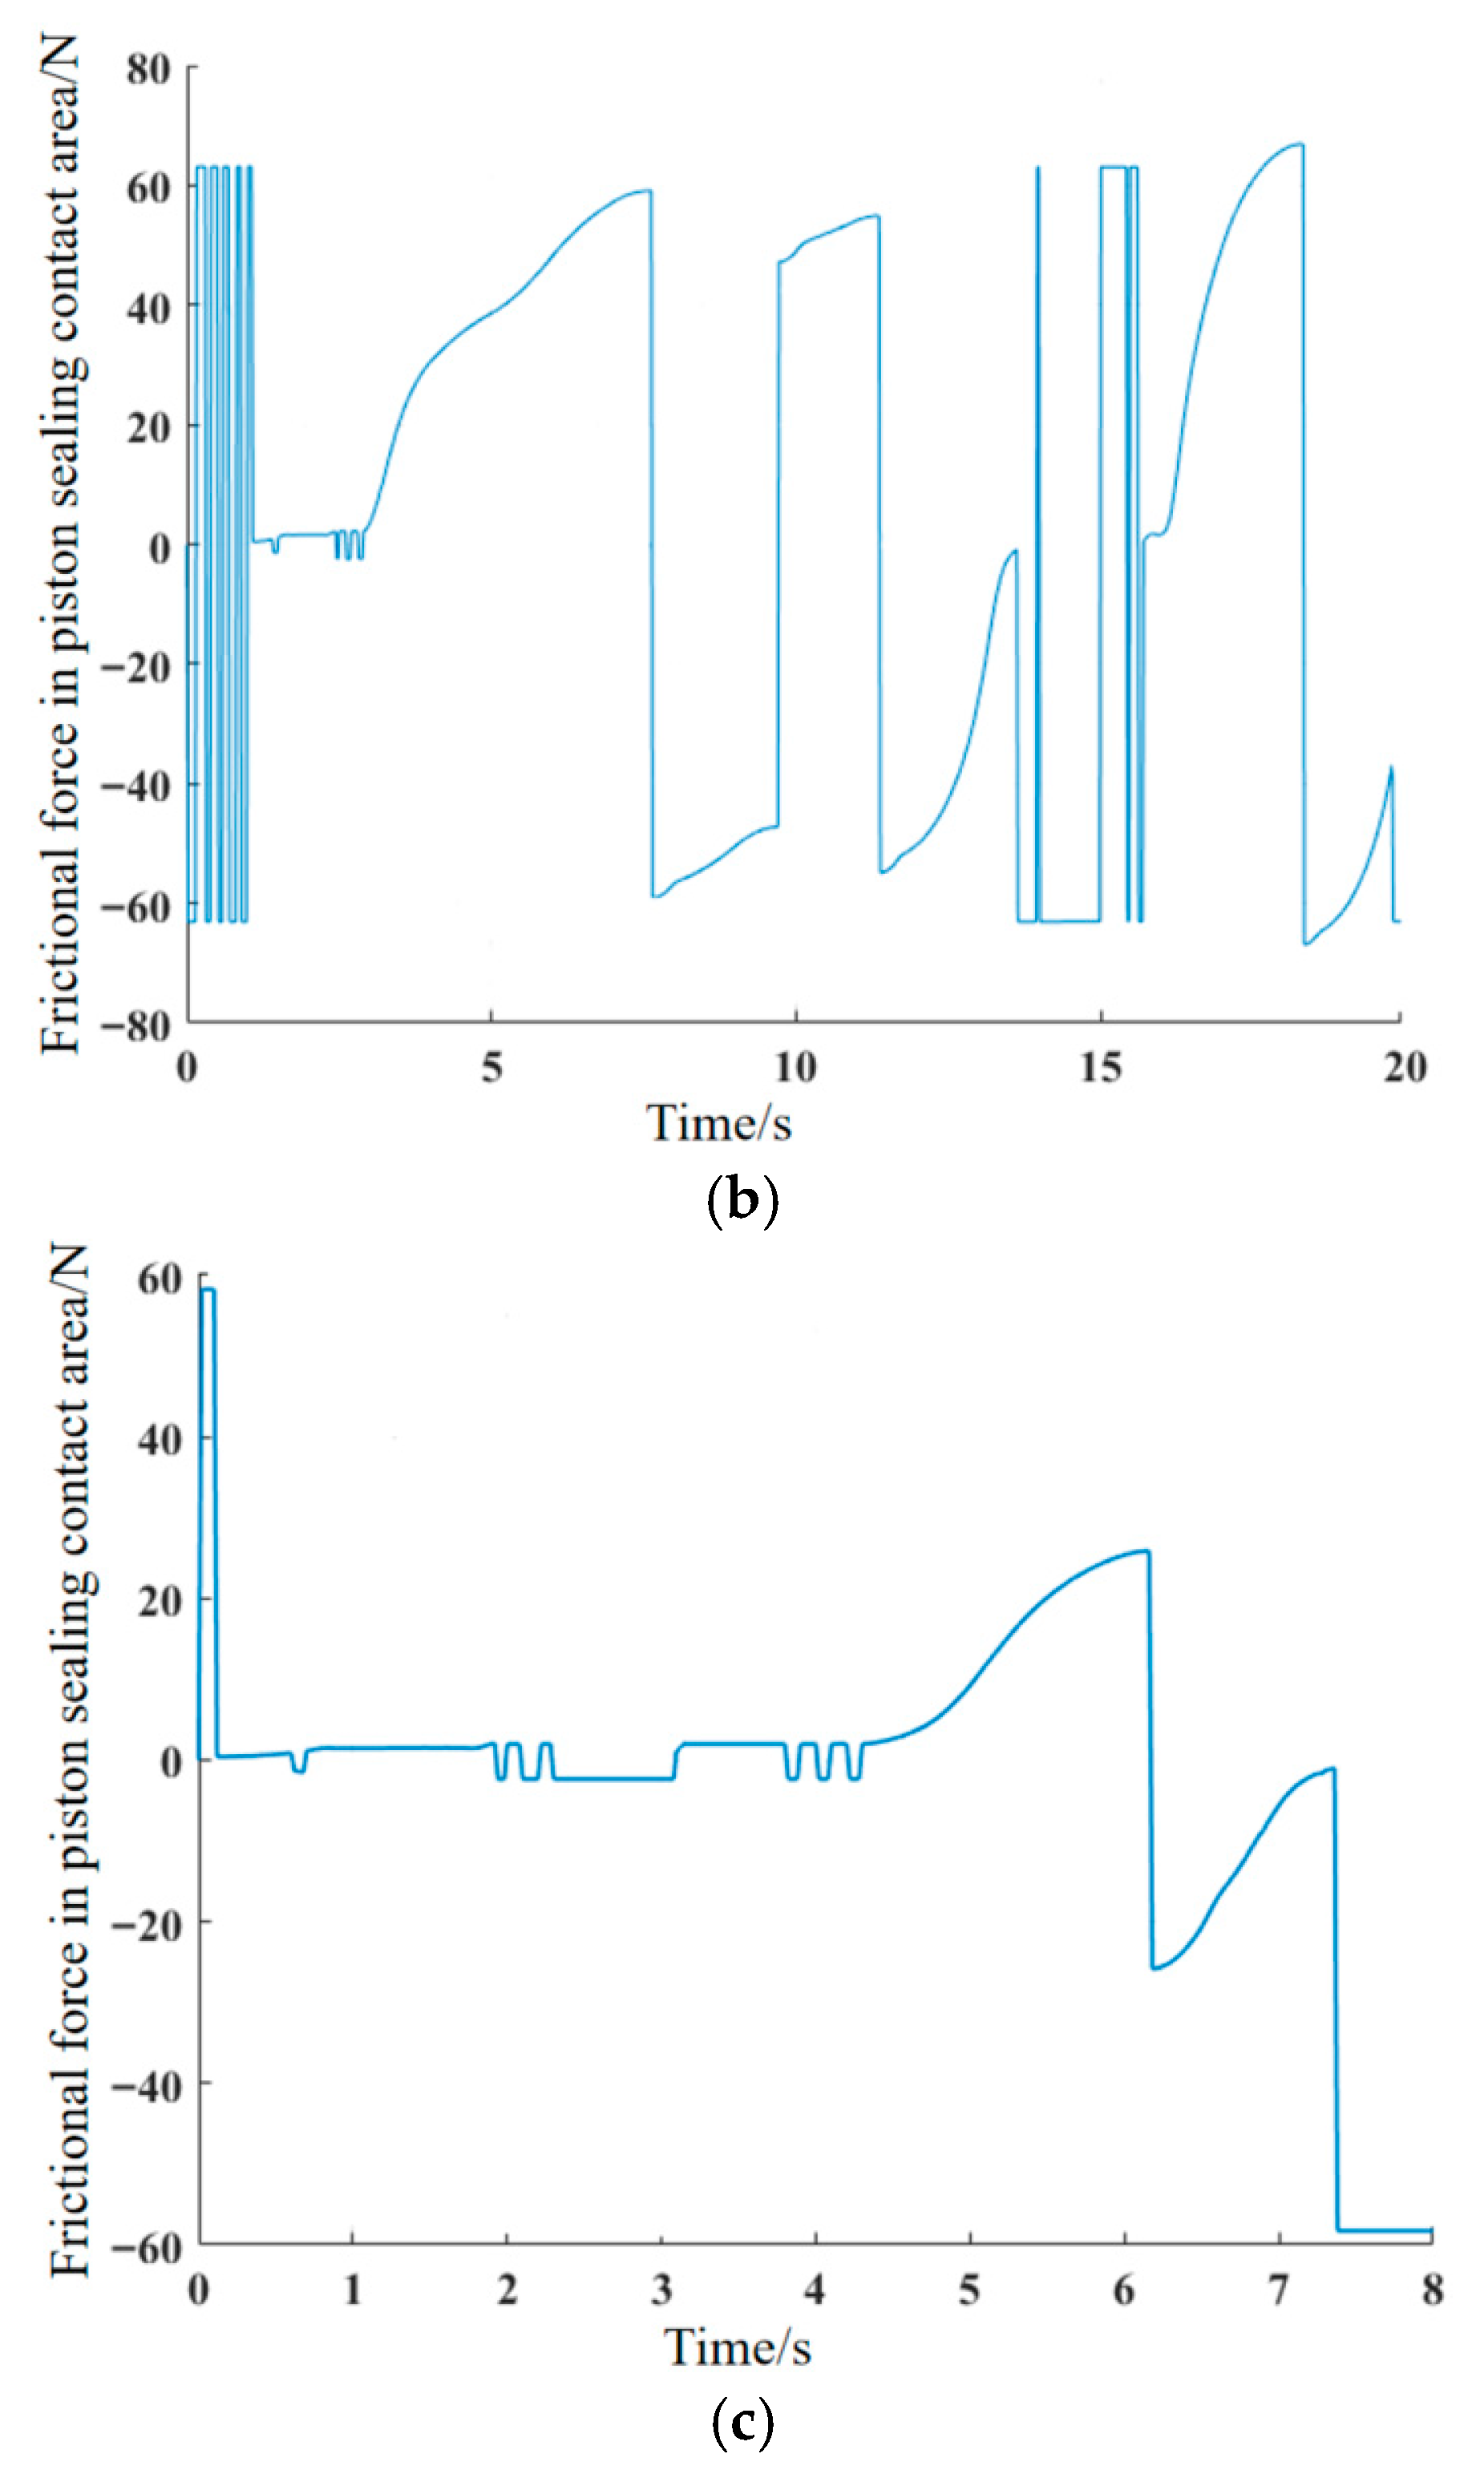
The time-history data for piston velocity and brake fluid sealing pressure are used as inputs for the brake drag mechanism model. The resulting time-history data curves of the friction force in the piston-sealing contact area for typical braking conditions are calculated and shown in Figure 18.
Figure 18.
Time-history data of frictional force in piston sealing contact area under typical brake working conditions. (a) Condition 1: Low-speed, light-braking condition; (b) Condition 2: Medium-to-low speed, prolonged-braking condition; (c) Condition 3: Medium-to-high speed, short-braking condition.
From Figure 18a,b, it can be seen that there is a phase of alternating positive and negative friction at the beginning of the extension stroke. This occurs because once the hydraulic thrust exceeds the maximum static friction, the piston begins to move, causing the sealing ring to deform tangentially under shear force. As the hydraulic pressure continues to rise during the piston’s extension stroke, the thrust will again surpass the maximum static friction, causing the sealing ring to start sliding relative to the piston. This results in a stage where there is frequent switching between static and kinetic friction. Throughout the entire reciprocating cycle of the brake piston, the maximum static friction value at the beginning of the extension stroke serves as the restoring force provided by the sealing ring for the piston during the retraction stroke. The maximum friction during the retraction stroke is the sliding resistance. Comparing the magnitudes of the restoring force and the piston sliding resistance in the figures: for Condition 1, the restoring force is 63.08 N, which is identical to the sliding resistance. For Condition 2, the restoring force is 63.0623 N, while the sliding resistance is 66.9276 N. For Condition 3, the restoring force is 58.2432 N, and the sliding resistance is 58.2418 N. Under the medium-to-low speed, prolonged-braking condition (Condition 2), the restoring force is less than the piston sliding resistance, preventing the piston from returning to its original position.
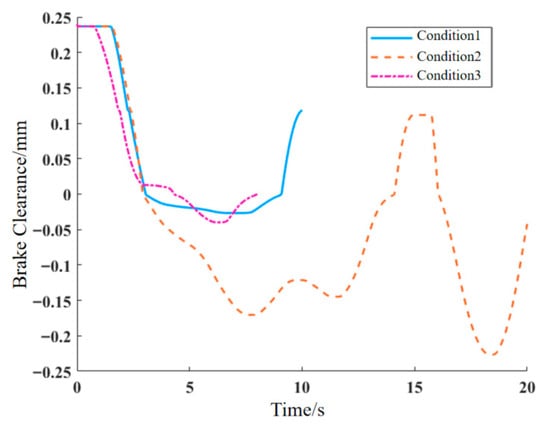
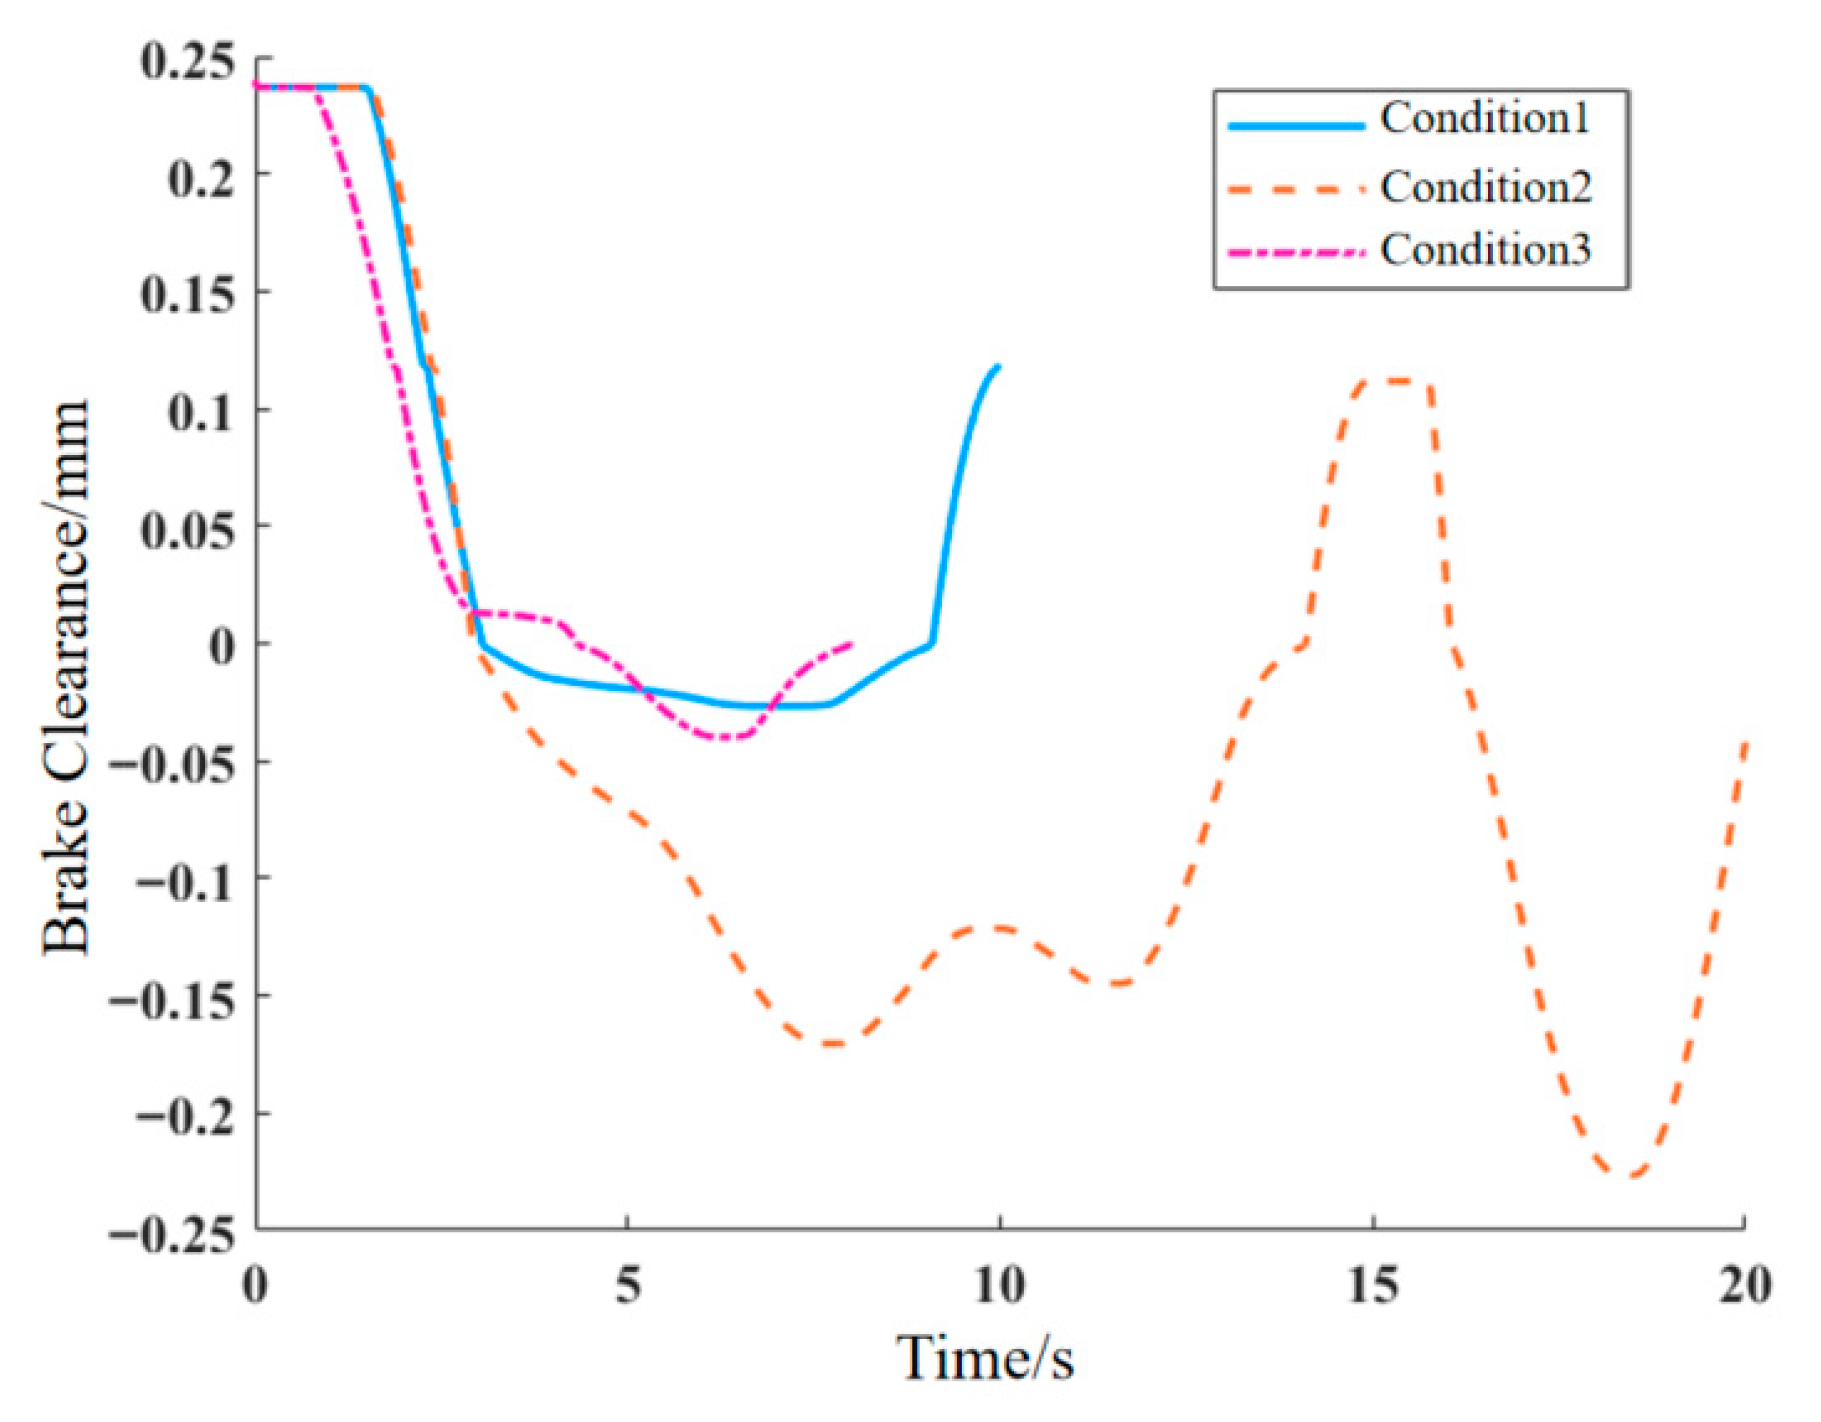
To further identify the conditions prone to braking drag, the established Amesim brake system model is used to solve for the piston displacement time-history data under different conditions, from which the brake clearance time-history data is obtained. The results are shown in Figure 19.
Figure 19.
Time-history data of brake clearance under typical working conditions.
From the figure, it can be seen that the brake clearance fluctuates more in Condition 2 than in the other two conditions. At the end of the braking period for Condition 2, the brake clearance value is the smallest and is negative, indicating a compression of the friction pad, which means there is contact between the friction pad and the brake disc.
Using the brake system dynamics model and the drag torque calculation formula, the brake system drag indices for the three typical braking conditions were obtained, as shown in Table 6.
Table 6.
Indices of brake system drag under typical brake working conditions.
As can be seen from Table 6, a negative value of the double-sided brake clearance represents the elastic compression deformation caused by the residual contact force between the friction pad and the brake disc due to the incomplete retraction of the piston after brake release. A positive value indicates that the piston can retract normally. From the table, it is observed that the residual brake pressure and piston relative displacement are positively correlated with the drag torque, while the brake clearance is inversely correlated with the drag torque. According to the standard QC/T 592-2013 “Performance Requirements and Bench Test Methods for Hydraulic Brake Caliper Assembly”, brake drag is determined when the piston displacement exceeds the single-side brake clearance threshold (taken as 0.12 mm in this paper) or the drag torque reaches or exceeds the 5 Nm threshold. The steady-state drag torques of Condition 1 (2.2821 Nm) and Condition 3 (2.3836 Nm) are both lower than the 5 Nm drag determination threshold specified by the industry standard, whereas the steady-state drag torque of Condition 2 (111.87 Nm) far exceeds this threshold.
To verify the stability and reliability of the model, the three core engineering parameters that have the most significant impact on brake drag characteristics and exhibit the largest fluctuation range in engineering practice were selected: the elastic modulus of the rectangular sealing ring, the dry friction coefficient of the piston-sealing ring interface, and the dynamic viscosity of the brake fluid. Centered on the calibrated parameter benchmark values in the paper, a fluctuation range of ±20% is set in order to analyze the influence of parameter variations on the drag torque of the three typical operating conditions.
The analysis results show that even when the above parameters vary within the common engineering range of ±20%: ① the drag torque of Condition 2 consistently remains within the range of 83.90~139.84 Nm, far exceeding 5 Nm; and ② the drag torques of Condition 1 and Condition 3 consistently remain within the range of 1.71~2.86 Nm, still below 5 Nm and significantly lower than the lower limit of Condition 2. These findings are consistent with the steady-state drag torque results (2–2.5 Nm) of the same type of disc brake reported in the literature [49], verifying the rationality of the model’s core output results.
In summary, the medium-to-low speed, prolonged-braking condition (Condition 2) can be identified as the typical condition prone to brake drag. Under this condition, severe brake drag will significantly increase driving resistance and energy consumption, while raising the thermal load and wear rate of the braking system, thereby reducing braking efficiency and long-term reliability.
5.3. Analysis of Braking Drag Condition Characteristics
Based on the conditions prone to brake drag, the influencing factors of brake drag are analyzed to clarify the distribution patterns between piston velocity, sealing pressure, friction force, and oil film thickness during piston operation.
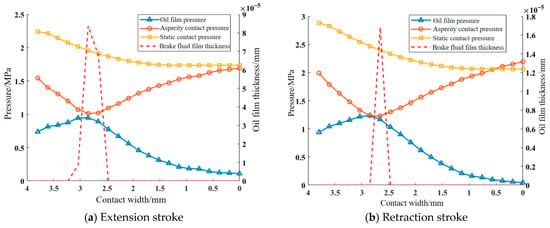
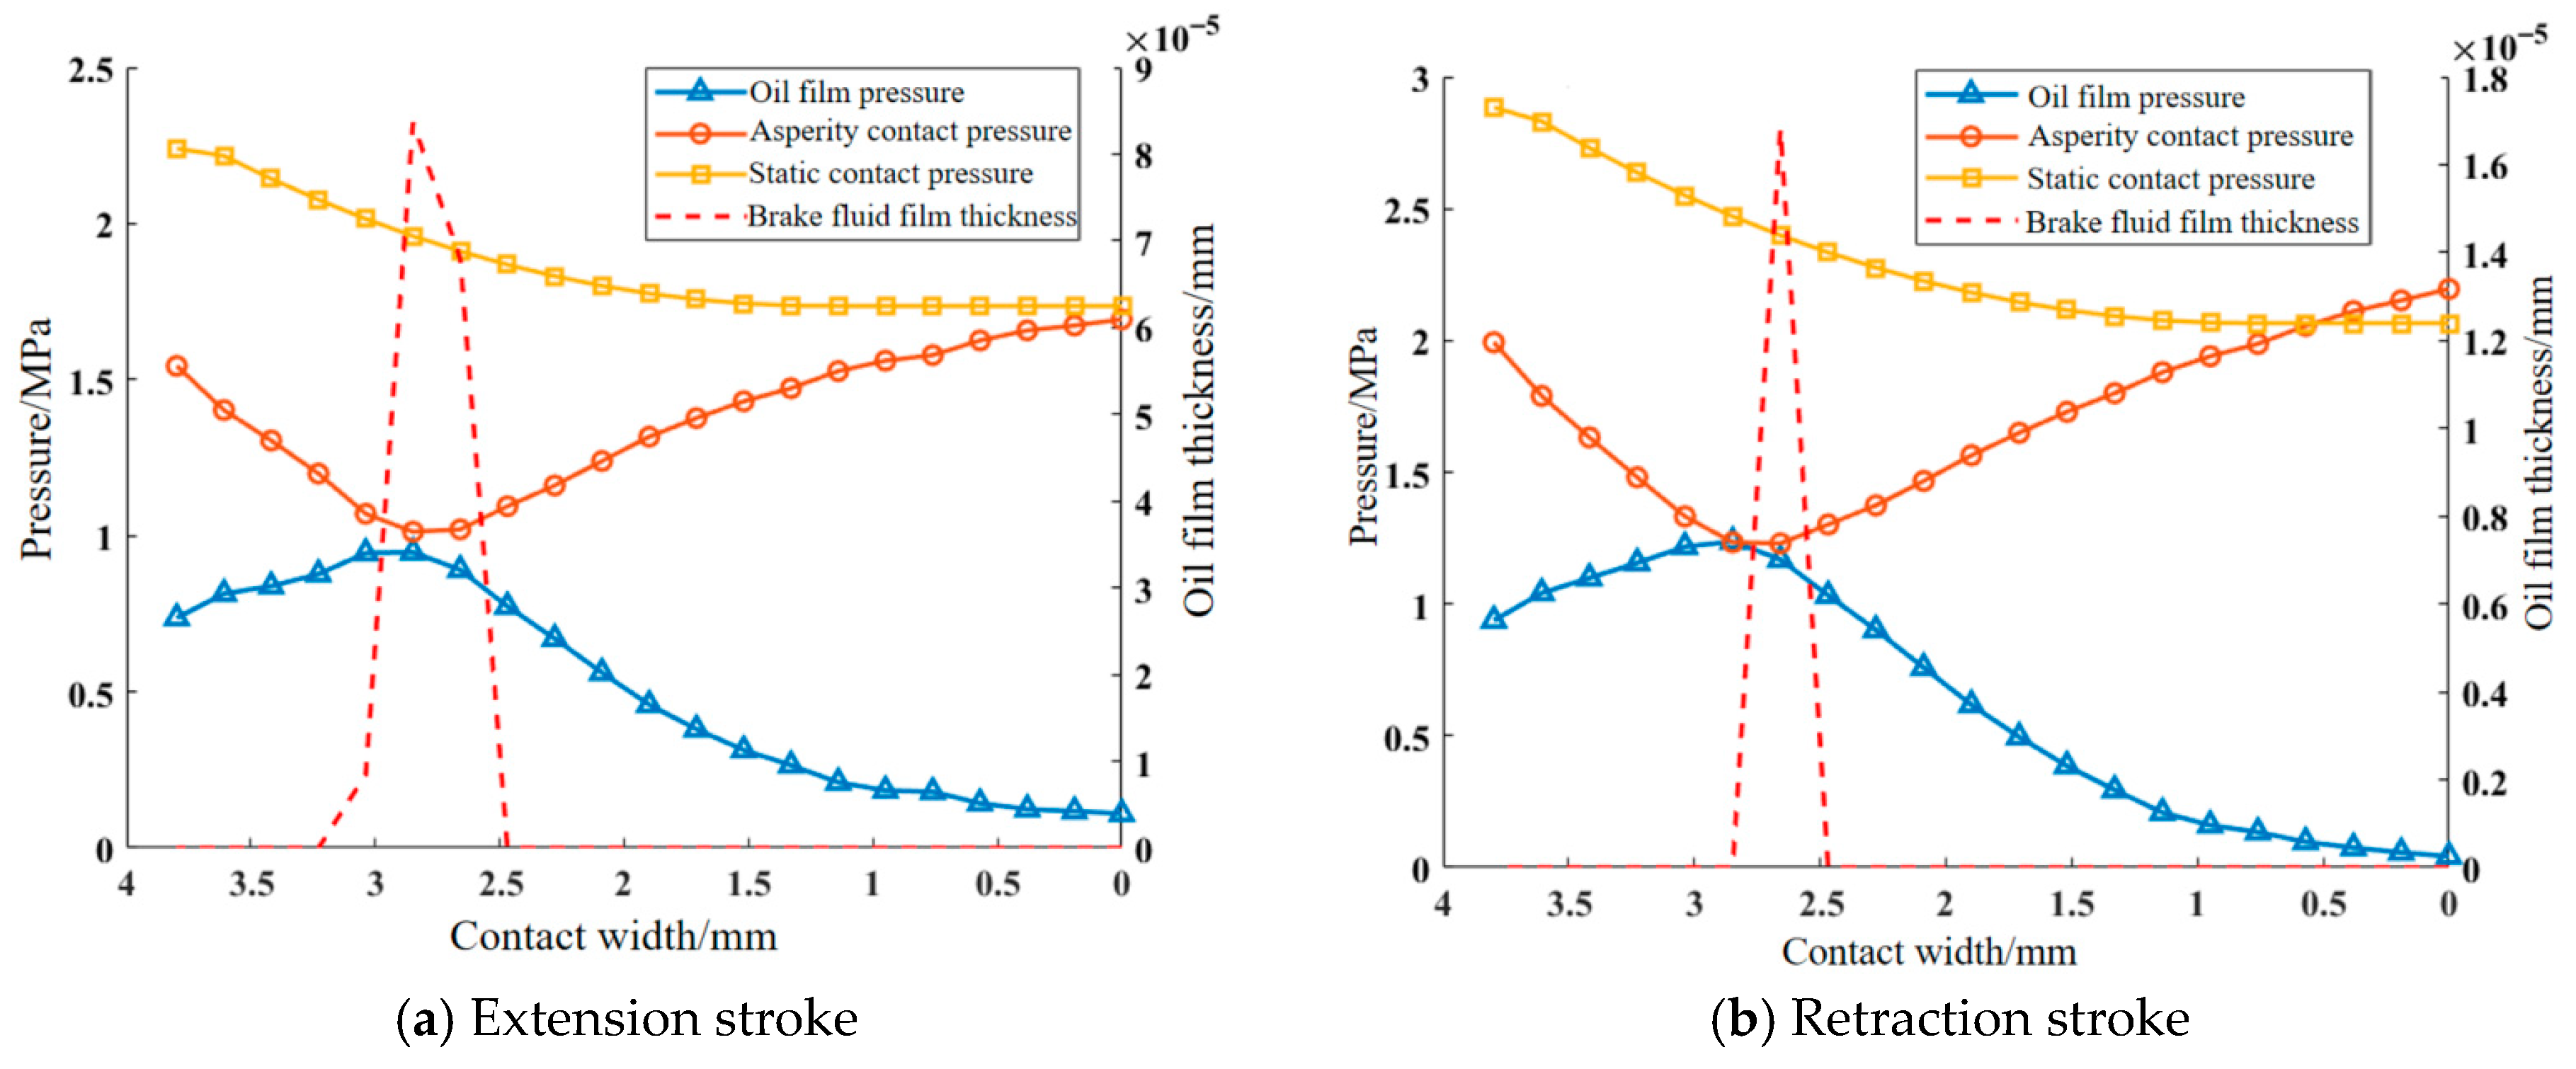
The friction force on the sealed contact surface originates from two parts: the viscous shear stress of the brake fluid and the contact shear stress of the asperities. Analyzing stable moments of the piston’s extension and retraction strokes, it is evident from Figure 20 that in Condition 2 the asperity contact pressure is greater than the oil film pressure during both strokes. This indicates that the shear stress caused by asperities plays a dominant role in the piston’s reciprocating friction force. The film thickness ratio for both strokes is less than 3, meaning the sealed contact surface is in a mixed lubrication state. Due to the elastic deformation of the sealing ring, the static contact pressure on the fluid side is greater than on the air side.
Figure 20.
Contact condition of sealed contact area.
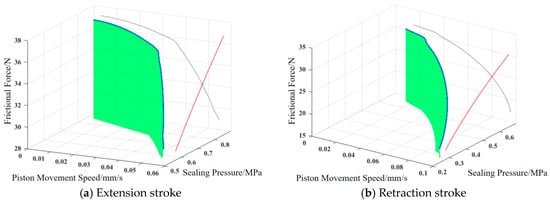
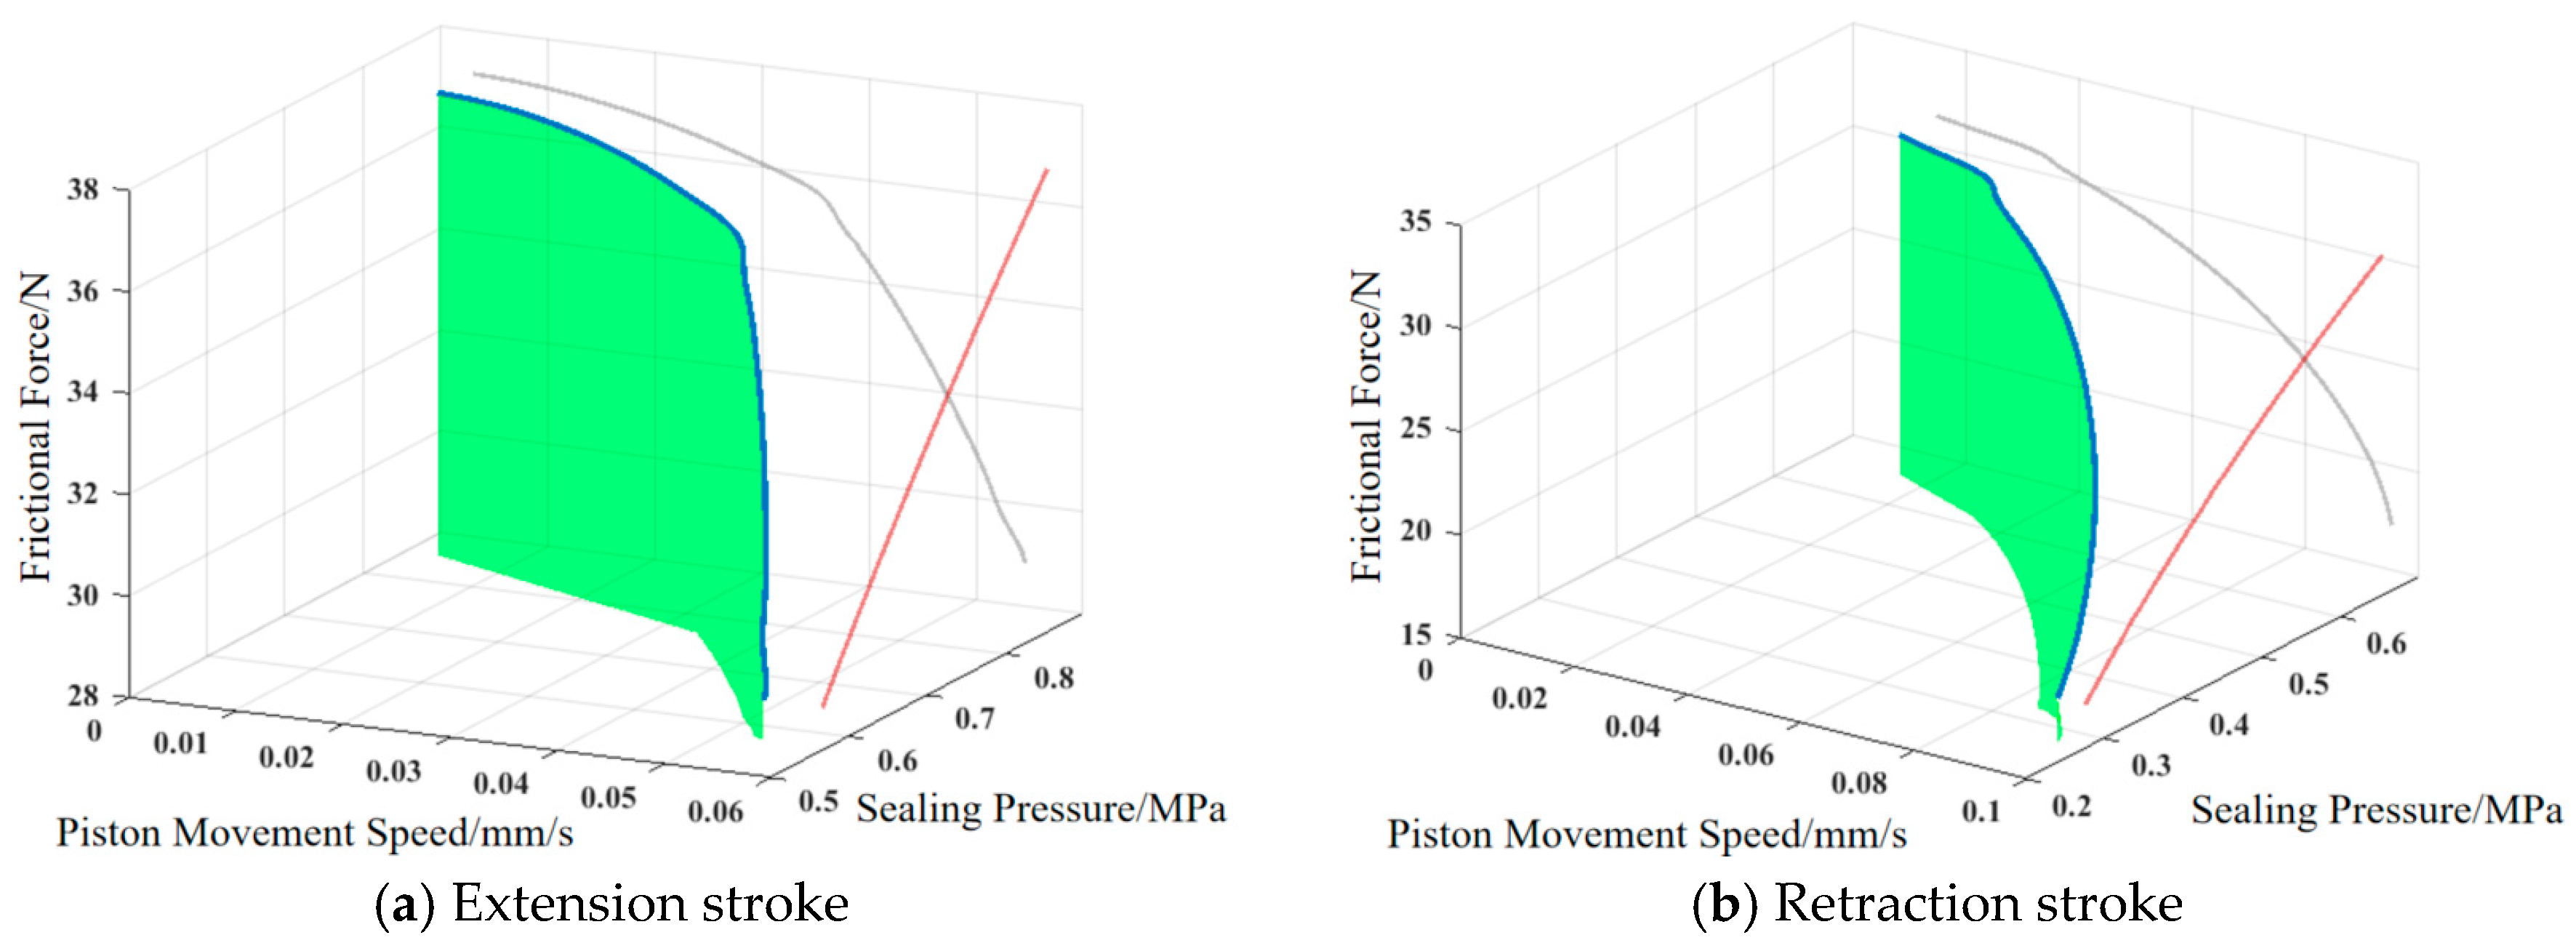
The variation trend in the piston’s reciprocating friction force with sealing pressure and piston movement speed is shown in Figure 21. In the figure, the gray line illustrates the relationship between piston movement speed and friction force, while the red line represents the relationship between sealing pressure and friction force. The blue line and the green shaded area correspond to the projections of these two variables onto the friction force axis, respectively. It can be seen that the friction force during the extension and retraction strokes is positively correlated with the sealing pressure and negatively correlated with the piston’s speed.
Figure 21.
Variation trend in frictional force with sealing pressure and piston reciprocating speed.
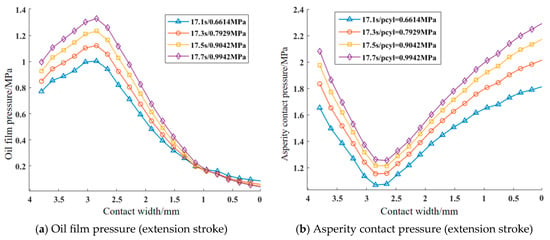
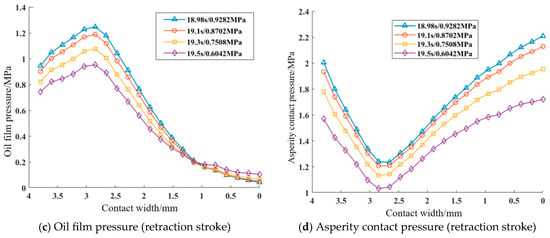
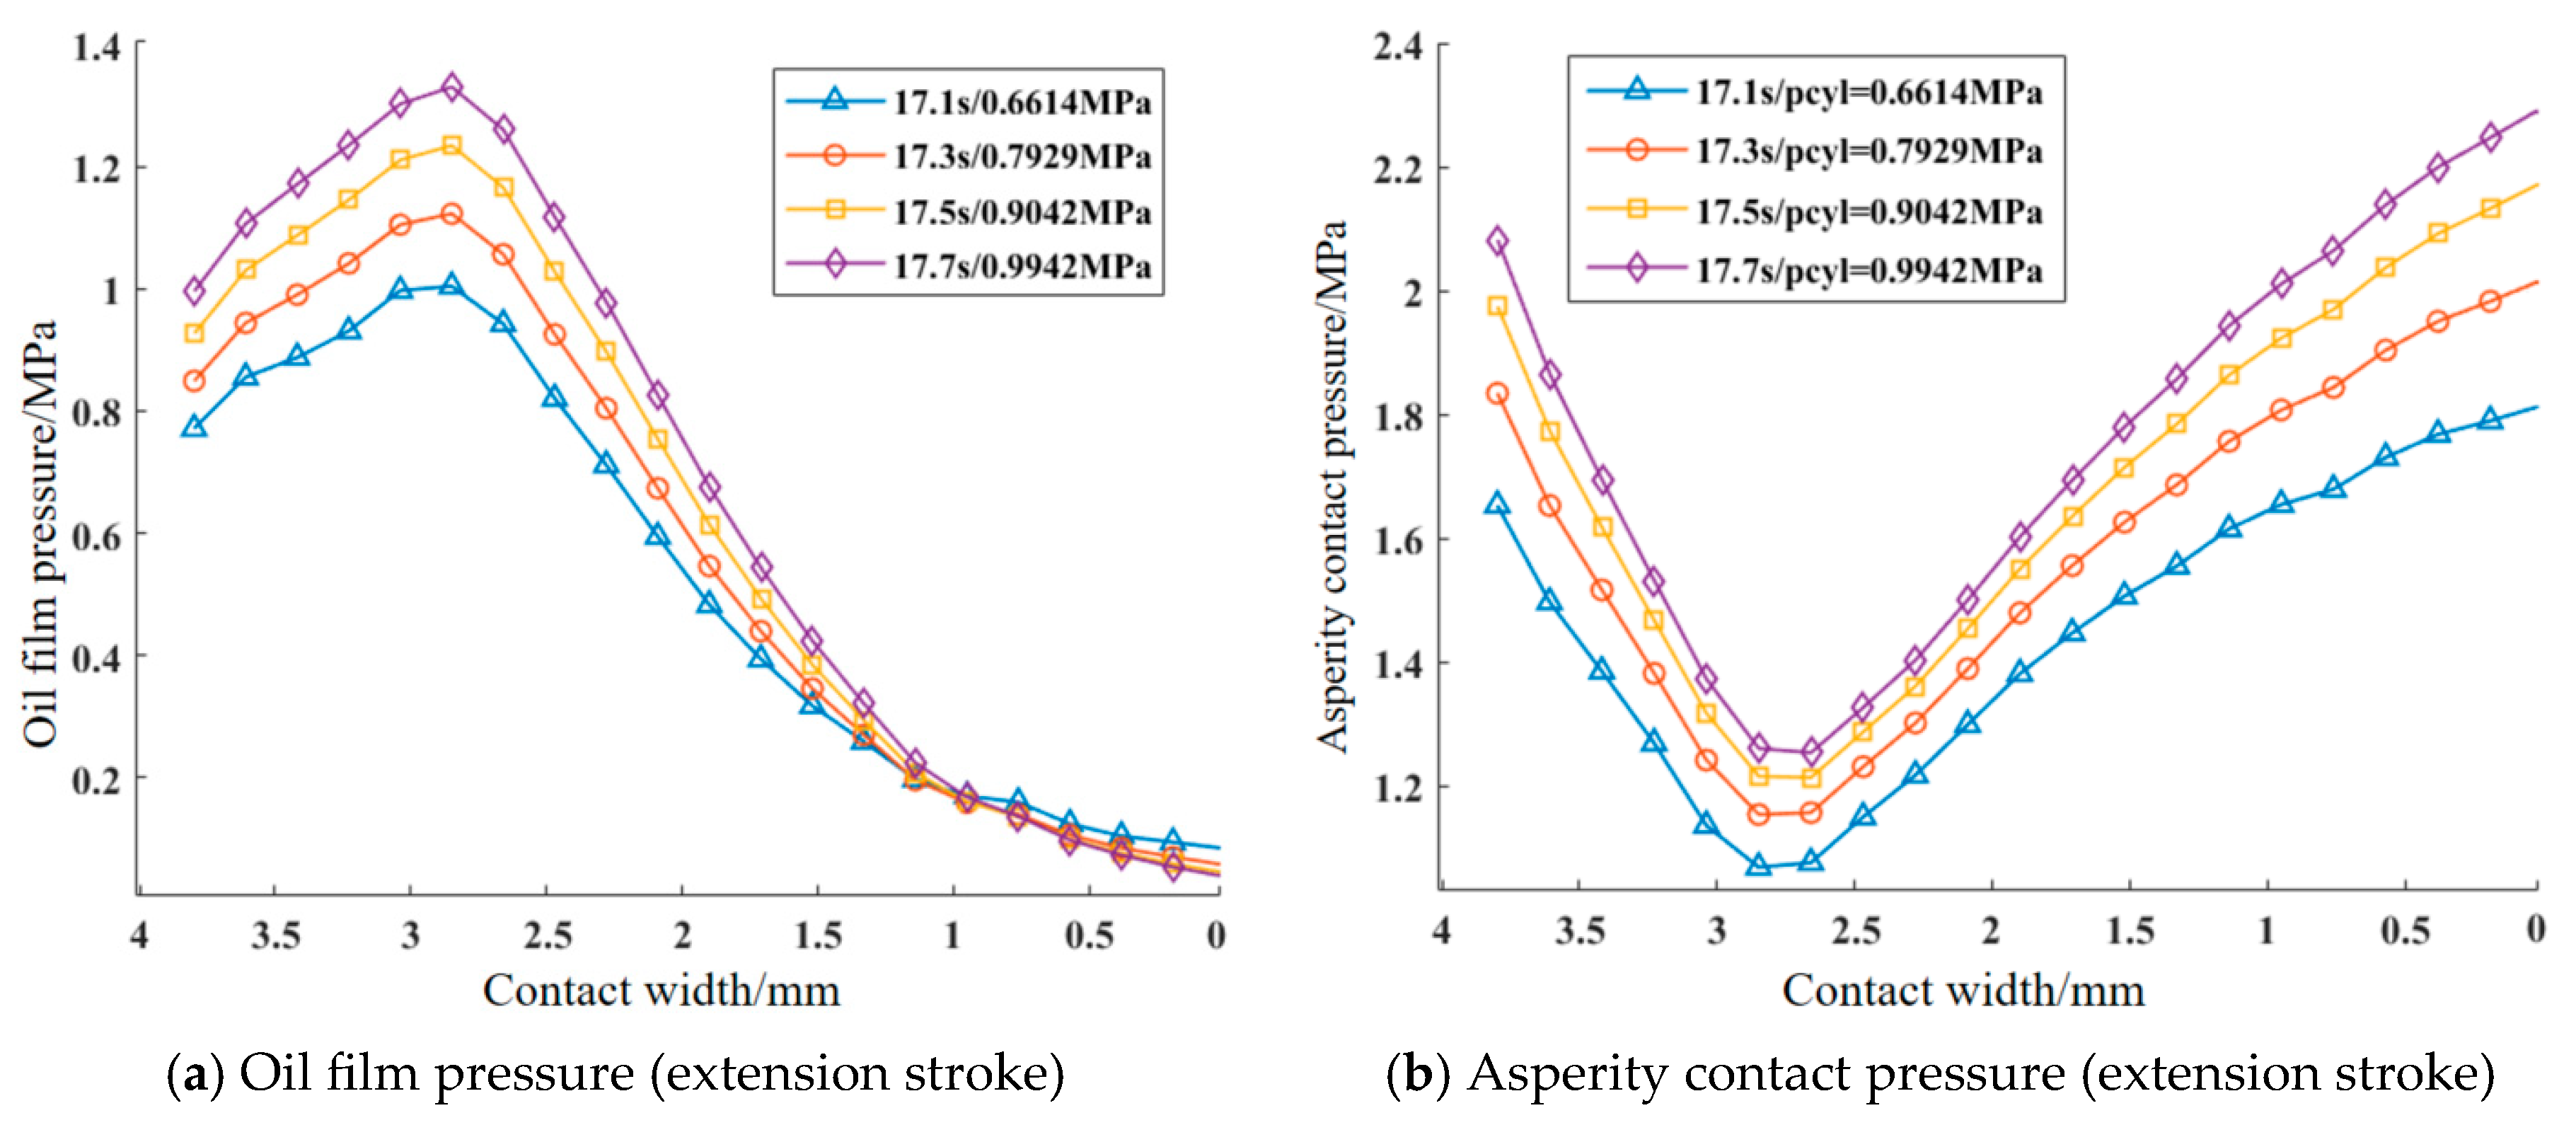
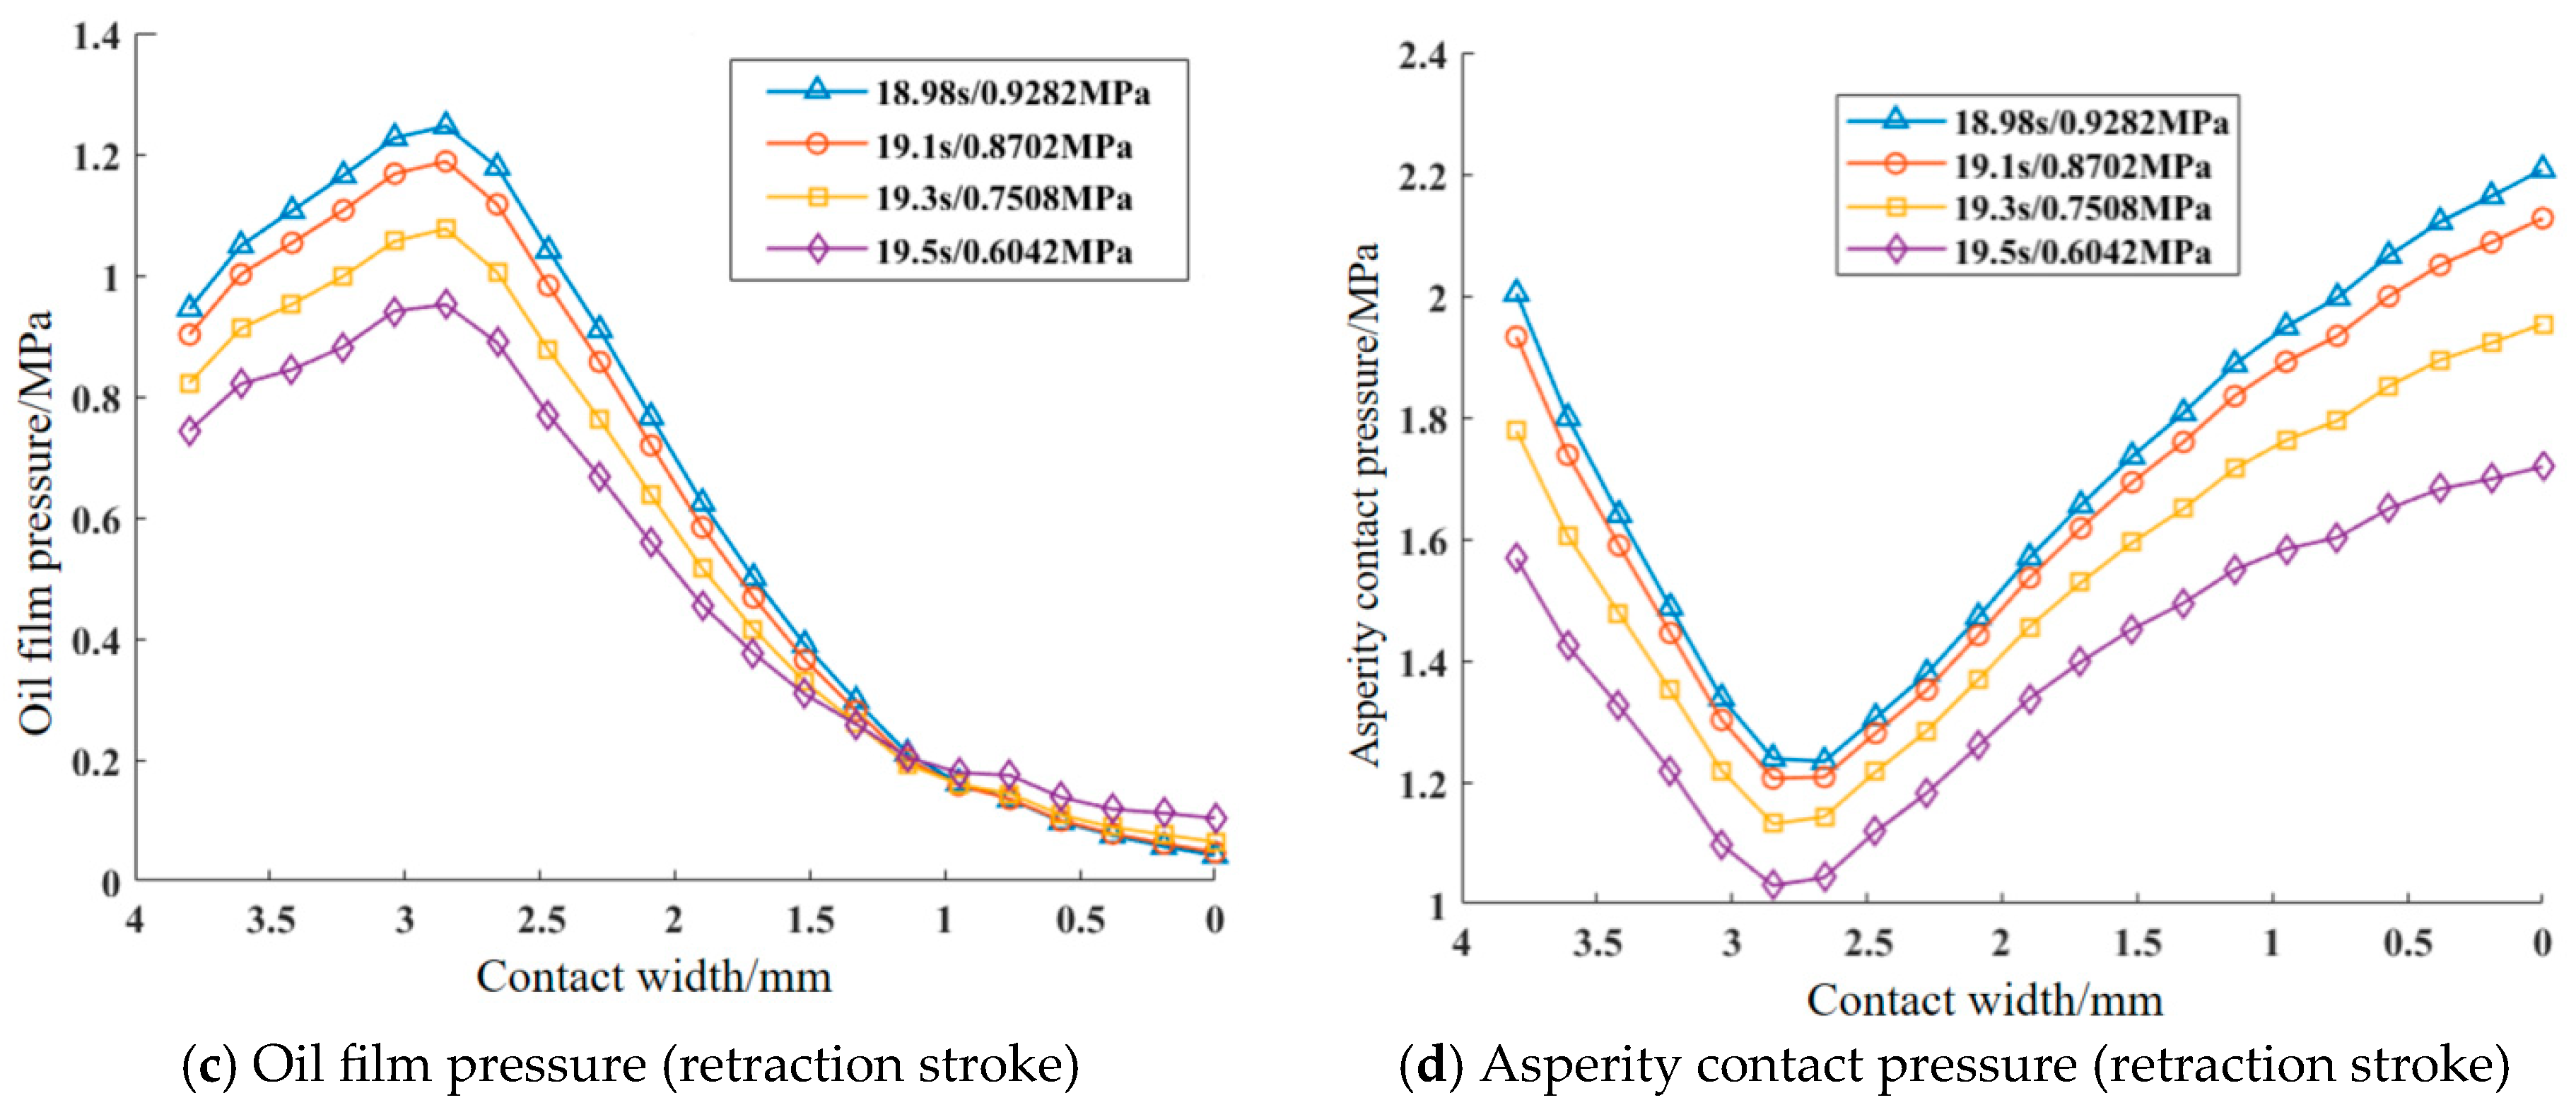
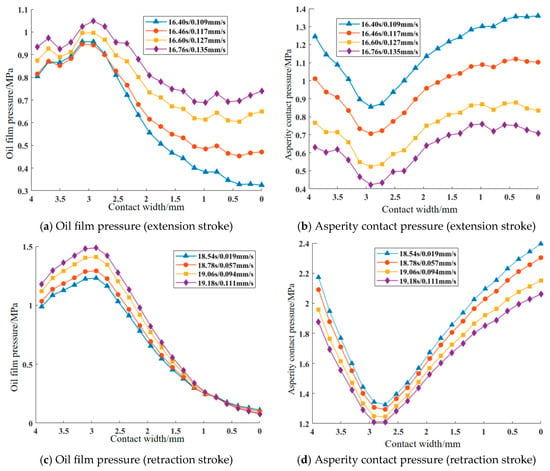
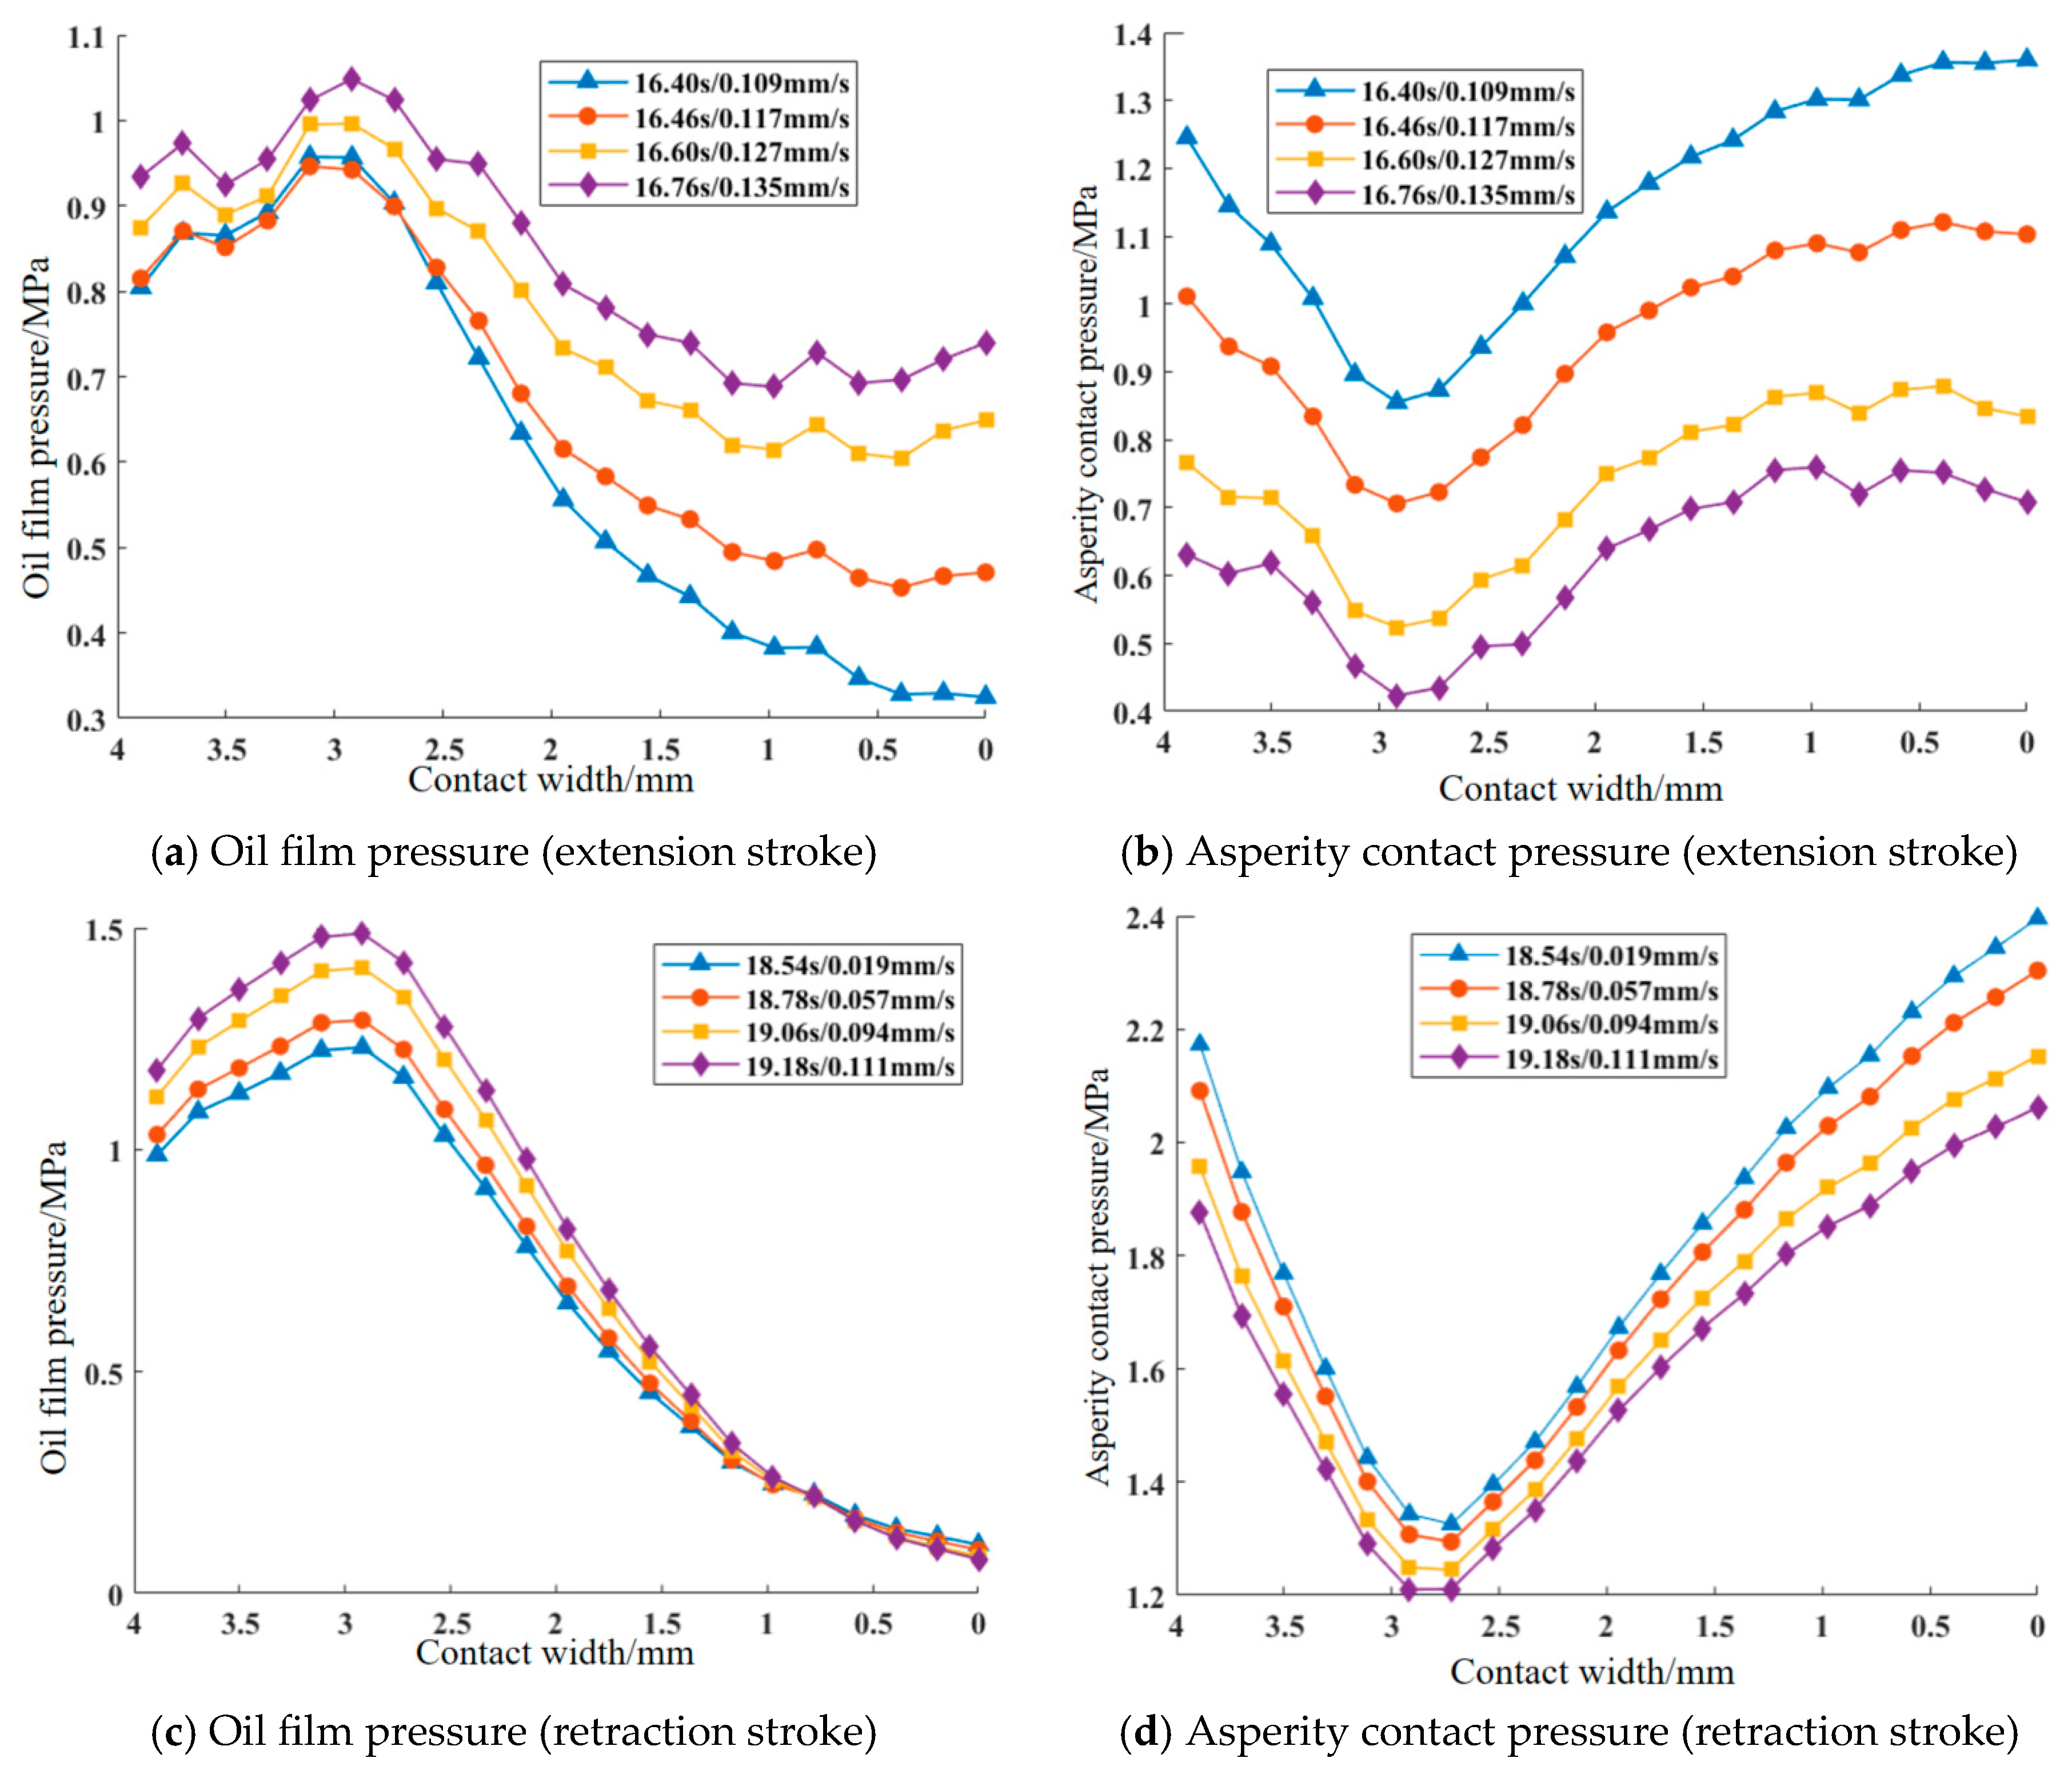
Furthermore, an analysis of the oil film pressure and asperity contact pressure under different sealing pressures and piston speeds is conducted for Condition 2. The extension and retraction strokes were discussed separately. For the extension stroke, four time points were selected as the sealing pressure began to rise: 17.1 s, 17.3 s, 17.5 s, and 17.7 s. For the retraction stroke, four time points were selected as the sealing pressure began to fall: 18.98 s, 19.1 s, 19.3 s, and 19.5 s. The analysis results are shown in Figure 22. From Figure 22, it is evident that the oil film pressure and asperity contact pressure in the sealed contact area exhibit similar distribution patterns under different brake fluid sealing pressures. On the air side of the contact area, the oil film pressure is lower, while on the fluid side, it is higher. As the brake fluid sealing pressure increases, the oil film pressure shows an increasing trend near the fluid side, while exhibiting a minor opposite trend near the air side. The asperity contact pressure also shows a similar pattern under different sealing pressures: from the fluid side to the air side, the contact pressure first decreases and then increases. Both oil film pressure and asperity contact pressure are positively correlated with the sealing pressure, which is consistent with the conclusions drawn earlier.
Figure 22.
Contact area pressure distribution under different brake fluid sealing pressures.
Using the same analytical method, the oil film pressure and asperity contact pressure of the piston during the extension and retraction strokes under different piston speeds were analyzed. The results are shown in Figure 23.
Figure 23.
Contact area pressure distribution under different piston reciprocating speeds.
From Figure 23, it can be seen that during a continuous increase in speed during the piston’s extension and retraction strokes, the asperity contact pressure in the sealed contact area shows a downward trend, while the oil film pressure shows an upward trend. This is because, with the initial conditions fixed, the total contact pressure within the entire sealed contact area remains constant. As the piston speed increases, the hydrodynamic effect of the brake fluid is enhanced, causing the oil film pressure to rise. This leads to a decrease in the asperity contact pressure in the sealed contact area, thereby reducing the piston’s motional friction, which aligns with the previously observed trend.
6. Conclusions
The main influencing factors of brake drag in disc brakes are analyzed according to user operational data; the working conditions prone to brake drag are determined using the dynamic model of brake drag mechanism based on typical braking conditions; the dynamic mechanical characteristics of the piston contact surface under the conditions prone to drag are further analyzed. This can provide a reference and basis for the optimal design of brake systems. The main conclusions are as follows:
- (1)
- The primary factor influencing brake drag in the studied disc brake is piston sliding resistance, which can be further amplified by thermal effects during high-intensity braking.
- (2)
- Using friction force and restoring force as the primary criteria, and brake clearance and drag torque as auxiliary criteria, the condition most prone to brake drag is identified as the medium-to-low speed, long-duration braking condition (Condition 2). Condition 2 is characterized by a relatively high initial braking speed, long braking time, and long braking distance.
- (3)
- Under Condition 2, the piston-seal contact area is in a state of mixed lubrication. The contact pressure is dominated by asperity contact pressure, and the piston’s reciprocating friction is also dominated by asperity shear stress. The friction force during the piston’s extension and retraction strokes is positively correlated with the sealing pressure and negatively correlated with the piston’s speed. The oil film pressure in the sealed contact area first increases and then decreases, being greater on the fluid side, while the asperity contact pressure shows the opposite trend. Both exhibit similar distribution patterns under different piston speeds and sealing pressures.
It should be noted that the drag-prone working conditions and drag characteristics laws identified in this study are obtained based on the specific floating caliper disc brake of the target vehicle. For braking systems with different structural forms or significantly different structural parameters, the model needs to be recalibrated and modified for the specific structure.
During braking, heat and particulate contamination are generated due to friction between the friction pads and the brake disc, as well as between the seals in the sealed contact area. This leads to changes in the friction coefficient and brake fluid viscosity, affecting the dynamic wear of the contact area and thereby altering its frictional characteristics [50,51,52,53,54]. In future research, the dynamic wear model can be expanded in combination with thermodynamic theory to improve the applicability and predictive accuracy of the model.
Author Contributions
Conceptualization, G.C. and D.Z.; methodology, G.C., D.W. and D.Z.; software, G.C. and D.W.; validation, G.C., D.W. and J.F.; formal analysis, G.C., D.W. and C.G.; investigation, G.C., D.W., C.G., Z.W. and X.L.; resources, J.F. and D.Z.; data curation, G.C., C.G., Z.W. and X.L.; writing—original draft preparation, G.C.; writing—review and editing, J.F., D.Z. and G.C.; visualization, G.C. and D.W.; supervision, D.Z. and J.F.; project administration, D.Z. and G.C.; funding acquisition, J.F. and D.Z. All authors have read and agreed to the published version of the manuscript.
Funding
This research was funded by the National Key R&D Program of China—New Energy Vehicles Special Project, grant number 2018YFB010156 (High-Reliability and Lightweight Design of Integrated Drive/Brake Electric Wheel Assembly); and the Shanghai Automotive Industry Science and Technology Development Foundation, grant number 1740 (Research on Multi-Axle Load Realization Method Based on Vehicle-Wide Simulation Environment).
Data Availability Statement
The data supporting the reported results are available from the corresponding author upon reasonable request.
Conflicts of Interest
Authors Chunhui Gong, Zujian Wang and Xu Long were employed by the company Jiangling Motors Co., Ltd. The remaining authors declare that the research was conducted in the absence of any commercial or financial relationships that could be construed as a potential conflict of interest.
References
- Seo, J. Component-level energy consumption and range analysis of battery electric vehicles under urban and highway driving conditions. Appl. Therm. Eng. 2025, 274, 126797. [Google Scholar] [CrossRef] [Scilit]
- Reich, A.; Sarda, A.; Semsch, M. Drag Torque in Disk Brakes: Significance, Measurement and Challenges. SAE Int. J. Commer. Veh. 2015, 8, 276–282. [Google Scholar] [CrossRef] [Scilit]
- Antanaitis, D.B. Vehicle Integration Factors Affecting Brake Caliper Drag. SAE Int. J. Passeng. Cars-Mech. Syst. 2012, 5, 1244–1258. [Google Scholar] [CrossRef] [Scilit]
- Gabriel, P.L.; Voelkel, K.; Stahl, K. Drag Losses of Wet Brakes and Clutches—A Scoping Review. Lubricants 2025, 13, 27. [Google Scholar] [CrossRef] [Scilit]
- Huchtkoetter, P.; Neubeck, J.; Wagner, A. Analysis of Brake-Drag in Disc Brakes on Vehicle-Level. In Proceedings of the 23. Internationales Stuttgarter Symposium, ISSYM 2023; Kulzer, A.C., Reuss, H.C., Wagner, A., Eds.; Springer: Wiesbaden, Germany, 2023. [Google Scholar] [CrossRef] [Scilit]
- Haag, M.; Reich, A.; Sardá, A.; Wurmlinger-Georg, M.; Semsch, M.; Borim, L.F. Residual Brake Torque Measurement on Dynamometer in Terms of Wheel Load and Side Forces; SAE Technical Paper 2017-36-0016; SAE Mobilus: Warrendale, PA, USA, 2017. [Google Scholar] [CrossRef] [Scilit]
- Steinmetz, M.F.A.; Aschersleben, J.; Panagiotidou, A. On-Road Measurements and Modelling of Disc Brake Temperatures and Brake Wear Particle Number Emissions on a Heavy-Duty Tractor Trailer. Atmosphere 2025, 16, 561. [Google Scholar] [CrossRef] [Scilit]
- Zhang, Q.; Yu, Z.; Liu, H.; Wang, R.; Mo, J.; Zhao, C.; Zhu, S. The evolution of friction and wear behavior of train brake friction pairs during sustained drag braking on long steep slopes. Wear 2025, 564–565, 205724. [Google Scholar] [CrossRef] [Scilit]
- Cai, H.; Anwana, O. Seal/Groove Performance Analysis Models; SAE Technical Paper 2002-01-2588; SAE Mobilus: Warrendale, PA, USA, 2002. [Google Scholar] [CrossRef] [Scilit]
- Chang, J.; Chen, L.; Mo, Y.; Gao, Y. Drag simulation analysis of vehicle disc brake. Mach. Des. Manuf. 2018, S1, 6–9+13. [Google Scholar] [CrossRef]
- Tan, S. Drag Characteristics and Performance Optimization of One Brake Caliper. Master’s Thesis, Tongji University, Shanghai, China, 2018. [Google Scholar]
- Zhang, L.; Wang, C. Analysis of factors influence for brake liquid volume and drag torque of caliper seal groove. Value Eng. 2020, 39, 171–173. [Google Scholar] [CrossRef]
- Wang, Y.; Ye, X.; Miao, L.; Peng, G.; Xu, X. Design optimization of caliper drag based on DFSS. In Proceedings of the 2016 SAE-China Congress & Exhibition; Springer Nature: Singapore, 2016; pp. 903–907. [Google Scholar]
- Sun, M.; Lu, L.; Bai, X.; Ni, H.; Shi, L. The Time-Dependent Reliability Analysis of Brake Piston Special-Shaped Seal of the Caliper Disc Brake. J. Sens. 2022, 2022, 2820010. [Google Scholar] [CrossRef] [Scilit]
- Mohan, S.; Dake, P.; Mullapudi, D.; Ingole, S. A Method to Capture and Analyze Brake Dynamic Drag; SAE Technical Paper 2021-26-0477; SAE Mobilus: Warrendale, PA, USA, 2021. [Google Scholar] [CrossRef] [Scilit]
- Lei, W.; Li, W.; Zeng, F.; Ren, X.; Wang, Y. Discussion on reducing drag torque test method for disc brake. Automob. Parts 2020, 6, 82–85. [Google Scholar] [CrossRef]
- Tamasho, T.; Doi, K.; Hamabe, T.; Koshimizu, N.; Suzuki, S. Technique for reducing brake drag torque in the non-braking mode. JSAE Rev. 2000, 21, 67–72. [Google Scholar] [CrossRef] [Scilit]
- Fyhr, P.; Hjelm, R.; Wahlström, J. An Experimental Study of Forced Vibration Influence on Disc Brake Drag Torque in Heavy Commercial Road Vehicles. Tribol. Ind. 2022, 44, 123–131. [Google Scholar] [CrossRef] [Scilit]
- Li, B.; Li, D.; Huang, T.; Liao, Y.S. Development and verification of braking system based on new energy vehicle. In Proceedings of the 2021 Chinese Society of Automotive Engineers Annual Conference and Exhibition, 3rd ed.; Shenzhen BYD Automotive Engineering Research Institute: Shenzhen, China, 2021; pp. 223–227. Available online: https://kns.cnki.net/kcms2/article/abstract?v=iwDheDcO5w4nrGH_rfBVnZxOB-UZqOsIR5A3UCjJ68bsnHlVVc7z1-hIaGajMgnAU2AtL-gntBDGuE2V9umz31vBTrJJ8Kdlron94j0NxUGlbgcOigxD8FaULze4jR1URSxzqhbK5lEs8WuWGKeRhYGUY9a-m-TN7Ax3SbtodlsKD5q5vFULQgJXZmcHvNoD&uniplatform=NZKPT&language=CHS (accessed on 9 January 2026).
- Hong, Q.; Wang, Q.; Xia, J. Key control factors of low drag torque calipers with ‘八’ shaped reset spring structure. Automob. Appl. Technol. 2022, 47, 32–36. [Google Scholar] [CrossRef]
- Wang, B. Design of Automobile Disc Brake Drag Torque Test System. Master’s Thesis, Anhui Agricultural University, Hefei, China, 2020. [Google Scholar] [CrossRef]
- Almachi, J.C.; Saguay, J.; Anrango, E.; Cando, E.; Reina, S. Clustering-Based Urban Driving Cycle Generation: A Data-Driven Approach for Traffic Analysis and Sustainable Mobility Applications in Ecuador. Sustainability 2025, 17, 3353. [Google Scholar] [CrossRef] [Scilit]
- Qiu, H.; Cui, S.; Wang, S.; Wang, Y.; Feng, M. A Clustering-Based Optimization Method for the Driving Cycle Construction: A Case Study in Fuzhou and Putian, China. IEEE Trans. Intell. Transp. Syst. 2022, 23, 18681–18694. [Google Scholar] [CrossRef] [Scilit]
- Liu, H.; Xie, Y.; Gao, P.; Yan, P.; Zhan, Z.; Wang, Z. Main influencing parameter screening for the overall dynamics response of a planetary transmission based on a grey relational analysis. Mech. Syst. Signal Process. 2022, 173, 109030. [Google Scholar] [CrossRef] [Scilit]
- Heng, X.; Wang, A.; Zhang, H.; Yin, Y. Research on the dynamic variation law of the discontinuous characteristics of the curvic coupling of aero-engine rotors under working conditions. Eng. Sci. Technol. Int. J. 2024, 59, 101870. [Google Scholar] [CrossRef] [Scilit]
- Huang, Y.; Liu, S.; Chen, H.; Dai, J.; Wang, X.; Tao, H. Dynamic behavior analysis method for the normal and faulty drivetrain of wind turbine under multi-working conditions. Energy Sci. Eng. 2023, 11, 3619–3640. [Google Scholar] [CrossRef] [Scilit]
- Fu, D.; Gao, R.; Li, Q.; Chen, P. Modeling and simulation analysis of hydraulic brake system based on AMESim. Agric. Equip. Veh. Eng. 2021, 59, 125–129. [Google Scholar] [CrossRef]
- Liu, Y. Study on Simulation of Brake Pedal Feel in a Passenger Car. Master’s Thesis, Liaoning University of Technology, Jinzhou, China, 2014. [Google Scholar]
- Anwana, O.; Cai, H.; Chang, H. Analysis of Brake Caliper Seal-Groove Design; SAE Technical Paper 2002-01-0927; SAE Mobilus: Warrendale, PA, USA, 2002. [Google Scholar] [CrossRef] [Scilit]
- Hong, B. Efficiency-Reinforcement Study for Elastic Hydraulic Reciprocating Sealing Based on Numerical Calculation. Master’s Thesis, Tianjin University of Science and Technology, Tianjin, China, 2015. [Google Scholar]
- Huchtkötter, P.; Neubeck, J.; Wagner, A.; Wittke, C. Real-Driving Residual-Drag-Torque of Disc Brakes. In Proceedings of the 13th International Munich Chassis Symposium 2022, IMCS 2022; Pfeffer, P., Ed.; Springer: Berlin/Heidelberg, Germany, 2024. [Google Scholar]
- Wang, S.; Zheng, S.; Chen, T.; Liu, X. Fuel cell vehicle reliability analysis based on demonstration operation. J. Mech. Strength 2014, 36, 51–56. [Google Scholar] [CrossRef]
- Xue, H.; Zhou, J.; Tong, P. Mechanical fault diagnosis method of in-wheel motor based on WMM-HMM. J. Huazhong Univ. Sci. Technol. (Nat. Sci. Ed.) 2021, 49, 32–37. [Google Scholar] [CrossRef]
- Chen, T.; Zheng, S.; Liu, X.; Feng, J. Statistical correlation analysis on the multiple failure modes of a fuel cell engine based on competing risks. Automot. Eng. 2015, 37, 266–270+283. [Google Scholar] [CrossRef]
- QC/T 592-2013; Performance Requirements and Bench Test Methods for Hydraulic Brake Caliper Assemblies. Ministry of Industry and Information Technology: Beijing, China, 2013.
- Šarkan, B.; Loman, M.; Kosiba, J.; Paumer, M. Measurement of Brake Fluid Boiling Point. Acta Technol. Agric. 2025, 28, 124–130. [Google Scholar] [CrossRef] [Scilit]
- SAE Standard J1703_202403; Motor Vehicle Brake Fluid. SAE International Technical Standard: Warrendale, PA, USA, 2024. [CrossRef] [Scilit]
- Qian, W.; Jiang, G.; Xie, L.; Li, G. Factors affecting the stress and contact pressure of rectangular sealing rings. Hydraul. Pneum. 2015, 3, 32–35. [Google Scholar] [CrossRef]
- Jiao, B.; Wang, F.; Ma, X.; Lu, X.; Li, T. Piston Ring—Cylinder liner lubrication model and related software development for low-speed two stroke marine diesel engines. Chin. Intern. Combust. Engine Eng. 2020, 41, 107–115+126. [Google Scholar] [CrossRef]
- Du, J.X. Sealing Performance Analysis of Packing Based on Mixed Lubrication Theory. Master’s Thesis, Dalian University of Technology, Dalian, China, 2022. [Google Scholar] [CrossRef]
- Wang, Y.; Liu, Y.; Huang, W.; Guo, F.; Wang, Y. The progress and engineering application of theoretical model for mixed lubrication. Tribology 2016, 36, 520–530. [Google Scholar] [CrossRef]
- Stefanelli, R.; Fichera, G.; Genovese, A.; Dell’Annunziata, G.N.; Sakhnevych, A.; Timpone, F.; Farroni, F. A Comprehensive Review of Rubber Contact Mechanics and Friction Theories. Appl. Sci. 2025, 15, 11558. [Google Scholar] [CrossRef] [Scilit]
- Peng, C.; Wei, J.; Liu, K.; Cao, H. Dynamic characteristics of angular contact ball bearings with mild defect on outer raceway. Eng. Fail. Anal. 2025, 178, 109721. [Google Scholar] [CrossRef] [Scilit]
- Wang, G.; Liu, H. Research progress of joint effects model in multibody system dynamics. Chin. J. Theor. Appl. Mech. 2015, 47, 31–50. [Google Scholar] [CrossRef]
- Huang, Z.; Zhang, L. Stationary solutions of high dimensional reduced FPK equation using both finite difference method and successive over-relaxation method. Chin. J. Comput. Mech. 2008, 2, 177–182. [Google Scholar]
- George, K.; Nikas, R.A. Elastohydrodynamics and Mechanics of Rectangular Elastomeric Seals for Reciprocating Piston Rods. ASME. J. Tribol. 2003, 125, 60–69. [Google Scholar] [CrossRef] [Scilit]
- Zhao, L.; Wang, Z.; Feng, J.; Zheng, S. Research on reliability condition characteristics of electric drive system based on user big data. Automot. Eng. 2020, 42, 1386–1396. [Google Scholar] [CrossRef]
- Warin, T.; d’Anglade, P.M.; de Marcellis-Warin, N. Optimising industrial efficiency: Integrating K-Means clustering and data Science for sustainable manufacturing and waste Reduction. Int. J. Sustain. Eng. 2025, 18, 2527300. [Google Scholar] [CrossRef] [Scilit]
- Pan, W.; Liu, H.; Fan, Y.; Wei, C. Research on caliper drag based on detached state of brake disc and pad. Automob. Technol. Mater. 2025, 9, 11–18. [Google Scholar] [CrossRef]
- Chen, Y.; Xie, Q.; He, C.; Lin, Q.; Li, P.; Liu, J. Research on the friction performance and structural optimization of brake pads considering train brake disc temperature. Int. Commun. Heat Mass Transf. 2025, 163, 108707. [Google Scholar] [CrossRef] [Scilit]
- Topczewska, K.; Kuciej, M.; Yevtushenko, A.; Senatore, A. Calculation of the temperature field in the thermal sensitive disc-pad couple during multiple braking. Int. Commun. Heat Mass Transf. 2025, 160, 108352. [Google Scholar] [CrossRef] [Scilit]
- Wang, T.; Wang, Y.; Wang, J.; Fan, X. The effect of rust particles under water contamination elastohydrodynamic lubrication of rolling mill oil film bearing. Mach. Des. Manuf. 2017, 12, 40–44. [Google Scholar] [CrossRef]
- Shen, Y.; Yang, W.; Zhang, Q. Pollution control and performance optimization of aircraft engine lubricating oil system. Intern. Combust. Engine Parts 2025, 12, 47–49. [Google Scholar] [CrossRef]
- Romagnuolo, F.; Avolio, S.; Fichera, G.; Ruffini, M.; Stefanelli, R.; Timpone, F. A Co-Simulation Platform with Tire and Brake Thermal Model for the Analysis and Reproduction of Blanking. Vehicles 2023, 5, 1605–1621. [Google Scholar] [CrossRef] [Scilit]

Disclaimer/Publisher’s Note: The statements, opinions and data contained in all publications are solely those of the individual author(s) and contributor(s) and not of MDPI and/or the editor(s). MDPI and/or the editor(s) disclaim responsibility for any injury to people or property resulting from any ideas, methods, instructions or products referred to in the content. |
© 2026 by the authors. Licensee MDPI, Basel, Switzerland. This article is an open access article distributed under the terms and conditions of the Creative Commons Attribution (CC BY) license.