


Abstract
The METEO Unit of the National Observatory of Athens has developed a suite of operational early warning systems for five Greek municipalities and one region, aimed at providing timely observational and forecast information to support preparedness and decision-making for weather-related and environmental hazards. This study presents the design, technological architecture, and operational implementation of these systems as a multi-site case study. The systems follow a common modular architecture that integrates near-real-time observations from meteorological, water-level, and air-quality sensors with satellite and lightning observations and numerical forecasts of weather, fire danger, and mineral-dust transport. All products are processed and displayed through web-based platforms accessible from personal computers, tablets, and mobile devices, while automated notifications are generated when predefined observational or forecast thresholds are exceeded. The common architecture has been adapted to the distinct hazard profiles and operational requirements of Kilkis, Nevrokopi, Athens, Penteli, Rethymno, and the Region of Thessaly. The individual implementations address different combinations of flooding, strong winds, temperature extremes, wildfire danger, frost, Saharan dust, and particulate-matter pollution. The results demonstrate that a shared technological framework can be transferred across contrasting geographical settings while allowing the observational equipment, forecast products, warning thresholds, and presentation of information to be tailored to local needs. The developed systems provide an operational example of locally embedded, multi-hazard early warning services and establish a flexible basis for the future integration of additional observations, forecast products, and impact-oriented flood-forecasting capabilities.
1. Introduction
In recent years, the increasing frequency and intensity of severe and extreme weather events have highlighted the urgent need to strengthen societal resilience and adaptive capacity [1]. The growing impacts on human safety, infrastructure, and economic activities underline the importance of early preparedness, systematic risk management, and the enhancement of public awareness. Climate change, rapid urbanization, and the increasing interdependence of critical infrastructure further amplify the consequences of hydrometeorological hazards, making timely, reliable, and locally actionable warnings an essential component of disaster risk reduction and climate adaptation [2].
In Greece, the High Impact Weather Events Database (HIWE-DB) has systematically recorded weather-related events involving floods, flash floods, windstorms, tornadoes, hail, snow or frost, and lightning, together with their direct social impacts, since 2000 [3]. During the period 2000–2025, it recorded 626 weather events, corresponding to 1871 local events at the region level (Nomenclature of Territorial Units for Statistics, NUTS 3). Flood-related hazards dominate the dataset, with 74% of the events (463) involving flash floods, while 32% involve multiple hazardous phenomena. Events are indexed independently on a three-level scale for weather intensity (W) and impact severity (I). In terms of impact severity (I), the events are relatively evenly distributed: 194 out of the 626 events (31%) were classified as I1, 237 (38%) as I2, and 195 (31%) as I3 [3].
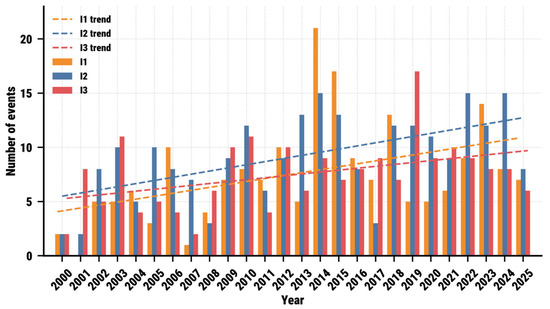
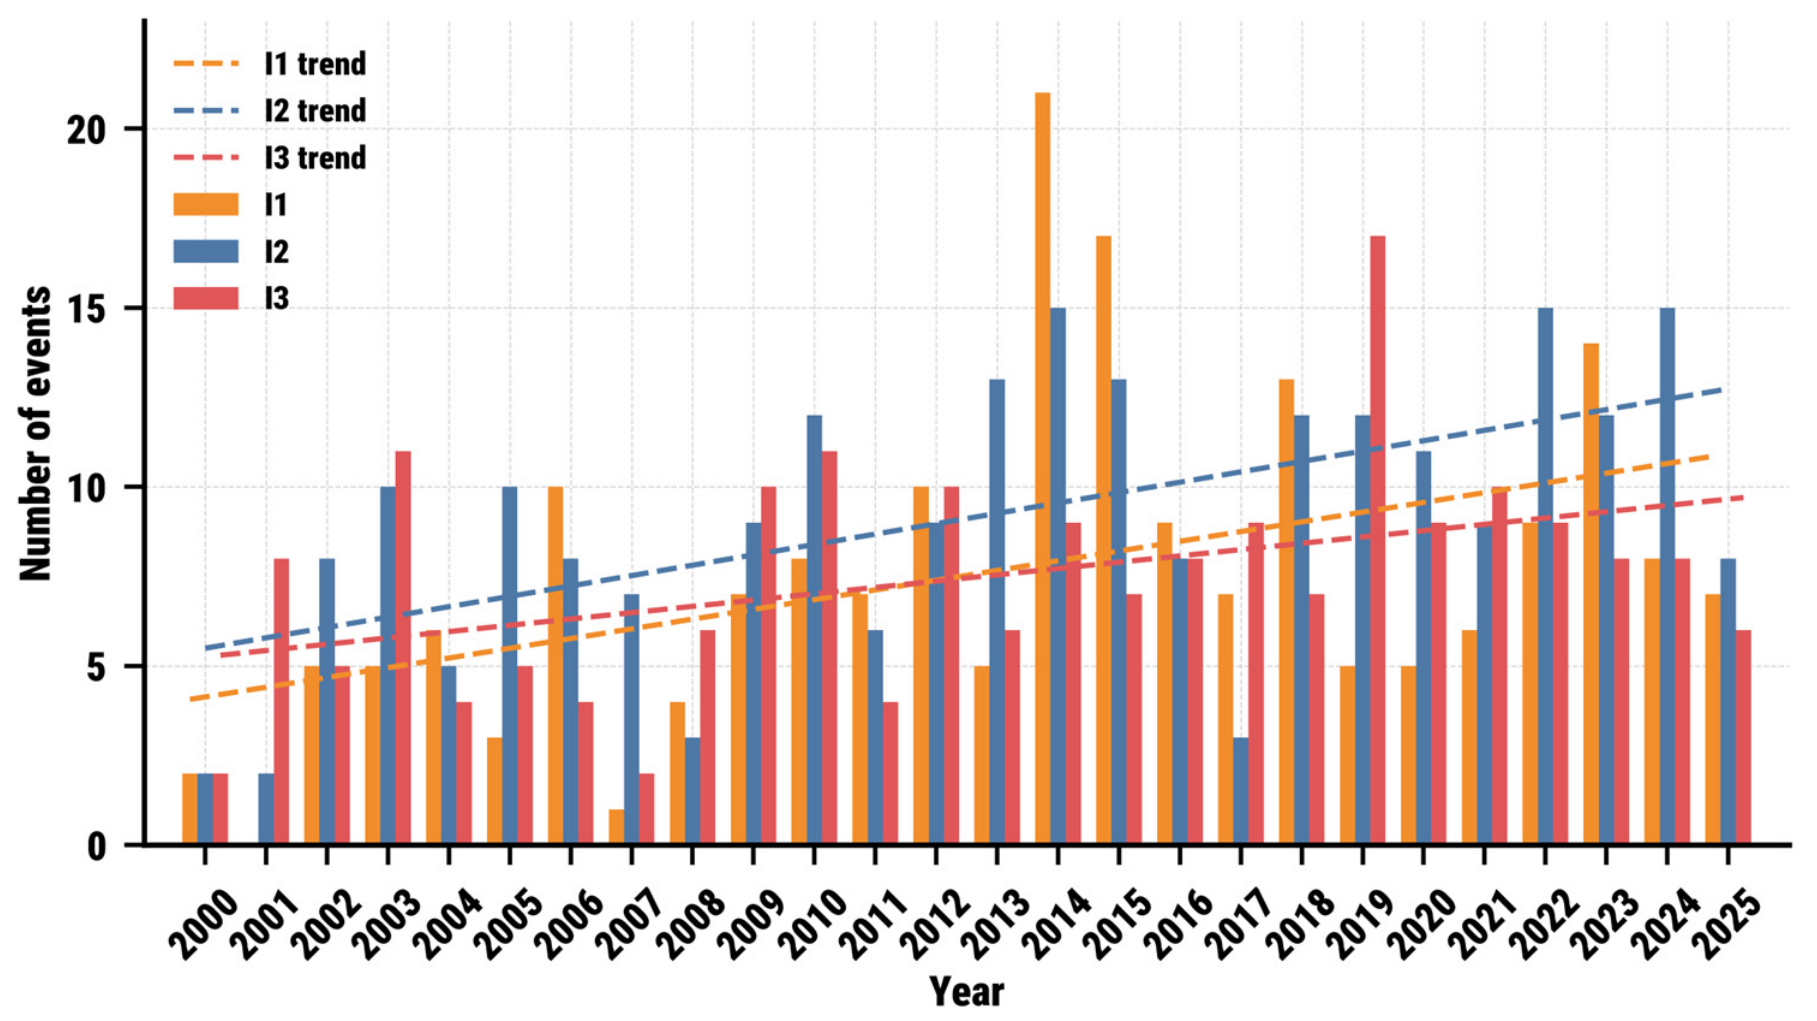
All levels of impact severity show an upward trend (Figure 1). The trends are statistically significant for low (I1) (tau = 0.37, p = 0.010) and moderate (I2) (tau = 0.40, p = 0.006) impact events. The most severe events (I3) do not show a statistically significant trend; however, they show an absolute increase of 38% in the second half of the study period compared with the first. Seasonally, events and severe impacts peak during autumn and early winter. The most frequent direct impacts are transport disruptions (recorded in 72% of local events) and damage to buildings (47% of local events). The database recorded 269 confirmed fatalities with an increase of 23% in the second half of the study period compared with the first. Flood-related phenomena are the deadliest, accounting for 62% of all fatalities, followed by lightning (17%) and windstorms (14%). The highest number of fatalities (24) occurred in Western Attica during the November 2017 extreme flash-flood event. Spatially, the most frequently affected areas include highly urbanized regions, such as the Athens Metropolitan Area and Thessaloniki, due to their large populations and high concentration of exposed people and assets. The most extreme recorded event was Storm Daniel in September 2023 which affected several regions and severely devastated the Thessaly region, causing 17 fatalities, triggering over 5000 rescues, and resulting in unprecedented damage and long-term problems for agriculture, critical infrastructure, livelihoods, and public health [3,4].
Figure 1.
Annual number of high-impact weather events in Greece by impact severity class (I1–I3) during 2000–2025, together with the corresponding trend lines.
In response to these challenges, effective early warning systems (EWSs) constitute a cornerstone in disaster preparedness and societal coping capacity, as they enable timely decision-making and proactive responses by authorities, communities and individuals.
An EWS should not be understood solely as a forecasting or alert-generation tool, but as an integrated, end-to-end system linking disaster-risk knowledge, observations and forecasting, warning dissemination and communication, and preparedness and response capabilities [5,6]. The global policy framework for this approach has been strengthened through the United Nations Early Warnings for All (EW4All) initiative, launched in 2022 with the objective of ensuring that every person on Earth is protected by life-saving early warning systems for hazardous weather, water, and climate events by the end of 2027 [5,6]. The initiative is co-led by World Meteorological Organization (WMO), the United Nations Office for Disaster Risk Reduction, the International Telecommunication Union, and the International Federation of Red Cross and Red Crescent Societies and is structured around four mutually dependent pillars: (i) disaster-risk knowledge; (ii) detection, observation, monitoring, analysis, and forecasting; (iii) warning dissemination and communication; and (iv) preparedness and response capabilities.
The EW4All framework also emphasizes that technically skillful forecasts are insufficient unless warnings are understandable, accessible, trusted, and connected to pre-agreed actions. Recent research therefore stresses the need for people-centred and locally embedded multi-hazard systems, developed with end-users and adapted to local vulnerabilities, institutional responsibilities, communication practices, and response capacities [7]. In parallel, the transition from hazard-based information to impact-based forecasting and warning can improve the relevance of warning for decision-making by translating predicted conditions into expected consequences and recommended protective actions [8,9]. More broadly, the effectiveness of an EWS depends on the performance of the complete warning chain—from observations and prediction to communication, interpretation, and decision-making—rather than on any single technical component [10].
In Greece, civil protection responsibilities are shared between the central government and local (municipal and regional) authorities, which are increasingly expected to develop or support mechanisms for hazard monitoring, early warning, and public communication tailored to their own jurisdiction. In this context, the METEO Unit of the National Observatory of Athens, in close collaboration with interested municipalities and regions, has developed a suite of operational early warning systems over the last six years, tailored to the specific needs of local communities. These systems combine in situ observations (weather stations and water-level sensors), satellite and lightning monitoring, together with high-resolution weather, fire-danger and mineral dust forecasts. The integration of these diverse datasets into a single, web-based platform ensures that end-users, primarily local civil protection authorities, but also the citizens, can access reliable and up-to-date information through a user-friendly interface. This local and regional implementation is consistent with the EW4All framework, particularly by strengthening hazard observation and forecasting, supporting warning dissemination, and providing authorities with information that can inform preparedness and response procedures.
By providing timely alerts and actionable information, the developed systems are intended to support preparedness and response capabilities before and during severe weather events, although their effect on operational decision-making has not yet been systematically evaluated. Furthermore, their versatility extends beyond civil protection, offering benefits for environmental monitoring, agriculture, tourism, and other socio-economic sectors that are sensitive to weather extremes. In this way, the platforms contribute not only to immediate risk reduction but also to long-term adaptation in the face of evolving climate challenges. The systems presented in this study therefore provide an operational example of how globally defined EWS principles can be translated into modular, place-based services at the sub-national level.
Despite the growing international emphasis on people-centred, end-to-end warning systems, published operational examples describing how a common EWS architecture can be adapted to the distinct hazard profiles and information requirements of different local authorities remain limited. The scientific contribution of the present study lies not in any individual observational, forecasting, or dissemination component, each of which relies on established methods, but in the design and operational demonstration of a single modular architecture that has been adapted, using the same underlying workflow, to six municipalities and regions with markedly different hazard profiles, institutional contexts, and data requirements. This integrative and transferable design, embedded within routine local civil-protection practice rather than presented as a prototype or pilot study, distinguishes the present work from previous multi-hazard early warning studies, which typically focus on a single hazard, a single location, or a technical component in isolation [2,11]. This study therefore presents the design and implementation of a modular EWS framework deployed across selected Greek municipalities and regions, specifically five municipalities (Kilkis, Nevrokopi, Athens, Penteli, and Rethymno) and one region (Thessaly), corresponding to six operational systems in total. It describes the observational and forecasting components, digital interfaces, locally defined configurations, and automated warning mechanisms, and illustrates how a common technological framework can be tailored to different combinations of weather, flood, fire-danger, heat, and air-quality risks.
The specific objectives of this study are therefore to (i) describe the common technological architecture underlying the developed early warning systems, including their observational and forecasting components; (ii) illustrate, through representative municipal- and regional-scale examples, how this common architecture is adapted to different local hazard profiles and operational requirements; and (iii) present the automated warning-generation and dissemination mechanisms that link the technical components to end-user decision-making. Consistent with these objectives, the study is presented as an operational implementation and case study of system design and deployment, rather than as a quantitative evaluation of forecast skill or warning effectiveness, which are identified as directions for future work.
2. Materials and Methods
The design and operational implementation of the early warning systems follow the principles established by the WMO for end-to-end multi-hazard early warning systems, which connect risk knowledge, observations and forecasting, warning dissemination, and preparedness and response. The systems described here primarily address the observation and forecasting component, support warning dissemination through digital platforms and automated messages, and provide information that municipal and regional authorities can incorporate into their preparedness and response procedures. The WMO stresses that these components should operate as an interconnected warning chain rather than as independent technical functions [5]. Aspects of the end-to-end warning chain related to systematic risk-knowledge assessment (e.g., formal exposure and vulnerability mapping) and to the evaluation of preparedness and response outcomes are not addressed by the present systems and are outside the scope of this study.
For that purpose, the METEO Unit of the National Observatory of Athens draws on its research and technological capabilities, developed over recent years in the fields of observations and forecasting. As detailed below, the developed EWSs operate through two complementary modes: (i) an observational and nowcasting mode, based on near-real-time in situ and remotely sensed information; and (ii) a forecasting mode, based on numerical-model outputs. Both modes feed a common digital infrastructure used for data processing, visualization, and automatic warning generation.
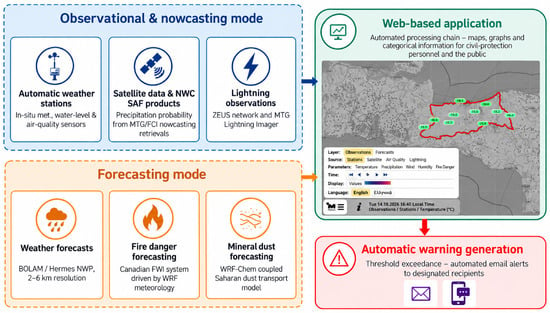
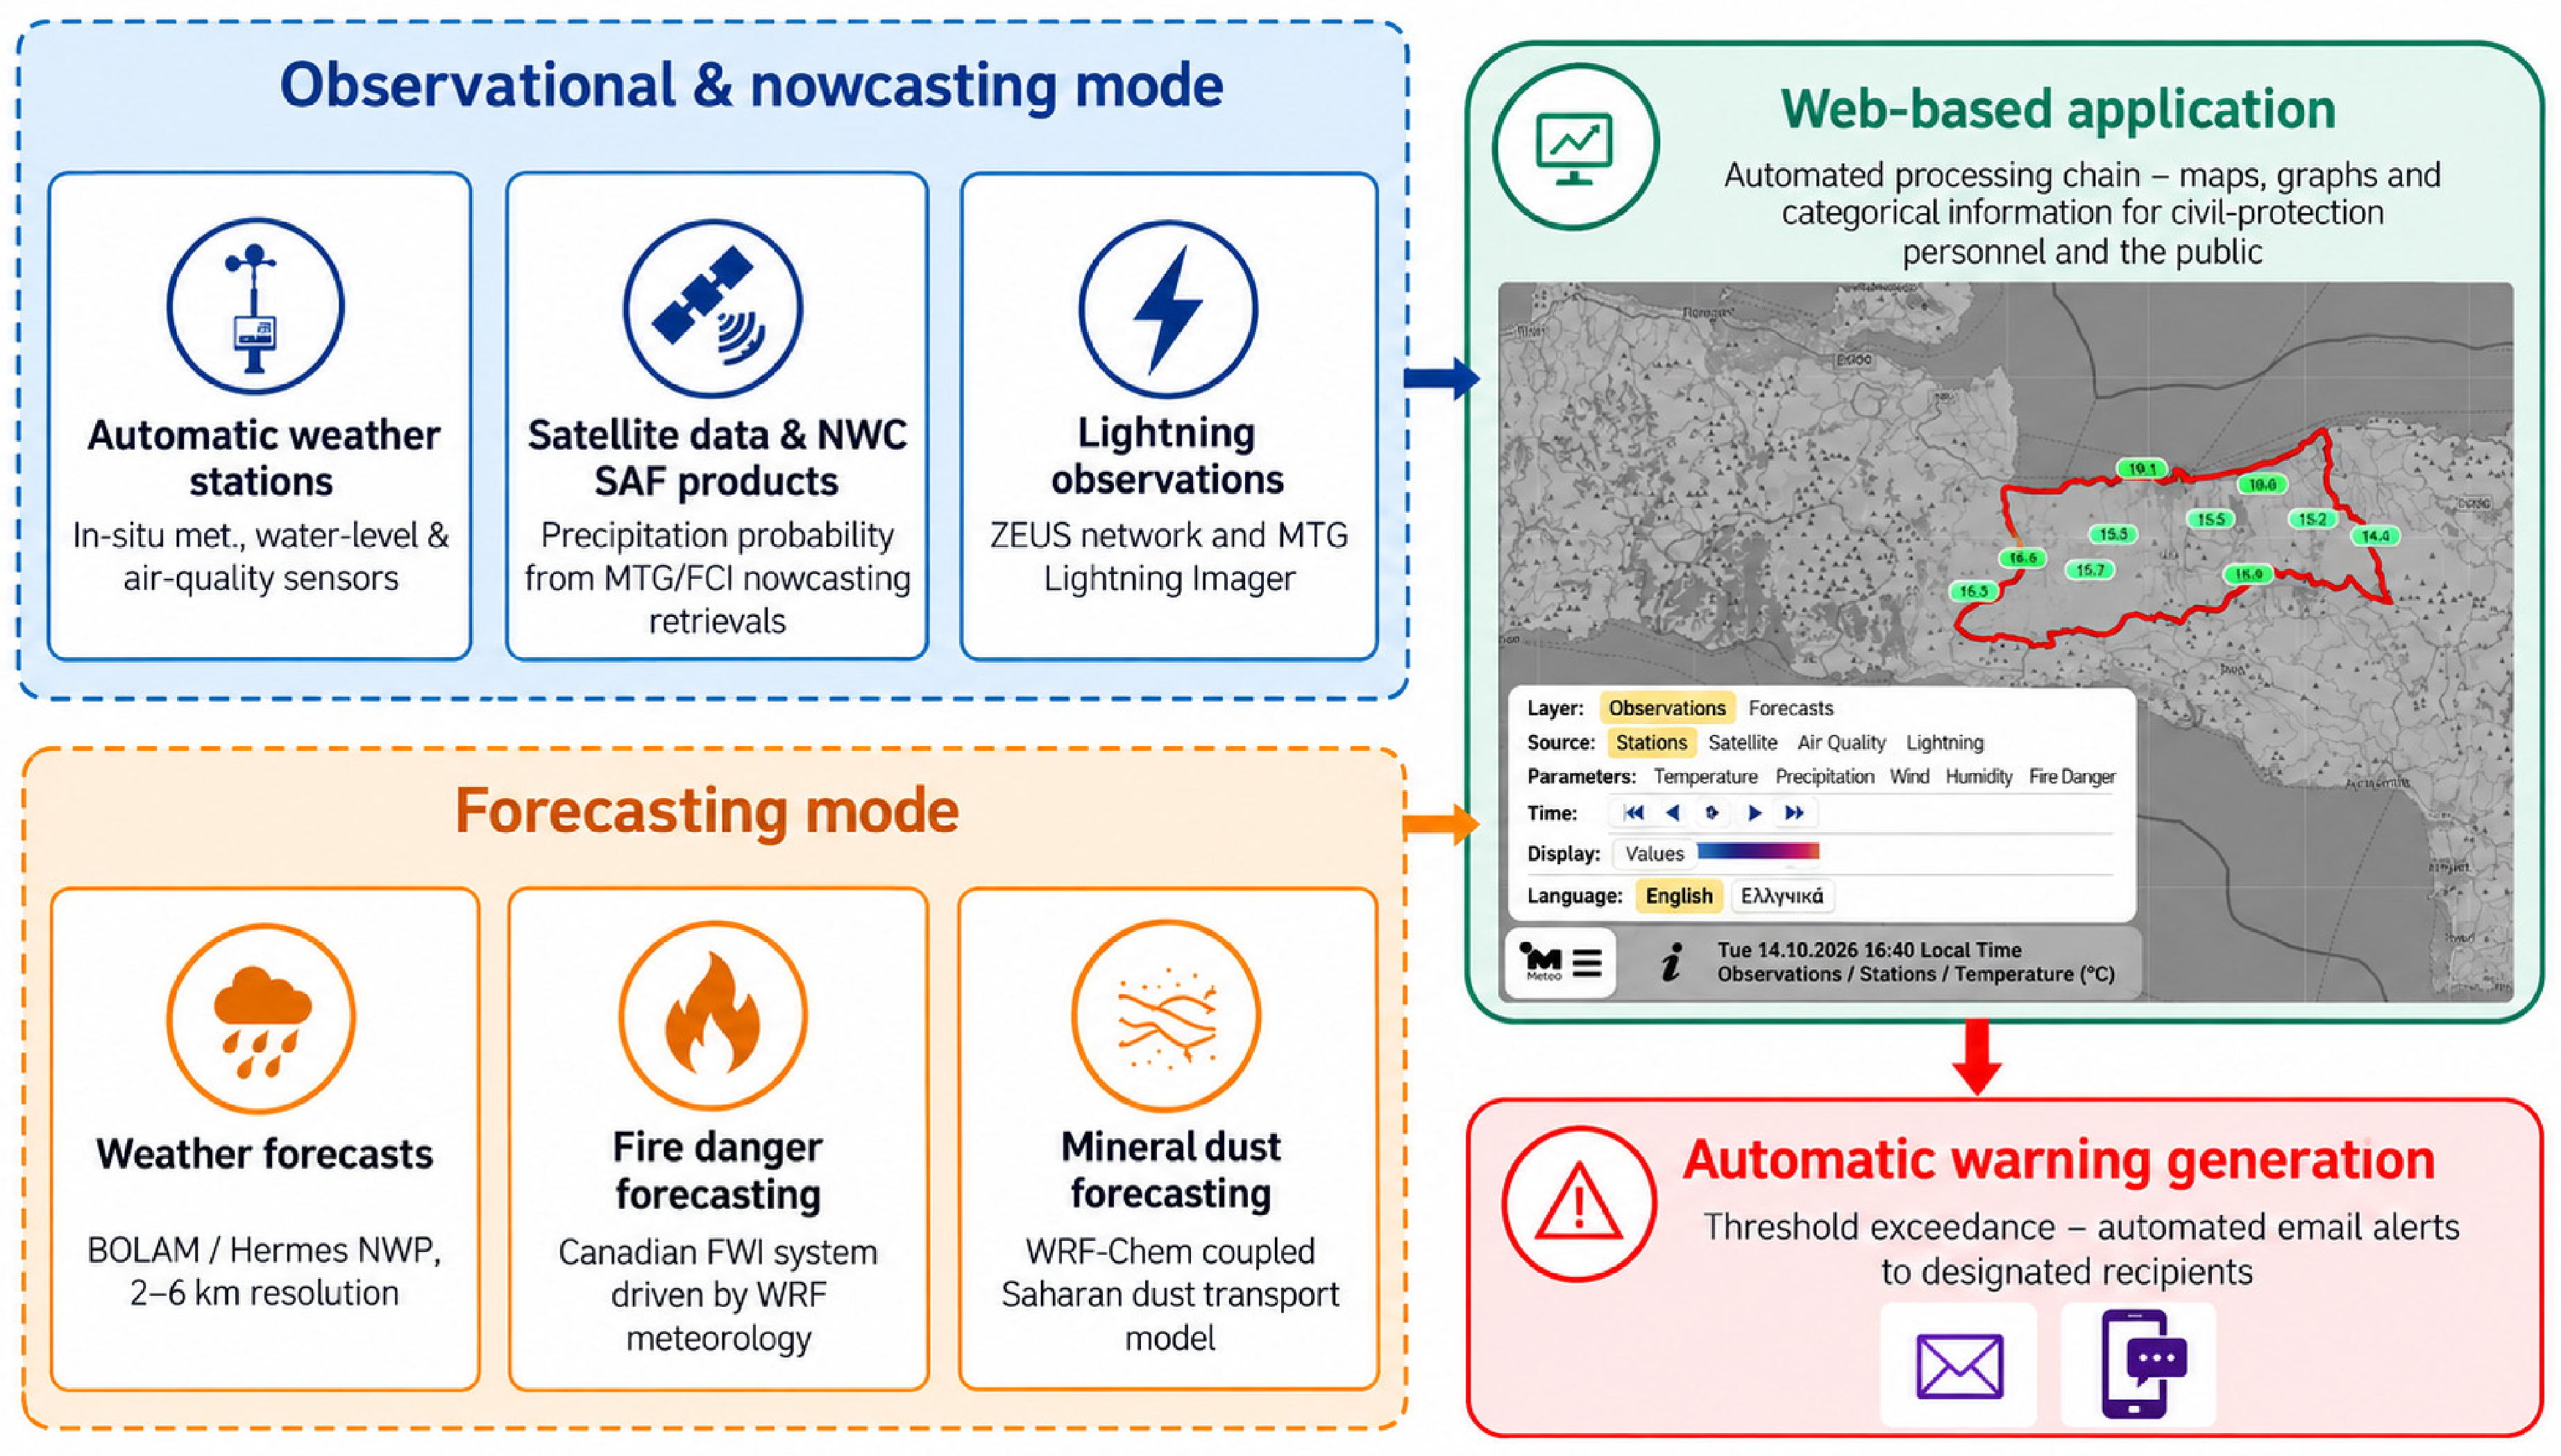
The general operational workflow comprises five stages: data acquisition; automated data processing and quality control; generation of observational and forecast products; spatial extraction and visualization for the area of interest; and dissemination through the web platform and threshold-based messages to local authorities (Figure 2). Although the same core architecture is used in all implementations, the included sensors, forecast products, displayed variables, and alert thresholds are adapted to the hazards and requirements identified in consultation with each local or regional authority.
Figure 2.
Schematic overview of the operational workflow of the early warning systems.
2.1. Observational and Nowcasting Mode
The observational mode is mainly based on the use of in situ measurements and remotely sensed observations. In situ data are guaranteed by the extensive network of automatic weather stations operated by the METEO Unit across the country [12]. In mid-2026, the networks comprised approximately 600 automatic weather stations. The standard variables measured include air temperature, relative humidity, precipitation, atmospheric pressure, and wind speed and direction, although the exact configuration varies among stations, as a number of them also measure total incoming solar radiation. When necessary, additional stations are installed to improve the spatial representativeness of observations and to address monitoring gaps within the participating municipality or region. Moreover, and to meet specific local needs, additional sensors may be deployed, including water-level sensors in selected streams and rivers, as well as air-quality sensors measuring particulate-matter concentrations. Observational data are automatically transmitted to the central processing infrastructure at predefined time intervals. Automated controls are applied to identify missing observations and physically implausible values before the data are displayed on the operational platform. The systems are also monitored routinely to identify communication or sensor failures [12].
The meteorological stations are Davis Vantage Pro2 automatic weather stations, whose full technical specifications are documented in [12]. Measurement accuracy and sensor update intervals are as follows, respectively: air temperature, ±0.3 °C (±1.1–1.7 °C at range extremes), updated every 10–12 s; relative humidity, ±3–4%, updated every 50–60 s; wind speed and direction, within max(5%, 1 m/s) and ±3°, updated every 2.5–3 s; precipitation (tipping-bucket gauge, 0.2 mm resolution), within max(3%, 0.2 mm), updated every 20–24 s; and atmospheric pressure, ±1.0 hPa, updated every 60 s. Station siting follows WMO-consistent criteria: anemometers are mounted 5 m above ground at open, rural sites (3 m at rooftop urban installations), and temperature/humidity sensors are housed in fan-aspirated radiation shields 1.8–2.0 m above ground, sited away from obstructions, vegetation, and heat sources [12,13]. Stations transmit 10 min observations to the central processing server via fixed or mobile-data Internet connections, with a station flagged as offline if no new observation is received within 60 min. Incoming data undergo a two-step quality-control procedure: an automated check, performed twice daily, flags values outside the sensor’s operational range, implausible extremes, or suspiciously persistent (stuck) readings, followed by a manual review step that also considers spatial and temporal consistency with neighbouring stations; flagged and erroneous data are excluded from the operational dataset, with the annual proportion of missing values on the order of 3–4% [12]. Routine maintenance includes an on-site visit approximately every 24 months, during which sensors are inspected, the rain gauge is recalibrated, and anemometer functionality is checked and replaced if necessary; temperature and humidity sensors are replaced after 6–7 years of operation, an interval established from certified-laboratory calibration checks on retired sensors [12]. A large subset of the network’s weather stations is registered in the WMO Observing Systems Capability Analysis and Review (OSCAR) database, and observations from these stations are routinely communicated to the European Centre for Medium-Range Weather Forecasts (ECMWF) for use in its operational data-assimilation systems, reflecting the quality standard maintained for these observations.
Water-level sensors are radar sensors, which measure the distance to the water surface using non-contact K-band (~26 GHz) radar, avoiding submersion or direct contact with the water body. The sensors operate over a range of 1–40 m with an accuracy of ±2 mm between 1.06 and 20 m (±6 mm at near range, 0.4–0.5 m), communicate via the SDI-12 protocol, and transmit observations to the central server at 30 min intervals. Sensors are mounted above the river or stream channel—typically on a bridge, pier, or dedicated fixed structure spanning the watercourse—oriented perpendicular to the water surface and positioned above the highest expected flood level, so that the measured distance can be converted into water level relative to the sensor’s fixed reference height.
Air-quality sensors are particulate-matter transmitters, which measure PM1.0, PM2.5, and PM10 mass concentrations (0–1000 µg/m3 for each size fraction) using the laser-scattering principle, with a linearity error below 5% and a repeatability below 3%. Sensors transmit observations to the central server at 15 min intervals. They are sited at locations representative of ambient exposure within the municipality, away from direct local emission sources, and at a height consistent with common practice for ambient air-quality monitoring. The sensors are relatively low-cost, which supports the long-term sustainability of the network, although their performance depends on calibration and environmental conditions [14].
The operational platform and its underlying database are maintained on servers hosted at the National Observatory of Athens, with routine, regularly scheduled backups performed to safeguard against data loss and to support recovery in the event of a hardware or software failure. Server performance and data flow are monitored on an ongoing basis by the METEO Unit’s technical staff, who intervene promptly to restore service in the event of an interruption.
Remote-sensing information complements the point measurements from the surface network, particularly over areas where station coverage is limited. Operational weather-radar observations are not currently integrated into the systems described in this study; therefore, satellite-derived precipitation and lightning products constitute the main remotely sensed sources used for near-real-time monitoring.
Satellite data, mainly from METEOSAT Third Generation Imager-1 satellite (MTG), currently operationally designated Meteosat-12, focus on the identification and monitoring of precipitating clouds and convective activity. Currently the “probability of precipitation” is based on EUMETSAT’s “Support to Nowcasting and Very Short Range Forecasting Satellite Application Facility” (NWC SAF) “Precipitating Clouds based on Cloud Physical Properties” (PCPh) product [15,16,17]. The NWC SAF software (GEO v2025) is operated in near-real time by the METEO Unit and is updated when new validated software versions become available. In its present configuration, it ingests Meteosat-12 Flexible Combined Imager (FCI) data, GFS model data, Meteosat-12 Lightning Imager (LI) data and Operational Sea Surface Temperature and Ice Analysis (OSTIA) data to generate a suite of nowcasting products. These products include Convective Rainfall Rate based on Cloud Physical Properties (CRRPh) [15,16,17] and PCPh, both provided in netCDF format. PCPh assigns each FCI pixel a probability of precipitation occurrence expressed as a percentage. For platform visualization, these values are converted into qualitative probability categories ranging from no or very low probability to high probability of precipitation. These classes facilitate rapid interpretation by non-specialist users but do not represent measured precipitation amounts. The NWC SAF software provides the algorithms required for users to generate the products locally rather than distributing the derived products directly. The v2025 package includes precipitation products specifically developed for the processing of MTG/FCI observations.
Lightning observations were initially provided by the ZEUS lightning-detection system operated by NOA, and from late 2025 onward they have also been provided by the Lightning Imager onboard Meteosat-12. ZEUS is a long-range very-low-frequency detection network that has been used for monitoring lightning activity over Greece and the broader Mediterranean region [15,16]. The MTG Lightning Imager provides continuous space-based detection of total lightning activity, including cloud-to-cloud, intra-cloud, and cloud-to-ground lightning, over Europe, Africa, and adjacent regions. Lightning information is displayed together with the satellite and surface observations to support the identification and monitoring of active convection. However, the lightning information is used as an observational and nowcasting indicator and is not, by itself, interpreted as a direct estimate of surface precipitation or local impact.
2.2. Forecasting Mode
The forecasting mode is organized around three principal modelling components: general weather forecasting, fire-danger forecasting, and mineral-dust forecasting. The products included in each local EWS depend on the principal hazards identified for the corresponding municipality or region. Namely:
- (a)
- Weather forecasts are provided by the Bologna Limited Area Model (BOLAM), which has been used for over two decades in the operational forecasting activities of the METEO Unit [18,19,20]. BOLAM output, provided at a horizontal grid spacing of approximately 6 km, constitutes the main source of forecasts for variables including air temperature, relative humidity, wind speed and direction, atmospheric pressure, and precipitation. Derived biometeorological indices are also calculated where required, particularly for systems addressing heat-related risk. Forecast fields are spatially extracted for each participating municipality or region and displayed through maps, time series, or municipality-level categories. Independent, municipality-scale verification of forecast skill for each of the six study areas is beyond the scope of the present paper, which focuses on system architecture and integration, and is identified as a direction for future work.
- (b)
- Fire danger forecasting is implemented through the computation of the Canadian Forest Fire Weather Index System (CFFWIS [21]) from input provided by the Weather Research and Forecasting (WRF) model [22] operated by the METEO Unit. In particular, the computation of CFFWIS components is carried out using 12 UTC WRF model data, including the 24 h accumulated precipitation (mm), 2 m air temperature (°C) and relative humidity (%), and 10 m wind speed (km h−1). The system produces the standard CFFWIS components and the composite Fire Weather Index, which expresses meteorological conditions favourable for fire ignition and spread but does not represent fire occurrence or comprehensive wildfire risk. Wildfire risk also depends on fuel, topography, ignition sources, exposure, and suppression capacity. Therefore, within the present EWSs, the product is described as a fire-danger or fire-weather indicator rather than as a complete wildfire-risk forecast. While the CFFWIS was originally developed to assess the expected fire behavior and spread in the forests of Canada, it has been shown to correlate well with fire activity globally (e.g., [23]) and across Europe [24,25,26]. The index is also used operationally, for example in the European Forest Fire Information System [27], and the potential predictability of fire danger from numerical weather prediction has been demonstrated [28]. The warning thresholds applied to the Fire Weather Index were selected on the basis of the analysis by Papagiannaki et al. [24], who identified weather-related thresholds that are particularly suitable for representing wildfire danger under the climatic, vegetation, and fire-regime conditions of Greece.
- (c)
- Mineral dust forecasting is implemented through the Weather Research and Forecasting (WRF) model coupled with Chemistry (WRF-Chem [29]), configured at a horizontal resolution of approximately 0.19° × 0.22° with 40 vertical levels. The domain covers North Africa, the Arabian Peninsula, and the Mediterranean basin, encompassing the principal dust source regions and their downwind receptor areas. Dust emission and transport follow the GOCART parameterization [30], distributing emitted mass across a configurable set of size bins whose number and effective radii were tuned to improve the representation of fine and coarse particle fractions relevant to regional dust transport [31]. Operational validation against ground-based PM10, and PM2.5 observations at background stations in Cyprus, Greece, and Israel confirmed that NOA-WRF-Chem ranks among the top-performing operational dust forecast systems, achieving a correlation coefficient of R = 0.91 at Finokalia, Crete, Greece, during intense dust episodes, while maintaining competitive skill over the full evaluation period [32].
2.3. Product Integration and Warning Generation
All observational, satellite-derived, and model-based products are ingested into a common web-based infrastructure. The processing chain automatically selects the data relevant to each geographical area and converts them into maps, graphs, and categorical information designed for use by local civil-protection personnel. Automatic notifications are generated when predefined observational or forecast thresholds are exceeded. The thresholds are variable- and location-specific and are defined using historical observations and climatological characteristics, historical weather events with impacts, operational experience, and consultation with the responsible local authority. Separate thresholds may be applied to measured and forecast values because their uncertainties and intended uses differ. This is most notable for rainfall: observed (station-based) accumulated rainfall is evaluated over a 24 h window, whereas the forecast rainfall product used for the municipality-level warning classification is evaluated over a shorter, 3 h accumulation window with correspondingly lower numerical thresholds, reflecting the more localized and short-fused nature of the forecast product. Table 1 summarizes, for each monitored variable, the applicable warning classes and the numerical thresholds currently applied, distinguishing observation-based from forecast-based criteria.
Table 1.
Observational and forecast warning thresholds applied per variable.
The present study evaluates the design, implementation, and operational deployment of the systems. It does not undertake a comprehensive statistical verification of every observational product, forecast model, or warning threshold, several of which have been evaluated separately in the cited literature. Operational evidence, including system deployment, local tailoring, platform functionality, and examples of automated warnings, is presented in Section 3.
Figure 2 summarizes this workflow schematically, from the observational and forecasting inputs through to automated warning generation.
3. Results
The principal results of this study are the operational implementation of a common modular EWS architecture in six Greek municipalities and regions, its adaptation to different combinations of local hazards, and the integration of observational, forecasting, visualization, and automatic-notification capabilities within a unified digital environment. The following subsections first present the common system design and geographical deployment and then describe representative municipal- and regional-scale implementations and the automated alerting functionality.
3.1. Design of Early Warning Systems in Greece
The design of the operational early warning systems developed by the METEO Unit follows a modular and integrative approach, ensuring reliability, flexibility, and scalability. Although the individual implementations differ according to local hazards and user requirements, they share a common technological and operational architecture. Its primary objective is to combine high-quality observational datasets with advanced forecasting products in order to provide timely and locally relevant information to end-users. The common infrastructure incorporates multiple sources of data (as presented in Section 2) and automated processing workflows, ensuring continuity of service even under demanding conditions. For each implementation, the geographical domain, included sensors, forecast products, displayed indicators, and notification thresholds are configured in consultation with the corresponding municipal or regional authority. The developed EWS framework comprises the following six key components:
- Expansion and integration of observational networks: Installation of new meteorological stations and if necessary, water-level meters and air-quality sensors, along with the incorporation of NOA’s pre-existing stations into the system.
- Continuous monitoring and maintenance: Routine supervision of the in situ observational equipment and data transmission systems to ensure data quality and operational readiness.
- Numerical weather prediction, fire danger and mineral dust forecasting: Provision of high-resolution forecast products tailored to regional and local needs, including specialized products for rainfall, wind, temperature extremes, thermal stress indicators, fire weather and Saharan dust events.
- Satellite and lightning observations: Incorporation of near real-time remote sensing products including precipitation probability and lightning activity, to complement ground-based measurements.
- Digital platform development: Visualization of all information through an online, interactive platform accessible to local authorities and the general public via personal computers, tablets, and smartphones.
- Automatic alert generation: Issuance of warning messages whenever predefined observational or forecast thresholds are exceeded.
A notable feature of the system design is its modularity, which allows for the seamless integration of additional data streams, new forecasting models, or specialized monitoring tools in response to emerging risks or evolving user needs. The modular structure also allows the same core platform to be replicated in different geographical areas without requiring the development of an entirely new system for each municipal/regional authority. This flexibility ensures that the platform can remain scientifically up-to-date and practically relevant, supporting both immediate risk management and long-term resilience strategies.
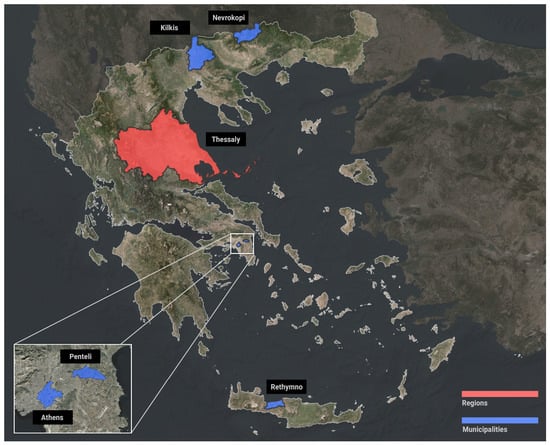
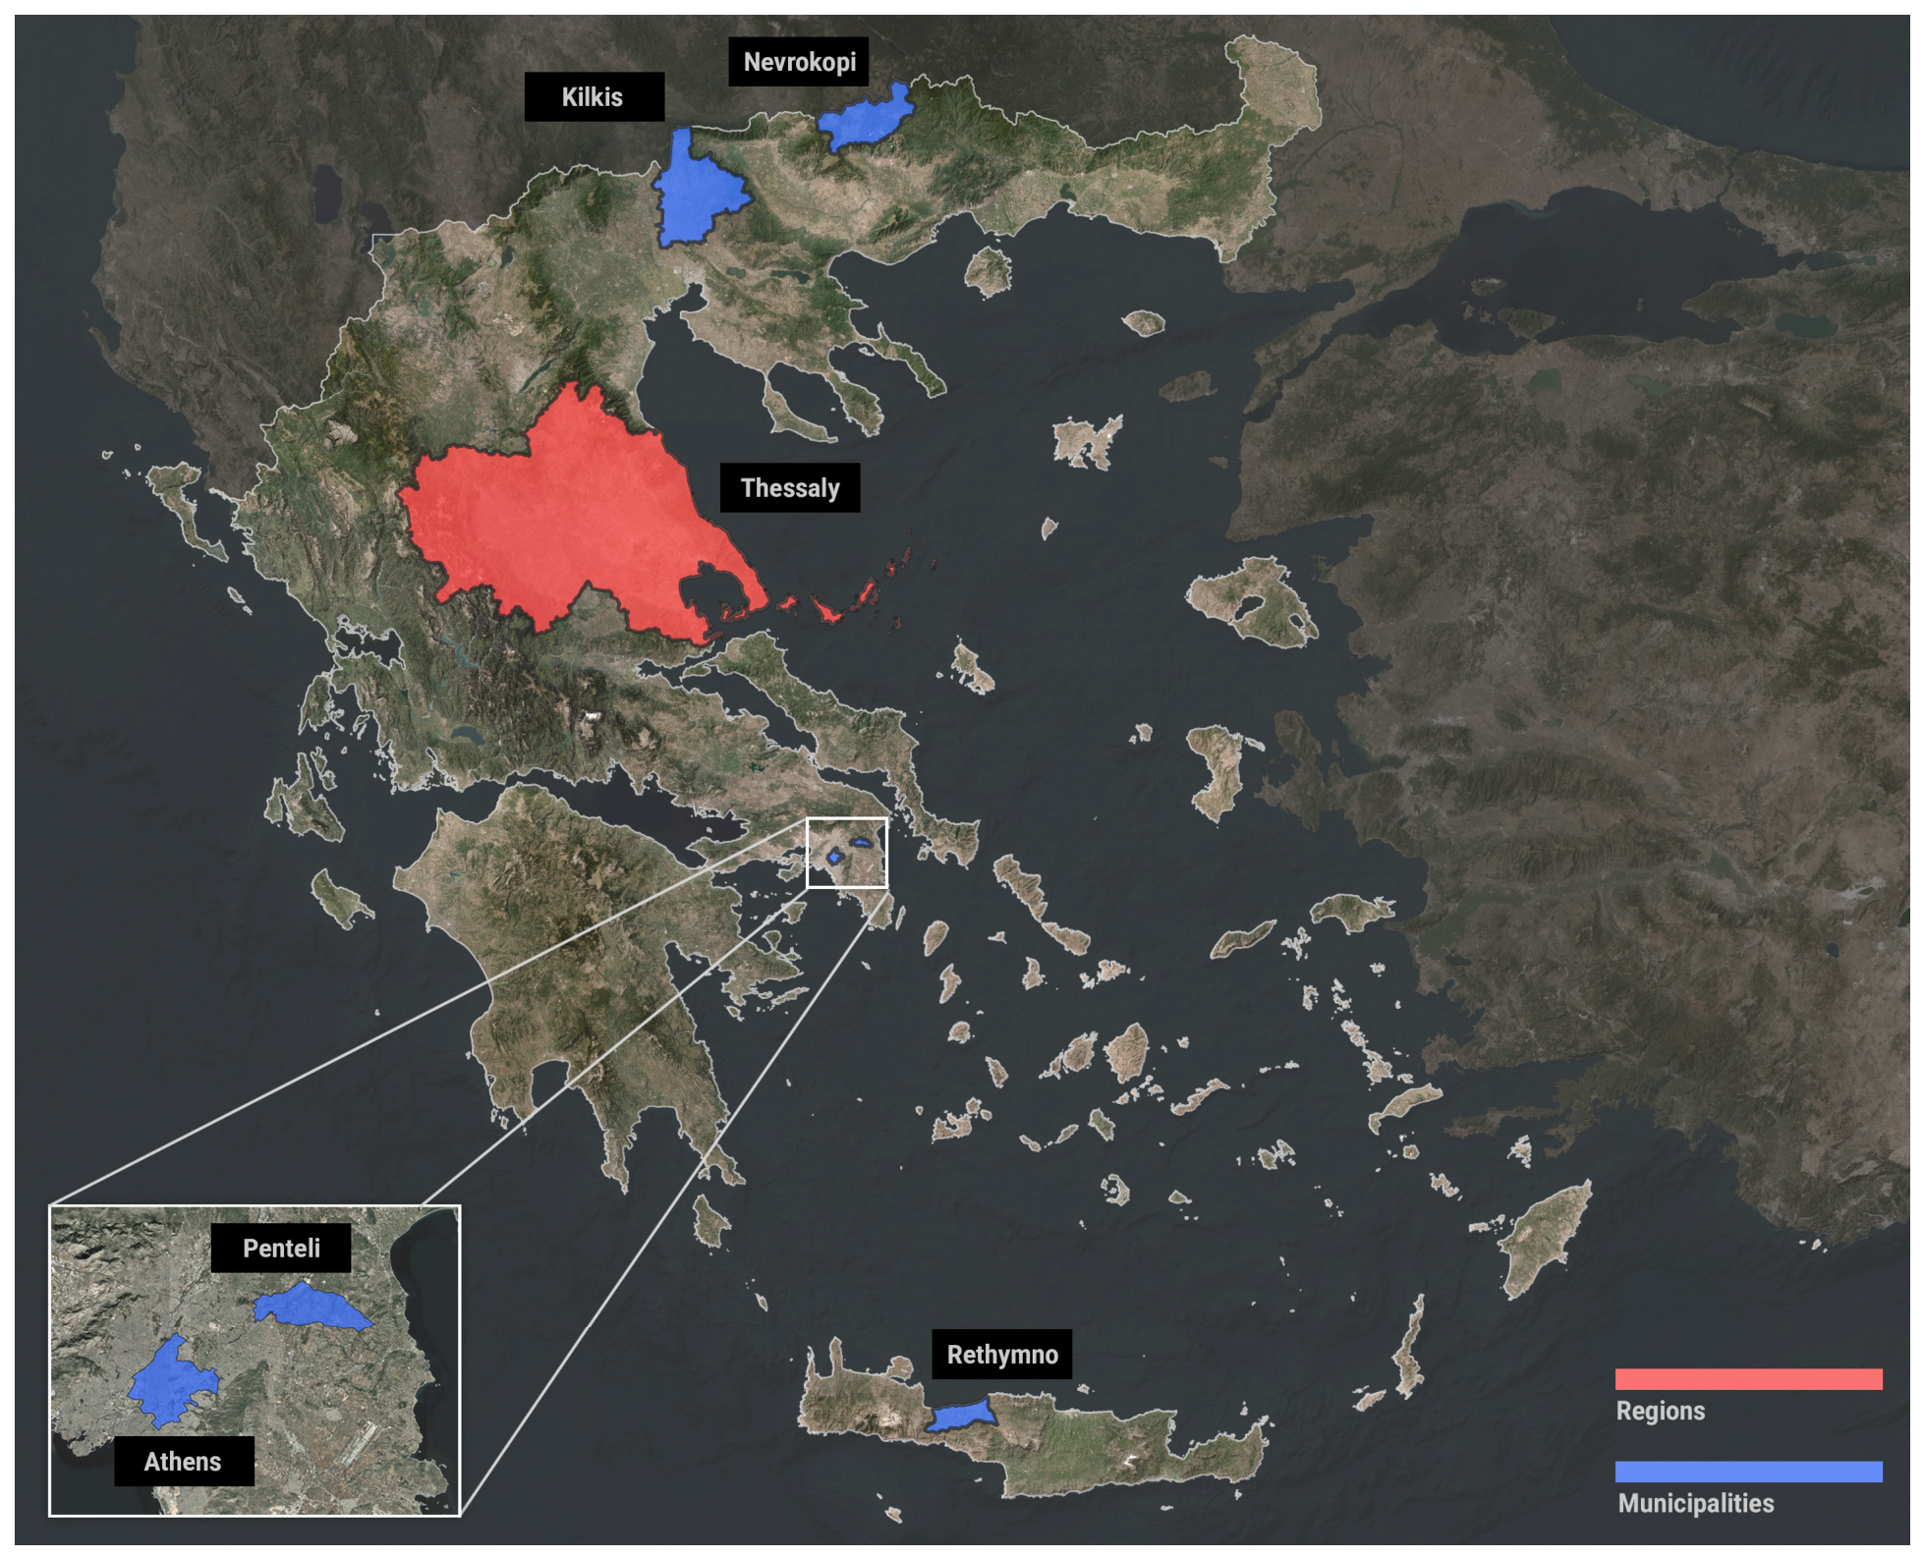
Figure 3 presents the geographical distribution of operating Early Warning Systems as of August 2026. Five EWSs operate at the municipal level (Kilkis and Nevrokopi in northern Greece, Penteli and Athens within the Attica Region and Rethymno in Crete, southern Greece) and one at regional level (Thessaly region). The selected sites represent contrasting geographical and hazard environments, ranging from densely urbanized areas exposed to heat and flash flooding to mountainous, agricultural, wildfire-prone, and dust-affected regions. This diversity provides an opportunity to demonstrate the transferability of the common architecture and its adaptation to different operational requirements.
Figure 3.
Geographical distribution of the municipal- and regional-scale early warning systems developed by the METEO Unit of the National Observatory of Athens. Municipal systems are shown in blue and the regional system in red.
Each EWS was designed in close collaboration with regional and municipal authorities, ensuring that its configuration responds directly to local priorities and vulnerabilities. This collaboration was carried out mainly through in-person meetings and site visits with civil-protection officers and technical staff of each municipality or region, during which priority hazards, sensor siting, displayed variables, and warning thresholds were discussed and agreed upon. A systematic, documented needs-assessment or user-feedback protocol was not applied and is identified as an area for future methodological development. Table 2 presents the main features of each system. New meteorological stations were installed in all participating areas, with the number and location of stations determined by the coverage of the pre-existing observational network, local topography, population distribution, and the hazards of primary concern. Where standard meteorological observations were insufficient to address local requirements, complementary sensors were deployed. In Kilkis, Rethymno, and the Region of Thessaly, these systems provide rainfall forecasts, rainfall monitoring, and water-level observations rather than hydrological or hydraulic flood forecasting; threshold exceedance for rainfall or observed water level does not equate to a forecast of river response, inundation extent, or flood impacts. The extension of these systems towards hydrological and hydraulic flood forecasting is discussed as a future development in Section 4.
Table 2.
Observational deployment, forecasting and monitoring components, and principal hazards addressed by each operational early warning system.
In flood-prone areas, such as the Municipality of Kilkis, two water-level sensors were installed at the major river of the municipality. In the Municipality of Nevrokopi, increased levels of particulate matter concentrations associated with intensive residential wood combustion during the prolonged cold season (Nevrokopi is among the coldest areas in Greece) led to the installation of two air-quality sensors. In the Municipality of Rethymno (in Crete, Southern Greece) both the risk for floods [33] as well as the increased frequency of dust episodes [34] motivated the installation of water-level and air-quality sensors, together with the inclusion of dust-forecasting products. In the Municipality of Athens, additional weather stations have been installed to better represent spatial variations in meteorological conditions across a densely urbanized area. Biometeorological indices were also incorporated into the forecasting component to support the monitoring of heat-related conditions. In the Municipality of Penteli (northern part of Athens), which has experienced major wildfires in recent years, additional stations were installed at strategically selected locations, including elevated sites, to better capture local wind conditions. Fire Weather Index forecasts and associated warning categories were therefore included as a dedicated component of the local platform. In the Region of Thessaly, a more extensive deployment of meteorological stations was required to improve observational coverage across a large and topographically diverse area. Particular emphasis was placed on heavy precipitation and flooding because the region experienced exceptionally severe flood events during recent years, most notably Medicane Ianos in 2020 [35,36] and Storm Daniel in 2023 [4].
Table 2 summarizes the newly deployed observational equipment, the principal forecasting components, and the main hazards addressed by each operational EWS. The table also summarizes, for each system, the operational start date, primary user group, and alert-dissemination channel, to enable a standardized comparison of system configuration and use across the six deployments. A full, event-based validation of comparative performance across all six systems is beyond the scope of the present paper, as discussed above, and the table content is intended to standardize the descriptive comparison of system configuration and use rather than to demonstrate comparative warning performance.
3.2. Example of Early Warning Systems in Greece at Municipality Level
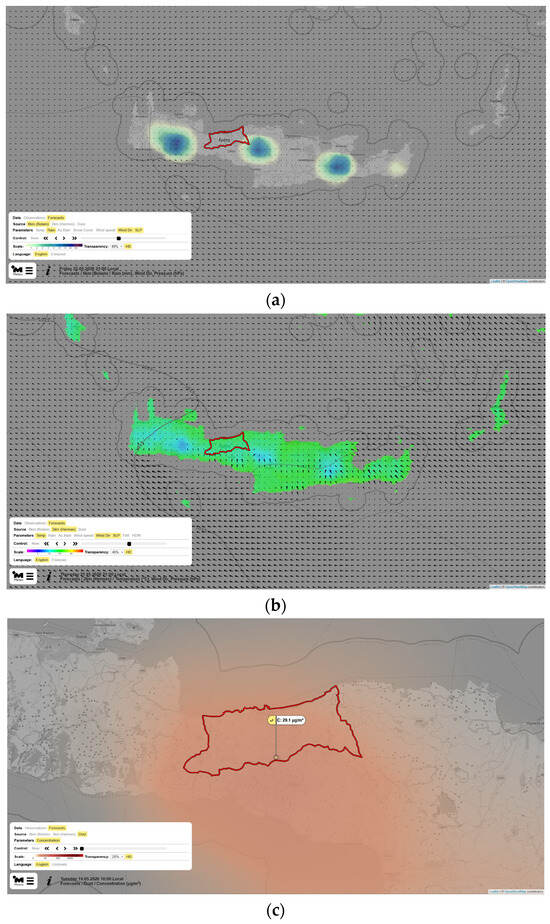
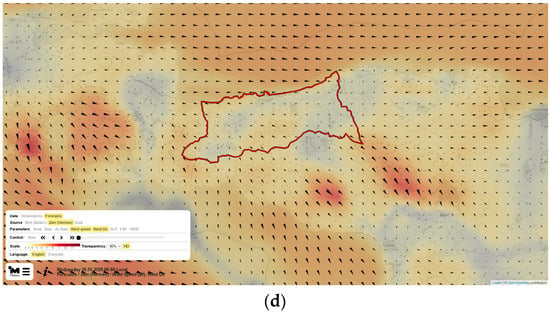
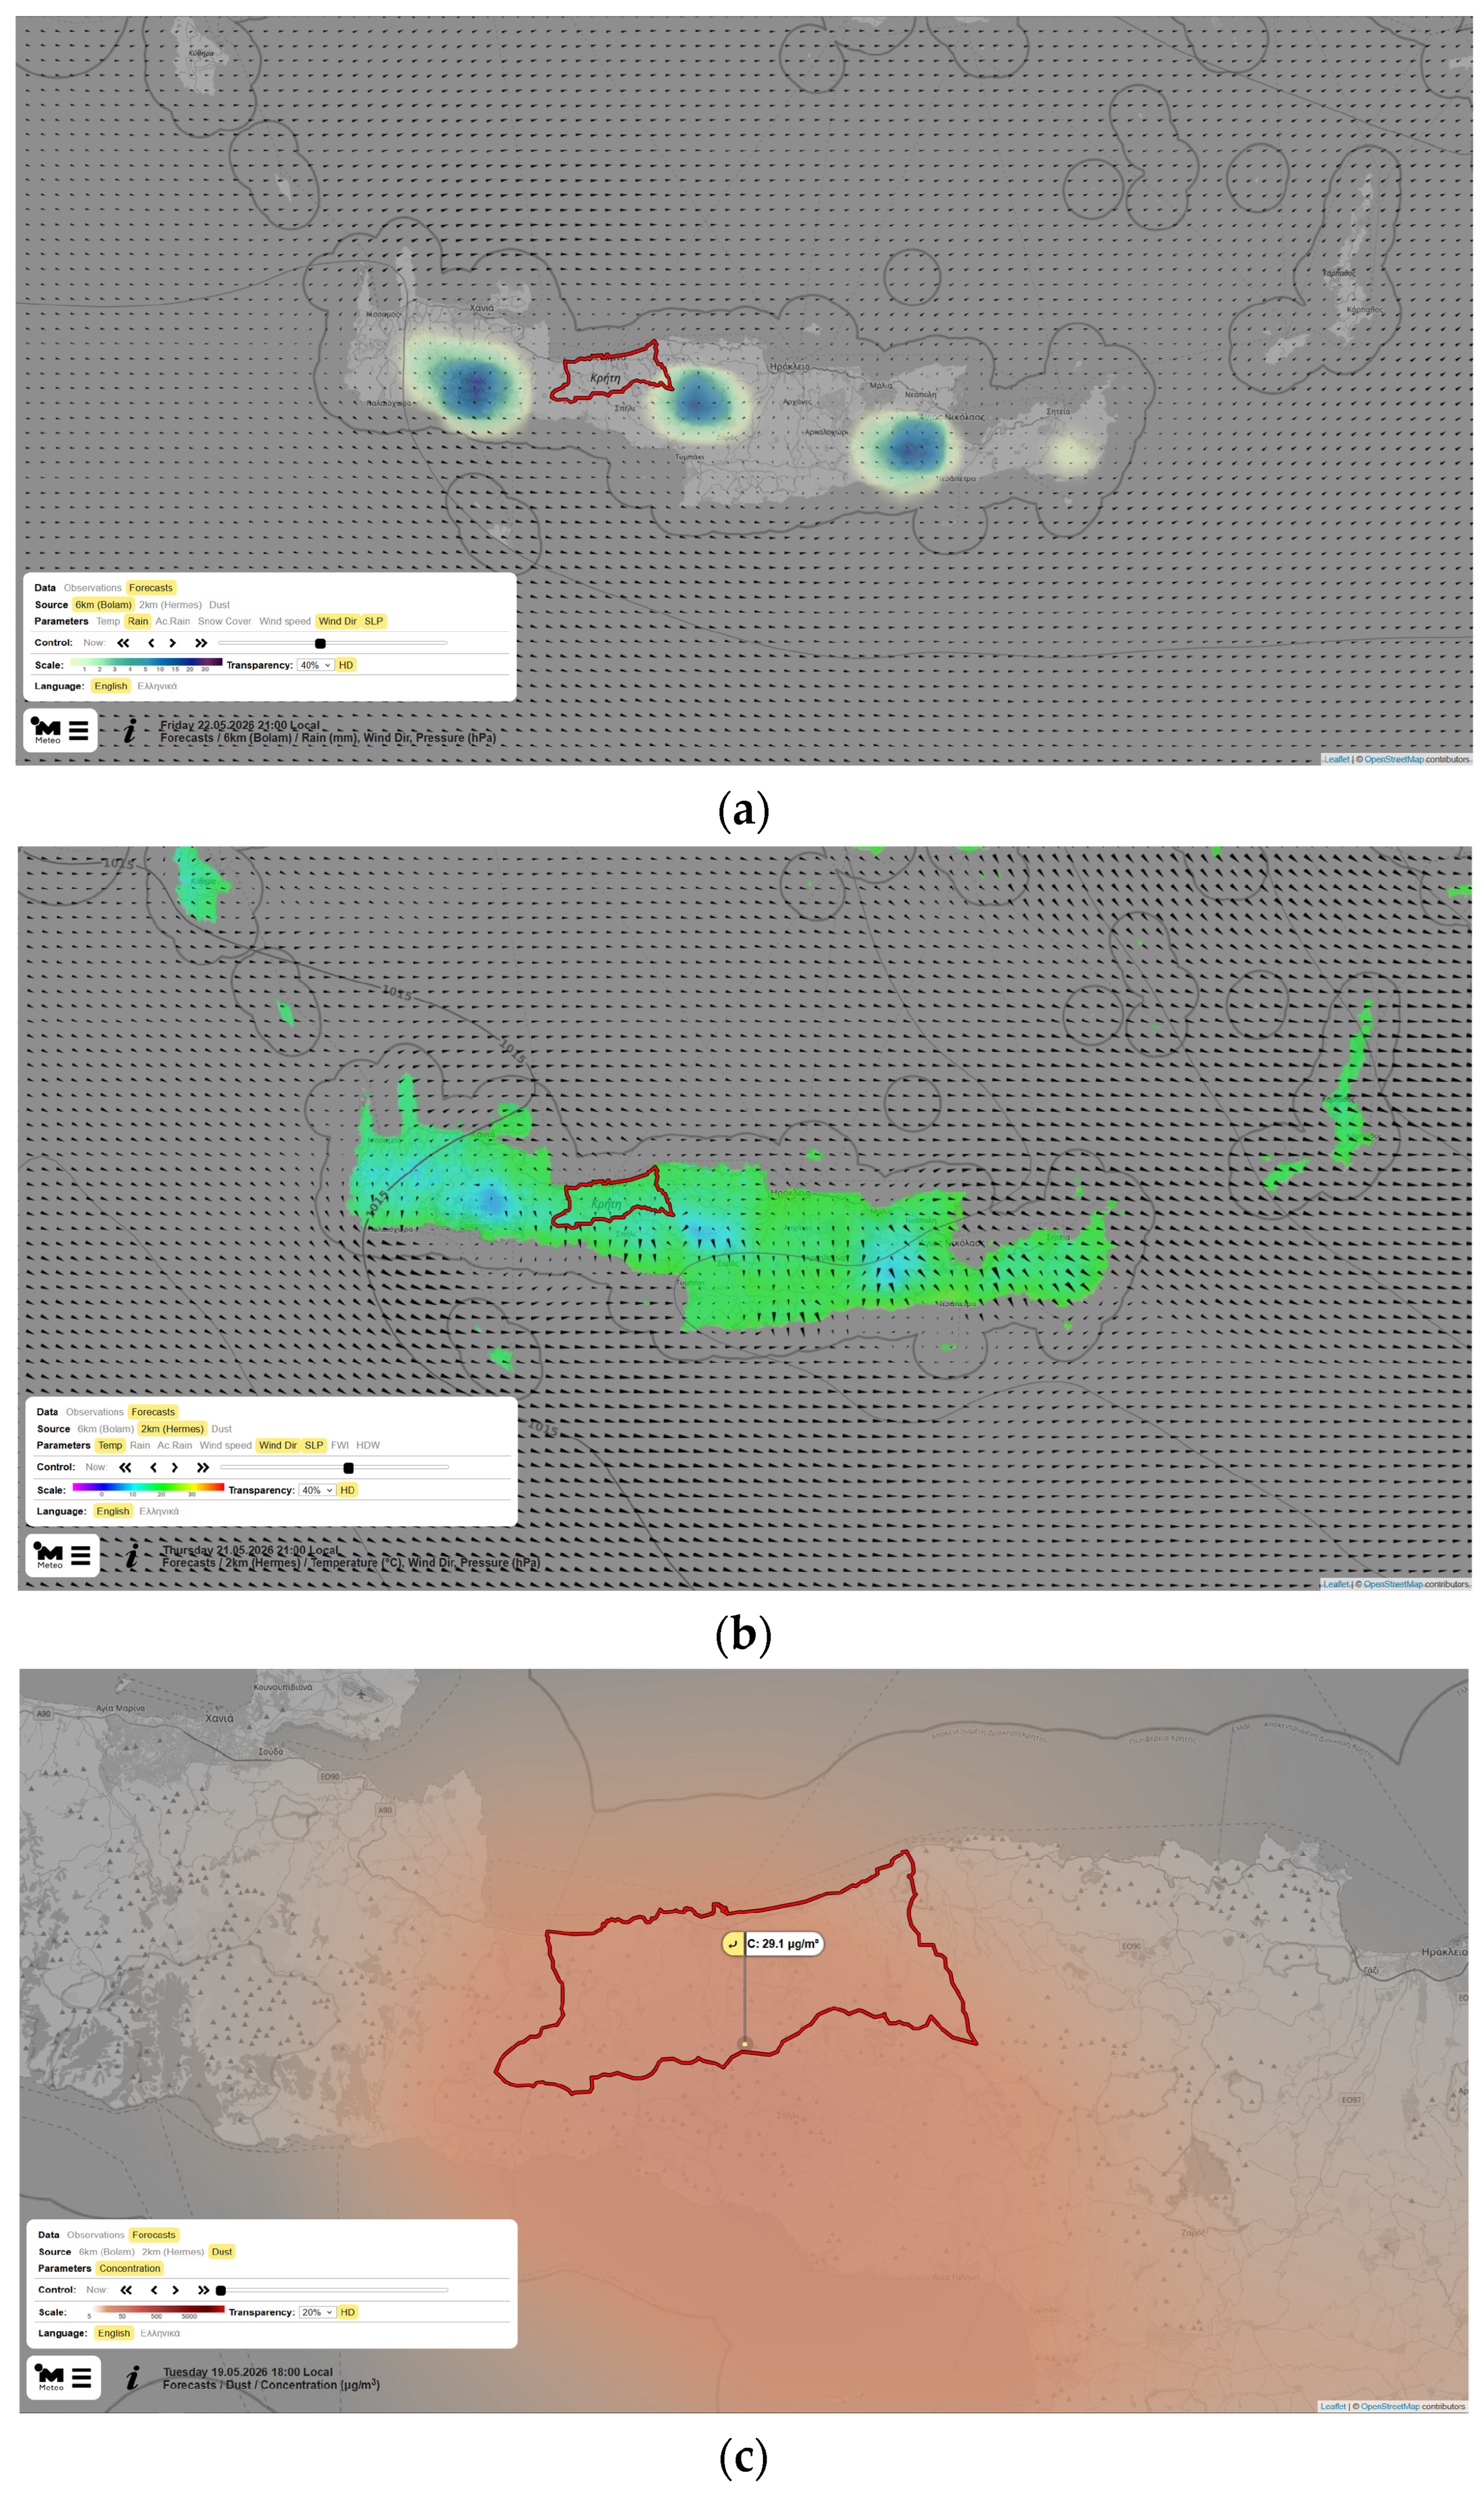
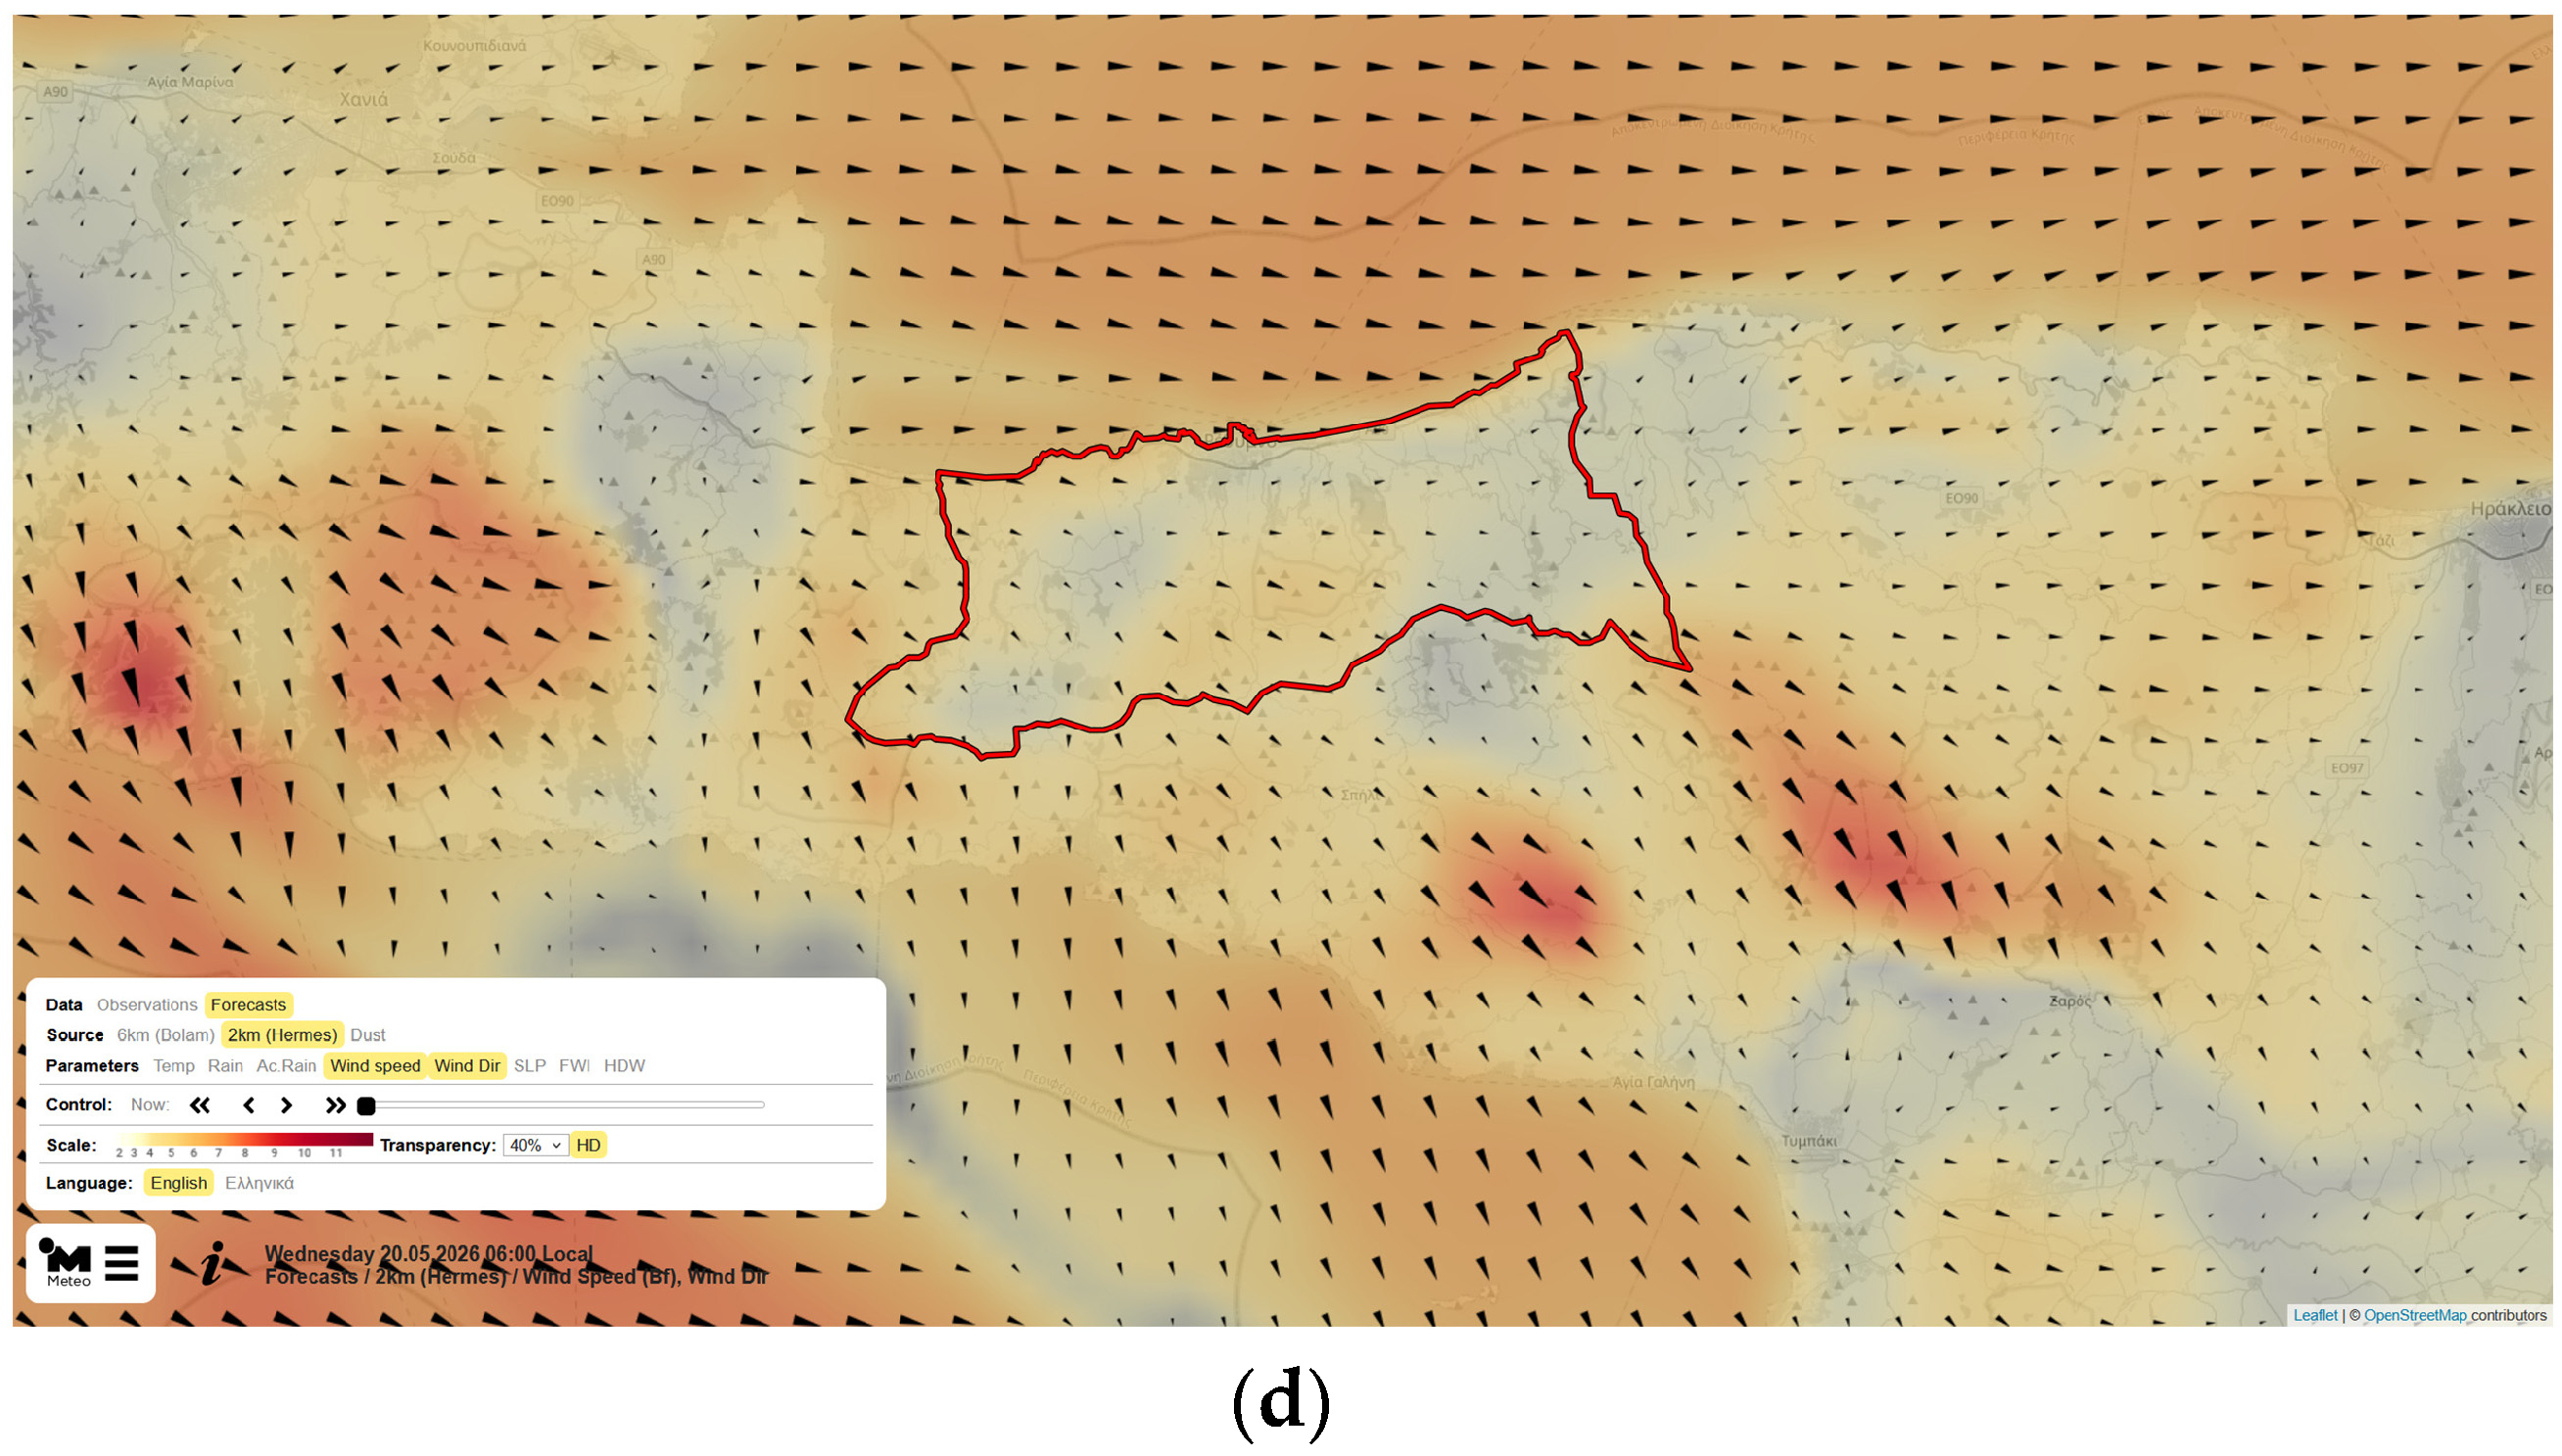
Municipality of Rethymno: Figure 4 presents the Early Warning System developed for the Municipality of Rethymno. Additional meteorological stations were installed to fill observational gaps, while water-level and air-quality sensors were added to address locally important flood and particulate-matter hazards. The system is accessible at www.meteo.gr/rethymno (accessed on 9 October 2026) and incorporates specialized components tailored to the region’s unique hazard profile. In particular, it includes particulate matter (PM) sensors and dust forecasting products, given that Rethymno and surrounding areas are often affected by severe Saharan dust intrusions, especially during spring. The municipal platform combines several types of information within a common interface, including near-real-time meteorological observations, precipitation-related satellite products, weather forecasts, dust forecasts, and fire-danger information. Users can select variables and forecast periods interactively and examine the corresponding information within the municipal boundary. By integrating air quality monitoring with severe weather alerts, the system provides added value for public health protection and local environmental management. The Rethymno implementation demonstrates how the common EWS architecture can be extended beyond conventional meteorological hazards to include environmental conditions with direct health relevance.
Figure 4.
Representative screens from the Early Warning System developed for the Municipality of Rethymno: (a) precipitation forecast; (b) temperature and wind forecasts; (c) mineral-dust forecast; and (d) wind-speed and wind-direction forecast. The municipal boundary is outlined in red.
3.3. Regional-Level Example: Region of Thessaly
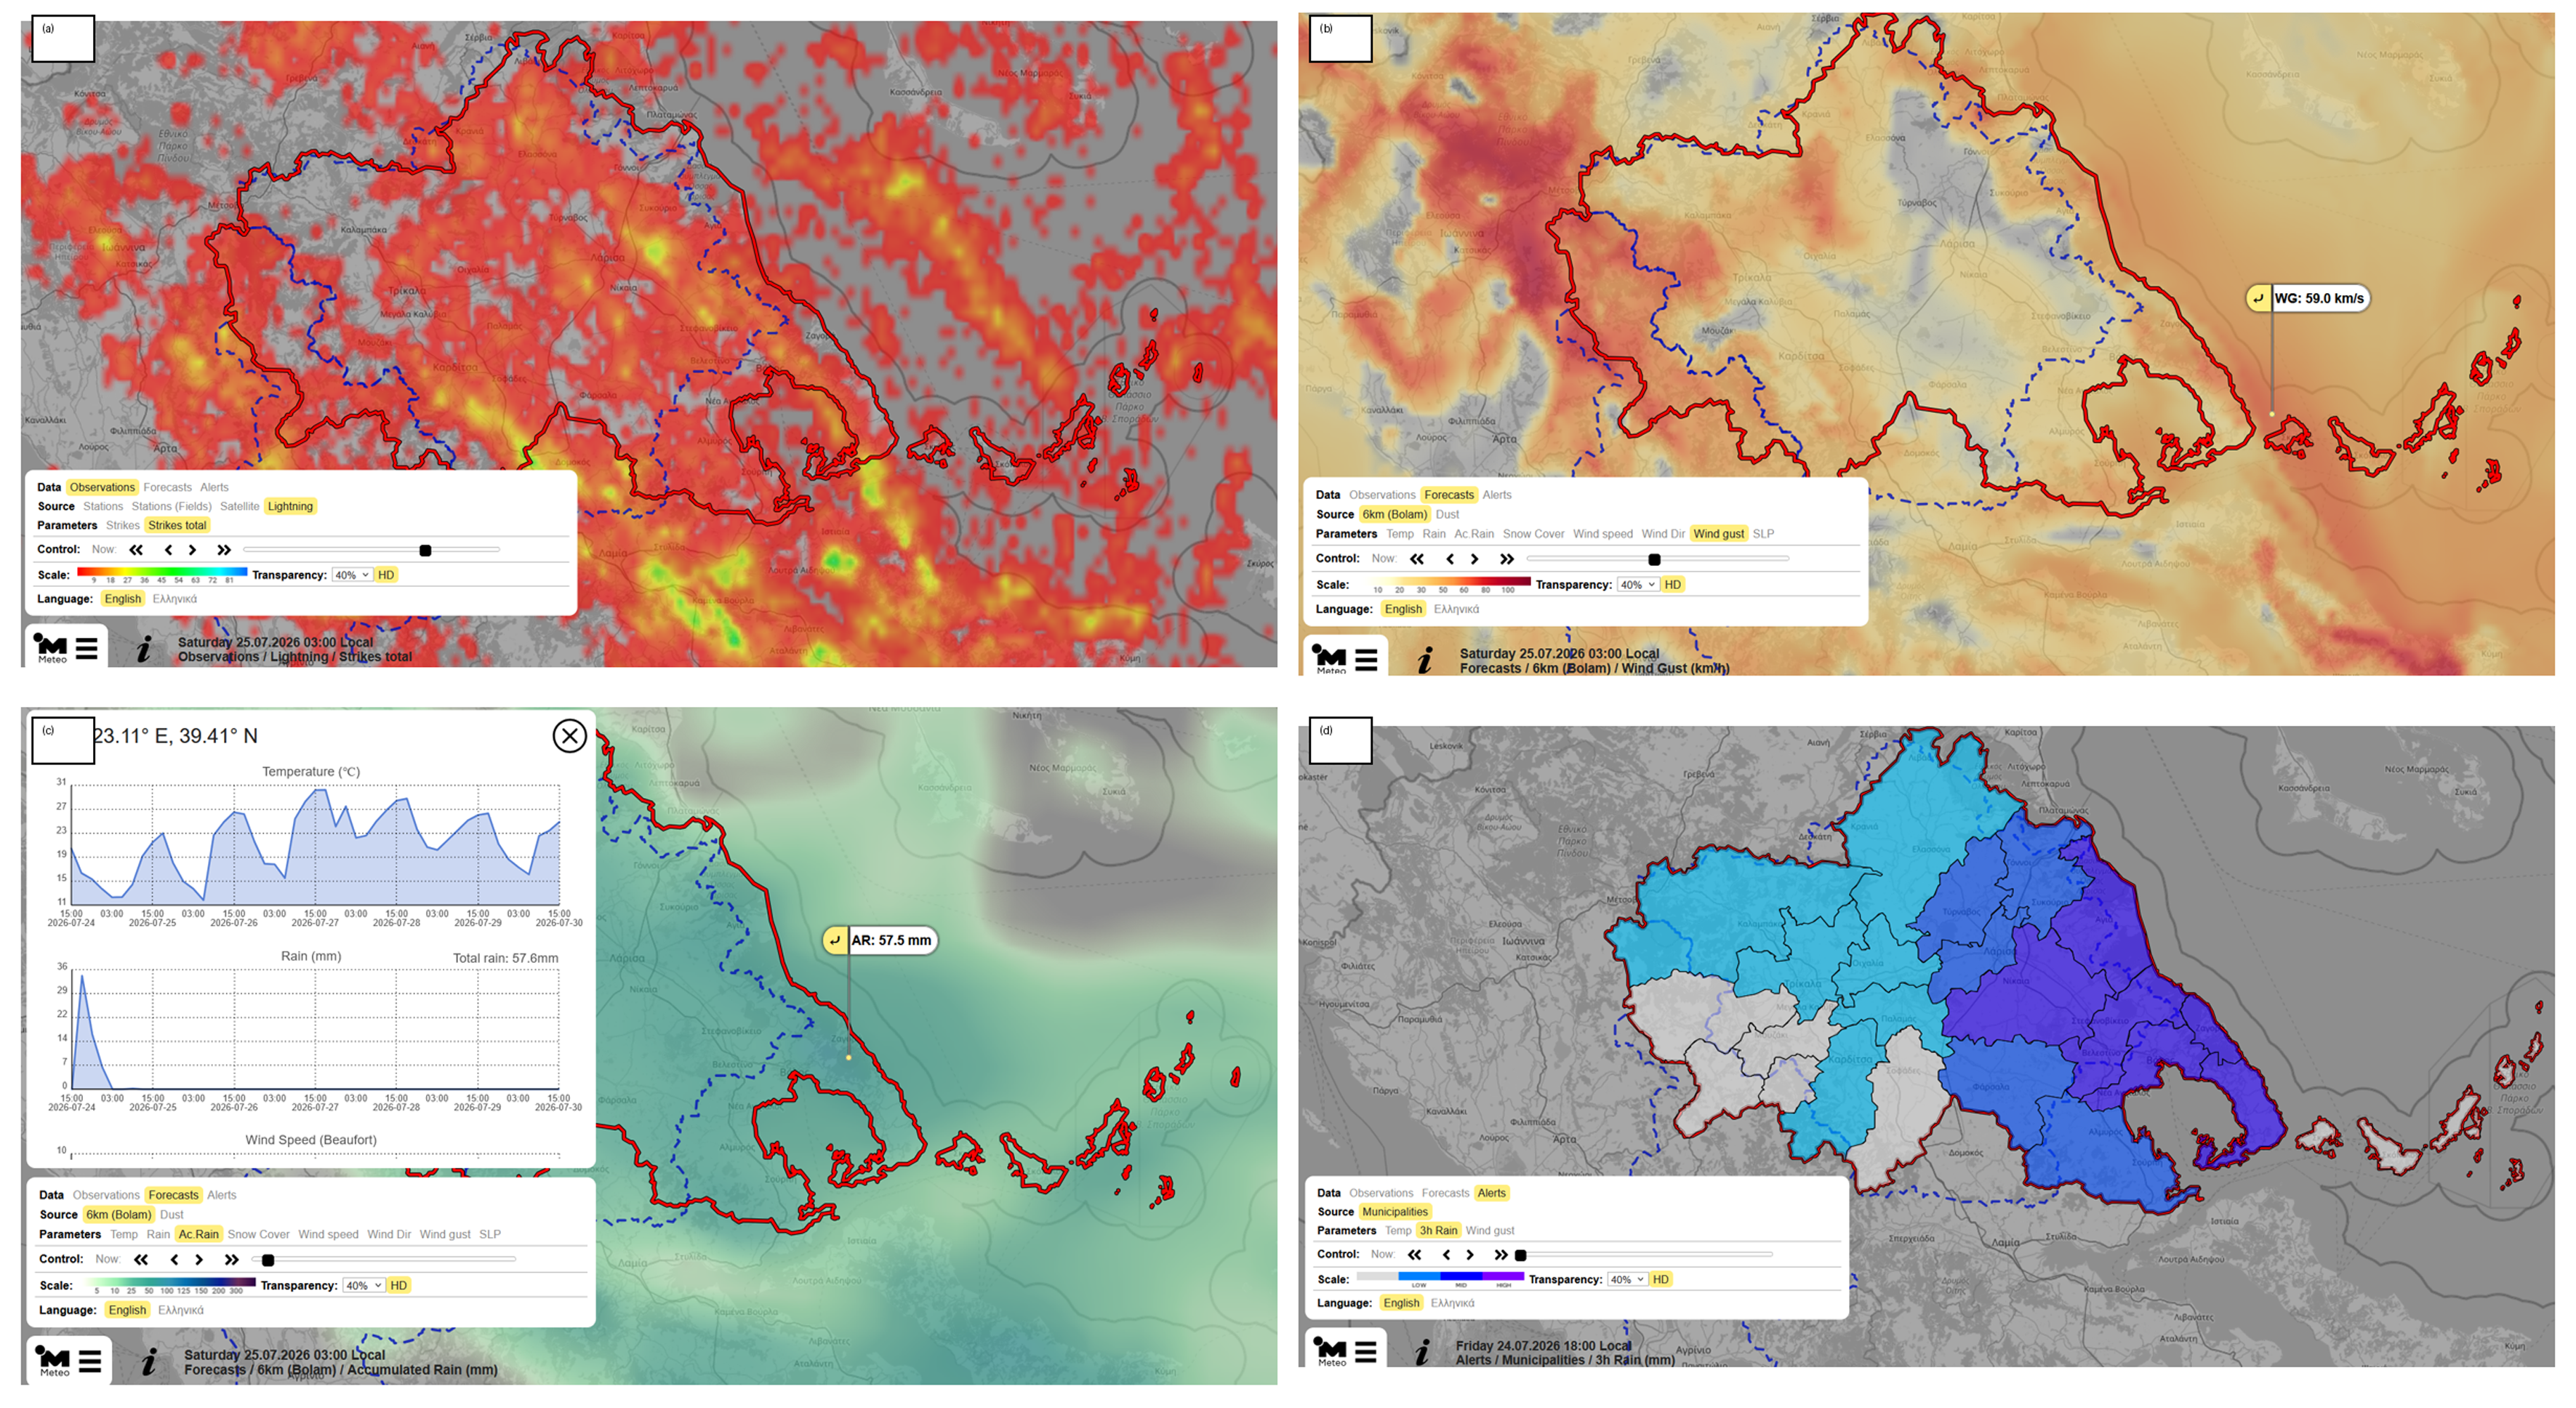
Region of Thessaly: The platform is accessible through www.meteo.gr/thessaly (accessed on 9 October 2026) and provides local authorities with high-resolution forecasts, near-real-time observations, and automated warnings. The system is integrated into the Operational Civil Protection Center of the Region of Thessaly, supporting both preventive planning and emergency management. Because Thessaly covers a large area with pronounced topographical, climatic, and land-use contrasts, the system provides both region-wide forecast maps and information aggregated at the municipal level. Since the region comprises 25 municipalities, the local authorities requested a simplified representation of warning severity. For this purpose, a three-level color-coded classification is applied at the municipal level (Figure 5d). Low, medium, and high warning levels are automatically derived from the high-resolution weather forecasts for rainfall, wind gusts, low temperature, and high temperature. For each variable, the warning level assigned to a municipality is determined by comparing forecast values within the municipality with predefined thresholds. The resulting classification provides a rapid overview of the geographical distribution and expected severity of potentially hazardous conditions, while the underlying maps and forecast fields remain available for more detailed examination.
Figure 5.
Representative components of the Early Warning System developed for the Region of Thessaly during the 24–25 July 2026 event: (a) total lightning activity from the MTG Lightning Imager, displayed at 03:00 local time on 25 July 2026; (b) wind-gust forecast, displayed at 03:00 local time on 25 July 2026; (c) accumulated rainfall forecast and point-specific six-day meteogram, displayed at 03:00 local time on 25 July 2026; and (d) municipality-level three-level warning classification for 3 h accumulated rainfall, displayed at 18:00 local time on 24 July 2026.
Figure 5 illustrates representative screens from the Thessaly Early Warning System during the severe rain and wind event of 24–25 July 2026. Figure 5a presents total lightning activity from the MTG Lightning Imager, representing the observational/nowcasting component of the EWS. In the absence of weather-radar observations within the present system, the lightning layer provides valuable complementary information for monitoring the location and evolution of active convection. Figure 5b shows the corresponding forecast wind-gust field. Figure 5c shows the forecast accumulated rainfall field and illustrates the point-query functionality of the platform: by selecting a location, the user can retrieve a six-day meteogram of the main forecast parameters. Finally, Figure 5d provides a simplified municipality-level overview of the forecast 3 h accumulated rainfall warning category. The three-level scale (light blue, blue, and dark blue) distinguishes municipalities with low, medium, and high warning levels, respectively, enabling civil-protection personnel to identify areas requiring increased attention.
During the same 24–25 July 2026 event, the automatic warning-generation component issued eight messages for observed rainfall threshold exceedances, triggered when accumulated rainfall reported by an individual weather station exceeded 30 mm, and 19 messages for wind-gust exceedances, triggered when an observed gust exceeded 50 km h−1. This example demonstrates how the observational and forecasting information displayed on the platform is complemented by automatic threshold-based notifications to designated recipients. These message counts demonstrate the operational activity of the automatic warning-generation component rather than its warning effectiveness. An event-based assessment of whether these alerts corresponded to observed hazards or impacts, the lead time they provided, and any false alarms or missed events was not undertaken for this event and is identified, together with the broader evaluation of forecast and alert performance, as a direction for future work.
The integration of observational, forecasting, and alert information within a single platform allows authorities to obtain a rapid overview of potentially hazardous conditions over the following hours and days. The system is intended as a decision-support layer rather than as a substitute for expert meteorological interpretation, particularly during complex or rapidly evolving events. Given that Thessaly has experienced repeated and severe flood events in recent years [4,35,36], the current rainfall-monitoring capabilities of the regional EWS provide a useful basis for future developments. An extension towards hydrological and hydraulic flood forecasting is currently under development, as discussed in Section 4.
3.4. Automated Messaging of Alerts
The final stage of design of the EWS workflow concerns the dissemination of warning information. In addition to information displayed continuously through the digital platform, automated email notifications are sent to predefined recipients when selected observational or forecast thresholds are exceeded. For this purpose, thresholds have been established for variables including air temperature, wind speed, accumulated rainfall, particulate-matter concentrations, water level, and fire danger where relevant. The thresholds included in each system depend on the local hazard profile and the requirements agreed with the corresponding authority. Automated alert generation reduces the need for continuous manual monitoring of the platform and directs the attention of operational users to potentially significant conditions. Each message identifies the relevant variable or hazard, the threshold exceedance, the affected location or station, and includes an active link to the platform for further assessment. This procedure has two main advantages:
- It immediately informs designated end-users when a predefined threshold is exceeded, without requiring uninterrupted monitoring of the system;
- It prompts recipients to access the platform and assess the wider observational and forecast context before deciding on any operational response.
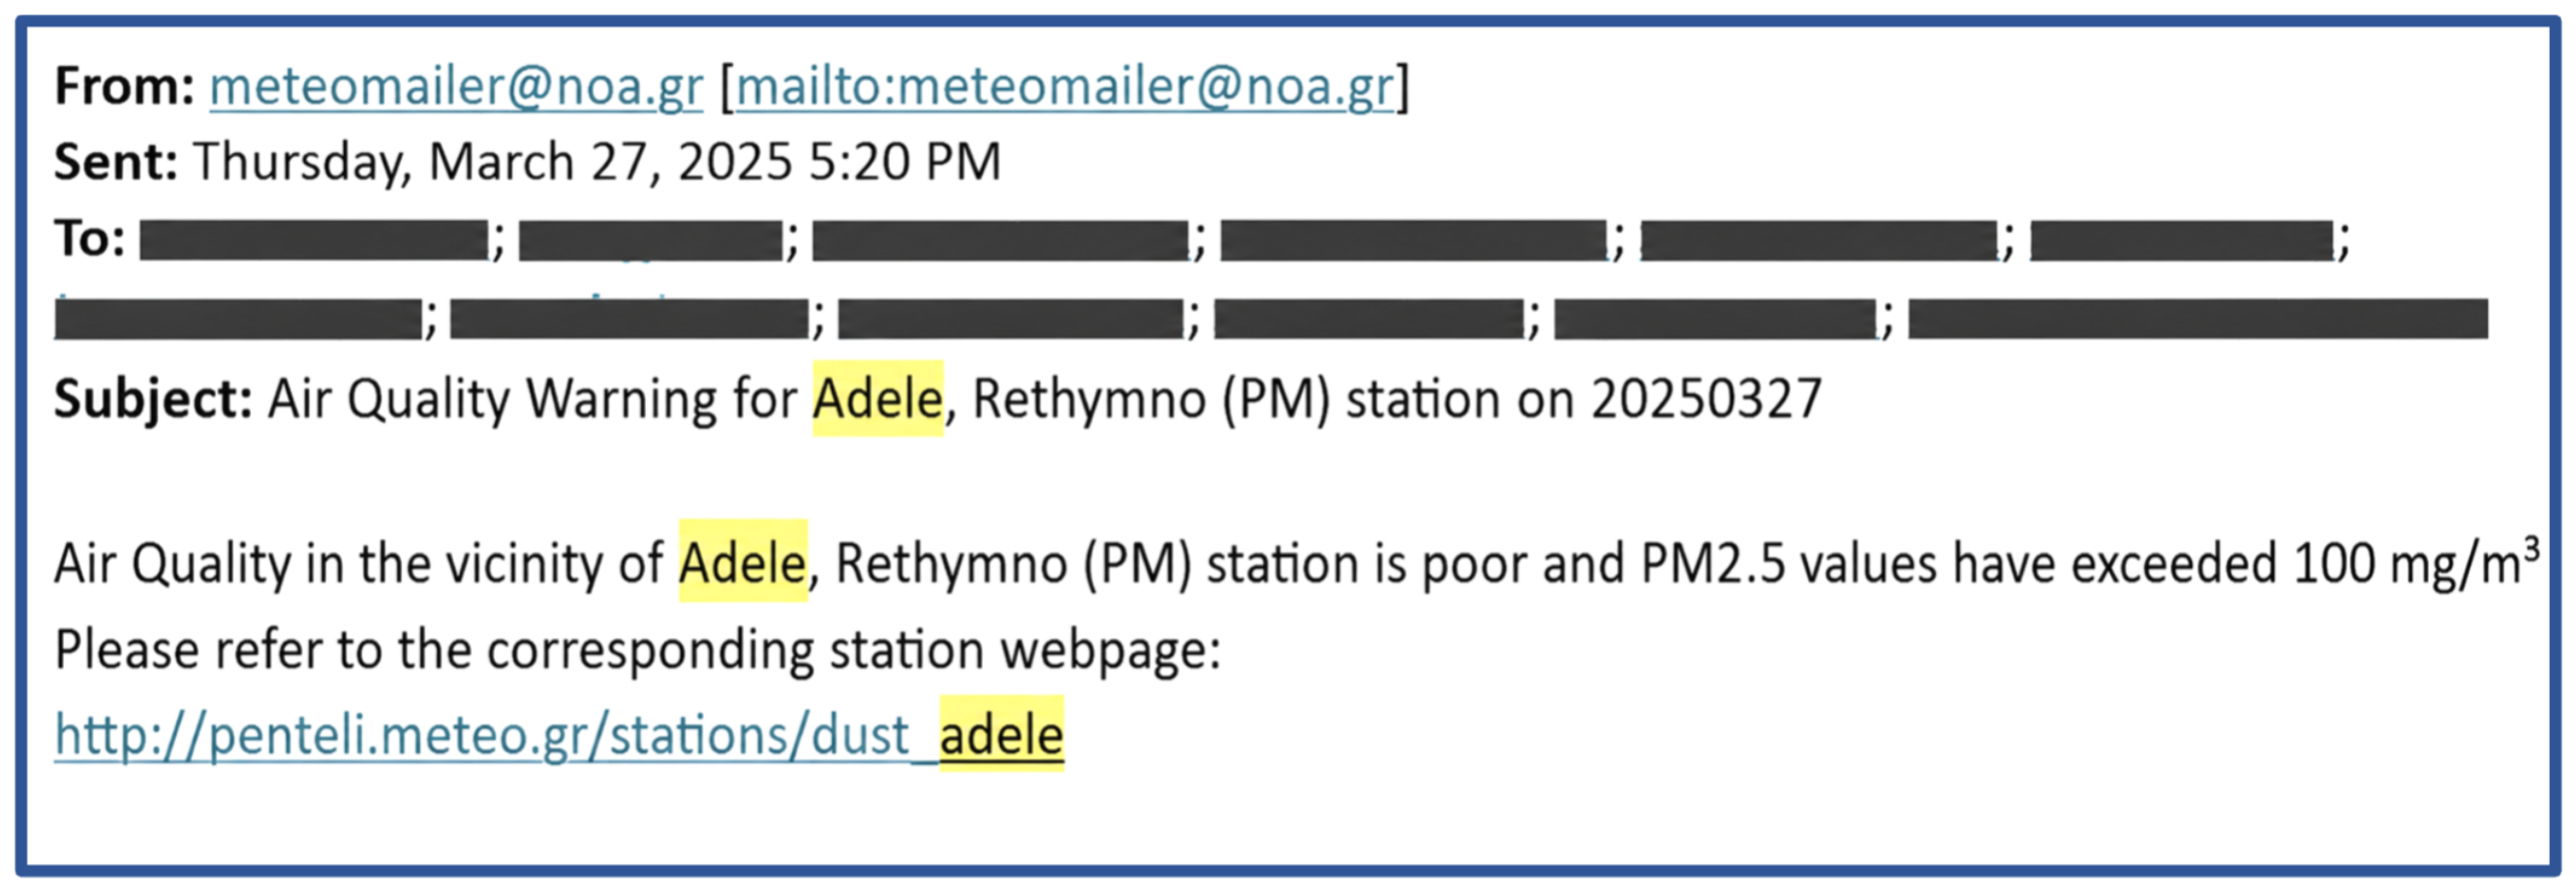
The automated messages are intended to support situational awareness and do not themselves constitute formal civil-protection instructions. Decisions concerning public warnings and protective actions remain the responsibility of the competent authorities. As an example, in the Municipality of Rethymno, during the first five months of 2026, eight warning messages were sent to designated civil protection recipients concerning exceedances of particulate-matter concentration thresholds in the city of Rethymno (threshold values given in Table 1). Figure 6 shows an example of an automated message sent to a recipient, including an active link to the observational platform.
Figure 6.
Example of an automated email notification generated following the exceedance of a predefined particulate-matter concentration threshold in the Municipality of Rethymno. The message includes the affected location, observed value, time of exceedance, and a link to the monitoring station. All URLs have been accessed on 14 October 2026. Yellow highlights the location of the warning.
Overall, the six operational implementations demonstrate that a common EWS architecture can support substantially different local configurations. The principal differences among the systems concern the density and type of observational equipment, the combination of forecast products, the hazards represented, and the way warning information is spatially aggregated and communicated. At the same time, all implementations retain the same basic workflow: observation and forecasting, automated processing, web-based visualization, threshold evaluation, and notification of designated users.
4. Discussion
The implementation of the early warning systems in six contrasting areas of Greece shows that a common operational architecture can be adapted to different geographical settings, hazard profiles, and user requirements. The same basic workflow—combining observations, forecasts, web-based visualization, threshold evaluation, and automated notifications—has been retained across all applications, while the observational equipment and information products have been tailored to local needs. This is illustrated by the emphasis on heat-related conditions in Athens, fire danger in Penteli, frost and particulate matter in Nevrokopi, dust and flooding in Rethymno, and multi-hazard monitoring across the larger and more diverse Region of Thessaly.
This place-based approach is consistent with the principles of people-centred multi-hazard early warning systems, which emphasize that warning services should reflect local vulnerabilities, institutional responsibilities, and response capacities rather than rely only on technically accurate forecasts. The close collaboration with municipal and regional authorities during system design is therefore an important feature of the present implementation. It allows the displayed variables, sensor deployment, warning thresholds, and means of communication to be adjusted to the operational priorities of the intended users. Similar conclusions have been drawn by Budimir et al. [7], who underline the importance of locally embedded and co-developed warning systems, and by the WMO EW4All framework [5,6], which calls for the translation of global forecasting capability into locally actionable services. The present systems primarily address the observation/forecasting and warning-dissemination pillars of the end-to-end EW4All framework; risk-knowledge assessment and systematic evaluation of preparedness and response outcomes were outside the scope of this study.
The systems currently contribute most directly to hazard monitoring and forecasting, warning dissemination, and support for preparedness. They should not, however, be considered complete substitutes for formal civil-protection warning and response procedures. Automated notifications are intended to draw attention to potentially hazardous conditions and direct users towards the full observational and forecast context. Final decisions concerning public warnings and protective measures remain with the competent authorities. This distinction is important because the effectiveness of an EWS depends on the entire warning chain, including interpretation, trust, institutional coordination, and the ability to act, rather than on the quality of any individual technical component.
A further strength of the architecture is its modularity. New observations or forecast layers can be incorporated without redesigning the complete system. Potential additions include pollen and noise measurements, hail or lightning-risk products, further biometeorological indicators, and additional air-quality information. Nevertheless, the inclusion of new products should be guided by demonstrated local relevance and by consultation with end-users, so that the platforms remain operationally focused and do not become overloaded with information.
The current study primarily documents system design and operational deployment and does not provide a comprehensive quantitative evaluation of forecast performance, alert accuracy, or user response. This represents an important direction for future work. Evaluation should include the frequency of threshold exceedances, false alarms and missed events, warning lead times, platform availability, and feedback from civil-protection personnel regarding the clarity and usefulness of the information. Such assessments would support the refinement of thresholds and help determine whether the systems lead to measurable improvements in preparedness and decision-making. The forecast products underlying the EWS (BOLAM, WRF/CFFWIS, and WRF-Chem) have been evaluated in previous studies [18,19,20,24,31,32], but the present paper does not provide independent, municipality-scale verification of these products for the six study areas and the operational period considered here. Such local-scale verification, together with assessment of spatial representativeness, model bias, and forecast uncertainty, is identified as a direction for future work.
A second development phase will focus particularly on flood forecasting. The integration of hydrological and hydraulic modelling, undertaken jointly by the National Observatory of Athens and the Hellenic Centre for Marine Research, will allow the present rainfall and water-level monitoring capabilities to be extended towards forecasts of river response and potentially affected areas. This would represent an important progression from hazard-based meteorological information towards more impact-oriented warning services. Recent research has shown the potential of high-resolution flood forecasting to translate meteorological and hydrological predictions into information on inundation and affected infrastructure, although such systems require appropriate hydrological observations, model calibration, and assessment of forecast uncertainty [8].
5. Conclusions
The early warning systems developed by the METEO Unit of the National Observatory of Athens provide a common operational framework for supporting Greek municipalities and regions facing different combinations of weather-related and environmental hazards. By integrating ground observations, satellite information, numerical forecasts, locally selected thresholds, and automated notifications, the systems provide authorities with timely information through a single accessible platform.
The six implementations demonstrate that the same core architecture can be transferred between areas while remaining responsive to local conditions and priorities. Their principal value lies not only in the scientific information they provide, but also in the way this information is organized and delivered to local users responsible for preparedness and emergency management.
Further development will focus on incorporating additional hazard information, improving flood-forecasting capabilities, and systematically evaluating forecast quality, warning performance, and user experience. These steps will help strengthen the transition from hazard monitoring towards more complete, locally actionable and impact-oriented early warning services, contributing to disaster-risk reduction and climate resilience in Greece.
Author Contributions
Conceptualization, K.L. and V.K.; methodology, K.L., A.B., G.K. and V.V.; software, A.B., S.D., C.G., T.M.G., A.K., I.K., G.K. and K.P.; formal analysis, A.B., S.D., G.K., I.K., K.P. and V.V.; data curation, all authors; writing—review and editing, K.L.; supervision, K.L. and V.K.; funding acquisition, K.L. All authors have read and agreed to the published version of the manuscript.
Funding
This research was funded by several contracts signed between the National Observatory of Athens and Greek municipalities (Kilkis, Grant 2269-Filodimos; Nevrokopi, Grant 2286; Penteli, Grant 2341; Rethymno, Grant 2297; Athens, Grant 2374) and regions (Thessaly, Grant 2381).
Data Availability Statement
The data presented in this study are available on request from the corresponding author (confidentiality constraints).
Acknowledgments
The authors acknowledge all the members of staff from various municipalities and regions that helped to improve the content and the usability of the developed early warning systems. During the preparation of this manuscript, the authors used Generative AI (Claude Opus 5.5) for the purposes of language editing and polishing to improve the clarity and readability of the manuscript. The authors have reviewed and edited the output and take full responsibility for the content of this publication.
Conflicts of Interest
The authors declare no conflicts of interest.
Abbreviations
The following abbreviations are used in this manuscript:
| EWS | Early Warning System |
| WMO | World Meteorological Organization |
| MTG | METEOSAT Third Generation |
| WRF | Weather Research Forecasting |
References
- World Meteorological Organization (WMO). State of the Global Climate 2025; WMO: Geneva, Switzerland, 2026; Available online: https://library.wmo.int/idurl/4/69807 (accessed on 3 September 2026).
- Alfieri, L.; Salamon, P.; Pappenberger, F.; Wetterhall, F.; Thielen, J. Operational early warning systems for water-related hazards in Europe. Environ. Sci. Policy 2012, 21, 35–49. [Google Scholar] [CrossRef] [Scilit]
- Papagiannaki, K.; Kotroni, V.; Lagouvardos, K. Impact-Based Analysis of Weather-Related Hazards in Greece (2000–2025): Insights from the High-Impact Weather Events Database (HIWE-DB). Climate 2026, 14, 105. [Google Scholar] [CrossRef] [Scilit]
- Dimitriou, E.; Efstratiadis, A.; Zotou, I.; Papadopoulos, A.; Iliopoulou, T.; Sakki, G.-K.; Mazi, K.; Rozos, E.; Koukouvinos, A.; Koussis, A.D.; et al. Post-Analysis of Daniel Extreme Flood Event in Thessaly, Central Greece: Practical Lessons and the Value of State-of-the-Art Water-Monitoring Networks. Water 2024, 16, 980. [Google Scholar] [CrossRef] [Scilit]
- World Meteorological Organization (WMO). Early Warnings for All: Executive Action Plan 2023–2027; WMO: Geneva, Switzerland, 2022. [Google Scholar]
- World Meteorological Organization (WMO). WMO and the Early Warnings for All Initiative. Available online: https://wmo.int/activities/early-warnings-all/wmo-and-early-warnings-all-initiative (accessed on 12 July 2026).
- Budimir, M.; Šakić Trogrlić, R.; Almeida, C.; Arestegui, M.; Chuquisengo Vásquez, O.; Cisneros, A.; Cuba Iriarte, M.; Dia, A.; Lizon, L.; Madueño, G.; et al. Opportunities and challenges for people-centered multi-hazard early warning systems: Perspectives from the Global South. iScience 2025, 28, 112353. [Google Scholar] [CrossRef] [Scilit] [PubMed]
- Najafi, H.; Shrestha, P.K.; Rakovec, O.; Apel, H.; Vorogushyn, S.; Kumar, R.; Thober, S.; Merz, B.; Samaniego, L. High-resolution impact-based early warning system for riverine flooding. Nat. Commun. 2024, 15, 3726. [Google Scholar] [CrossRef] [Scilit] [PubMed]
- Merz, B.; Kuhlicke, C.; Kunz, M.; Pittore, M.; Babeyko, A.; Bresch, D.N.; Domeisen, D.I.V.; Feser, F.; Koszalka, I.; Kreibich, H.; et al. Impact Forecasting to Support Emergency Management of Natural Hazards. Rev. Geophys. 2020, 58, e2020RG000704. [Google Scholar] [CrossRef] [Scilit]
- Reichstein, M.; Benson, V.; Blunk, J.; Camps-Valls, G.; Creutzig, F.; Fearnley, C.J.; Han, B.; Kornhuber, K.; Rahaman, N.; Schölkopf, B.; et al. Early warning of complex climate risk with integrated artificial intelligence. Nat. Commun. 2025, 16, 2564. [Google Scholar] [CrossRef] [Scilit] [PubMed]
- Kappes, M.S.; Keiler, M.; von Elverfeldt, K.; Glade, T. Challenges of analyzing multi-hazard risk: A review. Nat. Hazards 2012, 64, 1925–1958. [Google Scholar] [CrossRef] [Scilit]
- Lagouvardos, K.; Kotroni, V.; Bezes, A.; Koletsis, I.; Kopania, T.; Lykoudis, S.; Mazarakis, N.; Papagiannaki, K.; Vougioukas, S. The Automatic Weather Stations Network of the National Observatory of Athens: Operation and Database. Geosci. Data J. 2017, 4, 4–16. [Google Scholar] [CrossRef] [Scilit]
- World Meteorological Organization (WMO). Guide to Instruments and Methods of Observation, 2018 ed.; WMO-No. 8; WMO: Geneva, Switzerland, 2018. [Google Scholar]
- Morawska, L.; Thai, P.K.; Liu, X.; Asumadu-Sakyi, A.; Ayoko, G.; Bartonova, A.; Bedini, A.; Chai, F.; Christensen, B.; Dunbabin, M.; et al. Applications of low-cost sensing technologies for air quality monitoring and exposure assessment: How far have they gone? Environ. Int. 2018, 116, 286–299. [Google Scholar] [CrossRef] [Scilit] [PubMed]
- Lahuerta, J.A.; Pascual, A.; Ripodas, P. User Manual for the Precipitation Product Processors of the NWC/GEO; NWC SAF: Madrid, Spain, 2025; Available online: https://www.nwcsaf.org/Downloads/GEO/2025/Documents/Scientific_Docs/NWC-CDOP4-MTG-AEMET-SCI-UM-Precipitation_v1.2.1.pdf (accessed on 28 April 2026).
- Lahuerta, J.A.; Pascual, A.; Lliso, L.; Ripodas, P. Algorithm Theoretical Basis Document for the Precipitation Product Processors of the NWC/GEO MTG-I Day-1; NWC SAF: Madrid, Spain, 2025; Available online: https://www.nwcsaf.org/Downloads/GEO/2025/Documents/Scientific_Docs/NWC-CDOP2-MTG-AEMET-SCI-ATBD-Precipitation_v1.1.1.pdf (accessed on 28 April 2026).
- Lahuerta, J.A.; Pascual, A.; Ripodas, P. Scientific and Validation Report for the Precipitation Product Processors of the NWC/GEO; NWC SAF: Madrid, Spain, 2025; Available online: https://www.nwcsaf.org/Downloads/GEO/2025/Documents/Scientific_Docs/NWC-CDOP4-GEO-AEMET-SCI-VR-Precipitation_v1.0.1.pdf (accessed on 28 April 2026).
- Buzzi, A.; Fantini, M.; Malguzzi, P.; Nerozzi, F. Validation of a limited area model in cases of Mediterranean cyclogenesis: Surface fields and precipitation scores. Meteorol. Atmos. Phys. 1994, 53, 137–153. [Google Scholar] [CrossRef] [Scilit]
- Lagouvardos, K.; Kotroni, V.; Koussis, A.; Feidas, C.; Buzzi, A.; Malguzzi, P. The meteorological model BOLAM at the National Observatory of Athens: Assessment of two-year operational use. J. Appl. Meteorol. Climatol. 2003, 42, 1667–1678. [Google Scholar] [CrossRef] [Scilit] [PubMed]
- Davolio, S.; Malguzzi, P.; Drofa, O.; Mastrangelo, D.; Buzzi, A. The Piedmont flood of November 1994: A testbed of forecasting capabilities of the CNR-ISAC meteorological model suite. Bull. Atmos. Sci. Technol. 2020, 1, 263–282. [Google Scholar] [CrossRef] [Scilit] [PubMed]
- Van Wagner, C.E. Development and Structure of the Canadian Forest Fire Weather Index System; Forestry Technical Report 35; Canadian Forestry Service: Ottawa, ON, Canada, 1987. [Google Scholar]
- Skamarock, W.C.; Klemp, J.B.; Dudhia, J.; Gill, D.O.; Barker, D.M.; Duda, M.G.; Huang, X.-Y.; Wang, W.; Powers, J.G. A Description of the Advanced Research WRF Version 3; NCAR Technical Note NCAR/TN-475+STR; University Corporation for Atmospheric Research: Boulder, CO, USA, 2008. [Google Scholar] [CrossRef] [Scilit]
- Abatzoglou, J.T.; Williams, A.P.; Boschetti, L.; Zubkova, M.; Kolden, C.A. Global patterns of interannual climate-fire relationships. Glob. Change Biol. 2018, 24, 5164–5175. [Google Scholar] [CrossRef] [Scilit] [PubMed]
- Papagiannaki, K.; Giannaros, T.M.; Lykoudis, S.; Kotroni, V.; Lagouvardos, K. Weather-related thresholds for wildfire danger in a Mediterranean region: The case of Greece. Agric. For. Meteorol. 2020, 291, 108076. [Google Scholar] [CrossRef] [Scilit]
- Carnicer, J.; Alegria, A.; Giannakopoulos, C.; Di Giuseppe, F.; Karali, A.; Koutsias, N.; Lionello, P.; Parrington, M.; Vitolo, C. Global warming is shifting the relationships between fire weather and realized fire-induced CO2 emissions in Europe. Sci. Rep. 2022, 12, 10365. [Google Scholar] [CrossRef] [Scilit] [PubMed]
- Galizia, L.F.; Curt, T.; Barbero, R.; Rodrigues, M. Understanding fire regimes in Europe. Int. J. Wildland Fire 2022, 31, 56–66. [Google Scholar] [CrossRef] [Scilit]
- San-Miguel-Ayanz, J.; Schulte, E.; Schmuck, G.; Camia, A.; Strobl, P.; Libertà, G.; Giovando, C.; Boca, R.; Sedano, F.; Kempeneers, P.; et al. Comprehensive monitoring of wildfires in Europe: The European Forest Fire Information System (EFFIS). In Approaches to Managing Disaster—Assessing Hazards, Emergencies and Disaster Impacts; Tiefenbacher, J., Ed.; InTech: Rijeka, Croatia, 2012; pp. 87–108. [Google Scholar] [CrossRef] [Scilit] [PubMed]
- Di Giuseppe, F.; Pappenberger, F.; Wetterhall, F.; Krzeminski, B.; Camia, A.; Libertà, G.; San Miguel, J. The potential predictability of fire danger provided by numerical weather prediction. J. Appl. Meteorol. Climatol. 2016, 55, 2469–2491. [Google Scholar] [CrossRef] [Scilit]
- Grell, G.A.; Peckham, S.E.; Schmitz, R.; McKeen, S.A.; Frost, G.; Skamarock, W.C.; Eder, B. Fully coupled “online” chemistry within the WRF model. Atmos. Environ. 2005, 39, 6957–6975. [Google Scholar] [CrossRef] [Scilit]
- Ginoux, P.; Chin, M.; Tegen, I.; Prospero, J.M.; Holben, B.; Dubovik, O.; Lin, S.-J. Sources and distributions of dust aerosols simulated with the GOCART model. J. Geophys. Res. Atmos. 2001, 106, 20255–20273. [Google Scholar] [CrossRef] [Scilit]
- Flaounas, E.; Kotroni, V.; Lagouvardos, K.; Klose, M.; Flamant, C.; Giannaros, T.M. Sensitivity of the WRF-Chem (V3.6.1) model to different dust emission parametrisations: Assessment in the broader Mediterranean region. Geosci. Model Dev. 2017, 10, 2925–2945. [Google Scholar] [CrossRef] [Scilit]
- Eleftheriou, A.; Mouzourides, P.; Kouis, P.; Kalivitis, N.; Katra, I.; Vasiliadou, E.; Savvides, C.; Yiallouros, P.; Neophytou, M.K.-A. How accurate are operational dust models in predicting particulate matter (PM) levels in the Eastern Mediterranean Region? Insights from PM surface concentrations. Nat. Hazards Earth Syst. Sci. 2025, 25, 4961–4982. [Google Scholar] [CrossRef] [Scilit]
- Diakakis, M.; Mavroulis, S.; Deligiannakis, G. Floods in Greece, a statistical and spatial approach. Nat. Hazards 2012, 62, 485–500. [Google Scholar] [CrossRef] [Scilit]
- Monteiro, A.; Basart, S.; Kazadzis, S.; Votzis, A.; Gkikas, A.; Vandenbussche, S.; Tobias, A.; Gama, C.; García-Pando, C.P.; Tarradellas, E.; et al. Environmental and socio-economic impacts of a strong dust episode over southeastern Europe: The Minoan Red case. Sci. Total Environ. 2022, 843, 156861. [Google Scholar] [CrossRef] [Scilit] [PubMed]
- Lagouvardos, K.; Karagiannidis, A.; Dafis, S.; Kalimeris, A.; Kotroni, V. Ianos—A hurricane in the Mediterranean. Bull. Am. Meteorol. Soc. 2022, 103, E1621–E1636. [Google Scholar] [CrossRef] [Scilit]
- Ferrarin, C.; Pantillon, F.; Davolio, S.; Bajo, M.; Miglietta, M.M.; Avolio, E.; Carrió, D.S.; Pytharoulis, I.; Sanchez, C.; Patlakas, P.; et al. Assessing the coastal hazard of Medicane Ianos through ensemble modelling. Nat. Hazards Earth Syst. Sci. 2023, 23, 2273–2287. [Google Scholar] [CrossRef] [Scilit]

Disclaimer/Publisher’s Note: The statements, opinions and data contained in all publications are solely those of the individual author(s) and contributor(s) and not of MDPI and/or the editor(s). MDPI and/or the editor(s) disclaim responsibility for any injury to people or property resulting from any ideas, methods, instructions or products referred to in the content. |
© 2026 by the authors. Licensee MDPI, Basel, Switzerland. This article is an open access article distributed under the terms and conditions of the Creative Commons Attribution (CC BY) license.