Article

Spatiotemporal Patterns of Wildfire Severity and Demographic Characteristics in the 2025 Palisades Fire, Los Angeles, California


1
Laboratory for Remote Sensing and Environmental Change (LRSEC), Department of Earth, Environmental and Geographical Sciences, University of North Carolina, Charlotte, NC 28223, USA
2
Department of Civil and Environmental Engineering, University of North Carolina, Charlotte, NC 28223, USA
3
Center of Excellence in Regional, Urban, and Built Environmental Analytics (RUBEA), Faculty of Architecture, Chulalongkorn University, Bangkok 10330, Thailand
*
Author to whom correspondence should be addressed.
GeoHazards 2026, 7(4), 120; https://doi.org/10.3390/geohazards7040120
Submission received: 15 July 2026 / Revised: 29 September 2026 / Accepted: 5 October 2026 / Published: 9 October 2026

Abstract

This study examines historical wildfire frequency and the burned area in the Palisades region from 1928 to 2021 and the spatial distribution of burn severity within the 2025 Palisades Fire perimeter in Los Angeles County, California. Sentinel-2 imagery was used to calculate the Normalized Difference Vegetation Index (NDVI), differenced NDVI (dNDVI), and differenced Normalized Burn Ratio (dNBR). Burn-severity clustering was evaluated with Global and Local Moran’s I and Getis-Ord Gi*, and prefire land cover was summarized from Dynamic World V1. The historical record showed an overall increase in annual fire frequency, while annual burned area remained highly variable. Within the 2025 fire perimeter, the highest dNBR severity class represented 61.92% of the classified area, and Global Moran’s I indicated strong positive spatial autocorrelation (I = 0.874, z = 2656.89, p < 0.001). NDVI and dNDVI showed widespread reductions in vegetation greenness between the prefire and early postfire observation periods. An external field-informed cross-check against the final USGS Burned Area Emergency Response Soil Burn Severity product produced a moderately strong positive rank correlation (Spearman’s ρ = 0.70), although study-specific field validation was unavailable. Area-weighted American Community Survey data provide a descriptive demographic profile of intersecting census tracts and are not interpreted as a population-weighted social vulnerability assessment. The results characterize spatial fire effects and demographic context while avoiding causal attribution to environmental or social drivers that were not directly tested.

1. Introduction

Wildfire is a long-standing ecological disturbance in Southern California shrublands, where it influences vegetation dynamics and ecosystem processes [1]. In recent decades, however, California has experienced increasingly destructive wildfire events that affect both ecosystems and communities [2,3].
The Palisades region of western Los Angeles County lies along the Santa Monica Mountains and forms a complex wildland–urban interface (WUI) characterized by rugged terrain, suburban development, and extensive chaparral and other fire-prone vegetation [4,5,6]. The close proximity of homes and infrastructure to wildland fuels creates substantial exposure to wildfire hazards.
Wildfire risk in the WUI is not limited to California or the western United States, but is an emerging international issue. WUI landscapes are found on every continent, including large areas of Mediterranean Europe, Australia, South America, Africa, and Asia, where human settlements are located within or close to fire-prone vegetation [7]. Recent worldwide assessments have also identified that WUI areas have grown in recent decades and that millions of people globally are at risk from wildfire in these areas [8]. These patterns are a result of the influence of settlement expansion, flammable vegetation, and alteration of wildfire conditions. In the broader international context, the Palisades Fire is a very exposed WUI fire in which dense development, natural vegetation and extreme fire–weather conditions intersect.
The Palisades Fire began on 7 January 2025 and burned approximately 9596 ha [9]. Its winter timing occurred amid dry, windy conditions, while broader research has identified hydroclimatic variability as an important influence on wildfire risk [10]. The present study uses these conditions as event context and does not treat climate or weather as causal drivers of the observed burn-severity pattern.
The fire expanded rapidly during its initial phase. The reported area increased from approximately 8 ha at 10:30 a.m. on 7 January to 1182 ha by 7:30 p.m., then to 6407 ha by 2:45 p.m. on 8 January [11,12]. CAL FIRE reported extreme fire behavior and spotting [13], and Li et al. [14] estimated maximum early spread rates of approximately 1.0–3.7 km h−1 and satellite-derived fire radiative intensity in residential areas. Containment reached 95% on 28 January and 97% on 29 January [12].
The event provides an opportunity to examine a major winter WUI fire using a combination of historical fire records, satellite-derived spectral indices, and spatial statistics. Characterizing where burn severity clustered, how vegetation greenness changed during the early postfire period, and which demographic characteristics were present within the affected area can inform interpretation of the incident without implying causal relationships that were not tested.
Previous research has documented changes in fire frequency, burned area, and burn severity in California and the western United States, together with the influences of warming, Santa Ana winds, and hydroclimatic variability [2,3,10,15,16,17,18,19]. Remote-sensing measures such as the differenced Normalized Burn Ratio (dNBR) and Normalized Difference Vegetation Index (NDVI), combined with spatial statistics such as Moran’s I and Getis-Ord Gi*, can characterize burn-related spectral change and its spatial clustering [20,21,22,23]. Lentile et al. [24] emphasized the importance of distinguishing fire intensity, burn severity, and ecological response when interpreting remotely sensed fire products.
NBR and dNBR describe spectral change associated with fire effects, but their relationship to ecological burn severity can vary with vegetation type, terrain, prefire conditions, and image timing. Field measures such as the Composite Burn Index therefore remain important for calibration and validation. Spatial statistics can complement spectral indices by quantifying global and local clustering, while demographic data can provide contextual information about populations located within fire-affected WUI areas.
Previous studies have shown that wildfire exposure and disaster impacts can vary with age, income, mobility, language, housing tenure, and other characteristics associated with social vulnerability [25,26,27,28,29,30,31,32,33,34]. These relationships motivate inclusion of demographic context, but they do not establish vulnerability for a specific fire area without an explicit comparative index or outcome-based analysis.
Accordingly, this study uses area-weighted American Community Survey data to describe selected tract-level demographic characteristics within the Palisades Fire perimeter. The analysis is descriptive and is not presented as a composite social vulnerability index, a population-weighted exposure estimate, or a comparison with Los Angeles County or California.
This study includes two research questions:
How did wildfire frequency and burned area vary in the Palisades region from 1928 to 2021, and what spatial patterns of burn severity occurred within the 2025 Palisades Fire perimeter?
What area-weighted demographic characteristics were present in census tracts that meaningfully intersected with the 2025 Palisades Fire perimeter?
This study integrates established remote-sensing and spatial-statistical methods to characterize one WUI fire event. It contributes a spatially explicit account of dNBR burn-severity patterns, an external field-informed comparison with the final USGS BAER Soil Burn Severity product, historical context for fire frequency and burned area, and a clearly bounded demographic description of the intersecting census tracts.

2. Materials and Methods

A multi-platform geospatial workflow was implemented in Google Earth Engine (Google LLC, Mountain View, CA, USA), ArcGIS Pro 3.5 (Esri, Redlands, CA, USA), R 4.3.2 (R Foundation for Statistical Computing, Vienna, Austria), and Python 3.11.5 (Python Software Foundation, Beaverton, OR, USA). Sentinel-2 imagery was used to derive NBR, dNBR, NDVI, and dNDVI; ArcGIS Pro was used for local and global spatial statistics; R and Python were used to summarize and visualize the resulting data. The methods characterize burn-related spectral change, vegetation greenness, historical fire occurrence, prefire land cover, and area-weighted demographic conditions.

2.1. Study Area and Data Sources

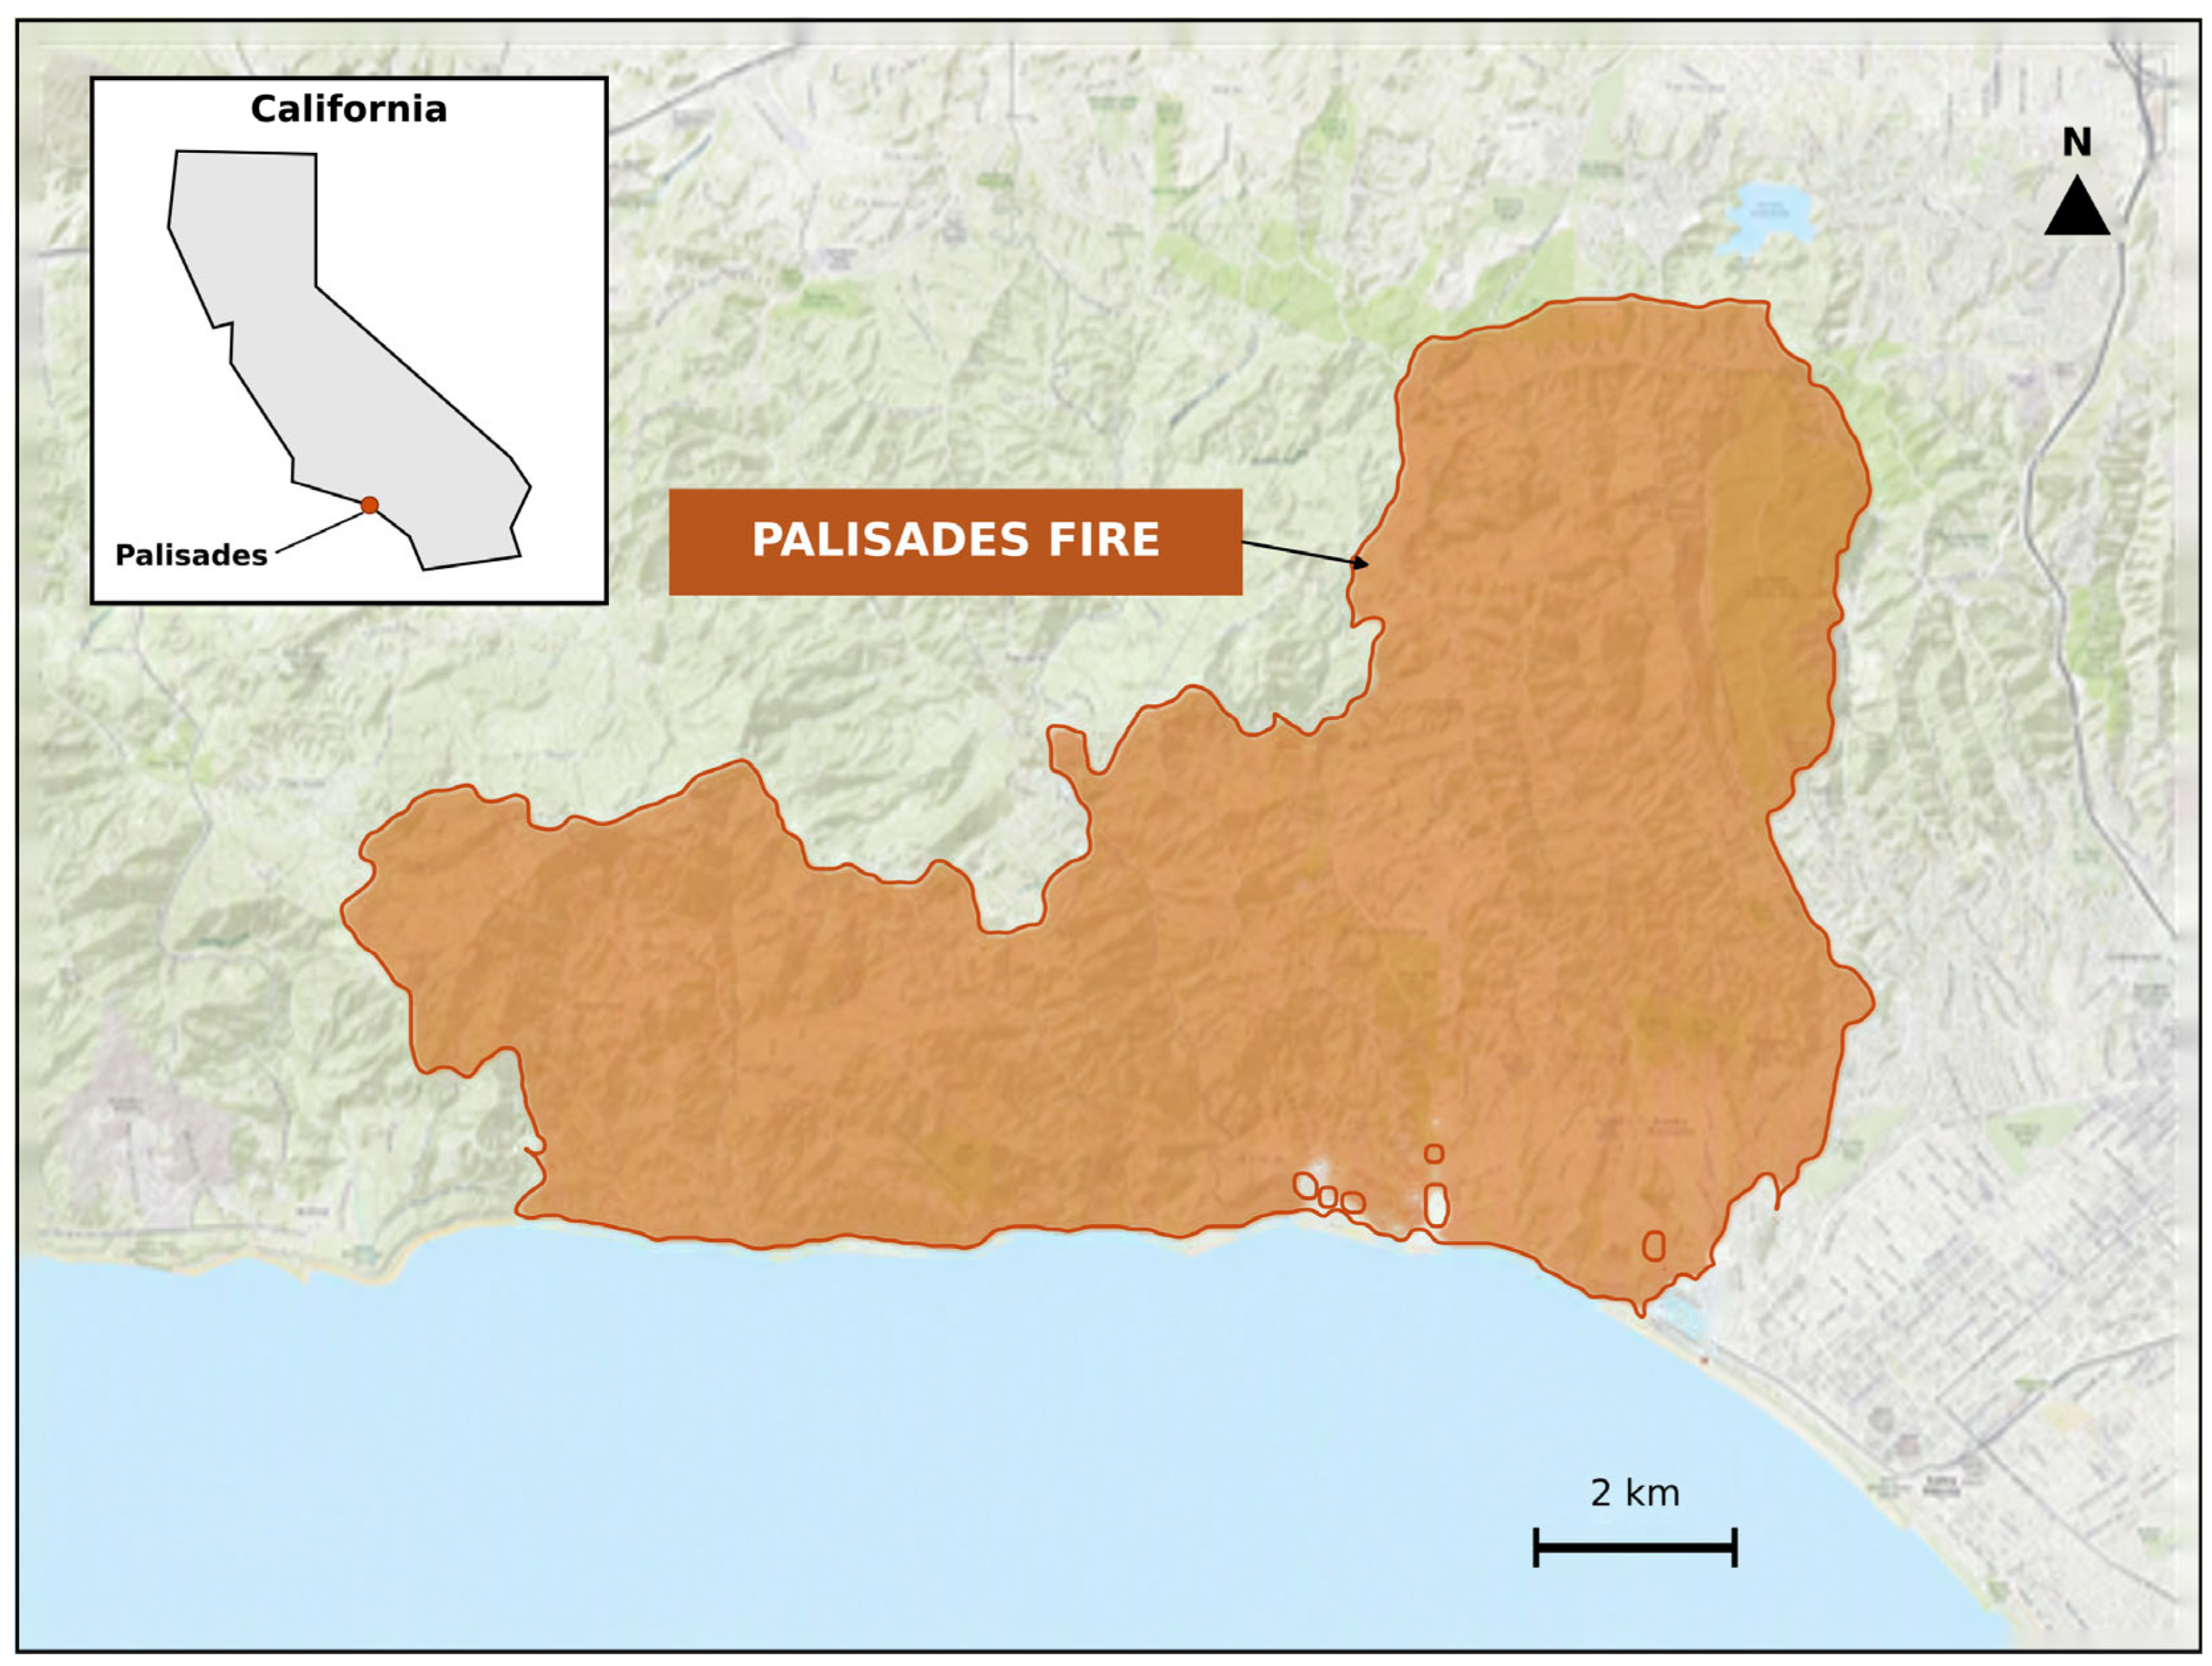
The study area comprises the 2025 Palisades Fire perimeter in western Los Angeles County, California (Figure 1). The perimeter intersects the rugged Santa Monica Mountains and adjacent developed areas within the WUI. Unless otherwise stated, spatial datasets and analyses were clipped to this perimeter.
The time frame under analysis included the following:
  • Before the fire: 1–5 January 2025.
  • Conditions after fire: 1–5 March 2025.
  • Historical fire occurrence: 1928–2021.
Table 1 summarizes the spatial datasets used in this analysis along with their temporal coverage.
The CAL FIRE Fire and Resource Assessment Program Fire Threat 2014 dataset (fthrt14_2) was used to characterize prefire wildfire threat [38]. The product combines annual fire probability with potential fire behavior represented by Fuel Rank and provides five classes: Low, Moderate, High, Very High, and Extreme. The published classes were retained without reclassification, clipped to the Palisades Fire perimeter in ArcGIS Pro, and summarized with the Tabulate Area tool. Class percentages were calculated relative to the total classified area within the perimeter.

2.2. Fire Behavior and Incident Progression

Fire behavior and incident progression were characterized from updates issued by the Los Angeles Fire Department and CAL FIRE, a contemporaneous CBS News report, and the satellite-based analysis of Li et al. [11,12,13,14]. The reviewed information included reported fire size over time, spread direction, wind conditions, observed fire behavior, spotting, containment, maximum spread rate, and satellite-derived fire radiative intensity. Event-specific wind and relative-humidity observations reported by Li et al. [14] were used only as context and were not independently derived or modeled spatially. The reviewed sources did not provide quantitative flame length or direct fireline intensity, so these variables were not estimated. Successive agency-reported fire sizes were used to describe temporal progression and to provide physical context for interpreting the spatial burn-severity patterns.

2.3. Prefire Vegetation and Land-Cover Composition

Prefire vegetation and land-cover conditions within the Palisades Fire perimeter were assessed using Dynamic World V1 [37], a 10 m land-cover dataset derived from Sentinel-2 imagery. The dataset classifies land cover into nine categories: trees, grass, shrub and scrub, built land, bare land, water, crops, flooded vegetation, and snow and ice. Imagery collected between 1 January and 31 December 2024 was clipped to the fire perimeter, and the modal land-cover class for each pixel was used to represent dominant prefire conditions. The total area and percentage of the fire perimeter occupied by each class were then calculated.

2.4. Satellite Image Preprocessing and Spectral Indices

Sentinel-2 Level-2A surface-reflectance imagery was obtained from the COPERNICUS/S2_SR_HARMONIZED collection in Google Earth Engine [36,40]. Prefire imagery covered 1–5 January 2025, immediately before ignition on 7 January, and early postfire imagery covered 1–5 March 2025. Scenes intersecting the Palisades Fire perimeter were filtered using the CLOUDY_PIXEL_PERCENTAGE metadata field, retaining scenes with less than 10% cloud cover. The original workflow did not apply an additional pixel-level cloud or shadow mask. A pixel-wise median composite was created for each period and used to calculate NBR, dNBR, NDVI, and dNDVI.
NBR and dNBR were selected because near-infrared and shortwave-infrared reflectance respond to fire-related changes in vegetation and surface conditions [41]. NDVI was used separately to describe vegetation greenness [42], and dNDVI represented the difference in greenness between the two observation periods [43]. Because the observations were acquired in January and March and only one early postfire period was available, seasonal and phenological effects could not be separated fully from fire effects. Accordingly, dNDVI was interpreted as short-term change in vegetation greenness, not as burn severity or a vegetation-recovery rate.
For the dNBR calculation, NBR was calculated separately for the prefire and postfire periods using Sentinel-2 Band 8 (near-infrared; NIR) and Band 12 (shortwave-infrared; SWIR2) as
NBR = (B8 − B12)/(B8 + B12).
The differenced Normalized Burn Ratio was then calculated by subtracting the postfire NBR from the prefire NBR:
dNBR = NBRpre-fire − NBRpost-fire.
Positive dNBR values indicate a decrease in NBR from the prefire to postfire period and generally represent greater fire-related spectral change, whereas values near zero indicate relatively little change and negative values indicate higher postfire than prefire NBR. The resulting dNBR values were classified into six burn-severity classes: class 0 for dNBR ≤ −0.10, class 1 for −0.10 < dNBR ≤ 0.10, class 2 for 0.10 < dNBR ≤ 0.27, class 3 for 0.27 < dNBR ≤ 0.44, class 4 for 0.44 < dNBR ≤ 0.66, and class 5 for dNBR > 0.66.
For the vegetation-change analysis, NDVI was calculated separately for the prefire and postfire images using Sentinel-2 Band 8 (NIR) and Band 4 (red) as
NDVI = (B8 − B4)/(B8 + B4).
The difference in NDVI was then calculated by subtracting the prefire NDVI from the postfire NDVI:
dNDVI = NDVIpost-fire − NDVIpre-fire.
Negative dNDVI values indicate a reduction in vegetation greenness between the prefire and postfire periods, whereas positive values indicate an increase. The dNDVI image was clipped to the Palisades Fire perimeter for analysis and visualization.

2.5. Burn Severity Classification and External Cross-Check

Continuous dNBR values were grouped into six ordinal classes to summarize the magnitude of burn-related spectral change (Table 2): class 0 (dNBR ≤ −0.10), class 1 (−0.10 < dNBR ≤ 0.10), class 2 (0.10 < dNBR ≤ 0.27), class 3 (0.27 < dNBR ≤ 0.44), class 4 (0.44 < dNBR ≤ 0.66), and class 5 (dNBR > 0.66). This classification follows the general framework of Key and Benson [41], who noted that class number and ranges may be adjusted for the application and image pair; comparable dNBR applications are described in [43,44]. The percentage of classified raster cells in each class was calculated. The classified raster was also vectorized in Google Earth Engine to create burn-severity polygons for the local spatial analyses.
As an external field-informed cross-check, the dNBR classification was compared with the final USGS Burned Area Emergency Response (BAER) Soil Burn Severity product for the Palisades Fire [39]. Only BAER classes 1–4 were retained. Spatially coincident values were randomly sampled within the fire perimeter at a 30 m scale, yielding 1969 valid pairs. Because the dNBR and BAER products used six and four ordinal classes, respectively, Spearman’s rank correlation was used to evaluate their ordinal correspondence. This comparison is not a substitute for independent Composite Burn Index field validation.

2.6. Spatial Statistical Analysis

Spatial statistics were calculated in ArcGIS Pro. Getis-Ord Gi* identified local concentrations of relatively high or low burn-severity values, and Anselin Local Moran’s I identified High–High and Low–Low clusters and High–Low and Low–High spatial outliers. These statistics provide complementary information about local concentration and association [45].
For Local Moran’s I and Getis-Ord Gi*, the analytical unit was the burn-severity polygon created by vectorizing the classified dNBR raster. Each polygon was one observation, and burn-severity class was the analysis field. Spatial relationships were supplied through a spatial-weights matrix file (.swm) using the ArcGIS Pro ‘Get Spatial Weights from File’ conceptualization, Euclidean distance, and row standardization; no additional distance threshold was specified. Local Moran’s I significance was evaluated at p < 0.05. Getis-Ord Gi* results were summarized at the 90%, 95%, and 99% confidence levels. Counts, percentages, z-scores, and p-values were exported for reporting. For Global Moran’s I, valid classified raster cells were converted to points, projected to WGS 1984 UTM Zone 11N, and analyzed using a fixed-distance threshold of 14.94 m. The statistic, expected value, variance, z-score, and p-value were retained to support reproducibility. Different scales of spatial association were captured by using these two different spatial conceptualizations. The polygon-based approach for local statistics was chosen to define contiguous areas of burn severity for management purposes and to minimize the fine-scale “salt-and-pepper” noise associated with cluster analysis of pixels. The global statistic represents overall pixel-level dependence, while the local statistics emphasize patch-level spatial clustering since these analyses employ different spatial units (fine-scale points versus broader polygons). A sensitivity test for Global Moran’s I was also carried out using a larger distance threshold of 500 m to ensure that the global clustering result was not only an artifact of fine-scale pixel adjacency (pseudo-replication).
R was used to summarize annual fire counts, burned area, vegetation-index values, land-cover classes, and burn-severity classes from outputs generated in Google Earth Engine and ArcGIS Pro. Python was used for supplementary data checks and tabulation.
Burn-severity-class percentages were displayed in a categorical bar chart. A Moran’s scatterplot was used to visualize the relationship between standardized burn-severity values and their spatial lags, while Global Moran’s I, its z-score, and its p-value provided the formal test of global spatial autocorrelation.

2.7. Historical Fire Trend Analysis

Historical fire frequency and burned area from 1928 to 2021 were analyzed using the California Fire Perimeter dataset in Google Earth Engine [35]. Fire perimeters intersecting the 2025 Palisades Fire perimeter were selected, and annual fire counts were calculated for every year, including zero-event years. For annual burned area, fire geometries were united by year, intersected with the 2025 study perimeter, and converted from square meters to hectares. A fitted linear trend and a three-year moving average were used to display long- and shorter-term variation in annual fire frequency. Annual fire count was also plotted against annual burned area. These analyses describe frequency and extent, not historical burn severity.

2.8. Demographic Analysis

2.8.1. Study Area and Spatial Framework

Official fire-perimeter data [30] were overlaid with U.S. census tracts in ArcGIS Pro 3.4. Tracts were retained when at least 10% of their land area intersected with the fire perimeter. This pragmatic threshold reduced the influence of incidental boundary intersections; it was not treated as a threshold of population exposure because within-tract population distributions were unavailable.

2.8.2. Demographic Data Sources

Demographic data were obtained from the 2019–2023 American Community Survey five-year estimates [46] at census-tract level. Indicators were selected with reference to the CDC/ATSDR Social Vulnerability Index framework [30] and prior wildfire-vulnerability literature [29,31,32,33,34]. They represent dimensions that may be relevant to emergency communication, mobility, housing, and recovery.
The following indicators were included:
  • The percentage of the population aged 65 and over;
  • Racial and ethnic composition;
  • The percentage of the population with one or more disabilities;
  • The percentage of households with limited English proficiency;
  • The percentage of individuals below the federal poverty line;
  • The percentage of individuals below 200% of the federal poverty line;
  • The percentage of households with no available vehicle;
  • The percentage of owner-occupied and renter-occupied housing units.

2.8.3. Weighted Statistical Analysis

For each retained tract, the weight equaled the proportion of tract land area contained within the fire perimeter. Weighted means were calculated for each demographic variable, and the minimum, maximum, and standard deviation were reported across the retained tracts. Because the weights represent geographic overlap rather than the spatial distribution of residents, the results are not population-weighted estimates of people directly exposed. The analysis is descriptive; no county- or state-level reference population was used, and the indicators were not combined into a social vulnerability index.

3. Results

3.1. Burn Severity and Spatial Clustering

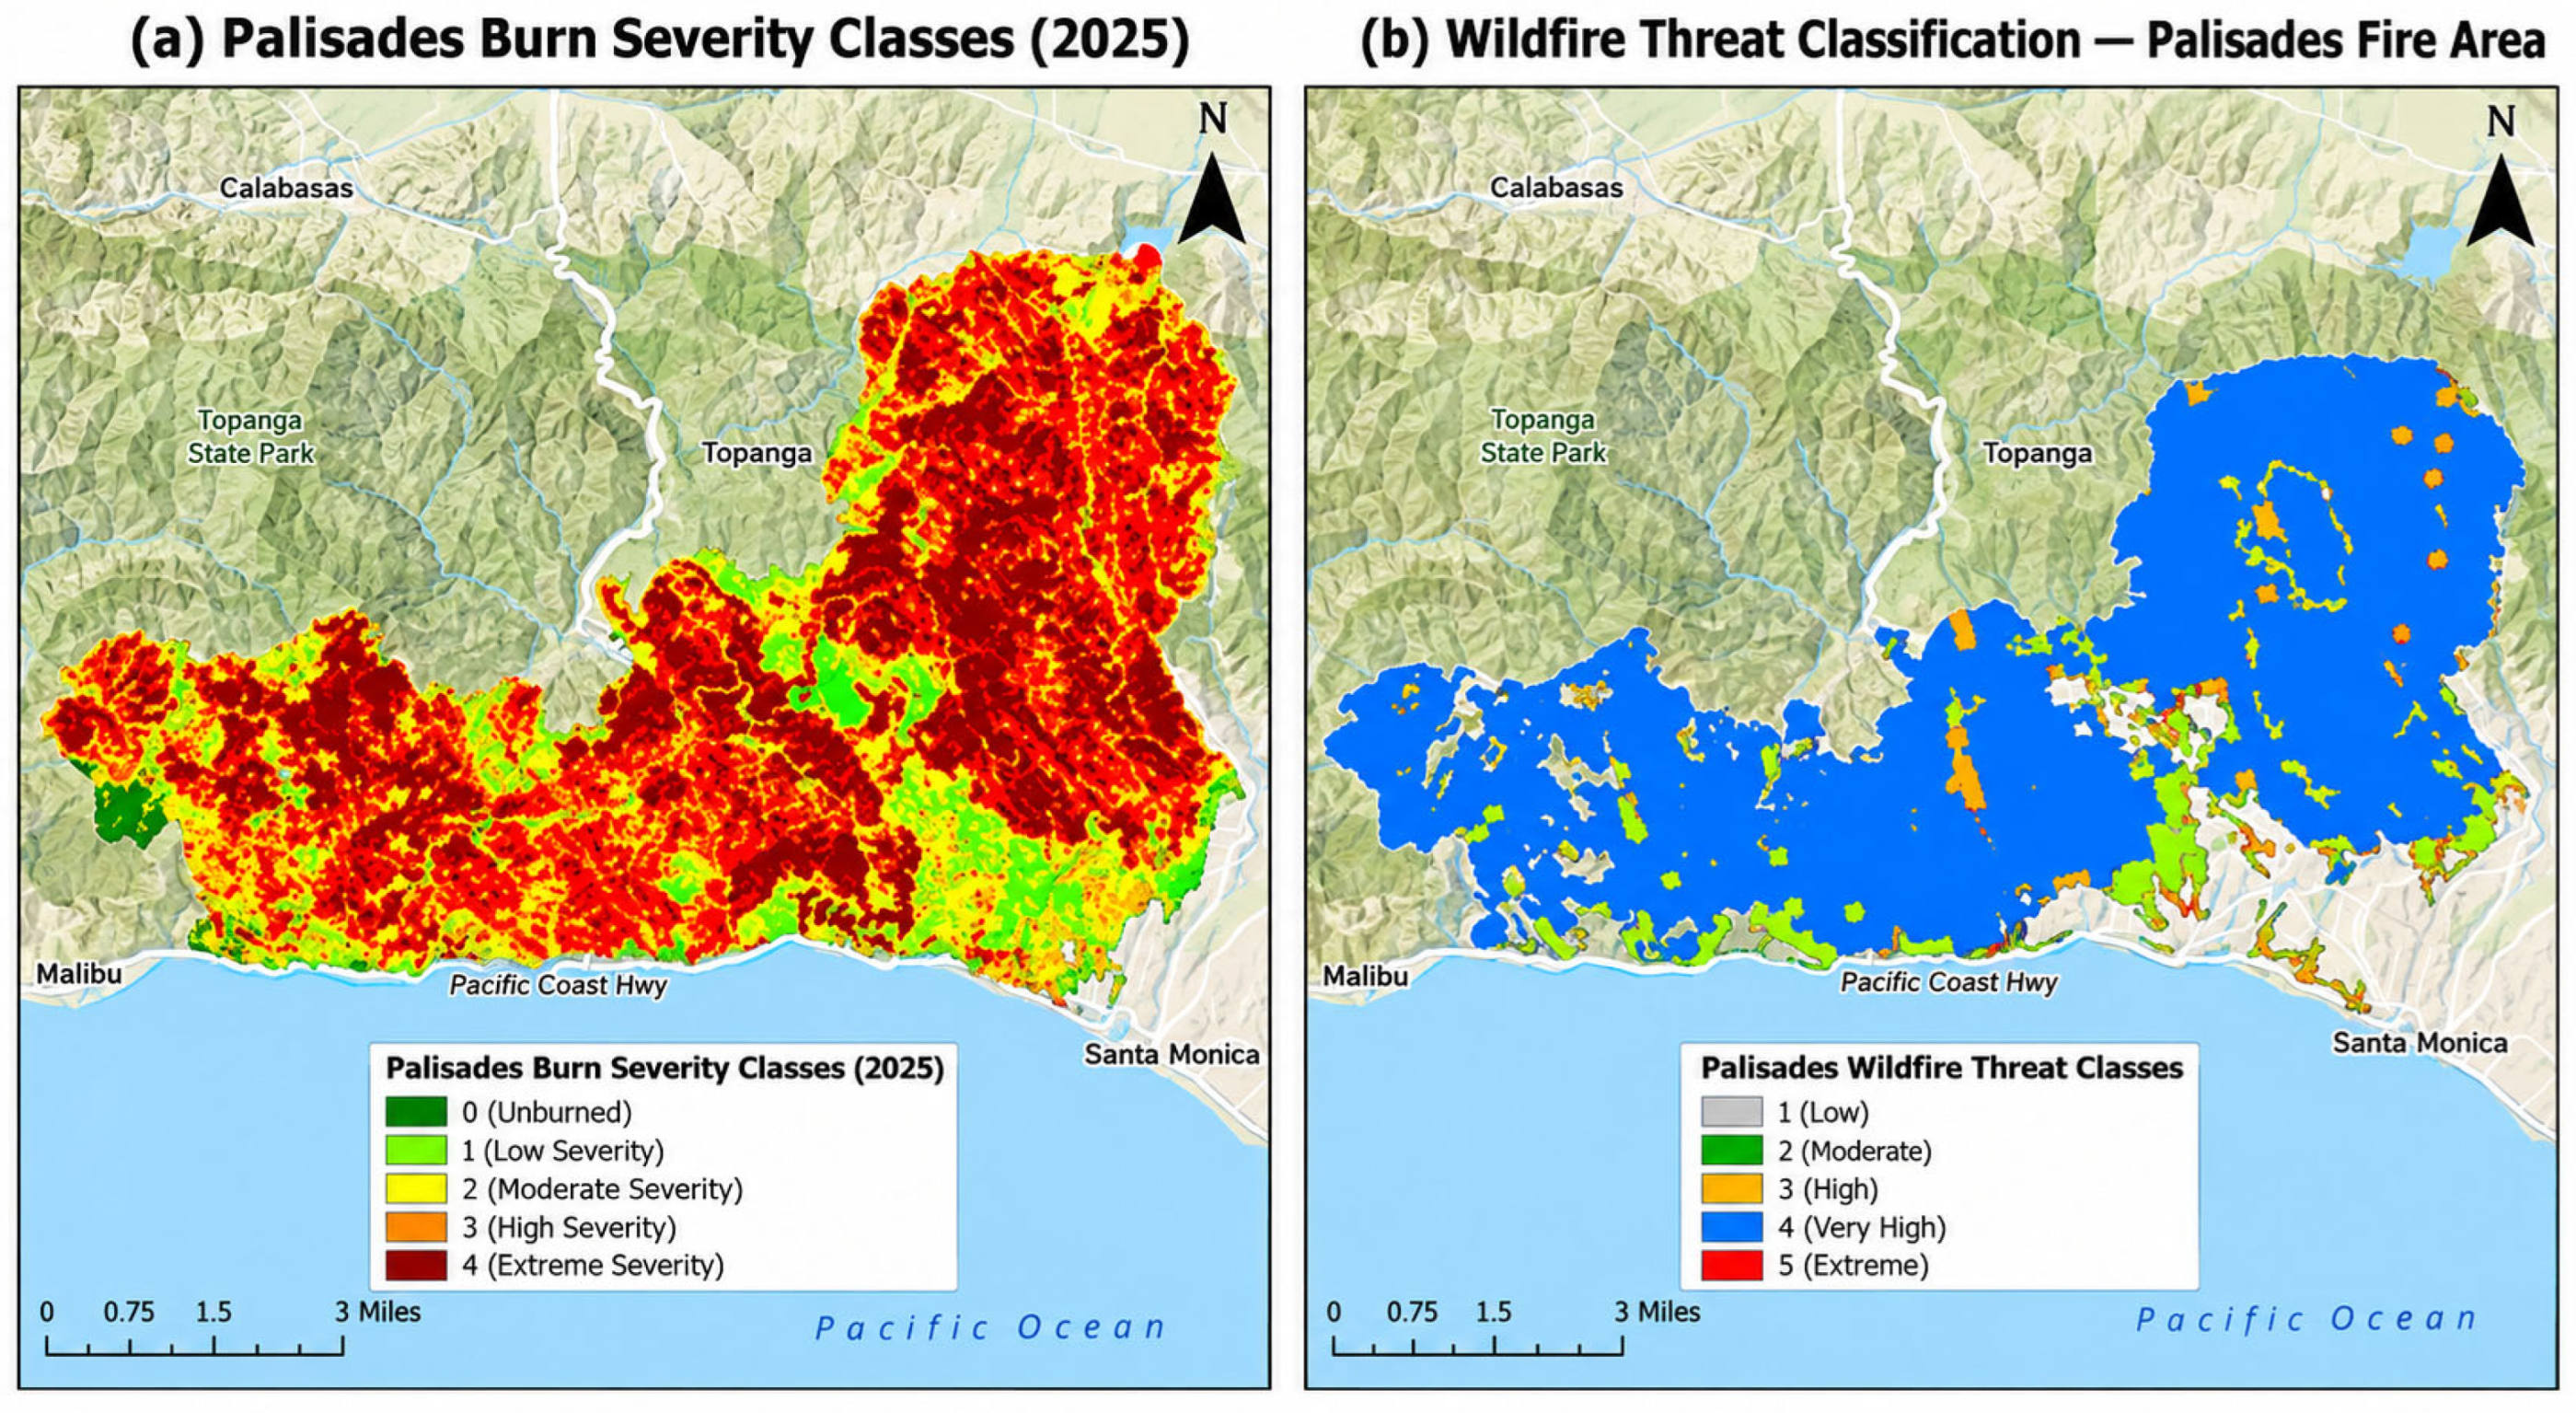
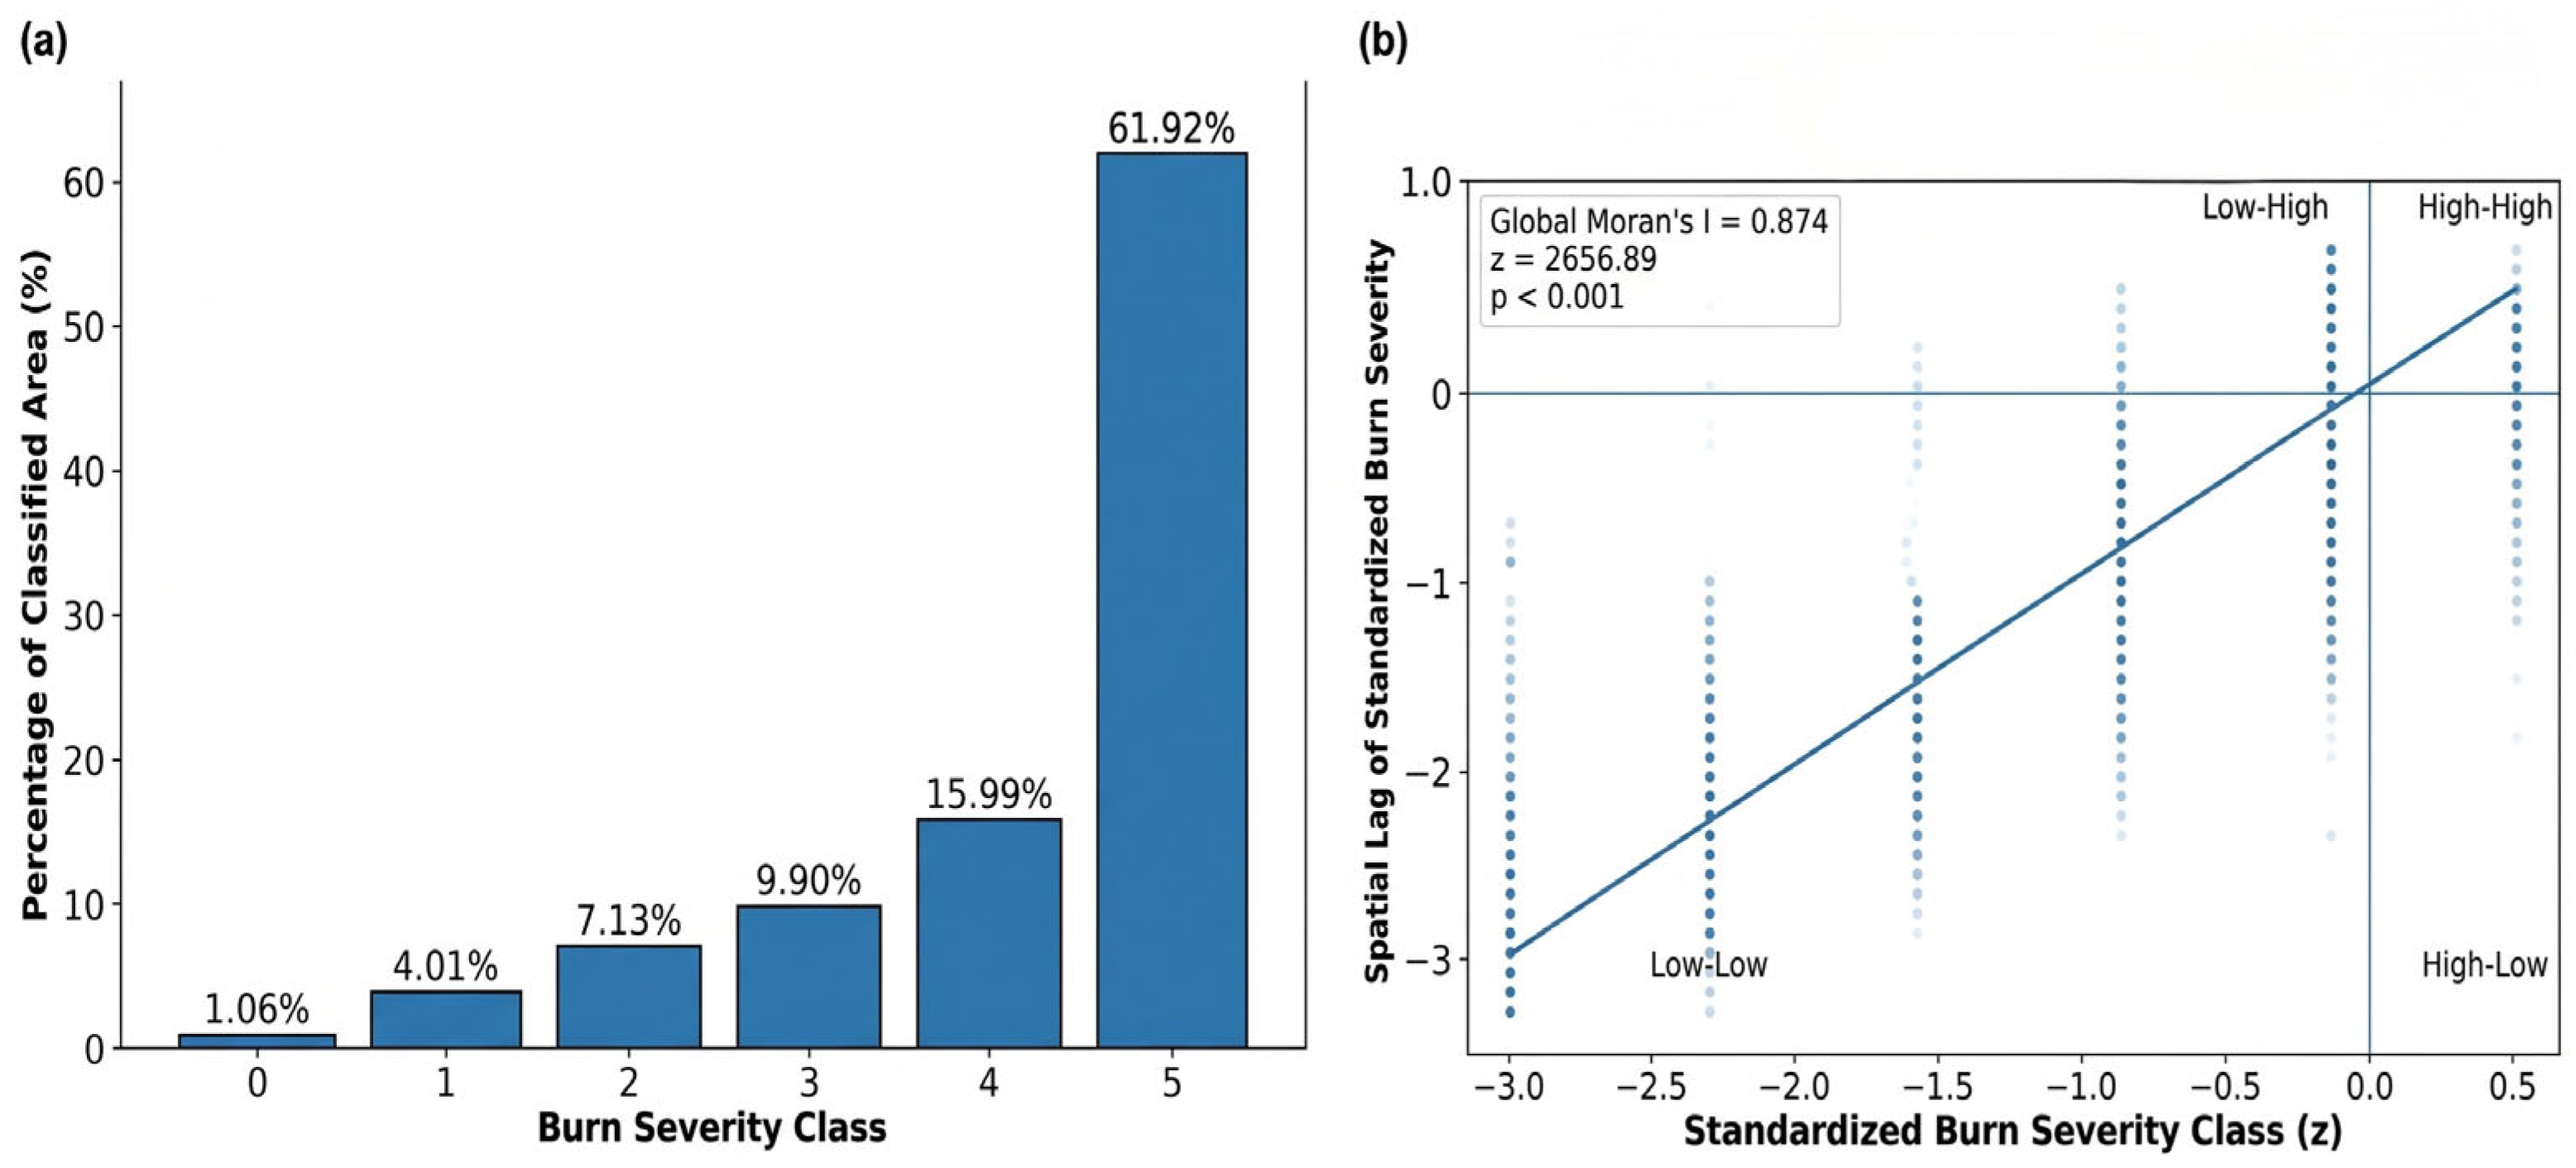
The classified dNBR map shows substantial spatial variation across the fire perimeter (Figure 2a). Class 5 accounted for 61.92% of the classified area, followed by class 4 (15.99%), class 3 (9.90%), class 2 (7.13%), class 1 (4.01%), and class 0 (1.06%) (Table 3). Higher classes were concentrated in portions of the interior and northern fire area, while lower classes occurred more frequently near portions of the perimeter.
The external comparison included 1969 spatially coincident dNBR and BAER observations. The six dNBR classes showed a moderately strong positive association with the four BAER Soil Burn Severity classes (Spearman’s ρ = 0.70), indicating that higher dNBR classes generally corresponded with higher BAER classes. Because the products measure related but distinct fire effects and the BAER product also incorporates remotely sensed information, this result is treated as an external field-informed cross-check rather than independent field validation.
Published event-specific observations from Li et al. [14] showed dry and windy conditions during the initial fire period, with average 10 m wind speeds of approximately 15–26 km h−1, relative humidity generally below 20%, and nearby-station wind gusts reaching approximately 110–144 km h−1. These observations are presented as meteorological context and were not independently analyzed as predictors of burn severity.
Prefire wildfire-threat classes within the Palisades Fire perimeter ranged from Low to Extreme (Figure 2b). The Very High class represented 86.79% of the classified threat area. The High and Moderate classes were less common and were concentrated mainly near inland valleys and portions of the southern coastal boundary. These values describe the published CAL FIRE threat classification and were not used as explanatory predictors of dNBR severity.
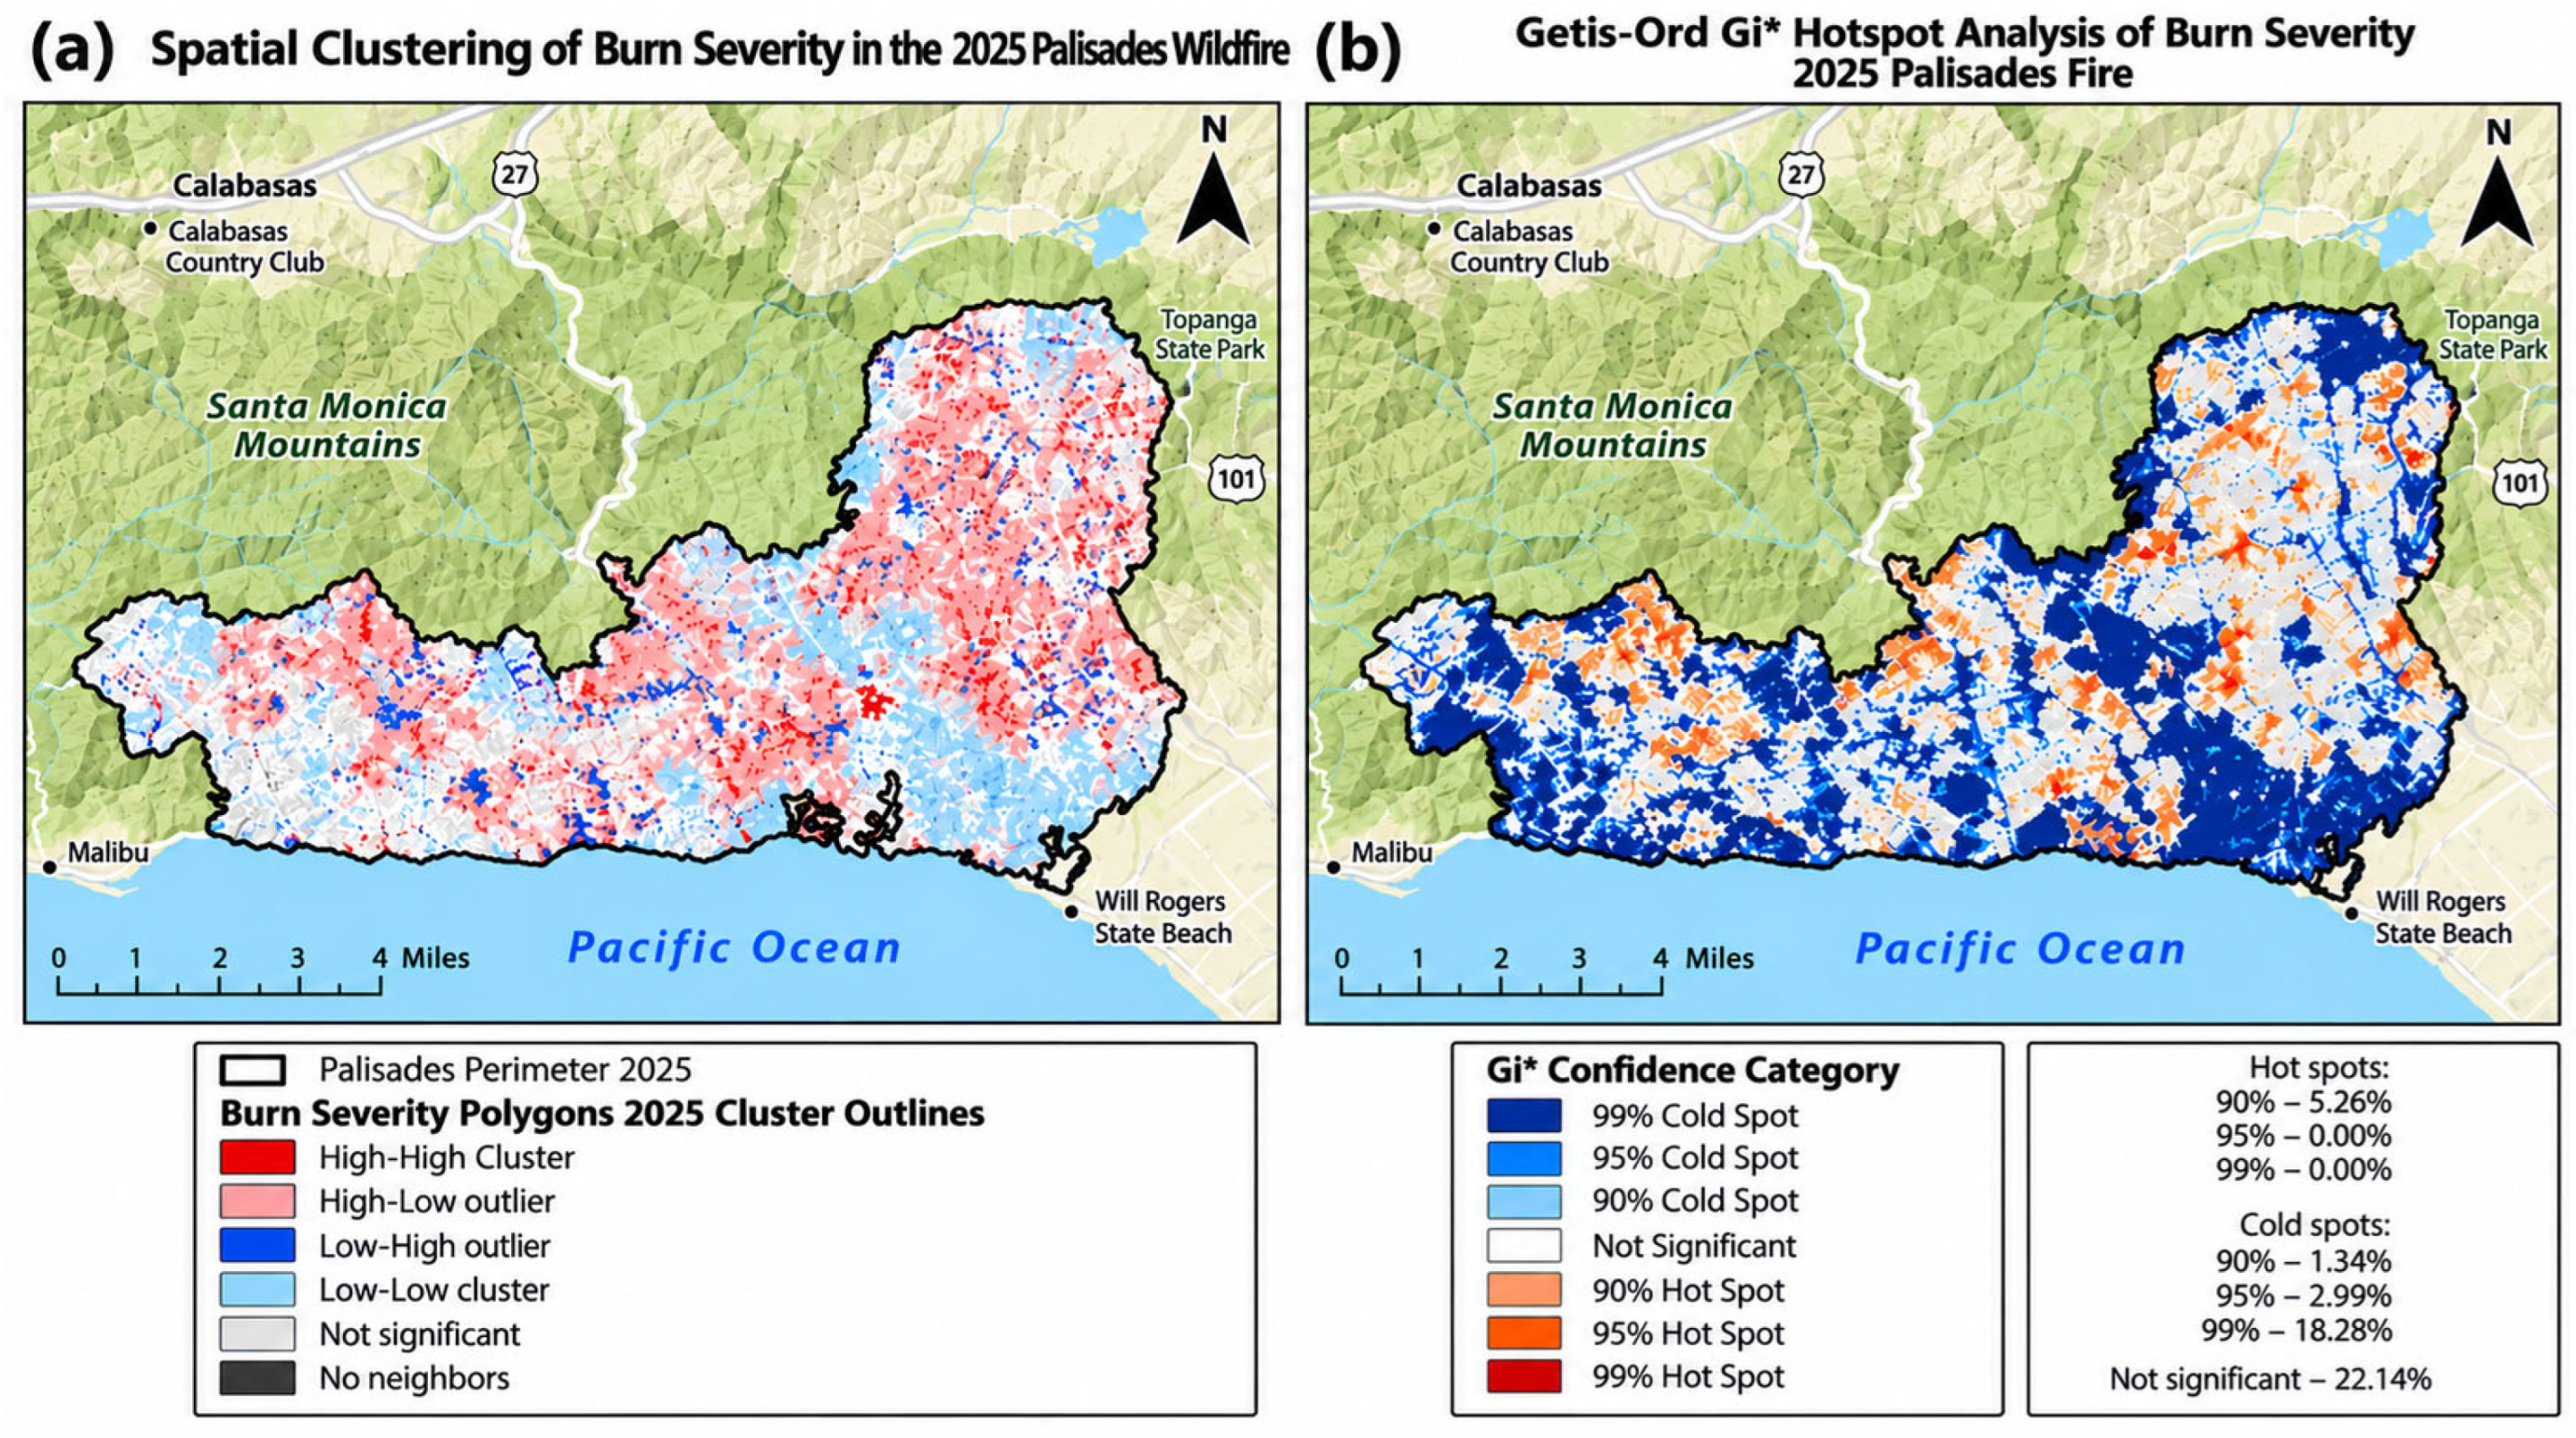
Local Moran’s I identified 389 High–High clusters (3.55%) and 333 Low–Low clusters (3.04%) among 10,958 analyzed polygons at p < 0.05 (Figure 3a). No High–Low or Low–High outliers were identified; 10,236 polygons (93.41%) were not statistically significant. Across the 722 significant polygons, z-scores ranged from −3.747 to 3.377 and p-values from 0.00018 to 0.02951. High–High clusters occurred mainly in portions of the fire interior, whereas Low–Low clusters were more dispersed toward the perimeter. Getis-Ord Gi* classified 55.26% of analyzed cells as hot spots at 90% confidence, with no cells classified as hot spots at 95% or 99% confidence (Figure 3b). Cold spots represented 1.34%, 2.99%, and 18.28% of cells at 90%, 95%, and 99% confidence, respectively; 22.14% were not significant. These categories correspond to p < 0.10, p < 0.05, and p < 0.01 and approximate absolute z-score thresholds of 1.65, 1.96, and 2.58.
The categorical distribution confirms that the highest dNBR class represented most of the classified fire area (Figure 4a). Global Moran’s I showed strong, statistically significant positive spatial autocorrelation (I = 0.874, z = 2656.89, p < 0.001), indicating that similar burn-severity classes tended to occur near one another rather than being spatially random (Figure 4b). The results of the sensitivity test at a 500 m distance threshold confirmed that significant positive spatial autocorrelation remained at the landscape scale (I = 0.442, z = 378.48, p < 0.001).
The Moran’s scatterplot provides a visual representation of the positive relationship between standardized burn-severity values and their spatially lagged neighbors. The inferential conclusion is based on Global Moran’s I and its associated z-score and p-value rather than on the scatterplot regression alone.

3.2. Prefire Land Cover and Vegetation Greenness

Dynamic World V1 indicated that trees covered 69.57% of the fire perimeter before the event, followed by built land (17.85%) and shrub and scrub (12.05%). Each remaining land-cover class represented less than 1% of the classified area.
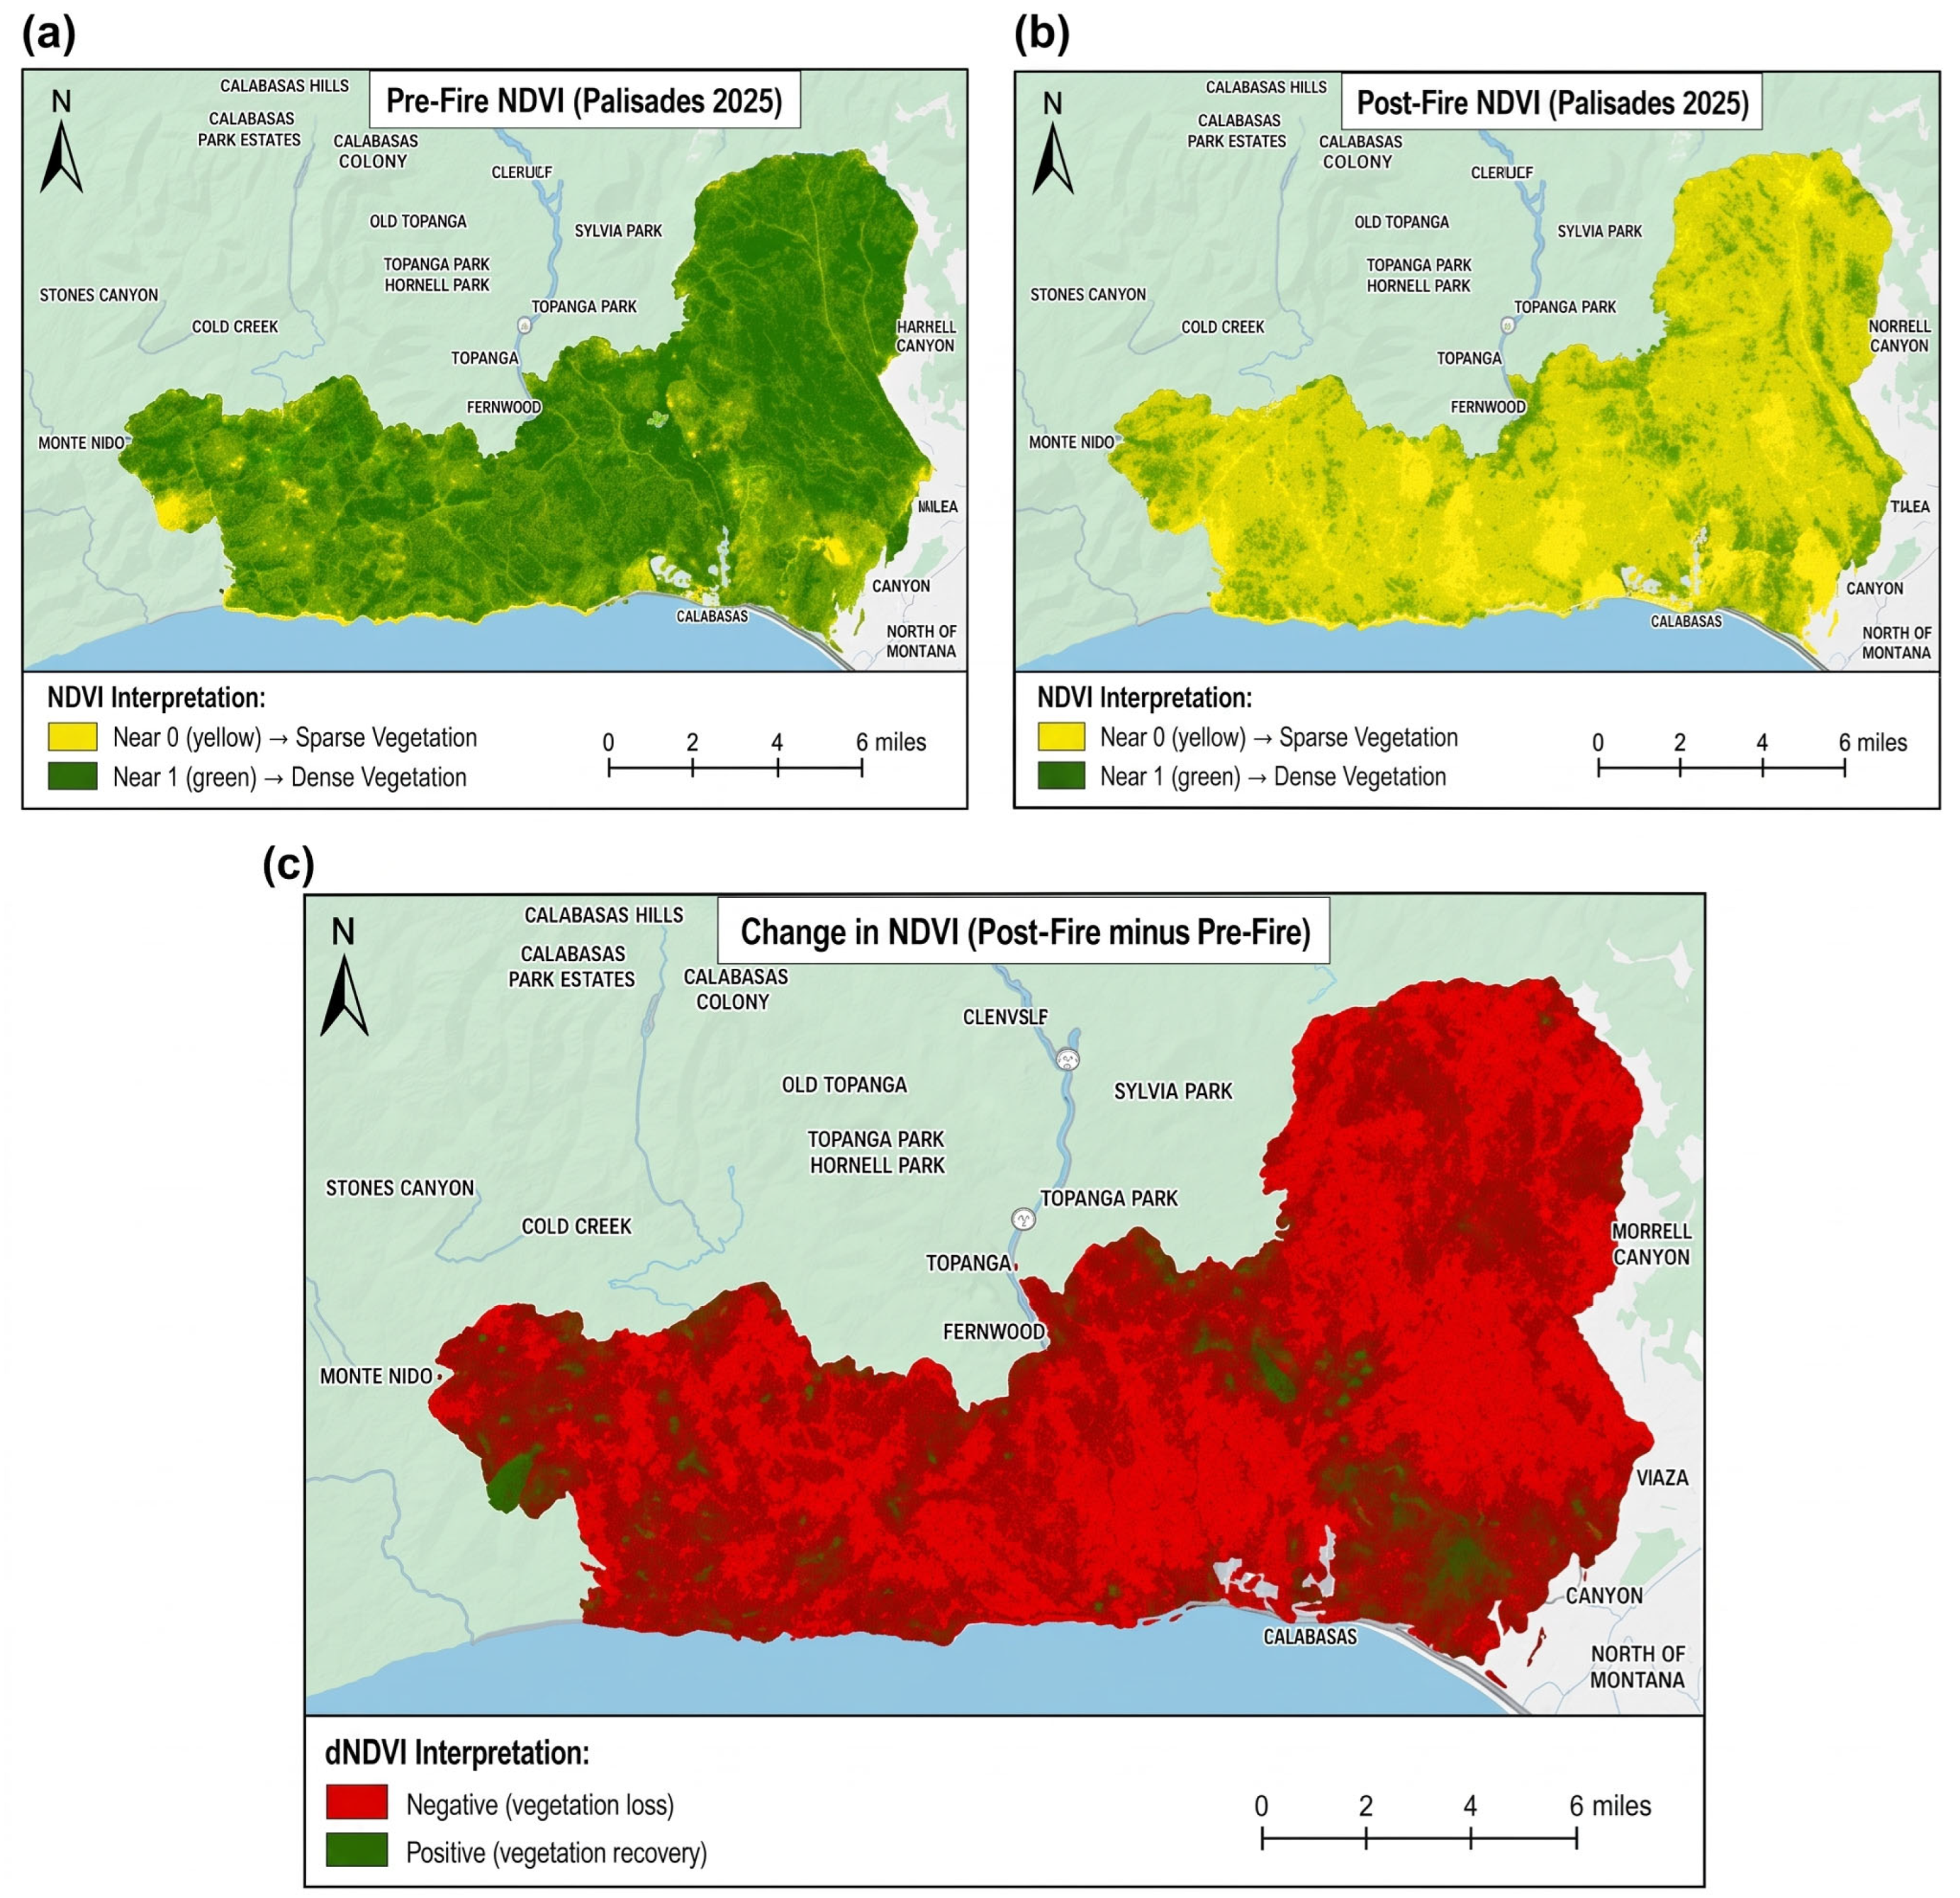
The prefire NDVI map depicts the spatial distribution of vegetation greenness during 1–5 January 2025 (Figure 5a). Higher values indicate greater green vegetation, whereas values near zero indicate sparse vegetation or nonvegetated surfaces. The map provides the baseline for comparison with the early postfire observation.
The postfire NDVI map for 1–5 March 2025 shows lower vegetation greenness across much of the fire perimeter relative to the prefire observation (Figure 5b). This comparison describes spectral greenness at the two observation periods and does not independently quantify ecological condition or recovery.
The dNDVI map shows widespread negative values across the fire perimeter, indicating reduced vegetation greenness between the prefire and early postfire periods (Figure 5c). Positive values indicate locations where greenness was higher in the March composite than in the January composite. Because only one early postfire period was analyzed and the dates differ seasonally, positive values are not interpreted as postfire regrowth or a recovery rate.
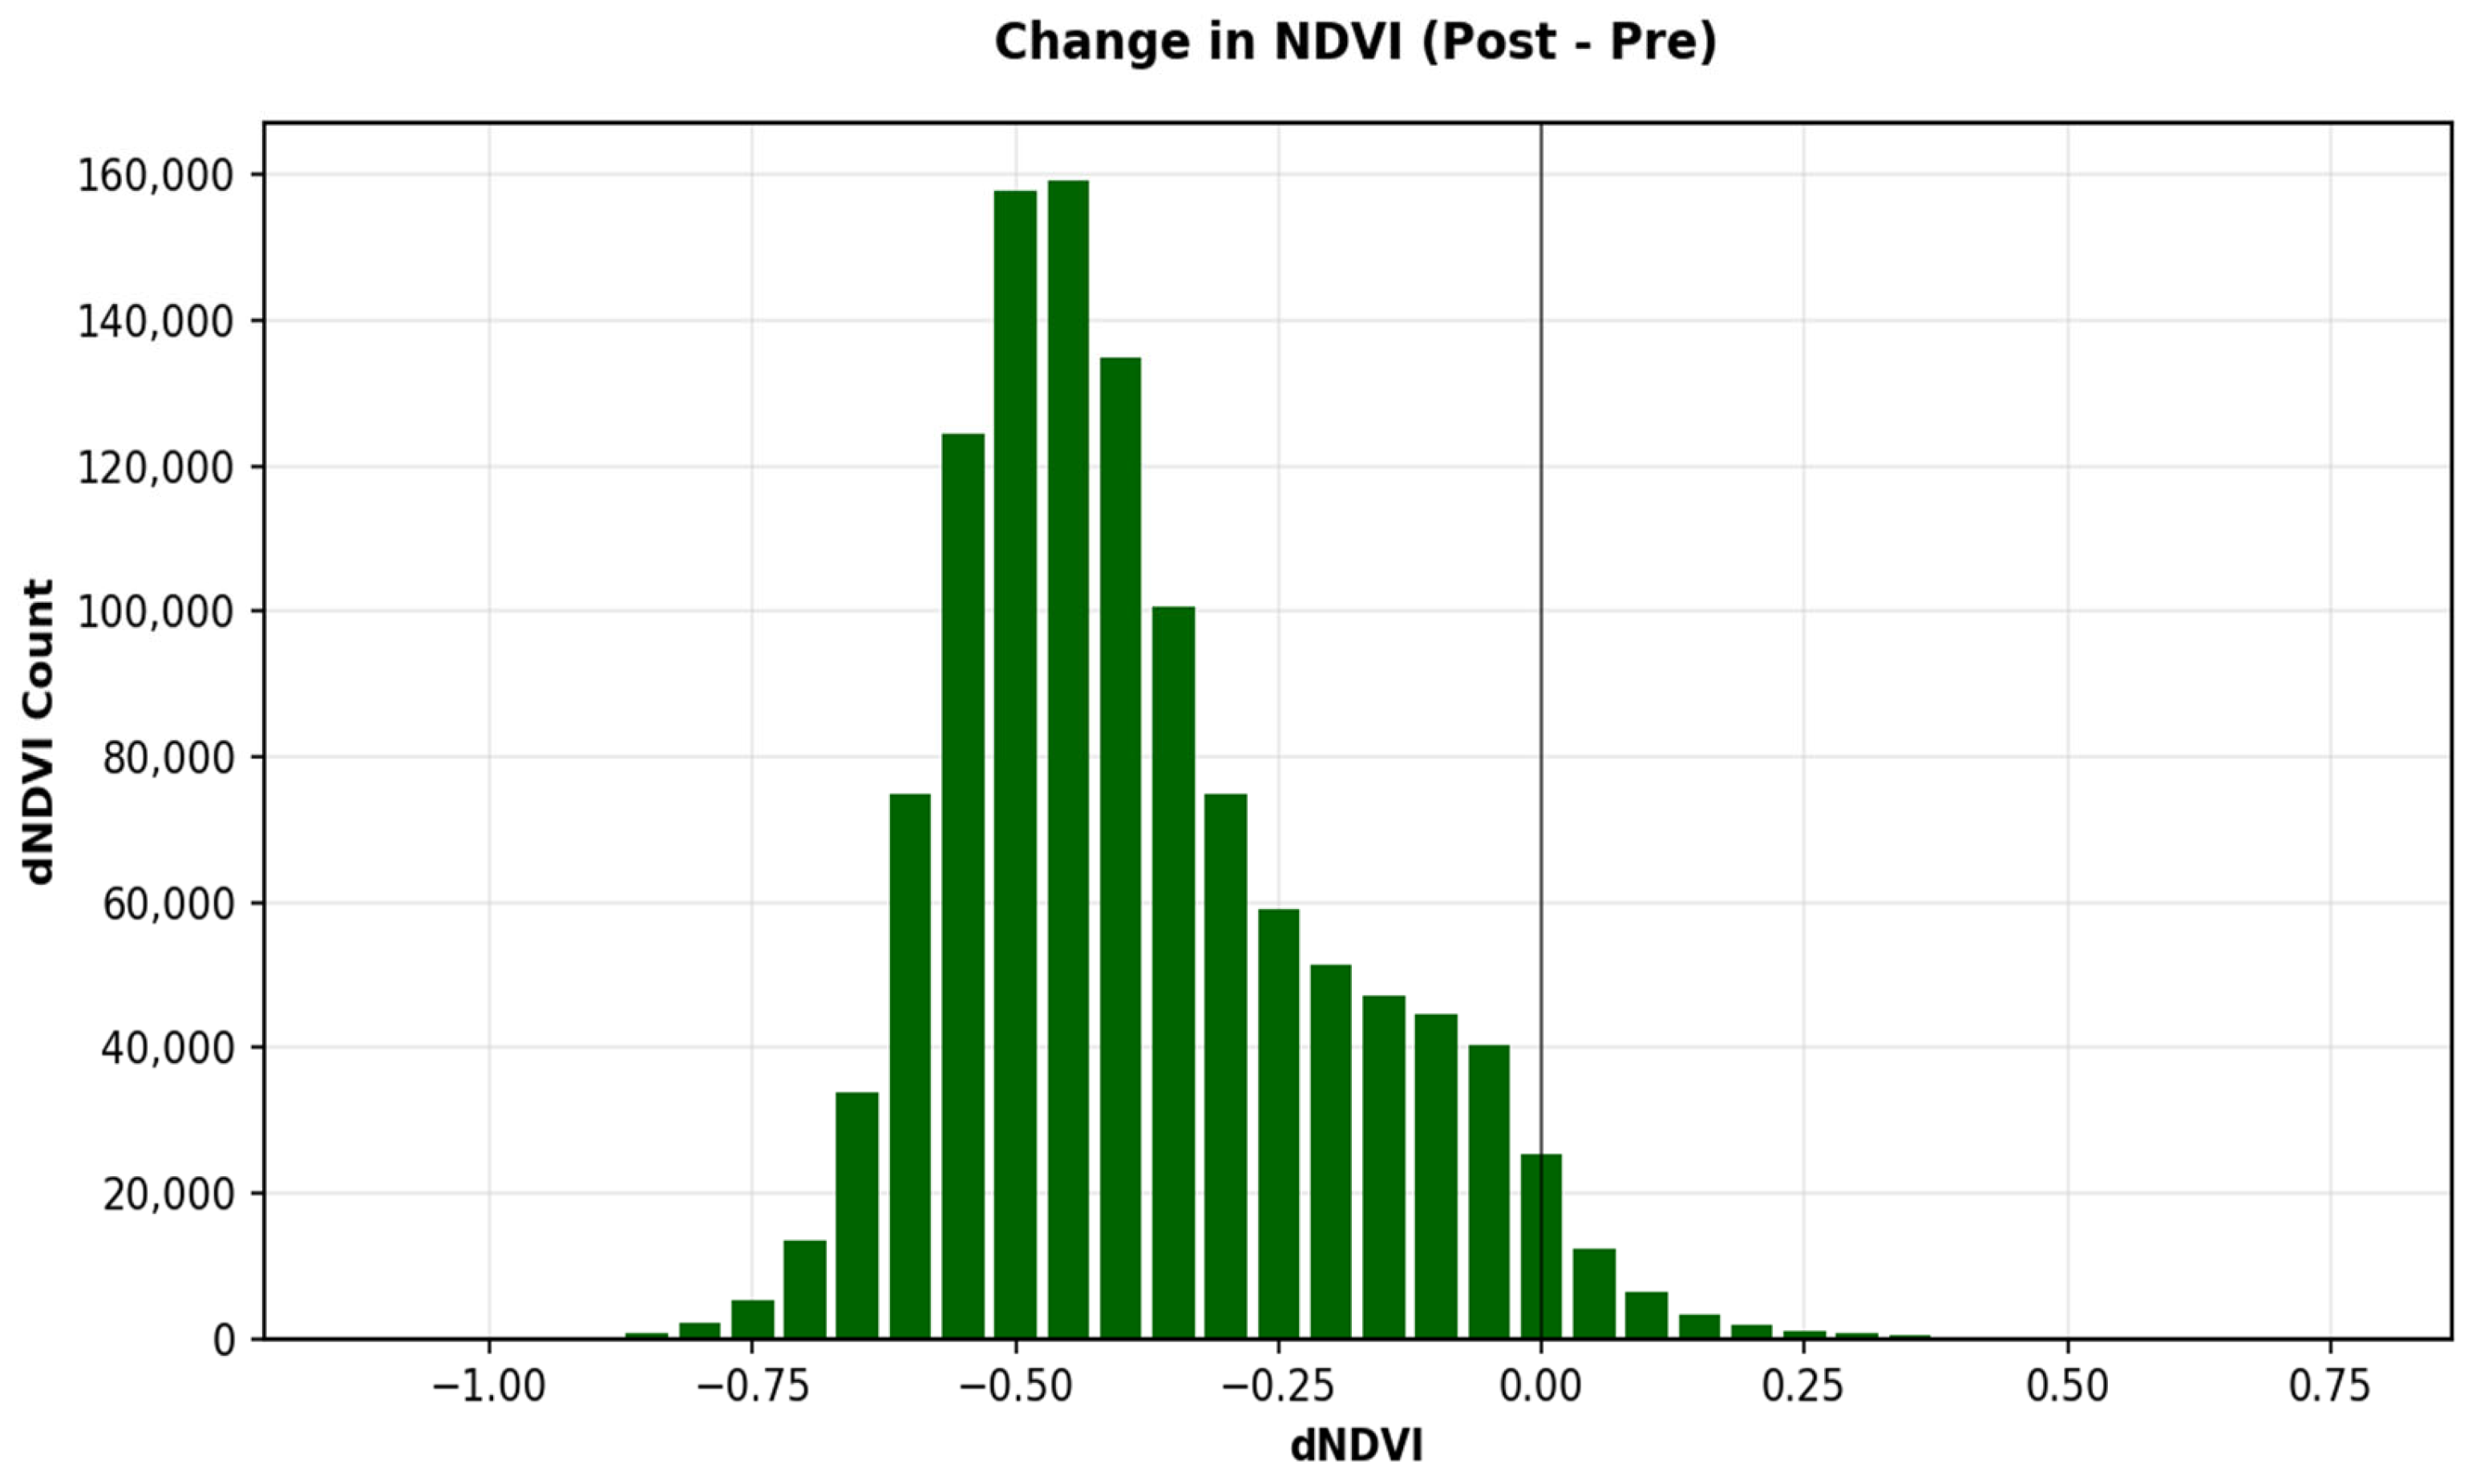
The dNDVI distribution is concentrated at negative values, particularly between approximately −0.6 and −0.2 (Figure 6), which is consistent with widespread reductions in vegetation greenness. A smaller proportion of pixels had positive values. These results characterize change between the two image periods and do not separate fire effects from phenological or other temporal influences.

3.3. Historical Fire Patterns

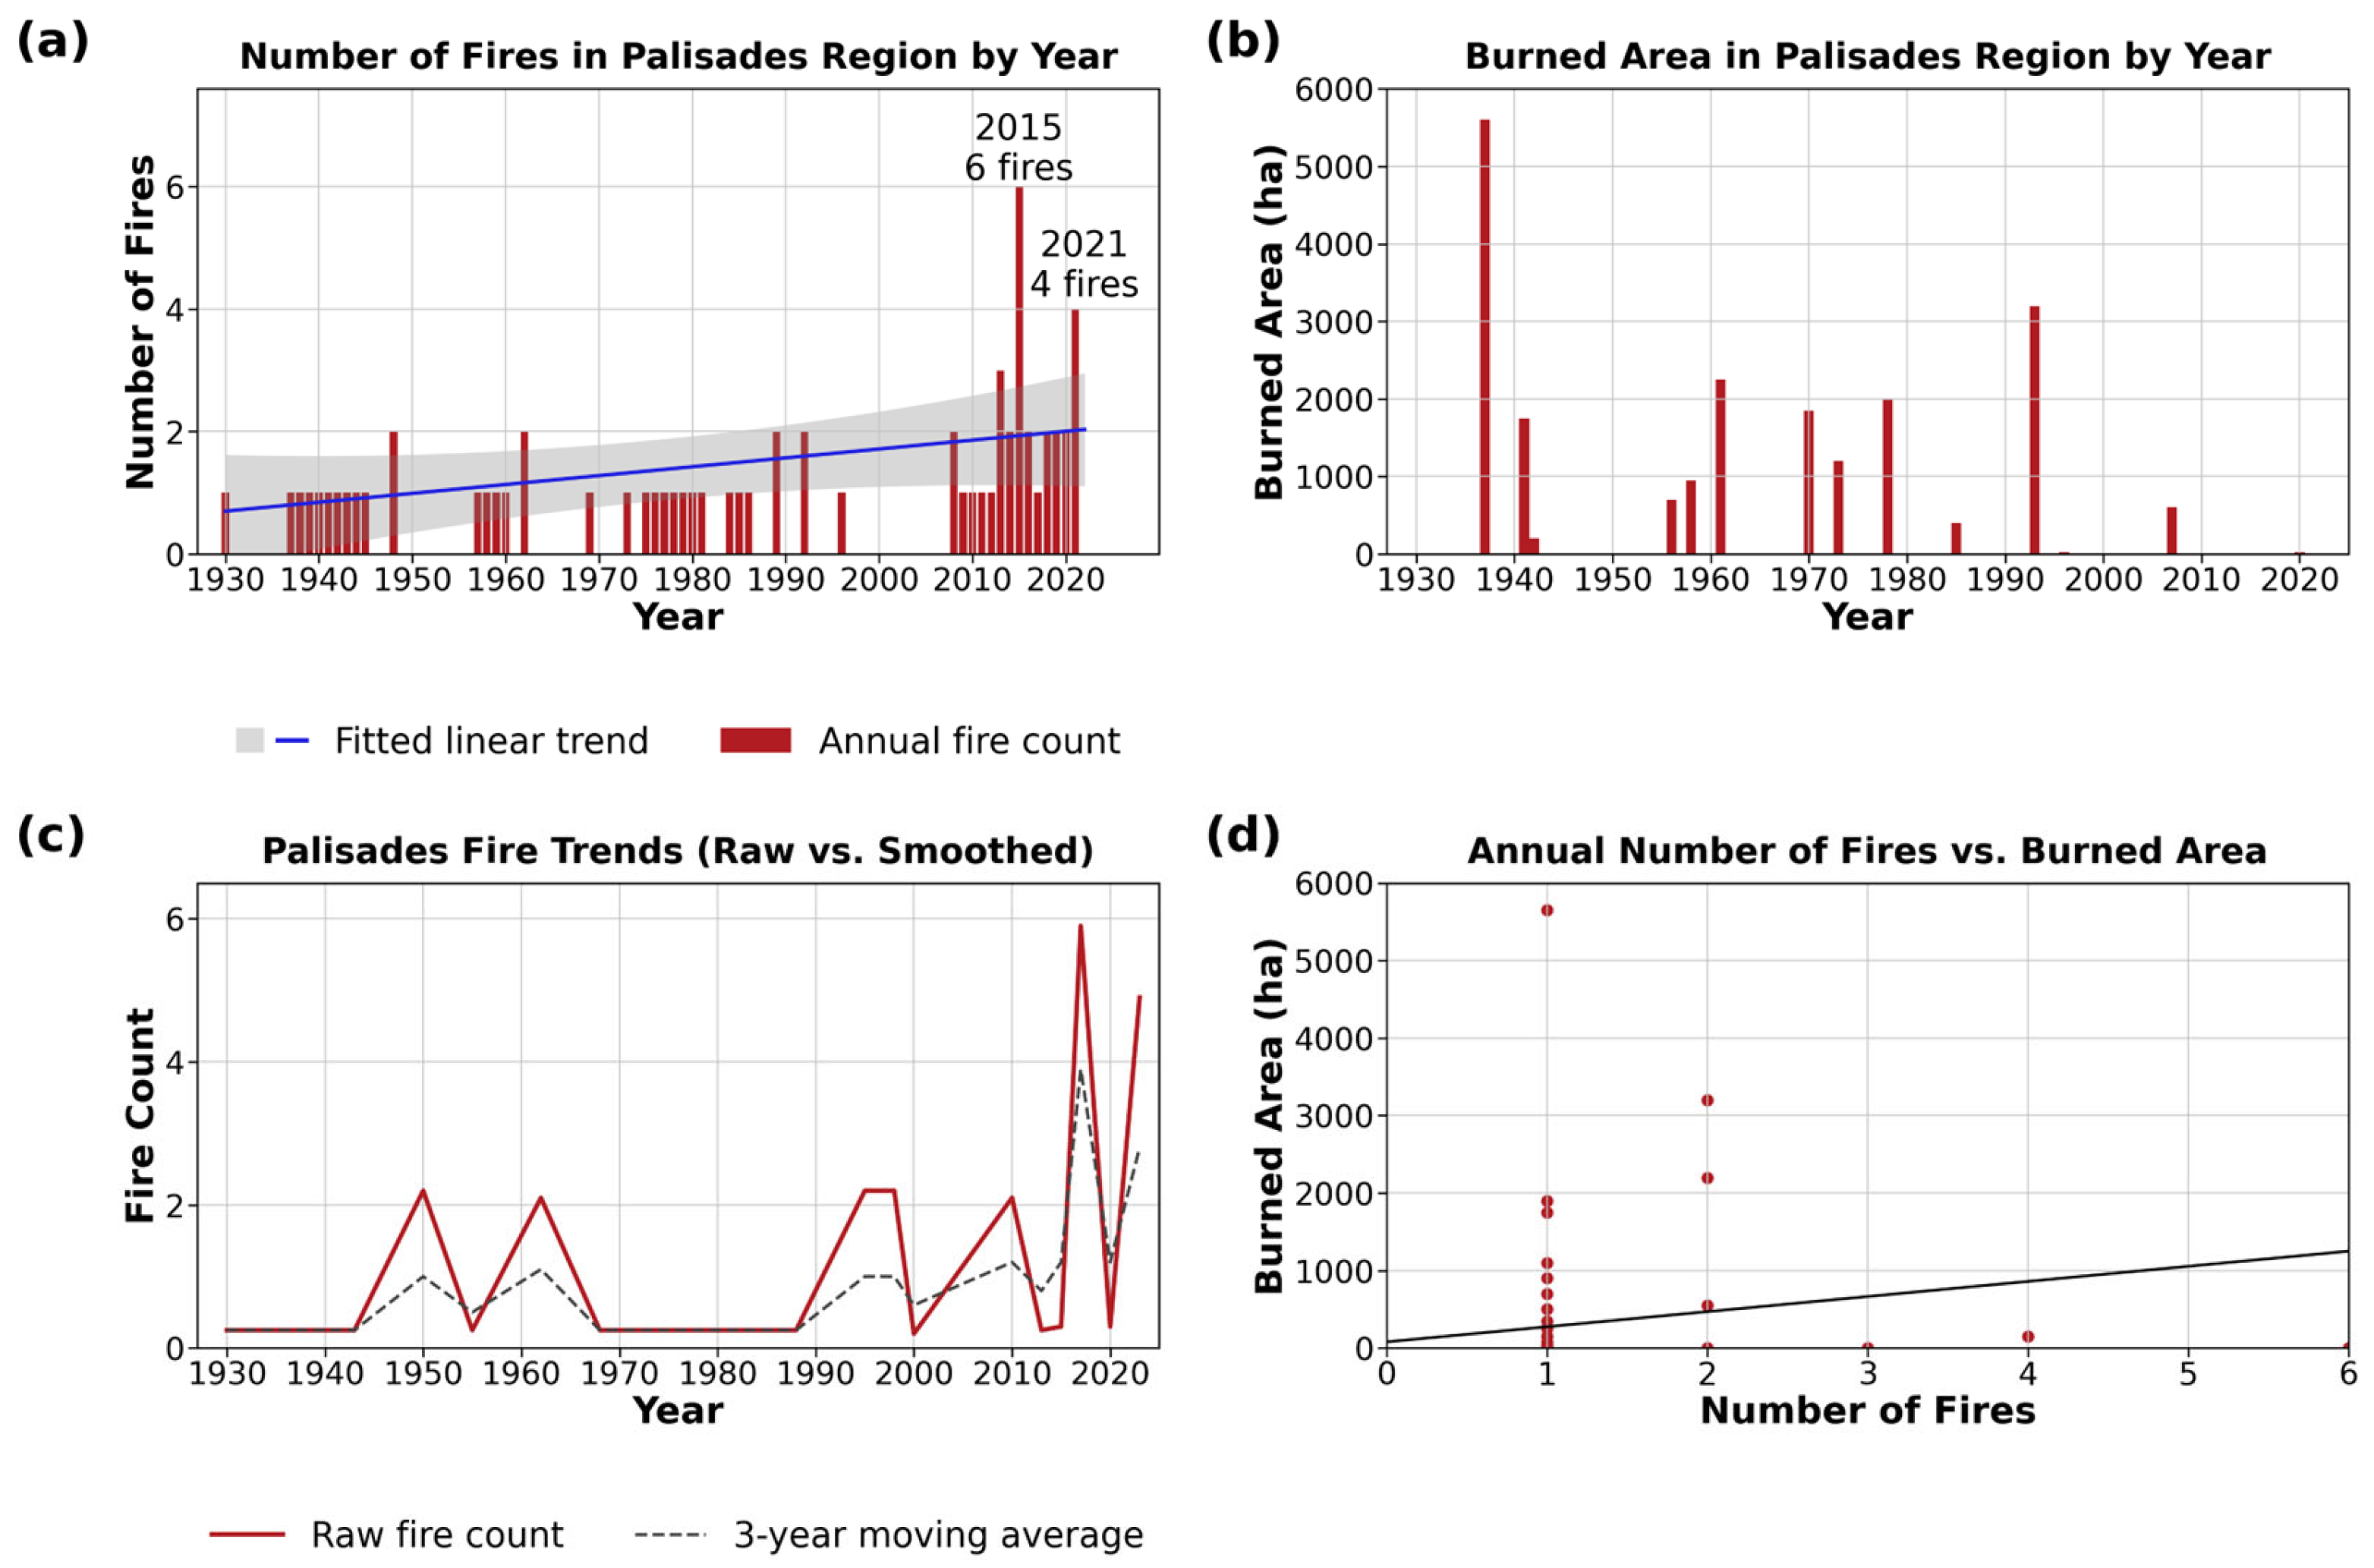
Annual fire frequency was relatively low and irregular during much of the early and mid-twentieth century, while higher annual counts occurred more often in recent decades (Figure 7a). The fitted linear trend indicates an overall upward tendency from 1928 to 2021. The highest annual count was six fires in 2015. The analysis does not identify the causes of this temporal pattern.
Annual burned area within the 2025 Palisades Fire perimeter varied substantially from 1928 to 2021 (Figure 7b). Most years had little or no recorded burned area, while the largest annual extent occurred in 1938 (5650.17 ha), followed by 1993 (3174.34 ha), 1961 (2207.82 ha), 1978 (1965.03 ha), and 1970 (1866.03 ha). The relationship between annual fire count and annual burned area was also examined directly (Figure 7d). The record shows higher fire counts in recent decades but highly variable burned area; it does not measure historical burn severity or establish a causal explanation.
The raw annual fire-count series and three-year moving average show low and irregular occurrence during much of the twentieth century and greater frequency and variability in recent decades, particularly during the 2010s (Figure 7c). The moving average is presented as a descriptive smoother rather than an inferential test.

3.4. Demographic Characteristics

Area-weighted summaries characterize the demographic profile of census tracts that met the 10% overlap criterion within the 2025 Palisades Fire perimeter.
Table 4 reports the selected demographic indicators. Mean area-weighted values were 26.6% for residents aged 65 years or older, 19.0% for residents below 200% of the federal poverty line, 31.0% for renter-occupied housing units, 6.2% for residents reporting a disability, 1.9% for households with limited English proficiency, and 3.7% for households without a vehicle. Because no county- or state-level comparator was used, the percentages are not described as elevated or reduced. They provide demographic context relevant to wildfire planning but do not constitute a composite social vulnerability assessment.

4. Discussion

The dNBR analysis identified a predominance of the highest severity class and strong spatial clustering within the 2025 Palisades Fire perimeter. While Global Moran’s I indicated strong positive spatial autocorrelation at the near-pixel scale, the local polygon-based statistics were able to detect larger, continuous areas of high and low severity. The positive association with final BAER Soil Burn Severity supports broad ordinal correspondence between the two maps. Nevertheless, dNBR represents spectral change, whereas the BAER product represents soil burn severity informed by BARC data and field assessment. The comparison is therefore an external field-informed cross-check, not direct field validation of the six dNBR classes. The prefire land-cover and NDVI results provide environmental context, but vegetation composition, terrain, and weather were not tested as predictors of spatial severity.
The documented rapid expansion, spotting, wind, and spread rates provide physical context for the event [11,12,13,14]. These observations may be consistent with a dynamic fire environment, but fire-behavior and meteorological variables were not modeled against the dNBR pattern. The spatial differences in severity therefore cannot be attributed directly to wind, humidity, fuel moisture, topography, or vegetation structure in this study.
The historical record shows that higher annual fire counts occurred more often in recent decades, while burned area remained highly variable. This pattern can be considered alongside broader evidence of changing wildfire activity in California [2,3], but the present analysis does not estimate historical severity or test climate, land use, or management as causal drivers. Similarly, the January timing occurred under documented dry and windy conditions [14], while hydroclimatic variability remains contextual rather than a tested mechanism [10].
The demographic analysis identifies selected population and housing characteristics within intersecting census tracts. These variables have been associated with differences in wildfire preparedness, evacuation, and recovery in previous studies [25,26,27,28,29,30,31,32,33,34], but this study did not measure individual exposure, adaptive capacity, or postfire outcomes.
The area-weighted means indicate the presence of older adults, residents with disabilities, households with limited English proficiency or no vehicle, lower-income residents, and renters within the study area. These values can help frame questions for emergency communication and planning. However, area weighting does not locate residents within tracts, and the absence of a comparison population precludes claims that the study area is more or less vulnerable than Los Angeles County or California.
The combined analysis is most useful as a descriptive WUI case study. The physical results identify where spectral fire effects clustered, and the demographic results identify characteristics that planners may consider when developing accessible alerts, evacuation assistance, and recovery programs. Similar challenges arise in WUI regions worldwide as settlement expands near fire-prone vegetation [7,8]. Generalization beyond the Palisades requires comparative studies that directly link hazard, exposure, vulnerability, and observed outcomes.
Future research should incorporate field-based severity measurements, multitemporal recovery monitoring, finer-scale population and building data, explicit vulnerability indices with justified weighting, and outcome measures such as displacement, rebuilding, health effects, and access to assistance. Multivariable spatial models could then test how weather, topography, fuels, built environment, and social conditions relate to observed fire effects and recovery.

5. Conclusions

This study characterized historical wildfire frequency and burned area in the Palisades region and spatial burn-severity patterns within the 2025 fire perimeter. Annual fire frequency showed an overall upward tendency from 1928 to 2021, whereas annual burned area was highly variable. For the 2025 event, class 5 represented 61.92% of the classified dNBR area, and Global Moran’s I indicated strong positive spatial autocorrelation. NDVI and dNDVI showed widespread short-term reductions in vegetation greenness, and the BAER comparison supported broad ordinal correspondence with the dNBR classification. The demographic component provides an area-weighted description of intersecting census tracts, not a social vulnerability index or population-weighted exposure estimate.
Several limitations constrain interpretation. First, study-specific Composite Burn Index observations were unavailable. The BAER comparison provides an external field-informed cross-check but does not replace independent field validation, and threshold-based dNBR classes may not capture all ecological effects. Optical indices may underrepresent understory burning beneath intact canopy, and the March imagery cannot capture delayed mortality [47].
Second, results depend on the adopted fire perimeter and do not address nearby areas or secondary fires. The demographic analysis uses tract values weighted by geographic overlap. It does not locate residents within tracts, estimate population exposure, test alternative overlap thresholds, or compare the study area with a reference population.
Third, dNDVI compares January and March composites. Phenology, precipitation, sensor conditions, and other temporal factors may contribute to the observed change, so dNDVI is interpreted as short-term greenness change rather than recovery. Recovery can depend on climate, soils, topography, aspect, and prefire conditions [48,49,50].
Finally, weather, fuel moisture, topography, detailed vegetation composition, and fuel structure were not modeled as explanatory variables. The observed spatial pattern therefore cannot be assigned to these factors.
Future studies should combine field surveys with higher-resolution and multitemporal remote sensing, test explicit environmental drivers of burn severity, and evaluate longer-term vegetation trajectories. Finer-scale demographic and exposure data, sensitivity analyses for boundary and weighting choices, and comparison with other Southern California winter fires would improve generalizability and support more direct evaluation of social vulnerability and recovery.
Overall, the results provide a reproducible description of the 2025 Palisades Fire’s spatial burn-severity pattern and its historical and demographic context. They support targeted follow-up investigation while remaining within the limits of the available remotely sensed, historical, and census-tract data.

Author Contributions

Conceptualization, R.T.; Methodology, R.T. and K.H.E.; Software, R.T.; Formal Analysis, R.T.; Investigation, R.T.; Data Curation, R.T. and K.H.E.; Visualization, R.T.; Writing, Original Draft Preparation, R.T.; Writing, Review and Editing R.T., K.H.E. and G.C.; Supervision, G.C. All authors have read and agreed to the published version of the manuscript.

Funding

This research received no external funding.

Data Availability Statement

The original contributions presented in this study are included in the article. Further inquiries can be directed to the corresponding author.

Acknowledgments

AI-powered tools (ChatGPT-4o and Grammarly Free Version) were used only for proofreading and editing the manuscript for grammatical and stylistic clarity. The entire scientific content was developed independently by the authors without assistance from artificial intelligence, including the underlying ideas, data collection methods, analysis, and the writing of the manuscript.

Conflicts of Interest

The authors declare no conflicts of interest.

References

  1. Keeley, J.E.; Zedler, P.H. Large, High-Intensity Fire Events in Southern California Shrublands: Debunking the Fine-Grain Age Patch Model. Ecol. Appl. 2009, 19, 69–94. [Google Scholar] [CrossRef] [Scilit]
  2. Buonanduci, M.S.; Donato, D.C.; Halofsky, J.S.; Kennedy, M.C.; Harvey, B.J. Consistent Spatial Scaling of High-Severity Wildfire Can Inform Expected Future Patterns of Burn Severity. Ecol. Lett. 2023, 26, 1687–1699. [Google Scholar] [CrossRef] [Scilit]
  3. Xu, Q.; Westerling, A.L.; Baldwin, W.J. Spatial and Temporal Patterns of Wildfire Burn Severity and Biomass Burning-Induced Emissions in California. Environ. Res. Lett. 2022, 17, 115001. [Google Scholar] [CrossRef] [Scilit]
  4. Qiu, M.; Chen, D.; Kelp, M.; Li, J.; Huang, G.; Yazdi, M.D. The Rising Threats of Wildland-Urban Interface Fires in the Era of Climate Change: The Los Angeles 2025 Fires. Innovation 2025, 6, 100835. [Google Scholar] [CrossRef] [Scilit]
  5. Cooper, D.S.; Katz, N.D.; Demirci, B.; Osborn, F.M. Lessons from the Santa Monica Mountains: Continuing the Cycle of Conservation. Front. Sustain. Cities 2022, 4, 923946. [Google Scholar] [CrossRef] [Scilit]
  6. Roberts, D.A.; Gardner, M.E.; Regelbrugge, J.C.; Pedreros, D.H.; Ustin, S.L. Mapping the Distribution of Wildfire Fuels Using AVIRIS in the Santa Monica Mountains. 1998. Available online: https://ntrs.nasa.gov/citations/20000064568 (accessed on 17 July 2026).
  7. Schug, F.; Bar-Massada, A.; Carlson, A.R.; Cox, H.; Hawbaker, T.J.; Helmers, D.; Hostert, P.; Kaim, D.; Kasraee, N.K.; Martinuzzi, S.; et al. The Global Wildland–Urban Interface. Nature 2023, 621, 94–99. [Google Scholar] [CrossRef] [Scilit]
  8. Chen, B.; Wu, S.; Jin, Y.; Song, Y.; Wu, C.; Venevsky, S.; Xu, B.; Webster, C.; Gong, P. Wildfire Risk for Global Wildland–Urban Interface Areas. Nat. Sustain. 2024, 7, 474–484. [Google Scholar] [CrossRef] [Scilit]
  9. NOAA. NOAA Satellites Monitor Raging Wildfires in California; National Environmental Satellite, Data, and Information Service (NESDIS); U.S. Department of Commerce: Washington, DC, USA, 2025. Available online: https://www.nesdis.noaa.gov/news/noaa-satellites-monitor-raging-wildfires-california (accessed on 17 July 2026).
  10. Swain, D.L.; Abatzoglou, J.T.; Albano, C.M.; Brunner, M.I.; Diffenbaugh, N.S.; Kolden, C.; Prein, A.F.; Singh, D.; Skinner, C.B.; Swetnam, T.W.; et al. Increasing Hydroclimatic Whiplash Can Amplify Wildfire Risk in a Warming Climate. Glob. Change Biol. 2025, 31, e70075. [Google Scholar] [CrossRef] [Scilit]
  11. Sharp, J. Palisades Fire in California Forces Drivers to Abandon Cars as They Flee Santa Ana Winds-Fueled Blaze. CBS Los Angeles, 7 January 2025. Available online: https://www.cbsnews.com/losangeles/news/residents-evacuate-and-flee-as-palisades-fire-grows/ (accessed on 17 July 2026).
  12. Los Angeles Fire Department. Palisades Fire Emergency Updates; City of Los Angeles: Los Angeles, CA, USA, 2025; Available online: https://lafd.org/news/palisades-fire-0 (accessed on 17 July 2026).
  13. California Department of Forestry and Fire Protection (CAL FIRE). Palisades Fire Incident Information; CAL FIRE: Sacramento, CA, USA, 2025. Available online: https://www.fire.ca.gov/incidents/2025/1/7/palisades-fire (accessed on 17 July 2026).
  14. Li, F.; Zhang, X.; Cochrane, M.; Kondragunta, S.; An, S. Fire Spread, Intensity, and Emissions Observations by Multiple Satellites: The Southern California Wildfires of January 2025. AGU Adv. 2026, 7, e2025AV002064. [Google Scholar] [CrossRef] [Scilit]
  15. Westerling, A.L.; Cayan, D.R.; Brown, T.J.; Hall, B.L.; Riddle, L.G. Climate, Santa Ana Winds and Autumn Wildfires in Southern California. Eos Trans. AGU 2004, 85, 289–296. [Google Scholar] [CrossRef] [Scilit]
  16. Barnes, C.; Keeping, T.; Madakumbura, G.; Abatzoglou, J.; Williams, P.; AghaKhouchak, A.; Pinto, I.; Thompson, V.; Vautard, R.; Lampe, S.; et al. Climate Change Increased the Likelihood of Wildfire Disaster in Highly Exposed Los Angeles Area; World Weather Attribution: London, UK, 2025. [Google Scholar] [CrossRef]
  17. Reilly, M.J.; Dunn, C.J.; Meigs, G.W.; Spies, T.A.; Kennedy, R.E.; Bailey, J.D.; Briggs, K. Contemporary Patterns of Fire Extent and Severity in Forests of the Pacific Northwest, USA (1985–2010). Ecosphere 2017, 8, e01695. [Google Scholar] [CrossRef] [Scilit]
  18. Li, S.; Banerjee, T. Spatial and Temporal Pattern of Wildfires in California from 2000 to 2019. Sci. Rep. 2021, 11, 8779. [Google Scholar] [CrossRef] [Scilit]
  19. Ostertag, S.; Rice, M.; Qu, J.J. Investigating Spatiotemporal Trends of Large Wildfires in California (1950–2020). Adv. Cartogr. GI Sci. ICA 2023, 4, 16. [Google Scholar] [CrossRef] [Scilit]
  20. Apraku, C.Y.; Twumasi, Y.A.; Ning, Z.H.; Anokye, M.; Loh, P.M.; Armah, R.N.D.; Oppong, J. Mapping Fire Severity from Recent California Wildfires Using Satellite Imagery. Int. Arch. Photogramm. Remote Sens. Spat. Inf. Sci. 2023, 48, 7–13. [Google Scholar] [CrossRef] [Scilit]
  21. Peacock, A.; Pinto, N.; Lou, Y. Burn Severity Mapping with L-Band UAVSAR Observations Over Los Angeles’ Largest Wildfire. In Proceedings of the IGARSS 2023—2023 IEEE International Geoscience and Remote Sensing Symposium, Pasadena, CA, USA, 16–21 July 2023; IEEE: Piscataway, NJ, USA, 2023; pp. 3375–3378. [Google Scholar]
  22. Lanorte, A.; Danese, M.; Lasaponara, R.; Murgante, B. Multiscale Mapping of Burn Area and Severity Using Multisensor Satellite Data and Spatial Autocorrelation Analysis. Int. J. Appl. Earth Obs. Geoinf. 2013, 20, 42–51. [Google Scholar] [CrossRef] [Scilit]
  23. Sam, J.A.; Baldwin, W.J.; Westerling, A.L.; Preisler, H.K.; Xu, Q.; Hurteau, M.D.; Thapa, S.B. Simulating Burn Severity Maps at 30 Meters in Two Forested Regions in California. Environ. Res. Lett. 2022, 17, 105004. [Google Scholar] [CrossRef] [Scilit]
  24. Lentile, L.B.; Holden, Z.A.; Smith, A.M.S.; Falkowski, M.J.; Hudak, A.T.; Morgan, P.; Lewis, S.A.; Gessler, P.E.; Benson, N.C. Remote Sensing Techniques to Assess Active Fire Characteristics and Post-Fire Effects. Int. J. Wildland Fire 2006, 15, 319–345. [Google Scholar] [CrossRef] [Scilit]
  25. Modaresi Rad, A.; Abatzoglou, J.T.; Fleishman, E.; Mockrin, M.H.; Radeloff, V.C.; Pourmohamad, Y.; Sadegh, M. Social Vulnerability of the People Exposed to Wildfires in U.S. West Coast States. Sci. Adv. 2023, 9, eadh4615. [Google Scholar] [CrossRef] [Scilit]
  26. Masri, S.; Scaduto, E.; Jin, Y.; Wu, J. Disproportionate Impacts of Wildfires Among Elderly and Low-Income Communities in California from 2000–2020. Int. J. Environ. Res. Public Health 2021, 18, 3921. [Google Scholar] [CrossRef] [Scilit]
  27. Han, S.Y.; Lee, Y.; Yoo, J.; Kang, J.Y.; Park, J.; Myint, S.W.; Kim, J.S. Spatial Disparities in Fire Shelter Accessibility: Capacity Challenges in the Palisades and Eaton Fires. arXiv 2025, arXiv:2506.06803. [Google Scholar]
  28. Baker, B.; Dinh, Y.; Foxfoot, I.R.; Ortiz, E.; Sells, A.; Anderson, S.E. Social Inequity and Wildfire Response: Identifying Gaps and Interventions in Ventura County, California. Fire 2024, 7, 41. [Google Scholar] [CrossRef] [Scilit]
  29. Cutter, S.L.; Boruff, B.J.; Shirley, W.L. Social Vulnerability to Environmental Hazards. Soc. Sci. Q. 2003, 84, 242–261. [Google Scholar] [CrossRef] [Scilit]
  30. Centers for Disease Control and Prevention; Agency for Toxic Substances and Disease Registry. CDC/ATSDR Social Vulnerability Index; U.S. Department of Health and Human Services: Atlanta, GA, USA, 2022. [Google Scholar]
  31. Davies, I.P.; Haugo, R.D.; Robertson, J.C.; Levin, P.S. The Unequal Vulnerability of Communities of Color to Wildfire. PLoS ONE 2018, 13, e0205825. [Google Scholar] [CrossRef] [Scilit]
  32. Winkler, R.L.; Mockrin, M.H. Aging and Wildfire Risk to Communities; EIB-284; U.S. Department of Agriculture, Economic Research Service: Washington, DC, USA, 2025. [Google Scholar]
  33. Sloan, E.E.; Hajjar, R.; Davis, E.J. Equity in Resilience: A Case Study of Community Resilience to Wildfire in Southwestern Oregon, United States. Ecol. Soc. 2025, 30, 20. [Google Scholar] [CrossRef] [Scilit]
  34. Lambrou, N.; Kolden, C.; Loukaitou-Sideris, A.; Anjum, E.; Acey, C. Social Drivers of Vulnerability to Wildfire Disasters: A Review of the Literature. Landsc. Urban Plan. 2023, 237, 104797. [Google Scholar] [CrossRef] [Scilit]
  35. CALFIREFRAP Fire and Resource Assessment Program, Fire Incidents. 2020. Available online: https://frap.fire.ca.gov/mapping/gis-data/ (accessed on 17 July 2026).
  36. Drusch, M.; Del Bello, U.; Carlier, S.; Colin, O.; Fernandez, V.; Gascon, F.; Hoersch, B.; Isola, C.; Laberinti, P.; Martimort, P.; et al. Sentinel-2: ESA’s Optical High-Resolution Mission for GMES Operational Services. Remote Sens. Environ. 2012, 120, 25–36. [Google Scholar] [CrossRef] [Scilit]
  37. Brown, C.F.; Brumby, S.P.; Guzder-Williams, B.; Birch, T.; Hyde, S.B.; Mazzariello, J.; Czerwinski, W.; Pasquarella, V.J.; Haertel, R.; Ilyushchenko, S.; et al. Dynamic World, Near Real-Time Global 10 m Land Use Land Cover Mapping. Sci. Data 2022, 9, 251. [Google Scholar] [CrossRef] [Scilit]
  38. California Department of Forestry and Fire Protection (CAL FIRE). Fire and Resource Assessment Program (FRAP). Fire Threat 2014 (fthrt14_2). CAL FIRE: Sacramento, CA, USA. Available online: https://tiles.arcgis.com/tiles/EJBJ6iaHlb2c1Uh1/arcgis/rest/services/fthrt14_2/MapServer?cacheKey=8442f3514ce1eca7&f=html (accessed on 17 July 2026).
  39. U.S. Geological Survey (USGS). Burned Area Emergency Response (BAER) Imagery Support Data Center; USGS: Reston, VA, USA, 2025. Available online: https://burnseverity.cr.usgs.gov/baer/node/2443 (accessed on 17 July 2026).
  40. Gorelick, N.; Hancher, M.; Dixon, M.; Ilyushchenko, S.; Thau, D.; Moore, R. Google Earth Engine: Planetary-Scale Geospatial Analysis for Everyone. Remote Sens. Environ. 2017, 202, 18–27. [Google Scholar] [CrossRef] [Scilit]
  41. Key, C.H.; Benson, N.C. Landscape Assessment. In FIREMON: Fire Effects Monitoring and Inventory System; Lutes, D.C., Keane, R.E., Caratti, J.F., Key, C.H., Benson, N.C., Sutherland, S., Gangi, L.J., Eds.; General Technical Report RMRS-GTR-164-CD.; U.S. Department of Agriculture, Forest Service, Rocky Mountain Research Station: Fort Collins, CO, USA, 2006; pp. LA-1–LA-55. [Google Scholar]
  42. Tucker, C.J. Red and Photographic Infrared Linear Combinations for Monitoring Vegetation. Remote Sens. Environ. 1979, 8, 127–150. [Google Scholar] [CrossRef] [Scilit]
  43. Zahabnazouri, S.; Belmont, P.; David, S.; Wigand, P.E.; Elia, M.; Capolongo, D. Detecting Burn Severity and Vegetation Recovery after Fire Using dNBR and dNDVI Indices: Insight from the Bosco Difesa Grande, Gravina in Southern Italy. Sensors 2025, 25, 3097. [Google Scholar] [CrossRef] [Scilit]
  44. Ward-Baranyay, M.; Lee, C.; Pascolini-Campbell, M.; Sousa, D.; Kinoshita, A.M. Pre-Fire Fuel Conditions Are Dominant Drivers of Burn Severity in the 2025 Los Angeles County Fires. AGU Adv. 2026, 7, e2025AV002179. [Google Scholar] [CrossRef] [Scilit]
  45. Kumari, S.; Mamgain, S.; Roy, A.; Prince, H.C. Characterising Spatial Clusters of Forest Fire Activity in the Western Himalayan Region of India: Implications for Conservation and Management. Int. J. Wildland Fire 2025, 34, WF23163. [Google Scholar] [CrossRef] [Scilit]
  46. U.S. Census Bureau. American Community Survey 2019–2023 Five-Year Estimates; U.S. Department of Commerce: Washington, DC, USA, 2023. [Google Scholar]
  47. Reilly, M.J.; Zuspan, A.; Yang, Z. Characterizing Post-Fire Delayed Tree Mortality with Remote Sensing: Sizing Up the Elephant in the Room. Fire Ecol. 2023, 19, 64. [Google Scholar] [CrossRef] [Scilit]
  48. Wilson, A.M.; Latimer, A.M.; Silander, J.A., Jr. Climatic Controls on Ecosystem Resilience: Postfire Regeneration in the Cape Floristic Region of South Africa. Proc. Natl. Acad. Sci. USA 2015, 112, 9058–9063. [Google Scholar] [CrossRef] [Scilit]
  49. Petropoulos, G.P.; Griffiths, H.M.; Kalivas, D.P. Quantifying Spatial and Temporal Vegetation Recovery Dynamics Following a Wildfire Event in a Mediterranean Landscape Using EO Data and GIS. Appl. Geogr. 2014, 50, 120–131. [Google Scholar] [CrossRef] [Scilit]
  50. Bright, B.C.; Hudak, A.T.; Kennedy, R.E.; Braaten, J.D.; Khalyani, A.H. Examining Post-Fire Vegetation Recovery with Landsat Time Series Analysis in Three Western North American Forest Types. Fire Ecol. 2019, 15, 8. [Google Scholar] [CrossRef] [Scilit]
Figure 1. Map of the Palisades Fire study area in the western part of Los Angeles County, California. The orange shaded area depicts the perimeter of the 2025 Palisades Fire along with its geographic extent in California.
Geohazards 07 00120 g001
Figure 2. Burn severity and prefire wildfire-threat patterns in the Palisades Fire area. (a) Spatial distribution of the six dNBR burn-severity classes for the 2025 Palisades Fire, ranging from class 0 (unburned or very low impact) to class 5 (highest burn severity). (b) Prefire wildfire-threat classification within the Palisades Fire area, ranging from Low (class 1) to Extreme (class 5), based on wildfire-threat data available prior to the 2025 fire.
Geohazards 07 00120 g002
Figure 3. Spatial clustering of burn severity in the 2025 Palisades Fire. (a) Anselin Local Moran’s I at p < 0.05. High–High and Low–Low clusters accounted for 3.55% and 3.04% of 10,958 analyzed polygons, respectively; 93.41% were not significant. (b) Getis-Ord Gi* hot and cold spots at the 90%, 95%, and 99% confidence levels.
Geohazards 07 00120 g003
Figure 4. Burn-severity distribution and spatial autocorrelation in the 2025 Palisades Fire: (a) categorical bar chart showing the percentage of the classified area represented by each of the six dNBR burn-severity classes (0–5); and (b) Moran’s scatterplot of standardized burn-severity classes and their spatially lagged values, where data point density and distribution are shown by vertical point columns. Global Moran’s I = 0.874, z = 2656.89, p < 0.001.
Geohazards 07 00120 g004
Figure 5. Vegetation greenness and vegetation change associated with the 2025 Palisades Fire. (a) Prefire NDVI for 1–5 January 2025, where values closer to 1 indicate denser green vegetation and values closer to 0 indicate sparse vegetation. (b) Postfire NDVI for 1–5 March 2025 using the same interpretation. (c) Difference in NDVI (dNDVI; postfire minus prefire), where negative values indicate reductions in vegetation greenness and positive values indicate increases in vegetation greenness during the analyzed period.
Geohazards 07 00120 g005
Figure 6. Distribution of dNDVI values (postfire minus prefire NDVI) across the 2025 Palisades Fire area. The distribution is concentrated primarily at negative values, particularly between approximately −0.6 and −0.2, indicating widespread reductions in vegetation greenness between the prefire and early postfire observation periods.
Geohazards 07 00120 g006
Figure 7. Historical wildfire patterns in the Palisades region from 1928 to 2021. (a) Annual number of recorded wildfire events with the fitted linear trend and confidence interval. (b) Annual burned area within the 2025 Palisades Fire perimeter, calculated after clipping historical fire perimeters to the study boundary. (c) Raw annual fire counts and the three-year moving-average trend used to illustrate shorter-term variation in wildfire occurrence. (d) Relationship between the annual number of recorded fires and annual burned area within the Palisades Fire perimeter; each point represents one year and the fitted linear trend is shown in black.
Geohazards 07 00120 g007
Table 1. Data sources and temporal coverage used in the analysis of the 2025 Palisades Fire.
Data SourceDescription and Temporal CoverageSource
Palisades Fire perimeter2025 fire boundary used as the primary analysis extentCAL FIRE FRAP [35]
Sentinel-2 prefire imageryLevel-2A surface reflectance, 1–5 January 2025Copernicus Sentinel-2 [36]
Sentinel-2 postfire imageryLevel-2A surface reflectance, 1–5 March 2025Copernicus Sentinel-2 [36]
Dynamic World V1Modal 10 m land-cover class, 1 January–31 December 2024Brown et al. [37]
Fire Threat 2014Published Low-to-Extreme wildfire-threat classesCAL FIRE FRAP [38]
California Fire PerimetersHistorical fire occurrence and burned area, 1928–2021CAL FIRE FRAP [35]
USGS BAER Soil Burn SeverityFinal soil burn-severity product used for the external field-informed cross-checkUSGS BAER [39]
Table 2. dNBR classification applied to the 2025 Palisades Fire.
ClassdNBR RangeInterpretationSource
0≤−0.10Negative spectral changeStudy classification; framework follows [41]
1−0.10 < dNBR ≤ 0.10Unburned or very low spectral changeStudy classification; framework follows [41]
20.10 < dNBR ≤ 0.27Low burn severityStudy classification; framework follows [41,43]
30.27 < dNBR ≤ 0.44Moderate–low burn severityStudy classification; framework follows [41,43]
40.44 < dNBR ≤ 0.66Moderate–high burn severityStudy classification; framework follows [41,43]
5>0.66High burn severityStudy classification; framework follows [41,43]
Table 3. Distribution of dNBR burn-severity classes within the classified 2025 Palisades Fire area.
ClassdNBR RangeClassified Area (%)
0≤−0.101.06
1−0.10 < dNBR ≤ 0.104.01
20.10 < dNBR ≤ 0.277.13
30.27 < dNBR ≤ 0.449.90
40.44 < dNBR ≤ 0.6615.99
5>0.6661.92
Table 4. Area-weighted demographic characteristics of census tracts intersecting with the 2025 Palisades Fire perimeter. The mean, minimum, maximum, and standard deviation are reported for each variable.
VariableMean (%)Min (%)Max (%)Std. Dev. (%)
Population aged 65 and over26.619.533.85.2
White population82.175.190.75.1
Non-white population17.99.324.95.1
Population with disabilities6.238.91.6
Households with limited English1.905.11.4
Below 200% of federal poverty line1911.327.35.6
Households with no vehicle3.71.66.41.7
Renter-occupied housing units3116.252.412.5
Disclaimer/Publisher’s Note: The statements, opinions and data contained in all publications are solely those of the individual author(s) and contributor(s) and not of MDPI and/or the editor(s). MDPI and/or the editor(s) disclaim responsibility for any injury to people or property resulting from any ideas, methods, instructions or products referred to in the content.