Article

The Energy Requirements, Productivity and Profitability Effects of Removing Subsoil Compaction in Maize Cropping in the Eastern Pampas of Argentina


by
Guido F. Botta
1,
Alejandra Ezquerra Canalejo
2,
David Rivero
3,
Diego G. Ghelfi
1,
Sergio Rodríguez
1 and
Diogenes L. Antille
4,5,*
1
Departamento de Tecnología, Universidad Nacional de Luján, Avenida Constitución y Ruta Nacional 5, Luján 6700, Buenos Aires, Argentina
2
Escuela Técnica Superior de Ingeniería de Montes, Forestal y del Medio Natural, Universidad Politécnica de Madrid, 28040 Madrid, Spain
3
Facultad de Agronomía, Universidad Nacional de La Pampa, Santa Rosa 6300, La Pampa, Argentina
4
CSIRO Agriculture and Food, Canberra, ACT 2601, Australia
5
Engineering Department, Harper Adams University, Newport, Shropshire TF10 8NB, UK
*
Author to whom correspondence should be addressed.
AgriEngineering 2026, 8(5), 180; https://doi.org/10.3390/agriengineering8050180

Submission received: 5 February 2026 / Revised: 22 April 2026 / Accepted: 30 April 2026 / Published: 3 May 2026

Abstract

Removing subsoil compaction caused by agricultural traffic is energy-demanding and therefore expensive. Experimental work was undertaken on a Typic Argiudoll to quantify the energy required to remove subsoil compaction and determine the associated effects on yield and profitability. The following treatments were compared: (T1) soil under no-tillage for 20 years, which was used as a control; (T2) deep tillage performed with a paratill on soil that had had no-tillage in the 20 years prior to this study; and (T3) deep tillage performed with a chisel plow on soil that had had no-tillage in the 20 years prior to this study. The paratill and chisel plow were operated at depths of 400 and 250 mm, respectively, and the energy required to perform both (deep tillage) operations was determined. Soil cone index and maize yield were measured over three growing seasons and compared with T1. Results showed that the effect of deep tillage lasted for two years, after which the soil reconsolidated reaching soil strength values comparable to their pre-treatment condition. The reconsolidation of tilled soil over this period was due to both natural settlement and post-treatment (random) machinery traffic. The paratill treatment significantly increased maize yield compared with no-tillage, which therefore improved crop gross margins across all three seasons. The chisel plow treatment increased crop yields compared with no-tillage, but yield differences were small and therefore the average crop gross margins were not significantly different. Deep tillage with paratill costed US$76 per ha and generated an average gross income of US$1134 per ha, whereas deep tillage with chisel plow costed US$29 per ha and generated an average gross income of US$1027 per ha. These results compared with an average gross income of US$1001 per ha obtained under no-tillage. If (strategic) deep tillage needs to be performed on long-term no-tillage soil to remediate compaction, paratill may be preferred to chisel plow, but care should be exercised not to re-compact the soil after the operation has been performed. One effective way to do this is by implementing controlled traffic.

1. Introduction

Soil compaction has detrimental effects on the physical and hydraulic properties of soils, thereby affecting important plant–soil–water processes that influence crop productivity and ultimately profitability [1,2]. It is therefore a significant problem in mechanized agricultural systems in which controlled traffic farming is not practiced [3]. The development of heavier farm machinery over the past few decades has brought about increased risk of subsoil compaction [4]. In long-term no-tillage systems, soil compaction can be removed through strategic or occasional deep tillage, often to depths shallower than ~450 mm. Below such depths, removal of compaction becomes impractical and non-economical [5]. The extent of soil damage due to compaction is dependent on traffic intensity, soil type and soil condition at the time of traffic (e.g., soil water content), and the characteristics of the machinery used (e.g., vehicle load, operating speed, tire configuration and tire settings) [6].
The main crops grown in the Eastern Pampas of Argentina are maize (Zea mays L.), wheat (Triticum aestvium L.) and soybean (Glicyne max L. Merr.), all of which are susceptible to soil compaction with reported productivity losses between 5% and 40%, depending on seasonal rainfall (including crops grown under no-tillage) [6]. In Argentina, the area planted to maize under no-tillage is approximately 7 million ha per year [7], most of which is on clayey- to loamy-textured soils. These soils are known to be highly susceptible to compaction [1], particularly during the autumn and early part of the winter when they are moist and harvest operations take place. In the Eastern Pampas of Argentina, there is a growing interest in strategic deep tillage, which farmers perceive as a practical solution to overcome soil compaction-related problems. A drawback of the adoption of deep tillage in this region has been the lack of subsequent adoption of controlled traffic, which is known to improve the effectiveness and extend the longevity of such practice. In controlled traffic farming systems, machinery traffic is confined to permanent traffic lanes that typically occupy less than 20% of the field-cropped area; therefore, compaction is avoided (not reduced) in the remaining ~80% of the field. When controlled traffic is not practiced, soils that have been deep tilled often undergo a vicious cycle of compaction (typically, during harvest), followed by deep tillage and re-compaction (which normally occurs when the next crop in the rotation is established, and subsequently when it is harvested) [8]. In some systems, this process (compaction–deep tillage–re-compaction) is inevitably repeated each time a crop is produced. Common concerns that local growers have are: (i) whether the return on investment from deep tillage can outweigh the risk associated with performing such operation in a timely and efficient manner within a narrow window (<45 days, that extends between crop harvest and establishment of the following winter crop), and (ii) how long productivity benefits may last before deep tillage needs to be repeated [9]. These concerns are explained by the high cost of performing deep tillage while ensuring timely seedbed preparation and adequate trafficability conditions for establishing the following rotation crop [10]. Heavy traffic on soft soil can create deeper compaction, which can be impractical or non-economical to remove, and therefore the problem may be aggravated [8].
Generally, soil loosening performed under ‘good’ soil conditions and medium-textured soils (e.g., friable consistency) requires between ~2 and 9 kW per subsoiler shank, assuming the tillage implement is operated at depths between 300 and 500 mm, and at forward speeds between ~1.5 and 3.5 km h−1 [11]. However, the drawbar power required for deep tillage varies depending on soil type and soil condition (e.g., specific resistance), forward speed, and the geometry and settings of the implement [9]. Studies in Argentina on an Entic Haplustoll using a V-framed seven-shank subsoiler operated at 450 mm depth showed that the traction effort required to pull the implement through the soil was ~6.5 kN per shank, and the drawbar power was 67.3 kW at a speed of 5.2 km h−1 [9]. The same study also showed that for a chisel plow with eleven rigid shank units spaced at 285 mm and operated at a depth of 280 mm with a speed of 6.12 km h−1, the drawbar power required was 65.5 kW, and the tractive effort was 3.6 kN per shank. This study [9] serves to exemplify that the energy required for deep tillage (that is, at or below a working depth of ~250 mm) can be significant, and it therefore represents a sizeable cost to growers. From a farming system’s perspective, widespread adoption of no-tillage in Argentina over the past 30+ years has resulted in significant operating efficiency gains, enabling, for example, continuous double-cropping in areas that would, otherwise, rely on single cropping because of the narrow planting window [1]. However, soil compaction remains an unresolved and significant problem in Argentina, which compromises soil security and the long-term sustainability of arable cropping systems [12].
In response to the concerns raised by local growers and the absence of information relevant to the soil, mechanization and cropping conditions of the Eastern Pampas of Argentina, this work has identified the need to generate quantitative data to assist management decisions about remediation of soil compaction in long-term no-tillage systems. To address this information gap, this work measured the energy required to perform two types of tillage operations widely used in that region, and it determined the effects of such operations on soil, crop productivity and profitability. A key focus of this work was to determine the longevity of any beneficial effects on soil and crops before the operation was deemed to be repeated. Therefore, the objectives of this study were to: (i) quantify the energy required for deep tillage of a Typic Argiudoll that had been under no-tillage for 20 years prior to this study; (ii) determine the effects of deep tillage on soil cone index and maize yield over three growing seasons; and (iii) provide a set of practical recommendations for managing soil after deep tillage has been performed.

2. Materials and Methods

2.1. Experimental Site and Treatments

The study was conducted on a 250-hectare arable cropping farm located in the Eastern Pampas of Argentina (35°09′ S and 60°30′ W, elevation: 50 m above sea-level). The soil type at the site is a Typic Argiudoll [13] whose characteristics are provided in Table 1. Surface runoff is minimal on slopes between 0% and 1% and low to moderate on slopes between 1% and 5% [13]. Maize–soybean–wheat–soybean–maize is the traditional crop rotation implemented at the site, all under continuous no-tillage. Seasonal (1 October to 30 April) meteorological data recorded at the site during the study period is provided in Table 2.
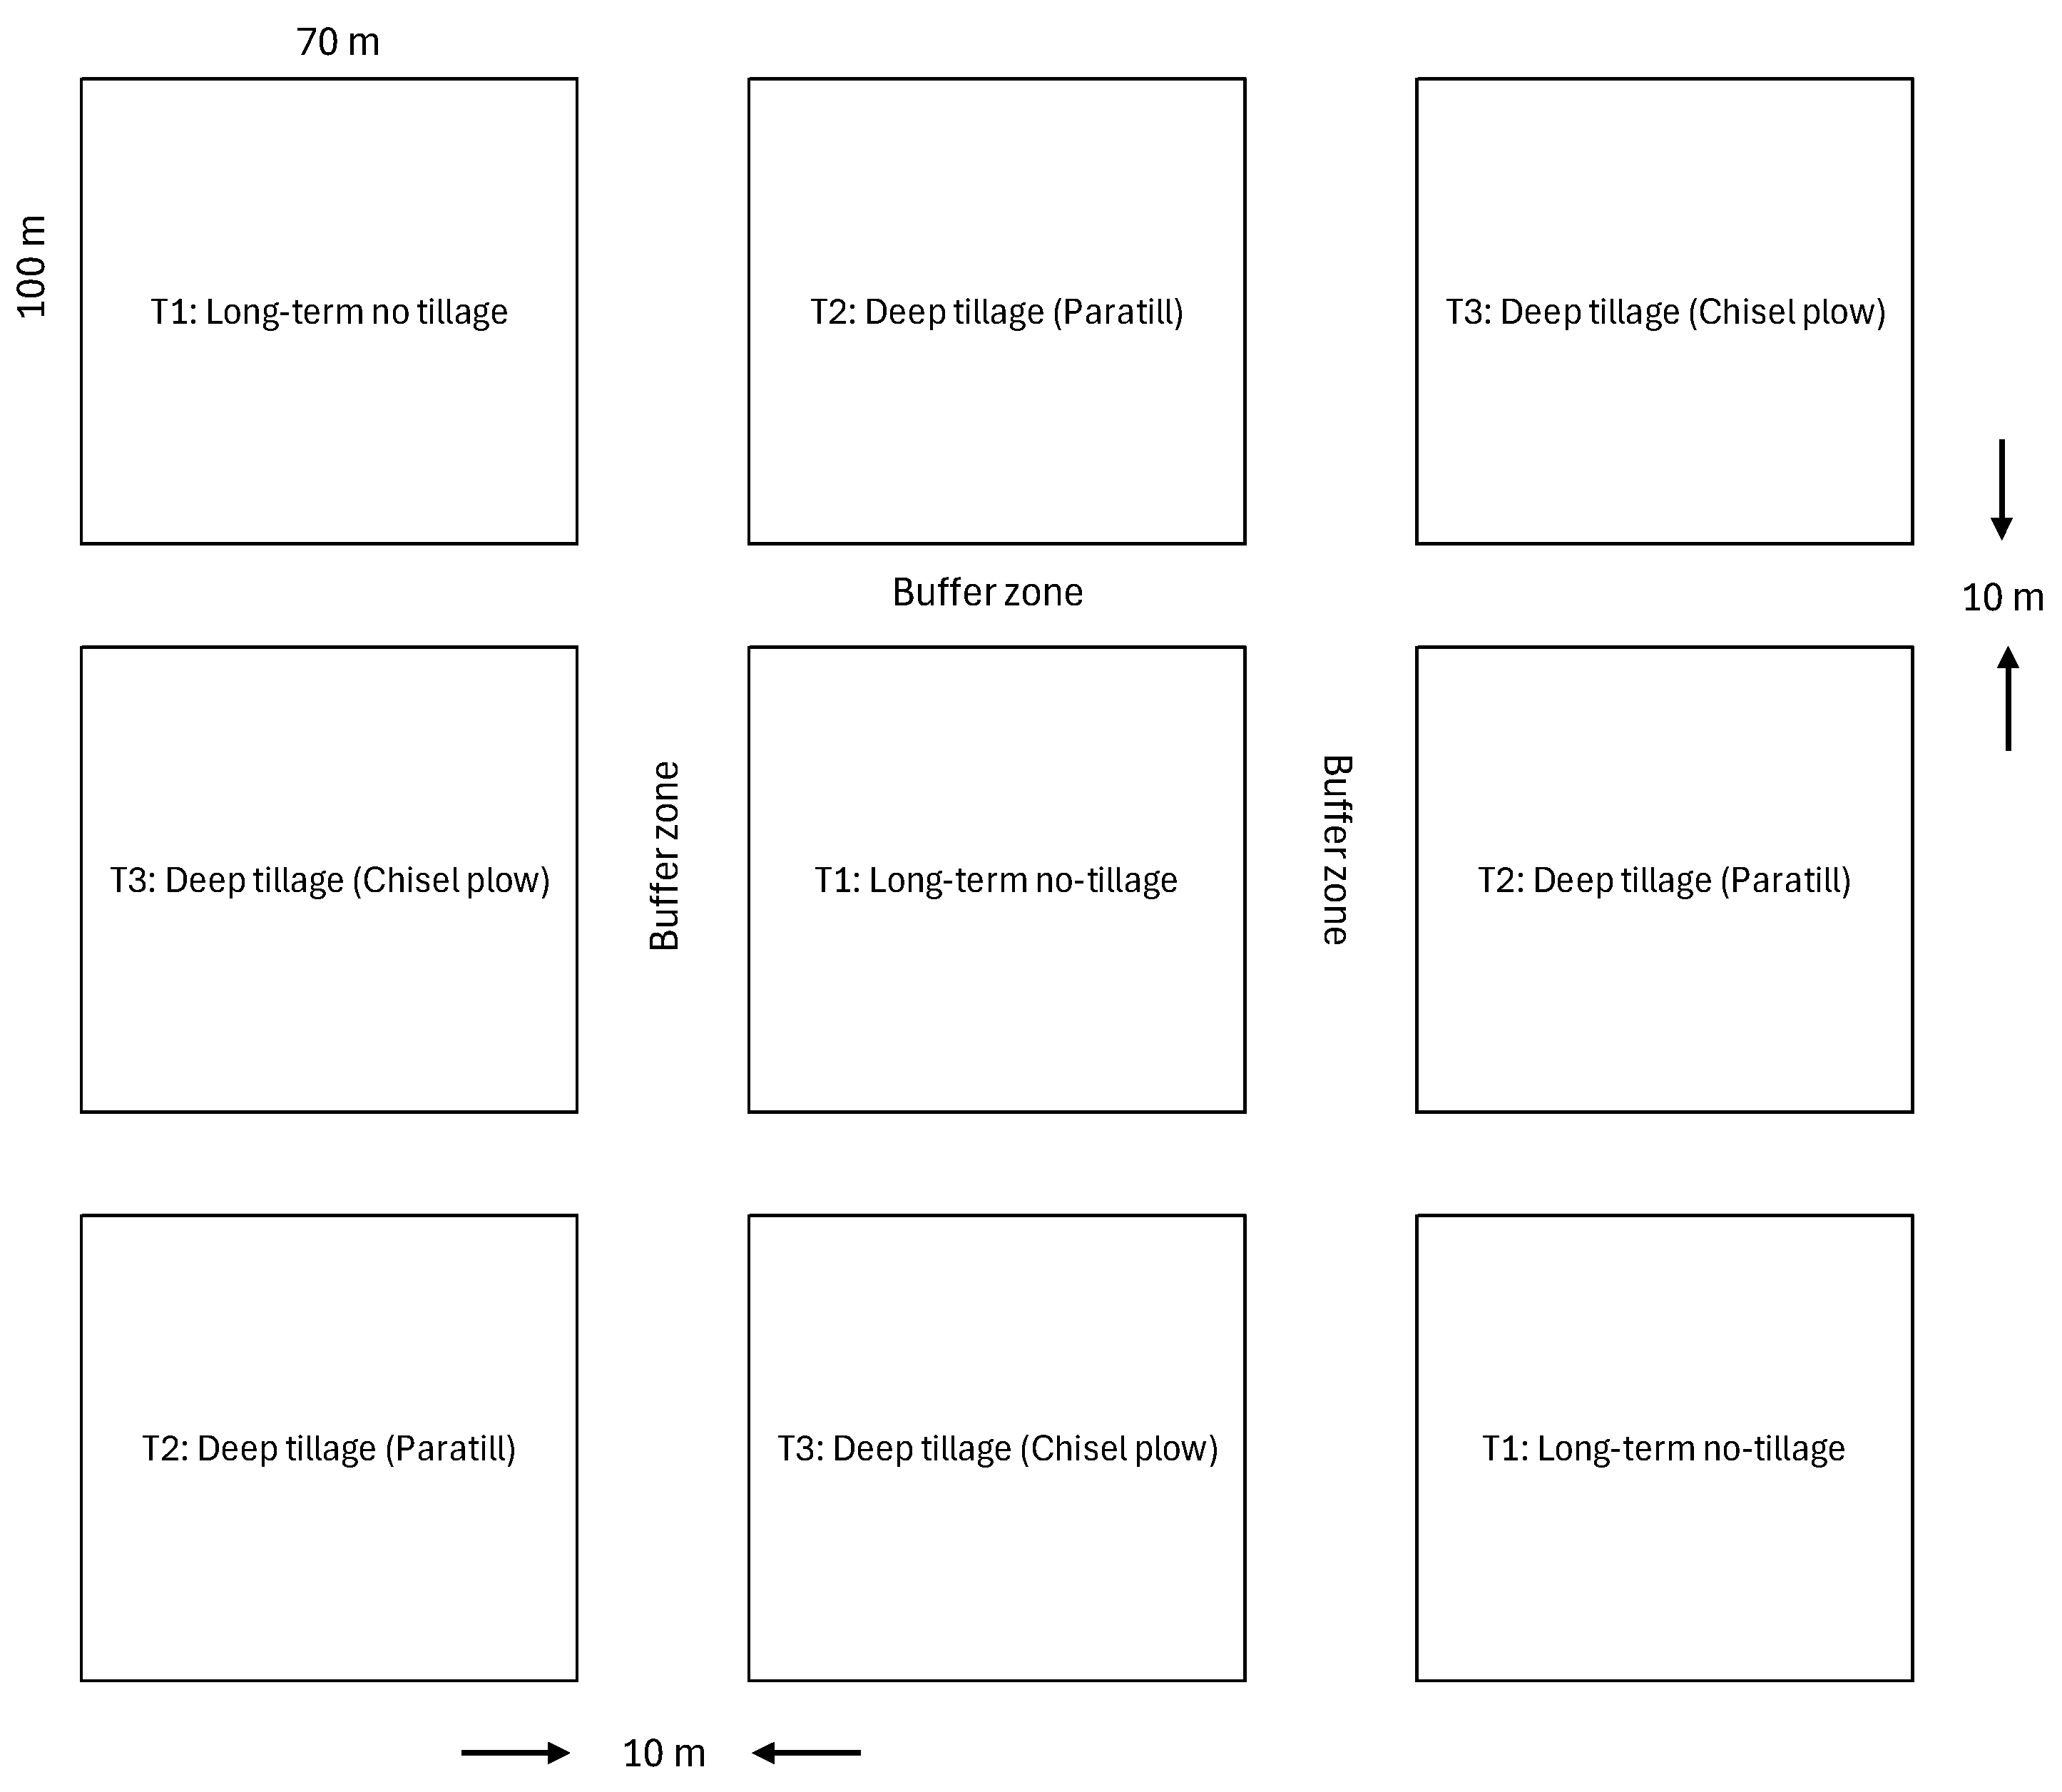
The experimental design consisted of three treatments referred to as: (T1) soil under continuous no-tillage for 20 years, which was used as a control; (T2) deep tillage performed with paratill operated at a depth of 400 mm on soil that had had no-tillage in the 20 years prior to this study; and (T3) deep tillage performed with chisel plow operated at a depth of 250 mm on soil that had had no-tillage in the 20 years prior to this study, respectively. Deep tillage in treatments T2 and T3 was performed four weeks before maize planting at the beginning of the experiment. The work was conducted on 100 m long by 70 m wide plots, which were arranged in a completely randomized block design with three (n = 3) replications (Figure 1), based on similar studies conducted in the past [23]. The plots were separated by 10 m buffer zones located between plots, which aimed to prevent any interference between the treatments. Measurements included: energy required to perform deep tillage, soil cone index (CI) before and after deep tillage was performed (0–450 mm), root biomass (dry matter), and maize yield. These measurements were conducted annually over three growing seasons (2015–2016 to 2017–2018) as described in Section 2.2, Section 2.3 and Section 2.4. Soil cone index data (CI = 2.50 ± 1.09 MPa, 0–450 mm) prior to deep tillage showed that there was a hardpan layer between ~150 and ~250 mm deep.

2.2. Crop Establishment and Management

Maize (DEKALB® hybrid DK-4F37) was planted on 12 October 2015 (1st season), 15 October 2016 (2nd season), and 14 October 2017 (3rd season), respectively. The planting density was 3.5 plants per linear meter with plant rows spaced at 525 mm (which resulted in 66,600 plants per ha), and the planting depth was 30 mm. The planter was equipped with individual pressure and depth control mechanisms for each of the soil openers fitted to the planting units. Across all treatments and years, the average emergence rate recorded at the site was 93%. Post-emergence herbicides were used to control weeds based on local agronomic advice, and fertilizer was applied each season at a rate of 140 kg ha−1 (diammonium phosphate, 18% N, 46% P2O5) and incorporated into the soil with the planter (~50 mm to the side and ~50 mm below the seed line). An additional 180 kg ha−1 of urea (46% N) was applied when the crop reached stage V6 (six fully expanded leaves) [24]. The equipment used for planting, spraying, fertilizer application, and harvesting (including chaser bins) was the same in all three seasons. The maize crops were harvested on 8 April 2016, 10 April 2017, and 15 April 2018, respectively. During harvest, in-field logistics were organized such that the grain was discharged from the combine harvester on to a chaser bin parked at the headlands. This arrangement restricted in-field traffic to the combine harvester and prevented other support vehicles from entering the experimental plots (which would have created additional compaction) [25].

2.3. Machinery Characteristics and Measurements

A description of the farm equipment used in these experiments is provided in Table 3. The tire ground pressure was determined prior to the experiment, and it represents the mean of ten measurements (n = 10). The deep tillage equipment consisted of a paratill and a chisel plow. The paratill was fitted with 4 convergent shanks spaced at 420 mm, and it was operated at a forward speed of 5 km h−1 and a depth of 400 mm. The chisel plow was fitted with 9 curved shanks spaced at 280 mm, and it was operated at a forward speed of 5 km h−1 and a depth of 250 mm. The machinery used in these experiments was the same as that used for the commercial crops grown at the farm, and it represents popular and modern equipment (<10 years old) commonly found in commercial farm operations in the study region.
Measurements included total drawbar power (DP), draft (D), fuel consumption (Fc), traveling speed (TS), and loosened soil area (A) [26]. Following the pass of each implement, A was assessed on the vertical plane, perpendicular to the direction of travel. For this, the loosened soil was manually removed and three profilometry measurements were conducted in each plot using a profile meter with vertical rods spaced at 0.02 m [27]. Draft was measured using a hydraulic dynamometer as described in Botta et al. [9]. Fuel consumption and TS were read from the digital instruments available in the tractor’s cabin as tillage was performed. Drawbar power was then estimated as Fd × TS [28], and S was measured as proposed by Wong [29]. The specific draft (force per unit of cross-sectional area of tillage required to pull the implement through the soil) was determined as D divided by the cross-sectional area of cut (width × depth) [30].

2.4. Soil and Crop Measurements and Analyses

Soil cone index (CI) was measured as per ASABE Standards [31] using a Field Scout™ 900 electronic penetrometer to a depth of 450 mm and readings were taken at regular intervals of 50 mm [32]. The gravimetric soil water content was simultaneously measured to account for the effect of soil water on soil strength [31]. Soil water was measured by taking soil cores (n = 20) to a depth of 450 mm using 25 mm diameter cylinders. The soil water content and CI were determined when deep tillage operations were performed in September 2015, approximately four weeks before the first maize crop was planted. Both these measurements were then re-taken twice during each growing season.
Maize yield was measured based on the approach outlined by Botta et al. [23]. Root dry matter (RDM) was measured on individual plants (n = 70 per treatment) 8 weeks after emergence (which coincided with tasseling). Roots were sampled from the top 300 mm of the soil profile, as approximately 60–90% of the total root biomass in rainfed maize crops is found within that depth interval [33]. The root samples were then washed to remove any soil attached to it, oven-dried at 105 °C until constant weight and reported [34].

2.5. Statistical Analyses

Statistical analyses for soil cone index, drawbar power, draft, fuel consumption, loosened soil area, root dry matter, and maize yield data used Statgraphics 19® (The Plains, VA, USA) [35] and involved ANOVA and Duncan’s multiple range test (which was used to separate treatments’ means). Measurements of soil water content were used as a covariate of soil cone index data as per ASABE Standards [31].

3. Results and Discussion

3.1. Effect of Climate on Crop

The maximum air temperatures in January were slightly higher than 33 °C across all seasons, which may have induced heat stress on the crop. Between the eight-leaf stage and flowering, maize has an optimal growing temperature range of 25 to 30 °C. While the crop can tolerate higher temperatures, significant heat stress occurs when these exceed 35 °C, especially during late pre-flowering and into the flowering period, as the plant approaches tasseling and silking [36]. Despite this, the availability of rainfall (and therefore soil water) from crop establishment through to the critical crop growth stages (after the eight leaf is fully displayed, [37]) was satisfactory in all three growing seasons (Table 2), which likely mitigated the effects of adverse temperature on crop performance [38]. Rainfall prior to harvest (early April) was always high leading to excess soil water content and increased susceptibility of soil to compaction. Overall, climatic conditions between seasons were comparable (except for 2017–2018, which was slightly drier on average).

3.2. Treatment Effects on Tillage Energy

The average (gravimetric) soil water contents recorded at the time tillage operations were conducted were 18.1 ± 1.02%, 18.5 ± 0.21% and 19 ± 1.10% in the 0–150, 150–300, and 300–450 mm depth intervals, respectively (p > 0.05). In all cases, the soil was drier than the soil water content at DUL100 (drained upper limit) for the corresponding soil depth interval (Table 1), which was therefore consistent with the recommended soil management practice for optimizing tillage performance and soil disturbance [39]. Table 4 shows a summary of the soil-machine parameters measured at the experimental site after the tillage treatments were applied. The differences observed between the two implements suggested that shank geometry and settings (shape, rake angle, spacing, operating depth) all significantly affected draft, tractor fuel use and wheel slip and the volume of soil disturbed, consistent with previous work (e.g., [40,41,42]). The paratill produced more uniform soil disturbance both at depth and across the implement’s operating width, and it resulted in a smoother soil surface finish than the chisel plow, which was attributed to the spacing between the shanks and the shanks’ geometry [43]. The results showed that there were no significant differences in total drawbar power or in measured draft between the paratill and the chisel plow (p-values > 0.05), despite that the two implements were operated at different depths [44]. The drawbar power required by the chisel plow was 5.7% higher than the paratill, which explained the differences observed in fuel consumption. The specific draft was ~14% higher with the chisel plow compared with the paratill. The cross-sectional area loosened with the paratill was ~10% larger than that of the chisel plow; however, such difference was not statistically significant.

3.3. Treatment Effects on Soil Cone Index and Root Dry Matter

Table 5 shows soil cone index data for the control (long-term no-tillage soil) and treatments (paratill and chisel plow), respectively. Overall, soil cone index was significantly lower (p < 0.01) in tilled compared with no-tillage soil (p < 0.01). In no-tillage soil, average soil cone indexes were 2.72 and 4.28 MPa in the 0–250 and 250–450 mm depth intervals, compared with 1.13 and 2.12 MPa for the paratill, and 1.29 and 3.96 MPa for the chisel plow in the 0–250 mm and 250–450 mm depth intervals, respectively. In the top 250 mm of the profile, neither the paratill or chisel plow were statistically different (p > 0.05). Below 250 mm, the chisel plow treatment exhibited similar soil cone indexes to no-tillage soil (p > 0.05), and both treatments were significantly higher than the paratill (p < 0.05). These results were consistent with earlier studies (e.g., [45,46]) that measured soil cone index approximately four years after no-tillage was first practiced.
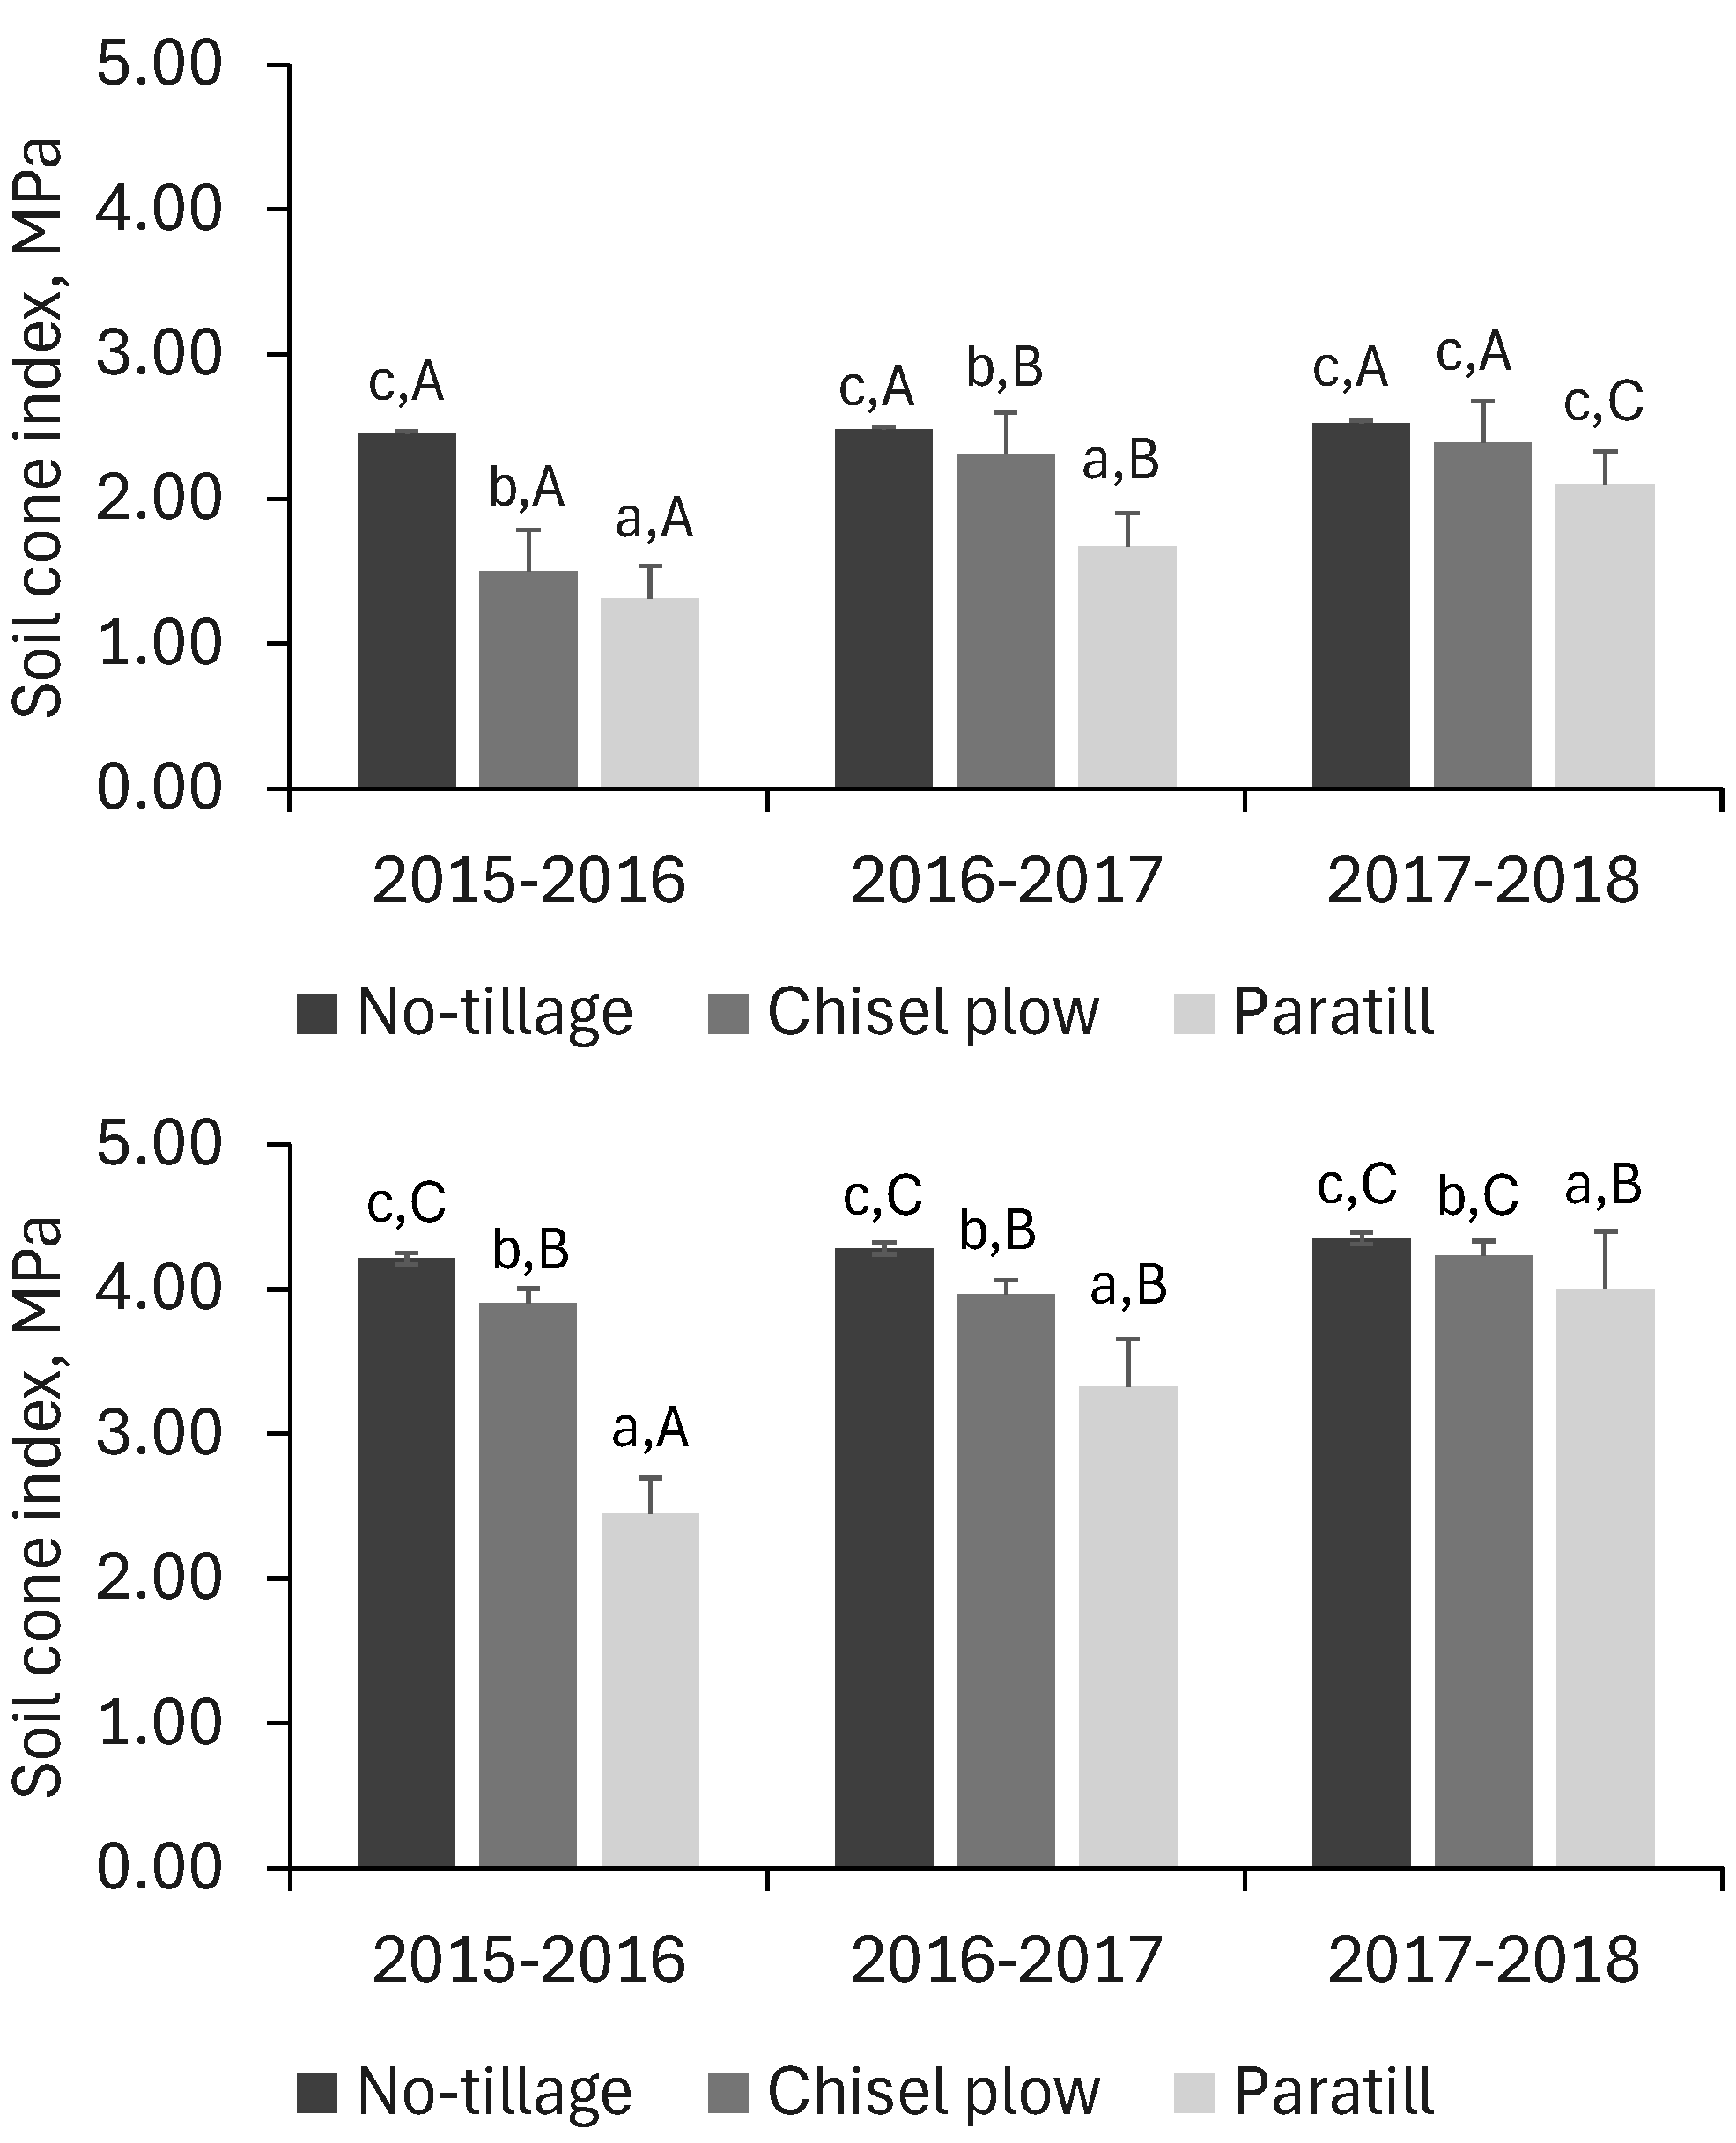
A summary of soil cone index by treatment and crop season is shown in Figure 2. Measurements in trafficked soil showed that, in the 0–250 mm depth interval, soil cone index increased at rates of 0.035, 0.445 and 0.395 MPa per season in no-tillage, chisel plow and paratill treatments, respectively. In the 250–450 mm depth interval, it increased at rates of 0.07, 0.165 and 0.775 MPa per season in no-tillage, chisel plow and paratill treatments, respectively. These results highlighted the rate at which soil strength increased over time and denoted both natural consolidation as well as compaction induced by machinery traffic. By the third season, it was observed that soil cone indexes across tillage treatments were similar to no-tillage (p-values > 0.05), with values between 2.10 and 2.52 MPa in the top 250 mm, and between 4 and 4.35 MPa at 250–450 mm. The results also showed that, by the third season (or ~25 months after the deep tillage operations were performed), the soil reconsolidated to pre-tillage treatment levels. Therefore, any beneficial effect of deep tillage on soil will likely be short-lived if it is not followed by adoption of (or jointly implemented with) controlled traffic [47,48]. Given the soil type and operational conditions of this study, it is fair to assume that such benefits will diminish at a rate comparable to the seasonal increment in soil cone index reported above. The reconsolidation of the soil was mainly attributed to (random) field traffic, and measurements conducted in April 2017 (after the second maize crop was harvested) showed a cumulative traffic intensity over the two seasons of ~142 Mg km ha−1. Such traffic intensities were reported to adversely affect productivity and rainfall-use efficiency in soybean and maize cropping systems under no-tillage (e.g., [1,49]).
Root elongation rate in maize grown in Mollisols declines when soil strength exceeds ~2 MPa [50,51]. Average cone indexes in long-term no-tillage soil through the measured soil depth, and in the chisel plow treatment below 250 mm, exceeded this threshold when the soil water content was ~60% of the DUL100. Root exploration of the soil profile was therefore impaired by soil strength, potentially restricting the ability of the crop to utilize water and nutrients at depth as the soil dried out [52]. It is noted that such threshold was reached while the soil was still rather moist (~0.6 × DUL100). The same soil strength threshold was only exceeded in the paratill treatment below 400 mm; therefore, the effective rooting depth in this treatment was greater. In the 400–450 mm depth range, there were no treatment differences in soil cone index, with values > 4 MPa. This was attributed to the transmission of soil stress at depth due to the high axle loads commonly used in intensively managed no-tillage systems, as shown by earlier studies (e.g., [1,53,54]).
A summary of tillage treatment effects on root dry matter is presented in Table 6. Overall, there were significant differences between treatments, which were observed in all three cropping seasons (p-values < 0.01). The average root dry matter in long-term no-tillage was approximately 20% and 38% lower than chisel plow and paratill, respectively. Root dry matter by treatment was consistent with measurements of soil cone index, which reflected the volume of soil loosened by the tillage operation, the effective rooting depth, and the impact of traffic-induced compaction on long-term no-tillage soil [54].

3.4. Treatment Effects on Crop Yield and Gross Income

The paratill treatment reported 22%, 16%, and 4.5% higher maize yields in the first, second, and third crop seasons (p < 0.05), respectively, than long-term no-tillage (Table 7). Chisel plowing increased yields by 6.5% and 1.2% relative to no-tillage in the first and second seasons, respectively; however, there were no statistical differences between these two treatments (p > 0.05). The lack of statistical effects was attributed to similar yields observed in the third season (6250 and 6220 kg ha−1). Gross income calculations (determined as crop yield multiplied by the year-specific price of grain) showed that the paratill treatment was ~13.3% and 10.4% higher than long-term no-tillage and chisel plow, respectively (Table 8). Overall, differences in gross incomes between no-tillage and chisel plow were marginal (~1% over three years). Therefore, chisel plowing may be discouraged as it did not deliver sufficiently high financial benefits to be justified in commercial-scale farming. These results suggested that the use of paratill to remove compaction in long-term no-tillage systems is a more cost-effective strategy than chisel plowing. However, care should be exercised to ensure that the soil is not re-compacted after ameliorative tillage has been performed. Adoption of controlled traffic farming will ensure widespread re-compaction of previously loosened soil is avoided and it will extend the longevity of deep tillage [55]. This is an important practical consideration from the soil sustainability and system’s efficiency perspectives. Failure to implement controlled traffic after soil compaction has been removed means that any beneficial effect on soil and crops will diminish within a relatively short timeframe (which will depend on the site-specific traffic intensity), and this study has demonstrated that in the absence of controlled traffic, the soil will likely return to its pre-deep tillage condition in about 2 years. Given soil loosening to depths of ~250–400 mm, there is also a risk of creating deeper compaction (potentially below 400 mm) due to the poor bearing capacity of freshly loosened soil [42]. This will exacerbate any compaction problem in the subsoil making it cumbersome (and potentially non-economical) to remove, which is undesirable.

4. Conclusions

Strategic deep tillage of long-term (~20 years) no-tillage soil was more energy-efficient with paratill than with chisel plow. Field measurements reported ~6% higher draft with chisel plow compared with paratill, despite the operating depth of the chisel plow being 150 mm shallower than the paratill. The beneficial effects of both paratill and chisel plowing on soil and crops lasted for just over two years (25 months) after the operations were performed. This rather transient effect of deep tillage on soil and crops was explained by relatively high traffic intensities (estimated at ~71 Mg km ha−1 per year) coupled with non-controlled traffic, both of which led to re-compaction of the soil profile. After three crop seasons, soil strength to the full measured depth (450 mm) was comparable to that found before ameliorative tillage was performed. It was therefore suggested that deep tillage needs to be followed by adoption of controlled traffic so that widespread compaction is avoided. Failure to do this will likely result in a recurrent cycle of compaction–(deep) tillage–re-compaction, which is both energy inefficient and counterproductive from the economic and soil sustainability perspectives.
Deep tillage significantly increased maize yields during the first and second seasons of the experiment, and it was possible to recover the cost of such operations, which were estimated at ~US$76 and US$29 ha−1 for paratill and chisel plow, respectively. The control treatment (long-term no-tillage) exhibited a three-year average gross income of US$1001 ± 91.3 per ha, while the chisel plow and paratill treatments reported average gross incomes of US$1027 ± 87.6 and US$1134 ± 62.8 per ha, respectively.

Author Contributions

Conceptualization, G.F.B., A.E.C. and D.R.; methodology, G.F.B. and D.R.; formal analysis, D.L.A. and D.G.G.; investigation, G.F.B., D.G.G. and S.R.; resources, D.R. and S.R.; data curation, D.L.A., A.E.C. and D.R.; writing—original draft preparation, G.F.B. and D.L.A.; writing—review and editing, D.L.A. and G.F.B.; project and funding acquisition, G.F.B. All authors have read and agreed to the published version of the manuscript.

Funding

The work reported in this article was supported by grants provided through Project ID: T088-UNLu, and Facultad de Agronomía at Universidad Nacional de La Pampa (Santa Rosa, Argentina) through Project ID: I-153/19-FA.

Institutional Review Board Statement

Not applicable.

Informed Consent Statement

Not applicable.

Data Availability Statement

The data reported in this article are available by request from Diogenes L. Antille (dio.antille@csiro.au) and Guido F. Botta (gfbotta@agro.uba.ar).

Acknowledgments

We are grateful to the Editor of this journal for facilitating reviews of our manuscript and to anonymous reviewers for their helpful comments. We would like to extend our gratitude to Fernando Zapater Guevara for providing operational support with the farm equipment and access to the experimental site used in this study.

Conflicts of Interest

The authors declare that there are no conflicts of interest. The funders had no role in the design of the study or in the collection, analyses, or interpretation of data nor do they have any involvement in writing up the manuscript, or in the decision to publish the results. Reference to trade names in this article is solely for the purpose of providing accurate information and it does not represent endorsement or otherwise by the authors or their organizations.

References

  1. Botta, G.F.; Antille, D.L.; Nardon, G.F.; Rivero, D.; Bienvenido, F.; Contessotto, E.E.; Ezquerra-Canalejo, A.; Ressia, J.M. Zero and controlled traffic improved soil physical conditions and soybean yield under no-tillage. Soil Tillage Res. 2022, 215, 105235. [Google Scholar] [CrossRef]
  2. Lepore, E.; Schmidt, O.; Fenton, O.; Tracy, S.; Bondi, G.; Wall, D.P. Traffic induced compaction and physical quality of grassland soil under different soil moisture deficits. Soil Tillage Res. 2024, 244, 106205. [Google Scholar] [CrossRef]
  3. Misiewicz, P.A.; Galambošová, J. Controlled traffic farming. In Encyclopedia of Smart Agriculture Technologies; Zhang, Q., Ed.; Springer: Cham, Switzerland, 2023; pp. 1–10. [Google Scholar] [CrossRef]
  4. Ogorek, L.L.P.; Gao, Y.; Farrar, E.; Pandey, B.K. Soil compaction sensing mechanisms and root responses. Trends Plant Sci. 2025, 30, 565–575. [Google Scholar] [CrossRef] [PubMed]
  5. Chamen, W.C.T.; Moxey, A.; Towers, W.; Balana, B.; Hallett, P.L. Mitigating arable soil compaction: A review and analysis of available cost and benefit data. Soil Tillage Res. 2015, 146, 10–25. [Google Scholar] [CrossRef]
  6. Botta, G.F.; Tolón Becerra, A.; Bienvenido, F.; Rivero, D.; Laureda, D.A.; Ezquerra-Canalejo, A.; Contessotto, E.E. Sunflower (Helianthus annuus L.) harvest: Tractor and grain chaser traffic effects on soil compaction and crop yields. Land Degrad. Dev. 2018, 29, 4252–4261. [Google Scholar] [CrossRef]
  7. INFOBAE. El Maíz en Argentina: Tecnología, Plagas Y El Balance de Una Campaña Desafiante. 2025. Available online: https://www.infobae.com/revista-chacra/2025/02/01/el-maiz-en-argentina-tecnologia-plagas-y-el-balance-de-una-campana-desafiante/ (accessed on 20 February 2026).
  8. Antille, D.L.; Peets, S.; Galambošová, J.; Botta, G.F.; Rataj, V.; Macák, M.; Tullberg, J.N.; Chamen, W.C.T.; White, D.R.; Misiewicz, P.A.; et al. Review: Soil compaction and controlled traffic farming in arable and grass cropping systems. Agron. Res. 2019, 17, 653–682. [Google Scholar] [CrossRef]
  9. Botta, G.F.; Antille, D.L.; Bienvenido, F.; Rivero, D.; Contessotto, E. Energy requirements for alleviation of subsoil compaction and the effect of deep tillage on sunflower (Helianthus annus L.) yield in the western region of Argentina’s rolling Pampa. Eng. Rural. Dev. 2019, 18, 174–178. [Google Scholar] [CrossRef]
  10. Earl, R. Prediction of trafficability and workability from soil moisture deficit. Soil Tillage Res. 1997, 40, 155–168. [Google Scholar] [CrossRef]
  11. Askari, M.; Abbaspour-Gilandeh, Y.; Taghinezhad, E.; El Shal, A.M.; Hegazy, R.; Okasha, M. Applying the response surface methodology (RSM) approach to predict the tractive performance of an agricultural tractor during semi-deep tillage. Agriculture 2021, 11, 1043. [Google Scholar] [CrossRef]
  12. Antille, D.L.; Imhoff, S.C.; Alesso, C.A.; Chamen, W.C.T.; Tullberg, J.N. Potential to increase productivity and sustainability in Argentinean agriculture with controlled traffic farming: A short discussion. Acta Technol. Agric. 2015, 18, 83–87. [Google Scholar] [CrossRef]
  13. INTA. Carta de Suelos de la Provincia de Buenos Aires. Buenos Aires, Instituto Nacional de Tecnología Agropecuaria (INTA), Argentina. 2015. Available online: https://inta.gob.ar/documentos/carta-de-suelos-de-la-provincia-de-buenos-aires (accessed on 10 April 2024).
  14. Gee, G.W.; Bauder, J.W. Chapter 15: Particle-size analysis. In Methods of Soil Analysis: Part 1 Physical and Mineralogical Methods, 5.1, 2nd ed.; Klute, A., Ed.; SSSA Book Series: Madison, WI, USA, 1986. [Google Scholar] [CrossRef]
  15. USDA-NRCS. Soil Taxonomy: A Basic System of Soil Classification for Making and Interpreting Soil Surveys, 2nd ed.; Agricultural Handbook No.: 436; USDA Natural Resources Conservation Service: Washington, DC, USA, 1999.
  16. Blake, G.R.; Hartge, K.H. Bulk density. In Methods of Soil Analysis, Part 1 Physical and Mineralogical Methods, 2nd ed.; Klute, A., Ed.; Agronomy Monograph; ASA-SSSA: Madison, WI, USA, 1986; Volume 9, pp. 363–375. [Google Scholar] [CrossRef]
  17. McKenzie, N.; Coughlan, K.; Cresswell, H. Soil Physical Measurement and Interpretation for Land Evaluation; CSIRO Publishing: Collingwood, VIC, Australia, 2002; p. 379. ISBN 0-643-067671. [Google Scholar]
  18. Pecorari, C.A.; Balcaza, L.F.; Frutos, E. Relaciones Empíricas Entre Contenido de Agua, Textura Y Materia Orgánica en Suelos Representativos de la Pampa Ondulada; Informe Técnico No: 222; Instituto Nacional de Tecnología Agropecuaria, INTA EEA Pergamino: Pergamino, Argentina, 1988; p. 32. [Google Scholar]
  19. Walkley, A.; Black, I.A. An examination of the degtjareff method for determining soil organic matter, and a proposed modification of the chromic acid titration method. Soil Sci. 1934, 37, 29–38. [Google Scholar] [CrossRef]
  20. Bremner, J.M. Determination of nitrogen in soil by the Kjeldahl method. J. Agric. Sci. 1960, 55, 11–33. [Google Scholar] [CrossRef]
  21. Davis, L.E. Measurements of pH with the glass electrode as affected by soil moisture. Soil Sci. 1943, 56, 405–422. [Google Scholar] [CrossRef]
  22. Jackson, M.L. Soil Chemical Analysis; Verlag-Prentice Hall Inc.: Englewood Cliffs, NJ, USA, 1958; p. 498. [Google Scholar]
  23. Botta, G.F.; Tolón-Becerra, A.; Lastra-Bravo, X.; Tourn, M.; Balbuena, R.; Rivero, D. Continuous application of direct sowing: Traffic effect on subsoil compaction and maize (Zea mays L.) yields in Argentinean Pampas. Soil Tillage Res. 2013, 134, 111–120. [Google Scholar] [CrossRef]
  24. Andrade, F.H.; Sadras, V.O. Bases Para El Manejo Del Maíz, El Girasol Y la Soja; Ediciones del Instituto Nacional de Tecnología Agropecuaria; INTA: Balcarce, Argentina, 2009; p. 310. ISBN 987-521-047-1. [Google Scholar]
  25. Botta, G.F.; Pozzolo, O.; Bomben, M.; Rosatto, H.; Rivero, D.; Ressia, M.; Tourn, M.; Soza, E.; Vázquez, J. Traffic alternatives in harvest of soybean (Glycine max L.): Effect on yields and soil under direct sowing system. Soil Tillage Res. 2007, 96, 145–154. [Google Scholar] [CrossRef]
  26. Zoz, F.M.; Grisso, R.D. Traction and Tractor Performance; ASAE Distinguished Lecture Series No.: 27; ASAE Publication No.: 913C0403; American Society of Agricultural and Biological Engineers: St. Joseph, MI, USA, 2003; Available online: https://elibrary.asabe.org/data/pdf/6/ttp2003/Lecture27.pdf (accessed on 12 April 2026).
  27. Williat, S.; Willis, H. A study of the trough formed by the passage of tines through soil. J. Agric. Eng. Res. 1965, 10, 1–4. [Google Scholar] [CrossRef]
  28. American Society of Agricultural and Biological Engineers. ASAE Standard ANSI/ASAE-S296.5 (Corrected December 2003). In General Terminology for Traction of Agricultural Traction and Transport Devices and Vehicles; ASABE Standards; ASABE: St. Joseph, MI, USA, 2003; pp. 118–120. Available online: https://elibrary.asabe.org/abstract.asp?aid=44199&t=3&redir=&redirType= (accessed on 16 April 2026).
  29. Wong, J.Y. Theory of Ground Vehicles, 5th ed; John Wiley & Sons: London, UK, 2022. [Google Scholar] [CrossRef]
  30. Harrigan, T.; Rotz, C.A. Draft relationships for tillage and seeding equipment. Appl. Eng. Agric. 1995, 11, 773–783. [Google Scholar] [CrossRef]
  31. American Society of Agricultural and Biological Engineers. ASAE Standard EP542.1 (Corrected November 2019). In Procedures for Using and Reporting Data Obtained with the Soil Cone Penetrometer; ASABE Standards; ASABE: St. Joseph, MI, USA, 2019; pp. 1–6. Available online: https://elibrary.asabe.org/abstract.asp?aid=50970&t=3&redir=&redirType= (accessed on 16 April 2026).
  32. Botta, G.F.; Romay, C.; Rivero, D.; Ezquerra-Canalejo, A.; Ghelfi, D.G.; Hidalgo, R.J. Cuantificación de los efectos del tráfico de la maquinaria agrícola sobre el suelo y el rendimiento del cultivo de girasol (Helianthus annuus L.). AgriScientia 2023, 40, 23–35. [Google Scholar] [CrossRef]
  33. Heinemann, H.; Seidel, F.; Hirte, J.; Welcker, C.; Chapuis, R.; Gelot, C.; Beauchêne, K.; Luchaire, N.; Bouidghaghen, J.; Don, A. Variability in maize root biomass distribution under drought can contribute to climate change adaptation. Plant Soil 2026, 519, 1025–1044. [Google Scholar] [CrossRef]
  34. Ministry of Agriculture; Fisheries; and Food. The Analysis of Agricultural Materials, 3rd ed.; Reference Book No.: 427; HM The Stationery Office: London, UK, 1986; p. 248. ISBN 0-11-242762-6. [Google Scholar]
  35. Statgraphics Statistical Software; Statgraphics Technologies Inc.: The Plains, VA, USA, 2009; Available online: https://www.statgraphics.com/ (accessed on 16 April 2026).
  36. Hatfield, J.L.; Prueger, J.H. Temperature extremes: Effect on plant growth and development. Weather. Clim. Extrem. 2015, 10, 4–10. [Google Scholar] [CrossRef]
  37. Andrade, F.H.; Vega, C.; Uhart, S.; Cirilo, A.; Cantarero, M.; Valentinuz, O. Kernel number determination in maize. Crop Sci. 1999, 39, 453–459. [Google Scholar] [CrossRef]
  38. Wang, X.L.; Zhu, Y.; Yan, Y.; Hou, J.; Wang, H.; Luo, N.; Wei, D.; Meng, Q.; Wang, P. Irrigation mitigates the heat impacts on photosynthesis during grain filling in maize. J. Integr. Agric. 2023, 22, 2370–2383. [Google Scholar] [CrossRef]
  39. Spoor, G.; Voorhees, W.B. Deep tillage. Soil Tillage Res. 1986, 8, 317–319. [Google Scholar] [CrossRef]
  40. Godwin, R.J. A review of the effect of implement geometry on soil failure and implement forces. Soil Tillage Res. 2007, 97, 331–340. [Google Scholar] [CrossRef]
  41. Spoor, G.; Godwin, R.J. An experimental investigation into the deep loosening of soil by rigid tines. J. Agric. Eng. Res. 1978, 23, 243–258. [Google Scholar] [CrossRef]
  42. Spoor, G. Alleviation of soil compaction: Requirements, equipment and techniques. Soil Use Manag. 2006, 22, 113–122. [Google Scholar] [CrossRef]
  43. Truman, C.C.; Reeves, D.W.; Shaw, J.N.; Motta, A.C.; Burmester, C.H.; Raper, R.L.; Schwab, E.B. Tillage impacts on soil property, runoff, and soil loss variations from a Rhodic Paleudult under simulated rainfall. J. Soil Water Conserv. 2003, 58, 258–267. [Google Scholar] [CrossRef]
  44. Godwin, R.J.; O’Dogherty, M.J. Integrated soil tillage force prediction models. J. Terramechanics 2007, 44, 3–14. [Google Scholar] [CrossRef]
  45. Dickey, E.C.; Peterson, T.R.; Gilley, J.R.; Mielke, L. Yield comparisons between continuous no-till and tillage rotations. Trans. ASAE 1983, 26, 1682–1686. [Google Scholar] [CrossRef]
  46. Carter, M.R. Temporal variability of soil macroporosity in a fine sandy loam under mouldboard ploughing and direct drilling. Soil Tillage Res. 1988, 12, 37–51. [Google Scholar] [CrossRef]
  47. Alakukku, L.; Weisskopf, P.; Chamen, W.C.T.; Tijink, F.G.J.; van der Linden, J.P.; Pires, S.; Sommer, S.; Spoor, G. Prevention strategies for field traffic-induced subsoil compaction: A review: Part 1. Machine/soil interactions. Soil Tillage Res. 2003, 73, 145–160. [Google Scholar] [CrossRef]
  48. Chamen, T.; Alakukku, L.; Pires, S.; Sommer, C.; Spoor, G.; Tijink, F.; Weisskopf, P. Prevention strategies for field traffic-induced subsoil compaction: A review: Part 2. Equipment and field practices. Soil Tillage Res. 2003, 73, 161–174. [Google Scholar] [CrossRef]
  49. Nawaz, M.M.; Noor, M.A.; Latifmanesh, H.; Wang, X.; Ma, W.; Zhang, W. Field traffic-induced soil compaction under moderate machine-field conditions affects soil properties and maize yield on sandy loam soil. Front. Plant Sci. 2023, 14, 1002943. [Google Scholar] [CrossRef]
  50. Pilatti, M.A.; de Orellana, J.A. The ideal soil: II. Critical values of an “ideal soil” for Mollisols in the north of the Pampean Region (in Argentina). J. Sustain. Agric. 2000, 17, 89–112. [Google Scholar] [CrossRef]
  51. Jorajuria, D.; Draghi, L. The distribution of soil compaction with depth and the response of a perennial forage crop. J. Agric. Eng. Res. 1997, 66, 261–265. [Google Scholar] [CrossRef]
  52. Threadgill, E. Residual tillage effects as determined by cone index. Trans. ASAE 1982, 25, 859–863. [Google Scholar] [CrossRef]
  53. Håkansson, I.; Myrbeck, A.; Etana, A. A review of research on seedbed preparation for small grains in Sweden. Soil Tillage Res. 2002, 64, 23–40. [Google Scholar] [CrossRef]
  54. Kirby, J.M.; Bengough, A.G. Influence of soil strength on root growth: Experiments and analysis using a critical-state model. Eur. J. Soil Sci. 2002, 53, 119–127. [Google Scholar] [CrossRef]
  55. Bennie, A.T.P.; Botha, F.J.P. Effect of deep tillage and controlled traffic on root growth, water-use efficiency and yield of irrigated maize and wheat. Soil Tillage Res. 1986, 7, 85–95. [Google Scholar] [CrossRef]
Figure 1. A diagram of experimental plots and tillage management treatments. The plots were spaced by 10 m wide buffer zones to minimize interference between treatments. In T1: long-term (20 years) no-tillage, T2: paratill at 400 mm depth after 20 years of no-tillage, and T3: chisel plow at 250 mm depth after 20 years of no-tillage. Note dimensions are not to scale.
Agriengineering 08 00180 g001
Figure 2. Mean soil cone index for the 0–250 mm (top) and 250–450 mm (bottom) depth intervals by treatment as recorded over three crop seasons. Uppercase letters show statistical differences between treatments and between crop seasons. Lowercase letters show statistical differences between treatments and within the same crop season. Error bars on mean values denote the standard deviation.
Agriengineering 08 00180 g002
Table 1. Physico-chemical characterization of the soil (Typic Argiudol [13]) at the experimental site. DUL100: drained upper limit (that is, the laboratory determination of field capacity at a suction of 100 cm); LL15: crop lower limit (that is, the laboratory determination of the permanent wilting point at 15 bar); SOC: soil organic carbon; Ca: calcium; Mg: magnesium; Na: sodium; K: potassium.
Soil Characterization/Soil HorizonAp1Ap2ABBt1BtssBt2BCk2CkkReference
Depth interval, cm0–1016–2025–3240–5565–8090–110112–150160–220Visual examination (in situ)
Particle size analysis--------[14]
Clay (<2 μm), g kg−1201248279342464320220149-
Fine silt (2–20 μm), g kg−133.134.629.528.120.730.031.829.9-
Coarse silt (20–50 μm), g kg−1756708672613500630727799-
Sand (>50 μm), g kg−19.99.419.516.915.32021.222.1-
Soil textural classSilt clay loamSilt clay loamSilty clay loamSilty clay loamSilty claySilty clay loamSilt clay loam Silt loam[15]
Soil bulk density, g cm−31.3351.3261.3131.2951.2641.3051.3281.351[16]
DUL100, % (w/w)26.6028.5026.8028.7035.2031.9027.0023.50[17]
LL15, % (w/w)7.527.617.3210.849.3211.247.457.34[18]
SOC, % (w/w)1.851.440.950.610.550.320.200.11[19]
Total nitrogen, % (w/w)0.230.130.110.080.070.050.03-[20]
C:N ratio8.91098866--
pH1:2.5 (soil/water ratio)5.85.86.06.26.56.46.47.9[21]
Cations--------[22]
Ca2+, meq/100 g11.412.712.013.818.317.216.5--
Mg2+, meq/100 g2.92.53.14.56.56.43.8--
Na+, meq/100 g0.20.10.20.10.20.20.30.5-
K+, meq/100 g1.41.00.91.32.32.42.32.4-
Table 2. Meteorological data recorded at the experimental site for the three crop seasons (2015/2016, 2016/2017, and 2017/2018, respectively) over which this study was conducted. For summer-grown crops, the crop growing season extends from 1 October to 30 April.
MonthRainfall, mmMean Maximum Temperature, °C
Crop Season2015–20162016–20172017–20182015–20162016–20172017–2018
October667711022.123.122.9
November105492524.223.727.8
December721207630.131.130.3
January29311033.133.633.2
February80691528.629.129.9
March30922225.524.925.1
April15017814525.524.925.1
Total532616403---
Table 3. Specifications of the tractor, harvester, sprayer, fertilizer applicator, chaser bin, and planter used in the study. FWA: front wheel assist. The tire inflation pressures at which the tires were operated may differ from the manufacturers’ recommended tire inflation pressures for the load, traveling speed and slope. The chaser bin did not enter the field (it was only allowed to traffic along the field’s headland), hence, the distance traveled was significantly less compared with the combine harvester.
DescriptionUnitsFWA TractorCombine HarvesterSprayerFertilizer ApplicatorChaser Bin
Model-Evo 250JD 9670-STS7040Fertec F824Akron 20
Manufacturer, location-Pauny (Cordoba, Argentina)Deer & Co., Des Moines, IA, USAMetalfor, Cordoba, Argentina. Crucianelli, Santa Fe, ArgentinaAkron, Santa Fe, Argentina
Engine powerCV/kW160/117.3325/238.3173/129240/179-
Front tires-16.9–28900/60 R3212.4 R4612.4–3623.1–30
Tire inflation pressure (front)kPa70200260260200
Rear tires-24.5–3228L- 2612.4 R4612.4–3623.1–30
Tire inflation pressure (rear)kPa65120260260200
Overall loadkN79.80162.9090.0098.60196
Load front axlekN31.75105.3036.7239.4498
Load rear axlekN48.0557.6053.2859.1698
Static load per front wheelkN15.8852.6518.3619.7249
Static load per rear wheelkN24.0228.8026.6429.5849
Front wheels track widthmm26502800300021003000
Rear wheels track widthmm26502800300021003000
Mean ground pressure front tirekPa38.7269.46231239116
Mean ground pressure rear tirekPa39.8538.22240251116
In-field distance traveled/seasonkm ha−11.4281.1900.6000.3570.567
DescriptionUnitsPlanter
Model-3520
Manufacturer, location-Santa Fe, Argentina
Overall loadkN111.23
Overall widthm7.00
Distance between rowsmm525
Seed metering system-Standard disc
Tires-400/60–15.5 × 4 (300 kPa) and 7.50–16 (×2 tires, 137 kPa)
Mean ground pressure per wheel kPa122.62
Cutting units and furrower-Turbo coulter, single-disc with one-depth limiting wheel
Closing and pressing wheels-Fitted with closing/pressing wheels with adjustable angle and down pressure
In-field distance traveled/seasonkm ha−11.428
Table 4. A summary of measured parameters for two tillage treatments (chisel plow and paratill). Different letters (vertically arranged) indicate that mean values were significantly different at p < 0.01 (Duncan’s multiple range test). Key: D (draft force), Fc (specific draft), DP (drawbar power), and A (loosened soil area).
Treatment, Operating DepthMeasured Parameter, Unit
-D, kNFc, kPaFuel Use, L h−1DP, CVA, cm2
Chisel plow, 250 mm28.80 a50.27 a22.9 a54.42 a5730 a
Paratill, 400 mm27.16 a43.31 b19.6 b51.33 a6274 a
Table 5. Soil cone index (MPa) for long-term no-tillage soil (control) and treatments (chisel plow and paratill) measured four weeks prior to maize planting, and after deep tillage was performed. Results are expressed as the mean ± standard deviation (SD). Different letters (horizontally arranged) indicate that values are significantly different at p < 0.01 (Duncan’s multiple range test).
Depth Interval, mmNo-TillageChisel PlowParatill
0–1502.13 ± 0.14 a1.18 ± 0.34 b1.09 ± 0.21 b
150–2002.32 ± 0.27 a1.30 ± 0.12 b1.12 ± 0.42 b
200–2502.75 ± 0.32 a1.39 ± 0.31 b1.19 ± 0.18 b
250–3003.92 ± 0.42 a3.20 ± 0.13 a1.29 ± 0.81 b
300–3504.23 ± 0.25 a4.01 ± 0.41 a1.32 ± 0.12 b
350–4004.32 ± 0.51 a4.20 ± 0.22 a1.49 ± 0.23 b
400–4504.40 ± 0.40 a4.41 ± 0.57 a4.38 ± 0.28 a
Mean ± SD3.44 ± 1.012.81 ± 1.471.70 ± 1.19
Table 6. Root dry matter (g [DM] plant−1) measured over three cropping seasons and reported as the mean ± standard deviation. Different letters within each year (horizontally) indicate a significant difference between tillage treatments. Use p < 0.01, Duncan’s multiple range test. Key to treatments: Long-term no-tillage (control) and treatments (chisel plow and paratill).
Crop Season/TreatmentNo-TillageChisel PlowParatill
2015–201642.2 ± 0.022 a51.0 ± 0.030 c65.0 ± 0.027 b
2016–201741.0 ± 0.034 a49.5 ± 0.022 c62.5 ± 0.033 b
2017–201841.2 ± 0.031 a48.0 ± 0.027 c60.0 ± 0.035 b
Mean ± SD41.4 ± 0.032 a49.5 ± 0.010 c62.5 ± 0.040 b
Table 7. Maize yield (kg [grain] ha−1) recorded over three growing seasons and reported as the mean ± standard deviation. Relative yield is expressed as a percentage of the yield recorded for long-term no-tillage. Different letters within each year (horizontally) indicate a significant difference between tillage treatments. Use p < 0.01, Duncan’s multiple range test. Key to treatments: Long-term no-tillage (control) and treatments (chisel plow and paratill).
TreatmentNo-TillageChisel PlowParatill
Crop yield, harvest 20166320 a6732 a7702 b
Relative yield (%)-6.5121.86
Crop yield, harvest 20176230 a6305 a7230 b
Relative yield (%)-1.2016.05
Crop yield, harvest 20186220 a6250 a6501 b
Relative yield (%)-0.4810.94
Table 8. Estimated gross income (GI, where GI = Yield × PG) for long-term no-tillage (control) and treatments (chisel plow and paratill) between 2016 and 2018. PG: price of grain perceived by the farmer in the year of harvest based on Bolsa de Comercio de Rosario (https://www.bcr.com.ar/, accessed on 12 January 2026), GI: gross income, and SD: standard deviation.
Harvest YearPG (US$ kg−1)GI (US$ ha−1)
Treatment-No-TillageChisel PlowParatill
20160.15598010431194
20170.1489229331070
20180.177110111061151
Mean ± SD0.160 ± 0.01511001 ± 91.31027 ± 87.61134 ± 62.8
Disclaimer/Publisher’s Note: The statements, opinions and data contained in all publications are solely those of the individual author(s) and contributor(s) and not of MDPI and/or the editor(s). MDPI and/or the editor(s) disclaim responsibility for any injury to people or property resulting from any ideas, methods, instructions or products referred to in the content.