


Abstract
Spray drift is one of the most significant challenges in the application of Plant Protection Products (PPPs), as it contributes to water, soil, and food contamination and is highly associated with health risks to agricultural workers, bystanders, and rural residents. Spray drift is defined as the fraction of PPP that is carried away from the target area by air currents during application. Factors such as high wind speeds, low relative humidity, and elevated temperatures increase the risk of drift by promoting droplet evaporation and off-target movement. Technological advancements in spraying equipment, such as low-drift and air induction nozzles, have been shown to significantly reduce drift potential. Air induction nozzles mix air with the spray liquid, creating larger droplets that are less susceptible to drift. The primary objective of this study was to quantify the spray drift reduction achieved using cost-effective and easily applicable drift mitigation techniques that do not require specialized and expensive equipment compared to conventional application methods in vineyards under Southern European conditions. Field measurements followed the ISO 22866:2005 protocol, using a conventional axial fan air-assisted sprayer that is commonly used by vineyard farmers in Greece. This study was conducted on Savatiano vines, the most widely cultivated winemaking variety in the Attica region, characterized by its low height. The spraying techniques evaluated as spray drift mitigation measures were one-sided spraying applications of the outer vineyard row; one-sided spraying applications of the two last rows; spraying with closed air assistance on the outer rows; and finally, spraying with the use of air induction nozzles. Results indicated that each technique produced varying amounts of sedimenting drift over distance. Spraying without air assistance consistently generated the lowest levels of drift at almost all distances. While air induction nozzles initially increased drift deposition within the first 4 m, they significantly reduced drift beyond 5 m. These findings demonstrate that simple operational adjustments to conventional vineyard sprayers, particularly reducing or switching off air assistance in outer rows, can substantially decrease spray drift without requiring additional investment in specialized equipment. Overall, spraying without air support achieved the greatest drift reduction across all distances from the vineyard, followed by air induction nozzles, which were equally effective at further distances (past 5 m) but less so near the application area. The results provide practical guidance for vineyard growers seeking low-cost strategies to minimize agricultural input losses, environmental contamination, and improve the sustainability of pesticide applications.
1. Introduction
Pesticides are effective tools for the management of pests, weeds, and pests and diseases in plant protection [1]. Because of the low cost and efficient performance, the largest volume of pesticides is applied by spraying [2,3]. The main goals of pesticide spray applications are adequate deposition and equal distribution of active matter on target plant surfaces [4]. Though the amount of spray that is released from the sprayer is considerably bigger than how much covers the crops eventually [5]. In most applications, the quantity of spray deposited on the target does not exceed 55% of the initial volume of pesticide, while 45% of the spray either ends up on the ground or is lost as airborne particles [6].
Spray drift is defined as the amount of Plant Protection Product (PPP) that is dispersed out of the sprayed (treated) area by the action of air currents during the application process [7] and is considered to be the most challenging problem facing applicators, as well as manufacturers of pesticides [8]. Spray drift has been identified as a major problem for the environment as it can result in surface water contamination [9]; damage to sensitive adjoining crops [10] and other susceptible off-target areas [11,12]; over-the-legal-limit pesticide residues; pesticide resistance [13]; and health risks to agricultural workers [14], bystanders, residents [15], and local fauna [16].
Spray drift is a complex phenomenon that is affected by various parameters, including the deployed spraying equipment and application techniques (type and dimensions of nozzles, spray force, air velocity, driving rate, sprayer’s system, etc.) [17,18]; meteorological conditions (wind, temperature, humidity, etc.) [19]; properties of spray liquid (viscosity, surface tension, homogeneity, etc.) [20,21]; topographic characteristics of the crop (dimensions, density, foliage, etc.) [22,23]; and operator care, attitude, and skill [24].
Weather conditions significantly influence the extent and volume of spray drift, with wind speed being recognized as the single most impactful meteorological factor [25]. As wind speed and spray drift deposition are directly correlated [26], the increase in wind speed results in higher drift volumes at greater distances from the application field [27]. Air temperature and relative humidity are also parameters that influence spraying applications. Higher temperature conditions and/or lower relative humidity can cause a faster evaporation of spray droplets and a bigger possibility of drift [28]. On the other hand, droplet size is the most important technical factor, which differs depending on nozzle diameter and type, spray force, and the chemical and physical properties of the spray liquid [29,30]. Drift loss is more common when the droplets have diameters smaller than 100 μm [31]. The understanding of the effect of spray parameters on droplet characteristics is essential to reduce drift.
Measures commonly proposed to reduce drift include the utilization of drift-reducing technology (DRT), no-spray buffer zones, and windbreaks and riparian vegetation [32,33,34]. Depending on the plant species and the leaf stage, the drift reduction efficiency of windbreaks (hedge and tree rows) varies strongly. FOCUS [33] recommends using 25% for bare trees, 50% for most types of trees, and 90% for trees with complete foliage. Ucar and Hall [35] reported that the presence of windbreaks reduced pesticide drift by 60–90% and observed that live windbreaks are preferable for wind speed reduction and drift mitigation than artificial ones. Furthermore, broadleaf vegetation (such as poplar) has worse performance at capturing spray drift than evergreen species (such as pine) [36]. After the investigation of no-spray buffer zones for use as protection by filtering out the pesticides, distances between 3 m and 24 m have been suggested as appropriate for drift mitigation [37]. Directive 2009/128/EC, which serves as the cornerstone EU legislation for all advancements in drift reduction and pesticide application efficiency, includes requirements for the use of protection zones. Each EU Member State shall determine the features of these zones (dimensions such as width and their connection to different spray application techniques) in its national action plan [38].
In recent decades, new technical equipment and improved application methods have been developed for the reduction of environmental contamination and spray drift. Low-drift and air induction nozzles that produce a much rougher spray quality and reduce spray drift potential are very popular in modern agriculture. Several studies reported a reduction in spray drift when air induction was enforced in contrast to conventional nozzles on a sprayer tested in vineyards [39,40]. The electrostatically charged sprays improve overall distribution and the underside leaf deposition due to the “wrap-around” effect, resulting in the reduction of spray drift, the improvement of canopy penetration, and the increase in deposition efficiency [41]. Pascuzzi and Cerruto [42] carried out field tests in vineyards and concluded that an electrostatic sprayer can deliver bigger deposits on leaves than a traditional air-assisted sprayer. Nevertheless, the improvement of this technology and the understanding of the behavior of electrostatic droplets, as opposed to conventional spraying systems, is mandatory, and some parameters must be carefully regulated, such as the distance to vegetation and the mass–charge ratio [43].
The most common sprayers for PPP applications in vineyards are conventional air-assisted sprayers with an arc-shaped spray boom and an axial flow fan. This type of fan causes a spiraling airstream, resulting in an uneven airflow between the two sides of the sprayer and an off-balance spray distribution arrangement. To counteract this phenomenon, adjustments to the nozzles are required [44]. Moreover, when the impeller’s rotational speed is changed, the vertical air flow profile may become unusual [45]. As conventional air-blast sprayers exhibit low efficiency in liquid utilization, characterized by significant losses resulting from off-target applications [46], some target-oriented systems, such as directed air jet, cross-flow, and tunnel sprayers with horizontal or adjustable air discharge systems, have been developed. The cross-flow sprayers reduce spray loss, but the horizontal air jet usually results in higher deposits on the upper leaf surfaces than on the undersides [47]. Tunnel sprayers build up the canopy deposition and minimize drift losses by encompassing the entire tree, recycling excess spray, and restricting the air flow inside the tunnel [48]. However, tunnel sprayers are associated with various limitations, including difficulties in maneuvering through orchards or vineyards, high costs, and the potential for disease transmission through physical contact or residual spray [49].
Target detection and the use of variable doses are strategies that have been developed to address the spray drift issue, either by using very advanced techniques, such as vision systems and laser scanning, or with ultrasonic and spectral systems. Various sensors for the precise application of pesticides have been tried for different types of orchards and vineyards. Llorens et al. [50] used the variable rate sprayer tested by Gil et al. [51] on three varieties of grapevine at different stages of maturity and showed 58% savings in pesticide volume compared with a conventional sprayer. Koch and Weisser [52] reported that in orchards and vineyards, sensor-equipped sprayers, which prevent spraying in the gaps between plants, can reduce drift by 50%.
The suitable adjustment of the air assistance and spray patterns from the sprayer to the canopy is considered very important for the mitigation of the spray drift. Adjusting the spray material distribution to the vine canopy profile can reduce spray drift by approximately 90% and pesticide usage by about 20% [53]. Another mitigation measure is to reduce or completely shut down air assistance when crossing through the outer rows or to only enable air assistance on the sprayer’s side where the air outlet is directed towards the interior crop lines, e.g., with a cover shield on the fan outlet or a redirection metal sheet [54]. Wenneker et al. [55] reported that the quantity of spray drift in an apple orchard can be significantly decreased by using air induction nozzles in conjunction with air-assisted adjustment and spraying the outer row while only the nozzle array facing that line is active.
Despite the extensive research on spray drift reduction technologies, relatively limited attention has been given to practical and low-cost mitigation strategies applicable to conventional vineyard spraying systems, particularly under Southern European conditions where low-height grapevine canopies and widely used axial fan air-assisted sprayers influence spray dispersion patterns. Many studies focus on advanced equipment or specialized technologies, which may not always be accessible to farmers. Therefore, there is a need to evaluate simple operational adjustments that can be implemented using existing equipment in order to reduce spray drift while maintaining practical applicability in vineyard production systems.
The objective of the present study was to quantify the reduction of spray drift achieved using practical drift mitigation techniques compared with a conventional spraying approach used as a reference treatment. Field measurements were conducted in accordance with ISO 22866:2005 [7] using a conventional axial fan air-assisted sprayer widely used by Greek vineyard farmers. The experiments were carried out in a Savatiano vineyard, the most widely cultivated winemaking variety in the Attica region, characterized by its relatively low canopy height. The evaluated spray application techniques included one-sided spraying of the outer vineyard row, one-sided spraying of the two outer rows, spraying without air assistance on the outer rows, and the use of air induction nozzles.
2. Materials and Methods
2.1. Field Site and Experimental Layout
Drift tests were carried out during the 2018 and 2019 cultivation years in a vineyard of the Agricultural University of Athens in Athens, Greece (37°59′06″ N, 23°54′21″ Ε). The vines were planted on rows with a spacing of 2.0 × 1.6 m (between rows × between vines). The leaves and grapes reached a zone 0.3 to 1.2 m above the ground, and the average vine height was approximately 1.1 m.
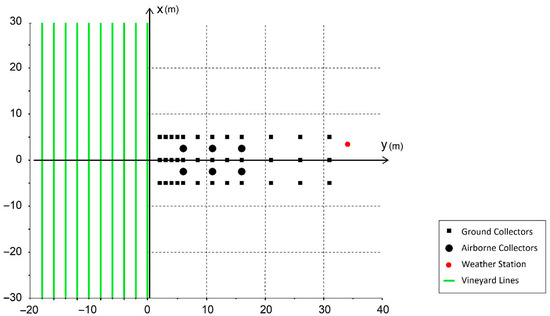
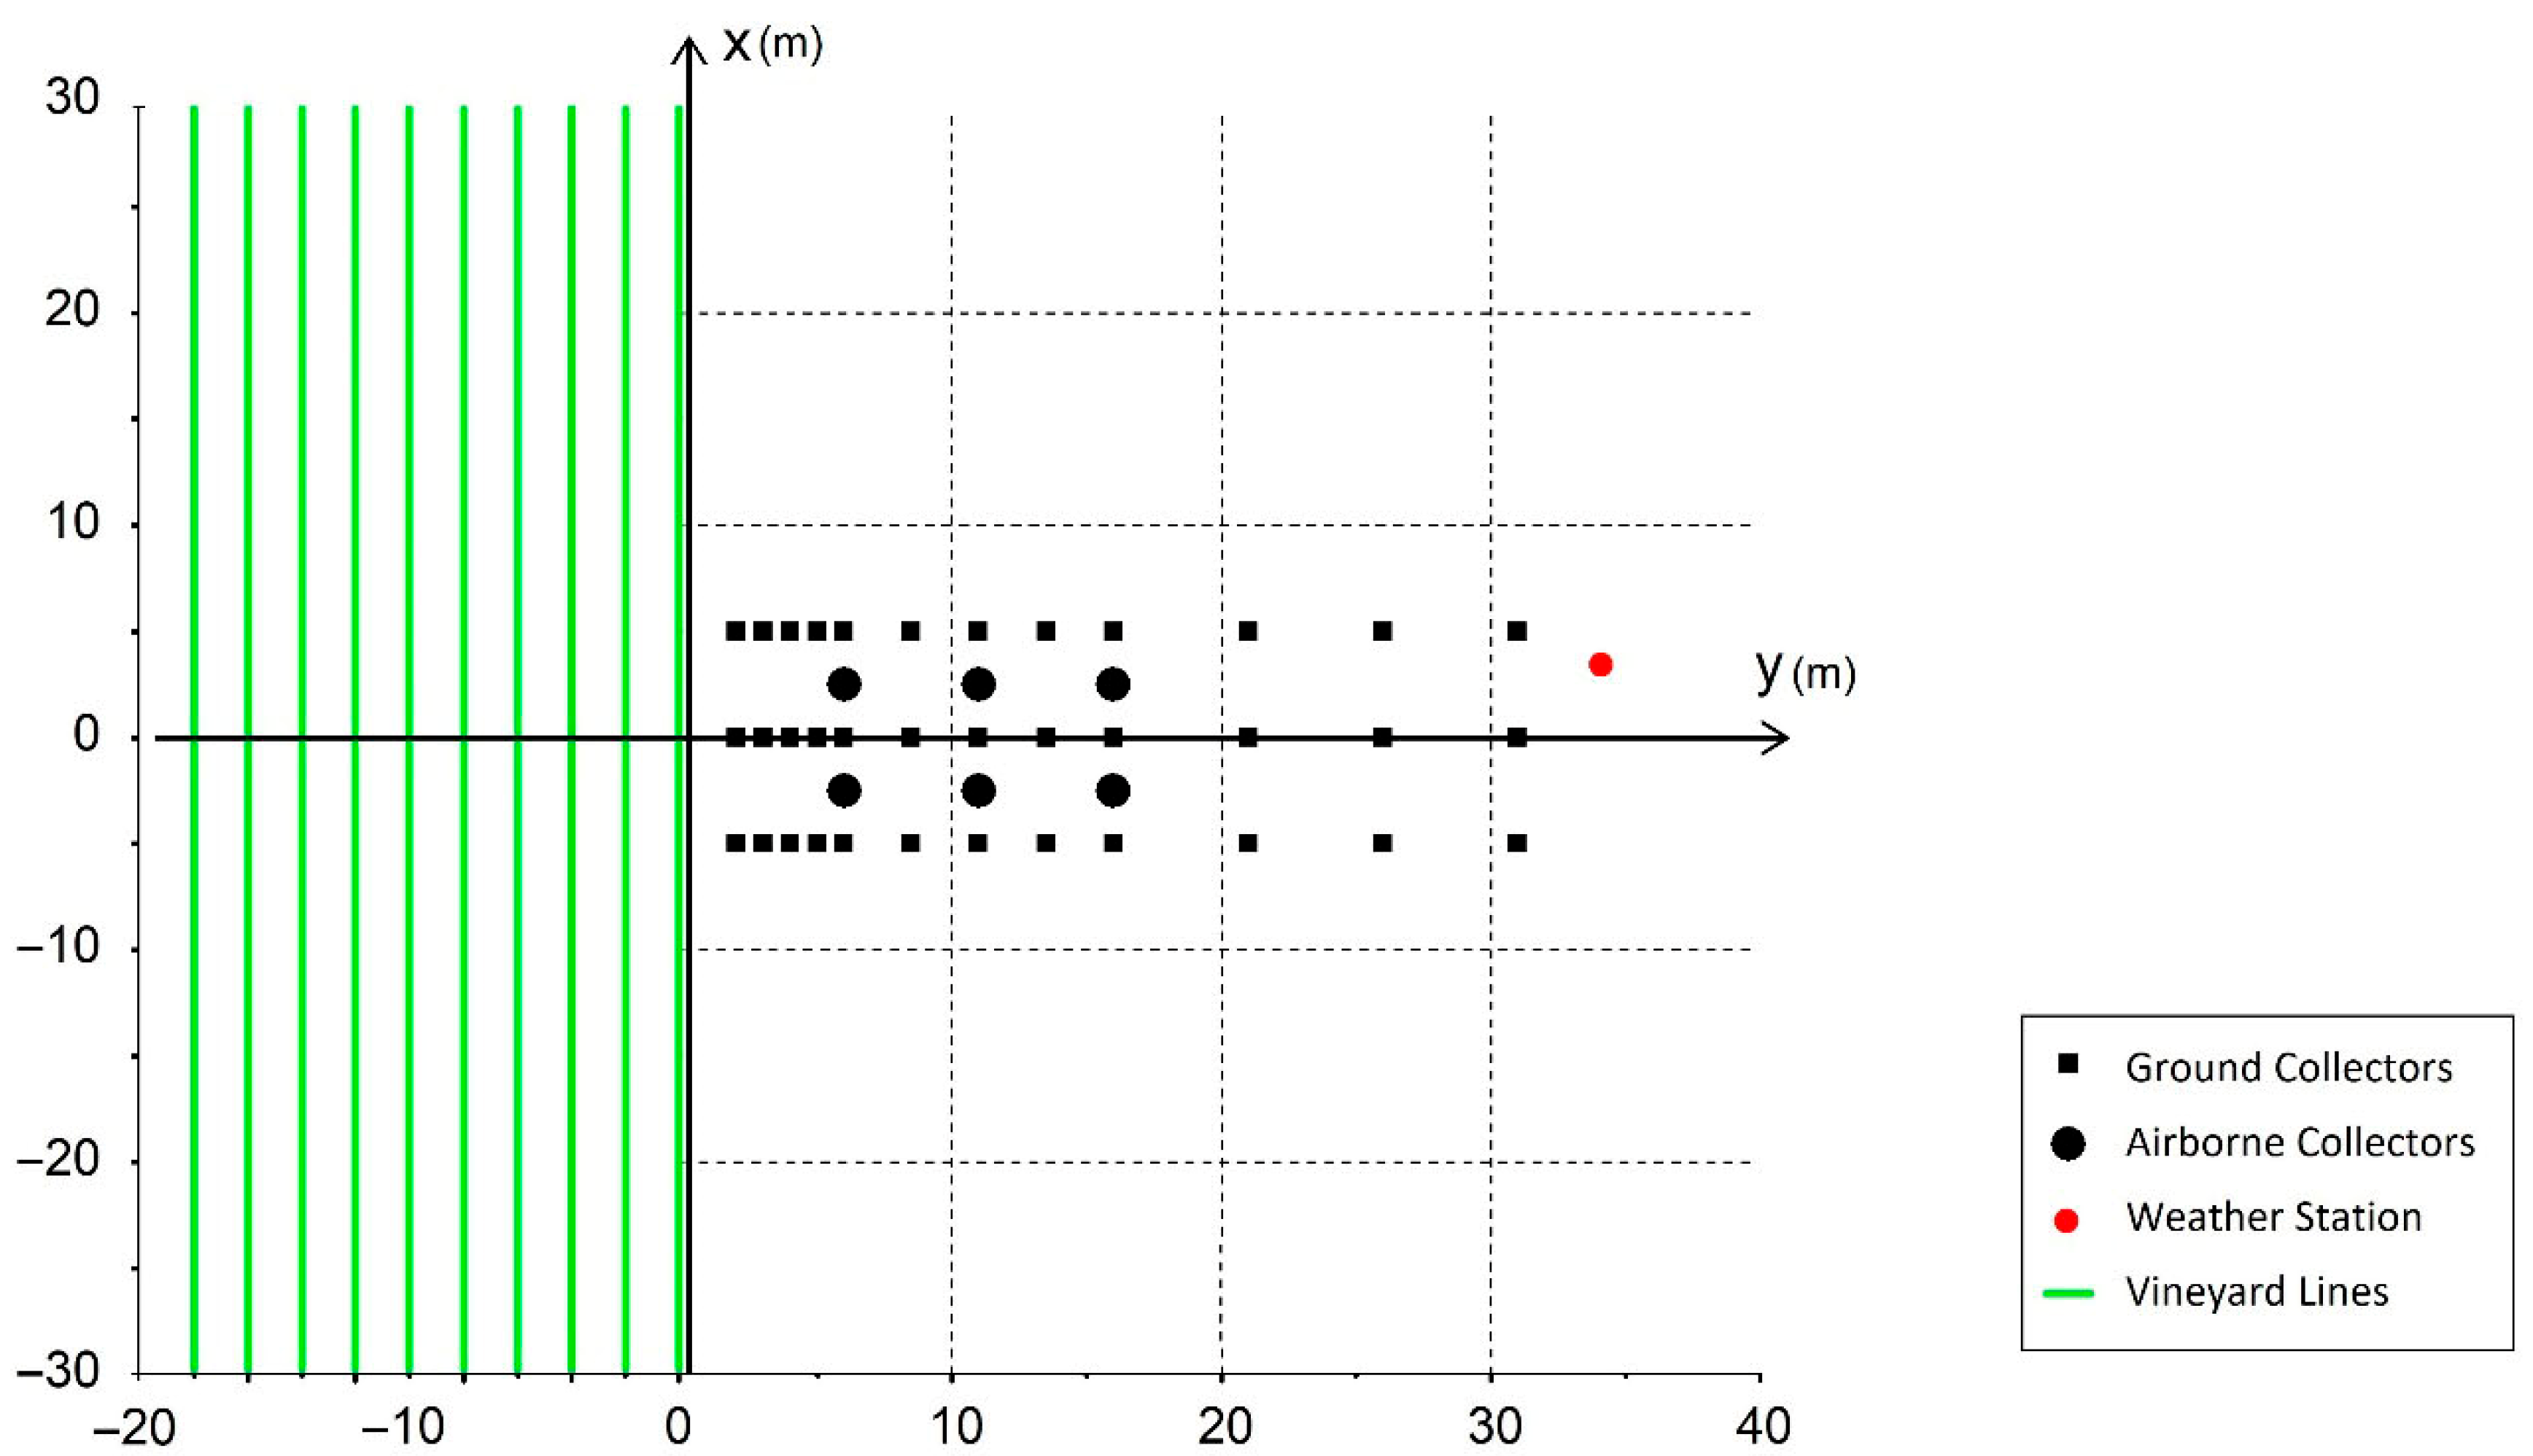
The standard ISO 22866:2005 was followed when setting up the test site [7]. Each attempt involved spraying the vineyard’s ten outside downwind rows over 60 m for the purpose of complying with ISO 22866:2005 [7], which required that the area of application must be at least twice as long as the longest downwind sampling distance and at least 20 m wide upwind of the cropped area’s edge (Figure 1).
Figure 1.
Diagram of layout of trial site.
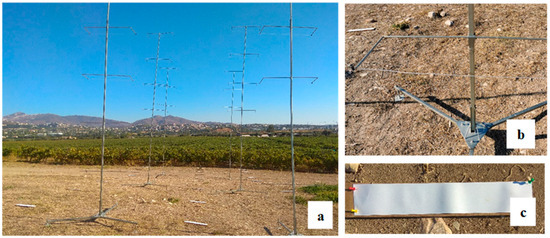
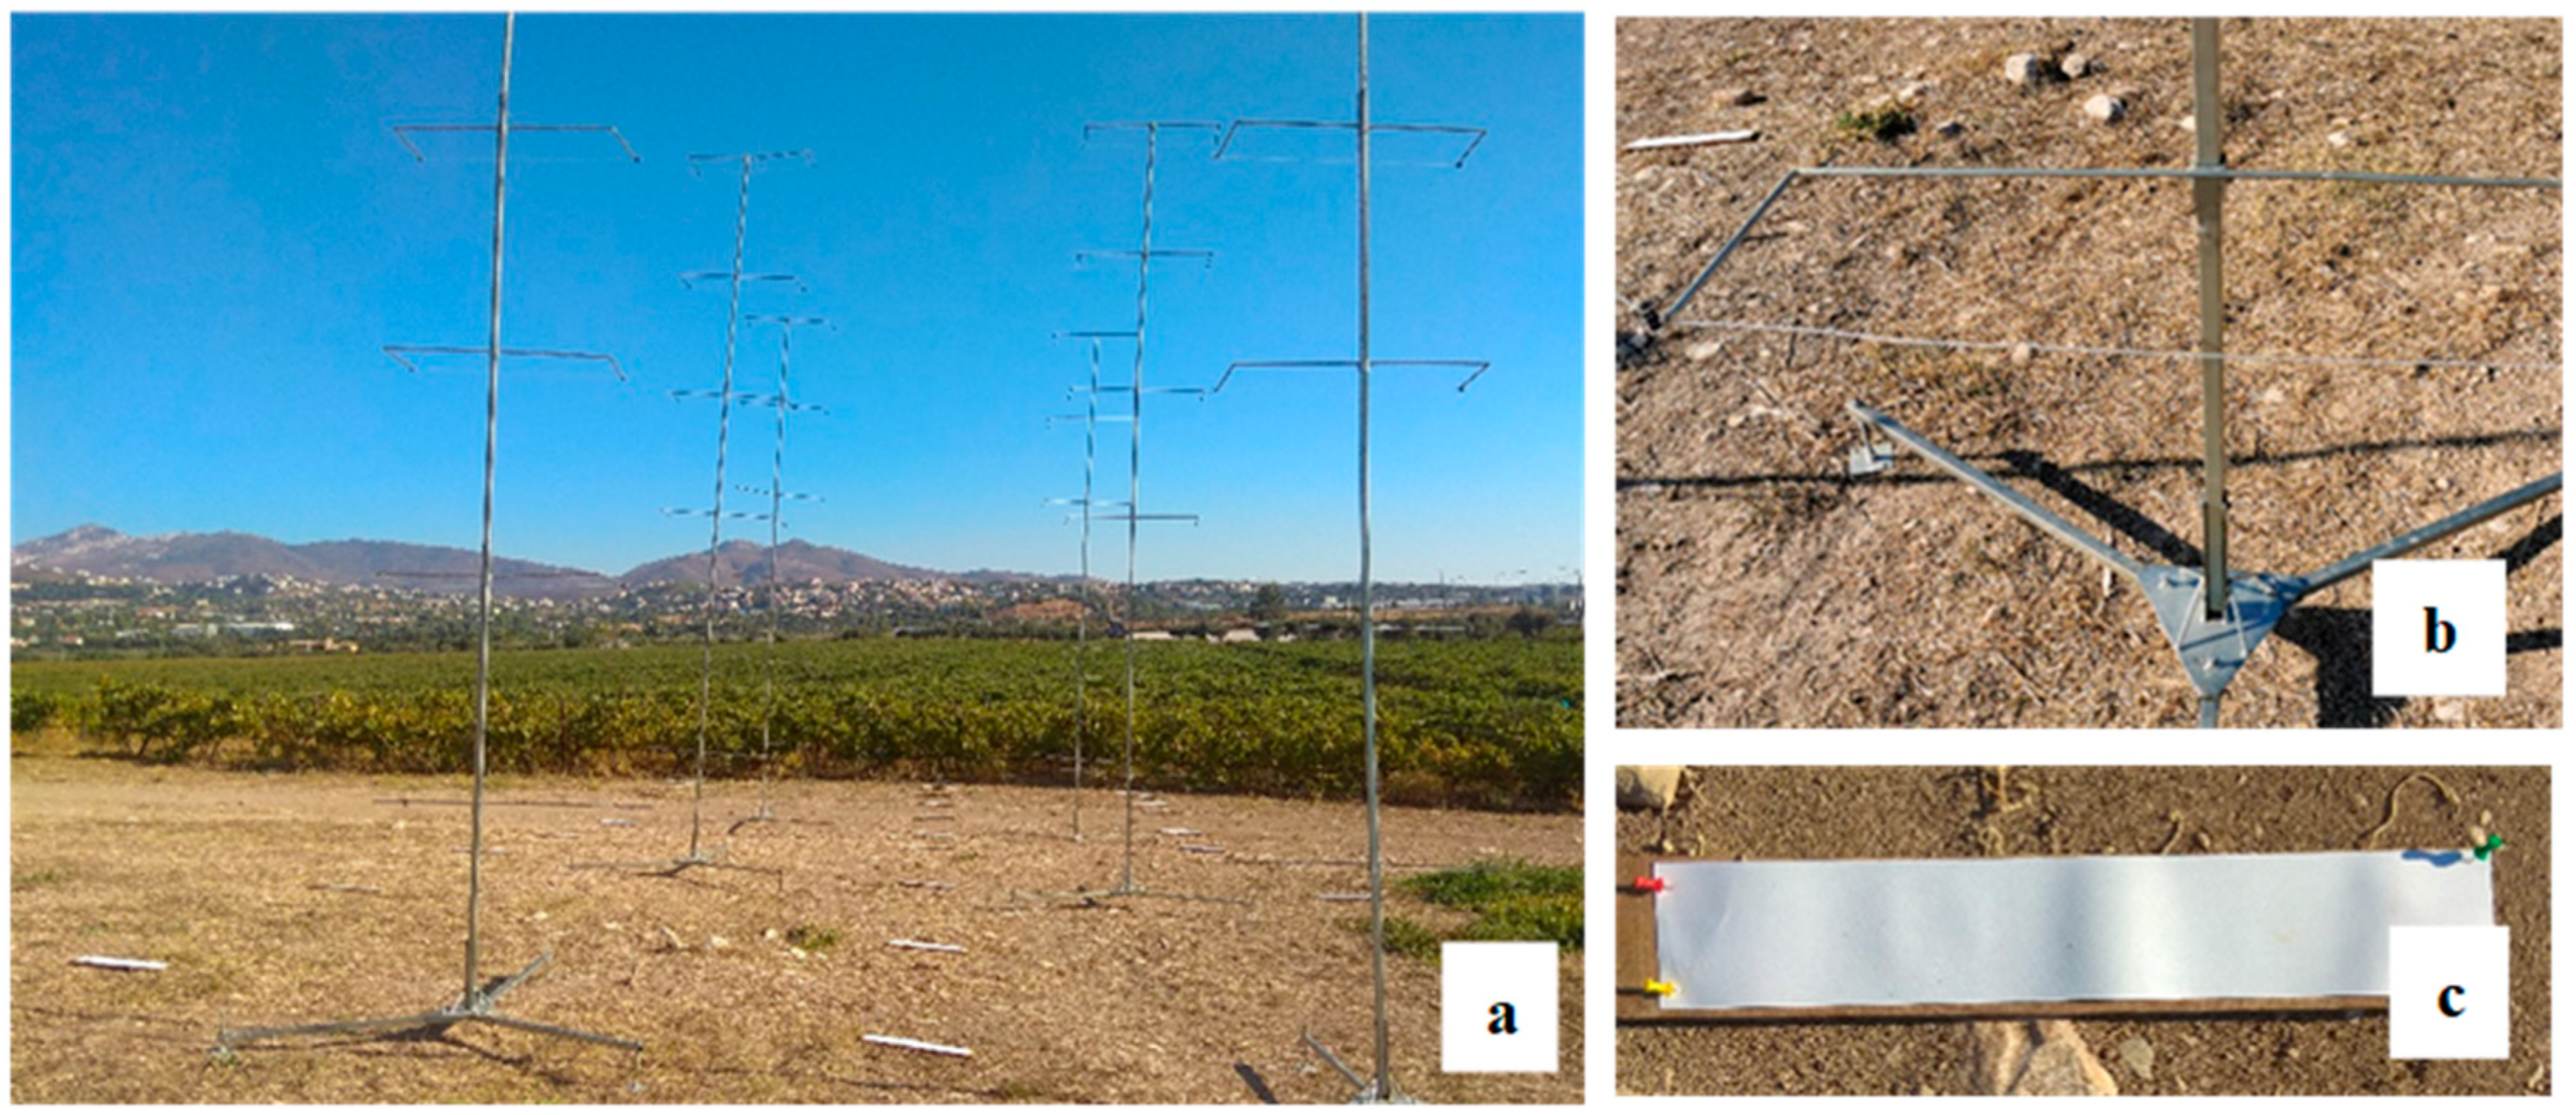
Samples of ground and airborne spray drift downwind to the immediate area of application were taken for each replicate. Ground sedimenting spray drift was sampled at 12 different sampling distances. The collectors were placed in bare soil at 1, 2, 3, 4, 5, 7.5, 10, 12.5, 15, 20, 25, and 30 m from the edge of the area of the direct application (Figure 1). The distance of 1 m (half of the row spacing) from the first plant row was considered as the beginning of the distances. At each sampling distance, three filter paper collectors (Whatman Grade 1, 46 × 8 cm) were placed (Figure 2a,c), yielding a total collector area at each distance of 1104 cm2.
Figure 2.
(a) The vineyard and sampling area; (b) airborne drift sampler (polythene line); (c) filter paper collector.
Airborne spray drift measurements were taken at 3 distances—5, 10, and 15 m—downwind from the edge of the direct area of application (Figure 1). At each sampling distance, two 6 m high poles were placed, and on each pole, 6 sampling positions were selected at 1, 2, 3, 4, 5, and 6 m height, at which airborne drift was collected using cylindrical polyethylene lines with an external diameter of 2 mm, length of 1 m, and collection area of 62.8 cm2 (Figure 2a,b). Consequently, a total sampling area of 753.6 cm2 was summarized by 12 collectors at each distance.
Following every spraying replicate, the air and ground collectors were placed in separate plastic bags and kept at a suitable temperature (approx. 4 °C) until they were analyzed in the laboratory.
2.2. Treatments, Sprayers, and Sprayer Settings
Five spraying scenarios were used to assess the potential for and mitigation of spray drift. Twenty-four experiments were performed in total to assess both sedimenting and airborne spray drift (Table 1).
Table 1.
Parameters of all treatments examined using the axial fan air-assisted sprayer Archimedes Turbo FS 1000. Treatments: A—standard two-sided application (reference treatment); B—one-sided spraying of the outer vineyard row; C—one-sided spraying of the two outer rows; D—spraying without air assistance on the outer rows; E—standard spraying using air induction nozzles.
An Archimedes Turbo FS 1000 (G. Roumeliotis, Aridaia Pellas, Greece) air-assisted sprayer for bush and tree crops was used in the trials, fitted with a 1000 L polyester tank, an axial fan (diameter 800 mm) provided with a two-speed gearbox, and equipped with 7 nozzles on each side of the sprayer. In all trials, after adjusting the spray profile to target characteristics by means of water-sensitive paper spread on the vineyard canopy and poles, a total of 6 nozzles (3 on each side of the sprayer) were activated.
Two different types of nozzles were used, one conventional hollow-cone TeeJet TXA8002VK (TeeJet Technologies, Wheaton, IL, USA), yellow signed, with nominal nozzle flow rate of 1.40 L min−1 at 1.0 MPa (in 4 treatments), and one air induction hollow-cone TeeJet TXA8002VK (TeeJet Technologies, Wheaton, IL, USA), yellow signed, with nominal nozzle flow rate of 1.46 L min−1 at 1.0 MPa (in 1 treatment). The real nozzle flow rate was measured using an electronic measuring device (AAMS-Salvarani BVBA, Maldegem, Belgium) and was closest to the nominal one.
For all tests, the spraying pressure was 1.0 MPa, forward speed was 1.61 m s−1 (5.8 km h−1), and volume application rate was 434 L ha−1 for TXA8002VK nozzles and 453 L ha−1 for AITXA8002VK nozzles. In all tests, the PTO revolution speed was 56.55 rad s−1 (540 rev min−1), fan speed was 169.65 rad s−1 (1620 rev min−1) (fan ratio 1:3), and fan airflow rate was measured using a measuring tunnel (AAMS-Salvarani BVBA, Maldegem, Belgium) at 10,000 m3 h−1.
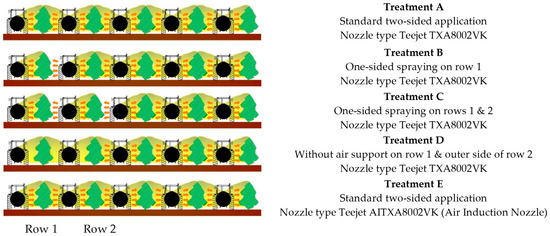
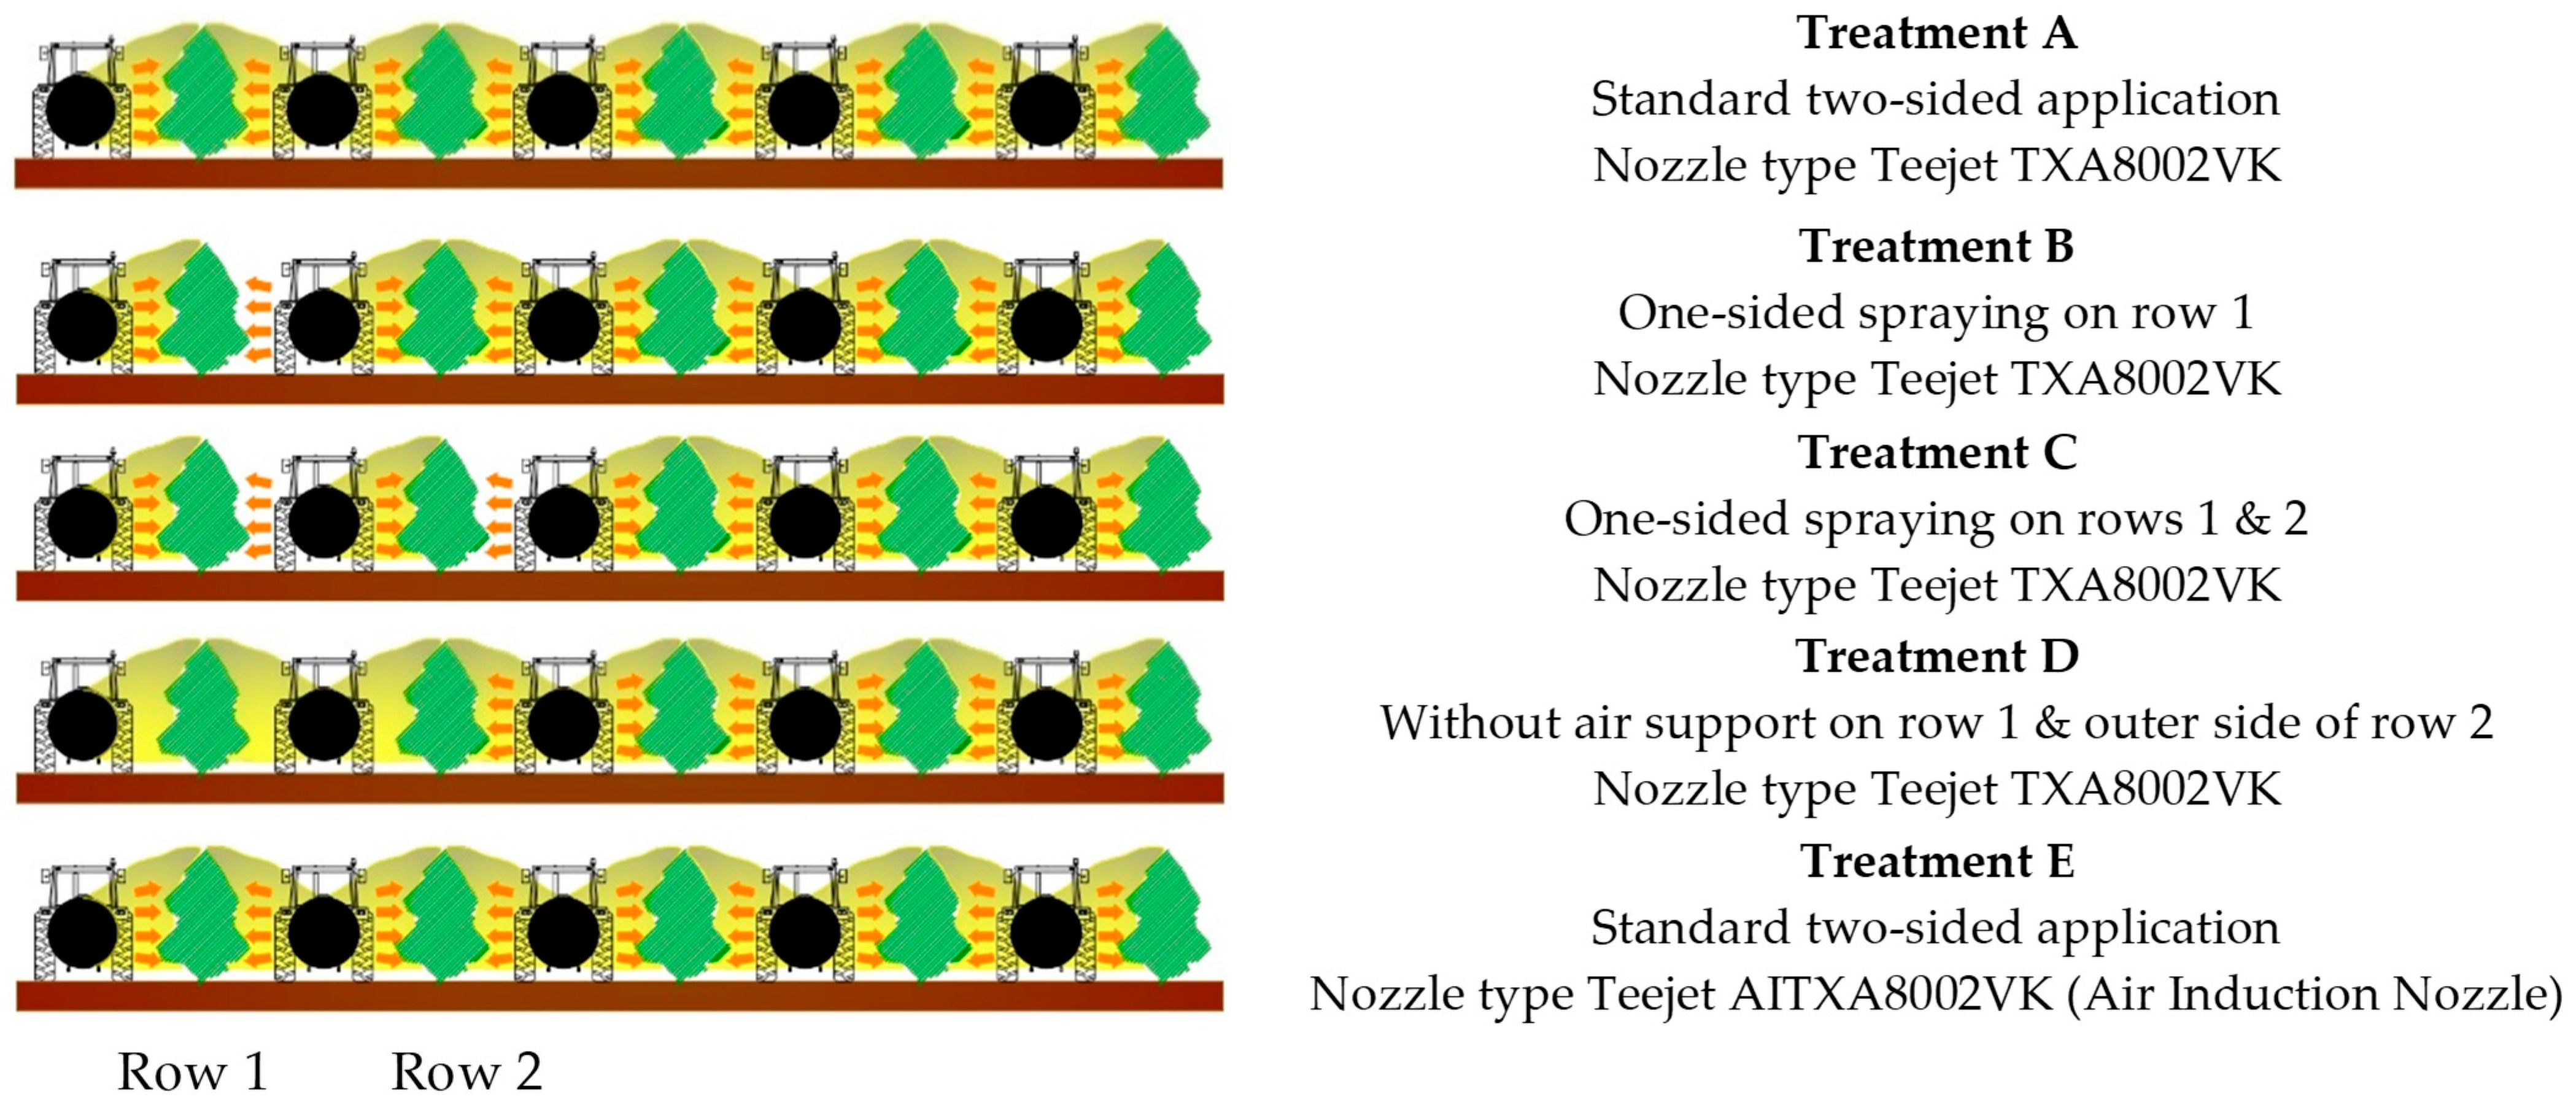
The five treatments tested in the vineyard are shown in Figure 3, and Table 1 provides an overview of them. In the five spray scenarios examined, various spray drift mitigation measures were examined due to immediate adjustment of the sprayer (Treatment B, C, and D) and improved equipment (Treatment E).
Figure 3.
Application scenarios for Treatments A–E. The arrows indicate the direction of spraying, while their presence denotes air-assisted application (i.e., the sprayer fan is activated). Treatments include standard two-sided spraying (A, E), one-sided spraying (B, C), and spraying without air assistance on selected rows (D).
Treatment A used six conventional hollow-cone nozzles (TeeJet TXA8002VK, TeeJet Technologies, Wheaton, IL, USA) and conventional spraying was applied; namely, all rows of vines were sprayed and blown on both sides. Treatment A was selected as the reference spraying, and six replicates were performed.
In Treatment B, the same nozzles were used as in Treatment A, and all rows of vines were blown on both sides; however, the first row of the vineyard was sprayed on one side, that is, on the external path and on the first path, spraying one side of the nozzles operated to the direction of the vineyard. In total, four Treatments B were applied.
In Treatment C, the same nozzles were used as in Treatment A, and all rows of vines were blown on both sides, but the first and second rows of the vineyard were sprayed on one side, i.e., on the outer passage. In the first passage’s spraying and in the second passage’s spraying, one side of the nozzles was working in the direction of the vineyard. In Treatment C, four replications were performed.
Treatment D employed the same nozzles as Treatment A, and the spray application was carried out on both sides of all vine rows. In this treatment, the fan did not operate on the outer path or on the first spray path, which means that the first row of vines and the outer side of the second row were sprayed without air support. On the first and second rows of the vineyard, it was desirable for the fan to blow the air on one side of the row only, but the sprayer did not have this setting. In Treatment D, five replicates were performed.
Treatment E used six air induction hollow-cone nozzles (TeeJet AITXA8002VK, TeeJet Technologies, Wheaton, IL, USA), and conventional spraying was applied; namely, all rows of vines were sprayed and blown on both sides. There were five replicates.
It is possible that in Treatments B, C, and D, depending on the crop protection needs, losses in efficacy can result due to less intense penetration and coverage. In this study, this issue was not taken into account, and only the possible reduction of the spray drift was considered.
Treatment A was used as the reference spraying method, and therefore, a slightly higher number of replicates was performed in order to provide a robust baseline for comparison with the drift mitigation treatments. The different number of replicates among treatments resulted from practical constraints related to field experimentation and the requirement to conduct trials under meteorological conditions compliant with ISO 22866:2005.
2.3. Spray Liquid and Determination of Spray Drift
A yellow dye tracer, E-102 Tartrazine 85% (w/w), was mixed with the spray liquid (water) at a concentration of approximately 4 g L−1 [56,57].
The solution was thoroughly mixed before each spraying, and two samples of the spray liquid were taken directly from a nozzle before and after the spraying process to determine the exact concentration of Tartrazine in the spray liquid in each test. Before every test, an empty sample of filter paper was placed in the area of application and collected right before the sprayer was turned on.
The spray deposits were extracted from the artificial collectors using a certain volume of deionized water in the laboratory and were quantified by analyzing the obtained liquid by means of a spectrophotometer Shimadzu UV-1800 (Shimadzu Corp., Kyoto, Japan) set to a 426 nm wavelength.
The quantity of spray application for each unit area was determined according to ISO 22866:2005 [7], where the collector is projected to detect spray drift is as follows:
where
driftdep is the sedimenting of spray drift in μL cm−2; ρsmpl is the spectrophotometer measurement of the sample (Abs), ρblk is the spectrophotometer measurement of the blanks (collector + deionized water) (Abs), Fcal is the calibration parameter in μg L−1, Vdil is the volume of dilution liquid used to solute tracer from collector in l, ρspray is the spray concentration of tracer in g L−1, and Acol is the projected collector’s area for catching the spray drift in cm2.
The percentage of spray drift on a collector can be calculated by relating spray drift deposition to the amount applied in the field on the same unit of area with the following formula:
where
βv is the spray application volume in liters per hectare (L ha−1), which is provided by the following equation:
where
total nozzle flow rate is the number of nozzles used multiplied by the nozzle nominal flow rate in L min−1, row spacing is the distance between lines in m, velocity is the velocity of the tractor in km h−1, time = 60 min, and area = 10,000 m2.
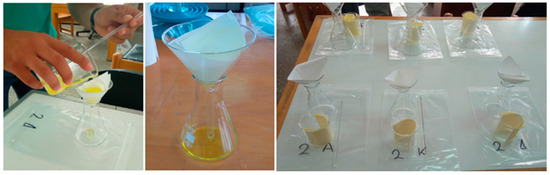
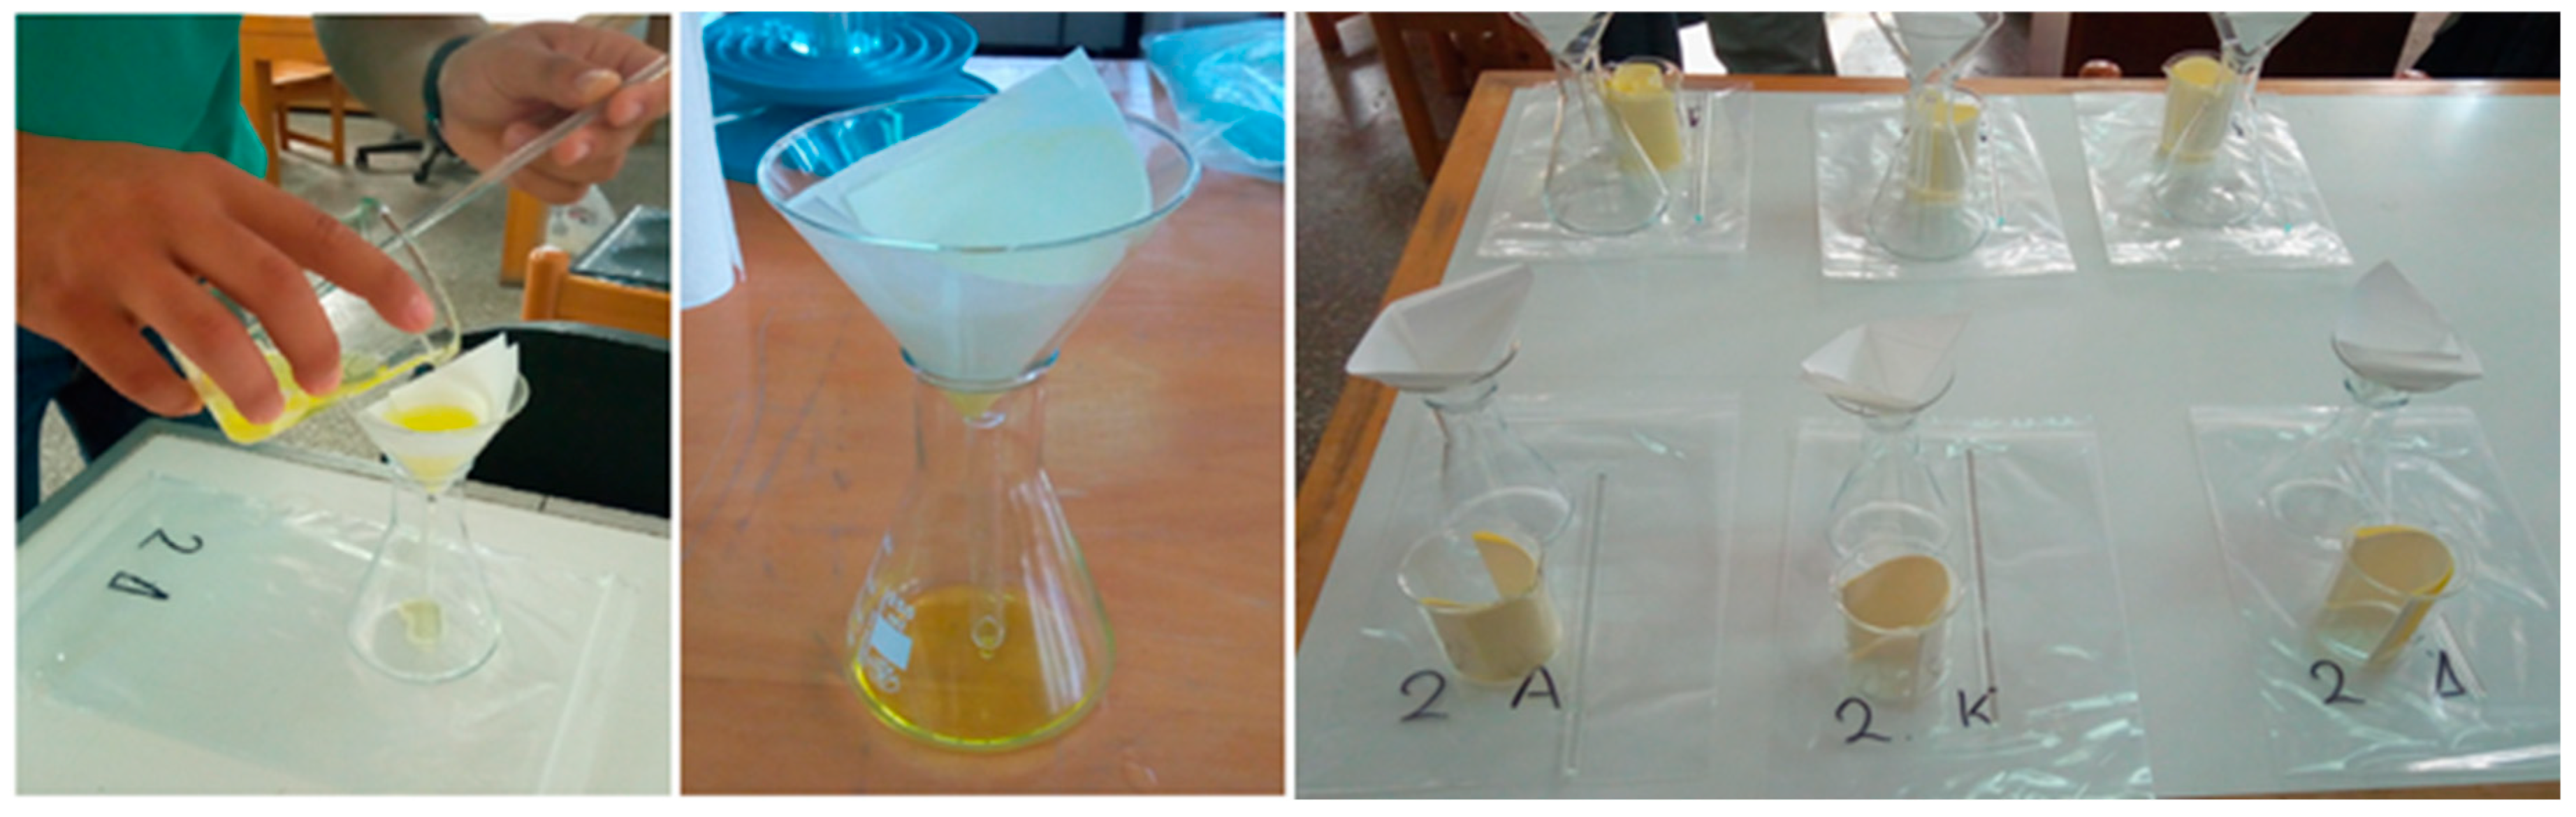
The mean of the readings obtained from the three samples (Figure 4) placed at each downwind distance was computed for drift ground sedimenting after the tracer amount on each collector was measured. For each of the three sampled downwind distances (5, 10, and 15 m from the area of application), the mean tracer quantity obtained from the two samples positioned at each sampling height above the ground was determined independently for airborne drift.
Figure 4.
Laboratory procedure for extracting the tracer dye (Tartrazine) from spray drift collectors prior to concentration measurement and calculation of drift percentage.
2.4. Drift Value and Drift Reduction Calculation
The drift value (DV) for every replicate was calculated by the numerical integral of the spray drift curves obtained [58]. A good approximate method for calculating the definite integral is as follows:
- -
- Division of the interval [a, b] into n equal intervals of width:
h is equal to 0.5 m; a correspond to 0.75 m distance from the area of application and to 0.75 m height above the ground for ground and airborne drift curves, respectively; and b corresponds to 30.25 m distance from the area of application and to 6.25 m height over the ground, respectively.
- -
- Calculation of the midpoint value x1, x2…xn of the equal h width intervals, which is included in intervals [a, b];
- -
- Calculation of the sum of the rectangles’ surface:
Sn is the sum of rectangles’ areas; h is the rectangles’ base; and f(x1), f(x2)…f(xn) are the rectangles’ heights.
The percentage of drift reduction in comparison to the reference spraying (RS) (Treatment A) is used to describe the overall drift reduction achieved for various vineyard treatments (other sprayings) (OS). These percentages are computed using drift values (DVs), as prescribed by ISO 22369-1:2006 [59] using the following formula:
where
dred is the drift reduction in %, dRS is DV of the reference spraying (unitless), and dOS is the DV of the other sprayings (dimensionless).
Comparable specific zone reductions in relation to the citation curve of spray drift were computed concurrently with the overall drift reduction. To illustrate each zone’s proportionate contribution to overall drift decrease, six distinct zones along the drift curve (1–5, 5–10, 10–15, 15–20, 20–25, and 25–30 m from the area of application) for ground drift curves and five distinct zones (1–2, 2–3, 3–4, 4–5, and 5–6 m height above the ground) for airborne drift curves were measured.
2.5. Meteorological Conditions During Tests
A portable meteorological station was placed in the middle of the sample area, 30 m from the area of application, near the edge of the downwind area, to measure the environmental conditions during the trials. Two thermo-hygrometer probes Rotronic HC2A-S3 (Rotronic AG, Bassersdorf, Switzerland) were positioned at two different heights (2 m and 3 m above the ground) to measure air temperature and relative humidity, and an ultrasonic anemometer (Campbell Scientific WindSonic1 Gill 2D, Logan, UT, USA) was installed at a distance of 3 m above the ground to estimate wind speed and wind direction. A data logger Campbell Scientific CR850 (Campbell Scientific, Logan, UT, USA) automatically recorded all readings at a frequency sampling rate of 1 Hz.
To confirm that the ambient conditions meet the ISO 22866:2005 [7] standard for ideal circumstances for field measurement of spray drift, the criteria listed below were calculated for each trial: (a) the percentage of wind speed measurements that are less than 1 m s−1 (must be less than 10%); (b) the mean wind direction must be at 90° ± 30° to the spray track (in this experiment, between 0° and 60°), with no more than 30% of results being > 90° ± 45° to the spray track; and (c) the mean temperature must be between 5 °C and 35 °C.
2.6. Data Analysis
The statistical analysis was conducted with STATGRAPHICS Centurion XVI Version 16.1.15 (Statgraphics Technologies, Inc., The Plains, VA, USA) software for Windows. The impact of each treatment and distance from the sprayed region on the sedimenting drift was evaluated using two-way analysis of variance (ANOVA). Three-way ANOVA was used to assess airborne drift, taking into account treatment, height above the ground, and distance from the sprayed region. Before the analyses, data were examined for regularity and homoscedasticity using Shapiro–Wilk [60] and Levene tests [61], respectively, and were log-transformed. Tukey’s Honestly Significant Difference (HSD) test was used for multiple comparisons of means in cases of significant differences [62]. Additionally, the link between the normalized sedimenting and airborne drift and the distance from the sprayed location and height above the ground was examined using Pearson’s linear correlation coefficients [63]. For every test, a p-value of less than 0.05 was deemed statistically significant. Finally, the mean drift values (DVs) of ground and airborne spray drifts for each treatment were calculated, as well as the drift reduction (%), considering Treatment A as a reference, using non-transformed data.
3. Results and Discussion
3.1. Meteorological Measurements During Trials
Despite the fact that it is common knowledge that field experiments utilizing various spray systems cannot be carried out under equivalent and recurring conditions [64], nevertheless, the meteorological conditions during all tests were monitored (Table 2) to ensure the limitations set in ISO 22866:2005 were met [7]. Although some variability between trials was observed, all measurements remained within the acceptable ranges defined by the standard, allowing reliable comparisons among treatments.
Table 2.
Meteorological conditions recorded during trials. Treatments A–E correspond to the spray scenarios described in Table 1.
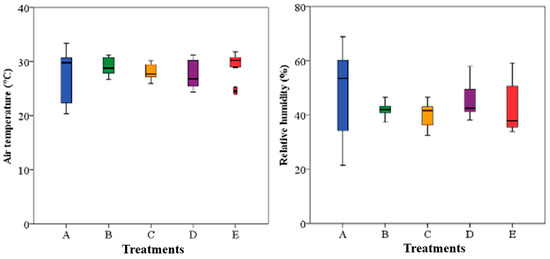
During trials, the mean temperature differed from 20.71 °C to 32.60 °C, and the range of relative humidity was between 23.75% and 67.17%. The maximum differences (Δ) in air temperature and relative humidity measured for the two heights (2 m and 3 m from ground) were 0.38 °C and 0.56%, respectively. The boxplots of all temperature and relative humidity measurements are shown in Figure 5.
Figure 5.
Boxplots of all air temperature and relative humidity measurements. Treatments A–E correspond to the spray scenarios described in Table 1. Red dots indicate individual outlier observations.
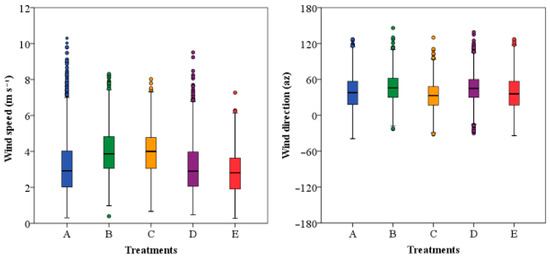
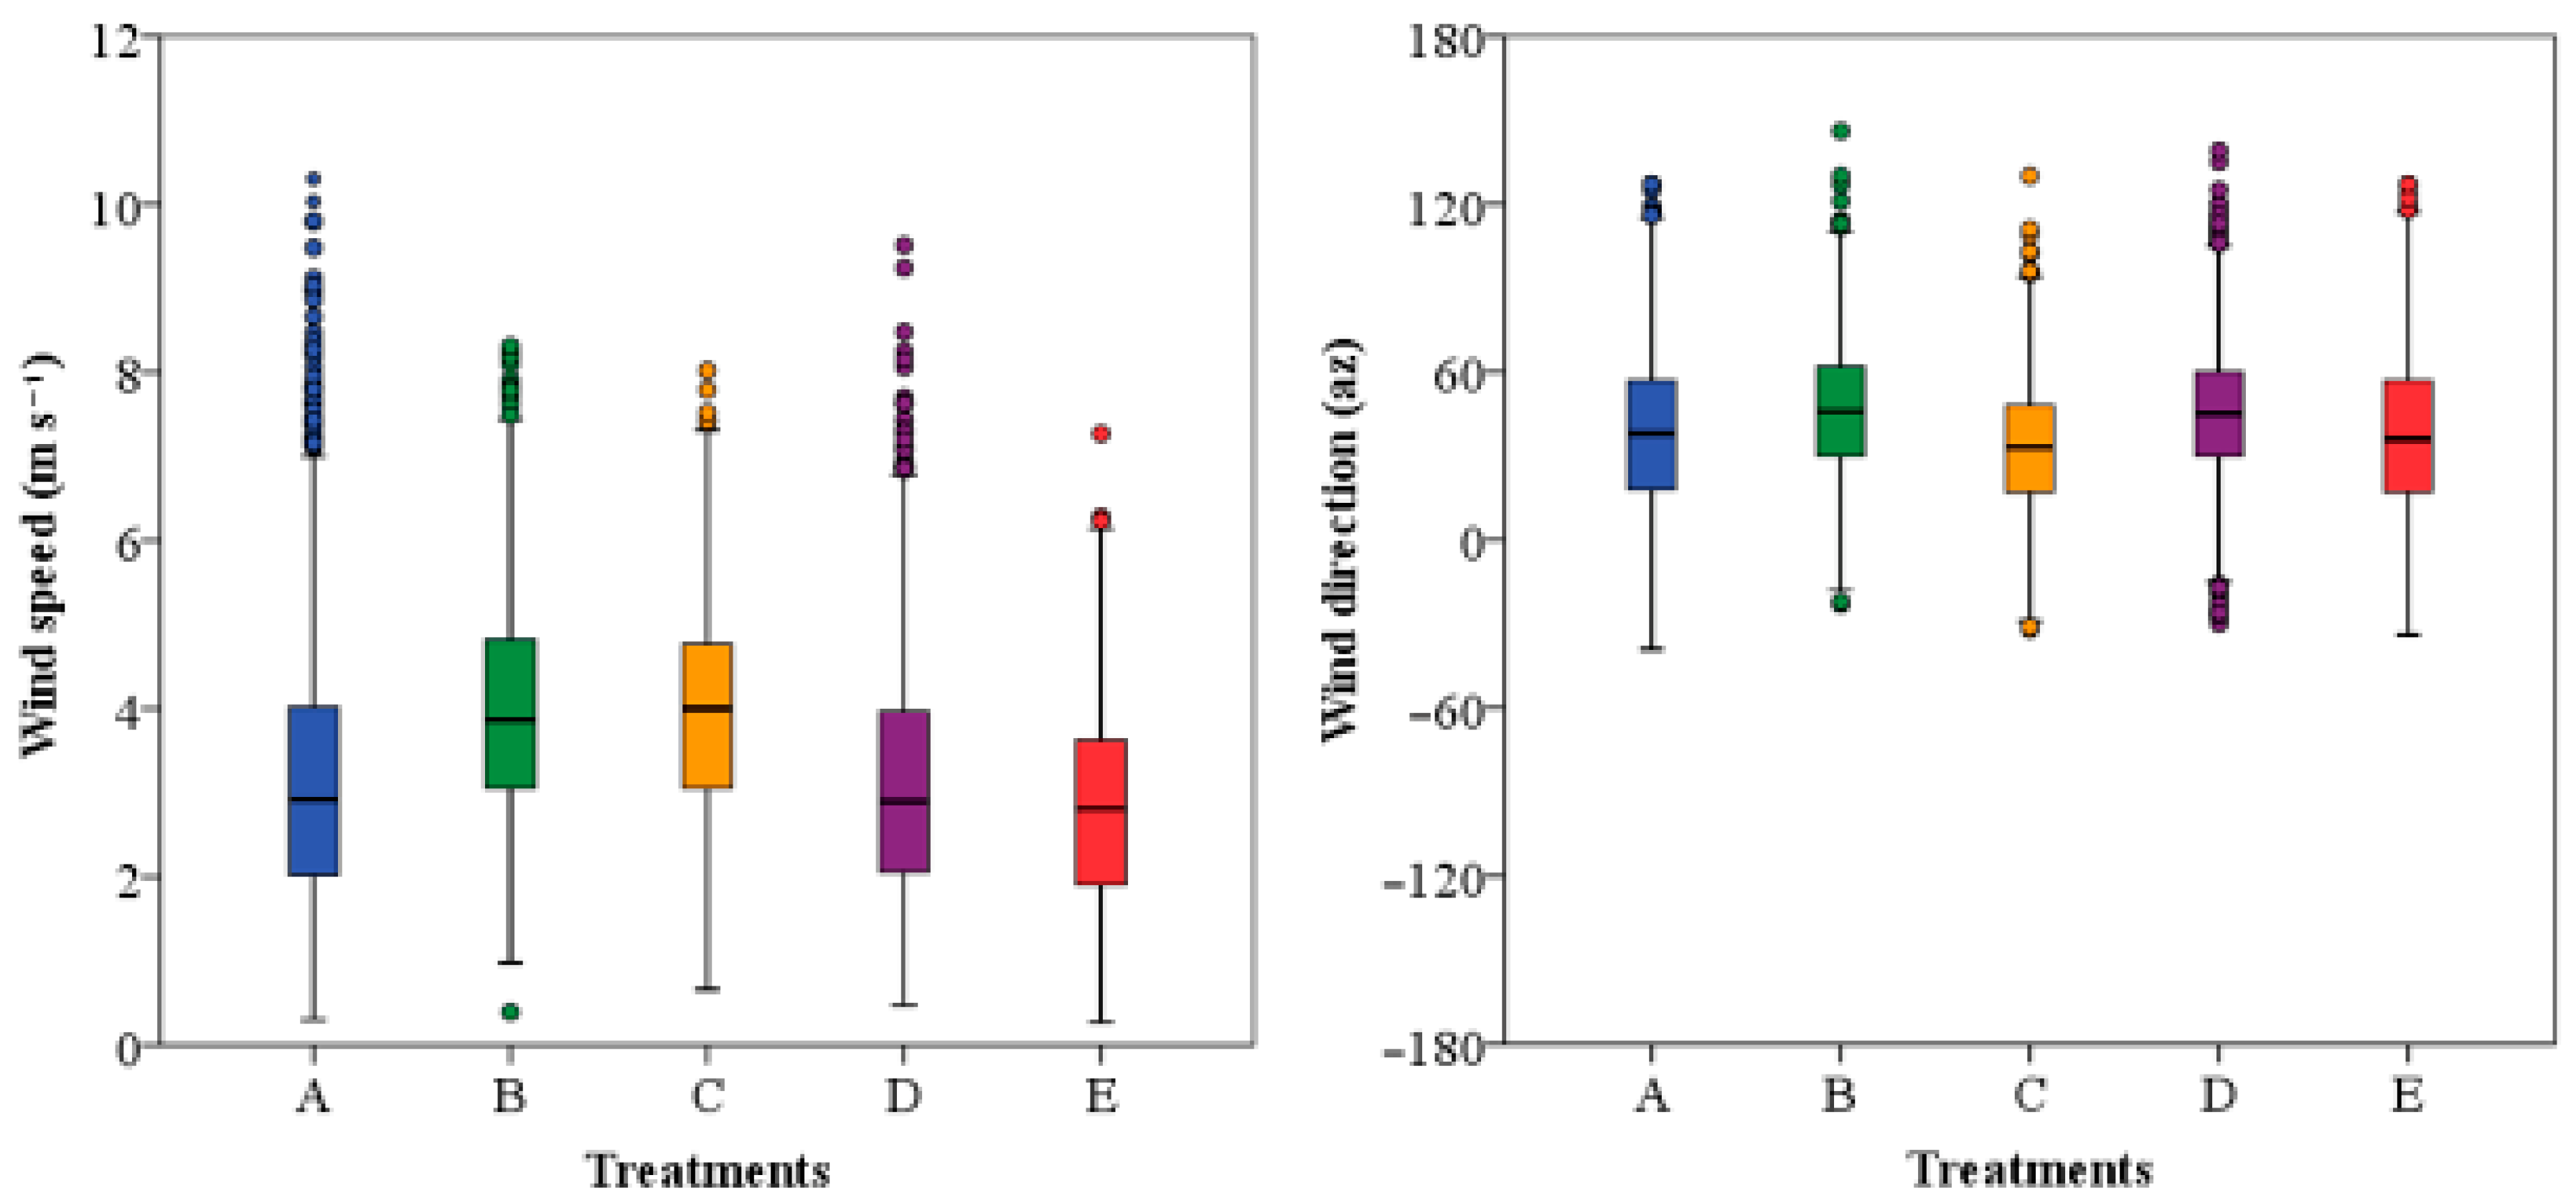
All trials were carried out with a mean wind speed greater than 1 m/s, as indicated in the standard protocol (minimum 1.74 m s−1 and maximum 5.09 m s−1). Additionally, the mean wind direction was from 12.86° to 59.97° (ideal direction was 30° ± 30°), as shown in Figure 6.
Figure 6.
Boxplots of all wind speed and wind direction measurements. Treatments A–E correspond to the spray scenarios described in Table 1. Colored dots indicate individual outlier observations.
3.2. Sedimenting Spray Drift
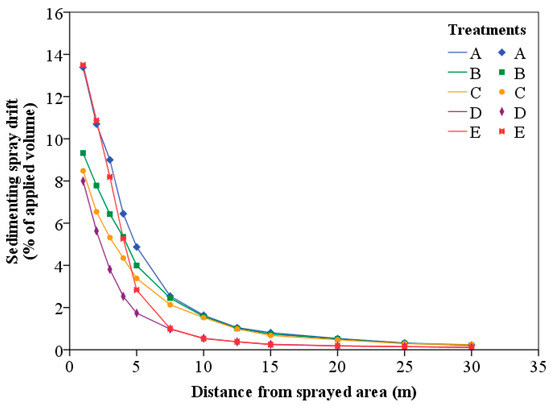
The spray drift deposits (% of applied volume) on ground collectors measured at various distances downwind of the sprayed zone for the mean values of all replicates for each treatment are presented in Table 3, and the mean data curves are shown in Figure 7.
Table 3.
Sedimenting deposit (% of sprayed volume) at various distances downwind of the area of application for all treatments. Treatments A–E correspond to the spray scenarios described in Table 1.
Figure 7.
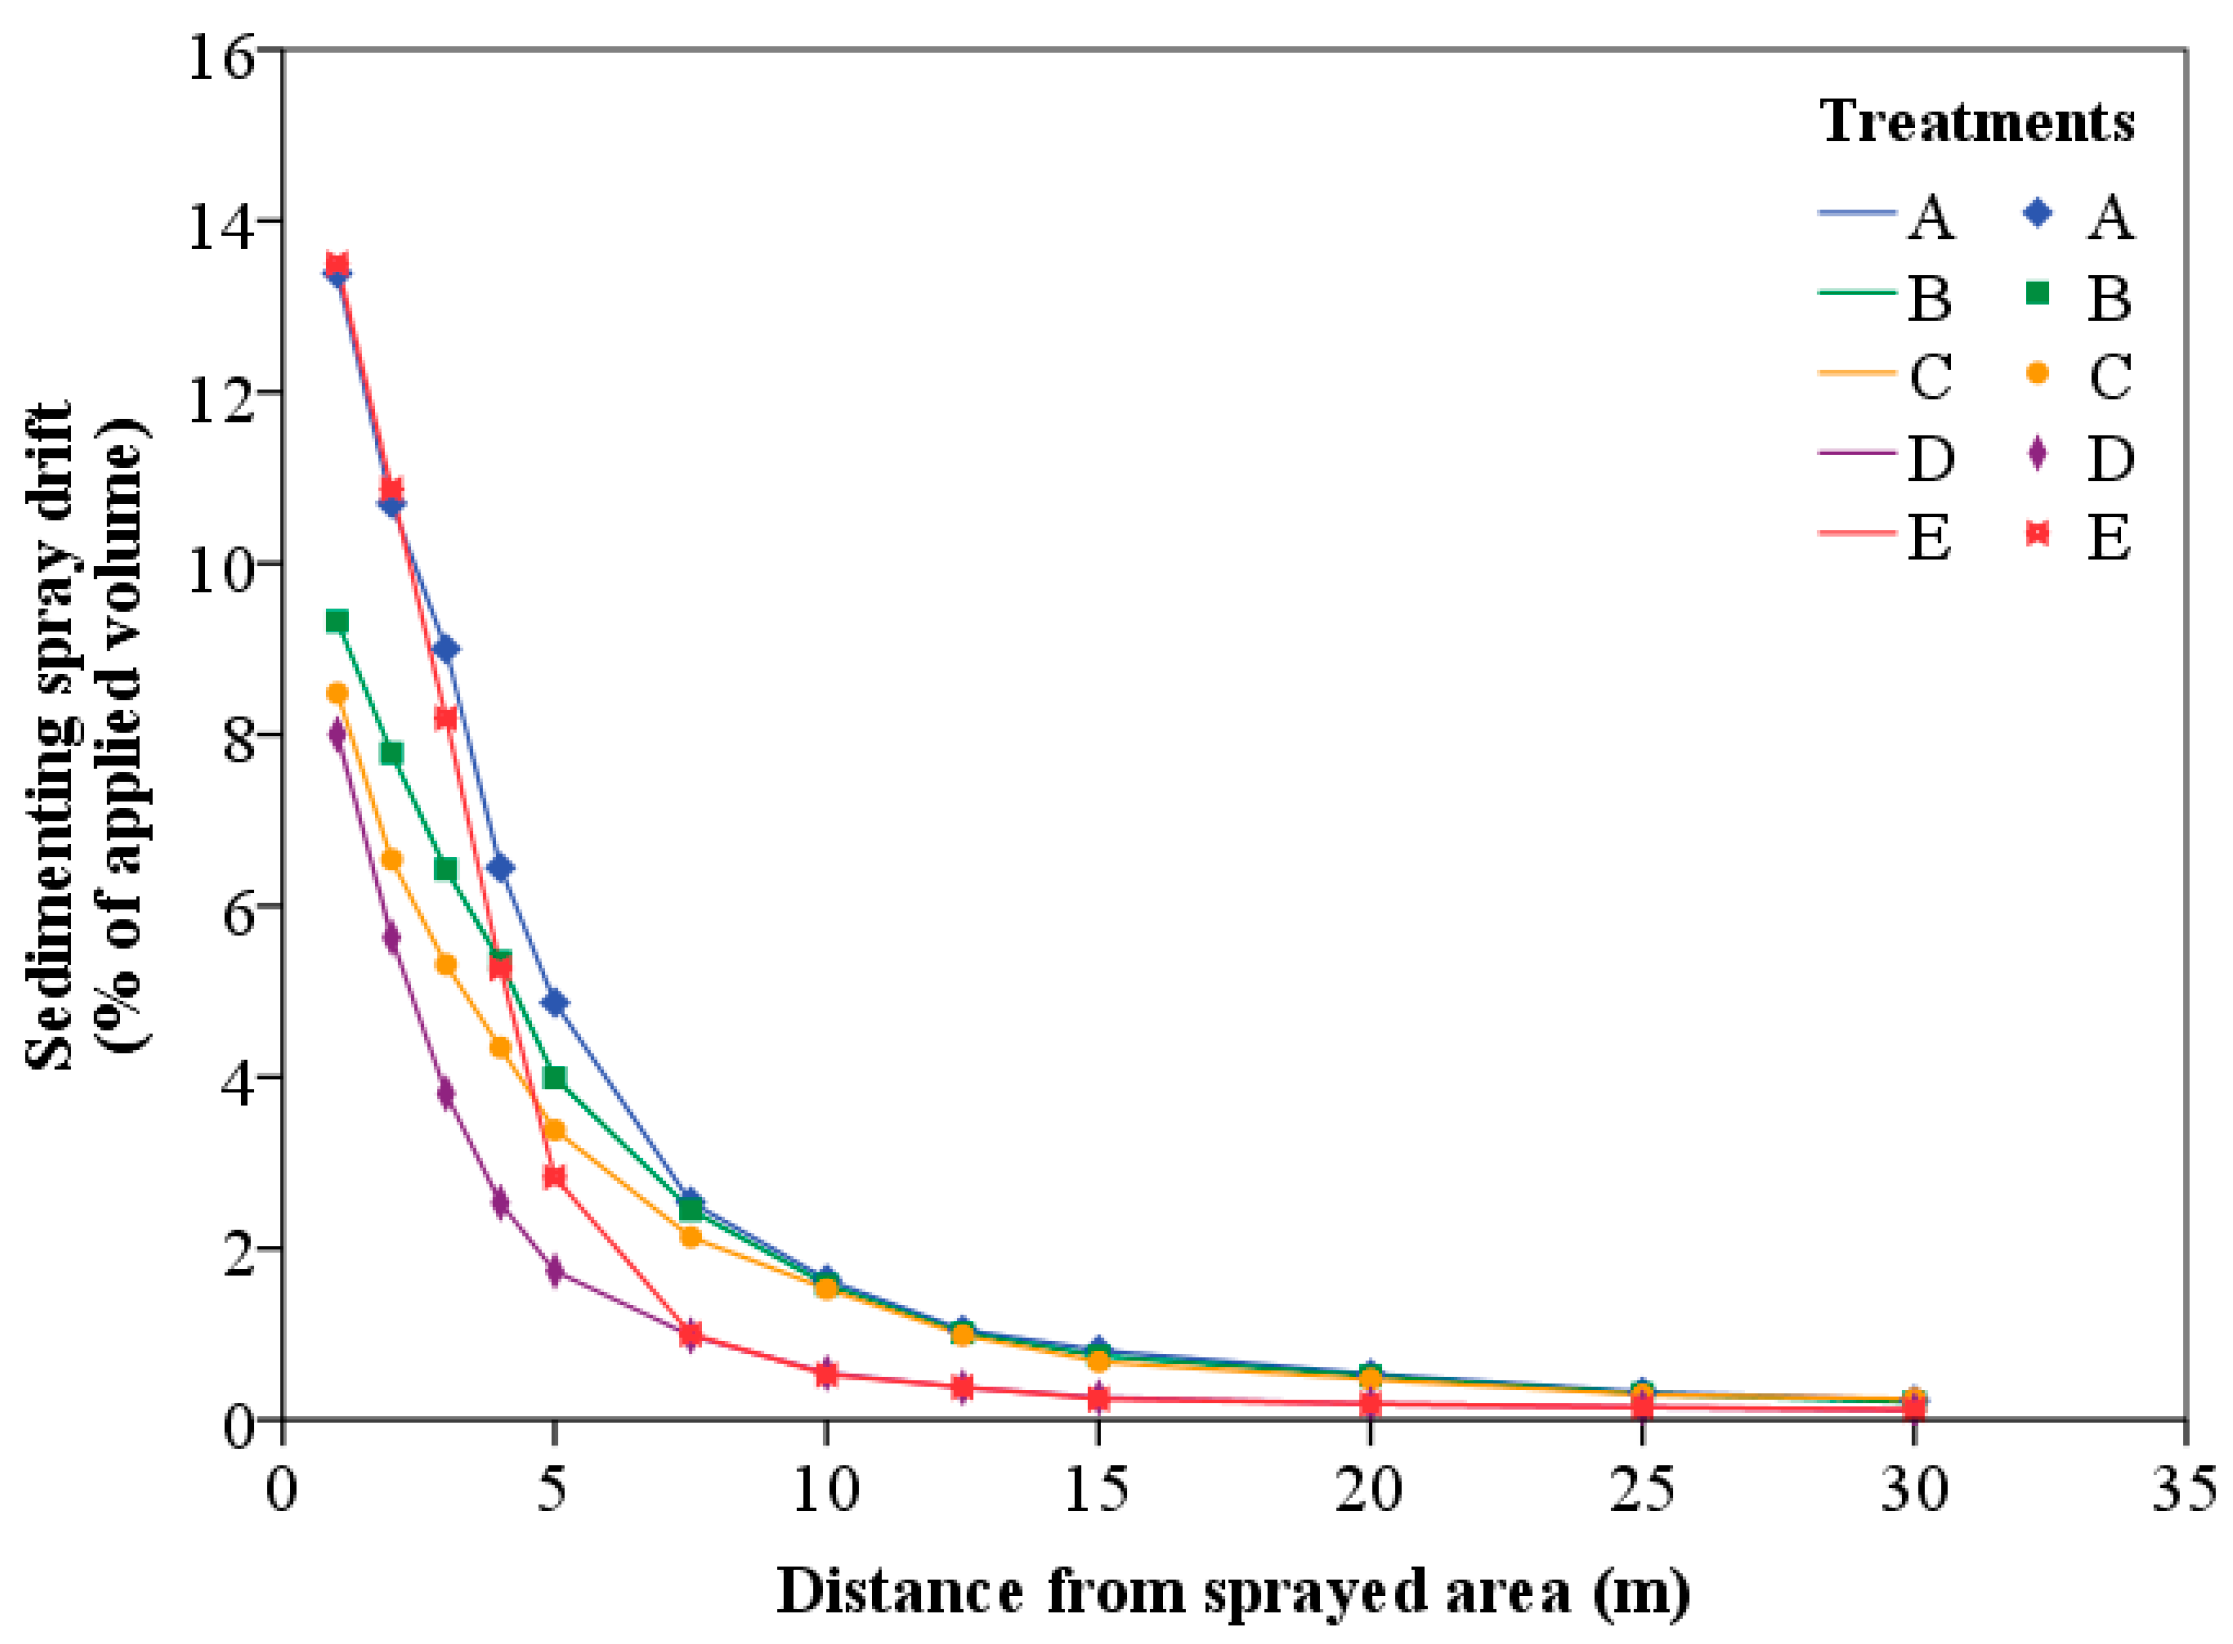
Sedimenting deposit (% of sprayed volume) at multiple distances downwind of the area of application for five treatments. Curves show mean values of replicates of each treatment. Treatments A–E correspond to the spray scenarios described in Table 1.
A considerable quantity of ground residue was observed at all sampling distances. The drift curves revealed a progressive decrease in ground sedimenting with increasing distance from the final vineyard row, with the rate of drop varying across the five treatments. Higher deposition was detected in the first few meters of the downwind area in all treatments. Similar results have been found in vineyard and orchard experiments by other researchers [39,40,65].
It is obvious that different levels of sedimenting drift over distance were caused by each of the five treatments. Treatments B, C, D, and E produced lower spray drift compared to Treatment A at all distances, which was considered a reference. An exception is the use of air induction nozzles (Treatment E), which produced a greater amount of sedimenting drift in the first 2 m from the edge of the vineyard compared to conventional spraying with conventional hollow-cone nozzles (Treatment A). Generally, during Treatment E, high amounts of spray drift appeared in the first 4 m, and after 5 m, the reduction of spray drift was very large, similar to that of Treatment D.
It is clear that the air induction nozzles reduce ground deposition in a considerable way. However, air induction nozzles produce coarse droplets, and the level of reduction in coarse droplet displacement is closely related to the measuring points. At the initial distances, the sedimenting deposits could be due to direct spraying and not only to drift dragged by the wind. This effect could be more important for air induction nozzles, as coarse droplets have ballistic behavior. As a result, the drift-reducing impact is minimal or nonexistent and close to the margins of the orchard and vineyard, as also found by Heijne et al. [66].
It is also apparent that Treatment D (spraying without air support on row 1 and the outer side of row 2) generated the lowest amounts of sedimenting drift at almost all distances, showing the major effect of air on spray drift. When Treatment D and Treatment E were applied, 1% of the applied volume was represented by a spray drift deposition, at approximately 7.5 m from the spray area, while when Treatment A (standard two-sided application), Treatment B (one-sided spraying on row 1), and Treatment C (one-sided spraying on rows 1 and 2) were applied, the same percentage of drift deposit (1% of the applied volume) was estimated at a distance of about 12.5 m (Figure 7).
For sedimenting drift on ground collectors, the two-way ANOVA test indicated a statistically highly significant effect of the treatment and the collector’s placement distance from the area of application (p < 0.001) (Table 4).
Table 4.
Two-way ANOVA results for sedimenting spray drift as caused by treatment and distance from the area of application (Df: degrees of freedom).
The collector’s placement distance and sedimenting spray drift had a strong negative connection (r = −0.8888), according to Pearson’s correlation test (Table 5), indicating that spray drift dramatically decreased with increasing distance (p < 0.001).
Table 5.
Results of Pearson’s correlation test between spray drift (%) and distance.
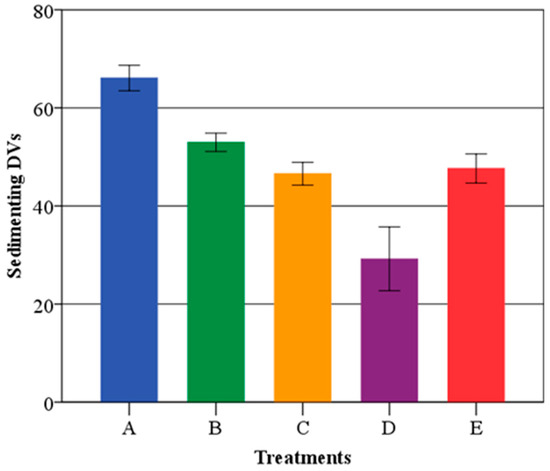
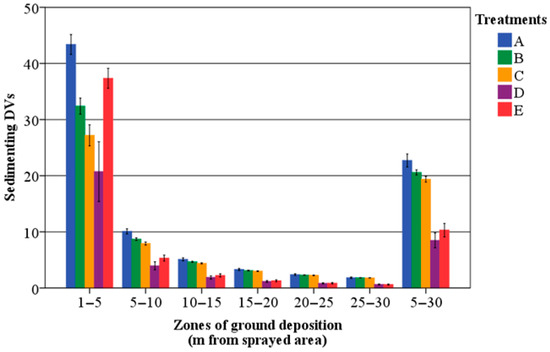
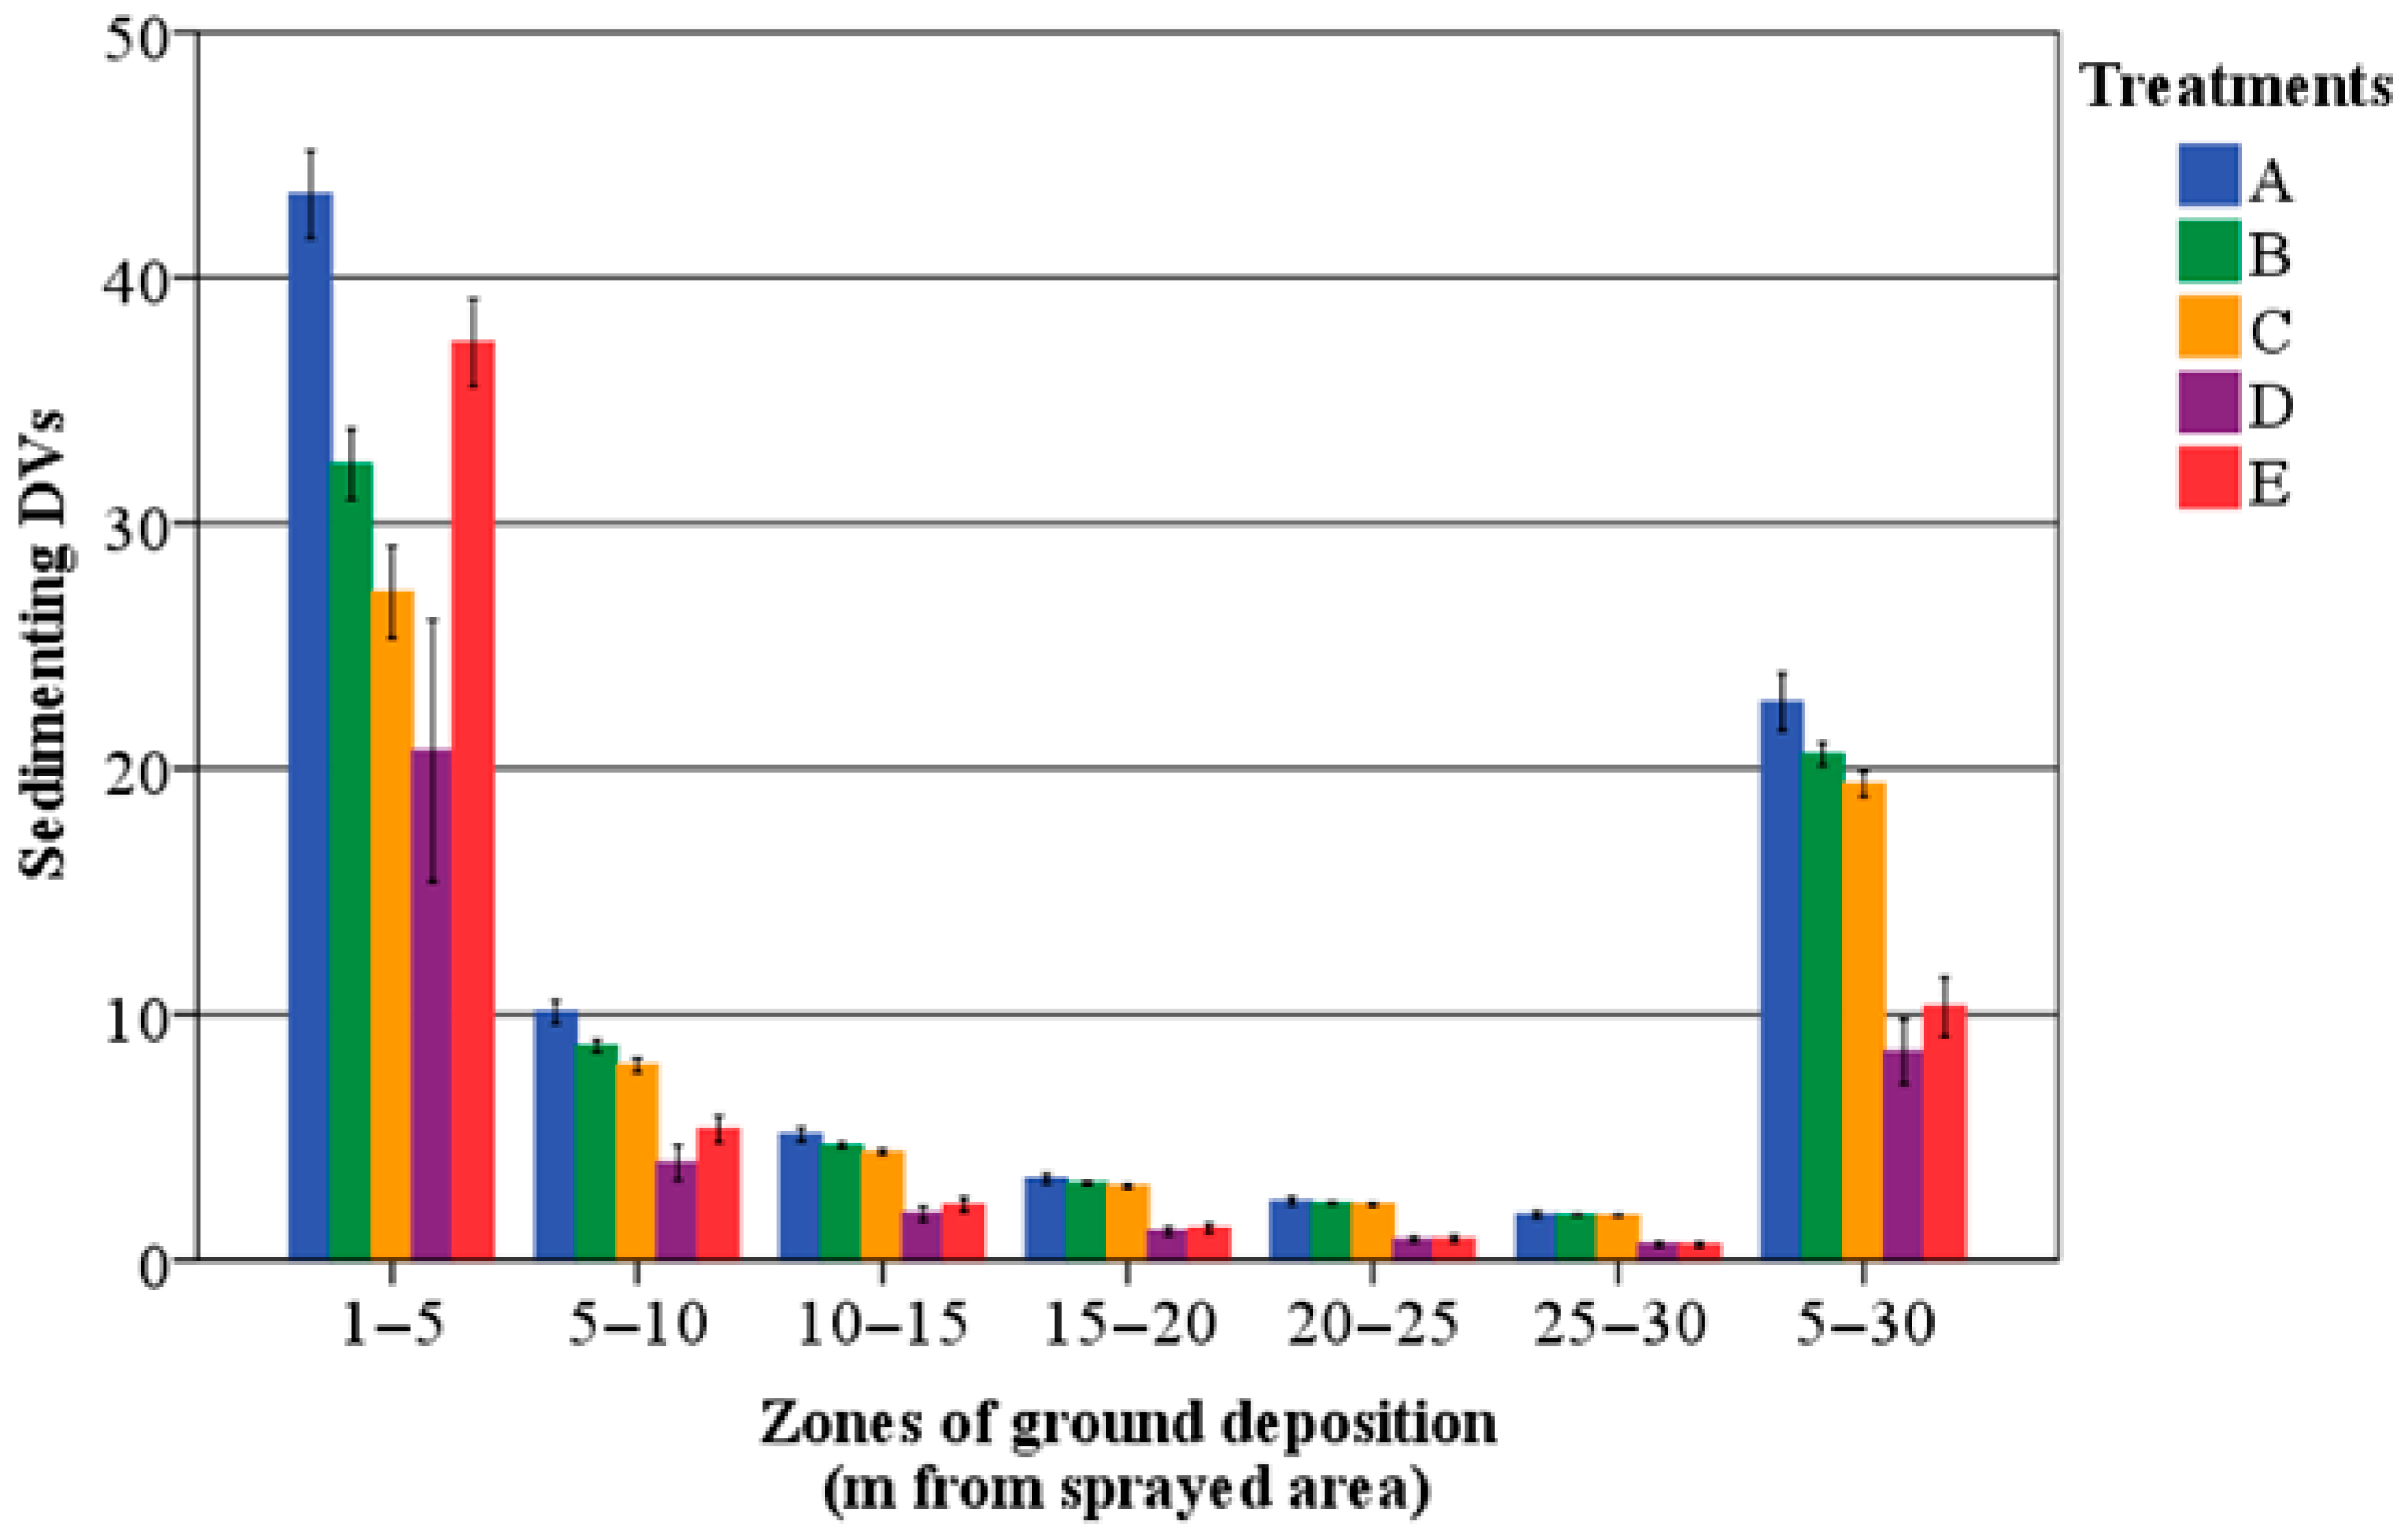
In Figure 8, the sedimenting drift values for each treatment are presented, with Treatment D showing the lowest value, followed by C, E, B, and A. At the same time, Treatment D has the lowest levels of ground deposition values across the six drift curve zones (distance from the area of application), as shown in Figure 9. It is also important to highlight the fact that Treatment E (using air induction nozzles) showed significantly low levels of spray drift deposition across the five drift zones (5–30 m), which were very close to the levels of Treatment D.
Figure 8.
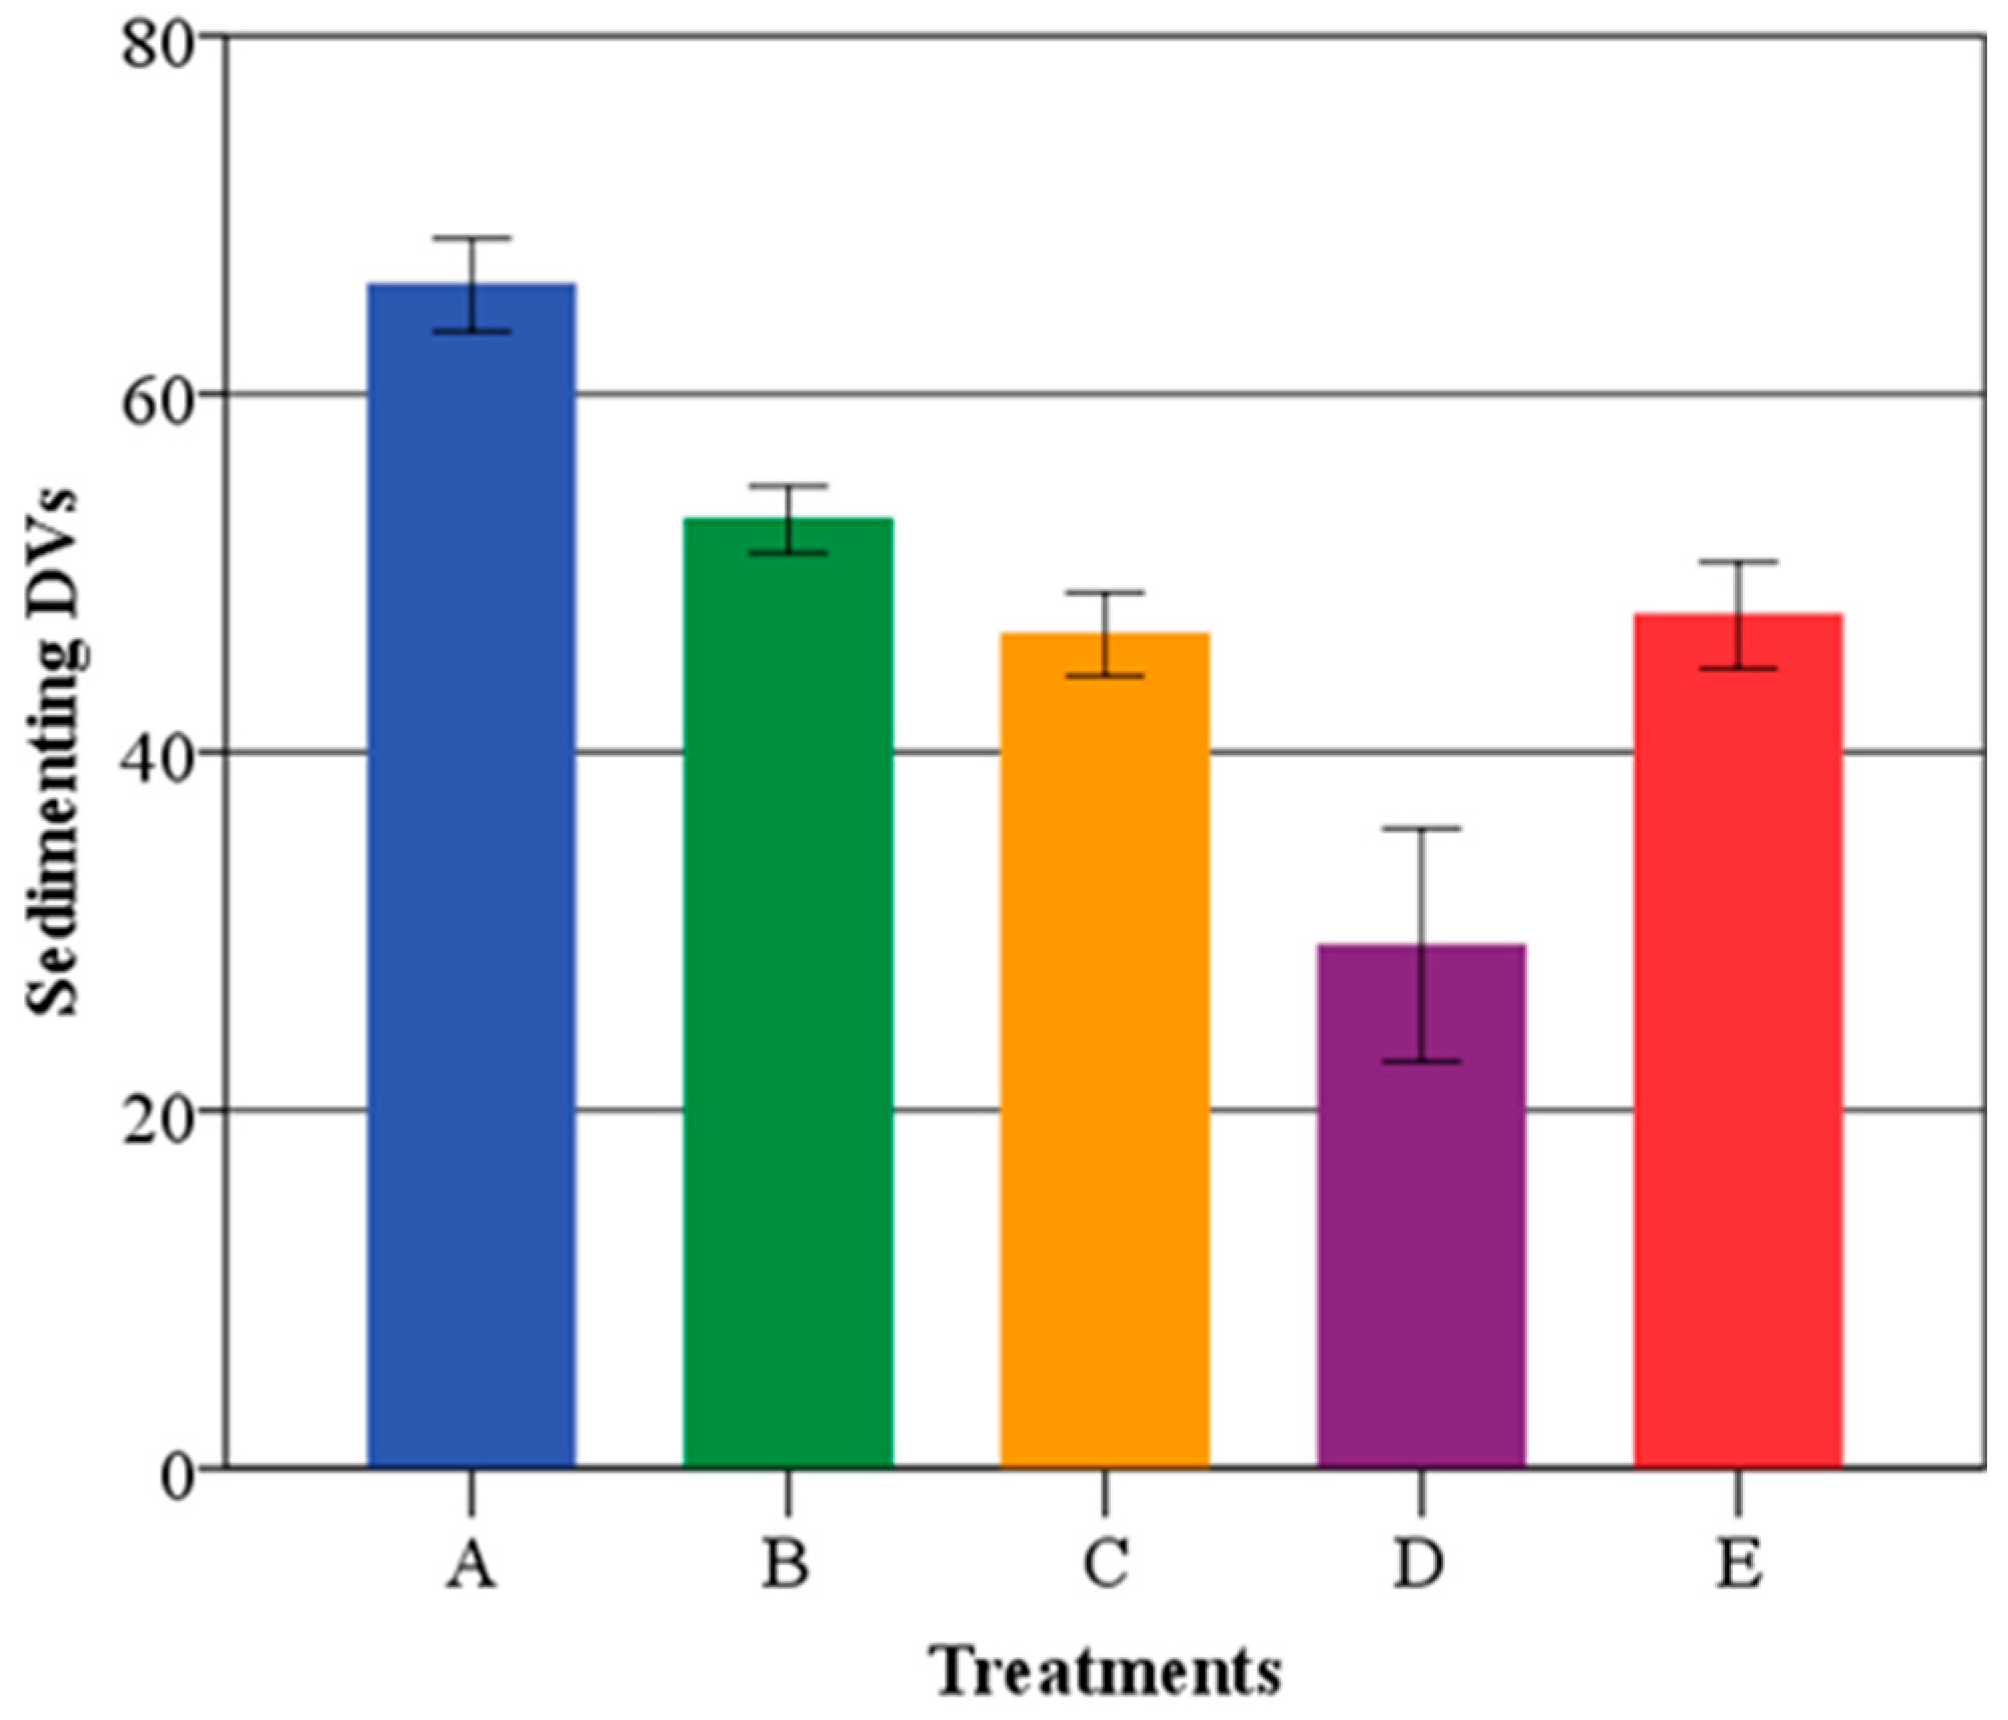
Drift values (DVs) obtained from ground spray drift curves for every treatment test. The bars present the mean ± SE of the mean.
Figure 9.
Drift values (DVs) derived from ground spray drift curves for each treatment tested across the six distance zones (1–5, 5–10, 10–15, 15–20, 20–25, and 25–30 m from the sprayed area). Drift values (DVs) are dimensionless indices derived from the integration of the drift curves and are therefore presented without specific units. The bars show the mean ± SE of the mean.
Tukey’s Honestly Significant Difference (HSD) procedure for pair-by-pair comparison among the means of the five treatments for all zones showed statistically significant differences between A–C, A–D, and A–E treatments at the zones from 0 m to 30 m (p < 0.05). No statistically significant differences were observed between A and B treatments (Table 6), indicating that one-sided application in row 1 did not achieve statistically highly significant results compared to the reference treatment.
Table 6.
Multiple range Tukey HSD tests for ground collectors (Tukey’s Honestly Significant Difference; Sig: significant).
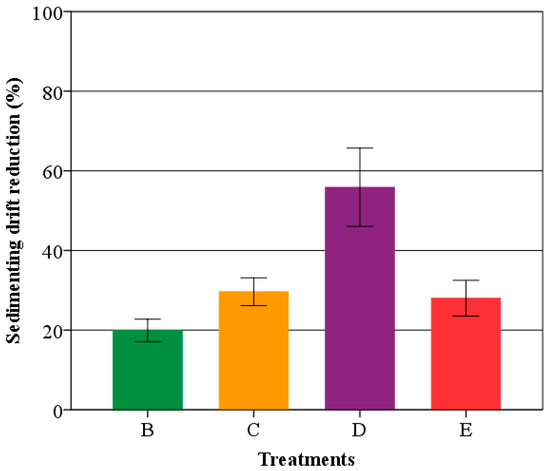
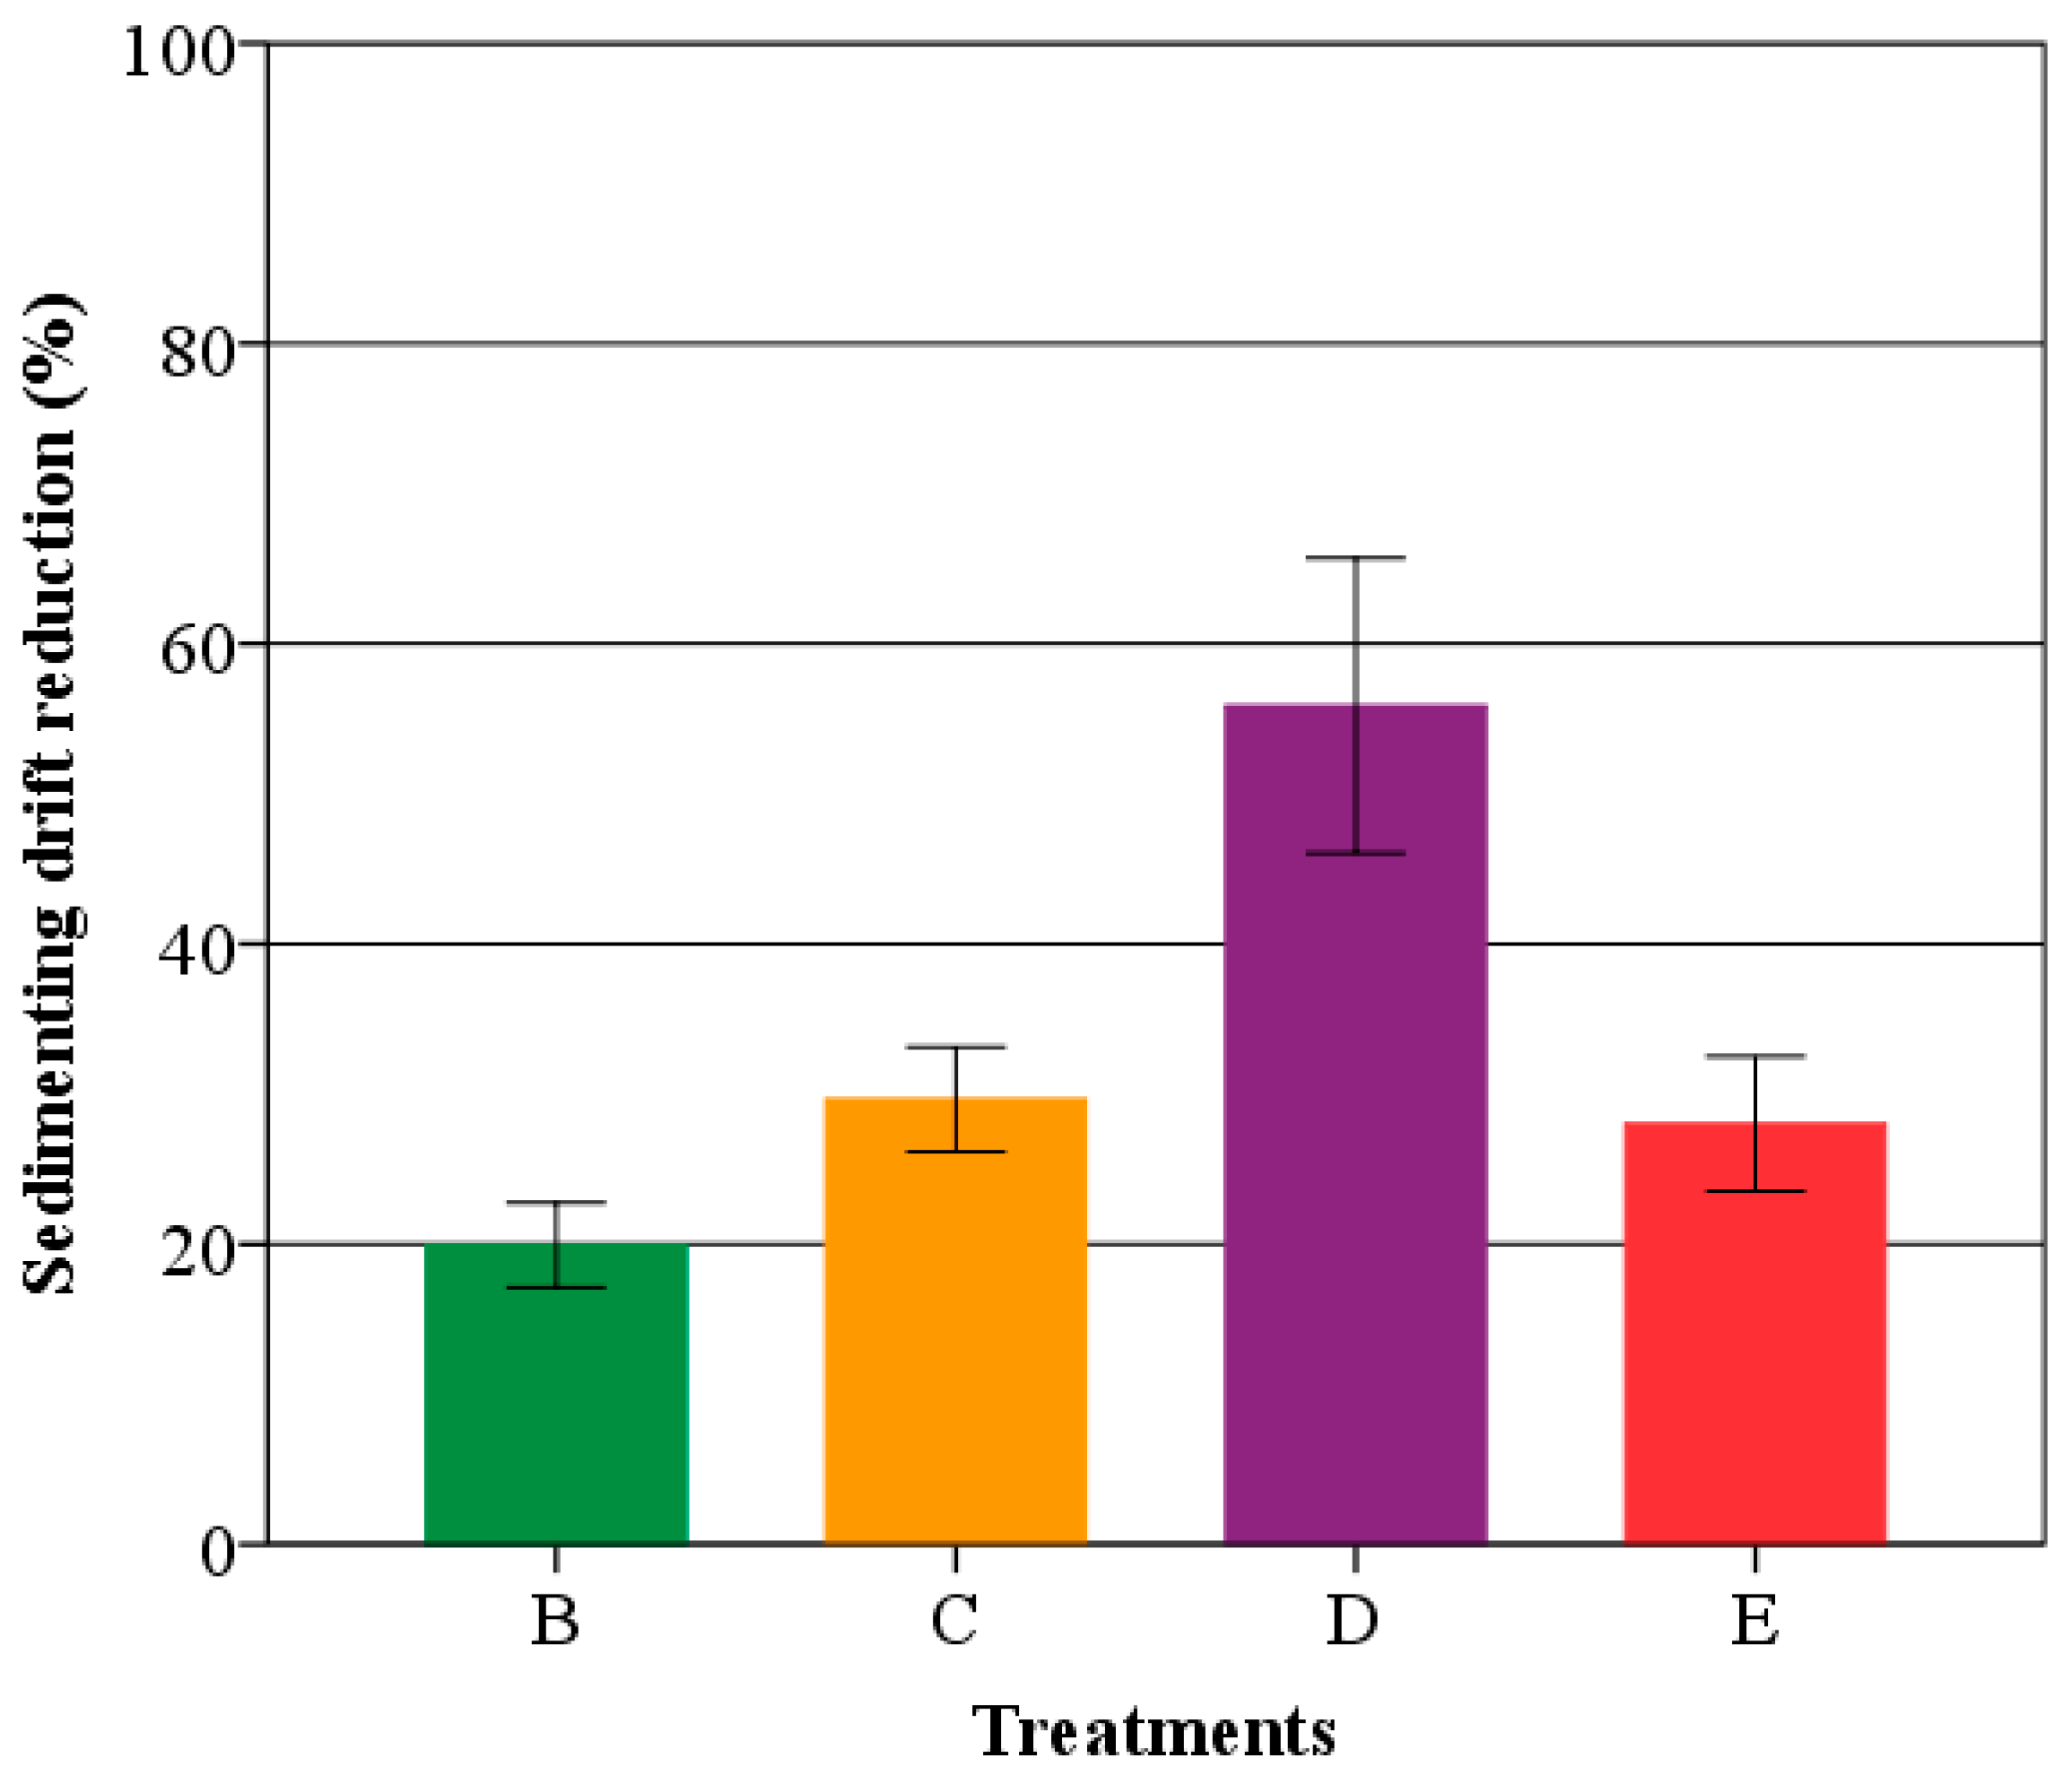
Figure 10 illustrates the total spray drift reduction achieved for all treatments tested, calculated for the entire drift curve, using Treatment A as reference. All tested treatments reduced spray drift compared to Treatment A. Treatment D achieved the highest reduction (56%); it employed the same nozzles as Treatment A, and air-assistance was switched off on the outer path and on the first spray path. The effect of fan air flow rate reduction in reducing spray drift is obvious. Excessive air concentrations have been found to enhance drift losses in apple orchards [67] and vineyards [68]. When the outer vineyard row was sprayed on one side, for Treatment B, an average drift reduction of 20% was achieved. In Treatment C, the first and second rows of the vineyard being sprayed on one side resulted in 30% drift reduction. Finally, when air induction nozzles were used (Treatment E), the spray drift reduction produced was not higher than 28%. Wenneker et al. [55], in experiments on the early growth stages of apple orchards, with a combination of the above treatments, using air induction nozzles and spraying the outer tree row while only the nozzle array facing that line was active and air assistance was turned off, reported a drift reduction of more than 80%.
Figure 10.
Total drift reduction (%) calculated along the entire ground drift curve obtained for each treatment tested, considering Treatment A as a reference. The bars display the mean ± SE of the mean.
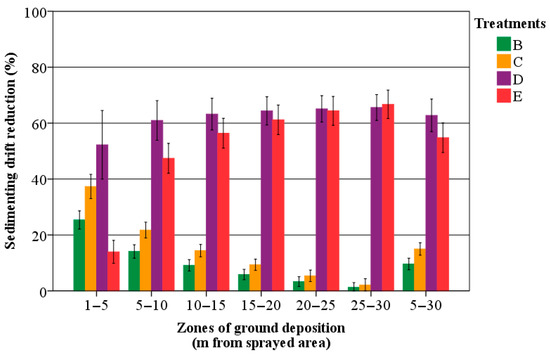
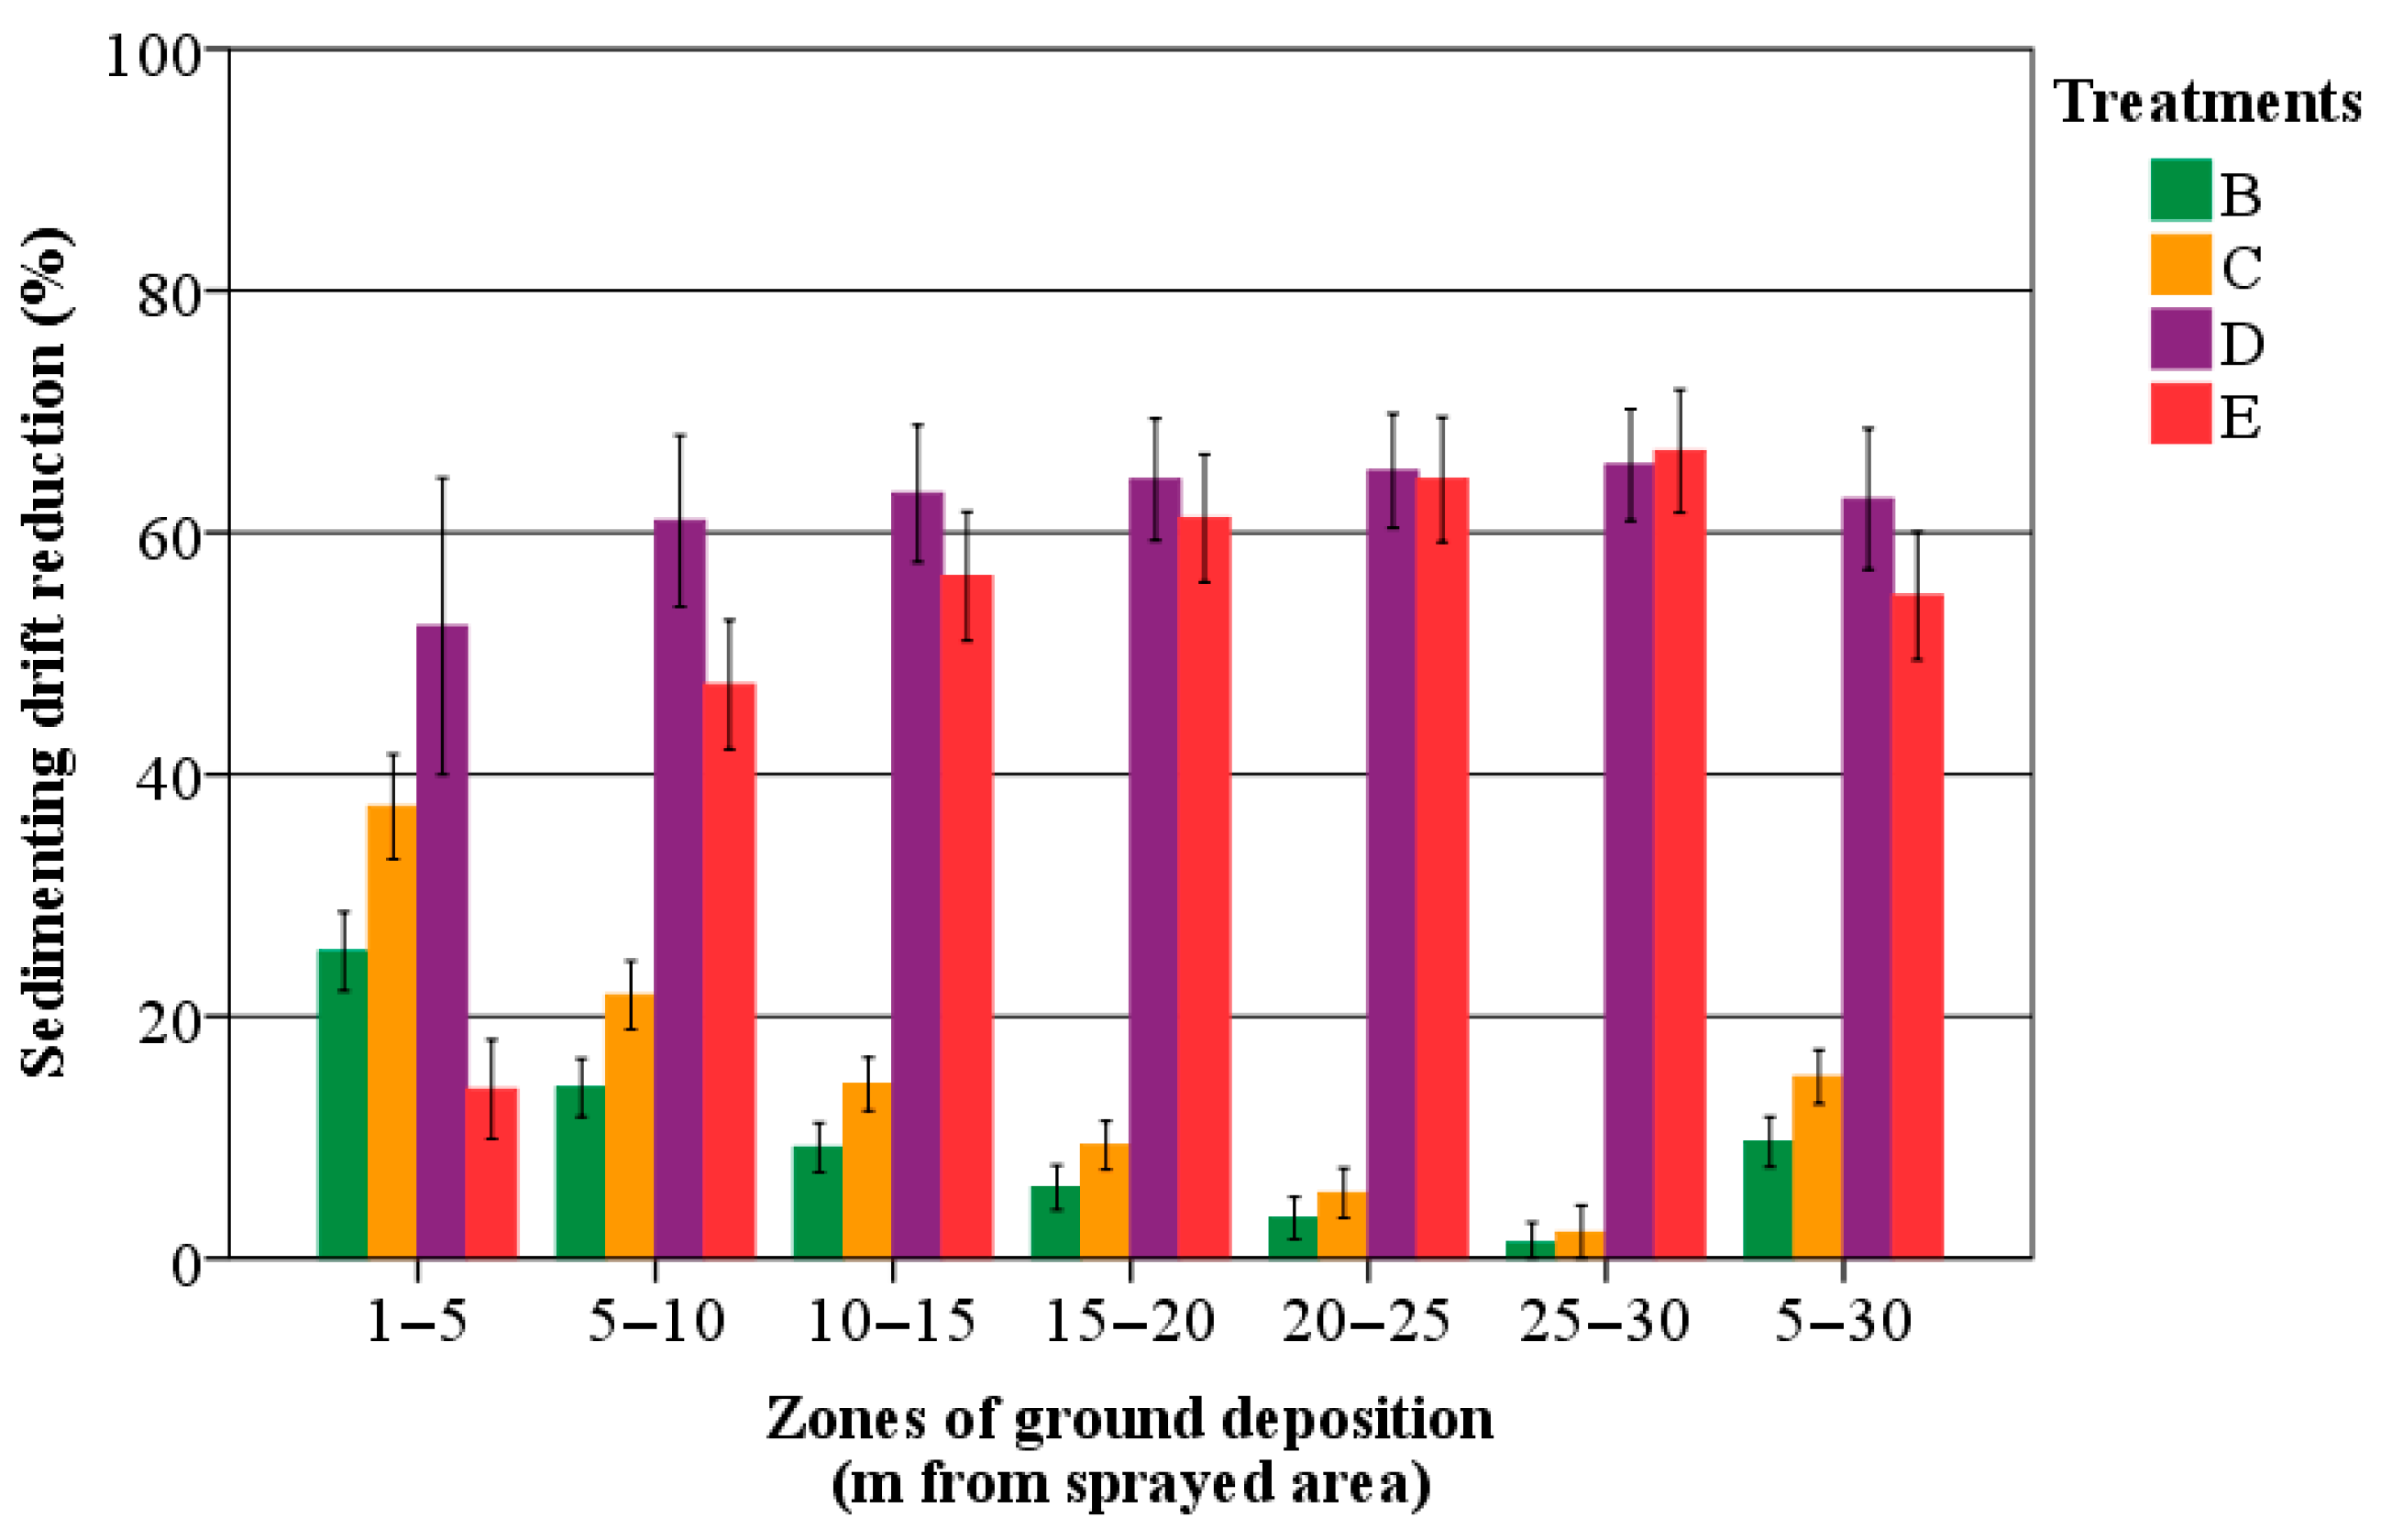
Corresponding to the total drift reduction, the drift reduction achieved by each treatment in the six selected zones of the downwind area of application was also calculated, and the results are shown in Figure 11. The treatments tested generated a drift reduction in all six zones. In Treatments B and C, where conventional nozzles and one-sided spraying in the first and second rows were used, the highest drift reductions were recorded in the zones closest to the area of application, as opposed to the highest drift reductions achieved in the zones farthest from the area of application when air induction nozzles were used (Treatment E). In Treatment D, using conventional nozzles and without air support on row 1 and the outer side of row 2, a high drift reduction was observed in all zones, which increased slightly as the gap from the spray area grew.
Figure 11.
Sedimenting drift reduction (%) achieved for each treatment tested for six drift curve zones (1–5, 5–10, 10–15, 15–20, 20–25, and 25–30 m from the coated area), considering Treatment A as a reference. The bars display the mean ± SE of the mean.
A more detailed consideration of the treatments points out that the utilization of air induction nozzles (Treatment E) produced the smallest drift reduction (14%) of all the treatments in the 1–5 m zone and the largest drift reduction of all the treatments (67%) in the 25–30 m zone. In the aggregate, in the 5–30 m zone, Treatment E achieved the second-best drift reduction (55%) after treatment D (63%). In contrast, Treatments B and C showed a different trend, with the highest drift reduction observed in the 1–5 m zone (25% and 37%, respectively) and the smallest drift reductions in the 25–30 m zone (1% and 2%, respectively). Treatment D presented constantly high drift reduction values in all zones, in particular, a 52% drift reduction in the 1–5 m zone and above 60% in all other zones.
3.3. Airborne Spray Drift
Vertical samplers positioned at six different heights and three different distances downwind of the sprayed zone were used to measure the airborne spray drift deposition. Table 7 exhibits airborne spray deposition, and Figure 12 displays the mean data curves.
Table 7.
Airborne spray drift deposition.
Figure 12.
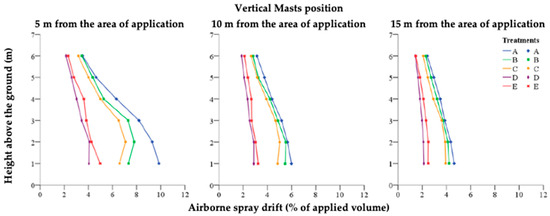
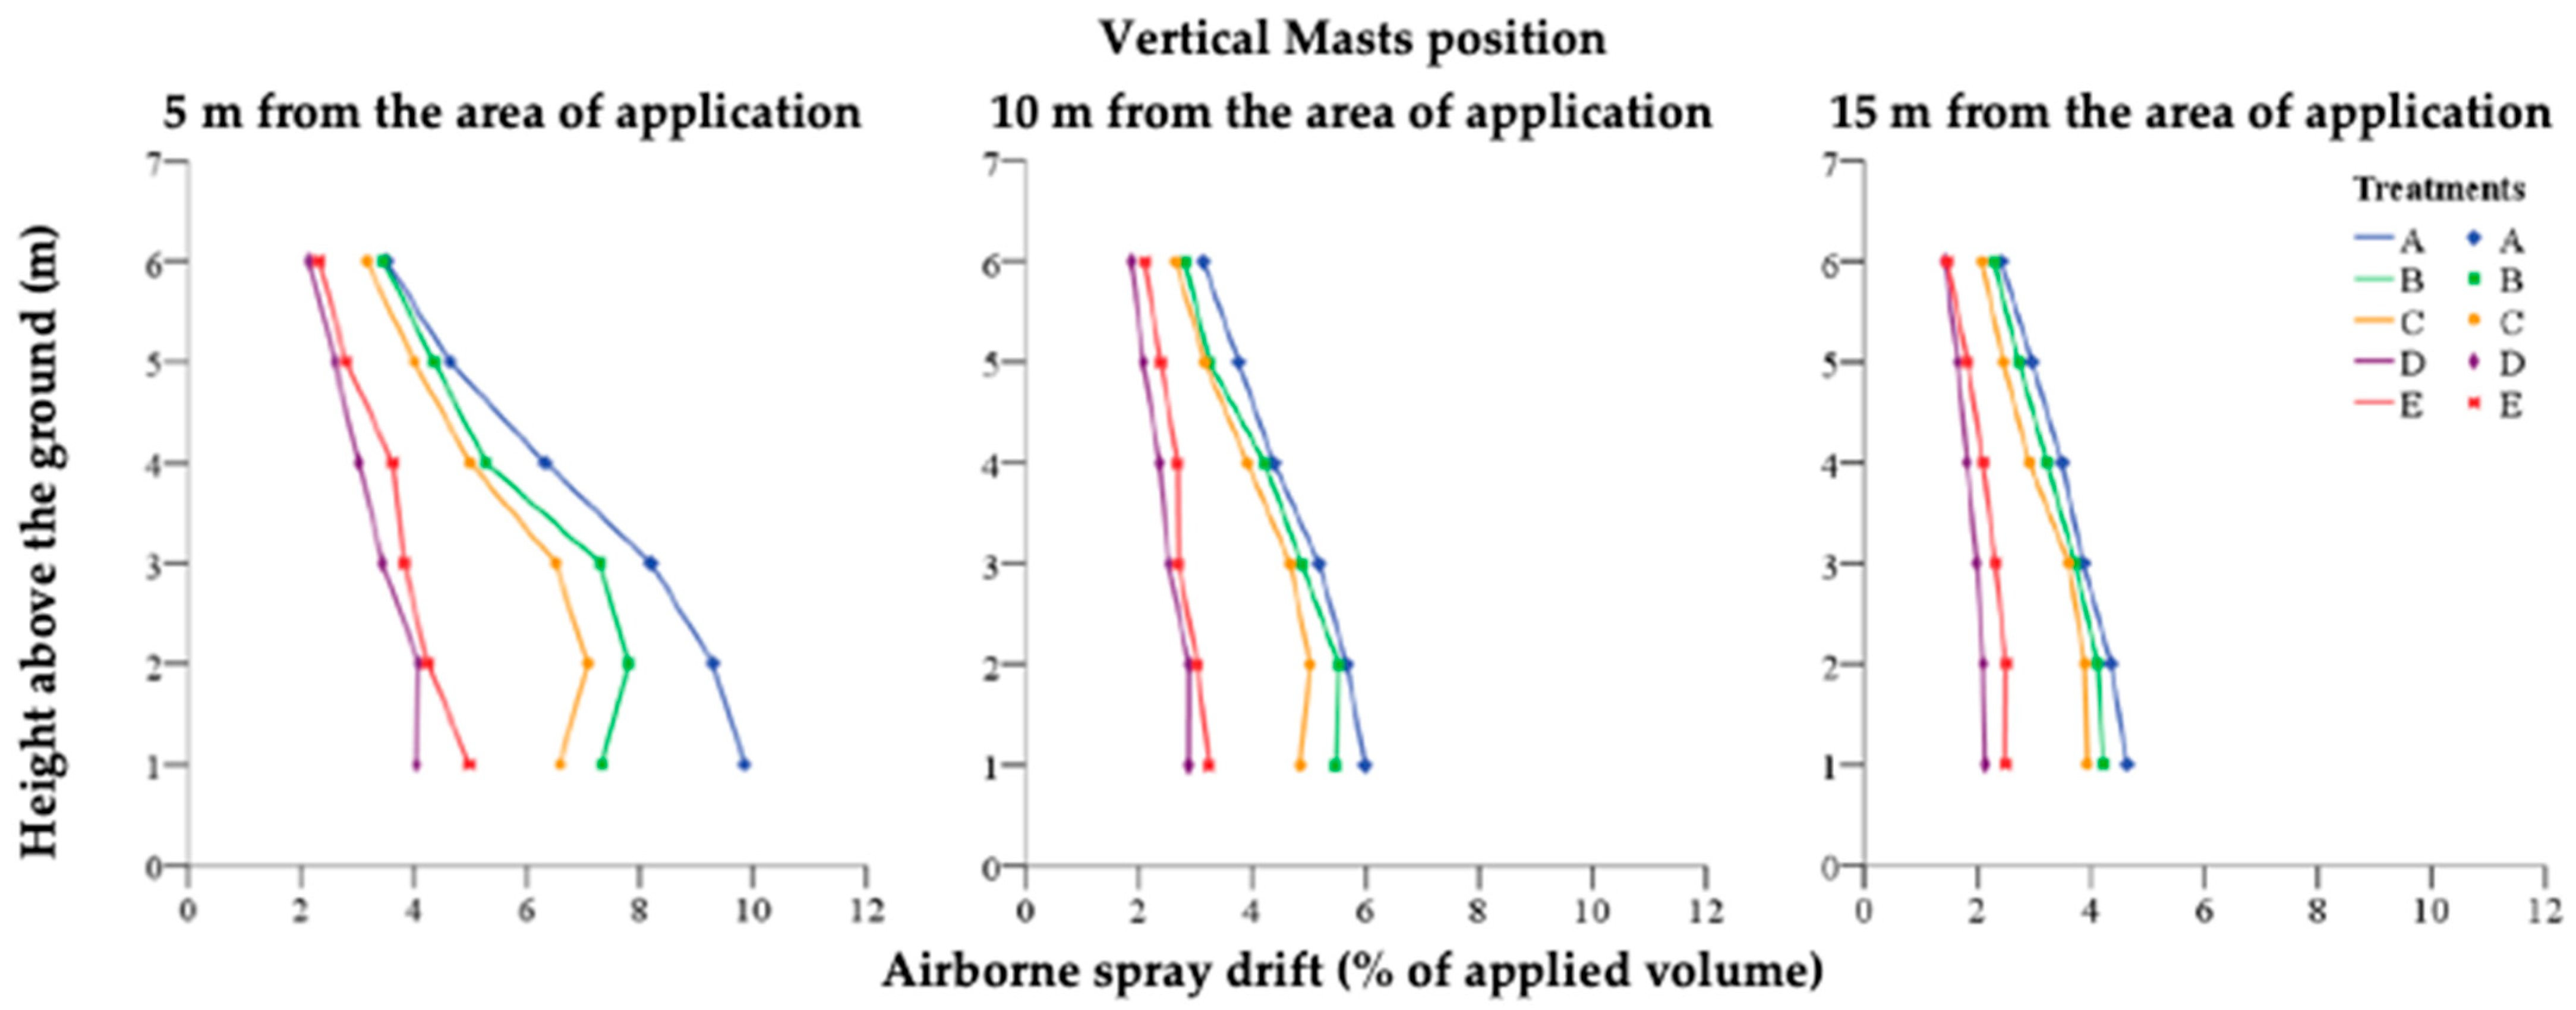
Airborne spray drift deposition profile at three distances from the area of application.
This study’s findings show that for every treatment, the greatest deposition levels were found 5 m downwind of the sprayed region, followed by 10 and 15 m. As seen in Figure 12, spray drift deposition decreased with height above the ground, particularly at a distance of 5 m from the sprayed region. This airborne drift profile is comparable to those found in prior orchard research studies [65,69]. Studies conducted in vineyards, however, show that deposition increases as height increases [40]. Because spray drift amount is greatly influenced by the architecture and geometry of the canopy, this divergence is strongly dependent on the experimental vineyard’s notably poor canopy and tiny height, which results in greater drift depositions at lower heights [70].
The effects of treatment, height, and distance from the sprayed region on the spray drift deposition for the vertical samplers were investigated using a three-way ANOVA test, which showed (Table 8) that all three of these parameters indeed have a statistically significant effect (p < 0.001). Interactions between treatment and distance, treatment and height, as well as distance and height did not show statistically significant effects on the airborne spray drift deposition.
Table 8.
Three-way ANOVA results for airborne spray drift as affected by treatment, distance from the area of application, and height above the ground (Df: degrees of freedom).
Pearson’s correlation test revealed (Table 9) that the distance from the sprayed region (r = −0.4466) and height (r = −0.4219) have a significantly negative association with regard to drift values, indicating that as distance increased, spray drift decreased, as well as with increasing height (p < 0.001).
Table 9.
Results of Pearson’s correlation test between spray drift (%) and distance and height.
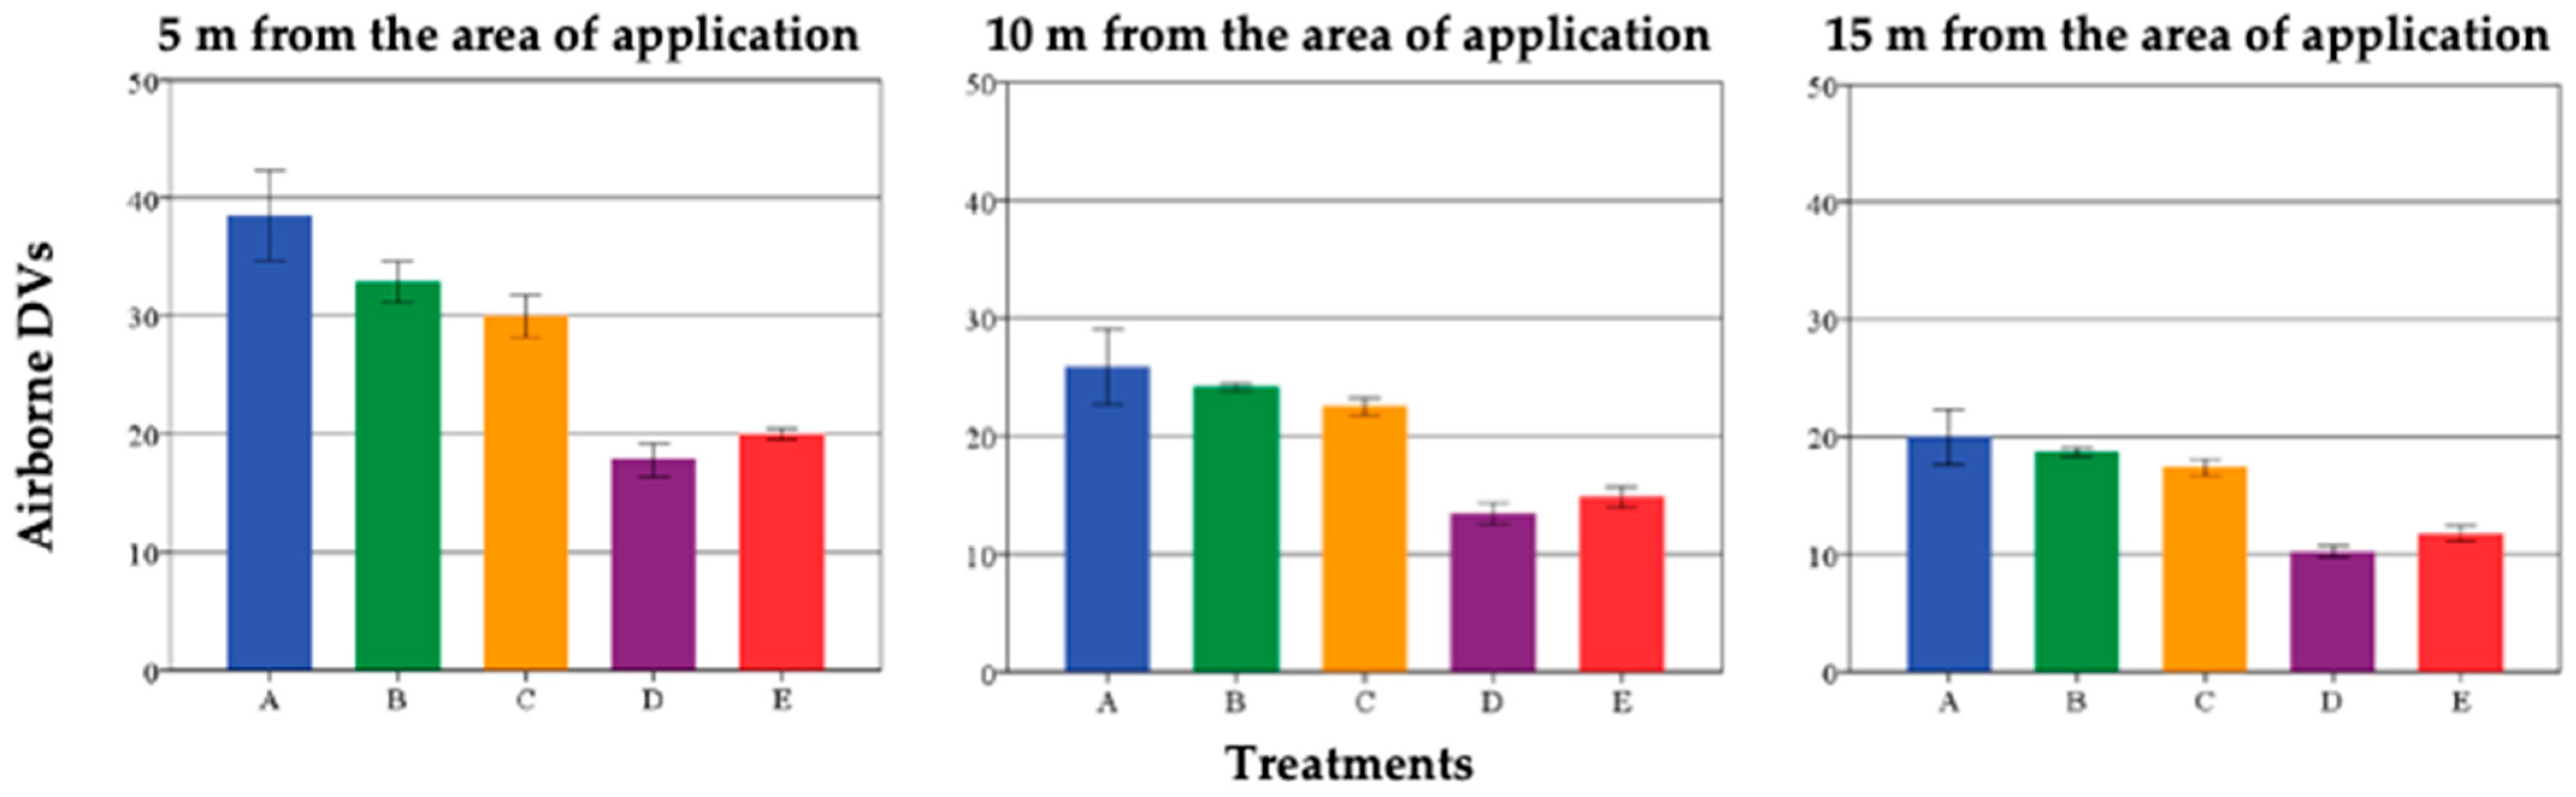
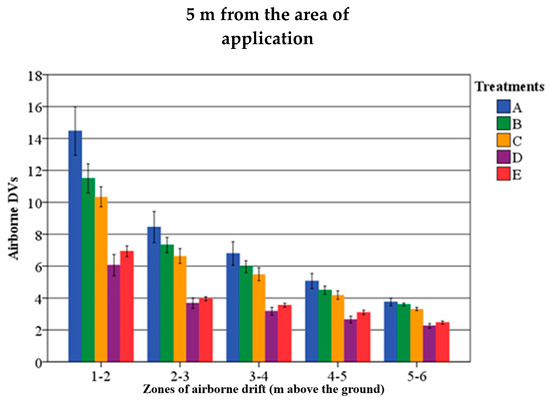
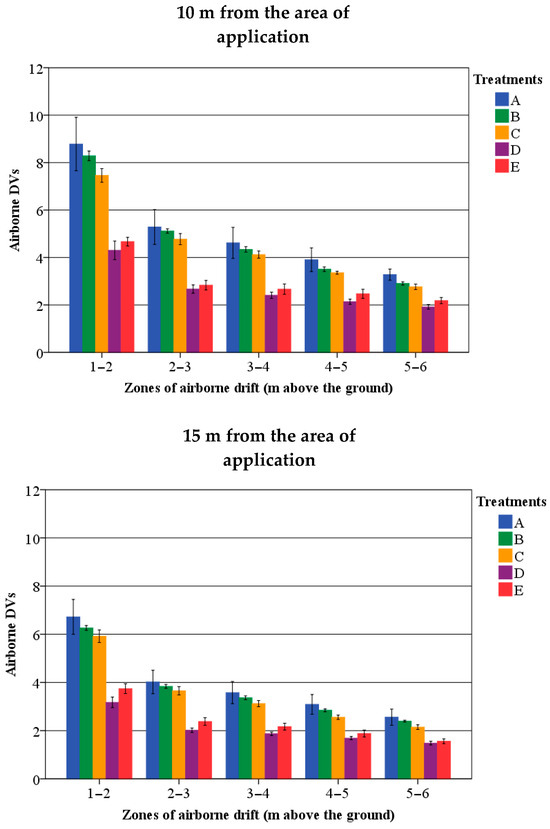
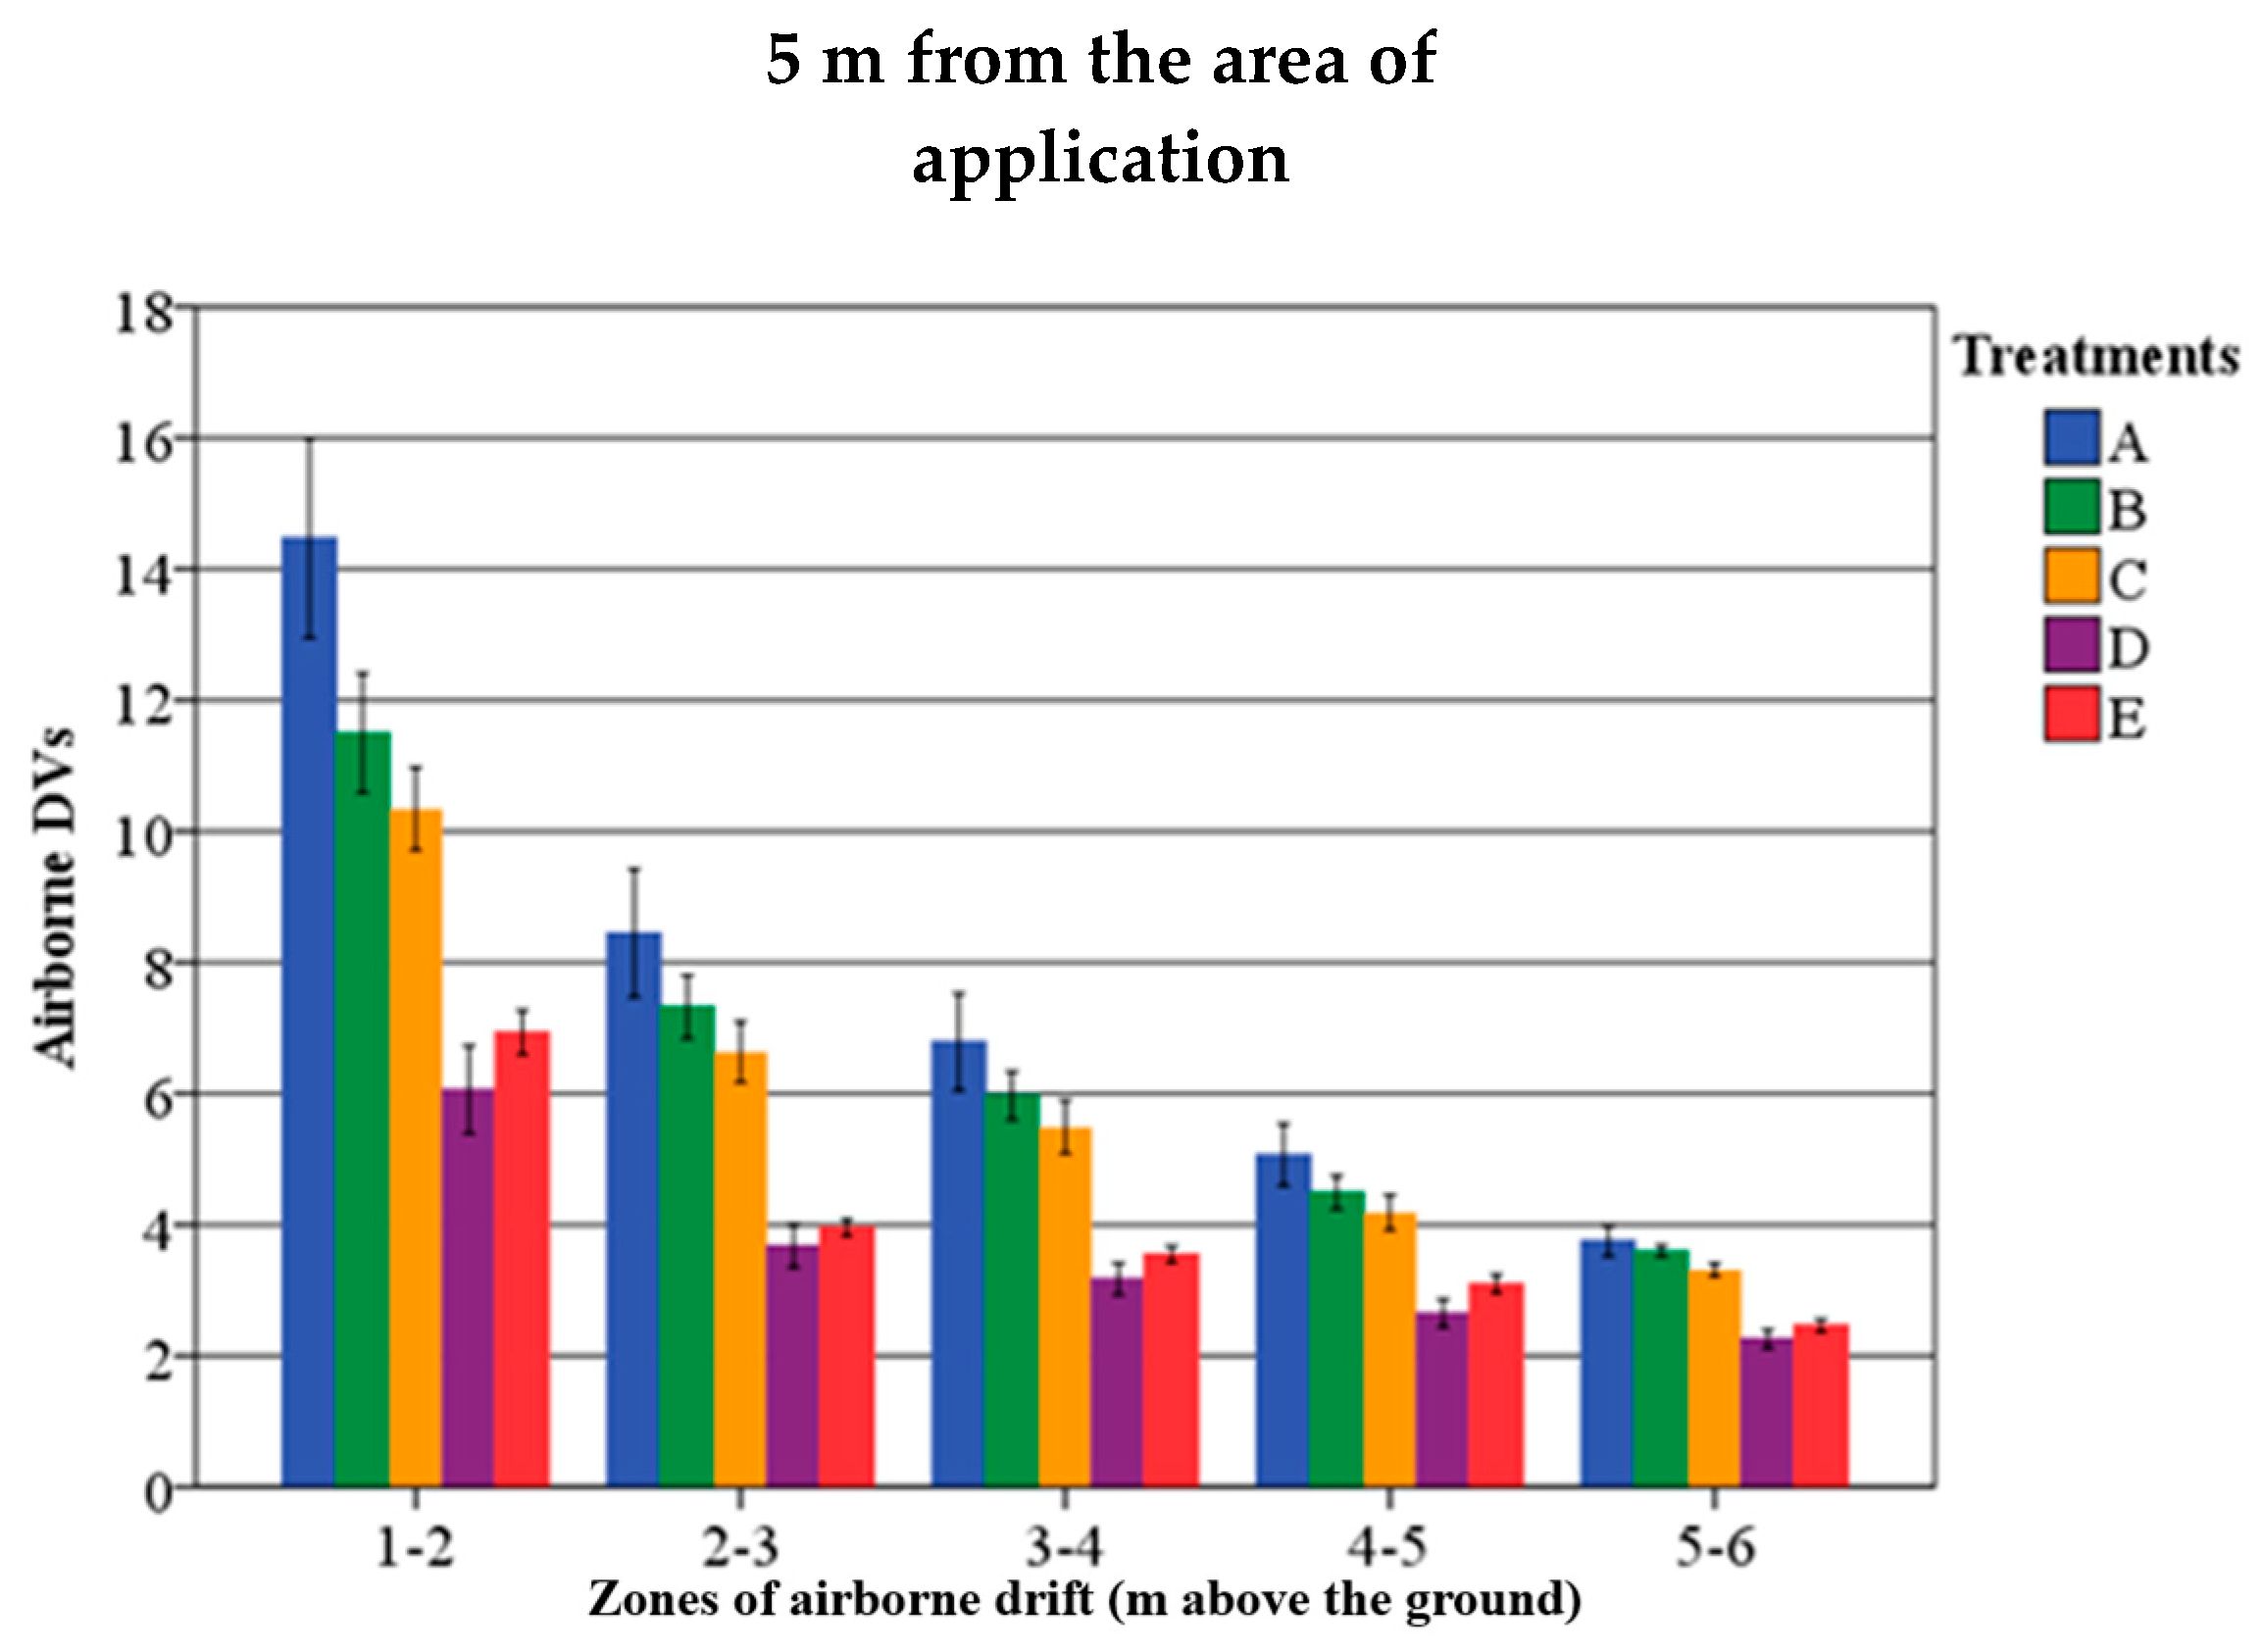
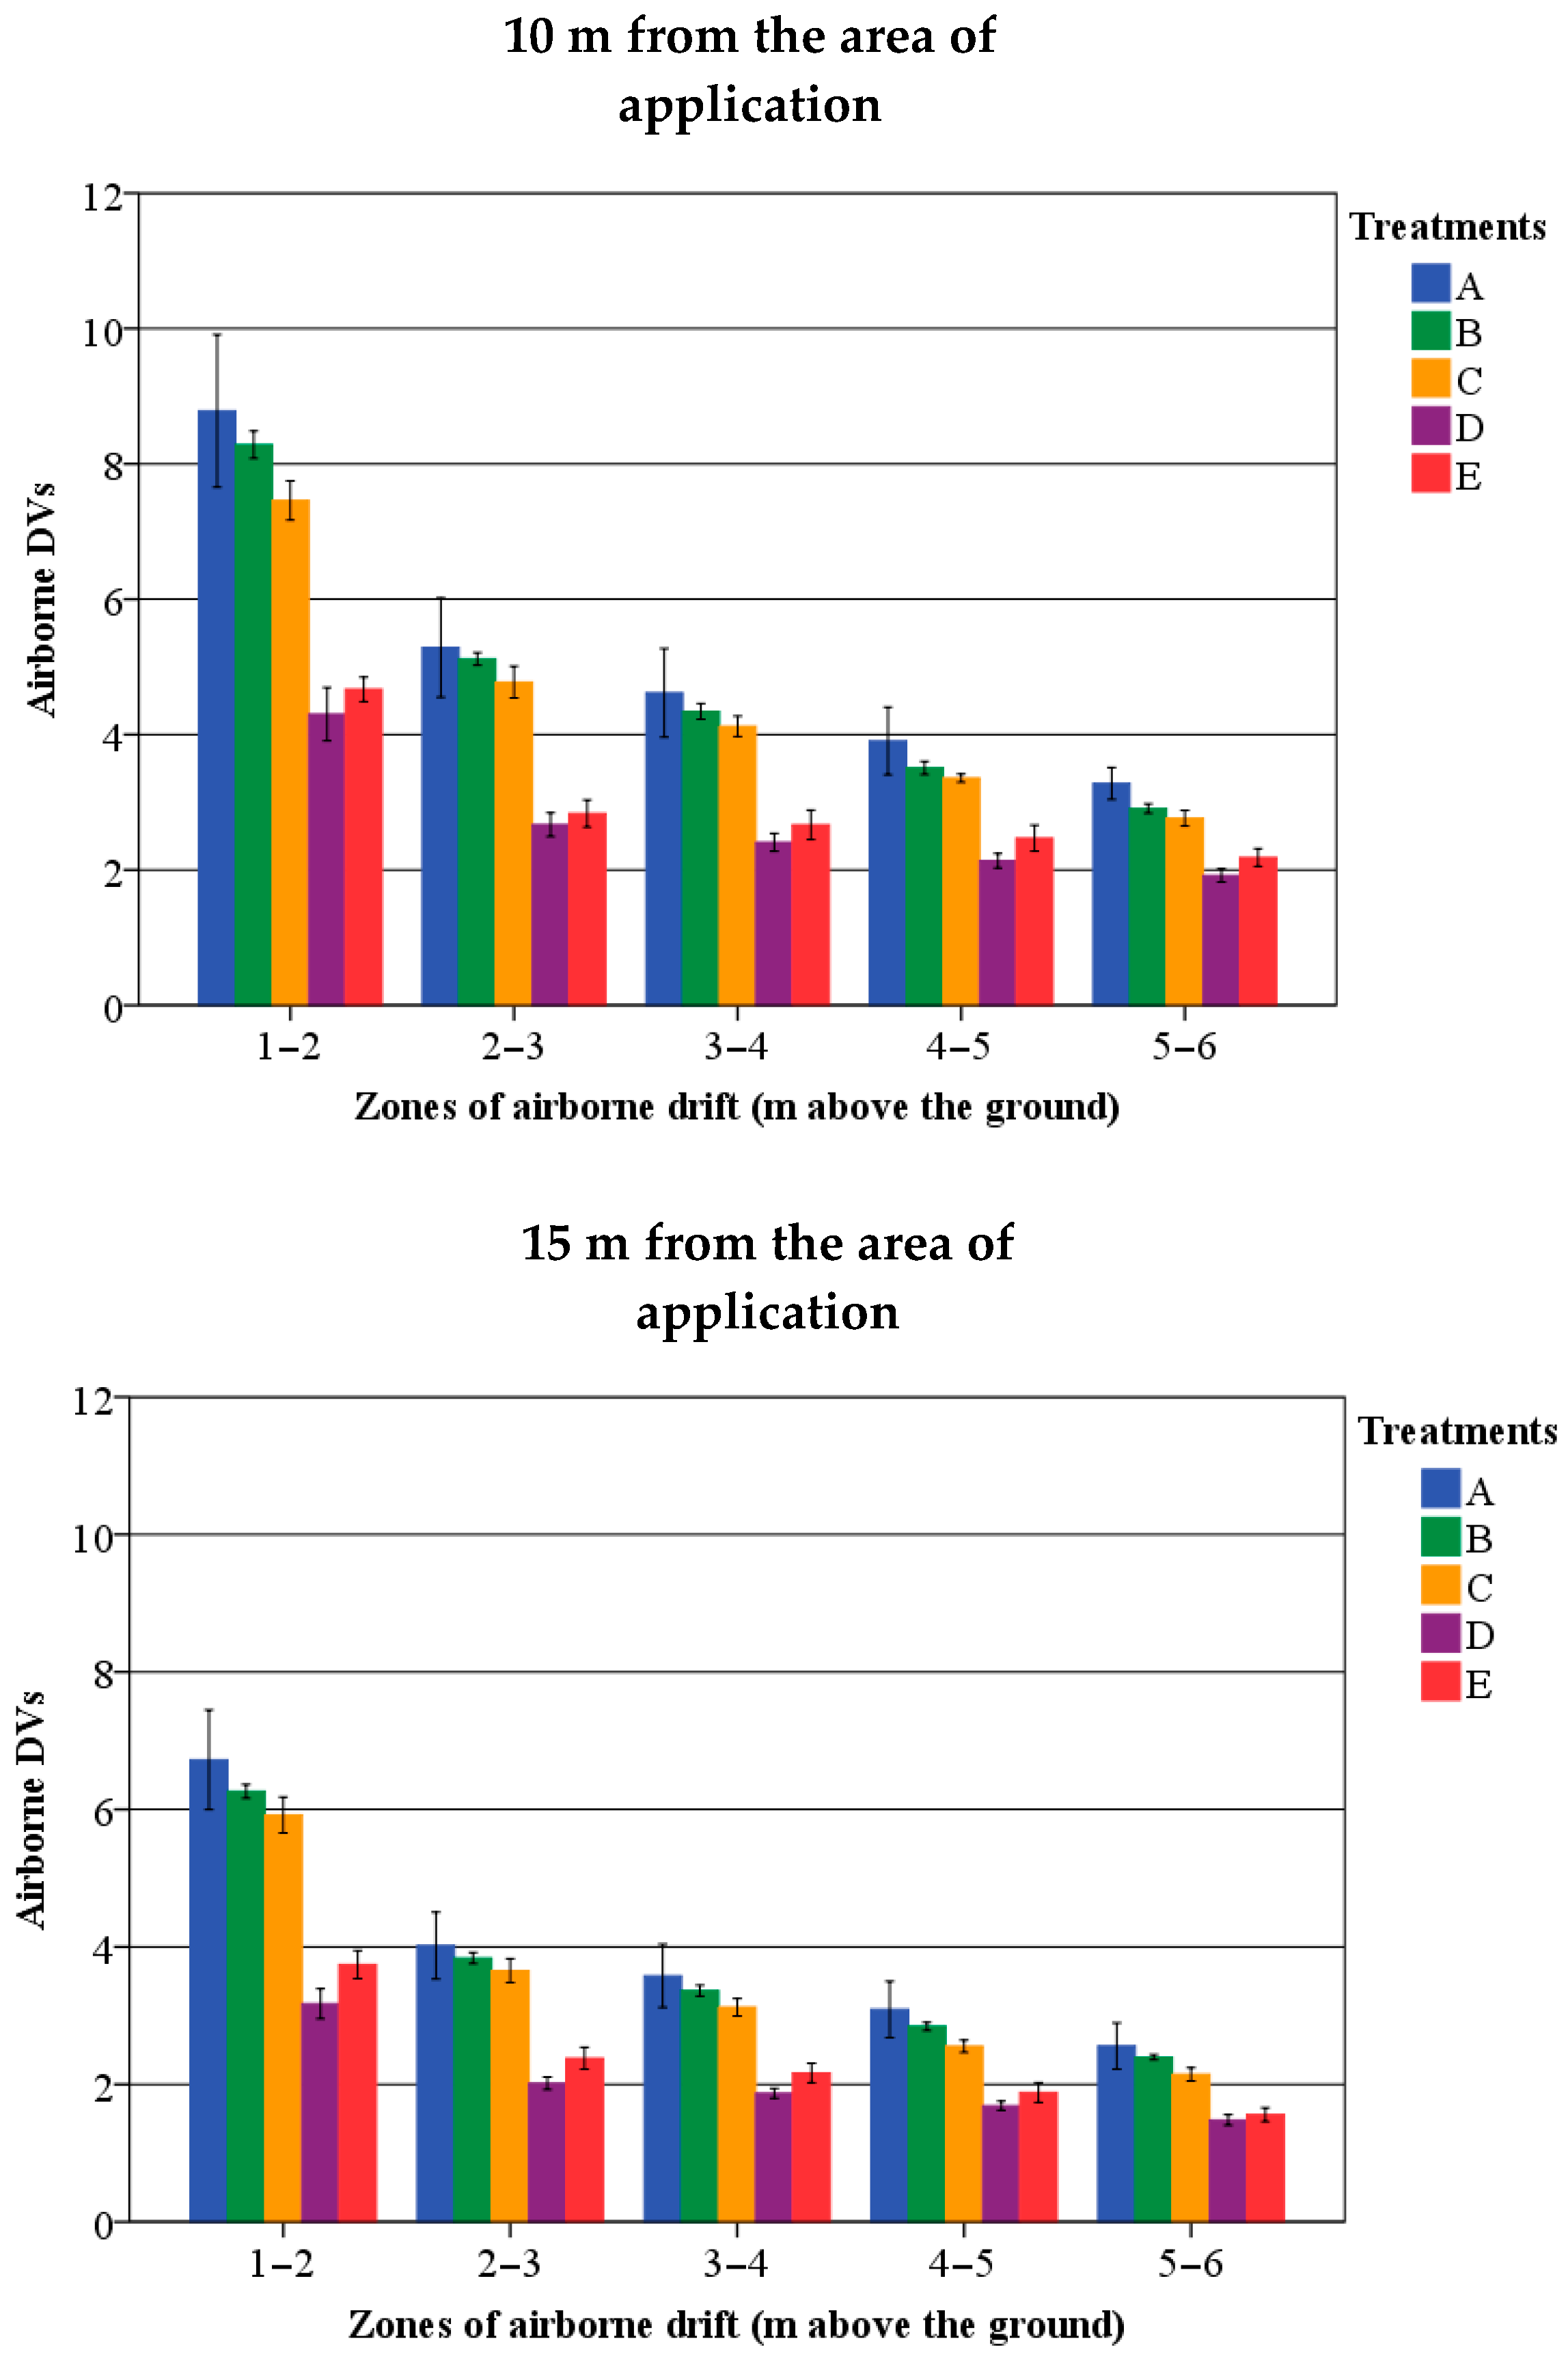
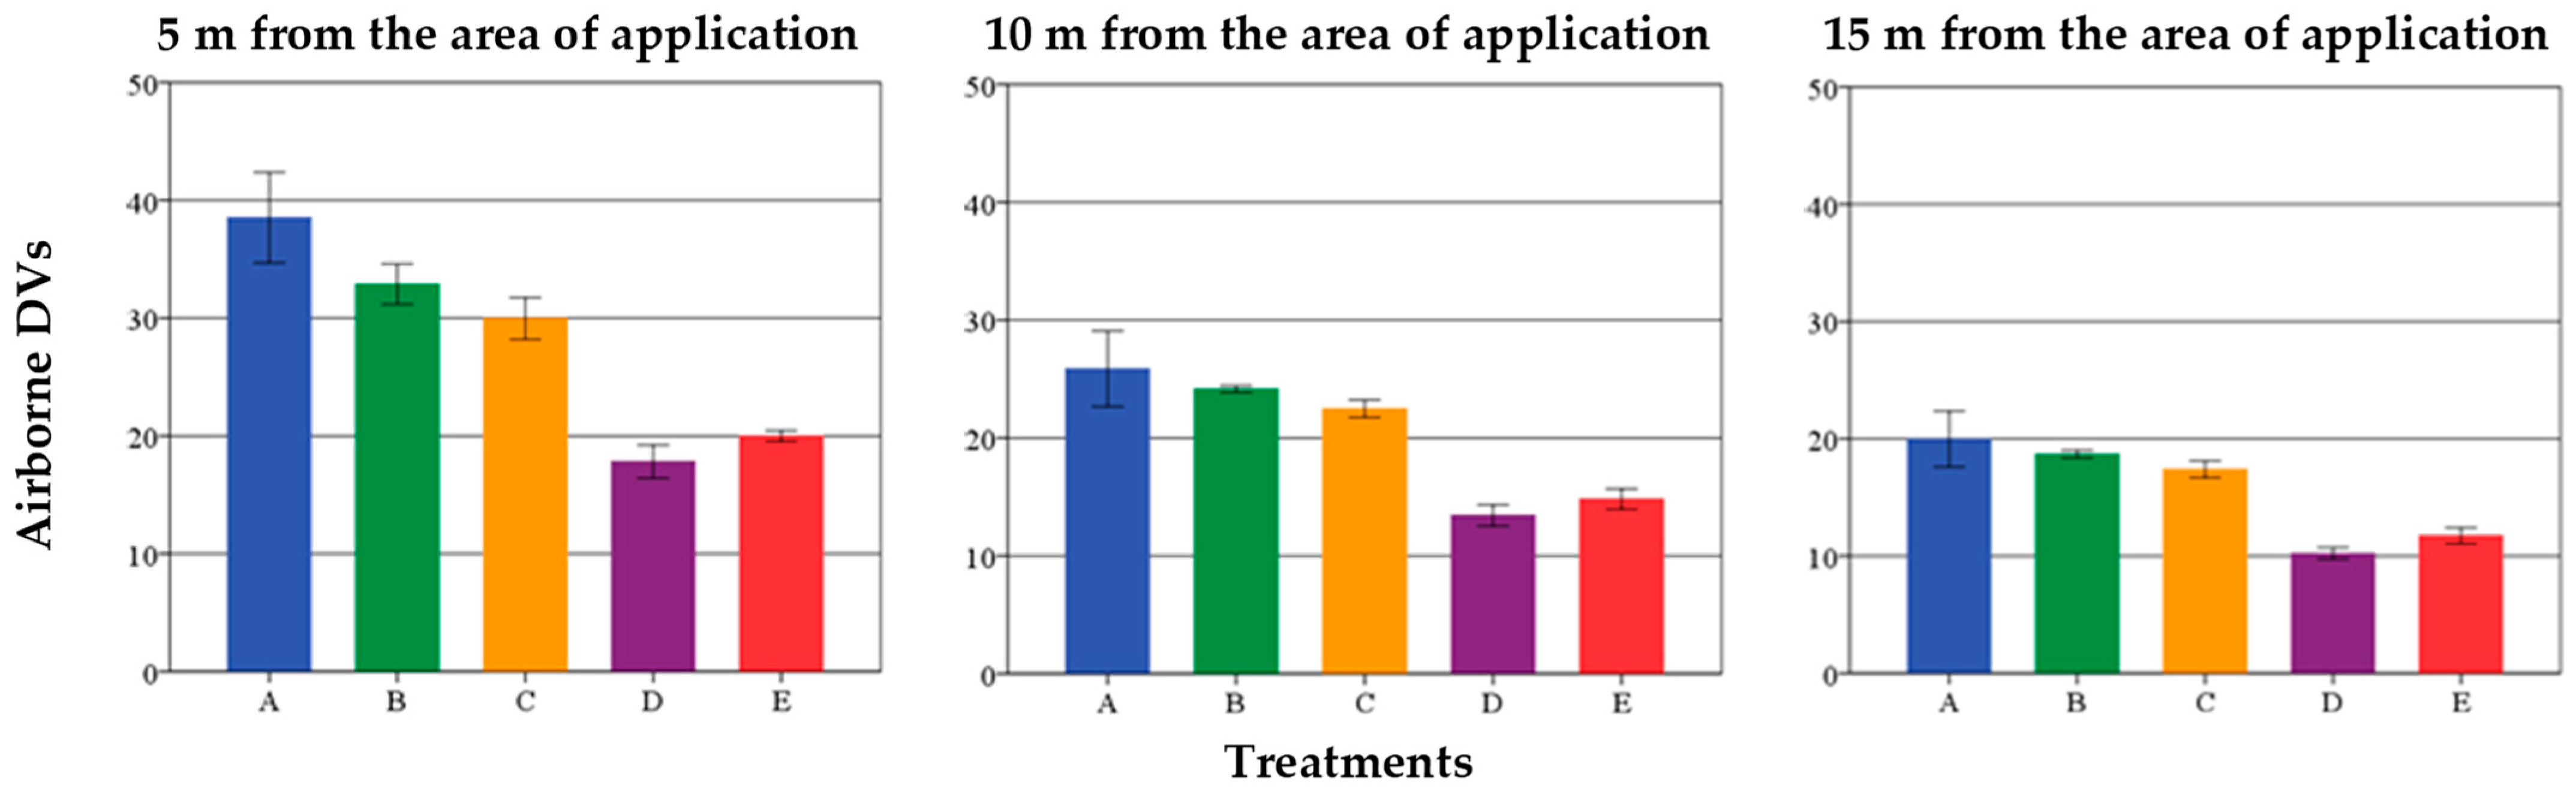
In Figure 13 and Figure 14, the drift values (DVs) derived from airborne spray drift curves at 5 m, 10 m, and 15 m distance from the area of application, as well as for five drift curve zones of height above the ground (1–2, 2–3, 3–4, 4–5, and 5–6 m) for all treatments are shown. It is apparent that for all three distances from the area of application, Treatments D and E achieved the lowest levels of spray drift deposition, followed by Treatments C, B, and A. This is also the case for the five curve zones of height above the ground.
Figure 13.
Drift values (DVs) derived from airborne spray drift curves at 5 m, 10 m, and 15 m distance from the area of application for all treatments. The bars display the mean ± SE of the mean.
Figure 14.
Drift values (DVs) derived from airborne spray drift curves for each treatment tested at 5 m, 10 m, and 15 m distance from the area of application for the five drift curve zones (1–2, 2–3, 3–4, 4–5, and 5–6 m height). The bars display the mean ± SE of the mean.
Tukey’s Honestly Significant Difference (HSD) procedure was applied for pair-by-pair comparison among the means of the five treatments for vertical samplers, showing statistically significant differences between A–D and A–E treatments at the three different distances downwind the area of application (p < 0.05), while no statistically significant differences were observed between A–B and A–C treatments (Table 10).
Table 10.
Multiple range Tukey HSD tests between treatments for vertical samplers (Tukey’s Honestly Significant Difference; Sig: significant).
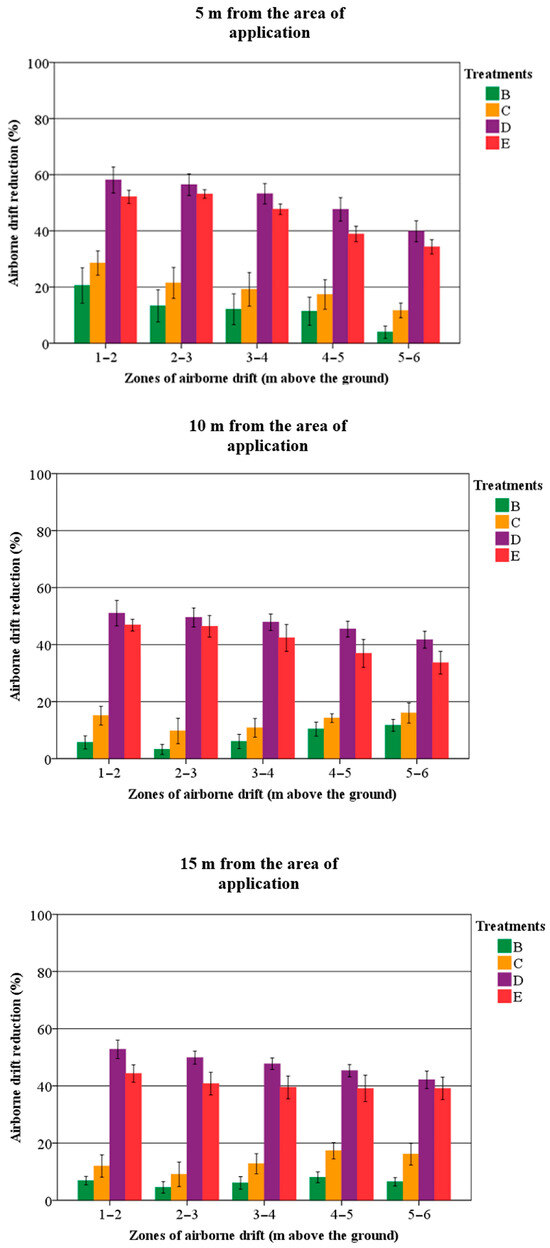
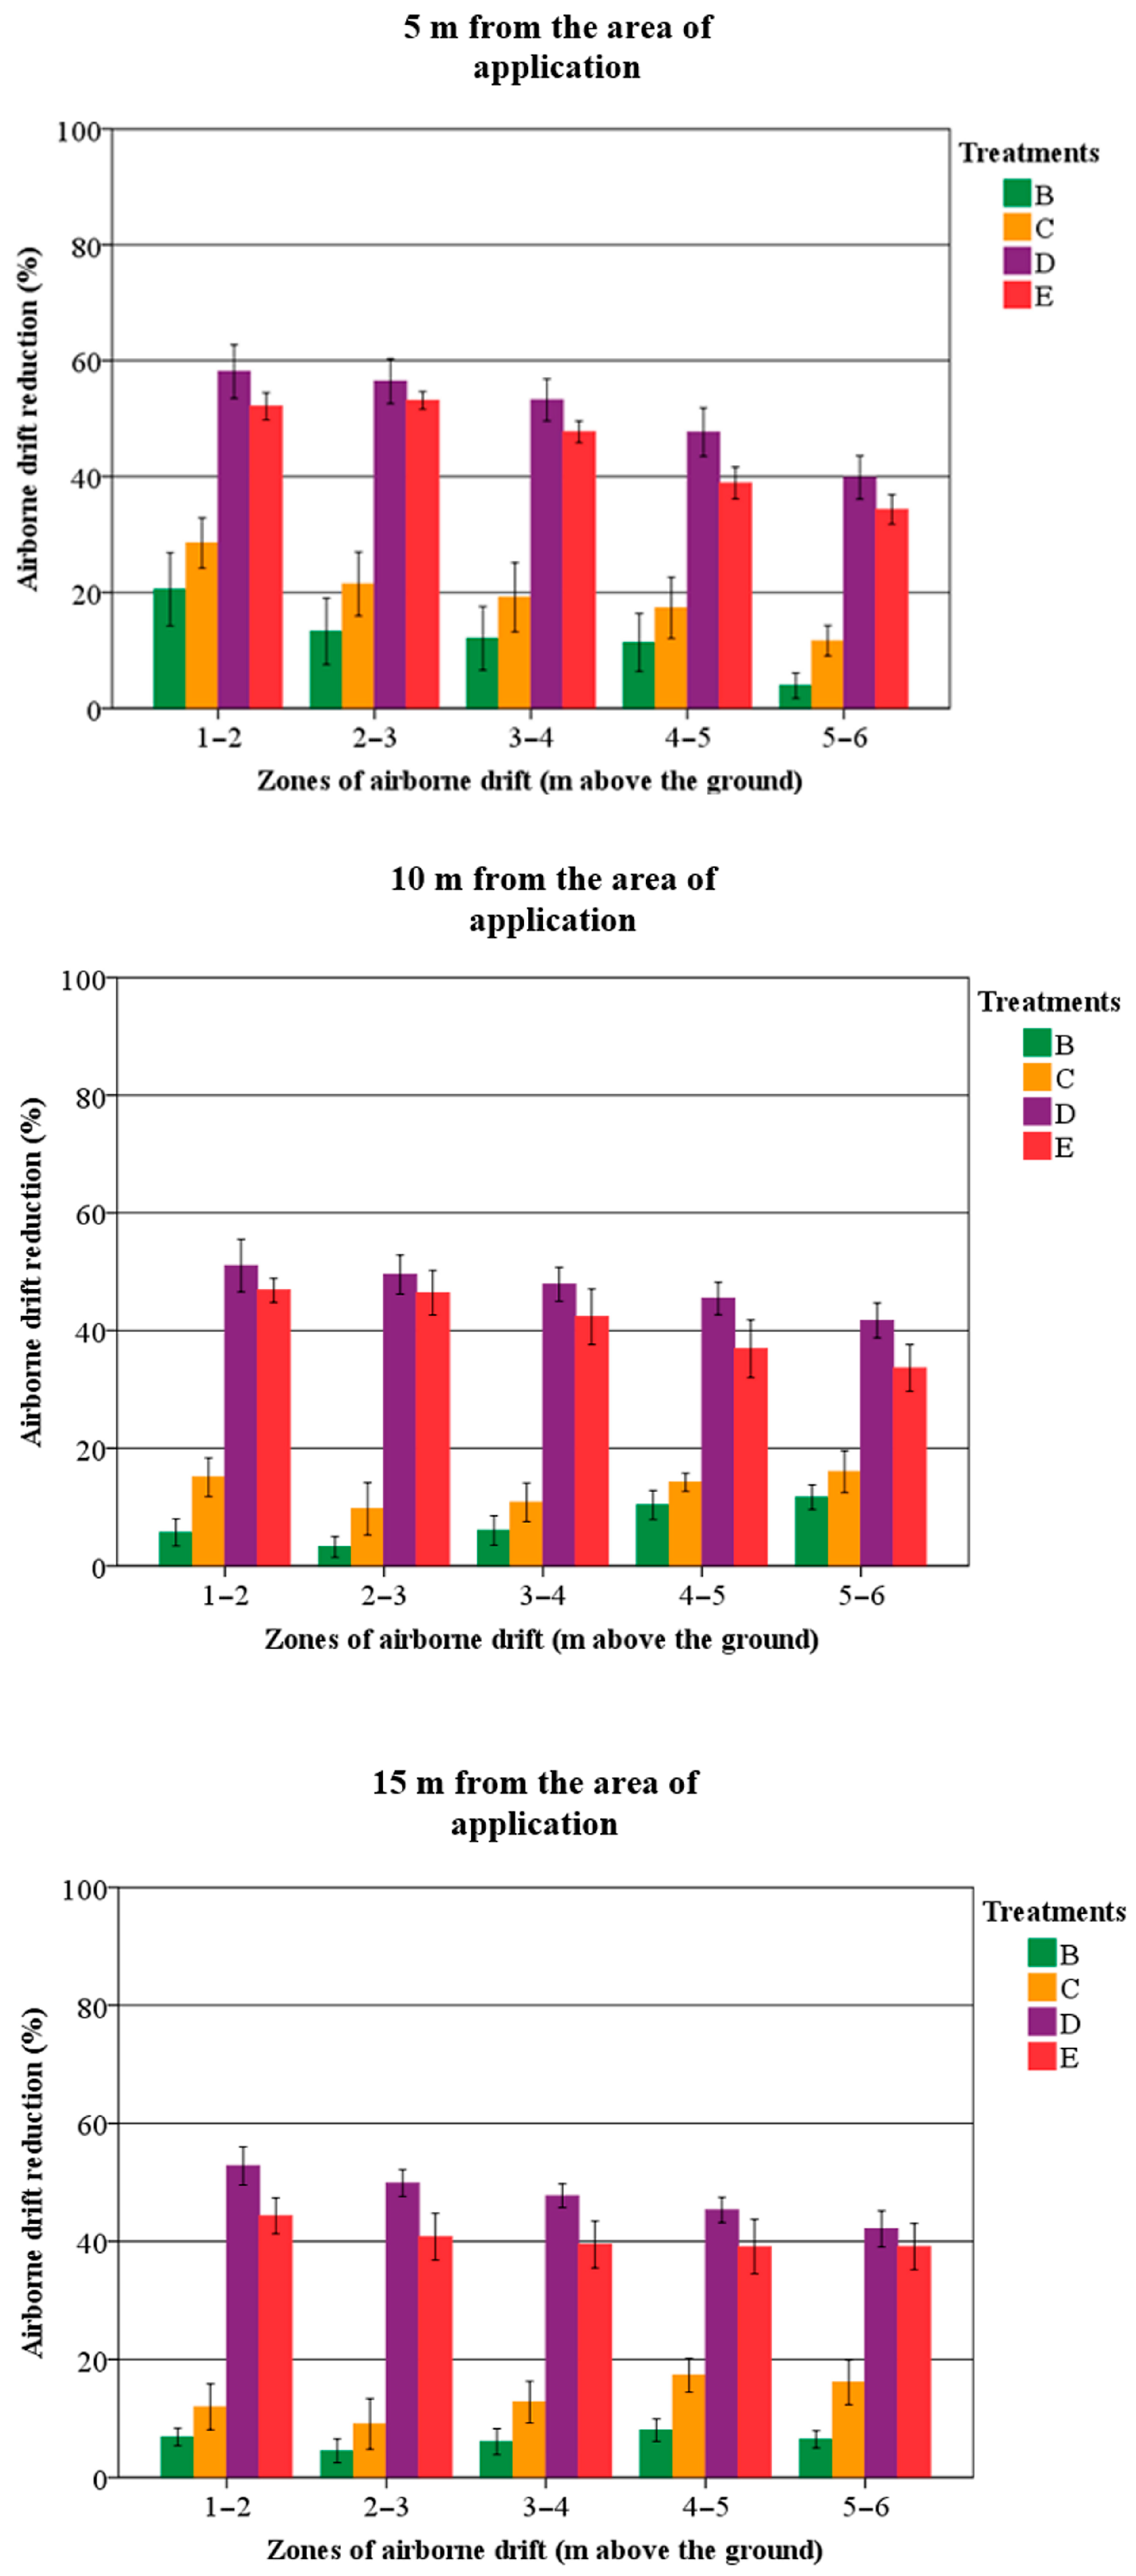
Figure 15 and Figure 16 illustrate the entire spray drift decrease achieved for all the treatments, estimated for the three distances downwind of the area of application and for the five curve zones above the ground, using Treatment A as reference. All tested treatments reduced spray drift compared to Treatment A. Similarly to the results for sedimenting drift, Treatment D achieved the highest reduction. It is also evident that although Treatment E showed less reduction of sedimenting drift in zone 1–5 m, it achieved high reduction for airborne drift at 5 m distance from the area, similar to Treatment D. More specifically, for the three distances away from the area of application, Treatment D achieved 54% at 5 m, 48% at 10 m, and 49% at 15 m. At the same time, Treatment E achieved a reduction of 48% at 5 m, 43% at 10 m, and 41% at 15 m; Treatment C achieved a reduction of 22% at 5 m, 13% at 10 m, and 13% at 15 m; and Treatment B achieved a reduction of 15% at 5 m, 7% at 10 m, and 6% at 15 m. Diving into more detail, for the 5 m away from the area of application, the results of Treatment D were a decrease of 58% at 1–2 m above the ground, 56% at 2–3 m, 53% at 3–4 m, 48% at 4–5 m, and 40% at 5–6 m. For the corresponding zones of height, Treatment E had a reduction of 52% (1–2 m), 53% (2–3 m), 48% (3–4 m), 39% (4–5 m), and 34% (5–6 m). For the 10 m away from the area of application, the reduction of Treatment D was 51% at 1–2 m above the ground, 49% at 2–3 m, 48% at 3–4 m, 45% at 4–5 m, and 42% at 5–6 m. For the 15 m away from the area of application, the reduction of Treatment D was 53% at 1–2 m above the ground, 50% at 2–3 m, 48% at 3–4 m, 45% at 4–5 m, and 42% at 5–6 m. The same trend was evident regarding the reduction caused by Treatments B, C, and E in all three distances from the area of application, as well as in the zones above the field. Treatment E was second in reduction performance after D, followed by C and then B. We can also see that higher reduction of airborne drift was achieved in the zone of lower height from the ground, while higher heights resulted in lower reduction, except for Treatments B and C at 10 m and 15 m distance from the area.
Figure 15.
Total drift reduction (%) calculated along the entire airborne drift curve obtained for each treatment tested at 5 m, 10 m, and 15 m distance from the area of application, considering Treatment A as a reference. The bars show the mean ± SE of the mean.
Figure 16.
Airborne drift reduction (%) achieved for each treatment tested at 5 m, 10 m, and 15 m distances from the area of application for the five drift curve zones (1–2, 2–3, 3–4, 4–5, and 5–6 m height above the ground), considering the Treatment A as a reference. The bars show the mean ± SE of the mean.
These findings are consistent with recent studies highlighting the importance of sprayer configuration, airflow management, and nozzle technology in reducing spray drift and improving the environmental sustainability of pesticide applications in orchard and vineyard systems. Recent research has emphasized that operational adjustments and drift-reducing technologies can significantly limit off-target deposition while maintaining application efficiency under field conditions [71,72].
4. Conclusions
This study shows that for ground collectors, the five treatments generated different amounts of sedimenting drift over distance. Compared to Treatment A, which was considered a reference, Treatments B, C, D, and E produced lower spray drift at all distances. An exception is the use of air induction nozzles (Treatment E), which produced a greater amount of sedimenting drift in the first 2 m from the edge of the vineyard compared to conventional spraying with conventional hollow-cone nozzles (Treatment A). Spraying without air support on row 1 and the outer side of row 2 (Treatment D) generated the lowest amounts of sedimenting drift at almost all distances, while with the use of air induction nozzles (Treatment E), high amounts of spray drift appeared in the first 4 m, although after 5 m the reduction of spray drift is significant, similar to that of Treatment D. With regard to spray drift reduction, Treatment E, using air induction nozzles, produced the greatest drift decreases in the zones that were furthest distant from the application area, as opposed to Treatments B and C, using conventional nozzles and one-sided spraying in the first and second rows, where the highest drift reductions were recorded in the zones closest to the area of application. Treatment D showed high levels of reduction in all zones. Regarding airborne spray drift deposition, the results indicate that increasing height above the ground resulted in decreasing spray drift deposition, particularly five meters away from the application area. It has been apparent that at each of the three locations from the application area, Treatment D achieved the lowest levels of spray drift deposition. This is also the case for the five curve zones of height above the ground. Overall, the results confirm that practical operational adjustments in conventional vineyard spraying systems can significantly influence spray drift behavior under Southern European field conditions.
In conclusion, this study highlights that for all the distances downwind of the area of application, spraying without air support in the first row and the outer side of row 2 (Treatment D) in general achieved the highest levels of sedimenting spray drift reduction, followed by the use of air induction nozzles (Treatment E), which showed similar levels of spray drift reduction, however not close to the crop (1–5 m), where drift deposition was increased. As for airborne spray drift reduction, firstly, Treatment D and, secondly, Treatment E showed the best performance in comparison to the reference treatment and all other treatments. From a practical perspective, the results indicate that simple operational adjustments to conventional vineyard sprayers, such as reducing or switching off air assistance in outer rows, can substantially decrease spray drift without requiring additional investment in specialized equipment. These findings provide practical guidance for vineyard operators aiming to reduce environmental contamination and improve the sustainability of pesticide applications while maintaining the use of standard spraying systems. These results contribute to the ongoing efforts to promote more sustainable plant protection practices and support the implementation of spray drift mitigation strategies in vineyard production systems.
Author Contributions
Conceptualization, G.B. and S.F.; methodology, G.B., M.K. and V.P.; software, G.B.; validation, G.B., M.K. and V.P.; formal analysis, G.B.; investigation, G.B., M.K. and V.P.; resources, S.F.; data curation, G.B.; writing—original draft preparation, G.B.; writing—review and editing, A.K.; visualization, G.B.; supervision, S.F. All authors have read and agreed to the published version of the manuscript.
Funding
This research received no external funding.
Institutional Review Board Statement
Not applicable.
Informed Consent Statement
Not applicable.
Data Availability Statement
The data presented in this study are available on reasonable request from the authors.
Conflicts of Interest
The authors declare no conflict of interest.
References
- Popp, J.; Peto, K.; Nagy, J. Pesticide productivity and food security. A review. Agron. Sustain. Dev. 2013, 33, 243–255. [Google Scholar] [CrossRef] [Scilit]
- Giles, D.K.; Akesson, N.B.; Yates, W.E. Pesticide application technology: Research and development and the growth of the industry. Trans. ASABE 2008, 51, 397–403. [Google Scholar] [CrossRef] [Scilit]
- Lebeau, F.; Verstraete, A.; Stainier, C.; Destain, M.-F. RTDrift: A real time model for estimating spray drift from ground applications. Comput. Electron. Agric. 2011, 77, 161–174. [Google Scholar] [CrossRef] [Scilit]
- Travis, J.W. Effect of Canopy Density on Pesticide Deposition and Distribution in Apple Trees. Plant Disease. 1987, 71, 613–615. [Google Scholar] [CrossRef] [Scilit]
- Salyani, M.; Farooq, M.; Sweeb, R.D. Spray deposition and mass balance in citrus orchard applications. Trans. ASABE 2007, 50, 1963–1969. [Google Scholar] [CrossRef] [Scilit]
- Panneton, B.; Theriault, R.; Lacasse, B. Efficacy evaluation of a new spray-recovery sprayer for orchards. Trans. ASAE 2001, 3, 473–479. [Google Scholar]
- ISO 22866:2005; Equipment for Crop Protection—Methods for Field Measurement of Spray Drift. International Organization for Standardization: Geneva, Switzerland, 2005; pp. 1–17.
- Ozkan, H.E. New Nozzles for Spray Drift Reduction. In Ohio State University Extension Fact Sheet Food Agricultural and Biological Engineering; OSU Extension Publishing: Columbus, OH, USA, 1998; p. AEX-523-98. [Google Scholar]
- Dabrowski, J.M.; Bollen, A.; Schulz, R. Combined effects of discharge. turbidity. and pesticides on mayfly behavior: Experimental evaluation of spray drift and runoff scenarios. Environ. Toxicol. Chem. 2005, 24, 1395–1402. [Google Scholar] [CrossRef] [Scilit]
- Reddy, K.N.; Ding, W.; Zablotowicz, R.M.; Thomson, S.J.; Huang, Y.B.; Krutz, L.J. Biological responses to glyphosate drift from aerial application in non-glyphosate-resistant corn. Pest Manag. Sci. 2010, 66, 1148–1154. [Google Scholar] [CrossRef] [Scilit]
- Kjaer, C.; Strandberg, M.; Erlandsen, M. Metsulfaron spray drift reduces fruit yield of hawthorn (Crataegus monogyna L.). Sci. Total Environ. 2006, 356, 228–234. [Google Scholar] [CrossRef] [Scilit]
- Marrs, R.H.; Frost, A.J. A microcosm approach to the detection of the effects of herbicide spray drift in plant communities. J. Environ. Manag. 1997, 50, 369–388. [Google Scholar] [CrossRef] [Scilit]
- Londo, J.P.; Bautista, N.S.; Sagers, C.L.; Lee, E.H.; Watrud, L.S. Glyphosate drift promotes changes in fitness and transgene gene flow in canola (Brassica napus) and hybrids. Ann. Bot. 2010, 106, 957–965. [Google Scholar] [CrossRef] [Scilit] [PubMed]
- De Schampheleire, M.; Spanoghe, P.; Brusselman, E.; Sonck, S. Risk assessment of pesticide spray drift damage in Belgium. Crop Prot. 2007, 26, 602–611. [Google Scholar] [CrossRef] [Scilit]
- Butler Ellis, M.C.; van den Berg, F.; van de Zande, J.C.; Kennedy, M.C.; Charistou, A.N.; Arapaki, N.S.; Butler, A.H.; Machera, K.A.; Jacobs, C.M. The BROWSE model for predicting exposures of residents and bystanders to agricultural use of pesticides: Comparison with experimental data and other exposure models. Biosyst. Eng. 2017, 154, 122–136. [Google Scholar] [CrossRef] [Scilit]
- Otto, S.; Mori, N.; Fornasiero, D.; Veres, A.; Tirello, P.; Pozzebon, A.; Duso, C.; Zanin, G. Insecticide drift and its effect on Kampimodromus aberrans (Oudemans) in an Italian vineyard-hedgerow system. Biosyst. Eng. 2013, 116, 447–456. [Google Scholar] [CrossRef] [Scilit]
- van De Zande, J.C.; Porskamp, H.A.J.; Michielsen, J.M.G.P.; Holterman, H.J.; Huijsmans, J.F.M. Classifications of spray applications for drift ability. to protect surface water. Asp. Appl. Biol. 2000, 57, 57–65. [Google Scholar]
- Nuyttens, D.; De Schampheleire, M.; Baetens, K.; Brusselman, E.; Dekeyser, D.; Verboven, P. Drift from field crop sprayers using an integrated approach: Results of a five-year study. Trans. ASABE 2011, 54, 403–408. [Google Scholar] [CrossRef] [Scilit]
- Gil, Y.; Sinfort, C.; Brunet, Y.; Polveche, V.; Bonicelli, B. Atmospheric loss of pesticides above an artificial vineyard during air-assisted spraying. Atmos. Environ. 2007, 41, 2945–2957. [Google Scholar] [CrossRef] [Scilit]
- Stainier, C.; Destain, M.F.; Schiffers, B.; Lebeu, F. Droplet size spectra and drift effect of two phenmedipham formulations and four adjuvants mixtures. Crop Prot. 2006, 25, 1238–1243. [Google Scholar] [CrossRef] [Scilit]
- De Schampheleire, M.; Nuyttens, D.; Baetens, K.; Cornelis, W.; Gabriels, D.; Spanoghe, P. Effects on pesticide spray drift of the physicochemical properties of the spray liquid. Precis. Agric. 2009, 10, 409–420. [Google Scholar] [CrossRef] [Scilit]
- Farooq, M.; Salyani, M. Modeling of spray penetration and deposition on citrus tree canopies. Trans. ASABE 2004, 47, 619–627. [Google Scholar] [CrossRef] [Scilit]
- Yi, C. Momentum transfer within canopies. J. Appl. Meteorol. Climatol. 2008, 47, 262–275. [Google Scholar] [CrossRef] [Scilit]
- Hofman, V.; Solseng, E. Reducing Spray Drift; North Dakota State University NDSU Extension Service AE-1210: Fargo, ND, USA, 2001. [Google Scholar]
- Threadgill, E.D.; Smith, D.B. Effect of physical and meteorological parameters on drift of controlled-size droplets. Trans. ASAE 1975, 18, 51–56. [Google Scholar] [CrossRef] [Scilit]
- Arvidsson, T. Spray drift as influenced by meteorological and technical factors. In A Methodological Study; Swedish University of Agricultural Sciences: Uppsala, Sweden, 1977; Volume 71, p. 144. [Google Scholar]
- Nuyttens, D.; Sonck, B.; De Schampheleire, M.; Steurbaut, W.; Baetens, K.; Verboven, P.; Nicolaï, B.; Ramon, H. Spray drift as affected by meteorological conditions. Commun. Agric. Appl. Biol. Sci. 2005, 70, 947–959. [Google Scholar] [PubMed]
- Kruger, R.G.; Klein, N.R.; Ogg, L.C. Spray Drift of Pesticides; University of Nebraska-Lincoln Extension: Lincoln, NE, USA, 2013; p. G1773. [Google Scholar]
- Miller, P.H.C.; Tuck, C.R. Factors influencing the performance of spray delivery systems: A review of recent developments. J. ASTM Int. 2005, 2, 1–13. [Google Scholar] [CrossRef] [Scilit]
- Douzals, J.; Heidary, M.H. How spray characteristics and orientation may influence spray drift in a wind tunnel. Asp. Appl. Biol. 2014, 122, 271–278. [Google Scholar]
- Miller, P.C.H. The measurement of spray drift. Pestic. Outlook 2003, 14, 205–209. [Google Scholar] [CrossRef] [Scilit]
- Felsot, A.S.; Unsworth, J.B.; Linders, J.B.H.J.; Roberts, G.; Rautman, D.; Harris, C.; Carazo, E. Agrochemical Spray Drift: Assessment and Mitigation—A Review. J. Environ. Sci. Health Part B 2010, 46, 1–23. [Google Scholar] [CrossRef] [Scilit]
- FOCUS. Landscape and mitigation factors. In Aquatic Risk Assessment. Extended Summary and Recommendations; Report of the FOCUS Working Group on Landscape and Mitigation Factors in Ecological Risk Assessment; EC Document Reference SANCO/10422/2005 V.2.0.; FOCUS: Mumbai, India, 2007; Volume 1, pp. 1–169. [Google Scholar]
- FOCUS. Landscape and mitigation factors. In Aquatic Risk Assessment. Detailed Technical Reviews; Report of the FOCUS Working Group on Landscape and Mitigation Factors in Ecological Risk Assessment; EC Document Reference SANCO/10422/2005 V.2.0.; FOCUS: Mumbai, India, 2007; Volume 2, pp. 1–436. [Google Scholar]
- Ucar, T.; Hall, F.R. Windbreaks as a pesticide drift mitigation strategy: A review. Pest Manag. Sci. 2001, 57, 663–675. [Google Scholar] [CrossRef] [Scilit]
- Ucar, T.; Hall, F.R.; Tew, J.E.; Hacker, J.K. Wind tunnel studies on spray deposition on leaves of tree species used for windbreaks and exposure of honey bees. Pest Manag. Sci. 2003, 59, 358–364. [Google Scholar] [CrossRef] [Scilit]
- Carlsen, S.C.K.; Spliid, N.H.; Svensmark, B. Drift of 10 herbicides after tractor spray application. Primary drift (droplet drift). Chemosphere 2006, 64, 778–786. [Google Scholar] [CrossRef] [Scilit]
- European Parliament; Council of the European Union. Directive 2009/128/EC of the European parliament and the council of 21 October 2009 establishing a framework for community action to achieve the sustainable use of pesticides. Off. J. Eur. Union 2009, 309, 71–86. [Google Scholar]
- Balsari, P.; Marucco, P.; Grella, M.; Savoia, S. Spray drift measurements in Italian vineyards and orchards. In Proceedings of the 13th Workshop on Spray Application in Fruit Growing (SuproFruit 2015), Lindau/Lake Costance, Germany, 15–18 July 2015; pp. 30–31. [Google Scholar]
- Grella, M.; Gallart, M.; Marucco, P.; Balsari, P.; Gil, E. Ground Deposition and Airborne Spray Drift Assessment in Vineyard and Orchard: The Influence of Environmental Variables and Sprayer Settings. Sustainability 2017, 9, 728. [Google Scholar] [CrossRef] [Scilit]
- Maski, D.; Durairaj, D. Effects of charging voltage, application speed, target height, and orientation upon charged spray deposition on leaf abaxial and adaxial surfaces. Crop Prot. 2010, 29, 134–141. [Google Scholar] [CrossRef] [Scilit]
- Pascuzzi, S.; Cerruto, E. Spray deposition in “tendone” vineyards when using a pneumatic electrostatic sprayer. Crop Prot. 2015, 68, 1–11. [Google Scholar] [CrossRef] [Scilit]
- Sasaki, R.S.; Teixeira, M.M.; Fernandes, H.C.; Monteiro, P.M.; Rodrigues, D.E.; Alvarenga, C.B. Parameters of electrostatic spraying and its influence on the application efficiency. Rev. Ceres 2013, 60, 474–479. [Google Scholar] [CrossRef] [Scilit]
- Khot, L.R.; Ehsani, R.; Albrigo, G.; Landers, A.J.; Larbi, P.A. Spray pattern investigation of an axial-fan airblast precision sprayer using a modified vertical patternator. Appl. Eng. Agric. 2012, 28, 647–654. [Google Scholar] [CrossRef] [Scilit]
- Dekeyser, D.; Ashenafi, T.D.; Verboven, P.; Endalew, A.M.; Hendrickx, N.; Nuyttens, D. Assessment of orchard sprayers using laboratory experiments and computational fluid dynamics modelling. Biosyst. Eng. 2013, 114, 157–169. [Google Scholar] [CrossRef] [Scilit]
- Holownicki, R.; Doruchowski, G.; Godyn, A.; Swiechowski, W. Variation of spray deposit and loss with air-jet directions applied in orchards. J. Agric. Eng. Res. 2000, 77, 129–136. [Google Scholar] [CrossRef] [Scilit]
- Holownicki, R.; Doruchowski, G.; Swiechowski, W. Uniformity of spray deposit within apple tree canopy as affected by direction of the air-jet in tunnel sprayers. J. Fruit Ornam. Plant Res. 1997, 3–4, 129–136. [Google Scholar]
- Pergher, G.; Gubiani, R.; Cividino, S.R.S.; Dell’Antonia, D.; Lagazio, C. Assessment of spray deposition and recycling rate in the vineyard from a new type of air-assisted tunnel sprayer. Crop Prot. 2013, 45, 6–14. [Google Scholar] [CrossRef] [Scilit]
- Fox, R.D.; Derksen, R.C.; Zhu, H.; Brazee, R.D.; Svensson, S.A. A history of air-blast sprayer development and future prospects. Trans. ASABE 2008, 51, 405–410. [Google Scholar] [CrossRef] [Scilit]
- Llorens, J.; Gil, E.; Llop, J.; Escolà, A. Variable rate dosing in precision viticulture: Use of electronic devices to improve application efficiency. Crop Prot. 2010, 29, 239–248. [Google Scholar] [CrossRef] [Scilit]
- Gil, E.; Escolà, A.; Rosell, J.; Planas, S.; Val, L. Variable rate application of plant protection products in vineyard using ultrasonic sensors. Crop Prot. 2007, 26, 1287–1297. [Google Scholar] [CrossRef] [Scilit]
- Koch, H.; Weisser, P. Sensor equipped orchard spraying—Efficacy, savings and drift reduction. Asp. Appl. Biol. 2000, 57, 357–362. [Google Scholar]
- Gil, E.; Landers, A.; Gallart, M.; Llorens, J. Development of two portable patternators to improve drift control and operator training in the operation of vineyard sprayers. Span. J. Agric. Res. 2013, 11, 615–625. [Google Scholar] [CrossRef] [Scilit]
- Rautmann, D. Drift reducing sprayers -Testing and listing in Germany. In ASAE Meeting; ASAE: St. Joseph, MI, USA, 2003; p. 031095. [Google Scholar]
- Wenneker, M.; Heijne, B.; van de Zande, J.C. Effect of air induction nozzle (coarse droplet), air assistance and one-sided spraying of the outer tree row on spray drift in orchard spraying. Annu. Rev. Agric. Eng. 2005, 4, 116–128. [Google Scholar]
- Gil, E.; Balsari, P.; Gallart, M.; Llorens, J.; Marucco, P.; Andersen, P.G.; Fàbregas, X.; Llop, J. Determination of drift potential of different flat fan nozzles on a boom sprayer using a test bench. Crop Prot. 2014, 56, 58–68. [Google Scholar] [CrossRef] [Scilit]
- Bourodimos, G.; Koutsiaras, M.; Psiroukis, V.; Balafoutis, A.; Fountas, S. Development and Field Evaluation of a Spray Drift Risk Assessment Tool for Vineyard Spraying Application. Agriculture 2019, 9, 181. [Google Scholar] [CrossRef] [Scilit]
- Grella, M.; Marucco, P.; Manzone, M.; Gallart, M.; Balsari, P. Effect of sprayer settings on spray drift during pesticide application in poplar plantations (Populus spp.). Sci. Total Environ. 2017, 578, 427–439. [Google Scholar] [CrossRef] [Scilit]
- ISO 22369-1:2006; Crop Protection Equipment—Drift Classification of Spraying Equipment—Part 1: Classes. International Organisation for Standardisation ISO: Geneva, Switzerland, 2006.
- Shapiro, S.S.; Wilk, M.B. An analysis of variance test for normality (complete samples). Biometrika 1965, 52, 591–611. [Google Scholar] [CrossRef] [Scilit]
- Levene, H. Robust tests for equality of variances. In Contributions to Probability and Statistics: Essays in Honor of Harold Hotelling; Olkin, I., Ghyrye, S.G., Hoeffding, W., Madow, W.G., Mann, H.B., Eds.; Stanford University Press: Palo Alto, CA, USA, 1960; pp. 278–292. [Google Scholar]
- Tukey, J. Comparing Individual Means in the Analysis of Variance. Biometrics 1949, 5, 99–114. [Google Scholar] [CrossRef] [Scilit] [PubMed]
- Pearson, K. Notes on regression and inheritance in the case of two parents. Proc. R. Soc. Lond. 1895, 58, 240–242. [Google Scholar] [CrossRef] [Scilit]
- Gil, E.; Llorens, J.; Montserrat Gallart, M.; Gil-Ribes, J.A.; Miranda-Fuentes, A. First attempts to obtain a reference drift curve for traditional olive grove’s plantations following ISO 22866. Sci. Total Environ. 2018, 627, 349–360. [Google Scholar] [CrossRef] [Scilit] [PubMed]
- Torrent, X.; Garcera, C.; Molto, E.; Chueca, P.; Abad, R.; Grafulla, C.; Roman, C.; Planas, S. Comparison between standard and drift-reducing nozzles for pesticide application in citrus: Part, I. Effects on wind tunnel and field spray drift. Crop Prot. 2017, 96, 130–143. [Google Scholar] [CrossRef] [Scilit]
- Heijne, B.; Wenneker, M.; van de Zande, J.C. Air inclusion nozzles don’t reduce pollution of surface water during orchard spraying in The Netherlands. International advances in pesticide application. Asp. Appl. Biol. 2002, 66, 193–200. [Google Scholar]
- Cross, J.V.; Ridout, M.S.; Walklate, P.J. Adjustment of axial fan sprayers to orchard structure. Bull. OILB/SROP 1997, 20, 86–94. [Google Scholar]
- Balsari, P.; Marucco, P. Sprayer Adjustment and Vine Canopy Parameters Affecting Spray Drift: The Italian Experience. In Proceedings of the International Conference on Pesticide Application for Drift Management, Waikoloa, HI, USA, 27–29 October 2004; pp. 109–115. [Google Scholar]
- van de Zande, J.C.; Butler Ellis, M.C.; Wenneker, M.; Walklate, P.J.; Kennedy, M. Spray drift and bystander risk from fruit crop spraying. Asp. Appl. Biol. 2014, 122, 177–185. [Google Scholar]
- Bird, S.L.; Esterly, D.M.; Perry, S.G. Atmospheric pollutants and trace gases. Off-target deposition of pesticides from agricultural aerial spray applications. J. Environ. Qual. 1996, 25, 1095–1104. [Google Scholar] [CrossRef] [Scilit]
- Grella, M.; Gallart, M.; Marucco, P.; Balsari, P.; Gil, E. Spray drift assessment in vineyards: Influence of sprayer settings and environmental conditions. Biosyst. Eng. 2020, 191, 1–12. [Google Scholar]
- Gil, E.; Gallart, M.; Llop, J.; Balsari, P. Influence of sprayer technology on pesticide spray drift in orchards and vineyards. Agriculture 2021, 11, 845. [Google Scholar]

Disclaimer/Publisher’s Note: The statements, opinions and data contained in all publications are solely those of the individual author(s) and contributor(s) and not of MDPI and/or the editor(s). MDPI and/or the editor(s) disclaim responsibility for any injury to people or property resulting from any ideas, methods, instructions or products referred to in the content. |
© 2026 by the authors. Licensee MDPI, Basel, Switzerland. This article is an open access article distributed under the terms and conditions of the Creative Commons Attribution (CC BY) license.