


Abstract
Research is needed to improve walnut drying throughput and energy consumption in hulling plants, but current methods for sampling nuts in commercial drying bins and measuring nut moisture content limit the capacity to investigate the drying process thoroughly. A novel apparatus for obtaining walnut samples at multiple depths and locations in stadium drying bins and a novel rapid method for accurately determining walnut in-shell moisture content were developed. A second rapid moisture measurement method involving near-infrared light (NIR) was also investigated. The sampling apparatus consisted of three sampling columns installed in each walnut drying bin. Each column had gate valves at four elevations, admitting approximately 30 in-shell walnuts to rectangular buckets hanging on a cable just below each gate valve. To collect samples, the gates were opened and closed, the buckets were withdrawn, the nut samples were collected and sealed in labeled bags, and then the buckets were returned to the column to be ready for the next sampling interval. This configuration, sampling nuts at four levels across three locations in the drying bin, allowed better moisture content variability investigation during in-bin walnut drying. The rapid moisture content measurement method consisted of selecting twelve representative in-shell walnuts from each sample and grinding them in a mill. Twelve grams were sub-sampled from the well-mixed ground material and dried in an oven at 105 ± 1 °C for 3 h, then reweighed to determine moisture loss. The coefficient of variation for sub-samples within an individual sample (n = 4) averaged 2.65% for moisture contents ranging from 6% to 47% dry basis. The rapid moisture content measurement method reduced the drying time from 24 h to 3 h compared to conventional oven drying method, with an accuracy of ±0.5 to 1.5% of the full moisture content range. The best correlation observed between the NIR methodology and the rapid moisture content method was 0.74 R2. These new in-bin walnut sampling and moisture-content measurement methods will accelerate future research aimed at improving walnut drying at commercial huller facilities.
1. Introduction
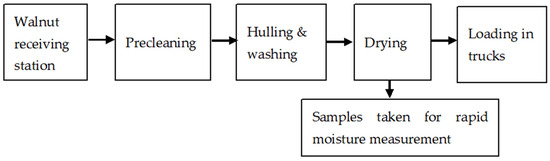
Walnuts, such as those harvested from Persian walnut or English walnut (Juglans regia) trees, require immediate drying after hulling to a safe storage moisture content of 8% in-shell, corresponding to a kernel moisture content of 4.3% (wet basis). Figure 1 shows the flow diagram for walnut processing in a commercial huller plant. The unit operations in walnut huller plants include (a) machines to remove the green outer husk, (b) washing and cleaning to remove any residue, (c) de-rocking and sorting to remove the dirt, rocks, and sticks, (d) floatation to remove the bad nuts, and (e) drying in bins to reduce the moisture to <8.1 (d.b.) for transport and safe storage.
Figure 1.
Flow diagram for walnut processing in a commercial huller plant.
Drying walnuts with heated air to reduce the moisture content to increase the shelf-stability and preserving the quality began in the 1880s, and by 1929, more than half of the California walnut crop was dried using hot air. University of California research established that 43 °C (110 °F) is the maximum temperature to which walnuts can be exposed without kernel damage [1]. In California today, where 99% of U.S. walnuts are produced, drying involves forcing hot air through freshly hulled walnuts in boxes, trailers, or bins. Most walnuts are dried in stationary (stadium) bins that hold 900 to 4500 kg (1 to 5 tons) and have sloped floors (25° to 30°) to facilitate material handling. Stadium bins are arranged in rows above hot air plenums and have expanded metal floors to admit hot air (typically 15–25 m3 min−1 per m3 of bin volume, or cfm per cubic foot) [2].
Originally, heat was provided by wood or oil furnaces. Currently, heat for drying is generated from propane and natural gas burners, requiring a range of 1.41 MJ per kg of nuts (12.2 Therm ton−1) [3] to 1.80 MJ kg−1 (15.5 Therm ton−1) [4]. Dryer fuel accounts for 51.3% of total operating costs for walnut hulling facilities [4], with the remaining costs comprising mechanical preprocessing such as precleaning and washing, labor, maintenance, and other utilities. While propane and natural gas are readily available, safe to use, and easy to control, managing operating costs and reducing burner emissions to comply with increasingly stringent environmental regulations necessitates research to improve drying efficiency while maximizing processing rate.
Before approximately 1920, the drying process was conducted on wooden trays in the open, which was weather-dependent and labor-intensive [2]. This method was partly supplanted by drying in covered facilities with natural convection or forced ambient air [5], a concept reexamined during the energy crisis of the 1970s [6]. Indirect solar drying has also been studied to replace sun drying in the open [7]. More recently, research teams have investigated walnut drying in a laboratory setting, with emphasis on understanding the drying mechanism, drying technologies, and quality changes in walnuts [8,9,10,11]. Some of the drying methods tested by these authors include (a) laboratory oven, (b) stepwise high temperature air drying and walnuts dried by sequential infrared and heated air drying (SIRHA) (c) ambient solar conditions (d) natural drying, (e) hot air drying, (f) vacuum freeze-drying, (g) vacuum drying, and (h) microwave drying as alternative methods to conventional drying. These authors concluded that the drying method, drying temperature, and drying time have a significant impact on quality, including kernel color change, concealed damage, and oil quality. They concluded that oven drying affects lipid oxidation in walnuts, with no significant impact on kernel color, while natural ambient drying has a greater impact on kernel color, mainly by altering metabolites. Microwave-dried and vacuum freeze-dried walnuts were closer to fresh samples in terms of sensory characteristics. Vacuum freeze-drying had the highest protein and total phenolic contents, better antioxidant activity, and optimal rehydration performance. Whereas the samples dried with hot air and microwave drying had more volatile compounds, resulting in better overall flavor quality of the walnuts. Also, hot air drying produced the highest levels of amino acids and fatty acids, and showed better aroma characteristics. Researchers also developed alternative combination drying technologies at scale, with throughputs of about 12 tons per hour, to reduce energy consumption during walnut drying [12]. These researchers developed infrared (IR) technology for commercial walnut hulling facilities to pre-dry the walnuts before they are finally dried in the walnut bins. The studies indicated that IR pre-drying walnuts for 180–225 s reduces surface moisture by about 3–5% and, when followed by hot-air drying, resulted in energy savings of 13–26 percent for both low- and high-moisture walnuts, respectively, compared with hot-air drying alone. To date, none of these novel methods has been adopted by the walnut industry.
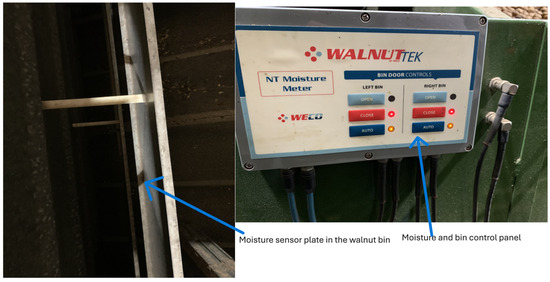
For commercial walnut drying and drying research, accurate moisture content measurements are essential. Walnut hulling plants in the U.S. measure moisture content in the walnut bins using electronic moisture sensors. Figure 2 shows a typical sensor plate used to detect in-bin walnut moisture and an individual bin control panel (which closes the hot air louvers once the nuts have reached their target moisture level). In-bin sensors directly contact the walnuts and measure electrical conductivity between them and the bin wall. Higher conductivity indicates a higher moisture content, as water conducts electricity better than dry material. A moisture-sensing plate is installed in each bin, typically at the front end of the bin and above the walnut discharge point. The moisture in each bin is displayed at a central location via computer.
Figure 2.
Moisture sensor plate and control panel in a commercial walnut hulling facility.
For research, typically, walnut moisture content is determined gravimetrically using a hot-air drying oven at 100 to 105 °C for 7 h to 24 h or until there is no change in dry weight, for whole walnuts [13], for hulls, shells, and kernels analyzed separately [14,15,16], and for halved walnuts [17]. Alternatively, 30 g sub-samples of walnuts ground in a blender were dried until there was no change in mass, usually requiring two days [6]. A rapid and accurate method to determine walnut moisture content would greatly accelerate drying research.
Most drying studies reported in the literature focus on drying walnuts in a laboratory environment with a focus on understanding quality changes. Literature on developing sampling systems and rapid moisture-measurement methodologies to reduce research drying time and sample size is not available. While standard practices may cover kernel moisture content determination [18], published approaches to in-shell moisture content determination are inconsistent and slow, and it was not easy to elucidate from the literature what might be considered best practices for determining in-shell walnut moisture content during drying at commercial hulling facilities. Further, there is no published literature on the development of systems for sampling multiple locations in commercial walnut drying bins (which hold about 5 tons of walnuts) to understand moisture variability, on rapid walnut moisture content measurement methods to facilitate drying research, nor data from continuous sampling during drying at a commercial walnut hulling facility. These date gaps and discussions with walnut hulling facility managers emphasized the need to develop a system to sample walnuts from different levels and locations in commercial walnut drying bins for moisture content variability assessments and a high-throughput methodology for walnut moisture content measurement to advance innovative walnut drying research.
The overall objective was to design a walnut sampling system and a rapid method for determining moisture content in commercial walnut drying bins. The specific objectives of this research were (a) to design and develop a walnut sampling system to collect walnut samples at different depths and locations within commercial walnut drying bins to understand moisture distribution during the drying process, (b) to evaluate the walnut sampling system developed at USDA-ARS, Southwestern Cotton Ginning Research Laboratory, Las Cruces, New Mexico, USA (SWCGRL), (c) to develop rapid walnut moisture content measurement method, (d) to compare the novel moisture content measurement method to the conventional oven drying method, (e) to compare walnut moisture content measurement sample preparation methods, including extended storage time, and (f) to test an alternative near-infrared (NIR) rapid moisture measurement method.
2. Materials and Methods
2.1. Novel Sampling System Developed for Commercial Walnut Processing Facility
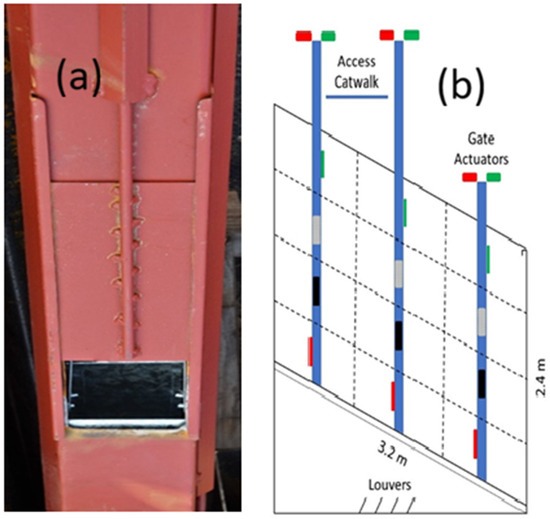
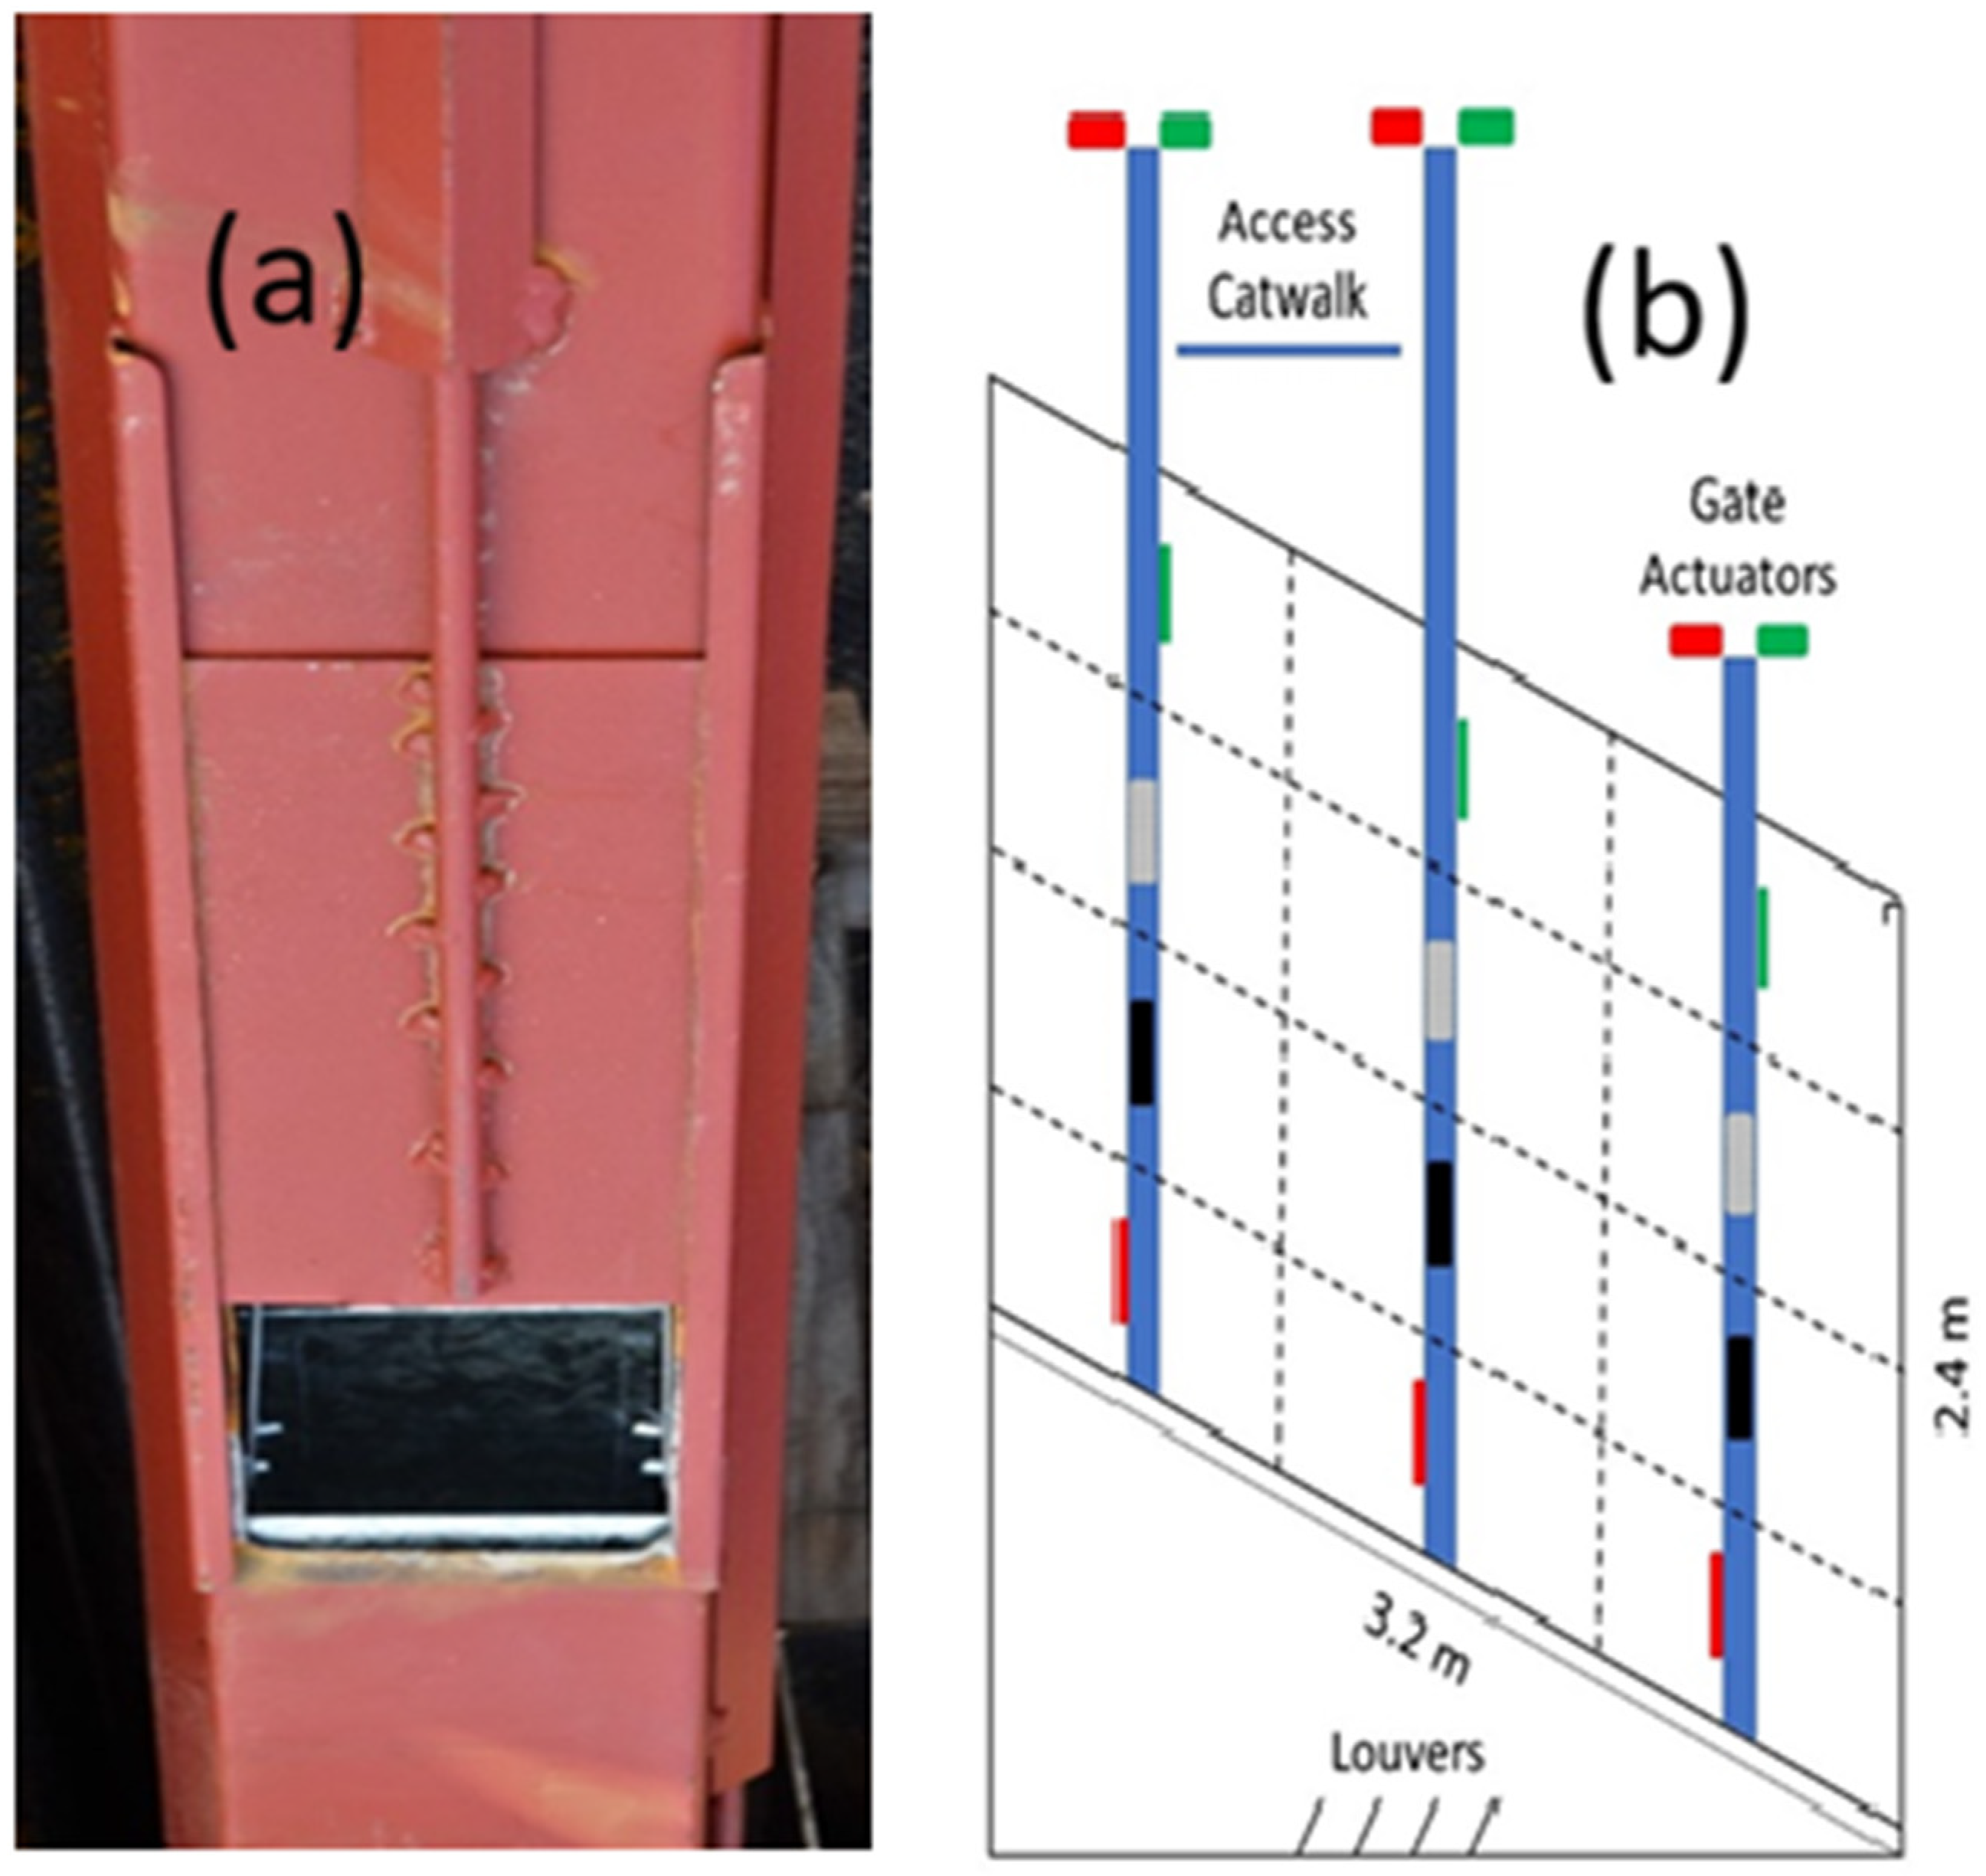
A commercial walnut stadium drying bin has a capacity of approximately 5 tons of material. To effectively monitor moisture content changes in the walnuts during the typical 18- to 24-h batch drying period, it is crucial to obtain representative samples from different depths and locations within the drying bin. The goal was to design a walnut sample collection system to gather around thirty nuts—minimizing the influence of variability among individual nuts—from the centroid of twelve distinct zones in each bin, at four different vertical levels and three horizontal locations. This meant retrieving about thirty nuts from 0.3 to 2.1 m (1 to 7 ft) below the surface since the cooperating commercial hulling plant’s drying bins were 2.4 m (8 ft) deep and 3.2 m (10 ft) from front to back (up slope, Figure 3). Past studies placed mesh bags of walnuts within the walnut pile to be retrieved at different times during drying [19,20]. Experiments conducted at SWCGRL determined that the force required to lift a mesh sample bag of thirty walnuts through 2 m (6 feet) of wet in-shell walnuts would exceed 227 kg (500 lbs.), a logistical impracticality. SWCGRL developed an apparatus that supports a fast and accurate method for obtaining a large number of samples necessary for high temporal and spatial resolution, with replication, required to understand moisture content variability during drying.
Figure 3.
(a) Photo of sampling column with gate valve open and rectangular bucket inside. Only this proof-of-concept column was painted; columns used in the study were unfinished to avoid contaminating the nuts. (b) drying bin diagram showing dimensions, zones, sampling apparatuses, and louvers above the hot air plenum.
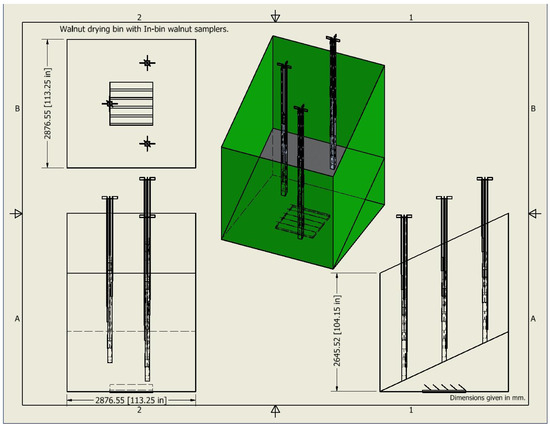
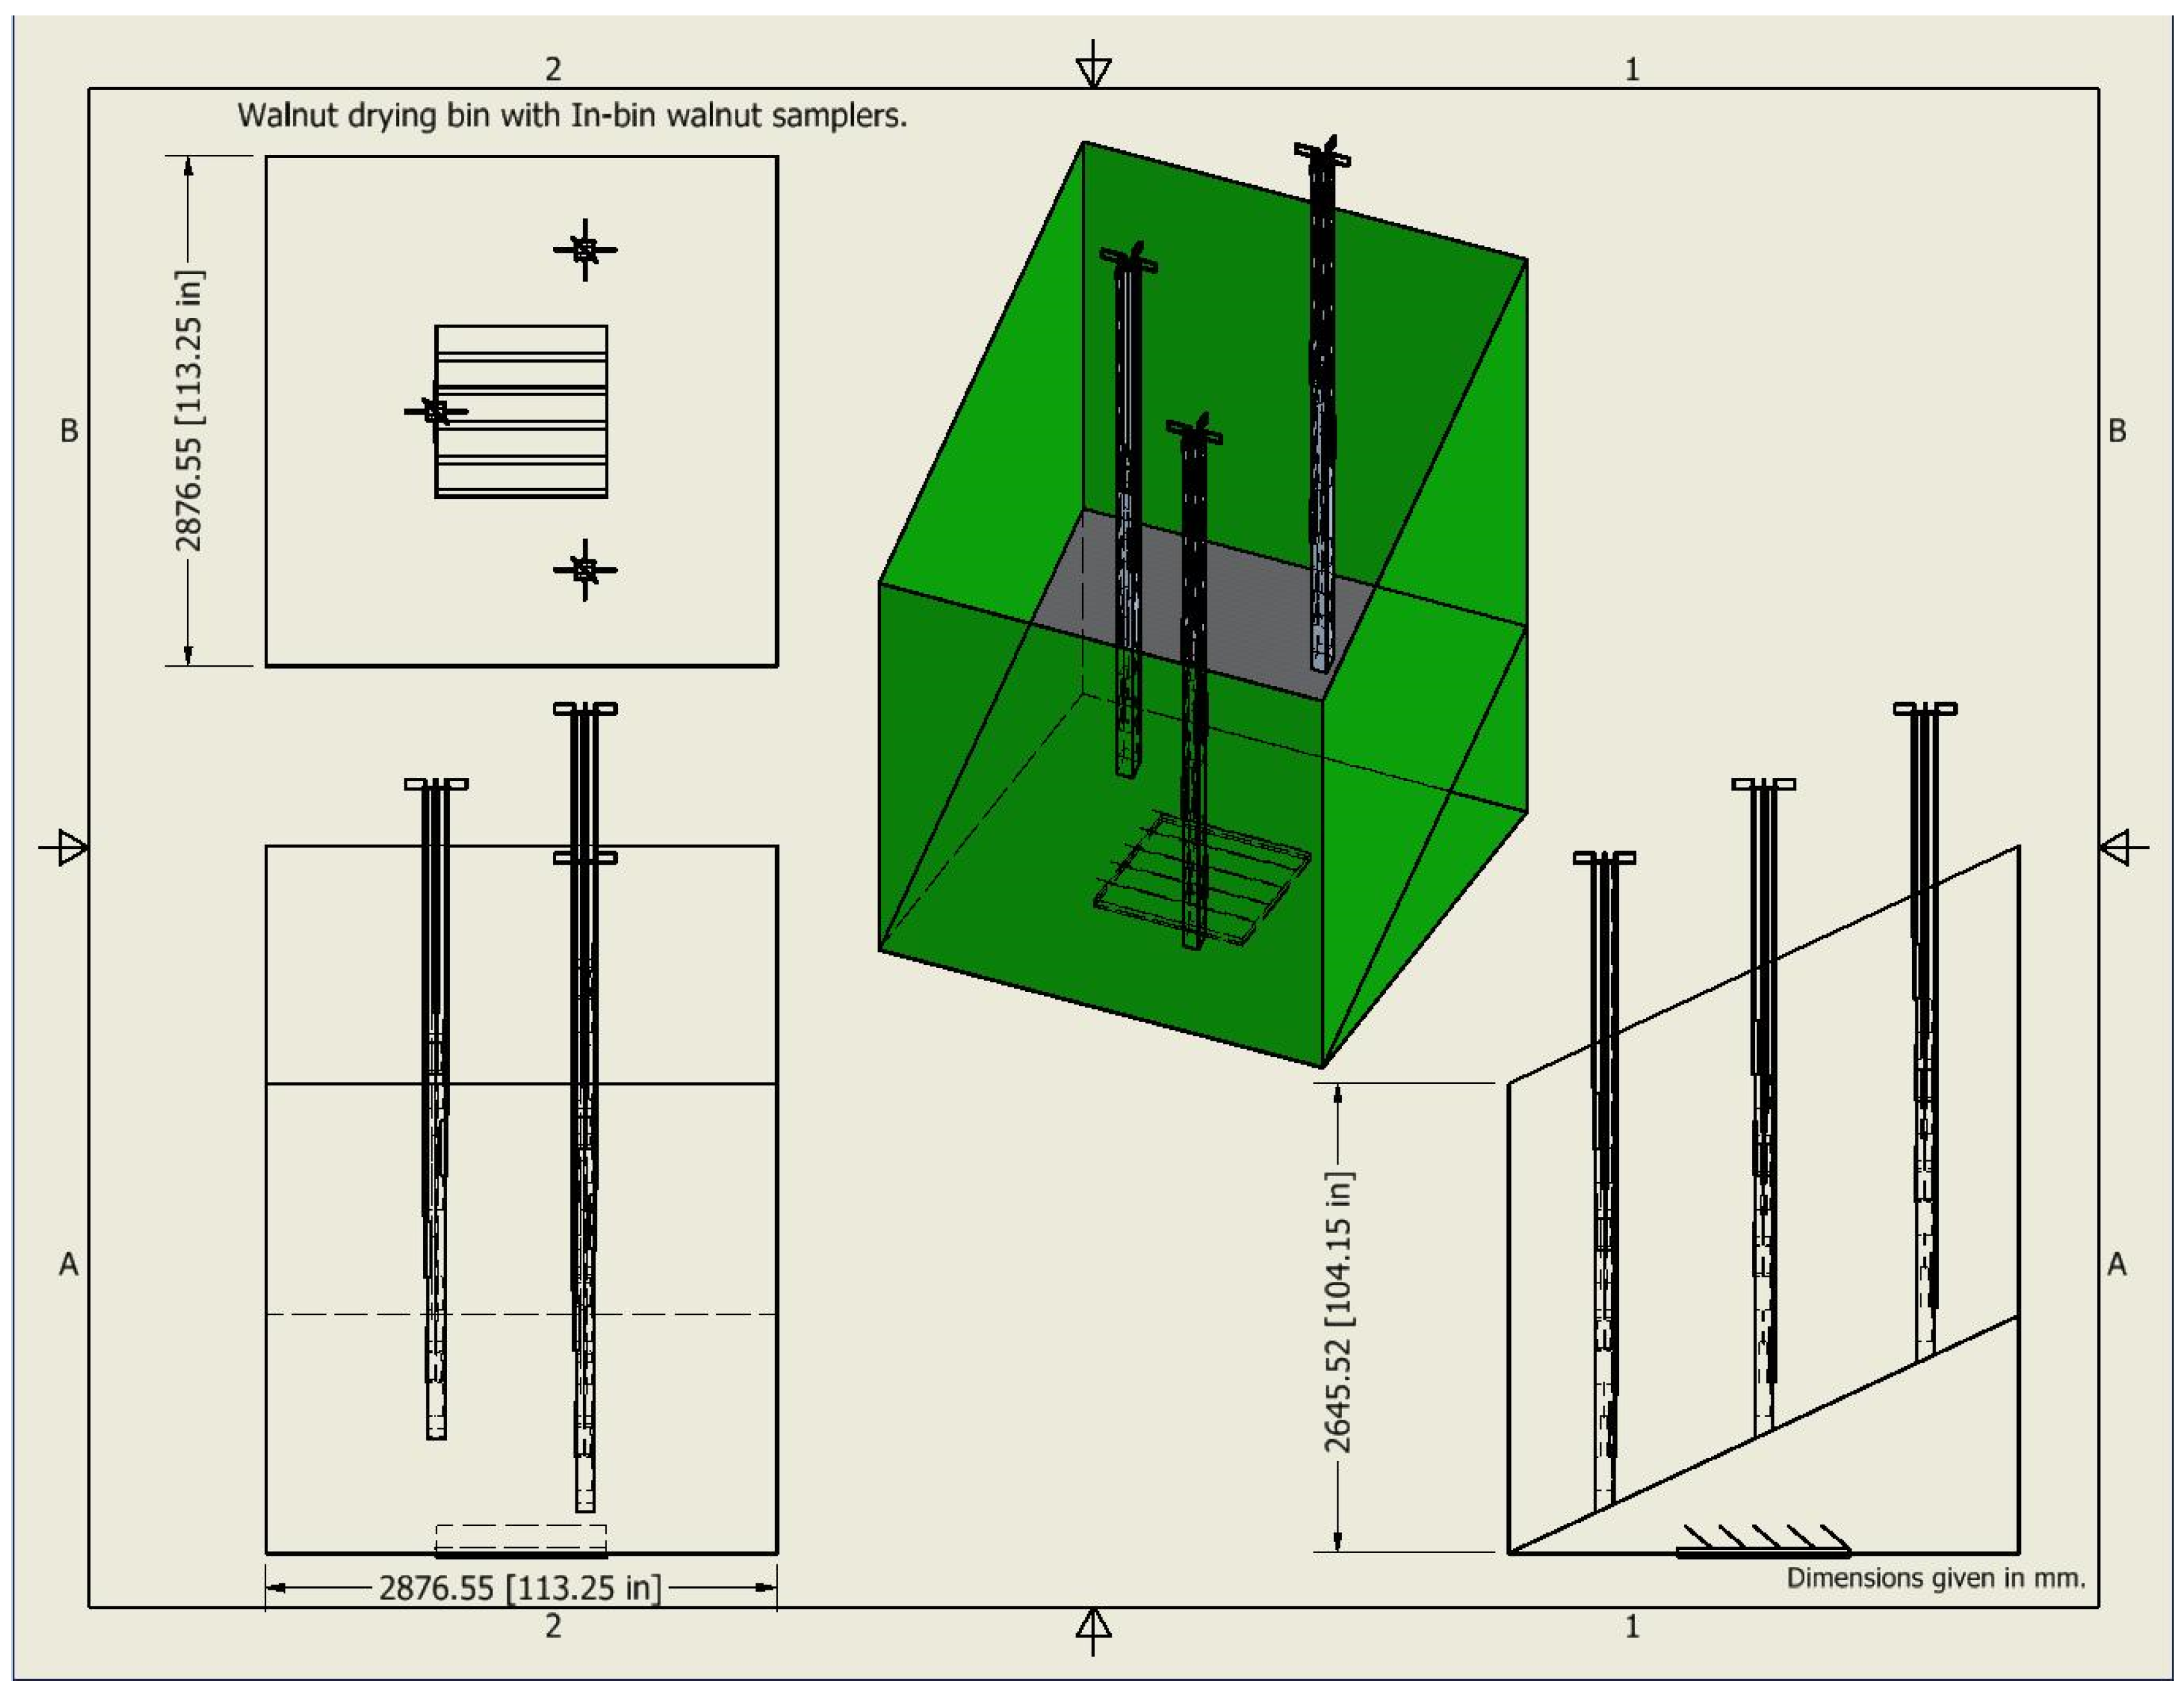
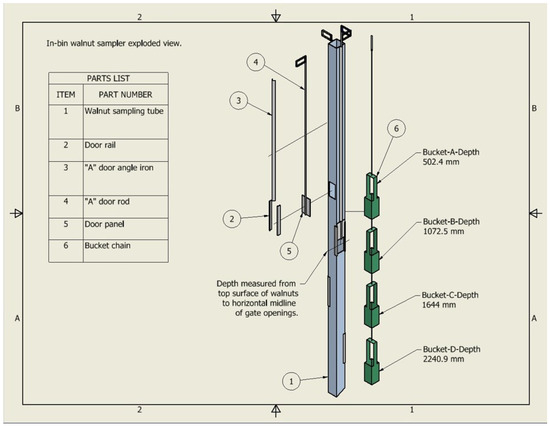
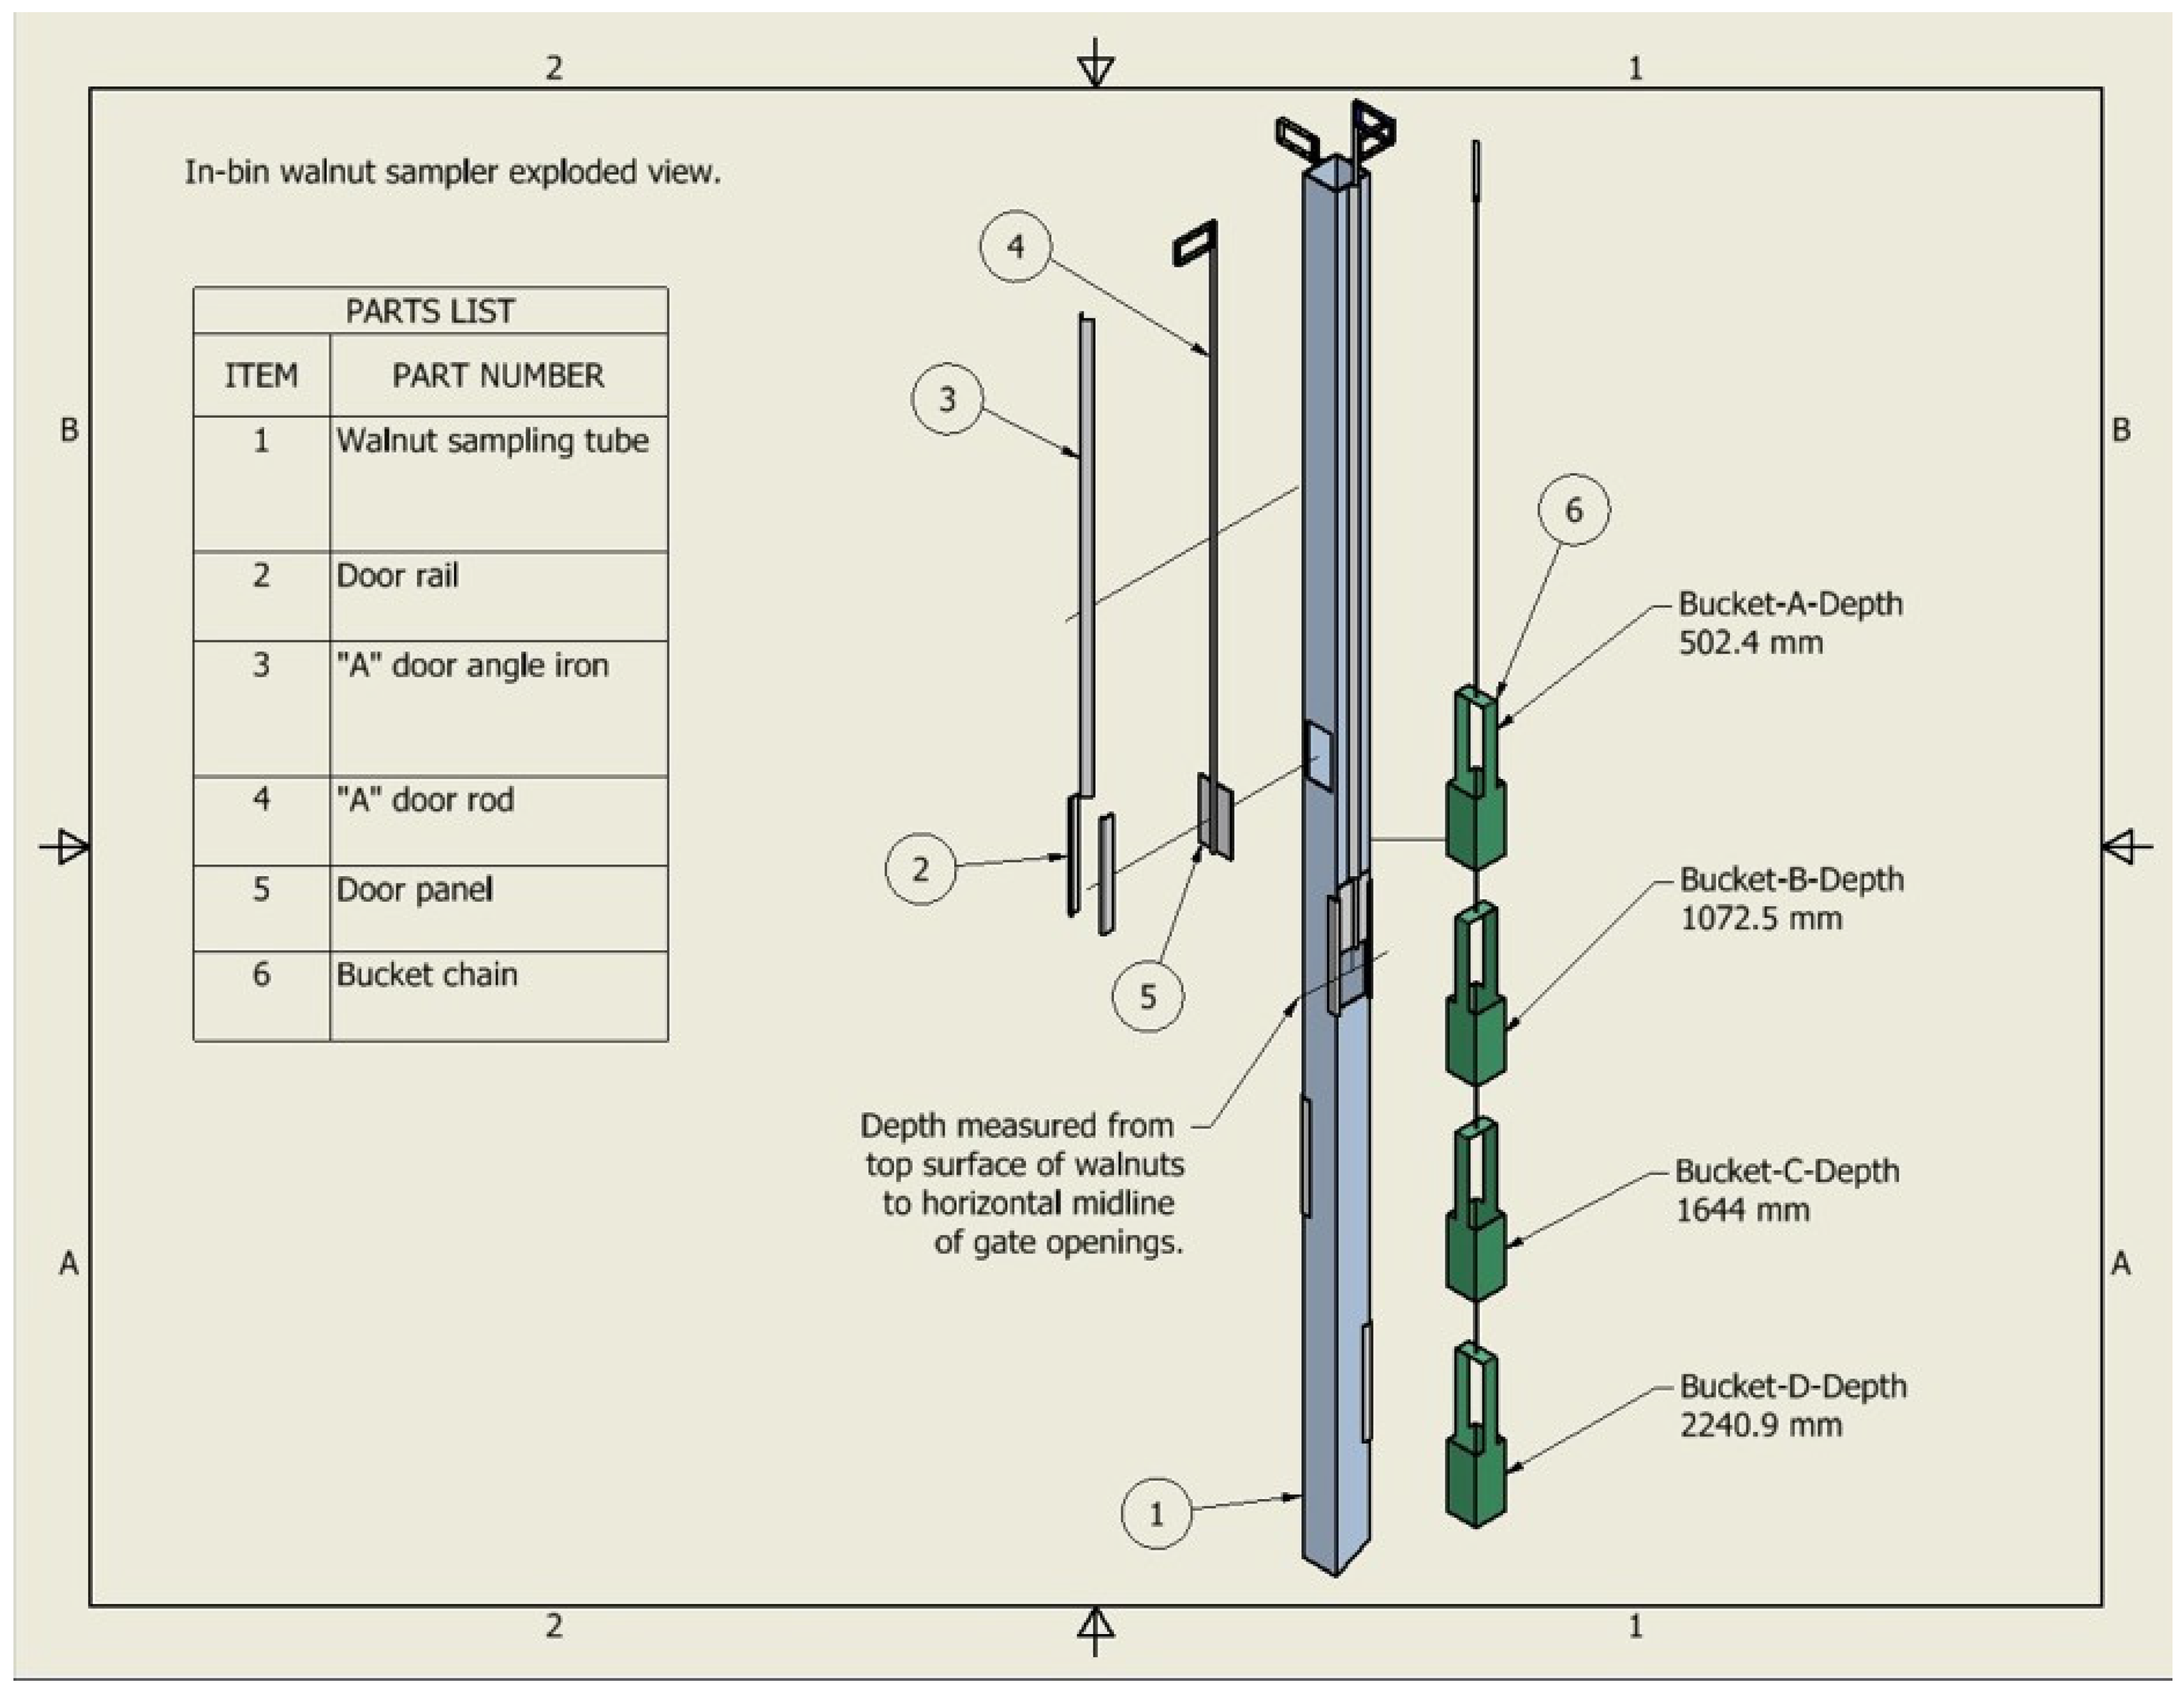
Figure 4 gives the dimensions of the commercial walnut bins with the in-bin walnut sampling columns. The sampling system developed aims to collect walnut samples from different depths and locations within the bins, which will help understand the uniformity of the drying process currently practiced by the industry. For this project, three sampling columns were installed in each walnut drying bin, supported by catwalks and steps that provided safe access. Each in-bin sampler consisted of four rectangular sample buckets, sized to hold about 30 nuts, and located at different depths inside a 3657.60-mm tall column with 101.6 mm × 101.6 mm (4 in. × 4 in.) cross-section (Figure 5). The buckets were connected at uniform intervals using aircraft cables. On each face of the square tubing at four different heights, a gate valve was installed that opened by pulling a handle at the top to allow walnuts to enter and settle in the associated sample bucket inside (Figure 3). The characteristic depth below the surface of the walnuts for the collected samples was the horizontal midline of a gate valve opening positioned for each sampling bucket. The depth for Bucket “A” gate was 502 mm, depth for Bucket B gate was 1072.5 mm, depth for Bucket C was 1644 m, and depth for Bucket D was 2240.9 mm (Figure 5). A complete set of CAD diagrams of the commercial walnut drying bin and sampling system is in the Supplementary File associated with this manuscript.
Figure 4.
CAD diagram of the walnut bin and location of the sampling columns.
Figure 5.
CAD diagram of the sampling column with ports and buckets (labeled A–D, where A is the top port/bucket and D is the bottom port/bucket).
Using this sampling system, we collected samples during drying studies to understand the moisture content loss in the walnuts during drying. In the first year (2021), we collected 96 samples from each bin for each 24-h drying test. In 2022, we optimized the sample selection time based on the 2021 tests, reducing the number of samples to 60 from each bin for each drying test to obtain representative data and enable us to understand the moisture content loss phenomenon during walnut drying.
Walnut Sampling Process
Various researchers have investigated the impact of sampling location and size on moisture measurements of walnut samples. Sampling location and interval varied as did the sample size: 7 nuts ground in a blender [6]; 10 nuts [7]; 20 to 30 nuts [19]; and approximately 50 nuts (600 g) that were placed in mesh bags and were collected from the dryer every two hours [19]. In another study, mesh bags containing 30 nuts were placed at the bottom and top of a bin and retrieved when drying was finished [20]. The data reported by earlier researchers does not investigate sampling the walnuts in commercial walnut bins continuously. In this study, the researchers at SWCGRL collaborated with a commercial walnut hulling facility in California to continuously sample the walnuts during drying and quantify drying system performance to develop a data set for understanding the moisture content removal during walnut drying, which typically takes about 18–24 h. These trials also provided data used to support the development of numerical models for commercial walnut drying bins [21]. In other words, moisture content analysis throughput was just as important as accuracy and precision, and we feel our novel solution achieved both ends. Further work on designing and implementing novel systems that will reduce drying time and thus increase fuel use efficiency and reduce operating costs will be reported elsewhere.
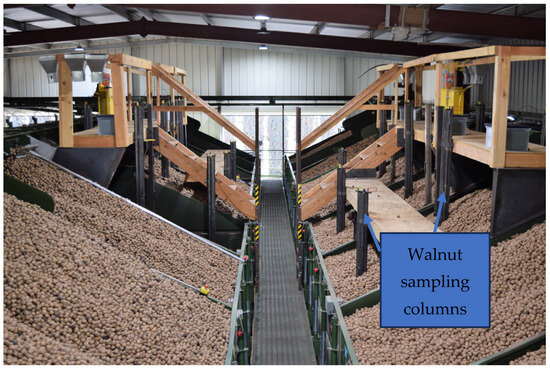
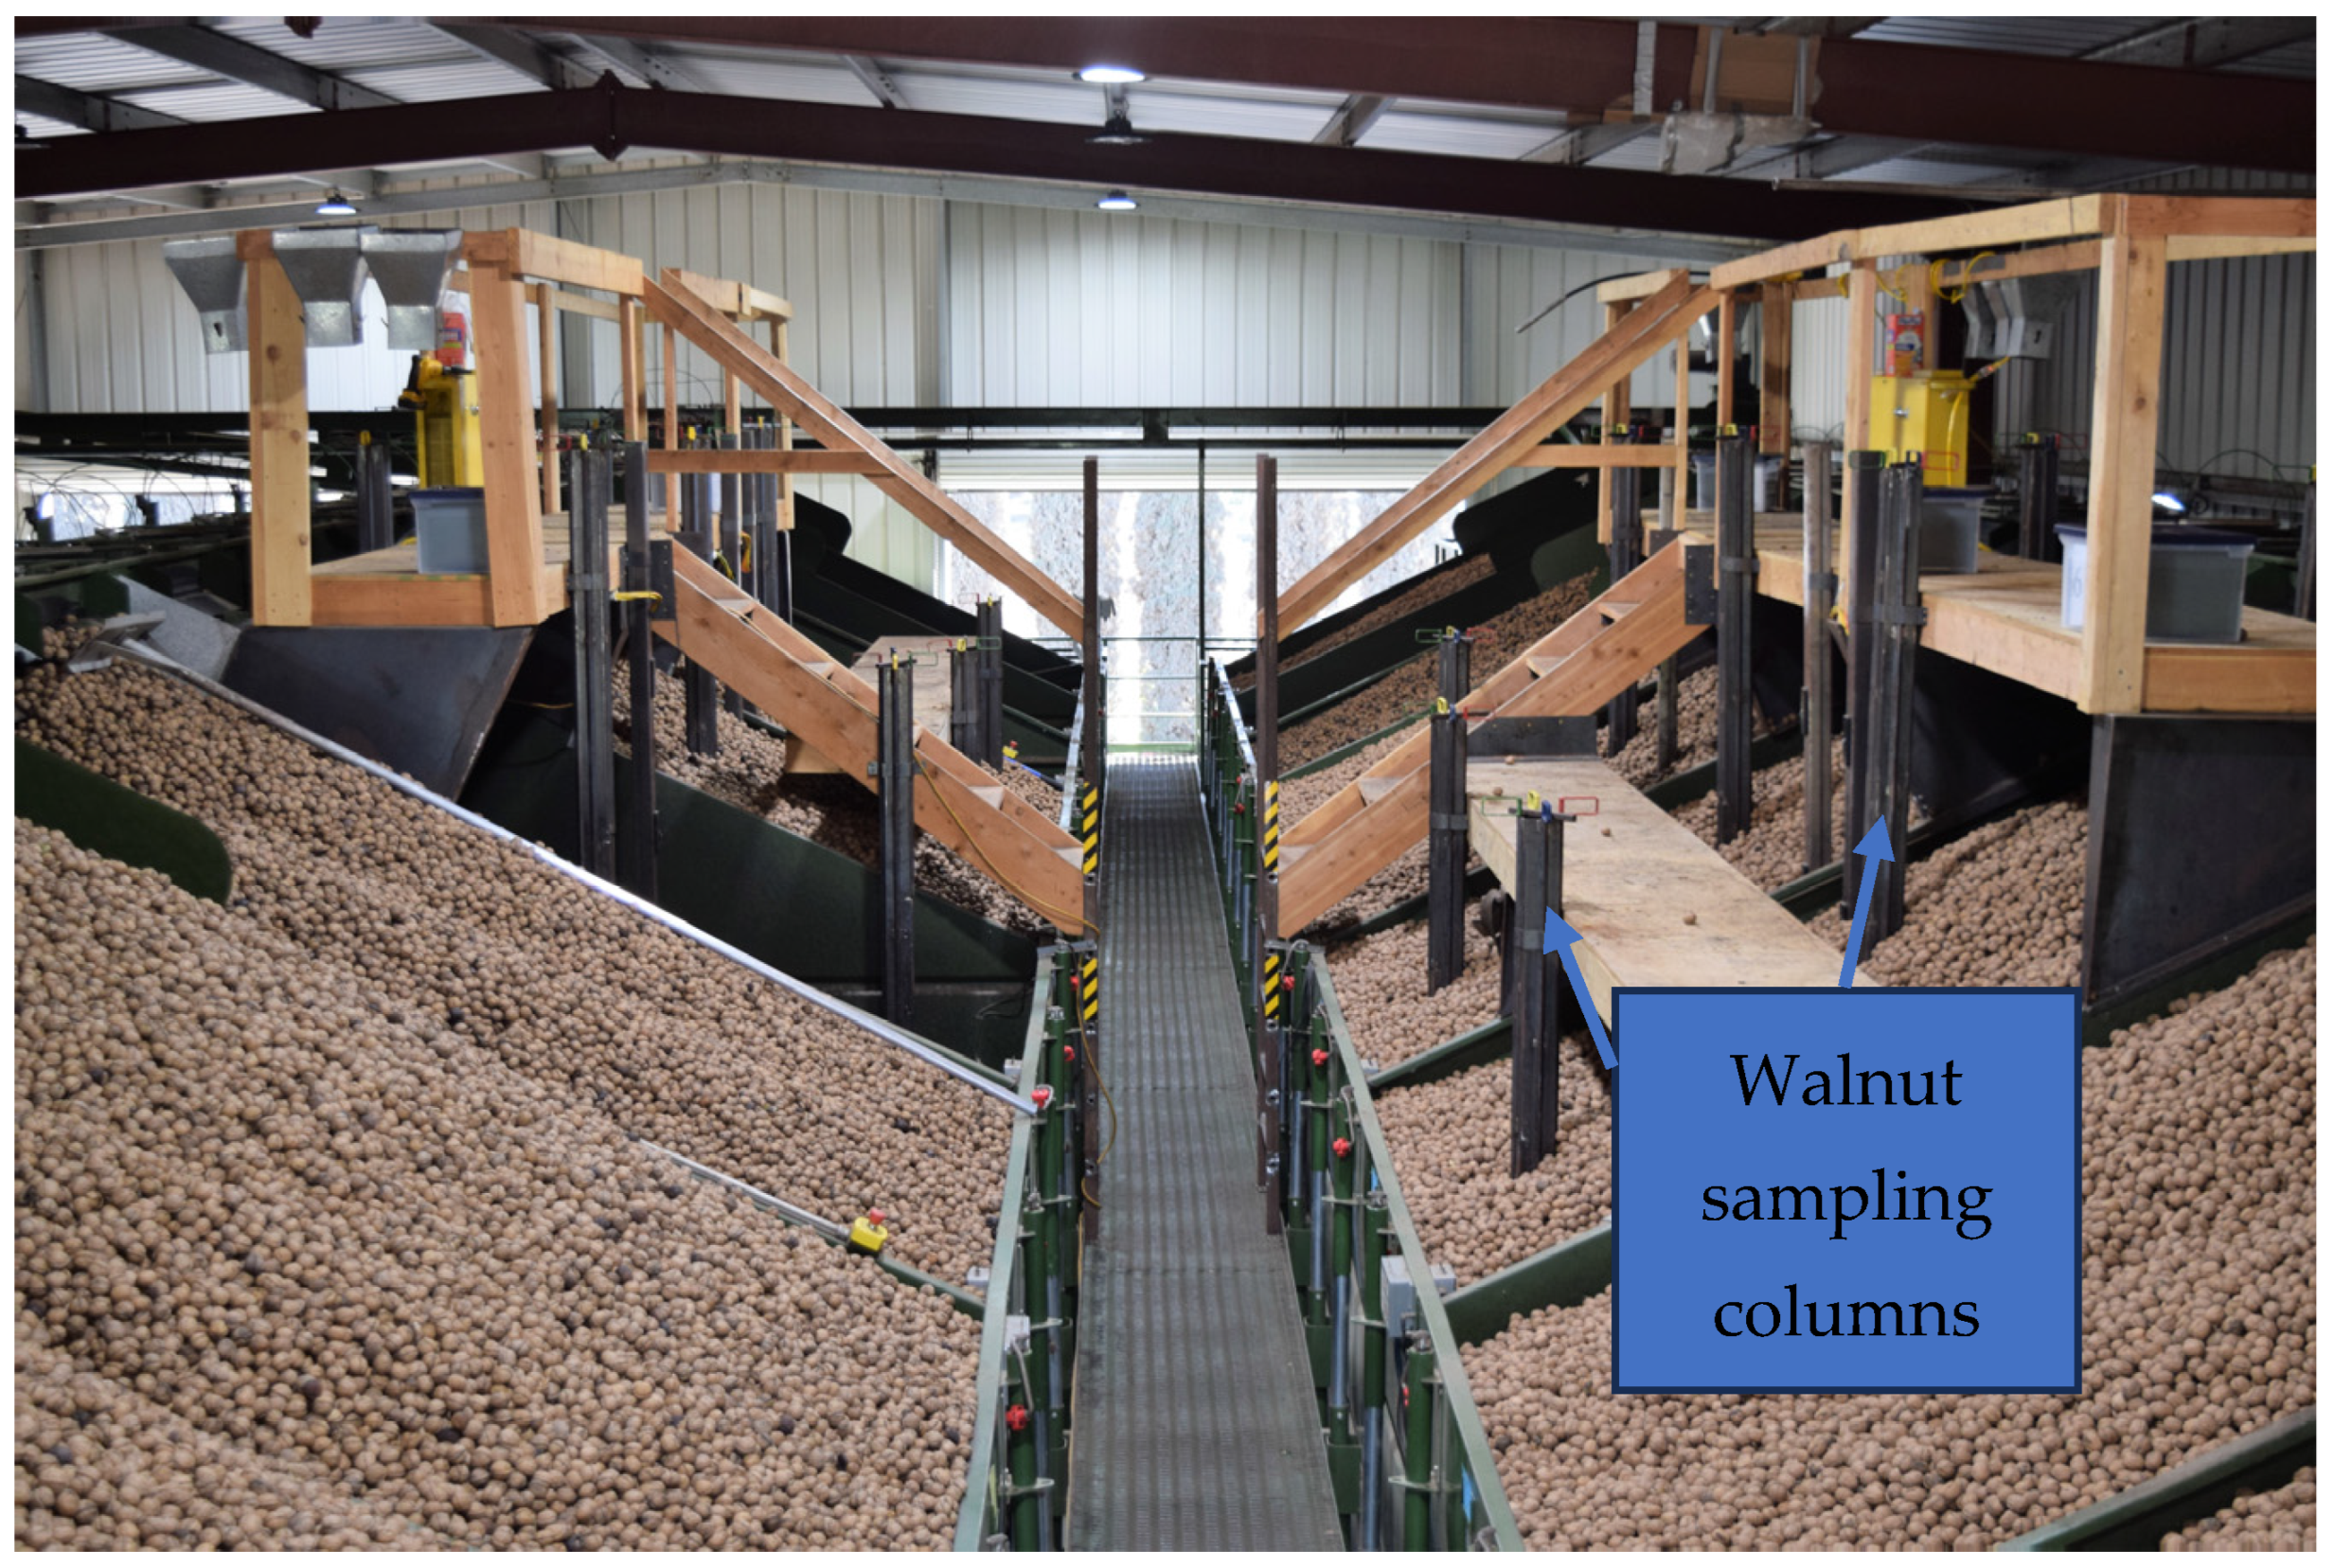
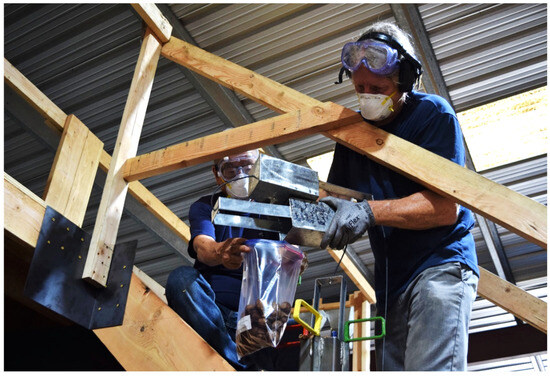
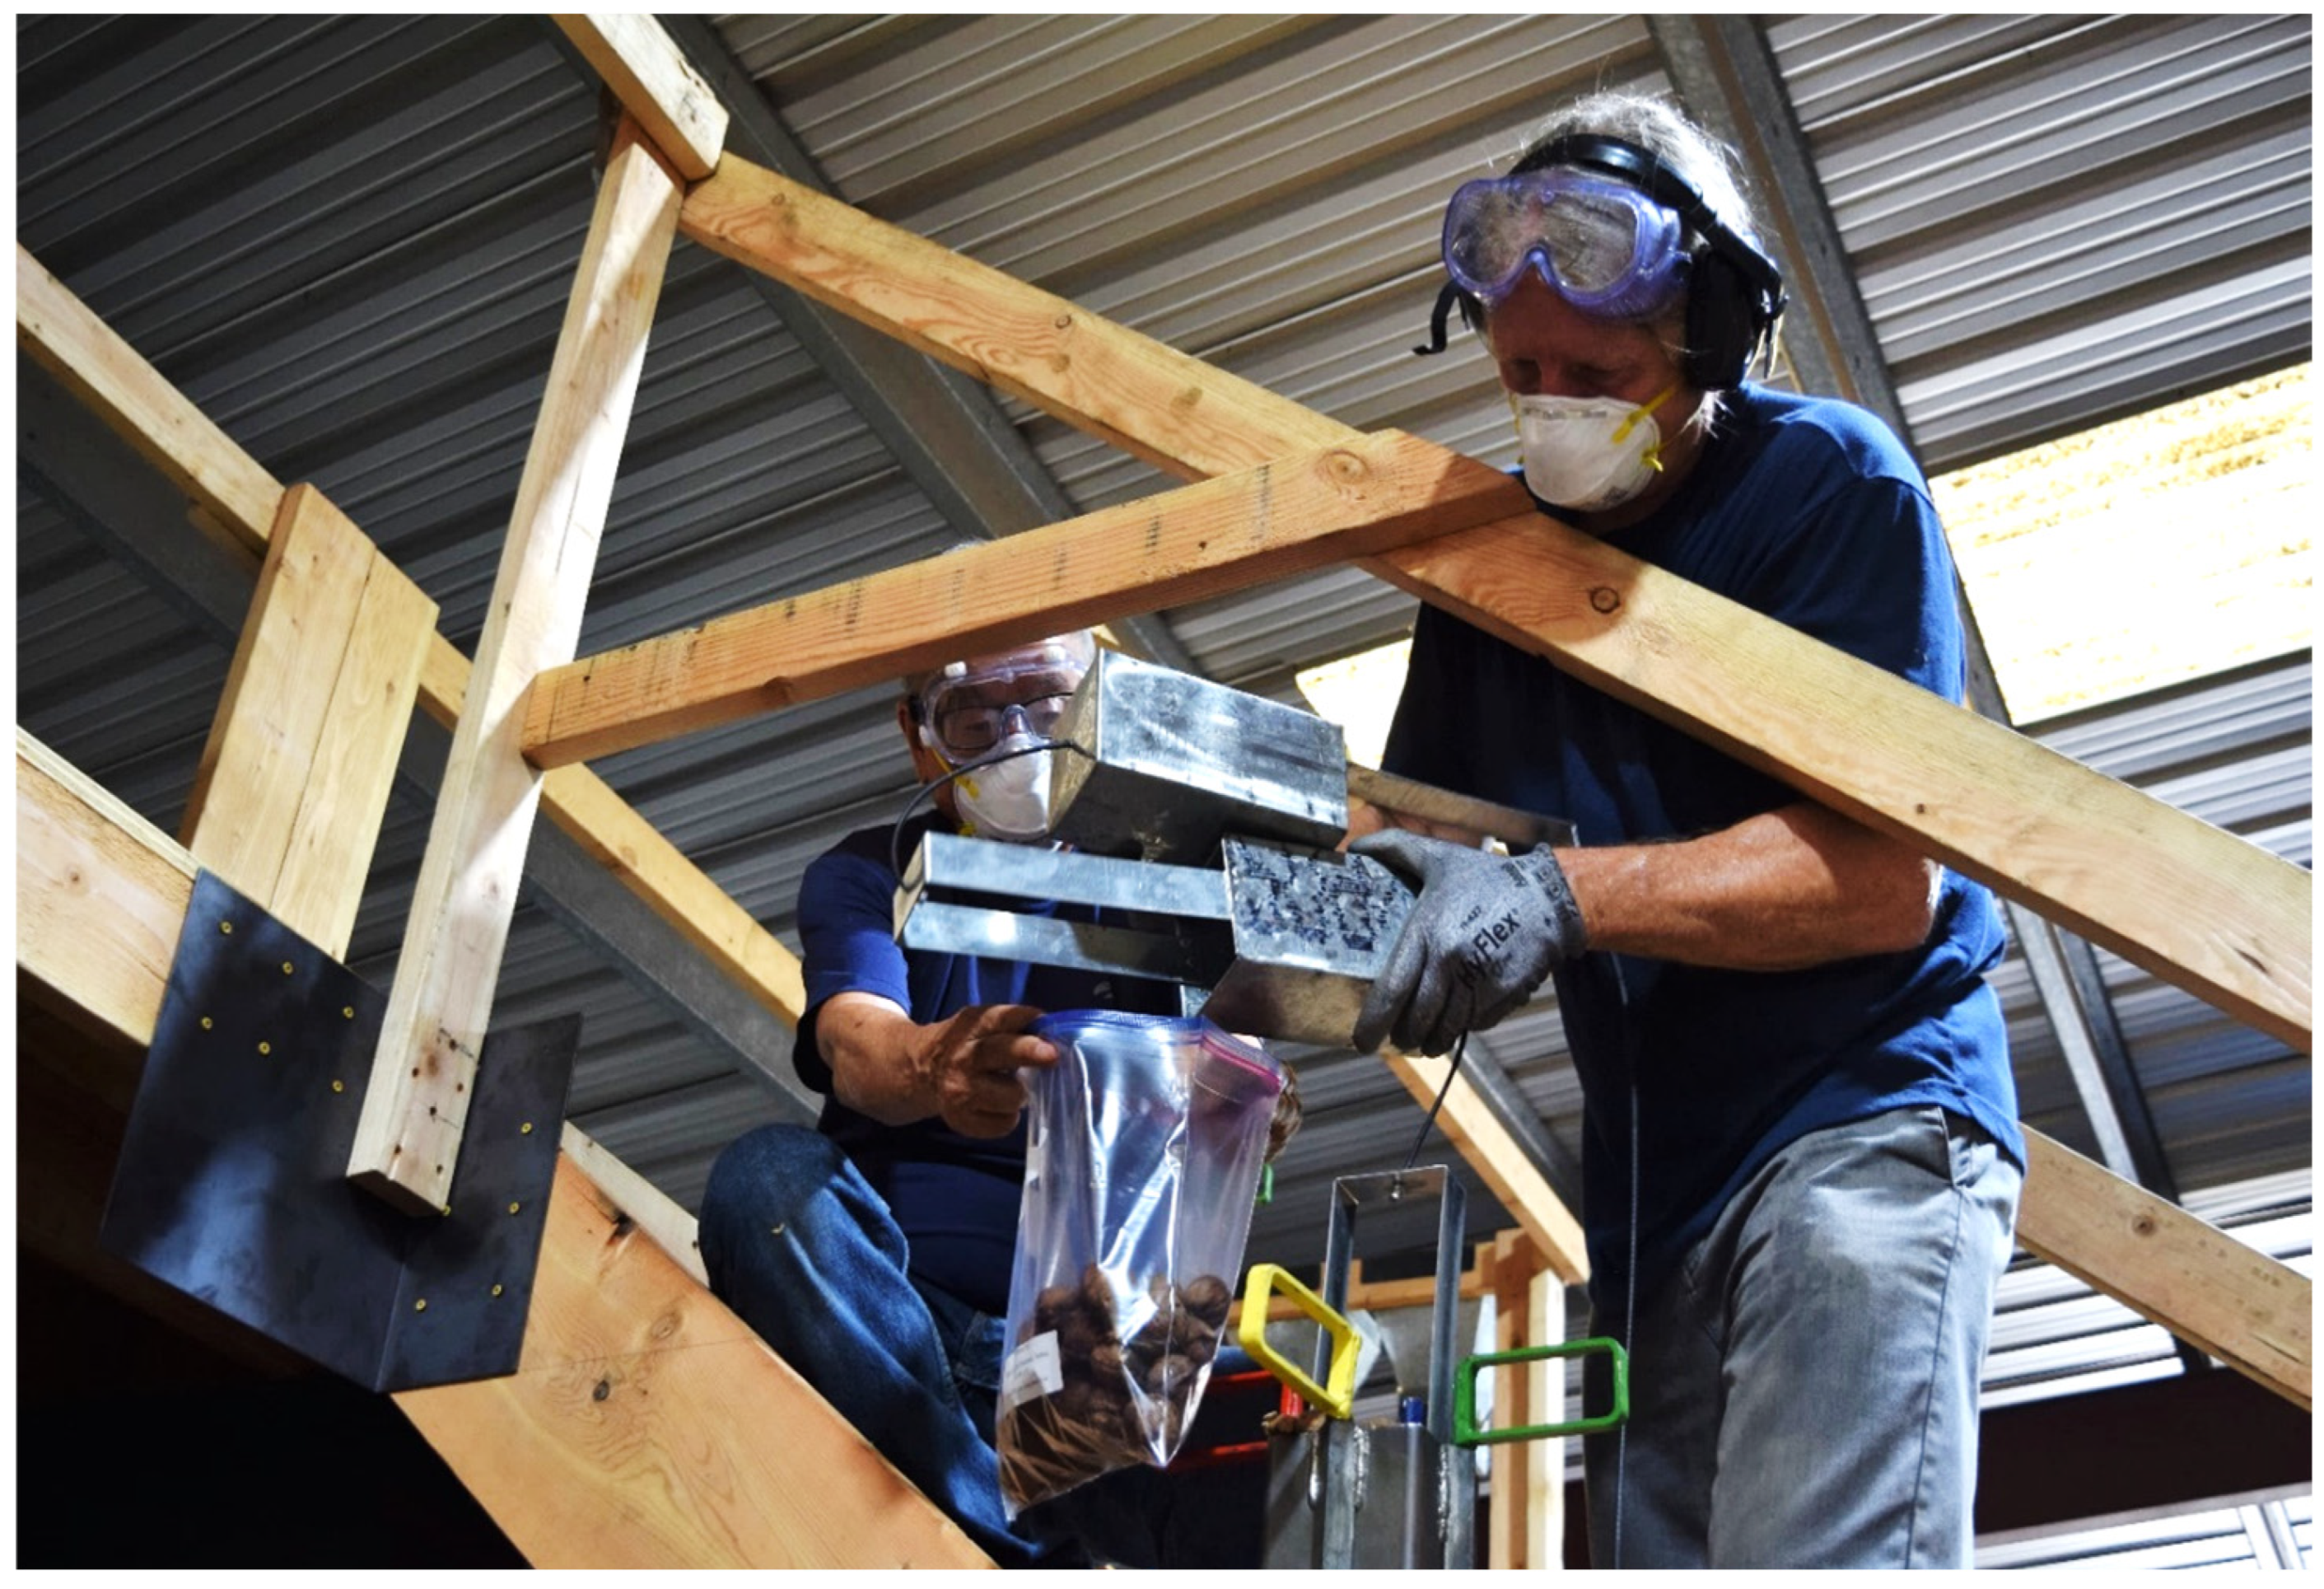
Figure 6 shows the commercial walnut bins that were used for moisture content measurement studies in this project. Note the temporary steps and catwalks installed to facilitate sample collection during drying. At each time interval, one person opened and closed the gate valves, then lifted the chain of buckets, carefully pouring nuts from each bucket into a corresponding pre-labeled zipper freezer bag held by the second person (Figure 7). It took about 15 min to collect a bin’s twelve samples. In the year 2021, Juglans regia walnut varieties tested were Tulare, Ivanhoe, Seer, and others, whereas in the year 2022, only the Chandler variety was tested to eliminate the impact of walnut variety on the moisture content results.
Figure 6.
Commercial walnut stadium bins tested in this project.
Figure 7.
Transferring nuts to pre-labeled zipper bags from buckets as they are lifted from the column.
2.2. Moisture Content Determination
In this project, three different walnut moisture content measurement methods were tested: (a) the novel rapid moisture content measurement method developed in this project that uses ovens set to 105 °C for three hours (Isotemp Oven 750F, Fisher Scientific, Hampton, NH, USA) (b) conventional oven drying method (105 °C for 24 h) [22] for validation of the novel rapid moisture content measurement method developed in this project, and (c) NIR methodology, a second novel method for very rapid moisture content measurement.
2.2.1. Novel Rapid Moisture Content Measurement Method
At harvest, the moisture content of individual walnuts varies significantly. In one study [14], those still in their hulls had a moisture content of 32%, while walnuts in the same batch without hulls had a 13% moisture content (w.b.) For this reason, a numerically small sample of walnuts may not provide a representative value. Drying a large number of in-shell walnuts to determine the average moisture content would require considerable time and oven space. It was found that it took 24 h for 40 in-shell walnuts in paper bags to reach a stable mass in a 105 °C oven [23]. For a single walnut bin, about 384 samples may have to be analyzed daily, which would require a large amount of oven space, and the number of samples increases when the number of walnut bins being sampled increases. To reduce the required oven space and time, sampled walnuts were ground for this study, and the well-mixed ground walnut samples were sub-sampled and used for moisture content measurement. Two advantages resulted: less mass to dry (hence less space in the oven was required), and a reduced drying time (from 24 h to 3 h) was required by decreasing the particle size while increasing the proportional surface area.
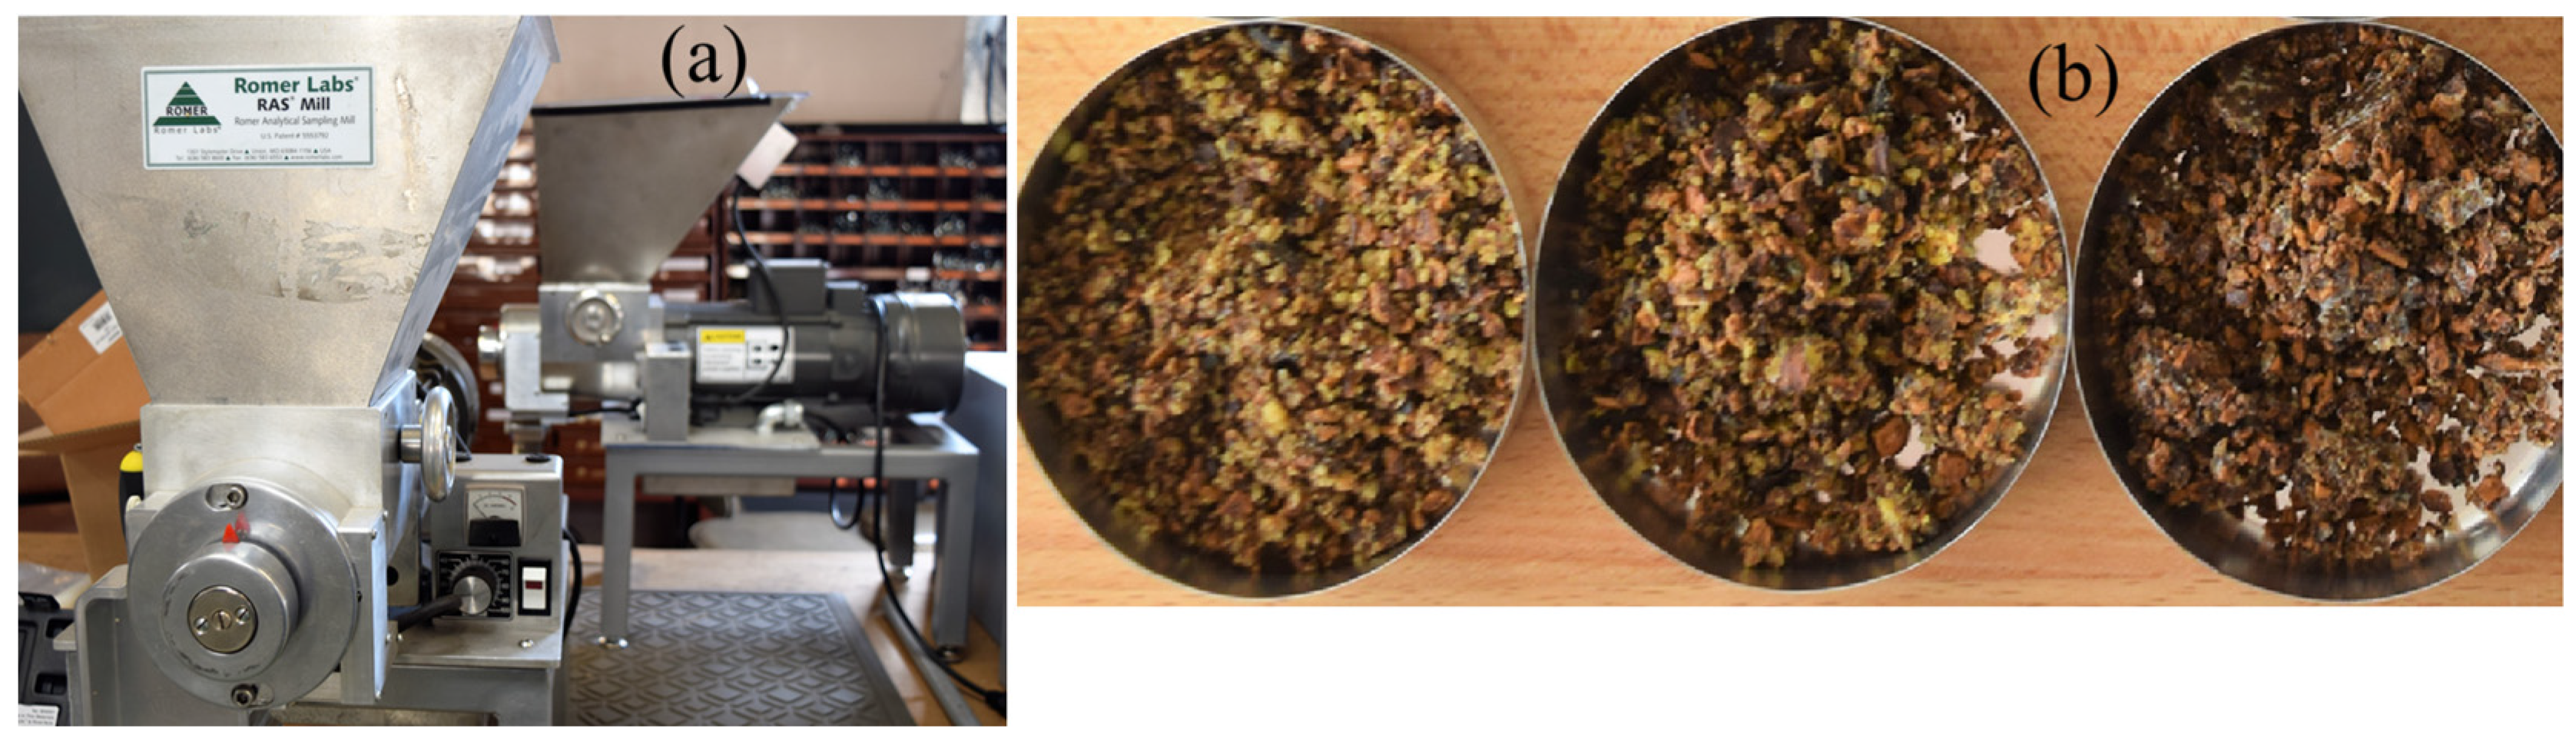
The number of nuts required for each sample was optimized by trial-and-error. We found that 12 full nuts without any breakage well represented the samples collected from each bucket; it also helped to reduce the drying time. The pre-labeled bag containing the sample was emptied into a tray, allowing for the removal of shells and broken walnut pieces for the moisture content measurement. A device designed for grinding wet, oily material (SH-Mill RAS, Romer Labs, Butzbach, Germany) was used for walnut sample grinding (Figure 8a). Twelve representative nuts were placed in the mill feed hopper (out of about 30 nuts collected), and the remainder of the sample was discarded. The pre-labeled bag was held beneath the discharge outlet of the mill while the sample was ground. Grinding took from one to five minutes, depending on moisture content, then the bag was closed immediately. The final consistency of the in-shell walnut meal resembled coarse, damp coffee grounds. The mill was cleaned thoroughly between samples to prevent cross-contamination. Figure 8b shows an example of ground walnut meal samples before being put in the oven for moisture content measurement.
Figure 8.
(a) Mill used for walnut grinding; (b) ground walnut samples.
For the oven analysis, three or four spoons of walnut meal (12 to 13 g) were removed from different locations in the thoroughly mixed sample bag and placed in a pre-weighed 7.6 cm (3 in) diameter aluminum pan. The tare and gross wet weights were recorded, and the pan was placed in the drying oven. Once full, the oven was operated at 105 °C (221 °F) for 3 h. While the pans were withdrawn and the gross dry weights were recorded, the oven remained on to maintain temperature until the oven was empty. Preliminary tests weighing the drying sub-samples every 30 min indicated that drying was complete after two hours (as the dry weights no longer changed significantly), but an extra hour was added to the drying time to make sure the samples were completely dried. Too much drying time can lead to overestimation of moisture content if volatile compounds in addition to water are driven off, but since the weight did not change measurably during the third hour of drying, this error appeared to have been avoided.
2.2.2. Oven Drying Method
To validate the novel rapid moisture content measurement method developed in the project, the conventional gravimetric method for determining moisture content was used. The conventional method involved placing approximately 40 walnuts in a hot-air oven at 105 °C for 24 h [23]. For both the rapid measurement and conventional oven drying tests, two sets of walnut samples were simultaneously drawn from the same bin. One set of samples (about 12 full nuts from about 30 nuts collected) was used for the rapid measurement method, and a second set of samples (about 30 nuts collected) was used for the conventional oven drying method, where the samples were dried at 105 °C in the oven for 24 h and then reweighed to determine moisture content. Results were compared to validate the novel rapid moisture content measurement method.
2.2.3. NIR Studies
NIR spectroscopy was tested as an alternative to moisture determination of both in-shell walnuts and ground kernels. For both tests, NIR spectra of the in-shell walnuts were captured using a hand-held NIR spectrophotometer (MicroNIR, Viavi Corp, Santa Rosa, CA, USA, 950–1650 nm) so that results would be applicable for in-field measurements. The two tests had different objectives as described below.
For testing NIR as an alternative to dry weight moisture determination for ground kernels, the goal was to eliminate the drying step in the moisture content determination experiments, which take three hours based on the novel rapid moisture content measurement method developed in this project. Collection of NIR spectra and dry weight moisture determination for individual ground kernels (one walnut per sample) was conducted concurrently with the other reported drying studies at the hulling plant. Nuts were selected from the various collection bins and times to generate a wide range of expected moisture contents, increasing the robustness of the subsequent NIR calibration. Nuts were shelled, and the kernel was ground for less than 30 s using a coffee grinder. NIR spectra were collected from the ground kernels, and a dry weight basis moisture determination was conducted. Partial least squares (PLS) regression was used as described later to correlate individual kernel NIR spectra with moisture content.
For in-shell walnuts, the spectra collected from the shell were correlated with the dry weight moisture determination of the interior ground kernel to test whether kernel moisture could be determined non-destructively. Samples were selected to have a full range of moisture content by collecting them at various drying times and storing them for later analysis at the USDA-ARS Healthy Processed Foods Research Unit in Albany, CA. NIR spectra were collected from the exterior shell, the moisture content of the kernels was determined using the dry weight method, and a correlation was measured as described above.
2.3. Impact of Storage on the Ground Walnut Samples’ Moisture Content
In the year 2021, 384 samples were collected, but only 216 were processed on-site at the commercial walnut hulling facility. The remaining samples were boxed and shipped back to the SWCGRL in Las Cruces, NM, USA. The sealed bags containing whole or ground nuts often grew mold during transport and storage. Tests were devised to measure any change in moisture content over storage time. Bags containing ground nuts that had been sub-sampled and analyzed within 36 h of sample collection were sub-sampled and analyzed again at the end of the season, up to 607.5 h (25 days) later. These data were compared to determine if the storage time and mold growth affected the moisture content.
2.4. Statistical Analysis
2.4.1. Coefficient of Variation (%CV)
Statistical analyses were conducted to assess the precision and repeatability of the rapid moisture content measurement method. The Coefficient of Variation (%CV) measures the extent of data variability in a sample in relation to the mean of the population. The variability in moisture content between initial walnut samples was expected to be minimal as all the nuts sequentially filling two adjacent dying bins were from the same farmer, field, transport trailer, and hulling line. Each time a pair of bins was filled, we collected 24 initial samples (12 from each bin) that theoretically should have been very similar. The coefficient of variation (CV) was used to evaluate the adequacy of our sampling method and sample preparation technique by comparing the CV for each bin alone (n = 12) and the CV for adjacent bins (n = 24). CV analysis was also used to evaluate the repeatability of the sub-sampling technique by finding the moisture content of four sub-samples from the same bag of 12 ground in-shell walnuts.
2.4.2. NIR Method Data Analysis
Partial least squares (PLS) regression was performed on the centered and scaled spectral data. Seven-fold cross-validation was applied, and the root mean predicted residual error sum of squares (PRESS) statistic was used to evaluate model fit to the dry weight moisture. The model with the fewest number of factors, without a significantly lower predictive value, was selected. The coefficient of determination (R2) of the predicted values vs. actual values was then calculated.
3. Results
3.1. Walnut Sample Collection Using the Novel System
The sample collection apparatus performed as designed. Concerns that removing eight 30-nut samples from each location would cause cavities in the bin proved unfounded; nearby nuts flowed in to fill the void. There were some minor challenges during the collection of walnut samples. Occasionally, it was necessary to push surface nuts toward a sampling apparatus to compensate for the volume withdrawn below. When the walnuts were especially wet, the first few samples did not flow easily. To help them move into the buckets, a cement vibrator was held against the top of the sampling column. If a gate valve were accidentally opened when the buckets had been withdrawn, nuts would end up at the bottom of the column. In this rare situation, a shop vac with extra tubes connected end-to-end was used to remove walnuts from the bottom of the column, allowing the bottom bucket to hang freely again below the lowest aperture.
3.2. Conventional Oven Drying Versus Rapid Moisture Content Method
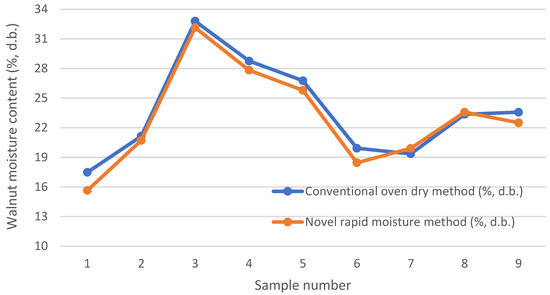
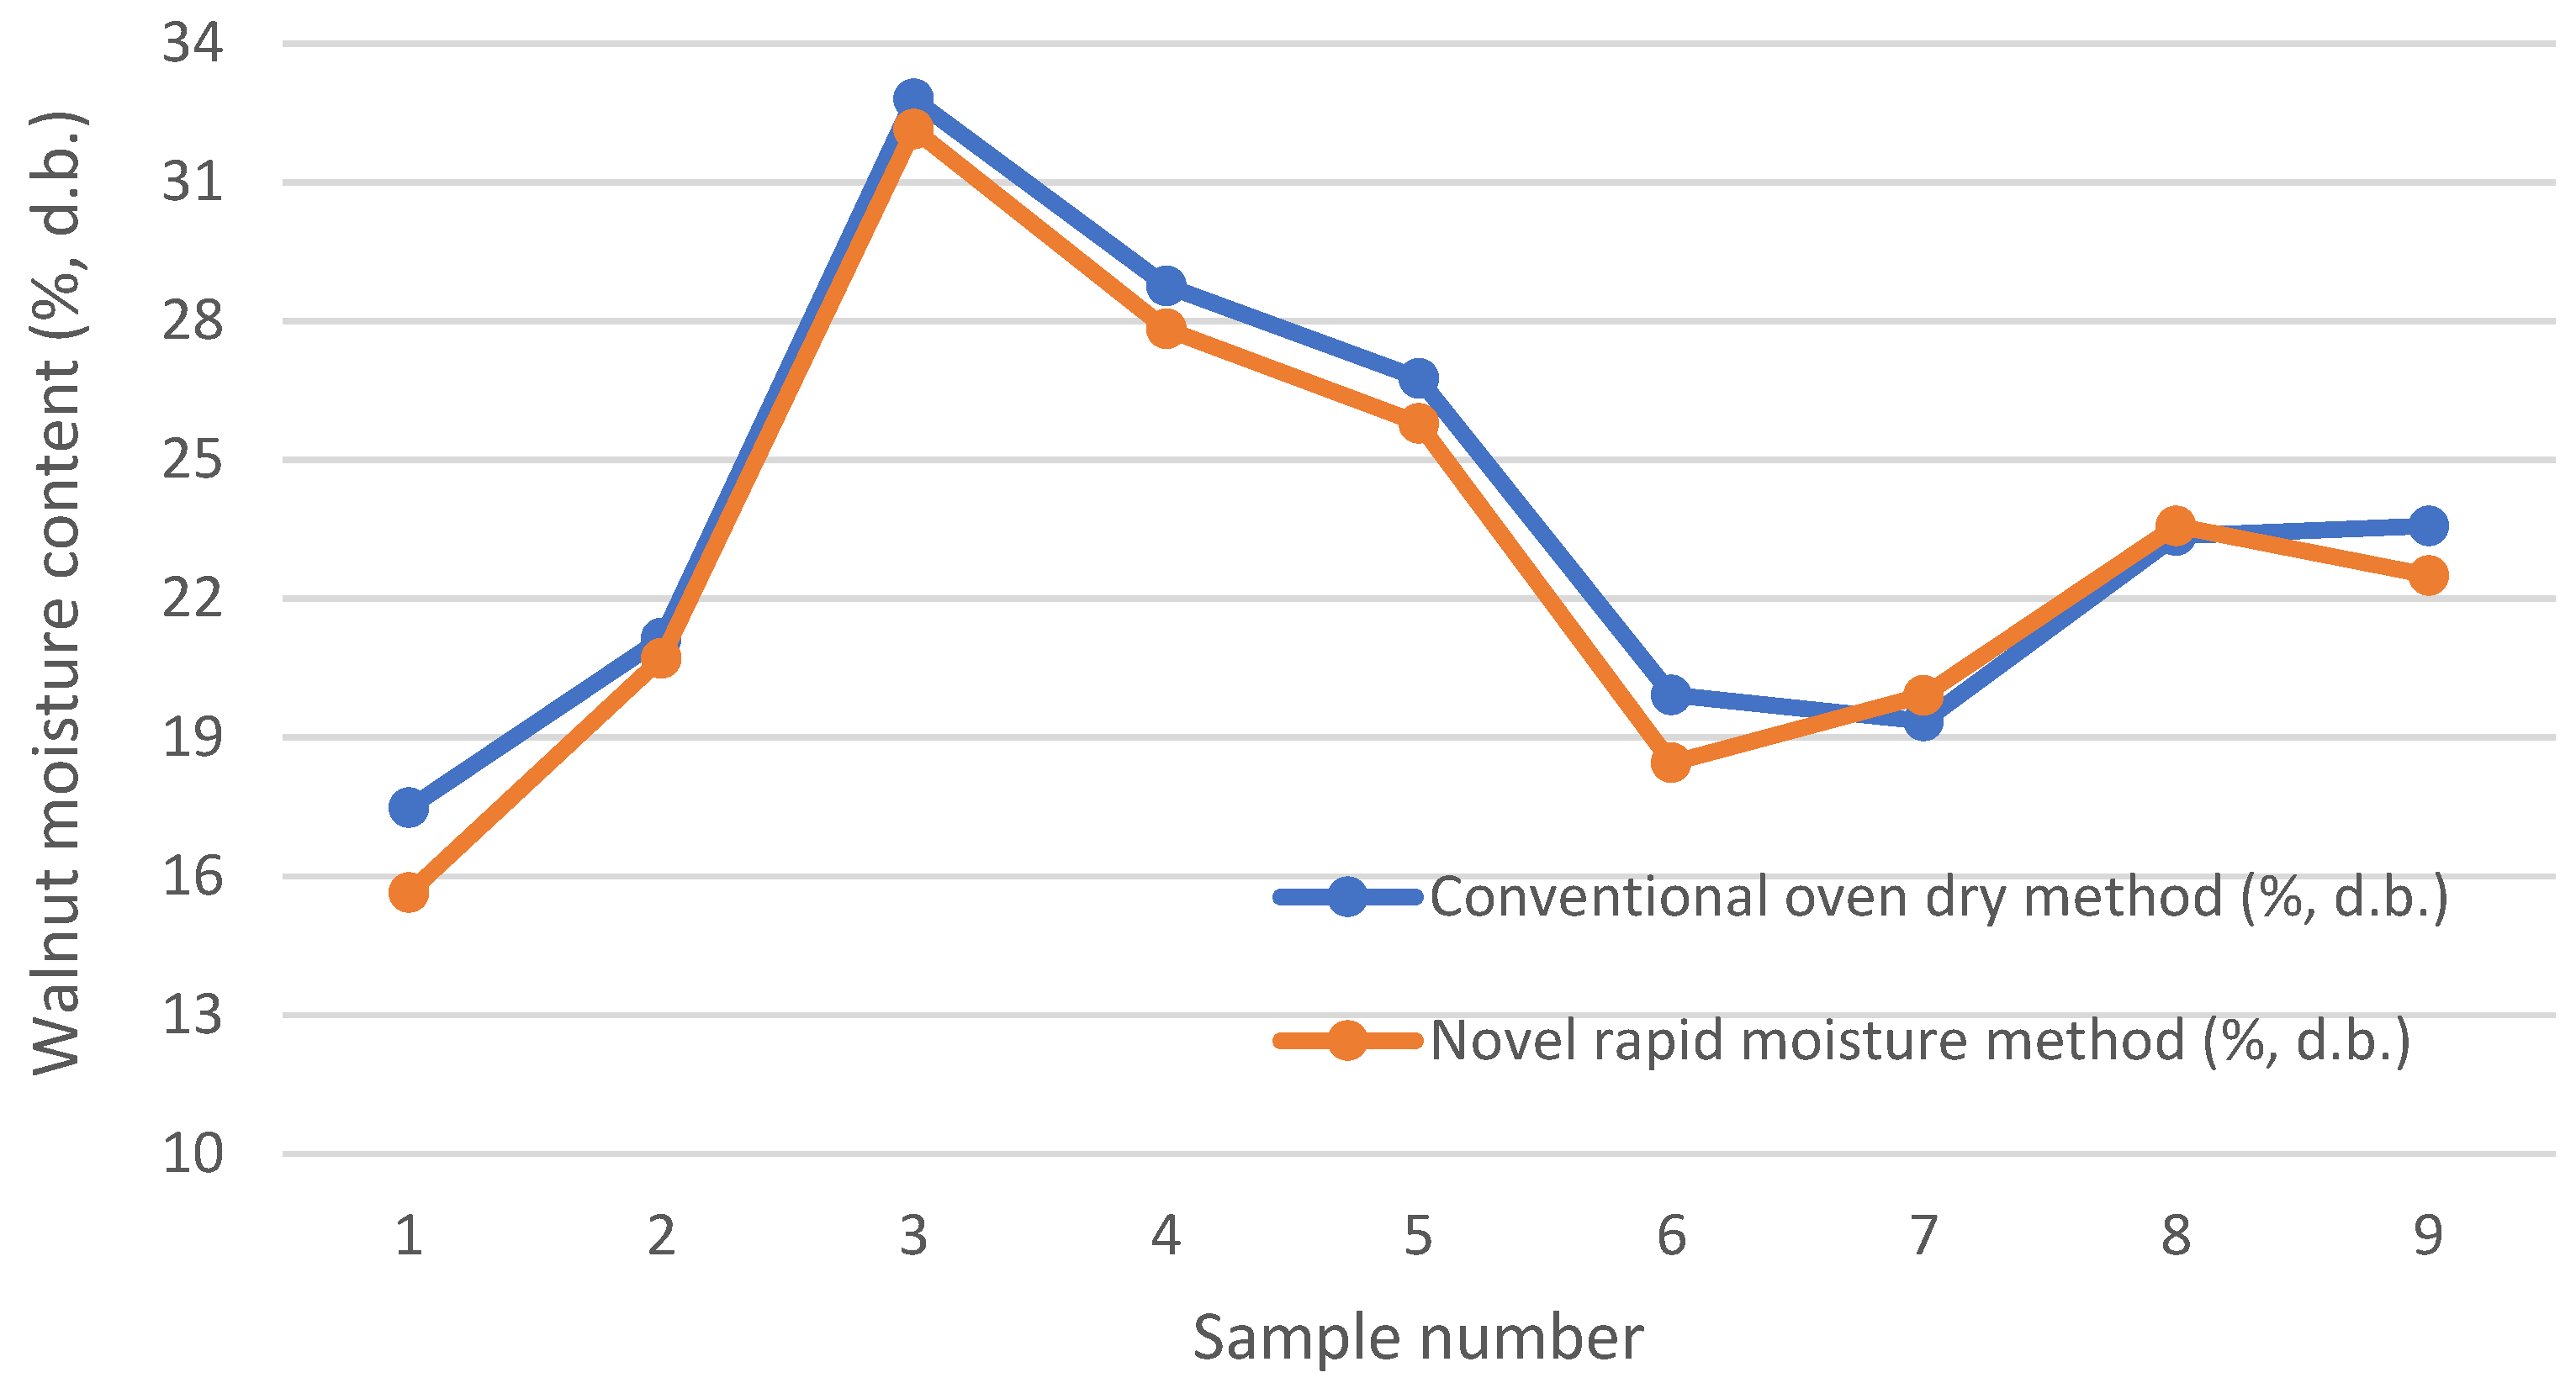
Figure 9 shows the moisture content of the walnuts measured using the 24 h standard oven-drying method and the 3 h rapid moisture measurement method developed in this project for the Chandler walnut variety. The results indicated that the moisture content measured using the conventional oven-dry method and the rapid moisture content measurement method agreed within ±0.5–1.5% (d.b.) except one measurement, which was about 1.83% (d.b.). The standard deviation values calculated for the calibration moisture samples, measured in duplicates and triplicates, were <1% (d.b.) for most samples, except for two measurements, where the standard deviation was about 3% and 7% (d.b.). In about 80 percent of cases, the conventional oven-dry method showed slightly higher moisture content than the novel rapid moisture content measurement method tested in this project. Also, the probable reason for the change in moisture content reported by the novel rapid moisture content measurement method may be moisture loss during walnut grinding. The rapid walnut moisture content method was calibrated for the Chandler variety of walnuts. Future work should focus on testing this method with other walnut varieties.
Figure 9.
Walnut’s moisture content based on conventional oven drying and rapid moisture content method.
3.3. Walnut Drying Studies in 2021
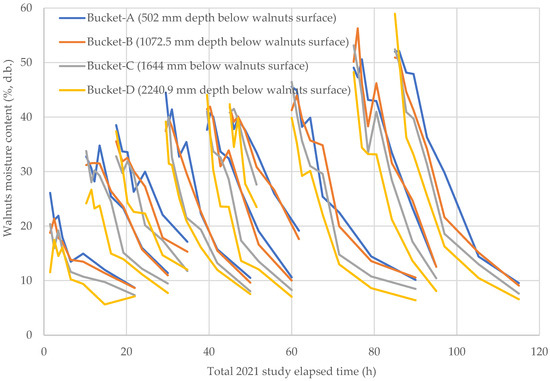
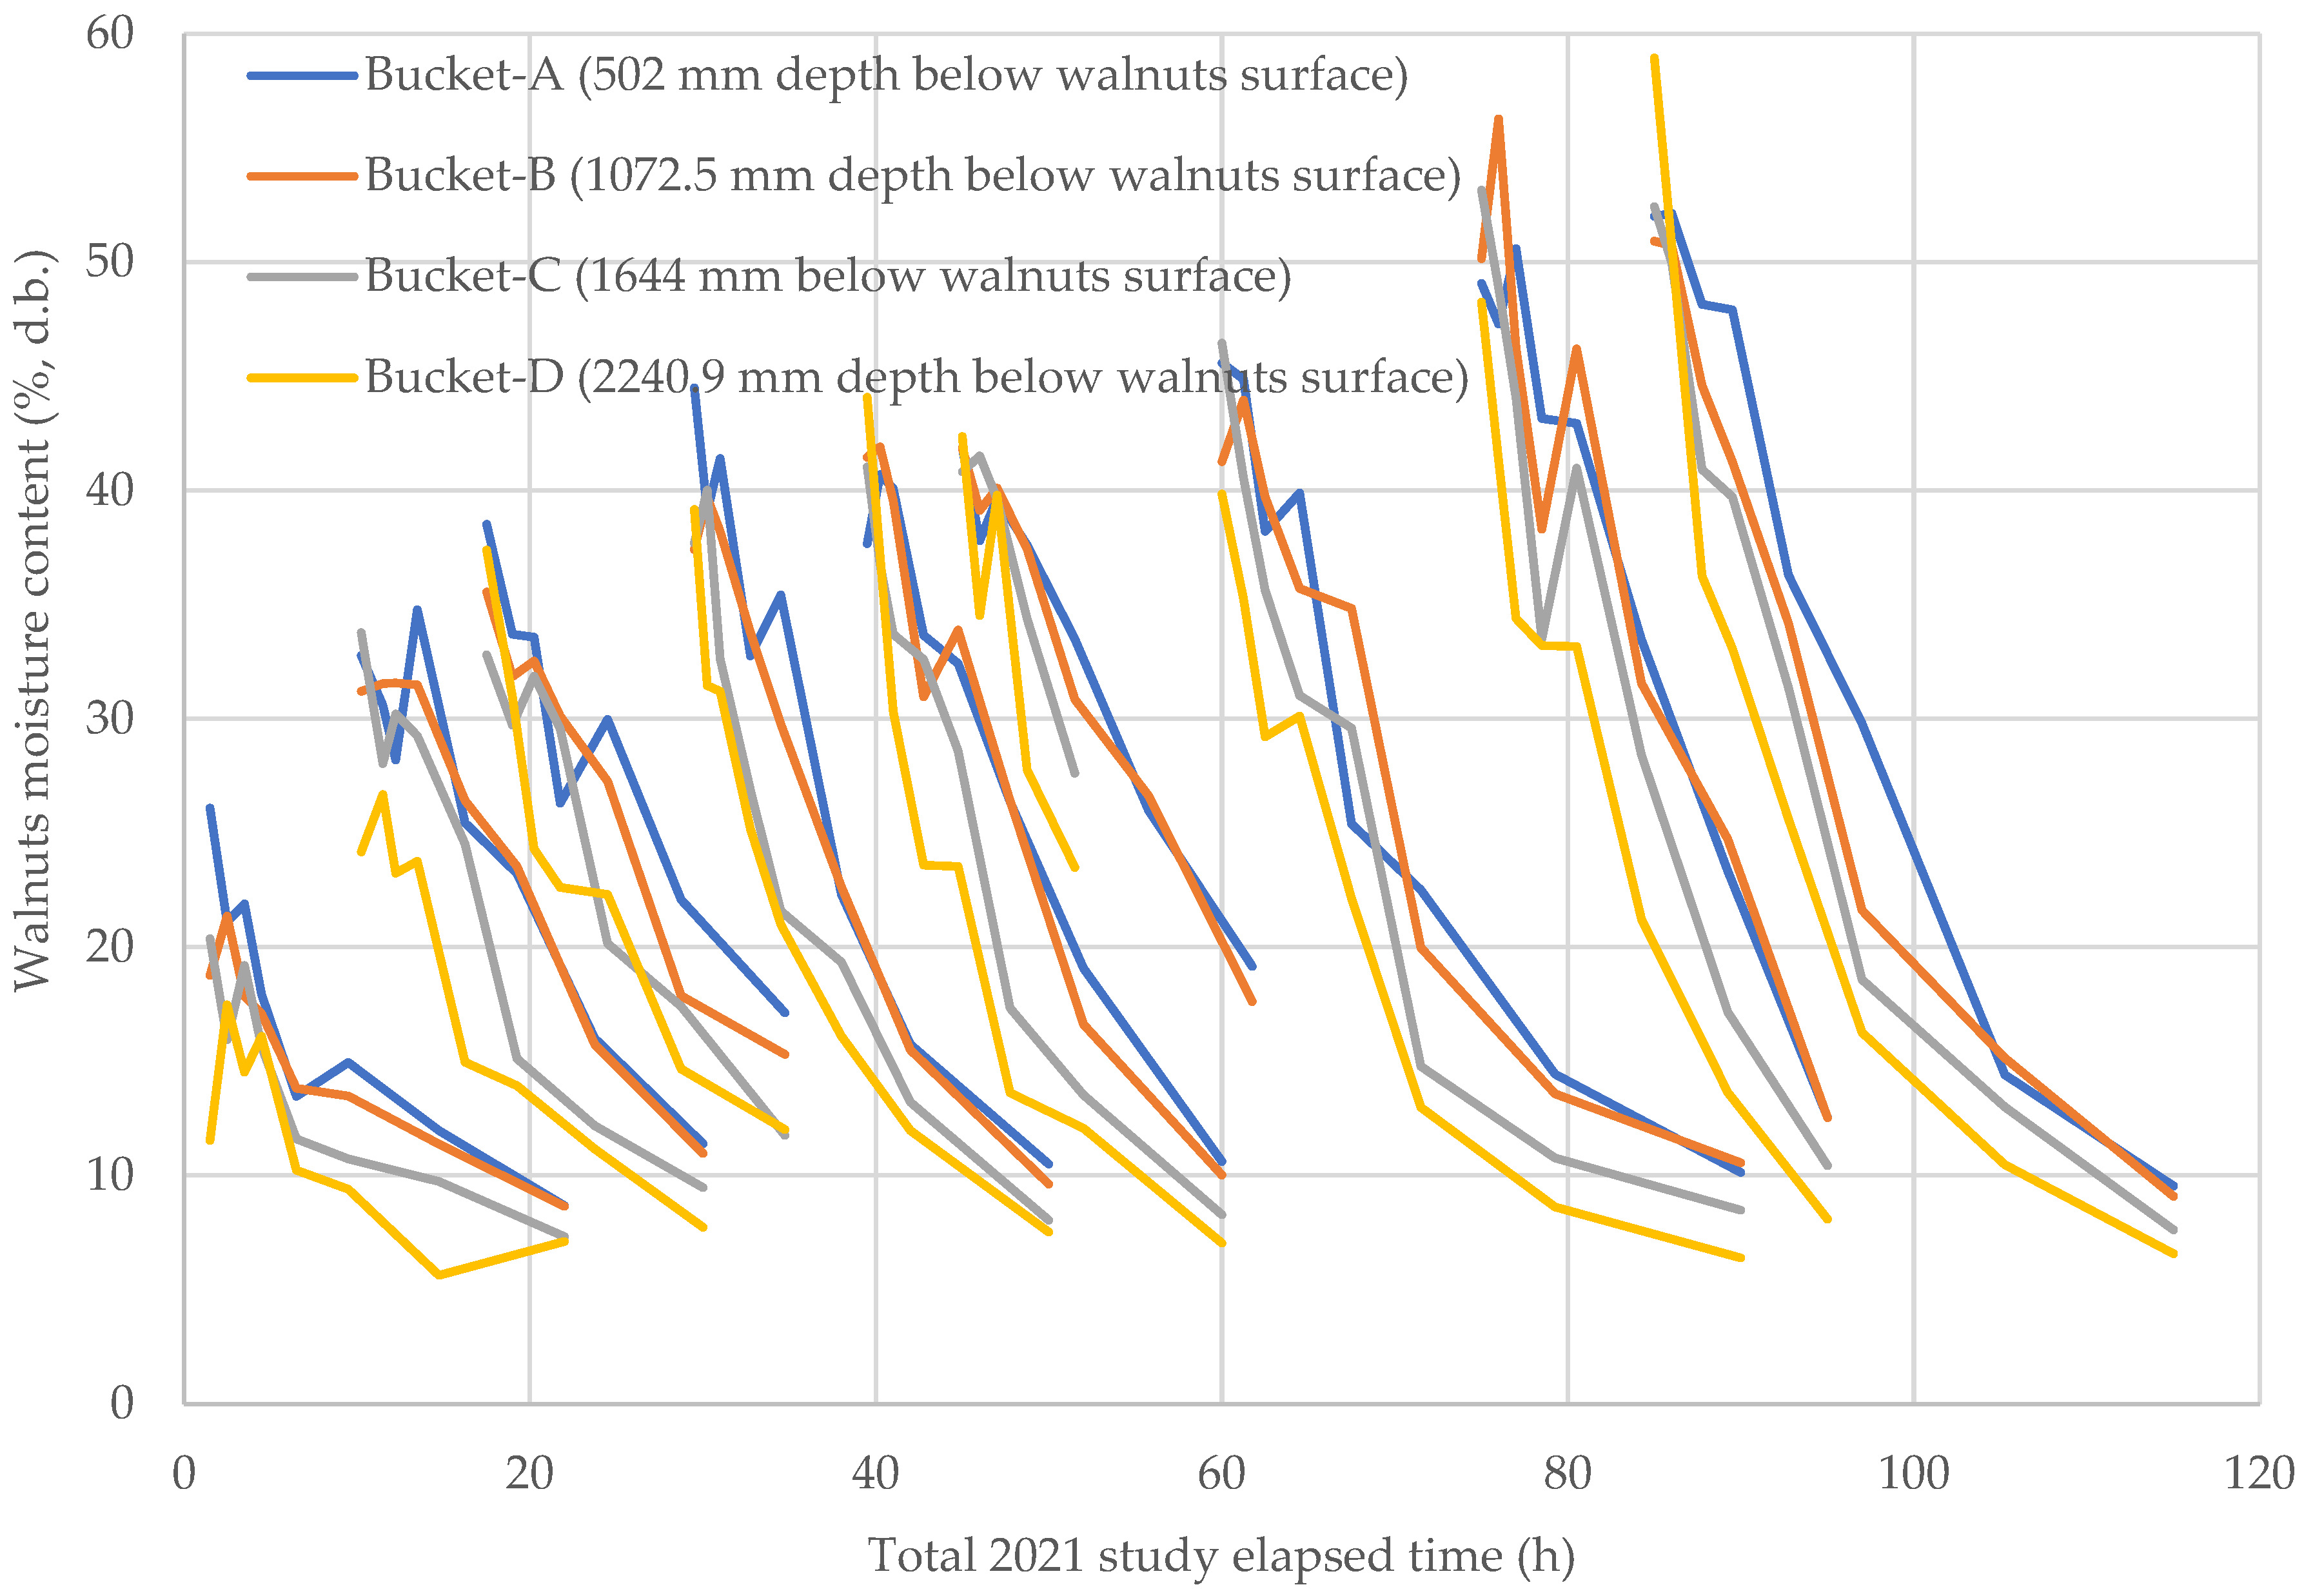
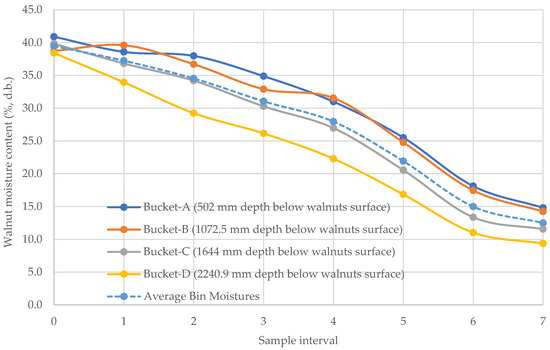
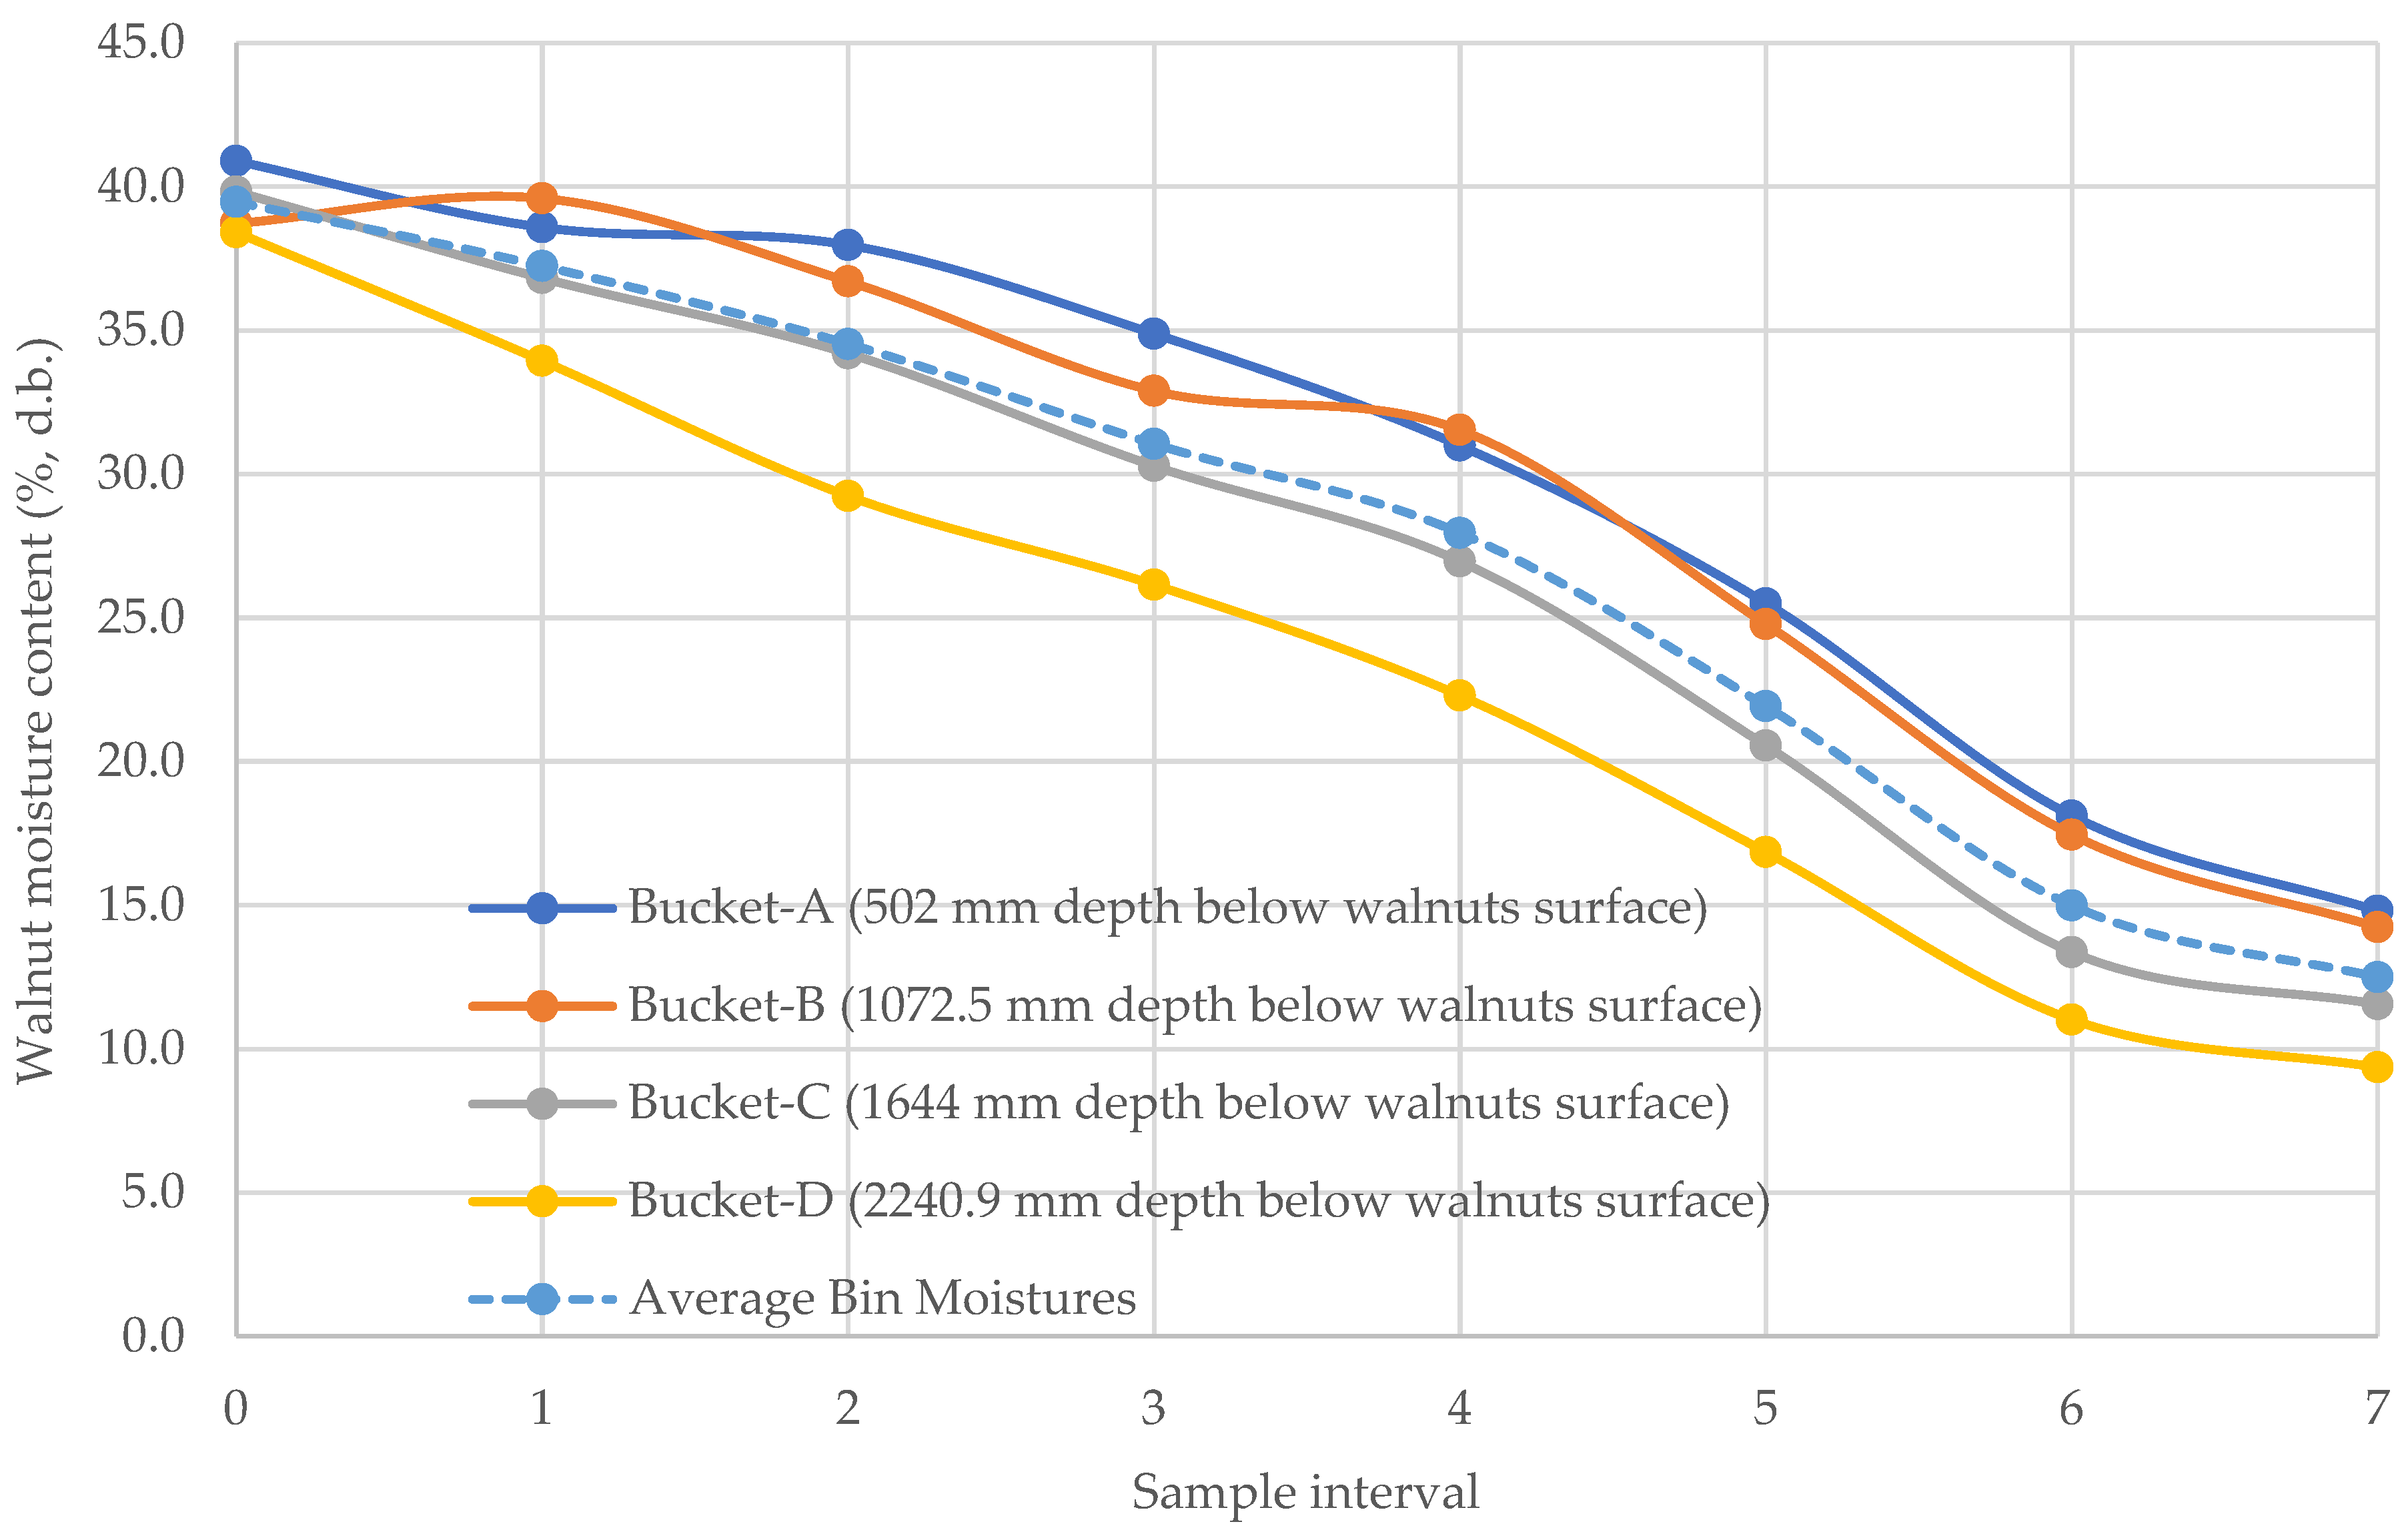
Figure 10 shows the walnut moisture content measurements from drying studies conducted on nine different drying runs (typically 24 h) in 2021, the first year of the study. The data indicated that the initial walnut moisture contents differ widely between 25–60% (w.b.). Based on his experience, the walnut hulling facility manager provided our team with the approximate drying time for each bin, and sampling intervals were selected based on that information. In the 2021 study, walnuts were sampled from each bin at eight different times during the drying process (the initial sample was collected before the start of drying, and the final sample was just before the dryer was switched off). The walnut plant manager switched off the dryers when the walnuts reached a moisture content of about 7.5% (w.b.) or 8.11% (d.b.) as indicated by the built-in electrical conduction-based moisture sensor at the top of the bins. Figure 10 indicates that the walnuts at the bottom portion of the bin (Bucket D) dry faster compared to the walnut samples close to the top of the bin (Bucket A). The probable reason for this observation can be due to the increasing vapor pressure of the air as it moves up through the nuts and absorbs water, reducing its ability to absorb moisture from the upper nuts. For most of the walnut moisture observations at Bucket C and Bucket D, the final moisture was <8.5% (d.b.). The data indicated that there is considerable variability in nut moisture content across the range of depths in the walnut bin and among different locations. Figure 11 shows the walnut moisture contents at the four sampling depths (Buckets A–D) and eight sampling intervals, averaged across the nine bins sampled in 2021. Based on the plot, the average starting walnut moisture content at different sampling depths was about 40% (d.b.), but over time, the moisture contents at different levels diverged, and the final moisture ranged from about 9% to 14% (d.b.). The moisture content of walnut samples taken at the end of each drying time was the highest for the top Bucket A (14.2% d.b.) and lowest for Bucket D (9.4% d.b.). The average of all the samples taken at different depths (shown as a dotted line) indicated that the average moisture content observed at the end of each drying time was about 12.5% (d.b.).
Figure 10.
Walnuts’ moisture at different levels during the experiments conducted in the year 2021.
Figure 11.
Walnut moisture content at each sampling depth and interval averaged across all nine bins sampled during the entire 2021 study.
3.3.1. Precision of Moisture Measurements
The CV of initial moisture content measurements from the individual bins (n = 12) and the two paired bins combined (n = 24), filled with a batch of nuts from the same farmer, field, transport trailer, and hulling line, were used to test the precision of the rapid moisture content measurement method. Combining neighboring bins did not reduce the CV, which averaged 12.2% (d.b.) for individual bins and 12.6% (d.b.) for paired bins (Table 1). Since precision did not increase with twice the number of samples, we concluded that the developed collection and preparation methods were adequate. The calculated values for the CV, though high for lab conditions, were reasonable for agricultural field work. The CV was also used to evaluate the repeatability of the sub-sampling technique. Moisture content measurements of four sub-samples from the same bag of 12 ground in-shell walnuts for samples ranging from 6 to 47% (d.b.) moisture content had an average CV of only 2.65% (d.b.). The sub-sampling and oven-drying methods appeared to yield a reasonably precise and repeatable estimate of sample moisture content.
Table 1.
Coefficient of Variation of Initial Moisture Content Measurements for Paired Bins and Each Individual Bin.
3.3.2. Walnut Sample Storage Effect on Moisture
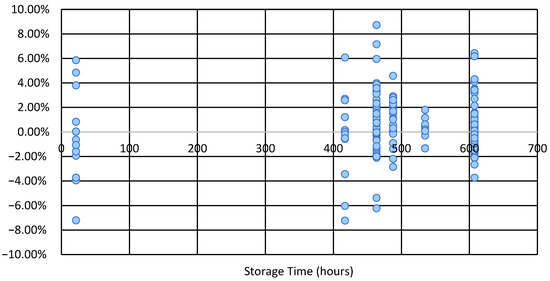
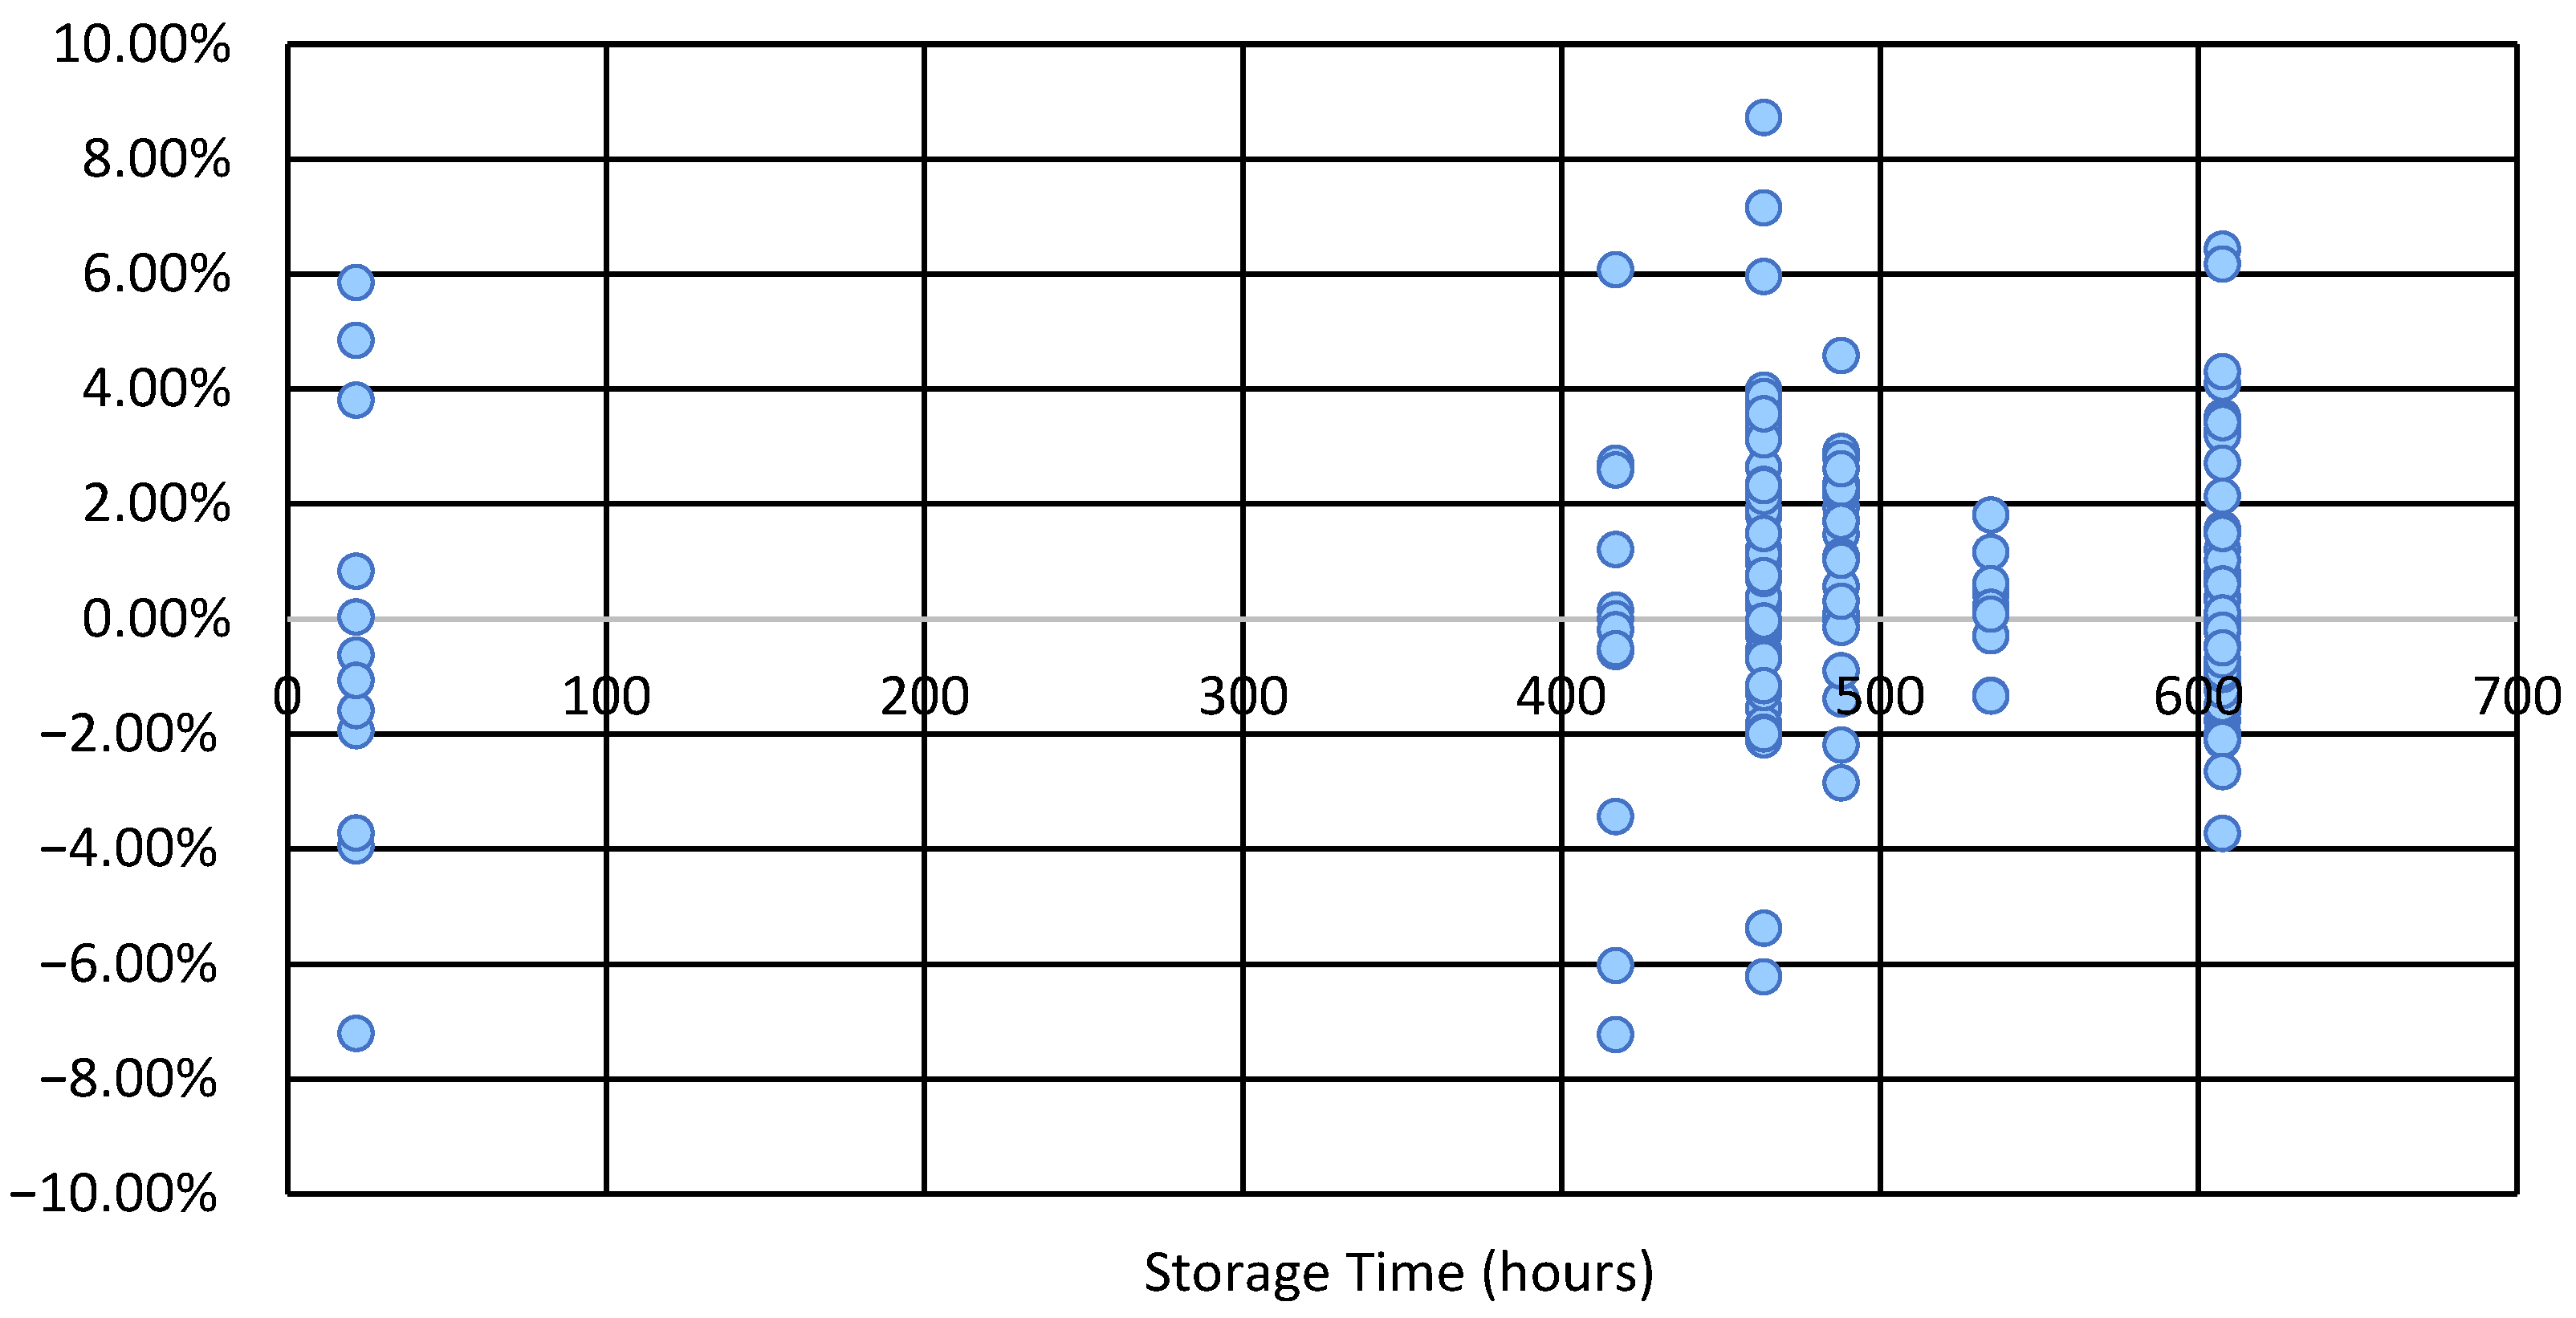
The study indicated no significant change when comparing moisture results from ground sub-samples analyzed immediately to results from the same samples sub-sampled and analyzed up to 25 days later. Mold growth aggregated the meal, making it more challenging to obtain sub-samples, but the change in moisture content values was negligible. Plotting the difference between moisture content values determined immediately and those determined after storage for an interval from 21.5 to 607.5 h revealed only random, uncorrelated differences that are within ±8% (where most of the measurements were within ±2%), indicating that storage and resulting mold growth did not systematically affect moisture content analysis results (Figure 12).
Figure 12.
Change in moisture content is determined immediately after storage at various times (h).
3.3.3. Sampling Interval Method Development for Walnut Moisture Content Measurement
In 2021, walnut sampling studies were conducted in four bins, spaced at regular time intervals, to examine changes in moisture during the drying period. In general, the drying data plotted over time approximated exponential decay, especially during the falling-rate portion of the drying period. The Page model is commonly used for understanding drying kinetics [24,25,26]. Consequently, samples collected at uniform time intervals exhibit poor resolution during the initial drying phase, when moisture content changes rapidly. To address this problem, the coefficients for an exponential equation were determined by fitting moisture content as a function of time to the 2021 data. Further, the logarithm of this equation was used to solve for time at five uniform moisture levels, and the resulting time intervals were used to establish a sampling schedule for data collection in 2022. In 2022, samples were taken more frequently during the initial part of each drying event, thereby collecting observations with more uniform changes in moisture content (improving resolution during the rapid initial portion of each drying event).
In Equation (1) moisture content, y, is an exponential function of drying time, x. The average initial moisture content was 0.368825 on a dry-basis, and the time coefficient was −0.07225 in a 24-h drying event. Solving the equation for time, x, with the same initial and final moisture contents, and 75%, 50%, and 25% thereof, determined the fractions of total drying time when the walnuts would be roughly 3/4, 1/2, and 1/4 dry, setting the sampling schedule. When the plant manager, based on his experience, estimated that the drying time would be shorter or longer than twenty-four hours, we prorated the schedule accordingly. For example, if the plant manager estimated a particular batch would take 20 h and the drying started at midnight (0:00), we would take samples just before the burners were switched on at midnight, at 2:40, 6:07, 11:05 and at 20:00, just after the burners were shut off, obtaining samples at intervals that were approximately equally spaced by moisture content instead of by time.
3.4. Walnut Drying Studies in 2022
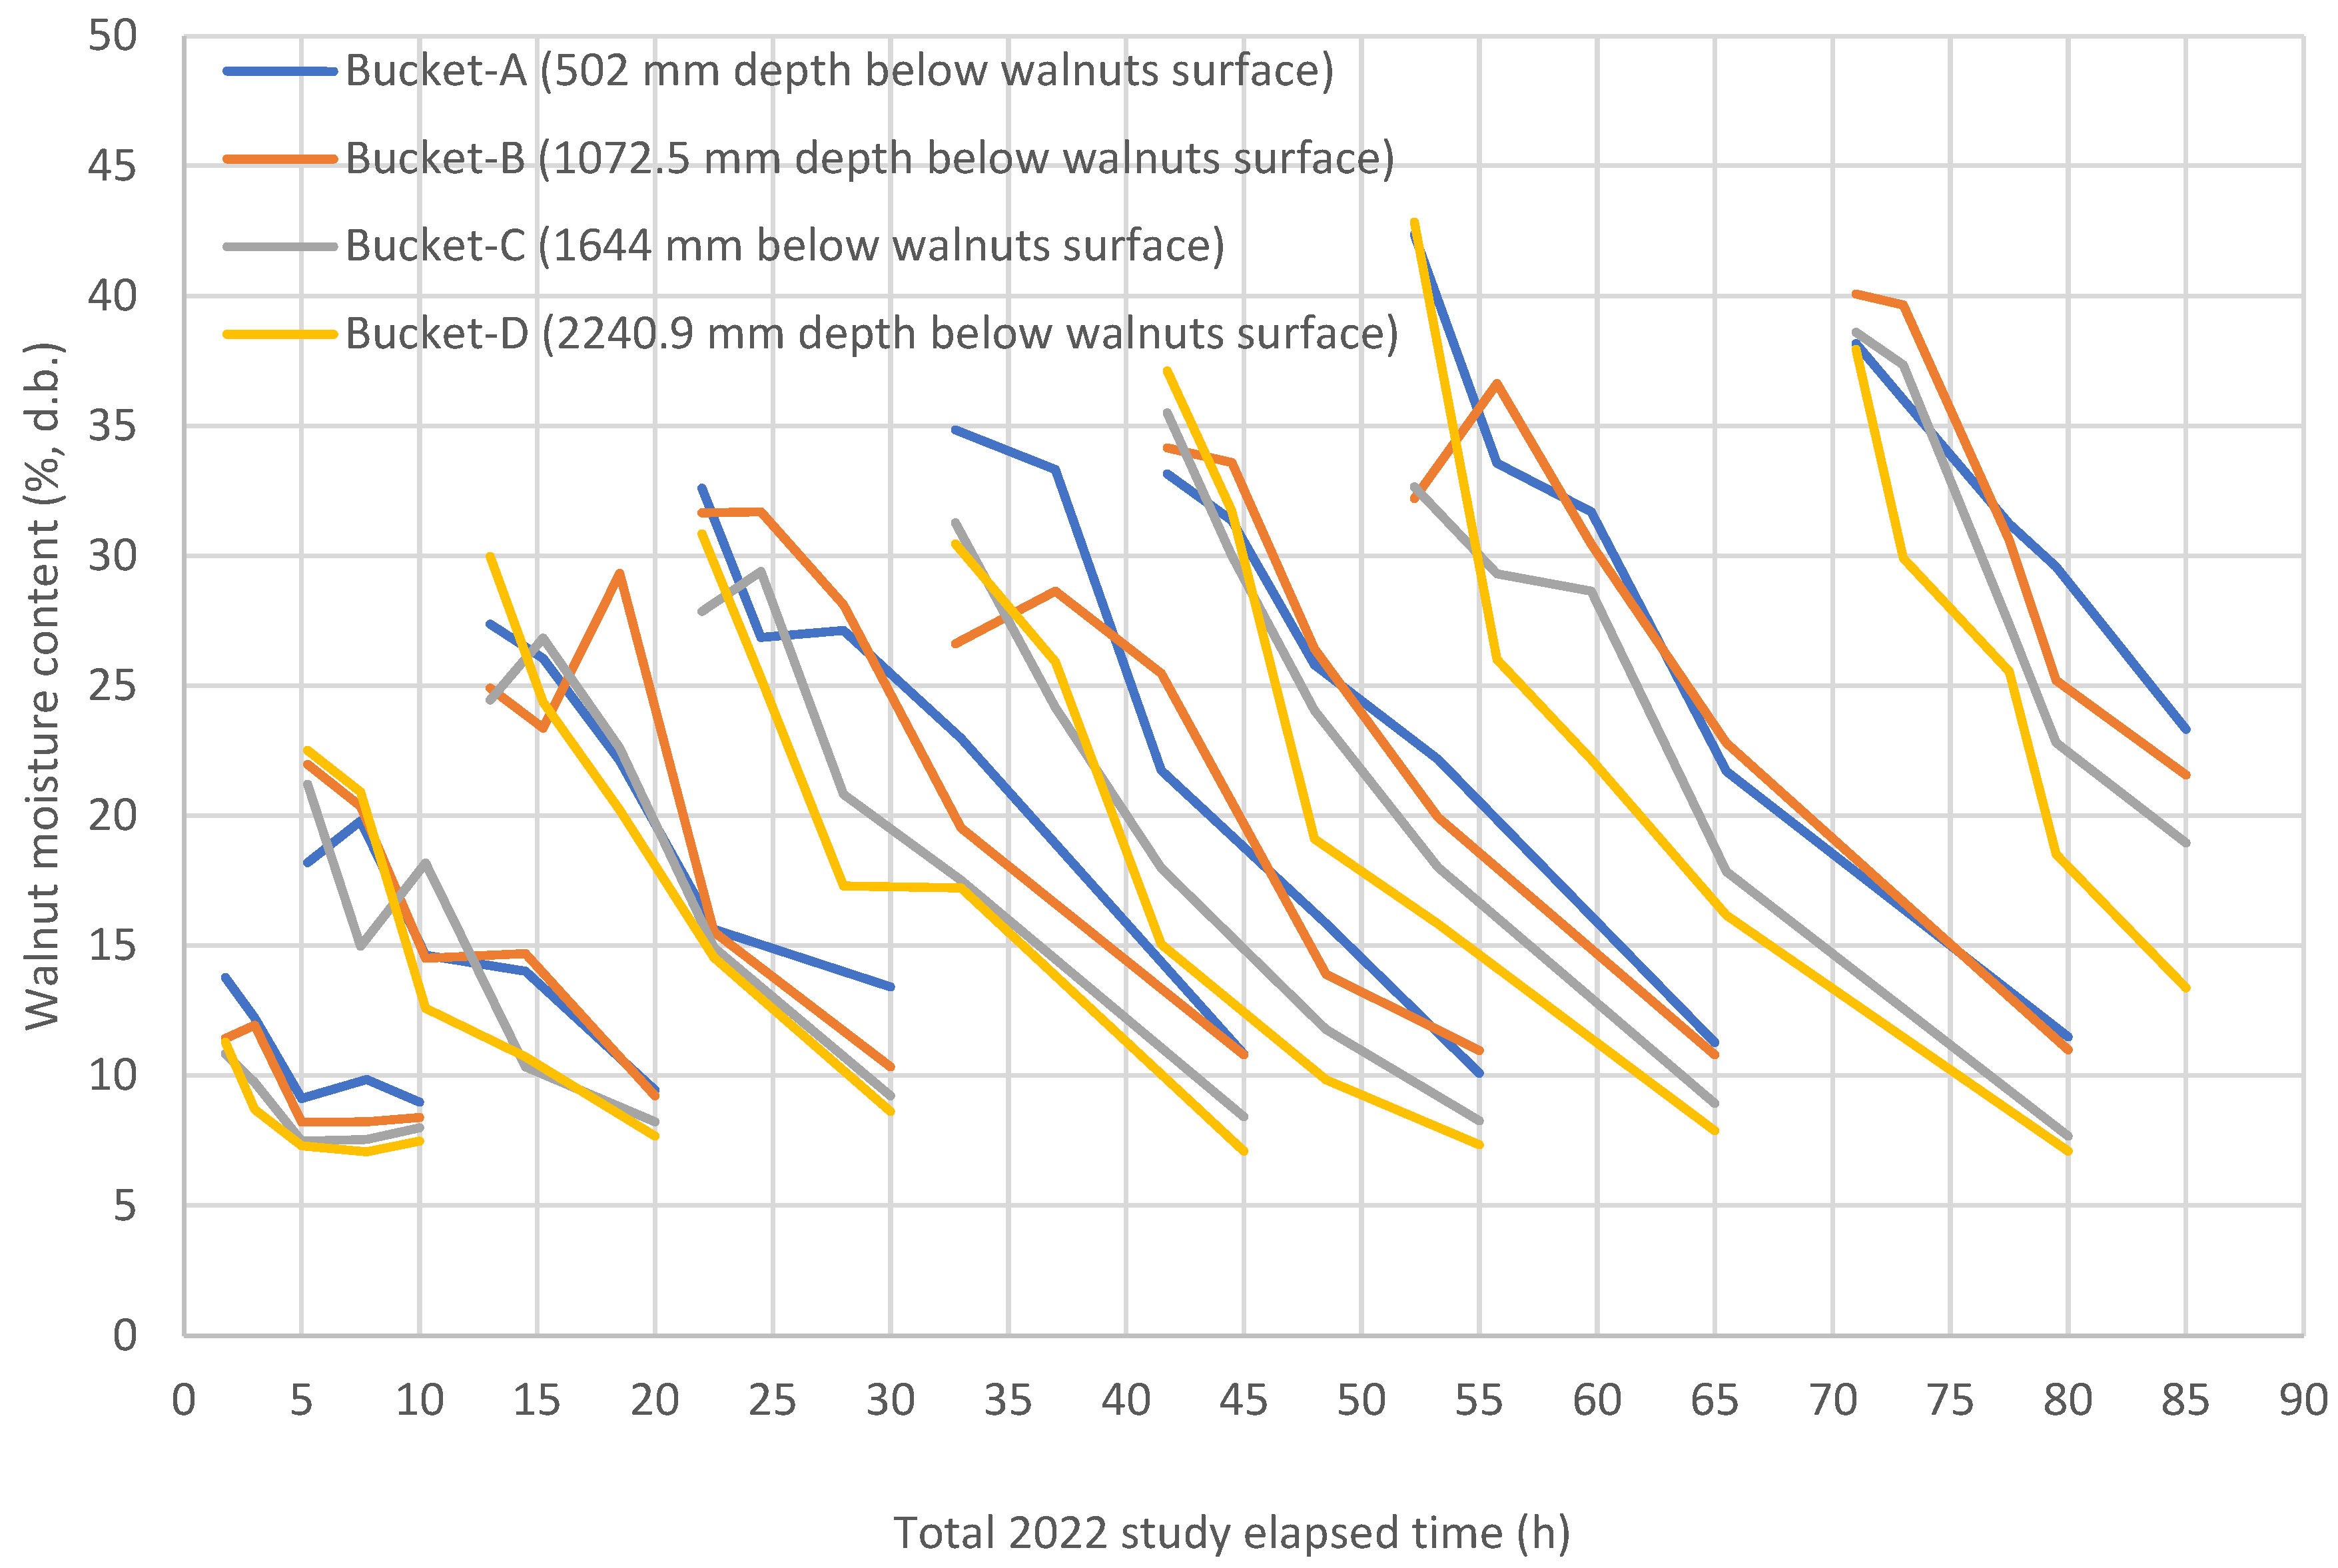
In 2022, instead of 8 sampling intervals, only five were used based on the results of the sampling interval analysis (see Section 3.3). The sample at time zero was the initial walnut moisture content before drying, and walnut sample 4 was the moisture content measurement just before the plant manager switched off the dryer. This sampling schedule captured uniform increments of moisture loss instead of uniform time increments during each batch and resulted in a more manageable number of observations. The sampling interval calculation was based on the approximate total drying time provided by the walnut plant manager. Even though the total drying time for a bin of walnuts was not always accurately estimated, plots of the observed walnut moisture contents are nearly linear (Figure 13 and Figure 14), confirming that the moisture content measurement intervals were at approximately equal moisture loss intervals. Also, our goal was to complete the sample processing and moisture content measurements at the site, thus avoiding storage, transportation back to SWCGRL, and the difficulties that arose from measuring moisture content later (like sub-sampling moldy samples, as seen in 2021).
Figure 13.
Walnuts’ moisture at different levels during the experiments conducted in the year 2022.
Figure 14.
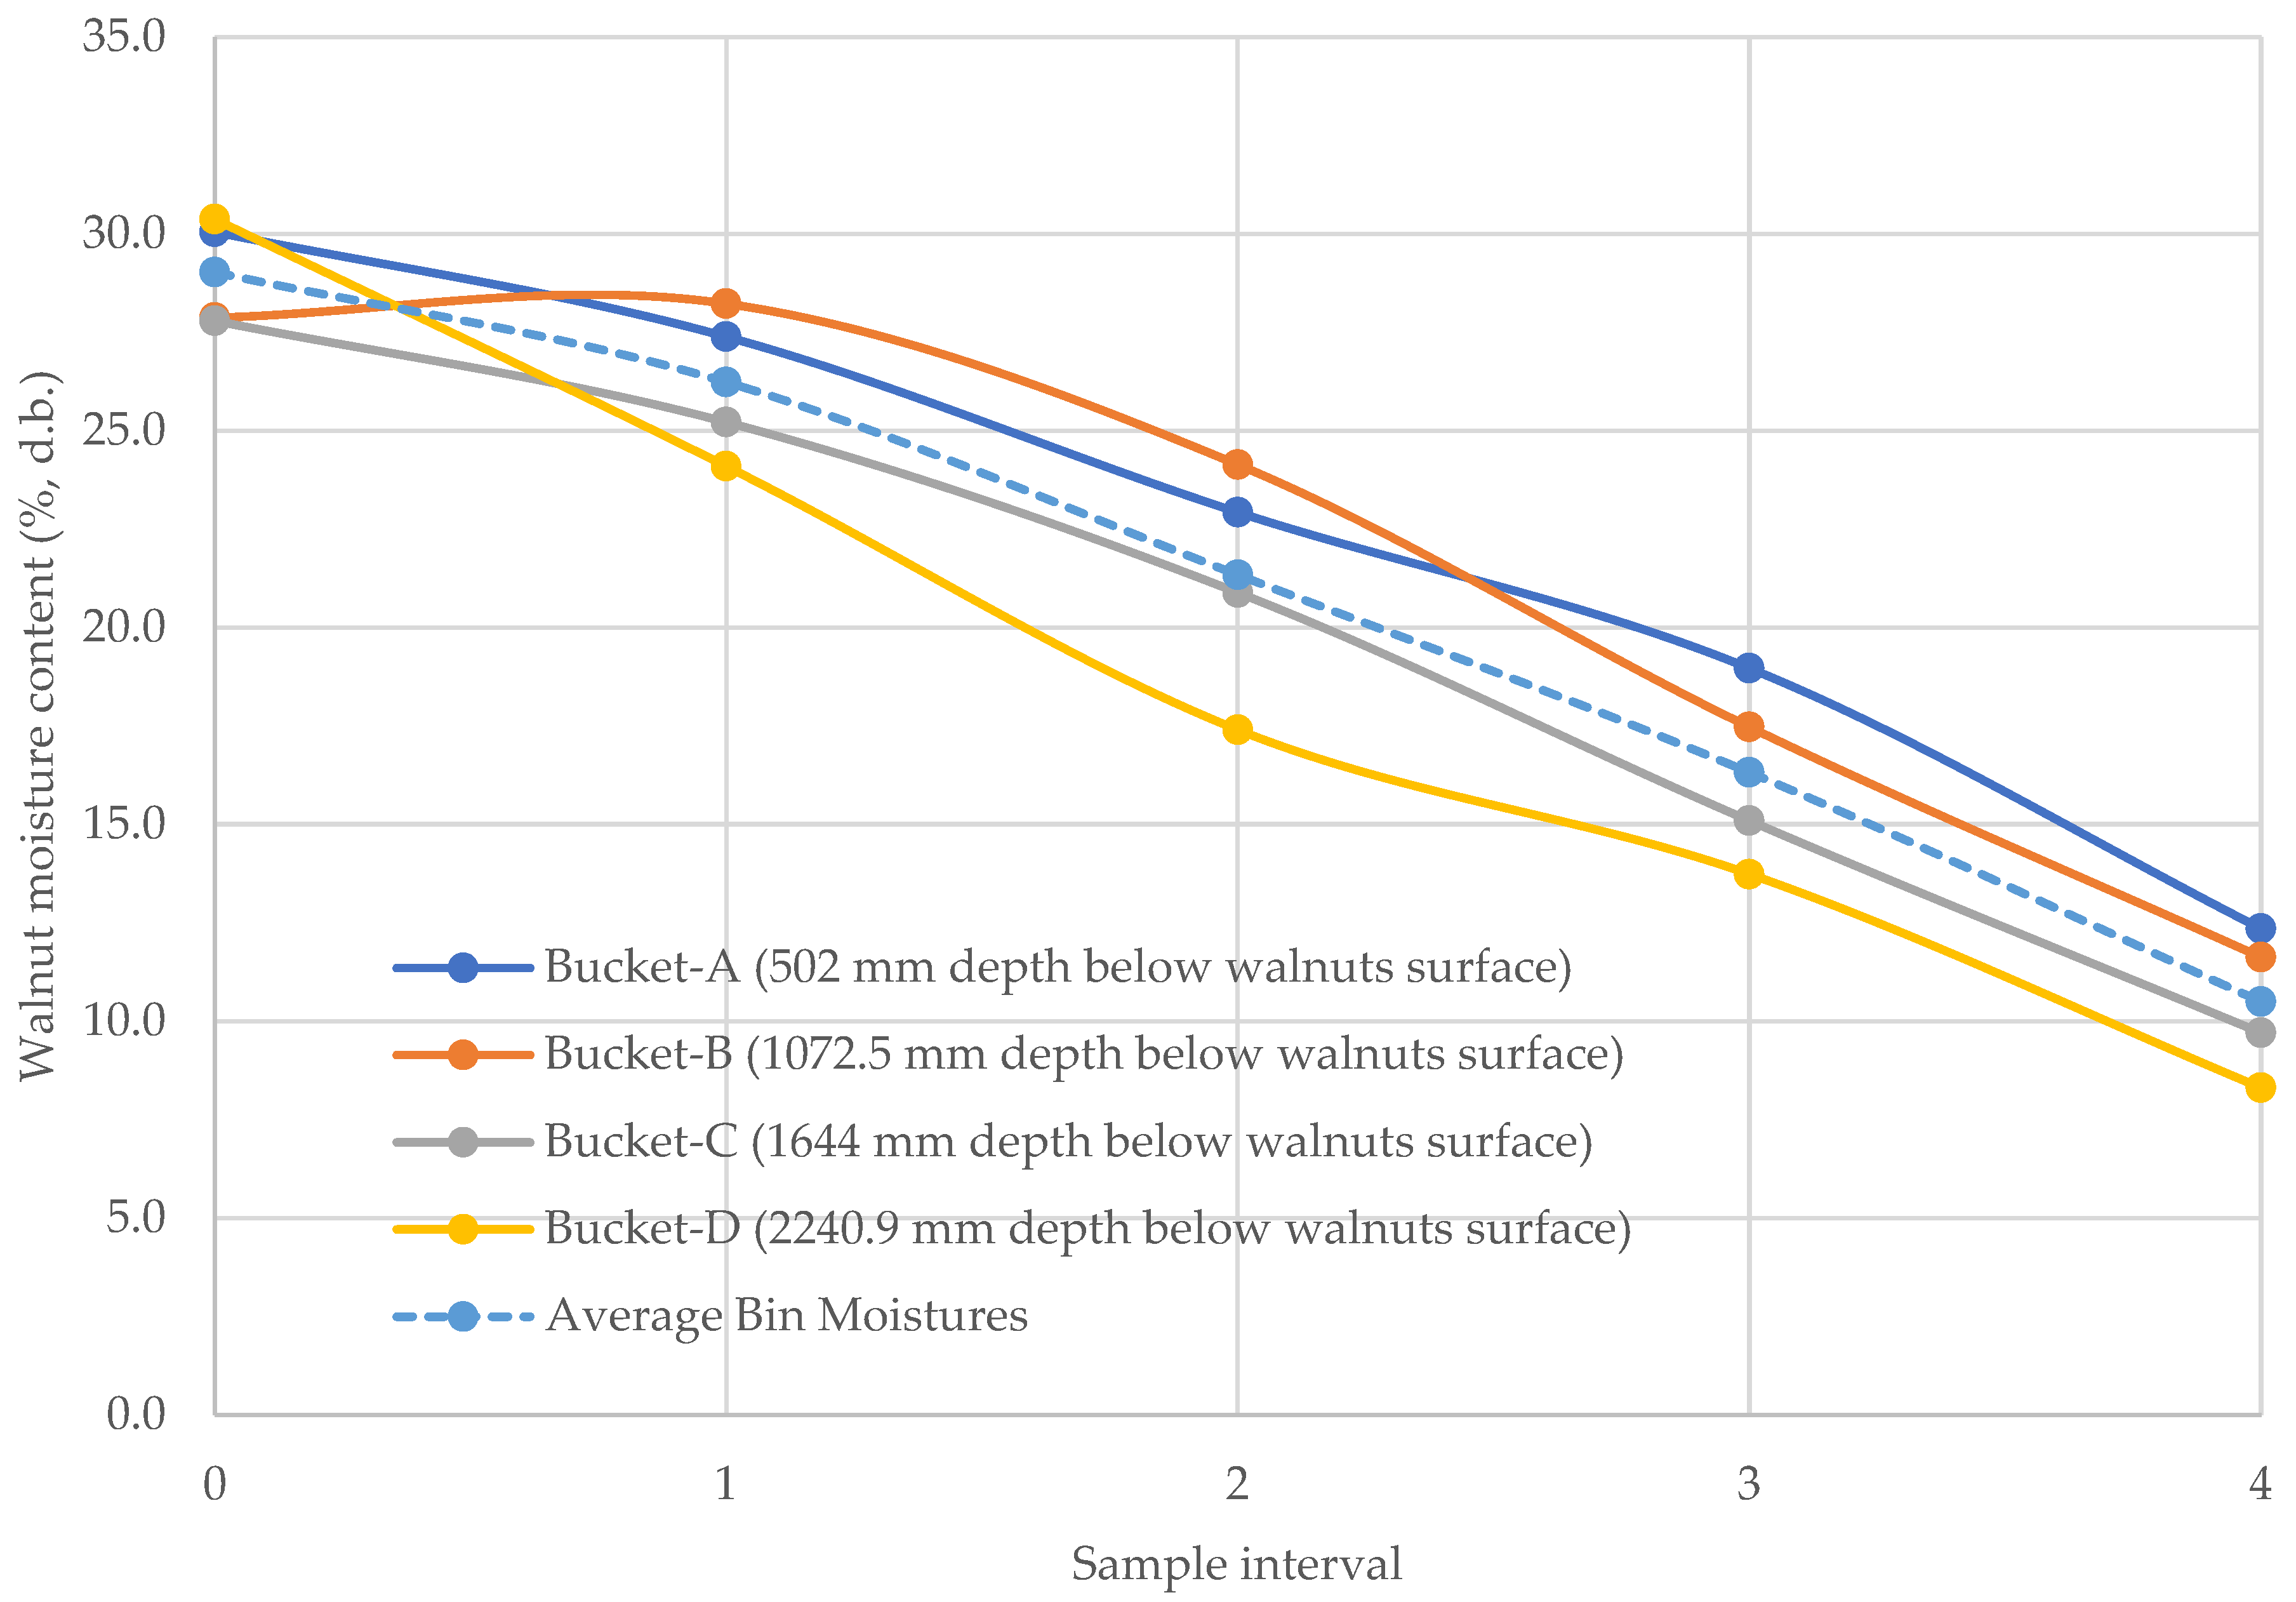
Walnut moisture content at each sampling depth and interval averaged across all eight bins sampled during the entire 2022 study.
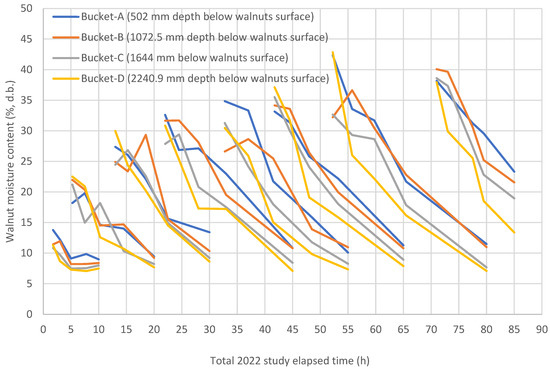
Figure 13 shows the walnut moisture content measured for eight different batches (bins) of walnuts at the commercial walnut hulling facility. This study includes the measurement of walnut moisture content for eight bins over a period of about 3.5 days. In Figure 13, the lines labeled Bucket A, B, C, and D show the walnut moisture content measurement at different depths, the same as shown in Figure 5 (where Bucket A is close to the top of the bin and Bucket D is close to the bottom of the bin). The figure shows that the initial moisture contents were different for each batch of walnuts tested. However, all the bins in the 2021 study approached a final moisture content of about 8–13% (d.b.), except the final batch at the far right in Figure 13, which was not complete when we left the facility, so it has a higher moisture content. The walnuts close to the surface of the bin (Bucket A) had higher moisture compared to walnuts close to the bottom (Bucket D). This observation was corroborated by the results from our 2021 drying studies. The moisture loss versus time curves for this study, in Figure 10 and Figure 13, are comparable to those measured for instrumented single walnuts dried in a laboratory forced air drying oven [17]. The slope of the moisture loss curve decreases as drying proceeds. Drying time for walnuts increased with increasing initial moisture content. The drying curves for walnuts vary significantly with walnut variety [27].
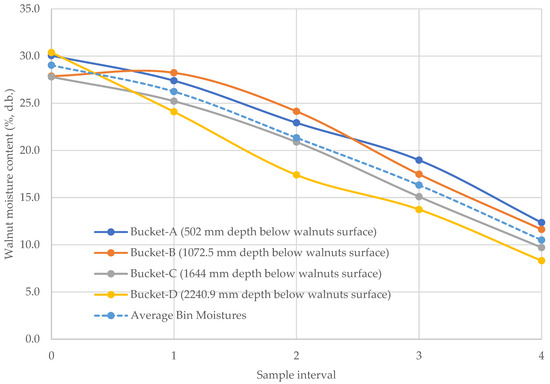
To understand the change in moisture content during the entire walnut study period of 3.5 days, the walnut moisture content measured at different depths (Buckets A–D) and sampling intervals was averaged across the 8 batches (bins) of walnuts (Figure 14). Figure 14 shows that walnuts at the bottom of the bins (Bucket D) had lower moisture contents compared to the shallower depths (Buckets A–C) after drying started. The amount of moisture content seems to be consistent, especially at depths of Buckets A, B, & C, which lost about 17.5, 16, and 18 percentage points. Samples from the depth of Bucket D, on the other hand, lost about 22.5 percentage points of moisture, about 30% more than the depths of Buckets A, B, & C. The moisture loss phenomena observed in the year 2022 were similar to studies conducted in 2021, but the final average moisture contents were in the range of 8.3–12.4% (d.b.), whereas in the year 2021, the final average moisture contents were in the range of 9.4–14.2% (d.b.). One of the factors that could have impacted the final walnut moisture is the variety tested. In 2021, walnut moisture data included several varieties like Ivanhoe, Tulare, Seer, and others, whereas in 2022, only the Chandler variety was tested. Based on the two-year study, we found that walnuts at different levels in the bins did not dry uniformly. The variable moisture decrease with time of the walnuts at the four depths below the surface of the walnuts is explained by the classic phenomena of a drying front moving through the walnut bin. In agricultural batch drying equipment, the drying front is the region where the air flowing through the material in the dryer is removing moisture [28]. The drying front occurs as the air flowing through the material becomes saturated with moisture, and water stops evaporating from the material. The drying front moves in the direction of airflow through the batch dryer. The drying front divides the material in the dryer into three zones: a dry zone in equilibrium with the inlet air, a drying zone where evaporation is occurring, and a wet zone where the flowing air is saturated [29]. There is a risk of over drying the material closer to the air inlet if an extended amount of time is required for the drying front to move completely through the dryer. Our recent work on modeling walnut drying using computational fluid dynamics (CFD) indicated that most drying happens at the lower portion of the bins, as the air is hottest and driest when entering the bin [21]. The same study also indicated that adding air tubes to inject air within the walnut mass (with a perforated cap at the top of the tube) of the commercial walnut bins can improve the airflow rates by increasing localized zones of high airflow rates in the bins, which is the focus of a future study.
3.5. NIR Model Moisture Predictions
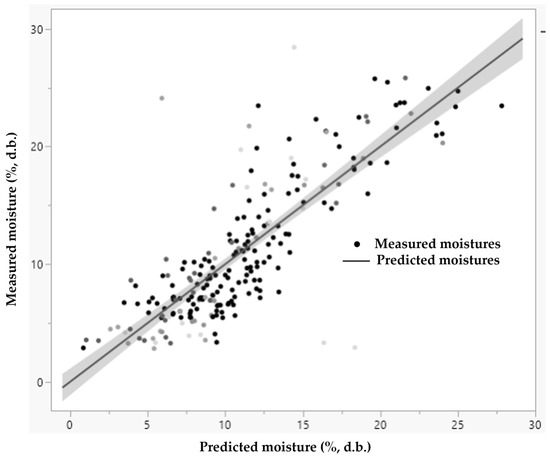
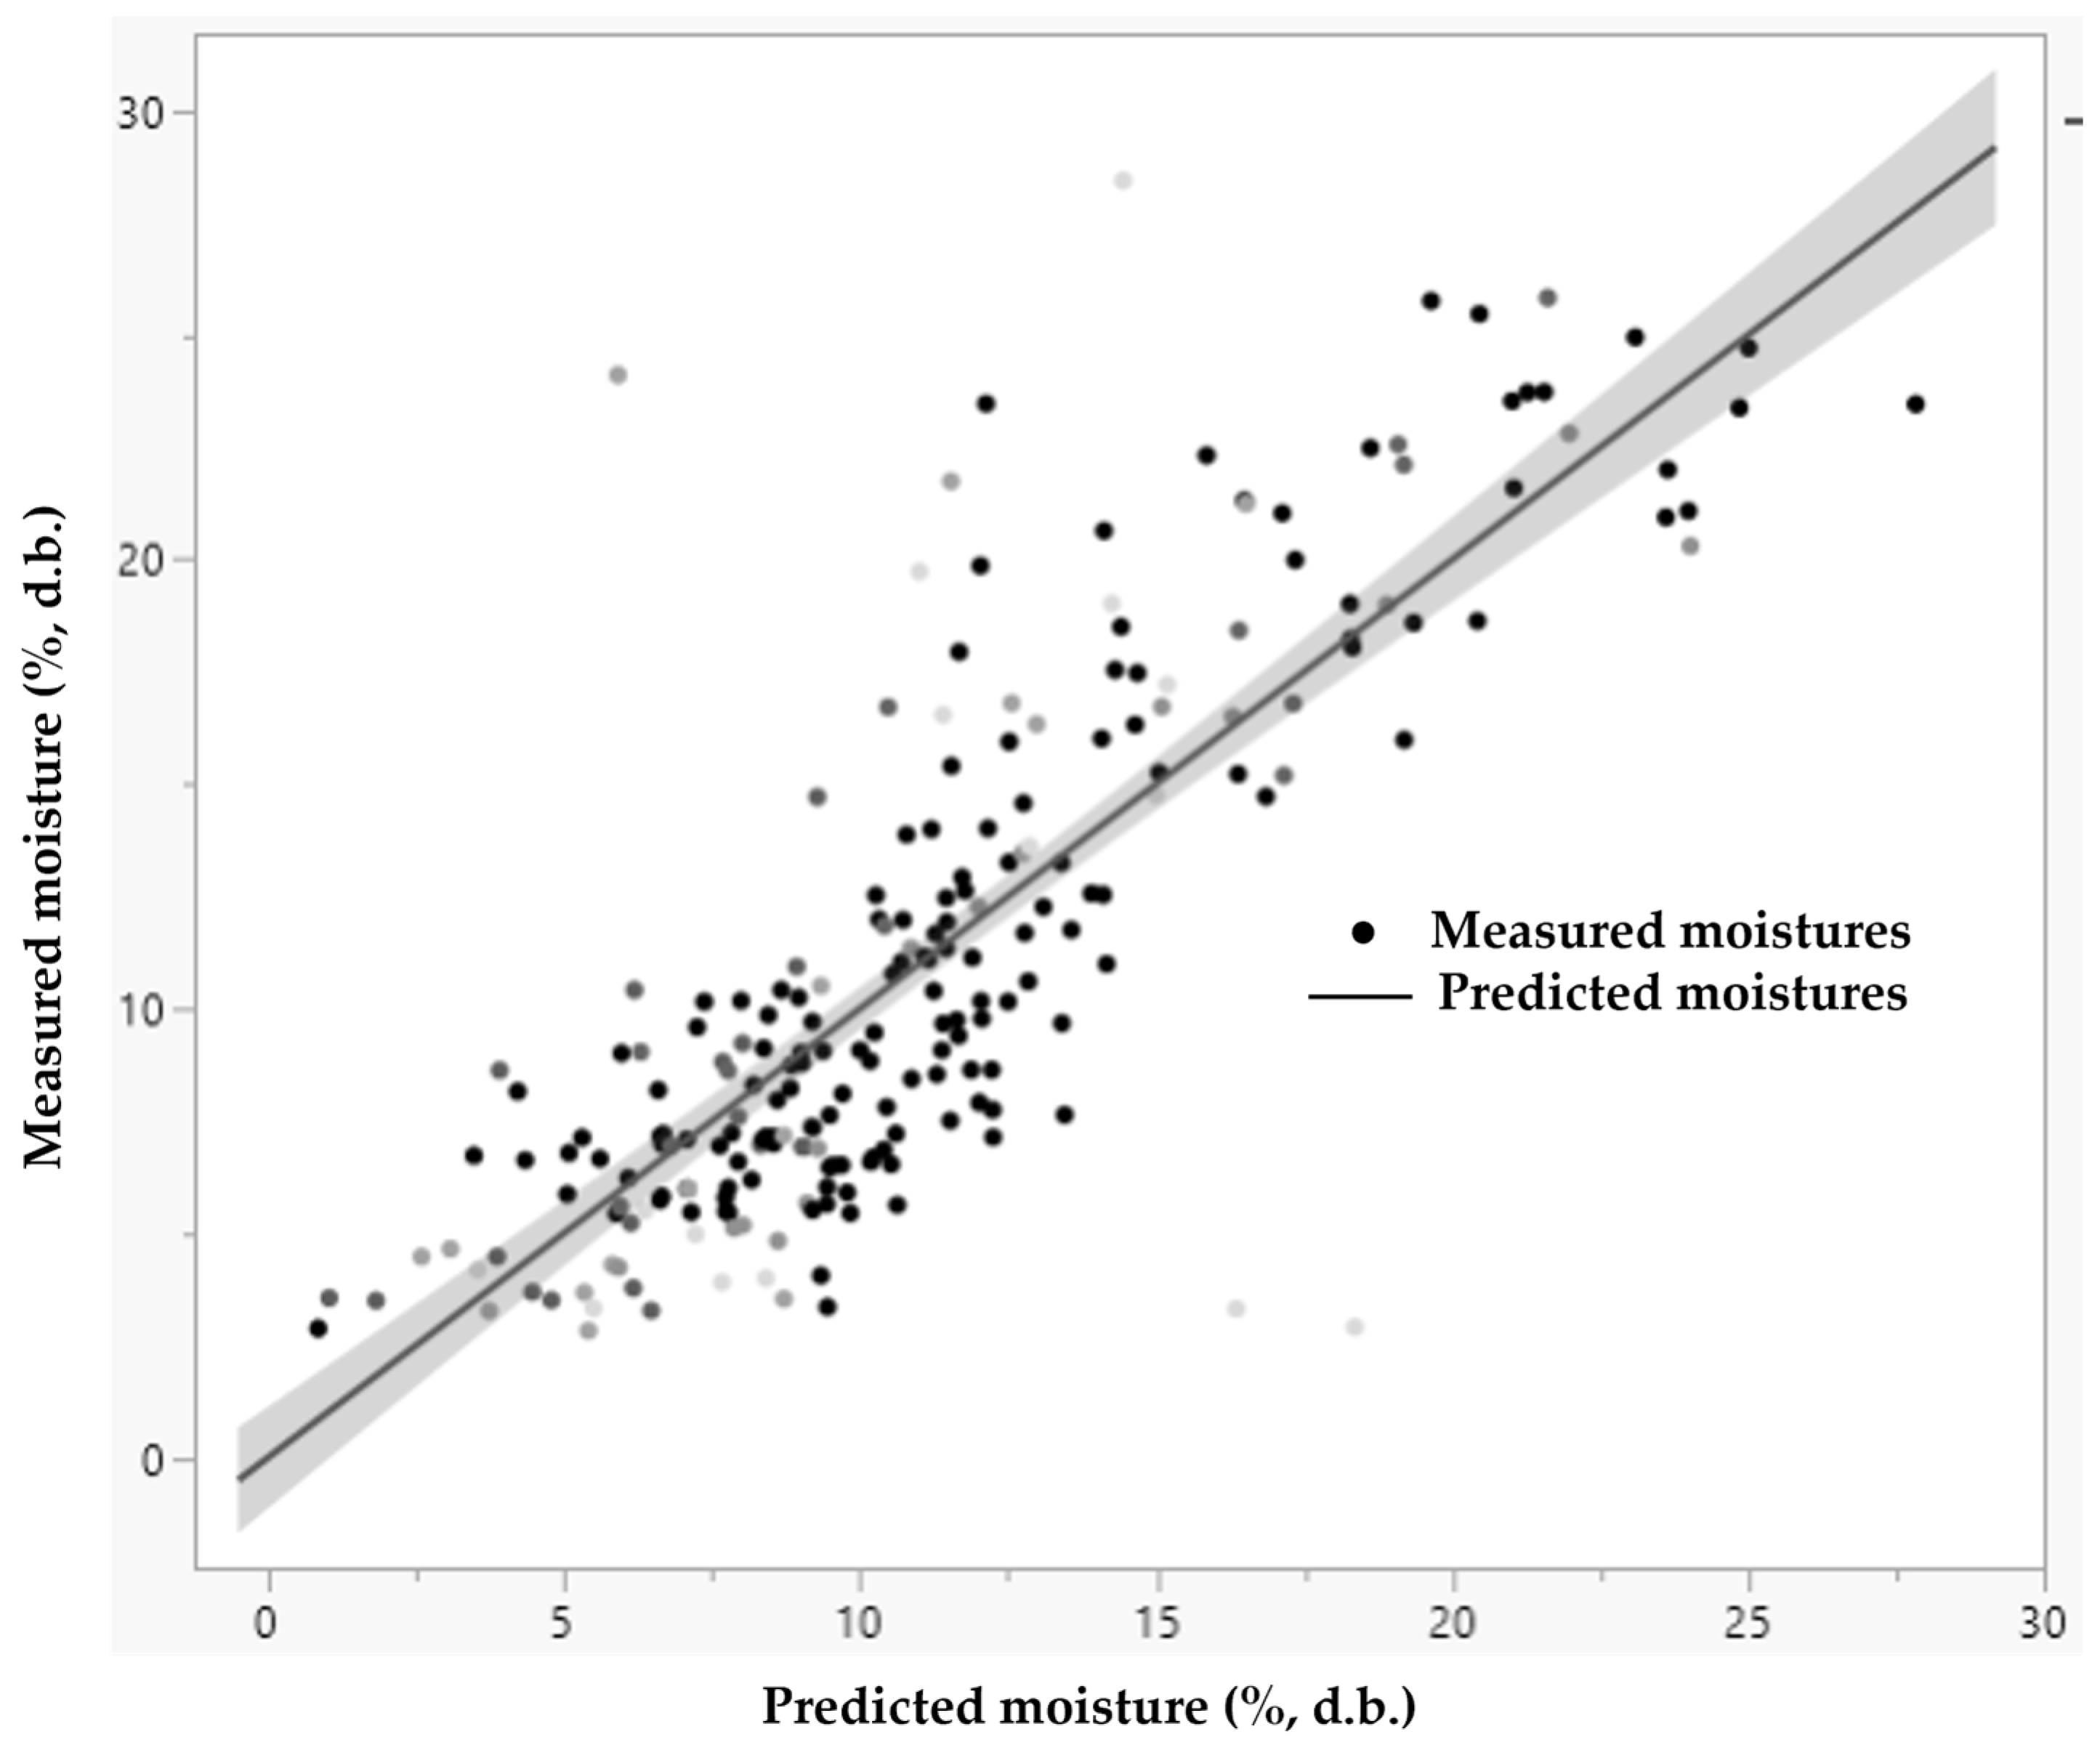
Preliminary studies on using NIR methodology for moisture content measurement at the walnut hulling facility revealed that the moisture content of incoming walnuts was highly variable (from 8.2% to 37.2%), with an average of 14.8% ± 5.5% (d.b.). Figure 15 shows the NIR predicted vs. measured moisture content based on the novel rapid moisture method for ground walnut kernels (R2 = 0.74). Correlation of NIR spectra of shell exterior to internal moisture was weaker, with R2 = 0.67. This was not surprising, given the low expected penetration depth of the incident NIR beam through the hard shell. The results arguably indicate the feasibility of NIR spectroscopy as an alternative to oven-dry methods despite the relatively weak correlations found here. However, better controls are needed to improve the correlation. These controls could include changes in sampling strategy, such as maintaining consistent particle size and ensuring uniform packaging density by minimizing voids. This would help reduce noise introduced into the spectra due to stray light or better account for the non-uniform surface of walnuts. Precise control of temperature and moisture condensation is also important, as both factors influence absorbance shifts and help reduce heterogeneity effects. Additionally, increasing sample diversity within the calibration set, removing outliers from measured samples, and incorporating additional samples can also help to improve the prediction of NIR models. More experiments are also needed to investigate whether kernels or ground kernels are better samples for NIR moisture content determination.
Figure 15.
Walnut moisture content: actual versus NIR predicted data for ground kernels.
4. Conclusions
Based on the present research, the following conclusions were drawn:
- The walnut sampling column design developed for the commercial walnut drying bins enabled the efficient collection of walnut samples at precise depths and locations in the bins, facilitating the collection of a large number of samples for moisture quantification.
- Walnut moisture measured using the conventional oven-drying method and the rapid moisture measurement method developed in this project agreed for most of the measurements within ±0.5–1.5% (d.b.). The rapid moisture content measurement method developed reduces the drying time from 24 h to 3 h.
- For samples with average moisture contents ranging from 6 to 47% (d.b.), the CV of those measurements averaged 2.65%, indicating a reasonably precise estimate of sample moisture content.
- The results indicated that storage of the ground walnut samples at ambient temperature in plastic bags resulted in mold growth but did not affect moisture content analysis results.
- Measuring moisture at four depths within the bin showed that walnuts at the bottom of the bin lost more moisture compared to the ones that were closer to the surface of walnuts in the bin.
- NIR methodology can determine the moisture content of ground walnuts; however, the best correlation with the oven-drying method was only 0.74 R2, suggesting that the technology requires further development.
Supplementary Materials
CAD diagrams of commercial walnut bin and walnut sampling system tested in the project. The following supporting information can be downloaded at: https://www.mdpi.com/article/10.3390/agriengineering8040121/s1, Figure S1: Walnut stadium drying bin with in-bin walnut samplers; Figure S2: Three-view drawing of walnut stadium bin with in-bin walnut samplers; Figure S3: Side view of walnut stadium bin with in-bin walnut samplers; Figure S4: Top view of walnut stadium bin with in-bin walnut samplers; Figure S5: Side and Top views of in-bin walnut sampler with details of top and bottom.; Figure S6: In-bin walnut sampler showing bucket chain; Figure S7: In-bin walnut sampler exploded view with parts list; Figure S8: In-bin walnut sampler bucket chain between bucket cables; Figure S9: In-bin walnut sampler bucket chain top cable and lifting handle; Figure S10: In-bin walnut sampler bucket chain; Figure S11: In-bin walnut sampler door rail to hold gate; Figure S12: In-bin walnut sampler port “A” sampler lifter rod and door three view drawing; Figure S13: In-bin walnut sampler port “B”, “C”, and “D” lift rod and door drawing; Figure S14: In-bin walnut sampler port “A” lift rod guide; Figure S15: In-bin walnut sampler port “B”, “C”, and “D” lift rod guides; Figure S16: In-bin walnut sampler bucket three view drawing; Figure S17: In-bin walnut sampler column tube three view drawing; Figure S18: In-bin walnut sampler column assembly section drawing.
Author Contributions
Conceptualization and methodology, J.S.T. and P.A.F.; investigation at walnut facility, J.S.T., P.A.F., R.P.H., A.P.B.III, Y.Z. and W.Y.; investigation of Near-infrared (NIR), R.P.H. and A.P.B.III; formal analysis, K.M.Y., J.S.T. and P.A.F.; writing—original draft preparation, J.S.T.; visualization, J.S.T. and J.S.M.; writing—review and editing, J.S.T., P.A.F., R.P.H., A.P.B.III, J.S.M., K.M.Y., D.P.W., C.B.A., Y.Z. and W.Y. All authors have read and agreed to the published version of the manuscript.
Funding
California Walnut Commission, Agreement Number/FAIN: 58-3050-2-013 and U.S. Department of Agriculture, Agricultural Research Service under project numbers: 3050-30600-001-000-D, 2030 30600 004 00D, and 6044-30600-001-000D.
Data Availability Statement
Data will be made available on request.
Acknowledgments
The authors gratefully acknowledge the cooperation of the Summerfield Farms, LLC, Hanford, California, hulling facility, David Stanfield, and crew for allowing us to do the experimental work. This study would not have been possible without their willingness and assistance. The authors would like to thank USDA-ARS-Southwestern Cotton Ginning Research Laboratory Shop Tye Lightfoot, and Russel Gardner, Fermin Alvarado, Branyan Sanxter, Paul Delgado, Arnold Gomez, Juan Gomez, Alberto Pando Jr., Kirk Zivkovich, and Jose Garcia for supporting the design, and fabrication of walnut sampling system and field experiments, which involved long hours in high temperatures and extended periods separated from their families.
US Department of Agriculture Disclaimer
The findings and conclusions in this publication are those of the author(s) and should not be construed to represent any official USDA or US Government determination or policy. Mention of trade names or commercial products in this publication is solely for the purpose of providing specific information and does not imply recommendation or endorsement by the US Department of Agriculture. USDA is an equal opportunity provider and employer.
Conflicts of Interest
The authors declare no conflict of interest.
References
- Batchelor, L.; Christie, A. Bulletin No. 376: Sun Drying and Dehydration of Walnuts; University of California Experiment Station: Berkeley, CA, USA, 1924. [Google Scholar]
- Thompson, J.F.; Rumsey, T.R.; Grant, J.A. Dehydration. In Walnut Production Manual; University of California Agriculture and Natural Resources: Richmond, CA, USA, 1998; pp. 277–284. Available online: https://ucanr.edu/sites/kingscounty/files/19005.pdf (accessed on 2 February 2025).
- Klonsky, K.; Thompson, J.; Grant, J.; Hasey, J.; Elkins, R. WN-SV-09: Sample Costs to Hull and Dry Walnuts; University of California Cooperative Extension: Sacramento Valley, CA, USA, 2009; Available online: https://ucanr.edu/sites/glenn/files/185671.pdf (accessed on 2 February 2025).
- Bergman, S.R. Energy Usage and Quality Attributes of Dry English Walnuts in California; Biological Systems Engineering, University of California: Davis, CA, USA, 2018. [Google Scholar]
- Wiegand, E. Station Bulletin 227: Walnut Drying and Packing in Oregon; Oregon Agricultural College Experiment Station: Corvallis, OR, USA, 1927; Available online: https://archiveswest.orbiscascade.org/ark:80444/xv80392 (accessed on 2 February 2025).
- Rumsey, T.; Thompson, J. Ambient air drying of English walnuts. Trans. ASAE 1984, 27, 942–945. [Google Scholar] [CrossRef] [Scilit]
- Ghatrehsamani, S.; Zomorodian, A. Impacts of drying air temperature, bed depth and air flow rate on walnut drying rate in an indirect solar dryer. Int. J. Agric. Sci. 2012, 4, 253–256. [Google Scholar] [CrossRef] [Scilit]
- Chen, C. Characteristics and Mechanisms of Walnut Drying Under Hot Air and Infrared Heating. Ph.D. Thesis, Biological Systems Engineering, University of California, Davis, CA, USA, 2020. [Google Scholar]
- Wongso, I. Drying and Quality Characteristics of Almonds and Walnuts with Different Drying Conditions. Ph.D. Thesis, Biological Systems Engineering, University of California, Davis, CA, USA, 2021. [Google Scholar]
- Yuan, Y.; Liu, X.; Jiang, J.; Liu, S.; Men, D.; Sheng, J.; Tian, Y.; Tao, L.; Dai, J. Comparative analysis of drying methods for fresh in-hull walnuts: Impact on sensory quality, physical and chemical properties and flavor characteristics. LWT-Food Sci. Technol. 2025, 223, 117675. [Google Scholar] [CrossRef] [Scilit]
- Wu, M.; Wang, P.; Zhu, F.; Zhu, Z.; Qu, X.; Wei, Y.; Cheng, Y.; Zhong, L. Post harvest drying of walnuts: Effect of drying methods on walnut quality. LWT-Food Sci. Technol. 2024, 191, 115565. [Google Scholar] [CrossRef] [Scilit]
- Pan, Z.; Zhang, R.; Venkitasamy, C.; McHugh, T.; Khir, R. Demonstration and Commercial Implementation of Energy-Efficient Drying for Walnuts. California Energy Commission, Energy Research and Development Division: Sacramento, CA, USA, 2024; CEC-500-2024-081. Available online: https://www.energy.ca.gov/publications/2024/demonstration-and-commercial-implementation-energy-efficient-drying-walnuts (accessed on 11 March 2026).
- Zhang, B.; Zheng, A.; Zhou, L.; Huang, Z.; Wang, S. Developing hot-air assisted radio frequency drying protocols for in-shell walnuts. Emir. J. Food Agric. 2016, 28, 459–467. [Google Scholar] [CrossRef] [Scilit]
- Pan, Z.; Thompson, J.F.; Haff, R. Improving Processing and Energy Efficiencies of Walnut Drying; California Walnut Board: Folsom, CA, USA, 2009; Available online: https://ucdavis.app.box.com/s/m03rsfa2x84e665m61ruepxdce54jmmd (accessed on 2 February 2025).
- Khir, R.; Pan, Z.; Atungulu, G.; Thompson, J.; Shao, D. Size and moisture distribution characteristics of walnuts and their components. Food Bioproc. Tech. 2013, 6, 771–782. [Google Scholar] [CrossRef] [Scilit]
- Chen, C.; Venkitasamy, C.; Weipeng, Z.; Khir, R.; Upadhyaya, S.; Pan, Z. Effective moisture diffusivity and drying simulation of walnuts under hot air. Int. J. Heat Mass Trans. 2020, 150, 119283. [Google Scholar] [CrossRef] [Scilit]
- Hassan-Beygi, S.; Aghbashlo, M.; Kianmehr, M.; Massah, J. Drying characteristics of walnut (Juglans regia L.) during convection drying. Int. Agrophys. 2009, 23, 129–135. [Google Scholar]
- AOAC. Official Methods of Analysis; Association of Official Analytical Chemists: Gaithersburg, MD, USA, 2002. [Google Scholar]
- Rumsey, T.; Lu, Z. High Temperature Walnut Drying; University of California: Davis, CA, USA, 1991; Available online: https://ucdavis.app.box.com/s/j5p4cfz1dm34j8r7txio2ivyburud8h3 (accessed on 2 February 2025).
- Arthur, J.; Rumsey, T. Two-dimensional drying model for stationary bin walnut dryers. Trans. ASAE 1991, 34, 193–200. [Google Scholar] [CrossRef] [Scilit]
- McIntyre, J.S.; Tumuluru, J.S.; Funk, P.A.; Haff, R.P.; Breksa, A.P.; Butts, C.L. Computational fluid dynamics modeling of airflow in walnut drying bins and bin modification effect on the airflow. Appl. Eng. Agric. 2024, 40, 415–426. [Google Scholar] [CrossRef] [Scilit]
- Grant, J.A.; Thompson, J.F. Walnut dehydrators vary in performance. Calif. Agric. 1990, 44, 12–13. Available online: https://ucdavis.app.box.com/s/a1us5vd8pm1zuqm8ht24va2qyazj907t (accessed on 2 August 2025). [CrossRef] [Scilit]
- Pan, Z.; Chen, C. Heat and moisture transfer studies on walnuts during hot air drying in fixed-bed column dryer. Appl. Therm. Eng. 2021, 199, 117554. [Google Scholar] [CrossRef] [Scilit]
- de Alcântara, C.M.; Moreira, I.d.S.; Cavalcanti, M.T.; Lima, R.P.; Moura, H.V.; da Silva Neves, R.; Cassimiro, C.A.L.; Martins, J.J.A.; da Costa Batista, F.R.; Pereira, E.M. Mathematical Modeling of Drying Kinetics and Technological and Chemical Properties of Pereskia sp. Leaf Powders. Processes 2024, 12, 2077. [Google Scholar] [CrossRef] [Scilit]
- Motevalli, A.; Minaei, S.; Soufi, M.D.; Ghobadian, B.; Khostaghava, M. Investigation of thermal utilization efficiency in different drying methods of Pomegranate Arils. Int. J. Agron. Plant Prod. 2013, 4, 2043–2046. [Google Scholar]
- Mugodo, K.; Workneh, T.S. The kinetics of thin-layer drying and modelling for mango slices and the influence of differing hot-air drying methods on quality. Heliyon 2021, 7, e07182. [Google Scholar] [CrossRef] [Scilit] [PubMed]
- Man, X.; Li, L.; Fan, X.; Zhang, H.; Lan, H.; Tang, Y.; Zhang, Y. Drying Kinetics and Mass Transfer Characteristics of Walnut under Hot Air Drying. Agriculture 2024, 14, 182. [Google Scholar] [CrossRef] [Scilit]
- Gunathilake, D.M.; Senanayaka, D.P.; Adiletta, G.; Senadeera, W. Drying of Agricultural Crops. In Advances in Agricultural Machinery and Technologies; Chen, G., Ed.; CRC Press: Boca Raton, FL, USA, 2018; p. 488. [Google Scholar]
- Lewis, M.A.; Trabelsi, S. Investigating the influence of grain drying with ambient air versus heated air within an eighth-scale grain drying bin. Appl. Eng. Agric. 2022, 38, 523–533. [Google Scholar] [CrossRef] [Scilit]

Disclaimer/Publisher’s Note: The statements, opinions and data contained in all publications are solely those of the individual author(s) and contributor(s) and not of MDPI and/or the editor(s). MDPI and/or the editor(s) disclaim responsibility for any injury to people or property resulting from any ideas, methods, instructions or products referred to in the content. |
© 2026 by the authors. Licensee MDPI, Basel, Switzerland. This article is an open access article distributed under the terms and conditions of the Creative Commons Attribution (CC BY) license.