


Abstract
Apple leaf disease identification with high precision is one of the main challenges in precision agriculture. The datasets usually have class imbalance problems and environmental changes, which negatively impact deep learning approaches. In this paper, an ablation study is proposed to test three different scenarios: V1, a hybrid balanced dataset consisting of 10,028 images; V2, an imbalanced dataset as a baseline consisting of 14,582 original images; and V3, a 3× physical augmentation approach based on the 14,582 images. The classification performance of YOLOv11x was benchmarked against three state-of-the-art CNN architectures: ResNet-152, DenseNet-201, and EfficientNet-B1. The methodology incorporates controlled downsampling for dominant classes alongside scenario-based augmentation for minority classes, utilizing CLAHE-based texture enhancement, illumination simulation, and sensor noise generation. All the models were trained for up to 100 epochs under identical experimental conditions, with early stopping based on validation performance and an 80/20 train-validation split. The experimental results demonstrate that the impact of balancing strategies is model-dependent and does not universally improve performance. This highlights the importance of aligning data balancing strategies with architectural characteristics rather than applying uniform resampling approaches. YOLOv11x achieved its peak accuracy of 99.18% within the V3 configuration, marking a +0.62% improvement over the V2 baseline (99.01%). In contrast, EfficientNet-B1 reached its optimal performance in the V2 configuration (98.43%) without additional intervention. While all the models exhibited consistently high AUC values (≥99.94%), DenseNet-201 achieved the highest value (99.97%) across both V2 and V3 configurations. In fine-grained discrimination, the superior performance of YOLOv11x on challenging cases is verified, with only one incorrect classification (Rust to Scab), while ResNet-152 and DenseNet-201 incorrectly classified eight and seven samples, respectively. Degradation sensitivity analysis under controlled Gaussian noise and motion blur indicated that CNN baseline models maintained stable performance. High minority-class reliability, including a 96.20% F1-score for Grey Spot and 100% precision for Mosaic, further demonstrates effective fine-grained discrimination. Results indicate that data preservation with physically inspired augmentation (V3) is better than resampling-based balancing (V1), especially in terms of global accuracy and minority-class performance.
1. Introduction
Accurate disease classification in apple leaves is essential in agriculture and precision farming. Despite this, it is a difficult job for apple leaves because of the various types of leaf diseases that exist, as there are fewer images used for training and testing. For a number of years, researchers have considered this a complicated problem to solve [1,2].
The application of deep learning models, especially convolutional neural networks (CNNs) and You Only Look Once (YOLO) networks, has been rapidly increasing in recent years for identifying and detecting plant diseases. For instance, a modified version of the YOLO v5 technique for recognizing/detecting diseases on the leaves of apples was developed by researchers named Liu and Li, which increased the efficiency and accuracy of the system with the incorporation of the Wise-IoU loss function along with the RepVGG module [3]. Another research study by Jiang et al. has shown that it is possible to harness the potential of CNNs for disease diagnosis, which has proven the feasibility of applying such models during the stages of plant disease development. This study further supports the potential applicability of CNN models for plant disease analysis [4].
Another problem that prevails in plant disease image classification is that of imbalances in the number of healthy images and disease images within the dataset. For handling such imbalances, Zhong and Zhao used a technique called DenseNet-121 with a set of hybrid image augmentation methods. The technique includes textural enhancements and lighting effects, which are used to enhance the underrepresented disease classes, thereby increasing the accuracy of disease image classification [5]. In a recent study, Ojo and Zahid showed that a combination of contrast-limited adaptive histogram equalization and GAN-based resampling can enhance the performance of deep learning for class-imbalanced plant diseases, yielding an average accuracy of 97.69% on a ResNet-50 backbone [6]. As a continuation of this subject, Khan et al. came forward with the concept of a real-time system for apple leaf disease detection based on deep learning solutions and made the point that efficient and scalable solutions for deep learning would be required and implemented [7]. Further innovative work was carried out by Sun et al. with the advent of MEAN-SSD: A highly efficient deep real-time detector designed with advanced light-weight convolutional neural networks [8]. Prior key contributions were made within image-based deep learning solutions for plant disease recognition by Mohanty et al. [9].
A recent systematic review by Doutoum & Tugrul [10] presents a thorough integration of the deep learning-based approaches for apple leaf disease classification and detection. This work analyzes 45 research papers that were published between 2016 and 2024, covering a vast array of convolutional neural network architectures such as AlexNet, VGG, ResNet, EfficientNet, and YOLO models. In addition to architectural approaches, the analysis discusses widely used datasets like PlantVillage, Plant Pathology, and self-recorded datasets for apple leaf images, demarking their strengths and pitfalls with regard to their realism, diversity, and class distribution. The study also dissects the testing methodologies, data augmentation approaches, and framework of preference, such as PyTorch, TensorFlow, or Caffe respectively, while pointing out some challenges, such as class imbalance, background cluttering, and the need to generalize models effectively for real-world applications. It also spotlights the current shift to reduced models with enhanced attention approaches, establishing the need for effective real-world models that still retain their high-performance levels even for a vast number of leaf diseases.
Table 1 gives a simple and clear literature review on recent deep learning research for classifying apple leaf disease. The comparison from the table highlights the differences between datasets, disease class range, network model design, and precision and applicable limits for each method.
Table 1.
Comparative analysis of recent deep learning-based studies on apple leaf disease classification.
Without further investigation, it appears that previous research methods tend to apply small class intervals; artificial data sets; and small, efficient models with lower sensitivity. In this work, however, the method is reliable with higher precision for classification compared to previous approaches. Despite the above-noted significant advancements, the current literature is also known to point out several limitations and concerns that still exist and relate to the constraints on the size and diversity of datasets and their application parameters from the real world. The recent work on the target for lightweight architectures in the 2023–2024 timeframe uses synthetic data or suffers from a significant natural class imbalance. Unlike previous work that focuses on model compression at the expense of minority class accuracy, this study targets an upper bound for performance with a high-capacity model (YOLOv11x) and a hybrid balancing approach that matches rare disease detection accuracy with that of common diseases.
The direction and outlook for next-stage research and development can be observed to be aligned towards optimization and compression for usage at the edge and applicable for UAV and mobile devices for agricultural disease surveillance and monitoring. The literature reviewed here encompasses the present state and also identifies areas for exploration for the development of balance-aware deep learning for apple leaf disease classification. Accordingly, this study is now guided by the following Research Questions (RQs):
RQ1: To what extent do different data distribution strategies (balanced vs. imbalanced vs. data-preserving augmentation) influence minority-class performance?
RQ2: How does the YOLOv11x architecture compare to traditional CNN benchmarks (ResNet, DenseNet) in terms of classification performance under class imbalance?
RQ3: Can the model maintain high sensitivity for fine-grained disease patterns (e.g., Grey Spot) without compromising global accuracy?
2. Materials and Methods
This section explains the properties of the dataset, a proposed framework for balancing the data, and the setup used in experiments within the research. To make the preprocessing steps reproducible, hyperparameter tuning is clearly expressed.
2.1. Dataset Acquisition and Characteristics
The proposed research uses the AppleLeaf9 dataset, a large dataset of apple leaf images. The AppleLeaf9 dataset has 14,582 images and is available at https://github.com/JasonYangCode/AppleLeaf9 [16]. The dataset is licensed under the Creative Commons Attribution 4.0 International License, and the paper gives more details on how the dataset was collected, including the equipment, location, and time used.
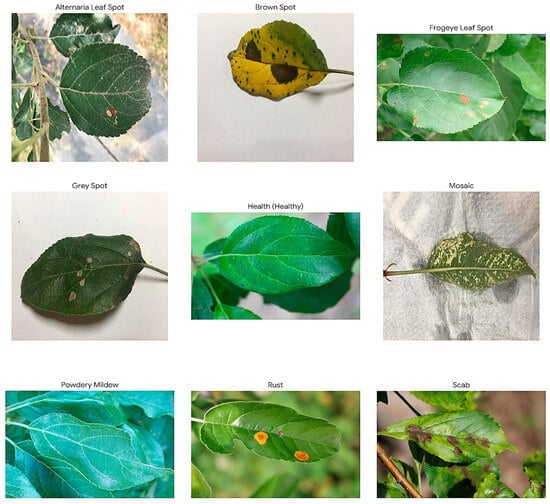
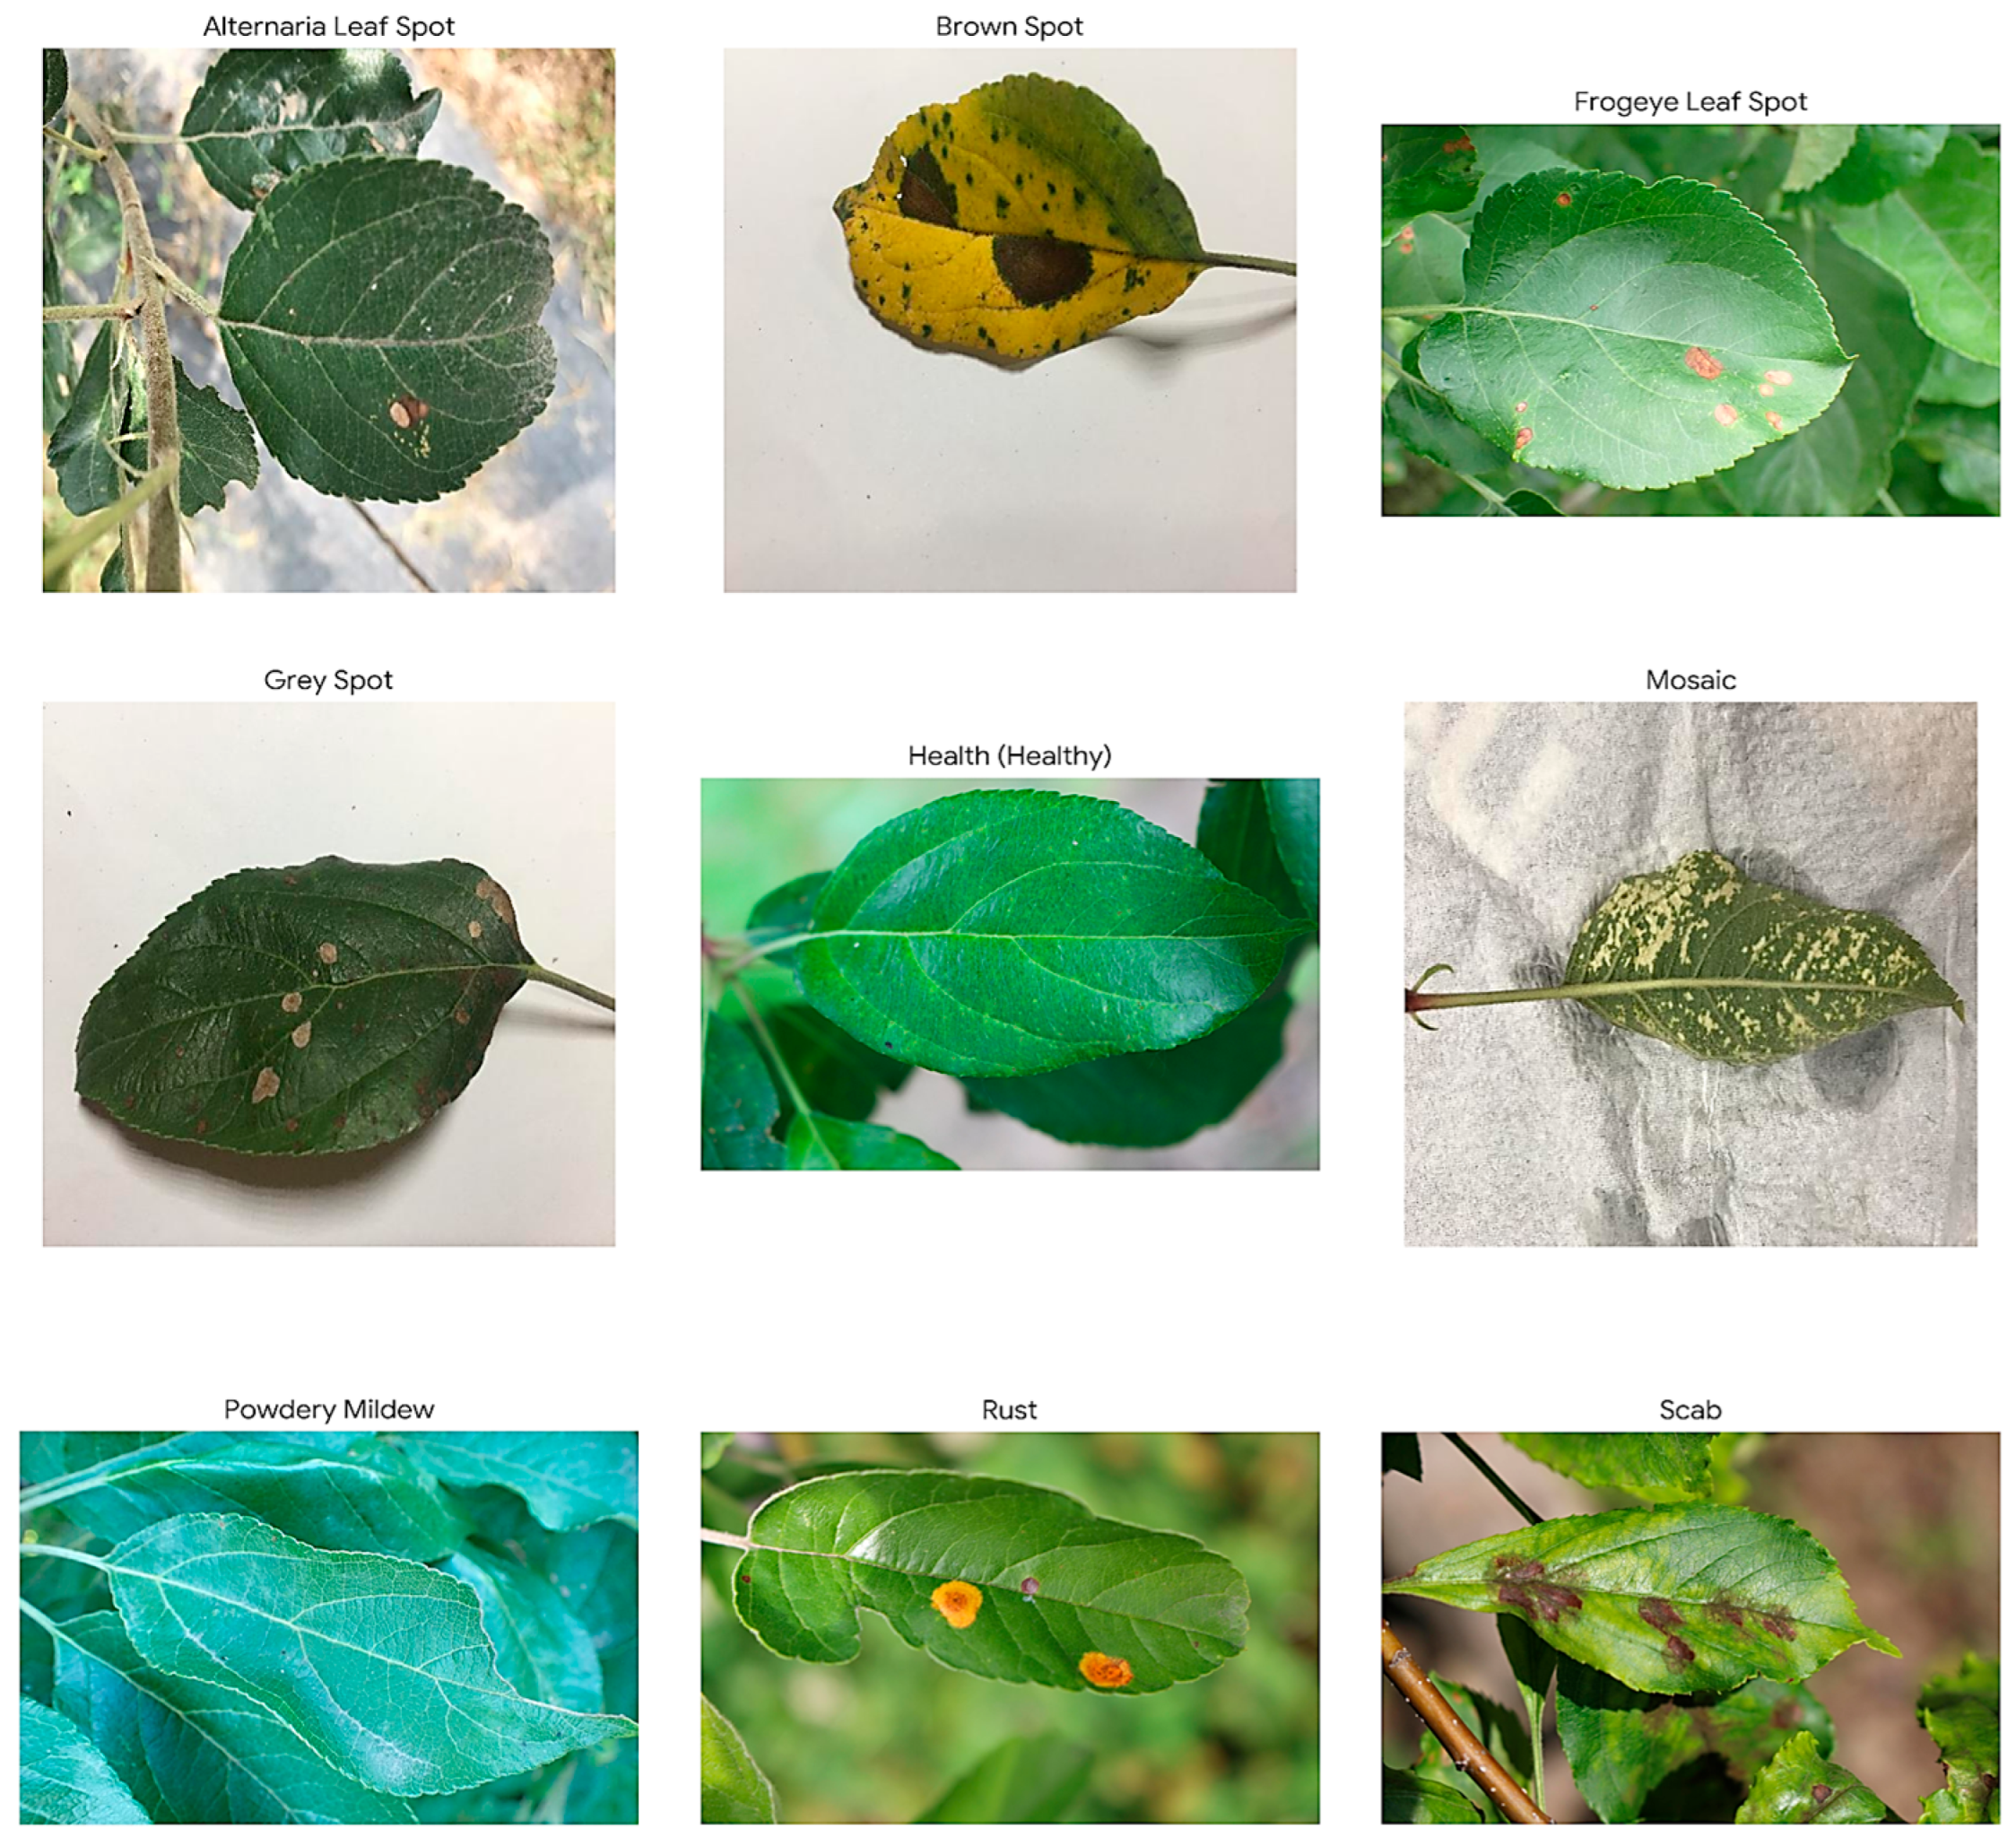
The dataset includes nine classes of different images. These represent eight classes of disease, such as Alternaria Leaf Spot, Brown Spot, Frogeye Leaf Spot, Grey Spot, Mosaic, Powdery Mildew, Rust, and Scab, and healthy leaves. Based on the exploratory data analysis, it has been observed that there is a significant imbalance in the dataset. The number of images in each class is significantly different. The class containing 5410 images is for the “Scab” disease type. The class containing only 339 images is for the “Grey Spot” disease type. This imbalance in the classes of the dataset is known to affect the learning algorithms. The learning algorithm is biased towards classes containing a greater number of instances. For this study, three experimental setups, namely V1, V2, and V3, were used. In V1, a balanced dataset of 10,028 images was used, which was made balanced through controlled downsampling and scenario-based augmentation. In V2 and V3, the imbalanced dataset of 14,582 images was used to evaluate the balancing and augmentation factors. Figure 1 shows the various apple leaf diseases with their visual representations.
Figure 1.
Representative samples from the AppleLeaf9 dataset. From left to right and top to bottom: Alternaria Leaf Spot, Brown Spot, Frogeye Leaf Spot, Grey Spot, Healthy, Mosaic, Powdery Mildew, Rust, and Scab.
2.2. Data Balancing and Augmentation Framework
To address class imbalance and improve stability under skewed class distributions, a Hybrid Balancing and Augmentation Strategy was adopted. It includes two stages:
1. Controlled Downsampling: To reduce the effect of the majority class, random undersampling of the Scab, Rust, and Frogeye Leaf Spot categories was used with a fixed size that ranges from 1000 to 1400 per class.
2. Scenario-Based Augmentation: For the minority classes, namely Grey Spot, Mosaic, Brown Spot, Alternaria, and Health, a data generation tool was developed that uses the Albumentations library. The augmentation tool consists of three components:
- ▪
- For all the images, CLAHE (Contrast-Limited Adaptive Histogram Equalization) was used with the following parameters: clip_limit = 4.0, tile_grid_size = (8, 8).
- ▪
- Lighting variations (sunny, overcast, and shadowed scenarios) were simulated by applying the RandomBrightnessContrast and HueSaturationValue transforms.
- ▪
- The acquisition artifacts, such as shake, defocus, and angular variations, were modeled by applying transformations with MotionBlur, GaussNoise, and ShiftScaleRotate.
Following these steps, a homogeneous and well-balanced dataset is acquired, which consists of a total of 10,028 images. The distribution of the dataset, with and without balancing, is represented in Table 2.
Table 2.
Class-wise data distribution before and after hybrid balancing.
To make the most of the data available for learning features in a stratified hold-out validation scheme, given that the sample size of the classes of interest is relatively small, the data was split equally into 80% for training and 20% for validation/test. The validation data was not to be used in the training process in any way, except to determine the “Best Model” using early stopping. Moreover, unlike previous approaches that addressed oversampling alone, the suggested framework addressed both class dominance and feature diversity adequately, which helped to effectively overcome the issue of overfitting caused by replicated instances in oversampling approaches while also capturing key features of the minority classes. Furthermore, the data augmentation scheme, which depends on the scenario, helped the network obtain feature representations that remain invariant to illumination variations, sensor noises, and inconsistencies in data acquisition that often occur in real-world orchard scenery. Therefore, the balanced data maintained both inter-class separability and consistency for better convergence of training, which is directly related to the improvement achieved in the experimental results.
Unlike the V1 configuration, the V3 setup did not utilize any class balancing or downsampling technique. Instead, the original data set in its original form was maintained. The original data set consists of 14,582 images. As the images were processed during the training phase, three different transformation operations were carried out on the images. As a result, three images were added to the data set for every original image. Thus, the original data set was expanded four times.
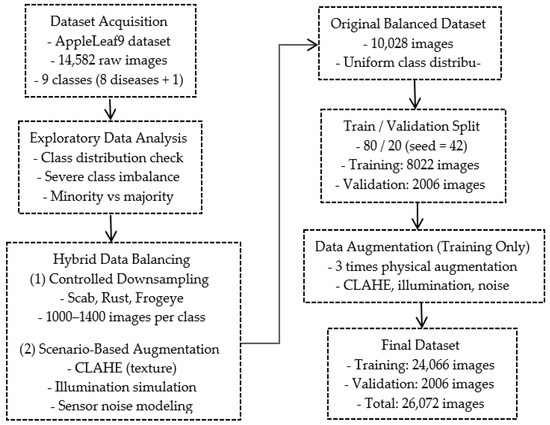
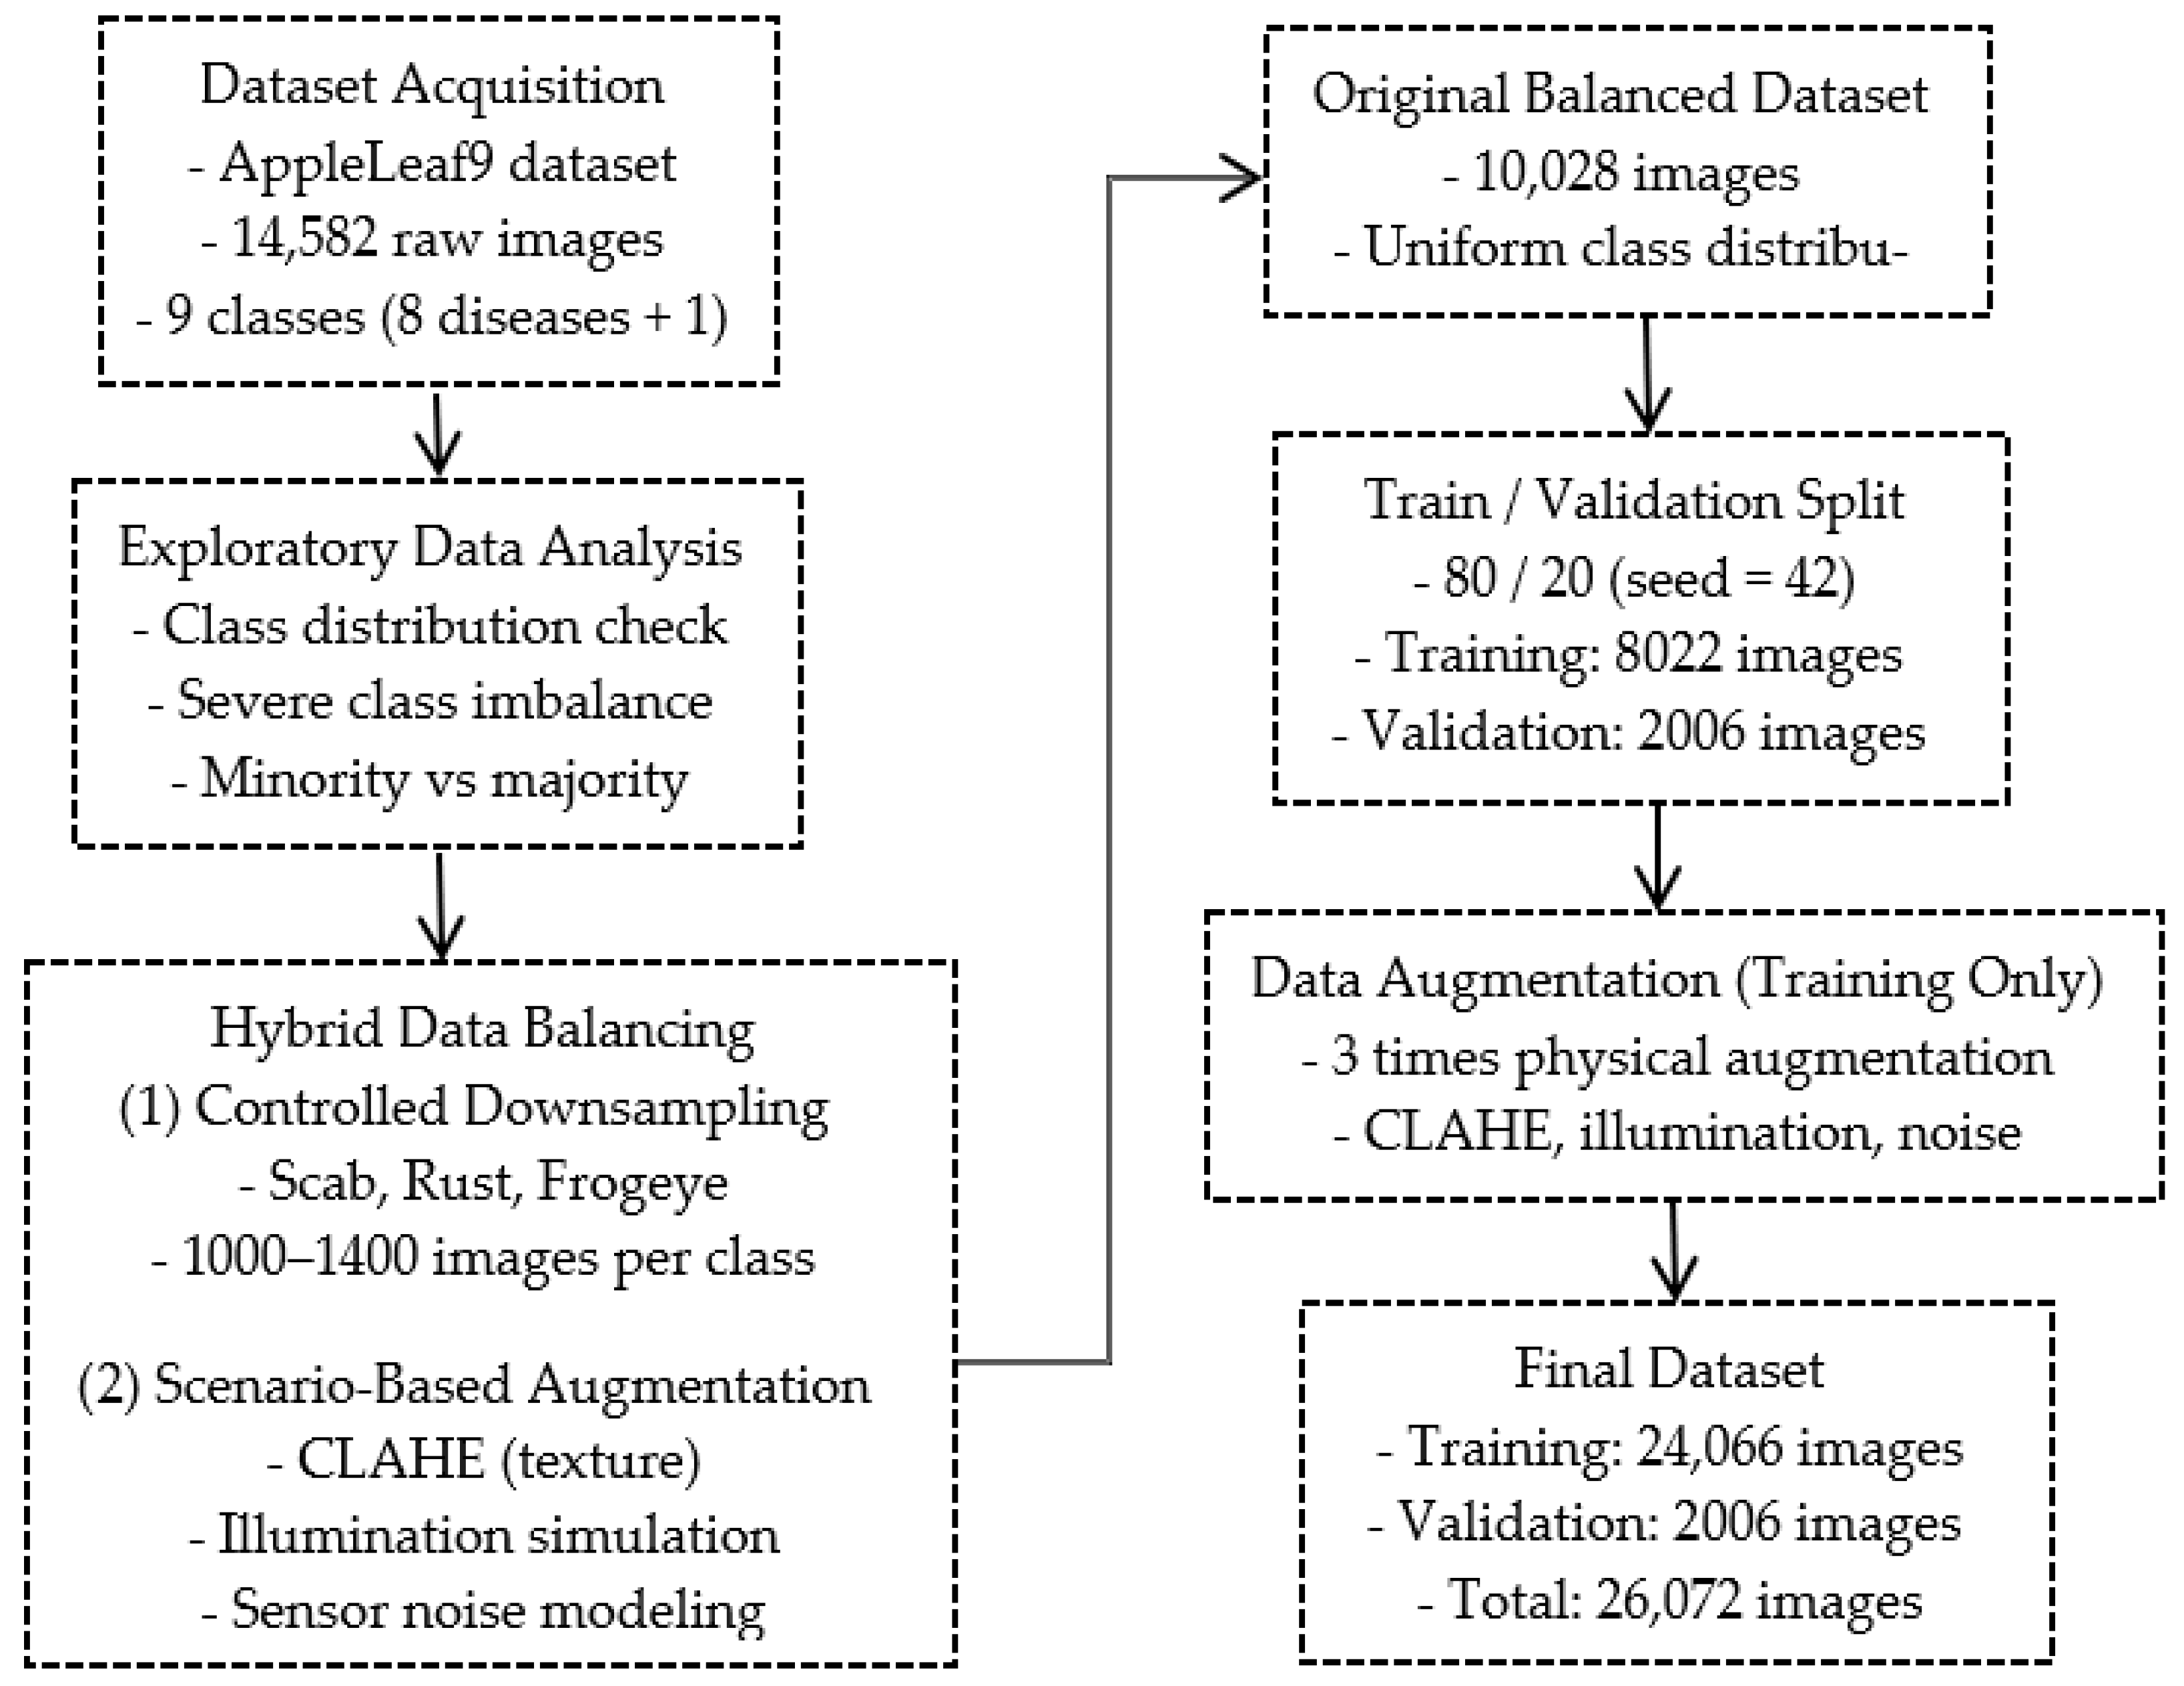
Figure 2 illustrates the experimental framework adopted for the robust classification of apple leaf diseases using the AppleLeaf9 data set. As depicted in the figure, the experimental framework starts by performing a thorough analysis of the data set to check whether class imbalance exists. To overcome class imbalance and reduce the effect of class imbalance, a hybrid approach was adopted. Downsampling of the majority class and scenario-based data augmentation were performed on the minority class. Variance in texture, illumination, and sensor noise were incorporated in the minority class data set to simulate various real-world conditions. After the class balancing technique was adopted, the data set was divided into the training set and the validation set in the ratio 80:20. Data augmentation was performed only on the training set, whereas the validation set was left unchanged. Finally, the proposed YOLOv11x model and various comparative CNN models were trained under the same experimental conditions.
Figure 2.
Experimental workflow of the proposed hybrid data balancing and YOLOv11x-based apple leaf disease classification framework.
In order to make sure that the integrity of the entire evaluation process remains high, the Split-First approach has been followed in a meticulous and thorough manner. In the case of the training process, dynamic and on-the-fly data augmentation was indeed followed, but it was restricted to the training split only. In the case of validation and test splits, it was ensured that they remain completely unbiased and do not have any augmentation related to geometry or intensity.
2.3. Experimental Setup and Model Architecture
All computational experiments were conducted using Google Colab Pro+ (Google LLC, Mountain View, CA, USA), which provides a cloud-based high-performance computing environment. The platform was equipped with an NVIDIA A100-SXM4 GPU (NVIDIA Corporation, Santa Clara, CA, USA) with 80 GB of GPU memory. The computational environment was configured using PyTorch v2.1.0 (Meta AI, Menlo Park, CA, USA) together with the Ultralytics YOLOv11 library (Ultralytics LLC, Houston, TX, USA) [17].
For this research, the authors chose the YOLOv11x (Extra Large) classification architecture as the basic approach because of its outstanding ability to extract features. The YOLOv11x architecture has a deeper structure than previous models, with an optimized feature pyramid network, which overall improves the capacity of the YOLOv11x architecture to identify small pathological features with high precision. To ensure a reliable comparison, the research used three established models of convolutional neural network architecture, namely ResNet-152, DenseNet-201, and EfficientNet-B1, for an accurate experiment.
In order to ensure statistical validity and perfect reproducibility of the experiments, the same random number seed of 42 was used for all random elements, such as the initialization of the weights and the splitting of the data. The last model checkpoint was chosen based on the highest accuracy on the validation set during the training phase to avoid overfitting.
The hyperparameters used in the training are described in Table 3. In particular, the learning was performed with the use of the stochastic gradient descent algorithm, with a learning rate fixed at 0.01, along with a momentum factor of 0.9. To conduct a fair evaluation on different models, a uniform image size of 224 × 224 pixels was used. The description of the training environment used in this research is provided in the following table. The maximum number of training epochs was set to 100 for all the models. Early stopping based on validation performance was applied, and convergence was typically achieved within 25–40 epochs. The best-performing checkpoint was selected according to validation accuracy.
Table 3.
Summary of the training configuration, hardware environment, and hyperparameters.
Even though the deployment at the edge is the final objective, the need to properly evaluate the suggested data balancing framework with the YOLOv11x architecture, which does not suffer from bottlenecks, led to the prioritization of this architecture in this study. By choosing the high-capacity architecture, we intended to separate the limit of the architecture from the quality of the data, thus setting a strong theoretical bound for the classification task. Moreover, since the AppleLeaf9 dataset did not provide the required annotations for the detection architectures, such as RT-DETR, this study only considered the classification tasks.
In the classification problem, the default detection head of the YOLOv11x model was swapped for a classification-specific head. The classification head used a Global Average Pooling layer for aggregating the spatial information, followed by a fully connected linear layer with a Softmax activation function for the generation of probabilities for different classes. The network was trained fully, and the backbone networks were allowed to adapt to the fine-grained properties of the AppleLeaf9 dataset.
2.4. Mathematical Background of the Classification Models
YOLOv11x employs a multi-scale feature extraction through a feature pyramid network (FPN) for extracting low-level texture information and high-level semantic information [18]. Given a set of feature maps extracted at different backbone stages , the pyramid representation is constructed as
is the pyramid feature at level l, is the lateral convolution, while is the upsampling function. This facilitates the spread of information from deeper levels to shallower levels, promoting the detection of subtle patterns of diseases [19].
To improve gradient flow and reduce computational redundancy, YOLOv11x integrates Cross-Stage Partial (CSP) connections. Let the input feature map be denoted as X, which is partitioned into two subsets: X = [X1,X2].
One subset is transformed using the convolutional layer , while the other remains unchanged; both are then concatenated. The outputs are then concatenated:
This method has a number of advantages; it will maintain the original characteristics, gradients can continue to smoothly flow through the network, and it will also have a regularization effect on the training by requiring the model to learn discriminative features from imbalanced datasets.
Traditionally, the YOLO models have prediction branches for bounding boxes, objectness scores, and class probabilities. In this work, all the prediction branches for object detection have been removed, making it a pure classification model. The aggregate representation of all features, represented as z, can be obtained by using global pooling on the final pyramid layer.
where denotes Global Average Pooling. The classification output is then computed using a Softmax-based decision layer:
where corresponds to the number of apple leaf disease categories. The predicted class label is given by
The main focus of the FPN-based network is feature fusion at various scales and the use of CSP connections for the efficient reuse of features. Such design strategies help YOLOv11x learn highly discriminative features. Consequently, YOLOv11x has the capability to distinguish well between visually similar classes of diseases, resulting in high confidence levels and high AUC values. Since it is a multiclass problem, precision, recall, and F1-score scores have been calculated using the Weighted Average approach because different classes have different supports. The AUC (Area Under the Curve) score was calculated using the Macro Average approach in the One-vs-Rest (OvR) method.
3. Results
In this section, an in-depth discussion on the proposed YOLOv11x is provided. The evaluation of the YOLOv11x was performed by comparing it with other prominent convolutional neural networks, namely EfficientNet-B1, DenseNet-201, and ResNet-152. The evaluation was performed on various aspects, including the performance comparison of the models, the confusion matrix of each class, and the ROC curve plot for the models. Moreover, the discussion is complemented by the visual representation of the impact of the training time on the performance of the models.
3.1. Comparative Performance Analysis
The quantitative results of the models’ performance, as measured by the test set, are shown in Table 4. The performance of the evaluated models shows that all models have highly competitive performance in all evaluation criteria. In the optimal configuration of the models (V1, V2, and V3), the proposed YOLOv11x model had the highest classification accuracy of 99.18%, as well as the highest Macro AUC value of 0.9997.
Table 4.
Performance comparison of deep learning models under their best-performing configurations (V1/V2/V3).
Other models, like the CNN-based models EfficientNet-B1, DenseNet-201, and ResNet-152, also had competitive performance with accuracy values higher than 97%. However, the proposed YOLOv11x had the best trade-off between accuracy, precision, recall, and AUC values.
The optimal configuration of the models used in the experiment was determined by the ablation study shown in Table 8.
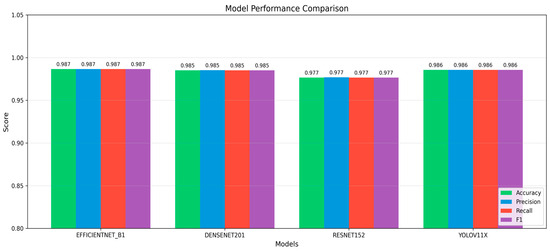
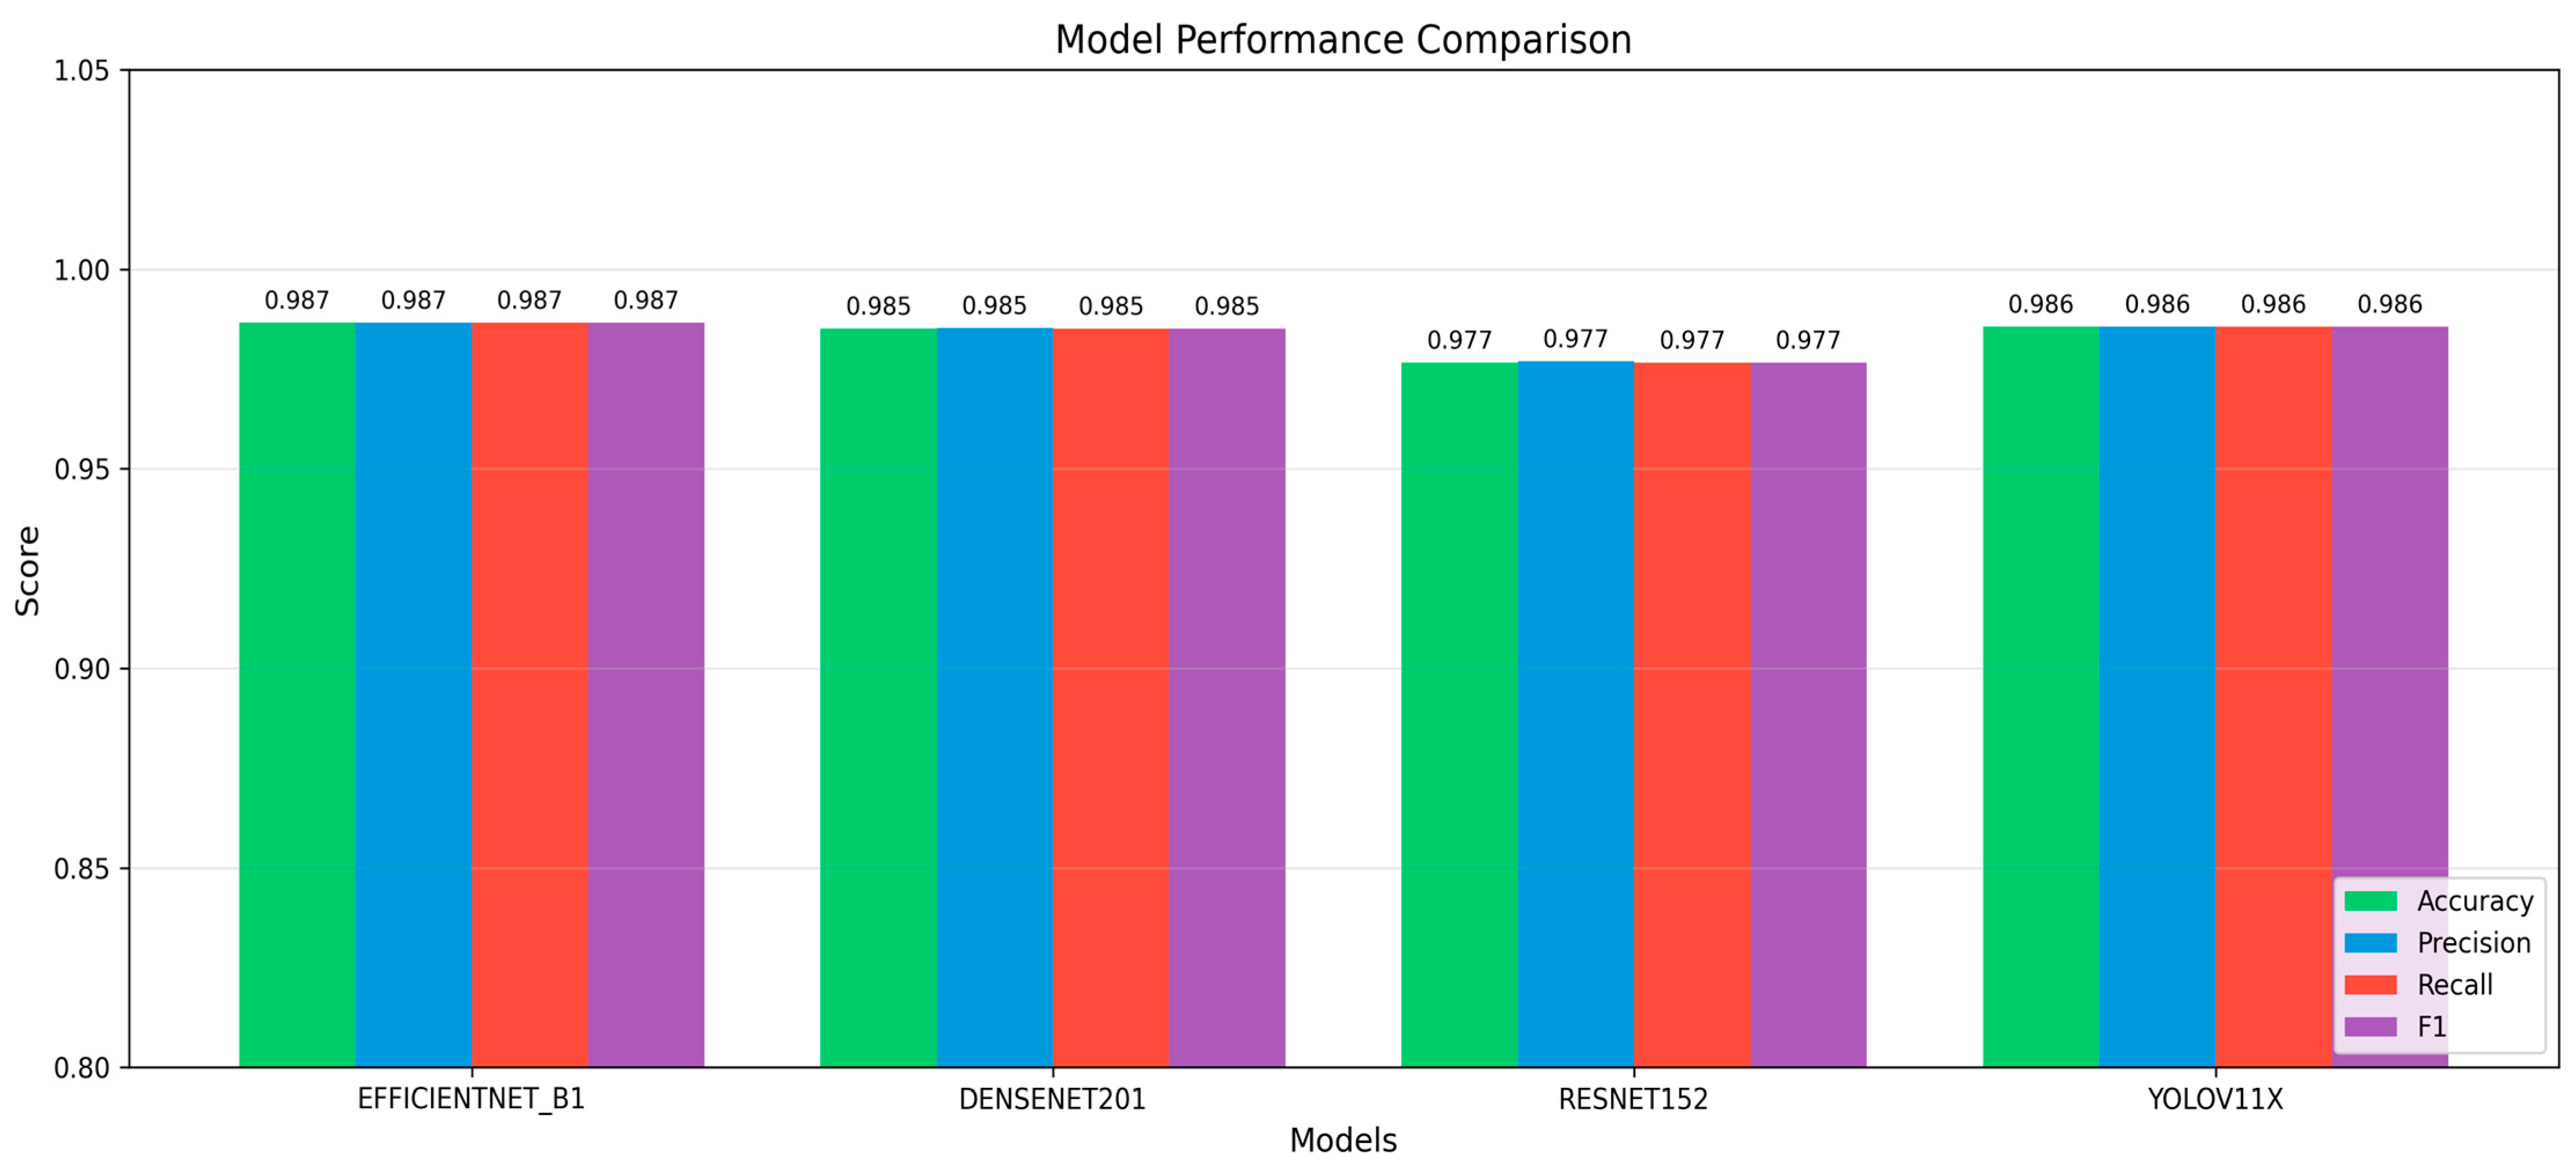
Figure 3 highlights a comprehensive comparison of the performance of the various deep learning models used for classifying the data based on four significant metrics: accuracy, precision, recall, and F1-score. In all the cases, the models were performing extremely well, with all the values resting comfortably above 97 percent. This means that the models were learning discriminative features for all the disease categories considered in this work.
Figure 3.
Accuracy, precision, recall, and F1-score comparison for the evaluated models.
Among all the models used, EfficientNet-B1 excelled by securing the highest accuracy and F1 score. This shows, without a doubt, that EfficientNet-B1 holds great potential for different classification tasks, as it excelled in all the experiments carried out. The proposed YOLOv11x model exhibited competitive performance in all the evaluation criteria. It performed extremely well in all areas, matching the performance of the best model in several areas, and at the same time, it had a good balance of precision and recall, thereby indicating its effectiveness without compromising one performance metric for the other.
DenseNet-201 also exhibited performance comparable to the best models, indicating its great performance in this regard. On the other hand, the performance of the Res-Net-152 model was not as great, especially when the performance evaluation criteria were accuracy-based, as its performance in these areas was lower compared to the best models.
The performance metrics of the proposed YOLOv11x model on a per-class basis, including precision, recall, F1-score, and support, for the nine classes of the apple leaf disease are presented in Table 5. Performance metrics provide a detailed insight into the performance of the model on each disease. Based on the findings, it can be observed that in all the classes, YOLOv11x maintained a high level of performance, with precision, recall, and F1-score exceeding 0.95 in most cases. Classes like Brown Spot, Health, and Mosaic received a perfect or almost perfect score, with precision and recall being 1.0000, which means that the reliability of the model in detecting and predicting examples belonging to that category of diseases is excellent. In more difficult classes, such as Grey Spot and Alternaria Leaf Spot, the model performed well with F1-scores of 0.9531 and 0.9624, respectively. The slight decrease in performance can be ascribed to the fact that there exist strong similarities between images belonging to different classes, and increased intra-class variability in real-world environments. Nonetheless, these scores indicate that the proposed method has alleviated the problem of imbalance between classes.
Table 5.
Class-wise performance indicators of the proposed YOLOv11x model.
The weighted average metrics for the entire dataset show that the values for precision, recall, and F1-score were 0.9856, computed based on class support. This implies that the model does not show any bias towards the majority class, as it is consistent across different disease classes. This is further supported by the varying values in the Support column, which range from 84 to 1082.
Results with Respect to Research Questions
In the case of RQ1, which focuses on the effect of varying data distribution strategies on minority class performance, Table 5 clearly indicates that minority classes performed well with high F1-scores using the balanced data distribution approach (V1). For instance, the performance of the Grey Spot class, which had the least number of samples (339) in the original data distribution, resulted in an F1-score of 96.20%. All the minority classes resulted in F1-scores above 95%. However, the ablation study results show that the balanced approach (V1) did not result in the best overall accuracy compared to the physical augmentation approach (V3), which achieved the highest performance. This could be due to the effect of feature diversity enhancement being more significant than resampling-based balancing.
In the case of RQ2, which compares the classification performance of the YOLOv11x and traditional CNN models, the results clearly show that the YOLOv11x model had strong discrimination ability, especially between visually similar classes of diseases. For instance, in the case of the Rust and Scab classes, which are challenging to classify correctly, the YOLOv11x model resulted in only one misclassification (1%) compared to eight (5%) and seven (4%) misclassifications by the ResNet-152 and DenseNet-201 models, respectively. The degradation sensitivity analysis on the models was done using the CNN baseline models and Gaussian noise and motion blur; therefore, the results are compared to the standard classification performance evaluation.
In the case of RQ3, which compares the ability to balance global accuracy with fine-grained sensitivity, the YOLOv11x model resulted in high overall accuracy (99.18%) while at the same time maintaining high minority class performance with an F1-score of 96.20% on the Grey Spot class. This clearly indicates that the model maintains fine-grained discrimination ability without compromising overall performance.
3.2. Class-Wise Classification Performance
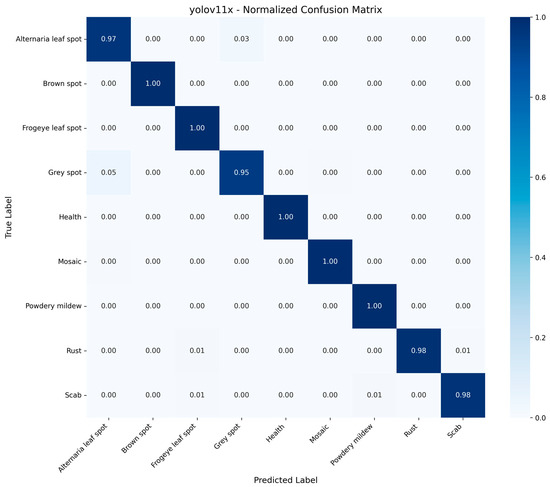
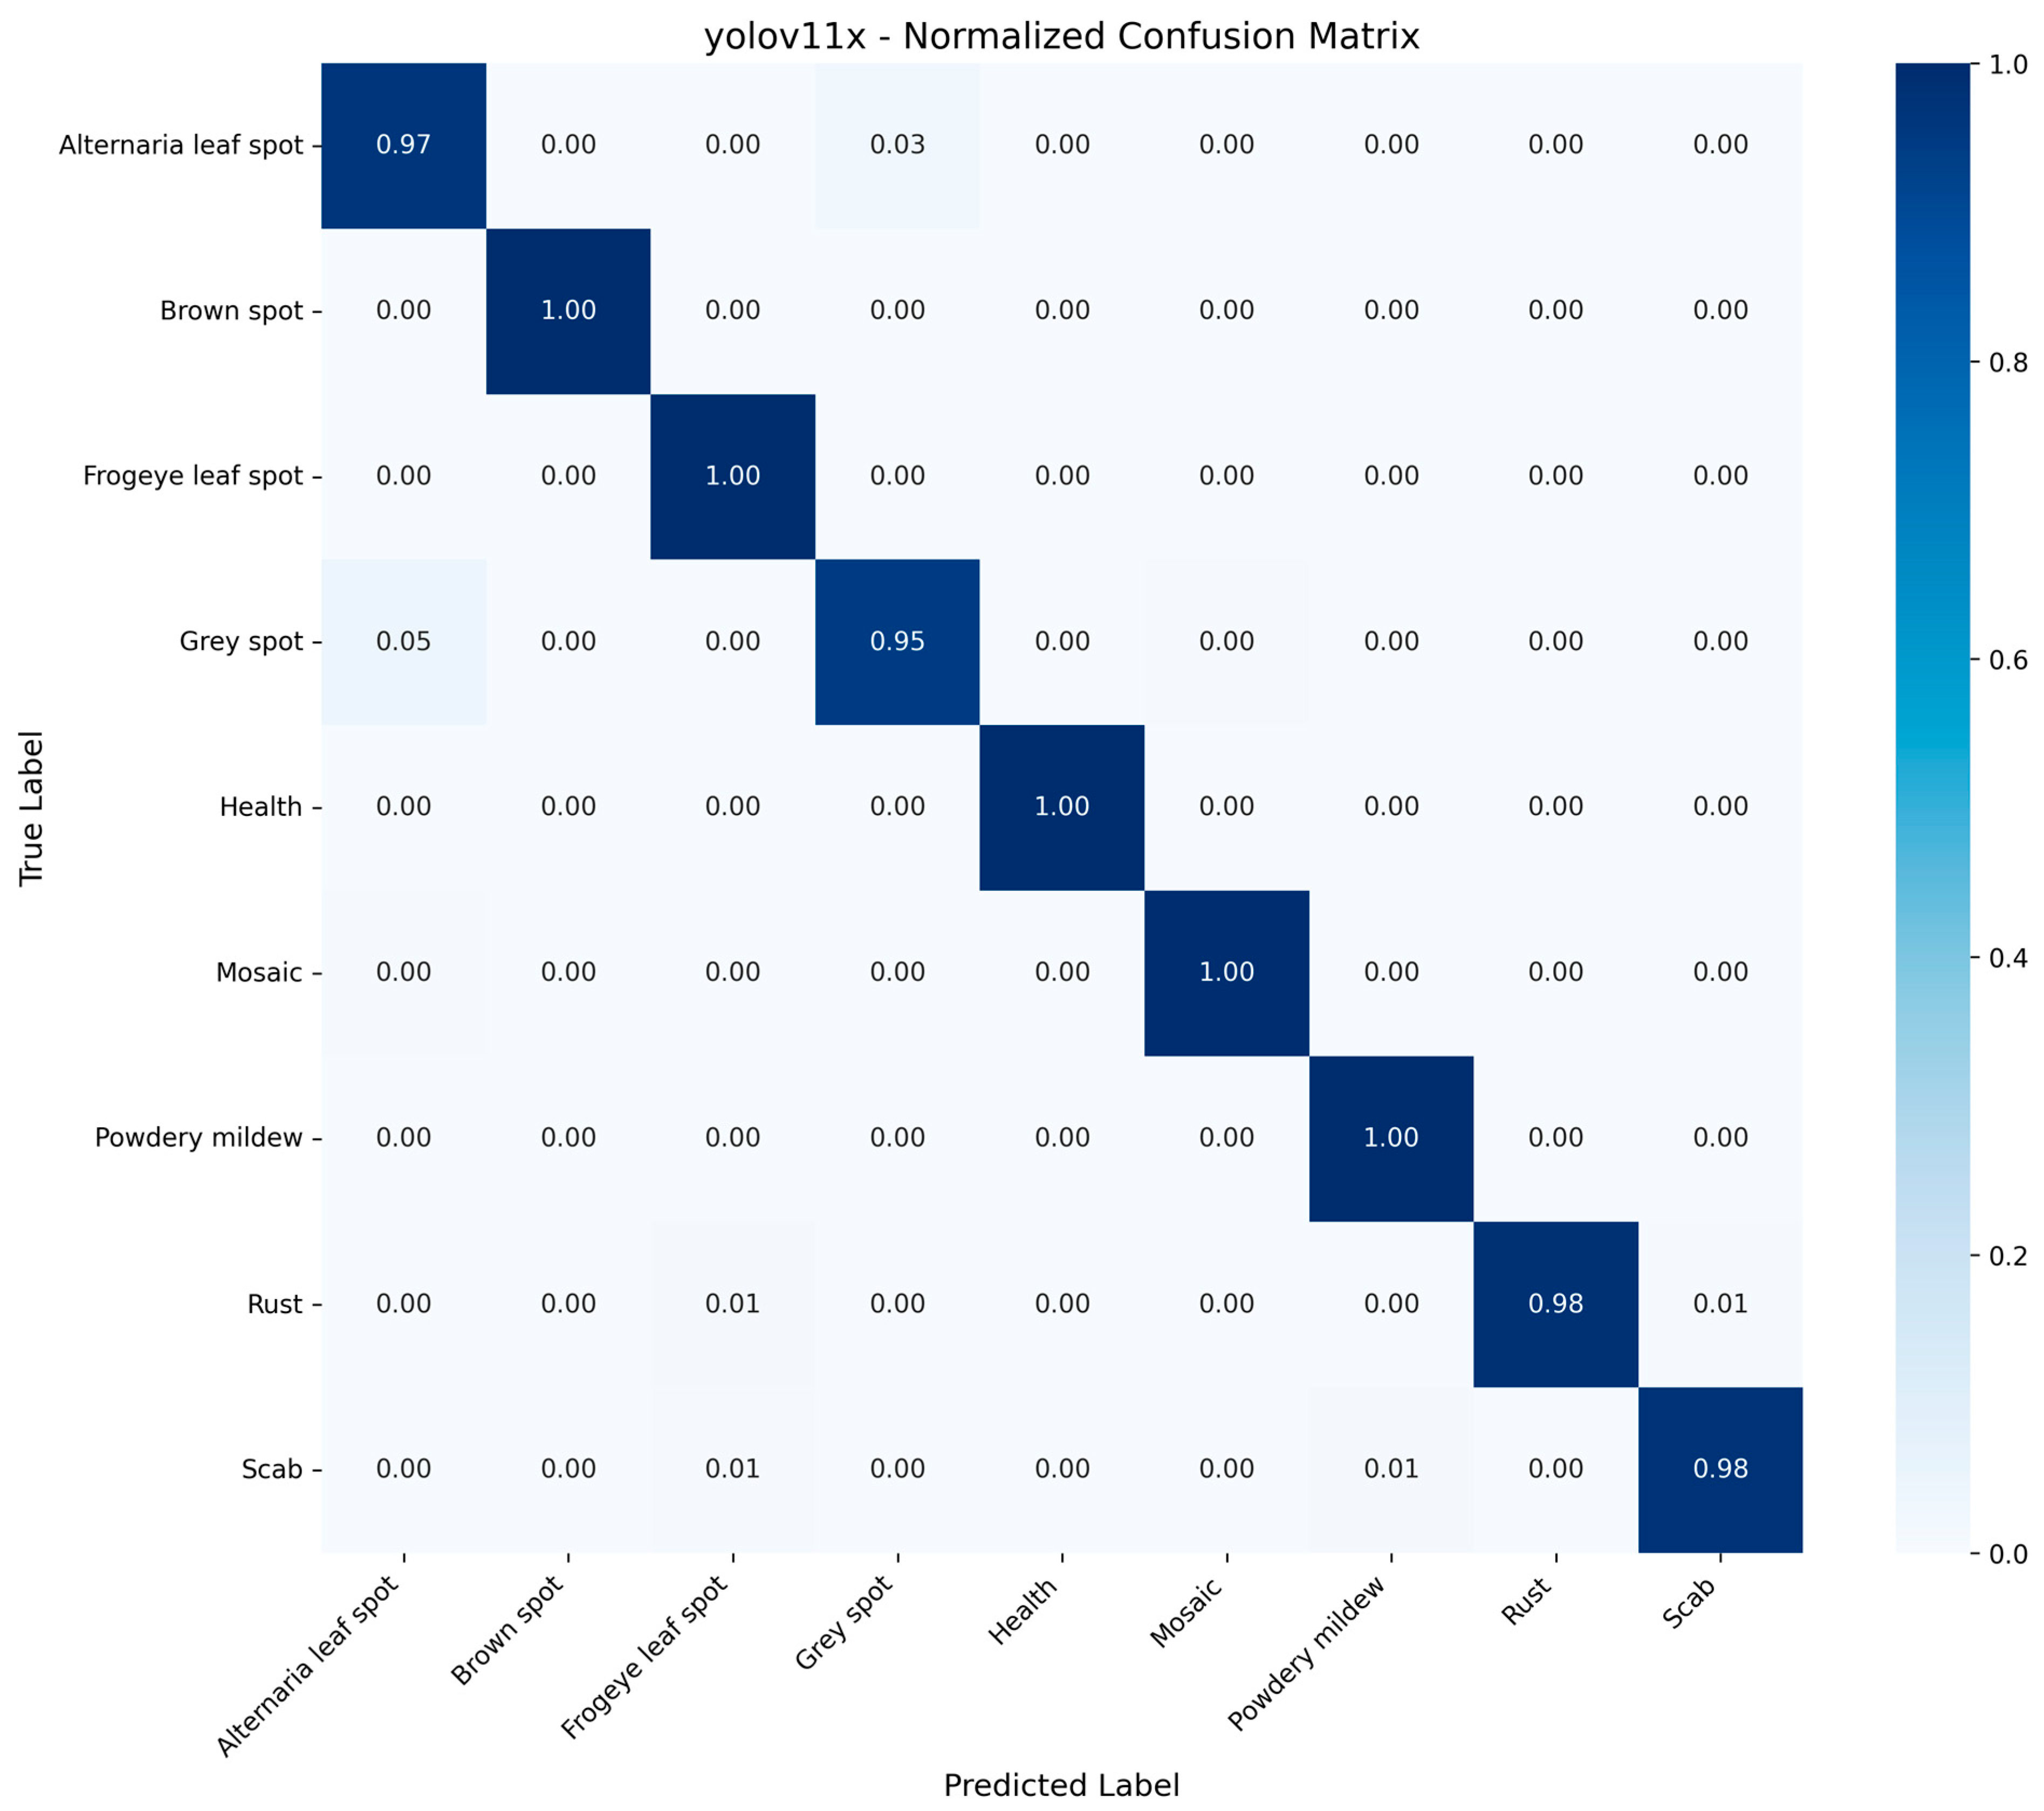
A detailed analysis was carried out class by class to check the effectiveness of the proposed technique in identifying objects of different classes using the YOLOv11x model. The analysis was carried out by using the confusion matrix, as presented in Figure 4. As per the results presented above, it is clear that the proposed technique is capable of yielding an exceptionally high degree of precision in identifying objects of different classes. The proposed technique is particularly effective when dealing with those classes that have objects with heavy texture on the surface. Now, if we consider the minority classes of the dataset used in the study, the Grey Spot class is the most dominant among all the minority classes. Although the Grey Spot class is a part of the original dataset used in the study and only accounts for a small percentage of the overall dataset, the F1-score recorded is remarkably high at 96.20%. Among all the classes used in the study, the Mosaic class is another important class that recorded a perfect precision rate of 100%. When considering the reliability of the classes used in the study based on the normalized confusion matrix, the diagonal values dominate the matrix. This is a clear indication that the model used in the study is not biased towards the majority class.
Figure 4.
Normalized confusion matrix of the proposed YOLOv11x model for apple leaf disease classification, illustrating class-wise prediction performance and inter-class confusion patterns.
However, a more in-depth analysis of the results shows that the residual misclassifications exist between very similar and consecutive classes, such as Alternaria: Early and Brown Spot, where the symptoms of the two diseases are almost indistinguishable. The values in the off-diagonal position remain very low, which implies that the classes are well separated, and the features used by the YOLOv11x algorithm, based on the deep hierarchical representation, are effective. The difference between the majority and minority classes is negligible, which implies a strong reduction in gradient bias achieved by the proposed hybrid imbalance framework. The true positive rate of the two classes is almost uniform.
3.3. Performance Under Class Imbalance and Training Stability
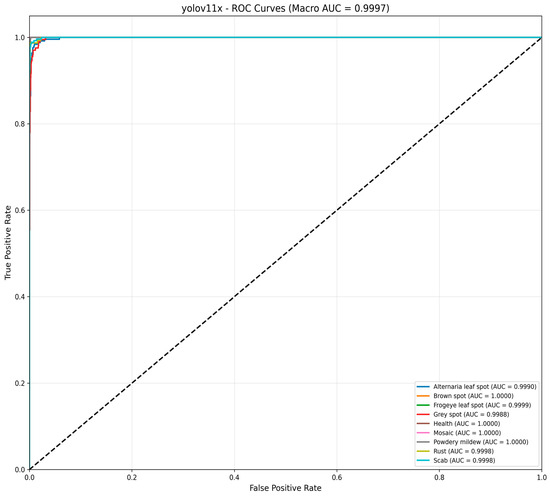
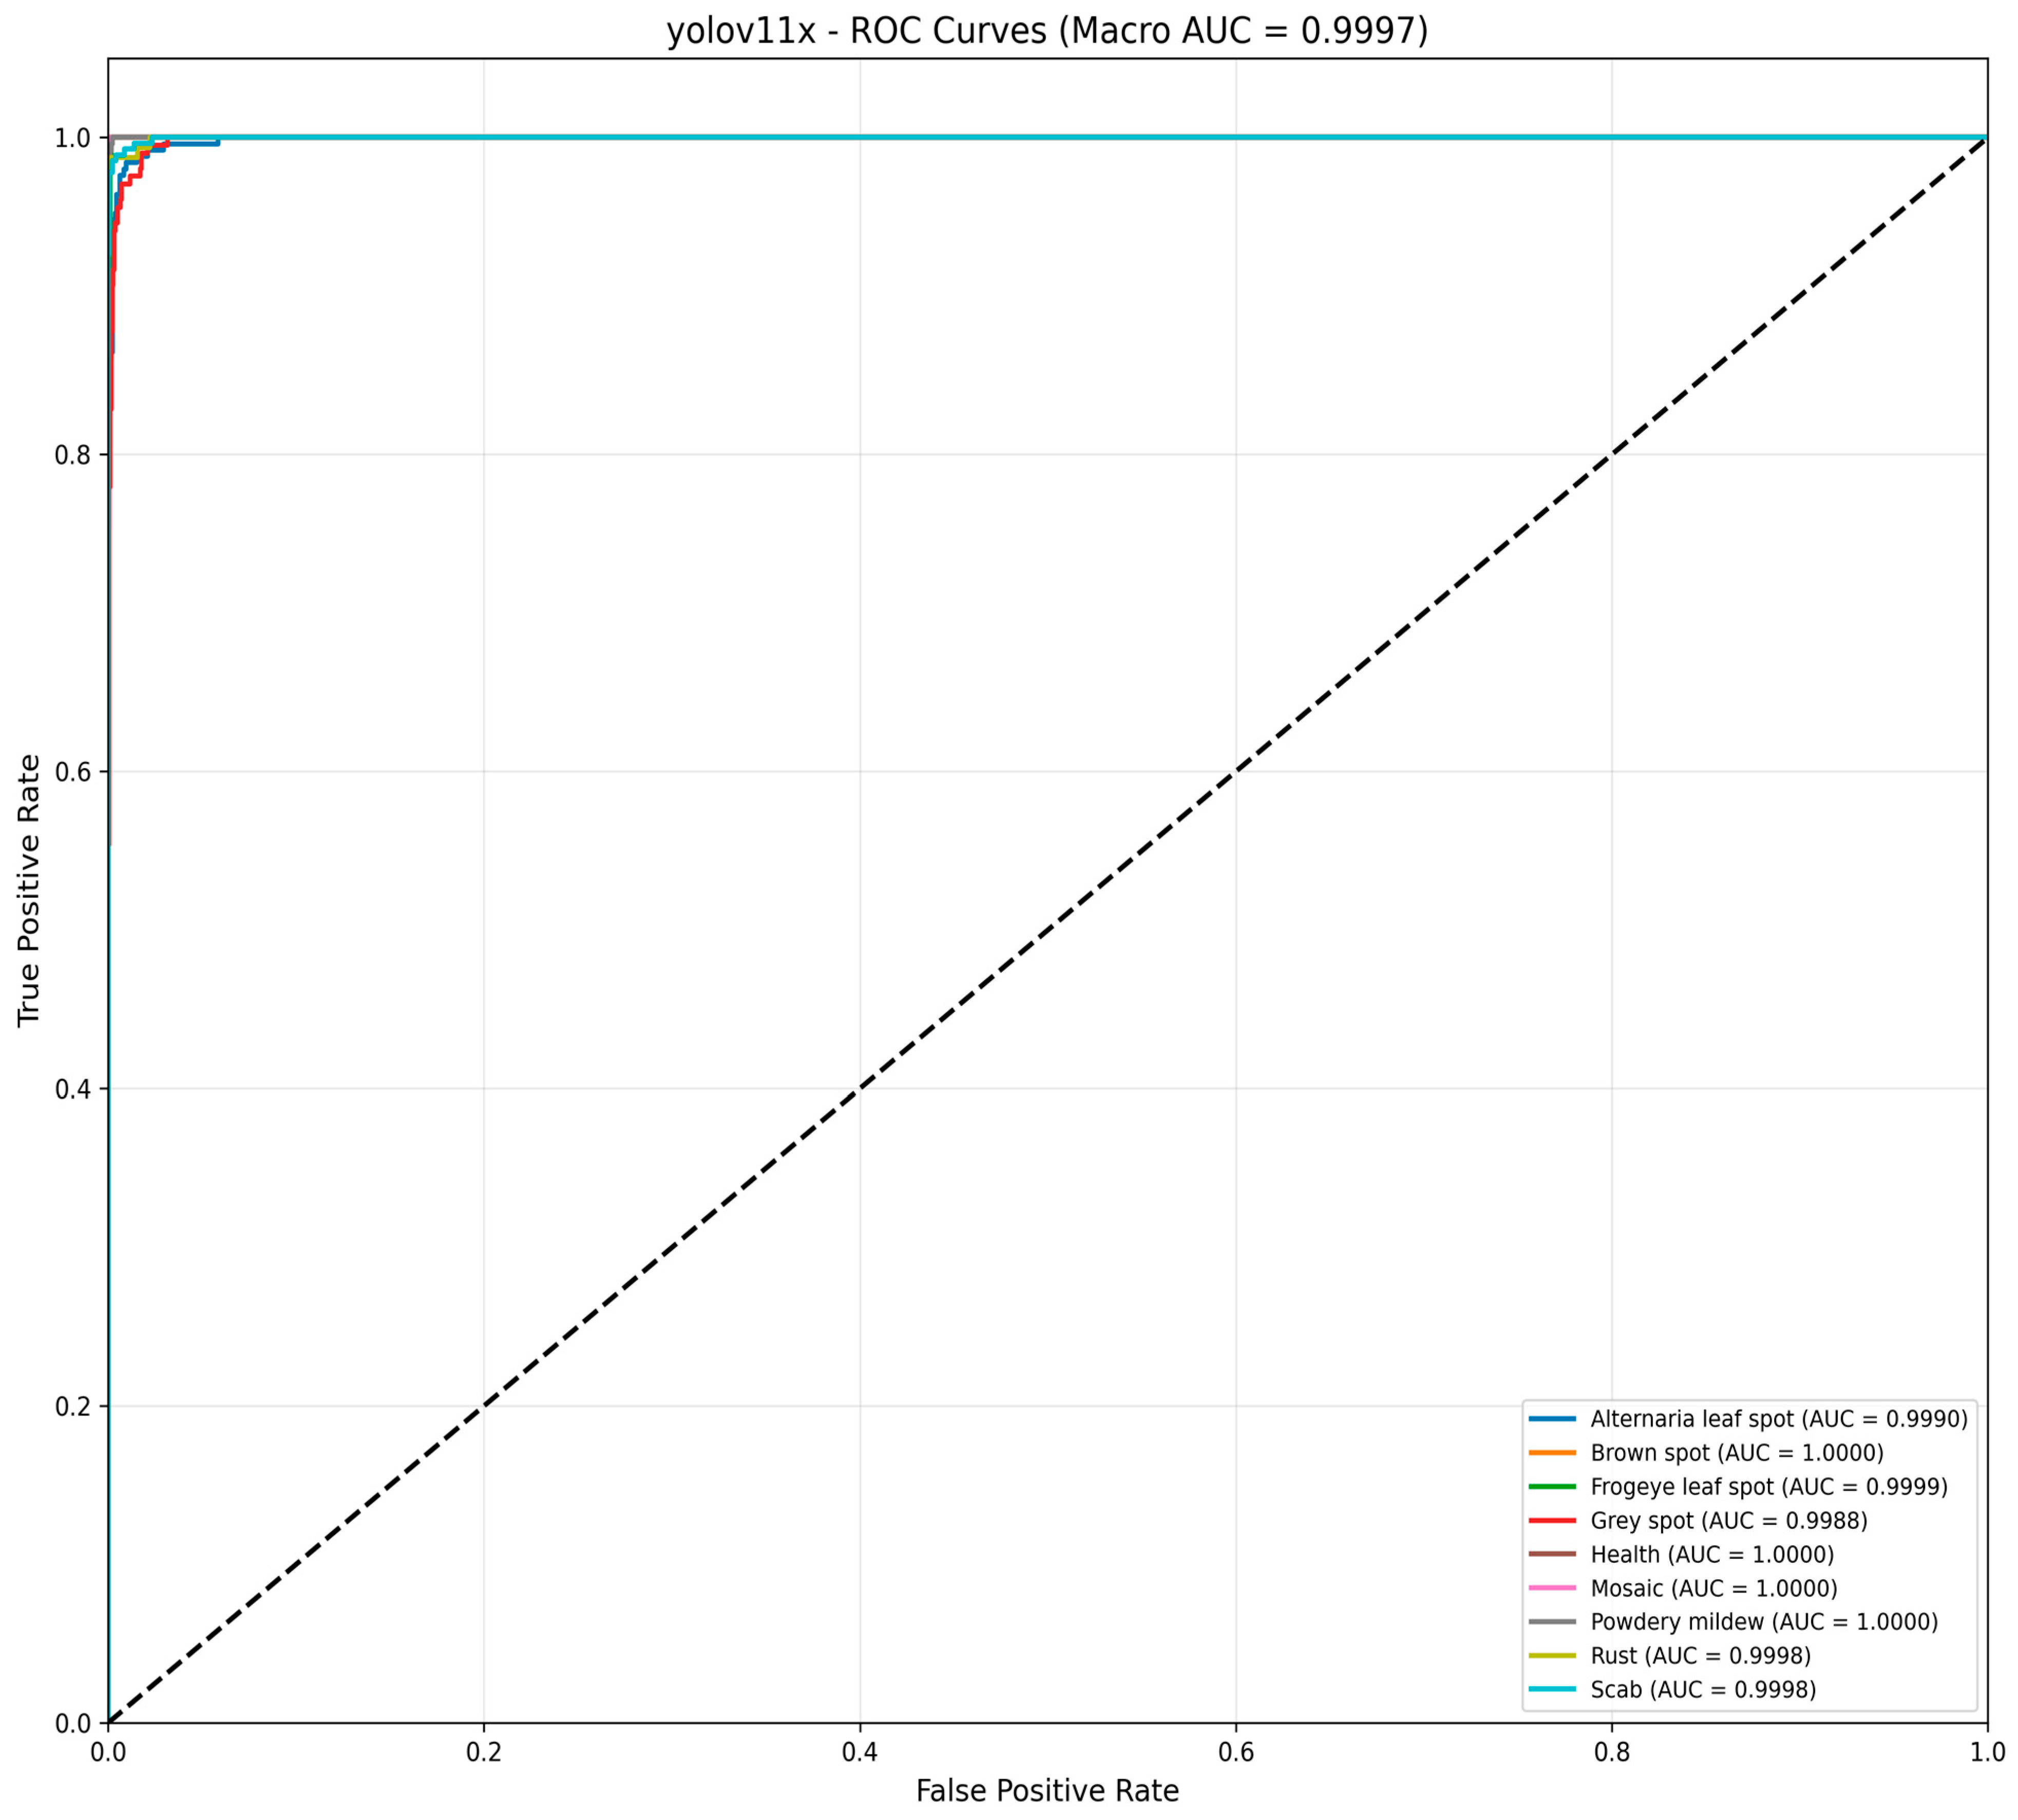
As part of the initial evaluation of the performance of the model in the presence of class imbalance, the researchers selected the Receiver Operating Characteristic (ROC) curve as the primary evaluation metric for the overall performance of the model. Out of all the models tested, YOLOv11x emerged as the model with a significant performance advantage over the others. Specifically, the YOLOv11x model was able to achieve an average Area Under the Curve (AUC) of 0.9997 for all the classes, as illustrated in Figure 5. This is indicative of the improved discriminative performance of the model compared to the others.
Figure 5.
ROC curves and AUC values of the YOLOv11x model for apple leaf disease classification. The dashed diagonal line represents the performance of a random classifier (chance level).
In order for us to have a fair and equitable comparison of the results of the three different experiment setups (V1, V2, and V3), we ensured that all the hyperparameters and training conditions were the same across all the experiment setups. This means that we used the same optimizer, the same learning rate, the same batch size, the same learning rate scheduler, the same weight decay, and the same maximum number of epochs, with the maximum set at 100, with the use of early stopping enabled. We also ensured that we have the same input resolution and the same data split of 80/20 with stratification enabled.
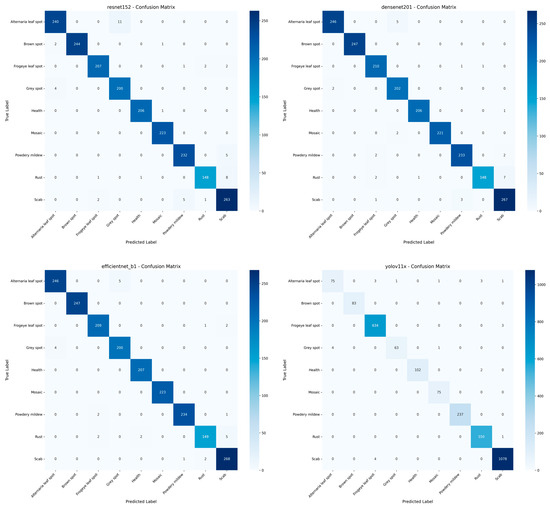
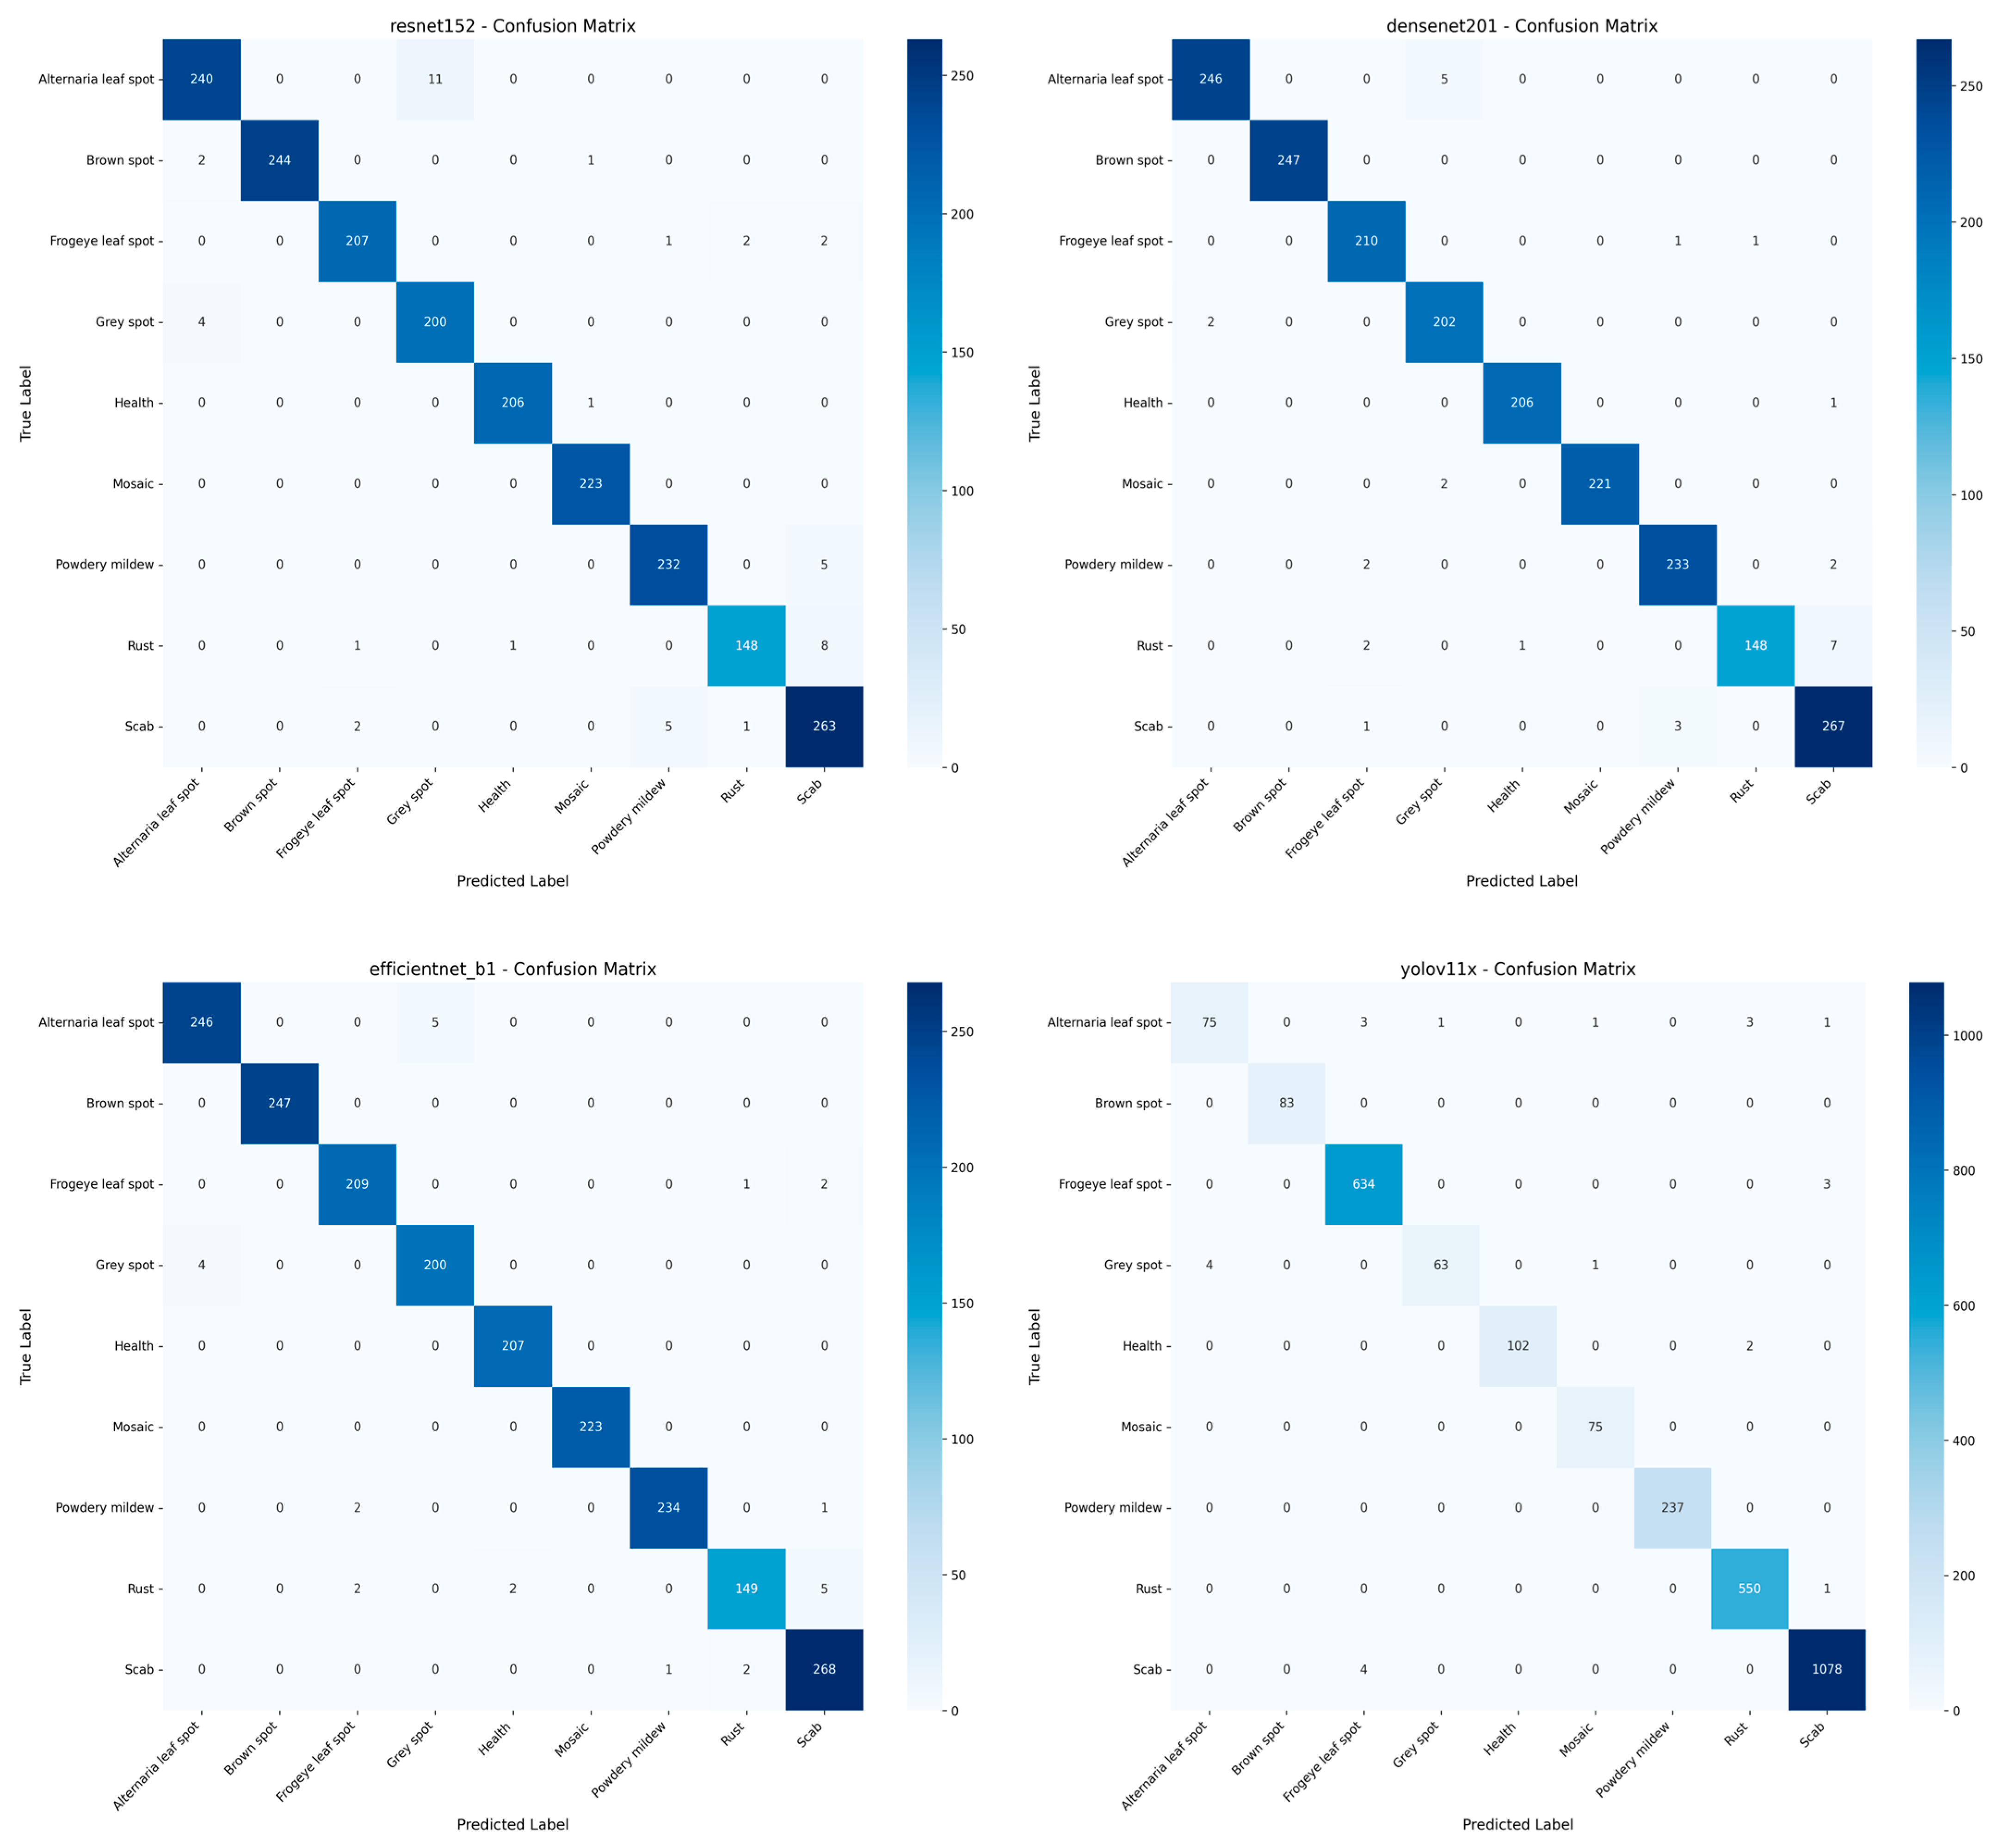
For qualitative evaluation, we present the class-wise confusion matrices for the benchmark models, as illustrated in Figure 6. These matrices, unlike the overall accuracy measure, reveal the systematic mistakes made by the models for each pair of classes, which is indicative of the models’ ability to generalize beyond the most frequent class. Leaf disease classification is one of the quintessential examples of fine-grained classification. In the context of leaf disease classification, the classes “Rust” and “Scab” are characterized by similar color and texture of the lesions. Consequently, these classes are subject to systematic mistakes by the models, especially the conventional CNN models.
Figure 6.
Confusion matrices of the benchmark models.
For instance, the ResNet-152 model classified eight samples belonging to the “Rust” class as “Scab,” while the DenseNet-201 model classified seven samples belonging to the “Rust” class as “Scab.” On the other hand, the YOLOv11x model classified only one sample belonging to the “Rust” class as “Scab,” indicating a significant improvement in the model’s ability to differentiate the discriminative textures of the lesions. These observations were validated by the class-wise recall values for the models, which revealed the YOLOv11x model’s superior ability to differentiate fine-grained classes compared to the other benchmark models.
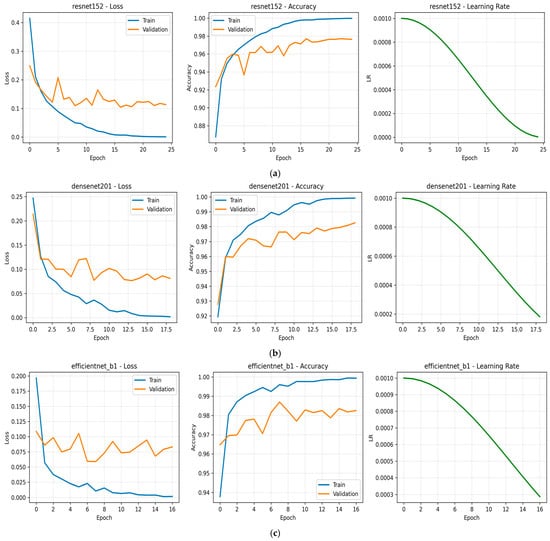
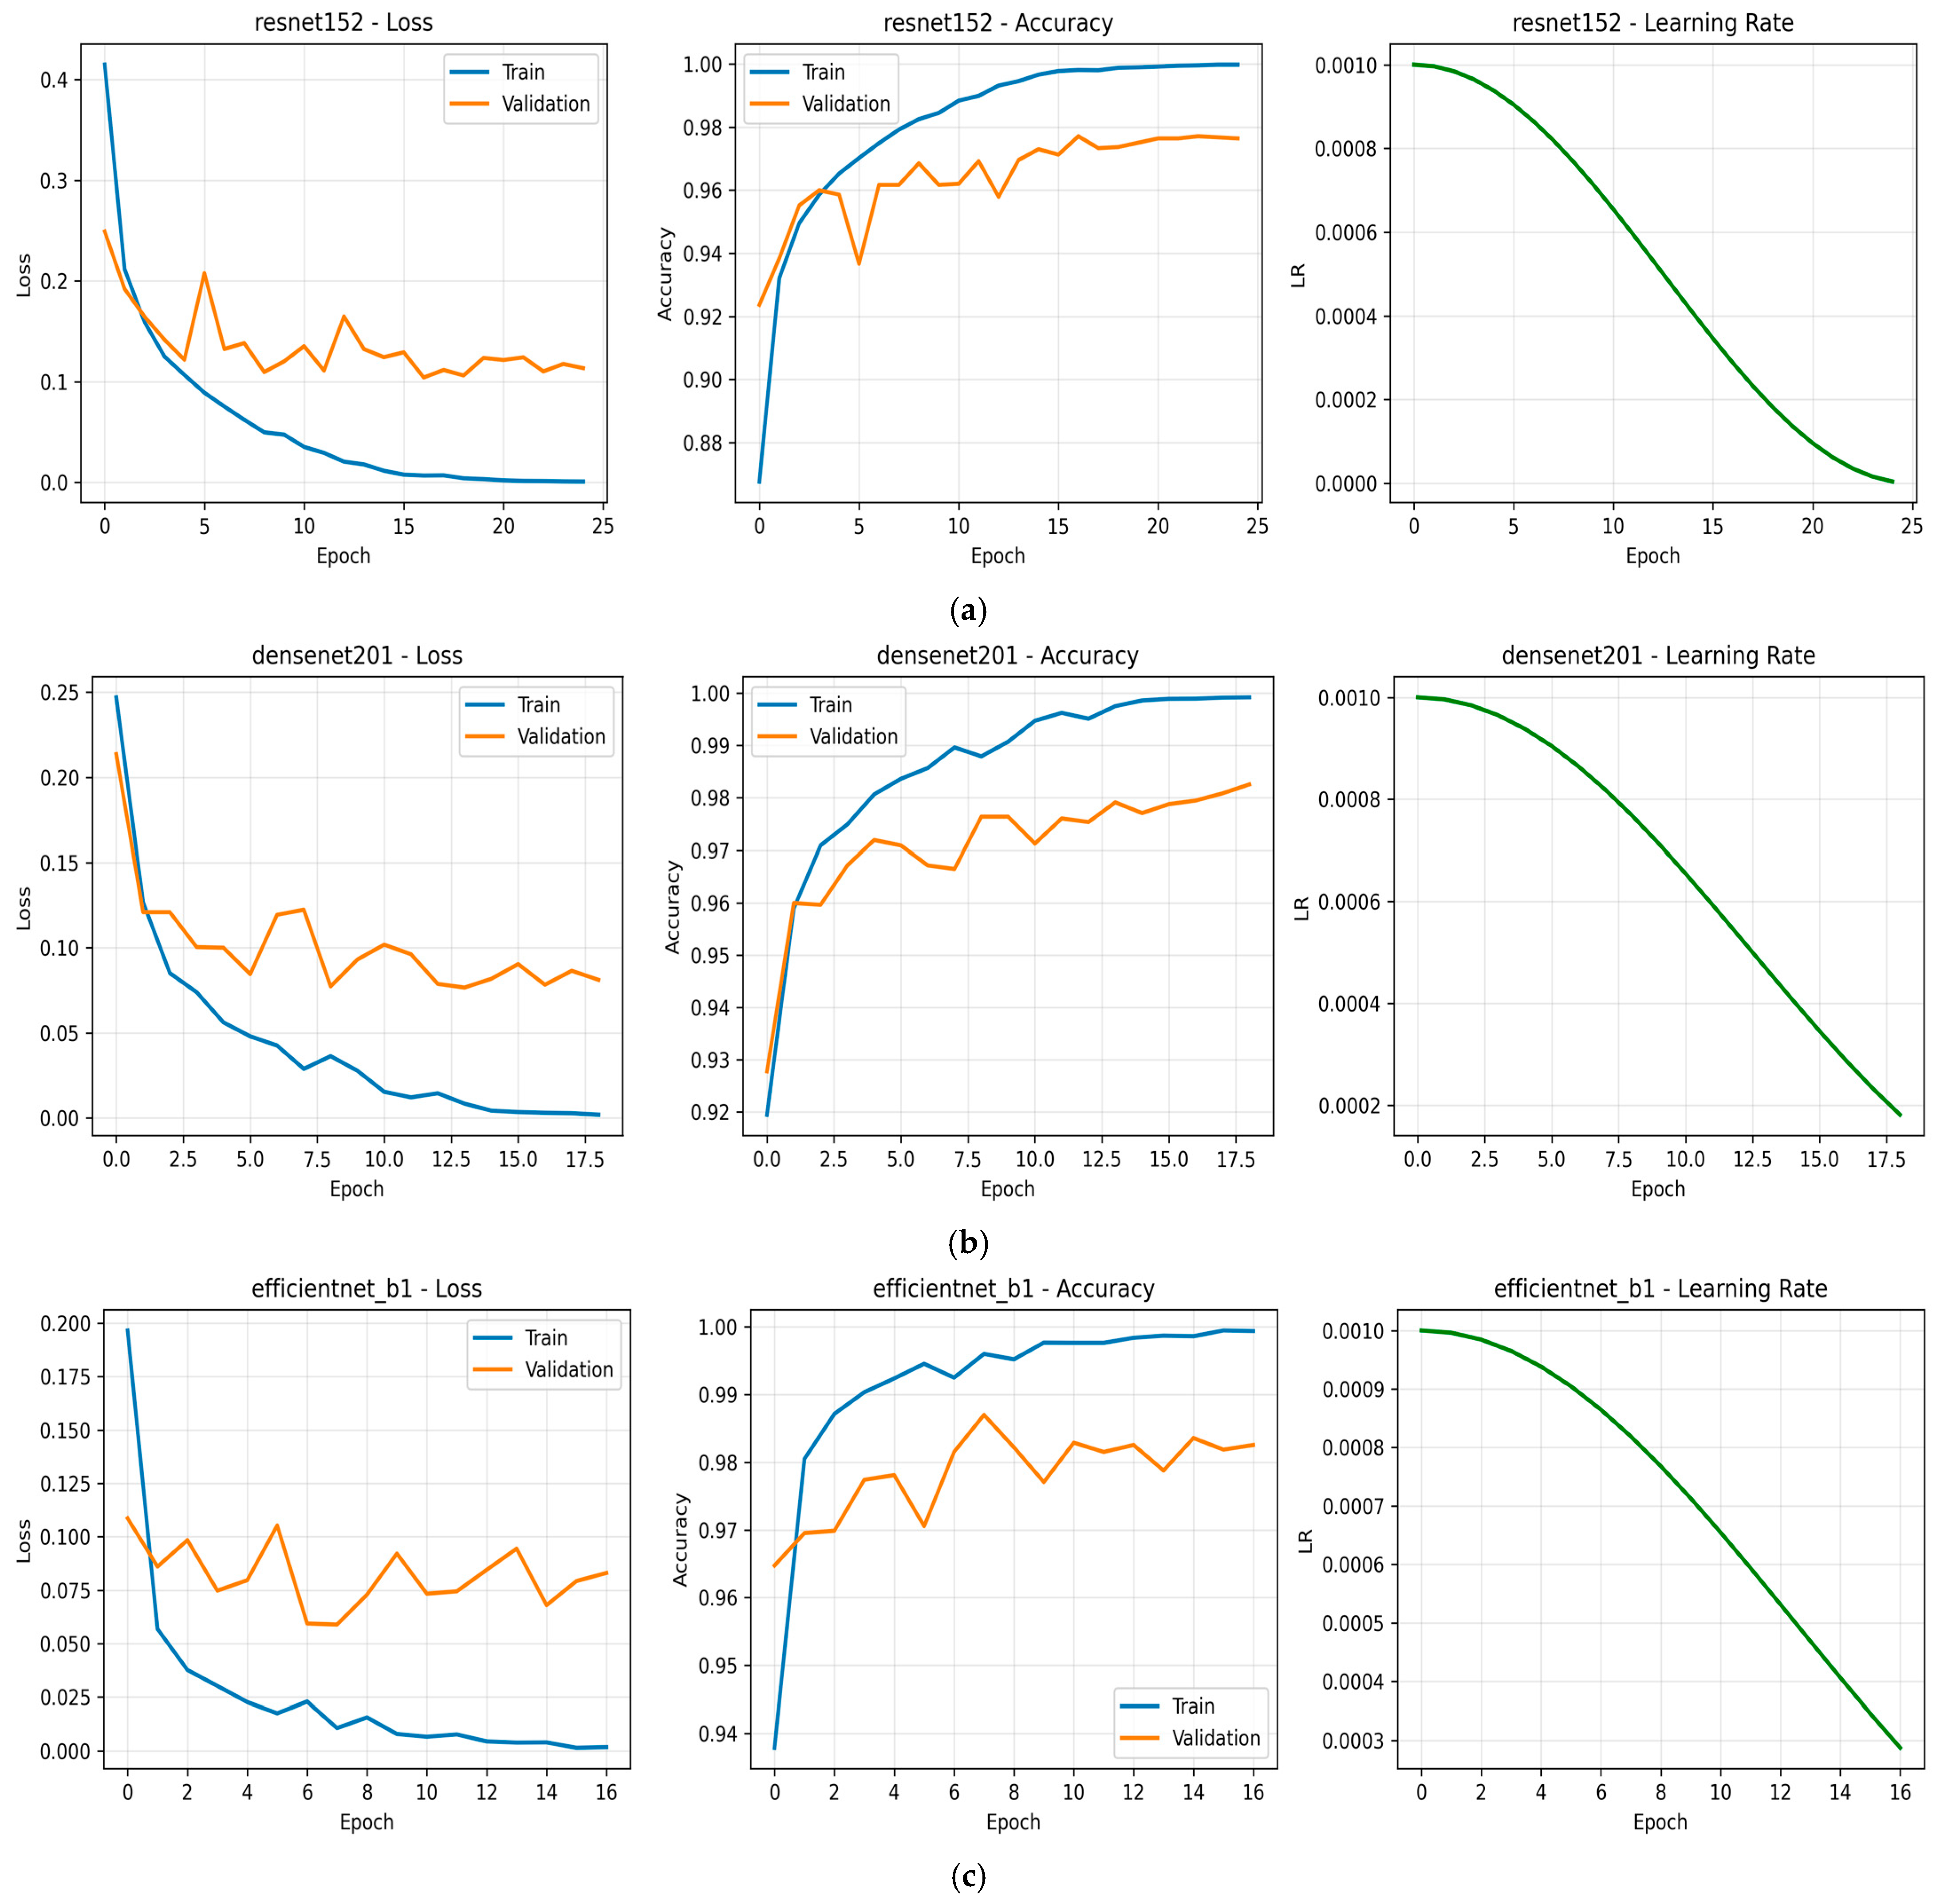
The optimization dynamics for all the baseline CNN models show a stable convergence behavior with respect to the training epochs. This is indicated by a monotonically decreasing nature of the training loss, as depicted in Figure 7 for ResNet-152, DenseNet-201, and EfficientNet-B1, which indicates effective minimization of the objective function for these CNN models. Simultaneously, the validation loss is also bounded without a visible increasing trend, which indicates a lack of significant overfitting for these CNN models. About accuracy, it is observed from the plots that there is a rapid saturation of the training accuracy with steady improvement in validation accuracy, which indicates that improvement in training accuracy is also reflected in validation accuracy for these CNN models. The difference between training accuracy and validation accuracy is small, which does not increase with time, thus indicating appropriate use of regularization and data augmentation. Finally, from Figure 7, it is also observed that there is a gradual decrease in the learning rate with an increase in epochs, which indicates a shift from coarse optimization of parameters to finer optimization of parameters for these CNN models.
Figure 7.
Training dynamics of the CNN baseline models, illustrating training and validation loss, accuracy, and learning rate schedules for ResNet-152 (a), DenseNet-201 (b), and EfficientNet-B1 (c).
From the training dynamics, specific characteristics of convergence for different architectures are observed. The training loss of the ResNet-152 architecture converges quickly to near-zero values, whereas the validation loss converges at a higher level. This implies a larger generalization gap for this architecture. The training dynamics of the DenseNet-201 and EfficientNet-B1 architectures indicate smoother convergence characteristics with fewer differences in training and validation curves. The EfficientNet-B1 architecture reaches a stable validation curve at an early stage of training, which denotes efficient feature extraction and parameter usage. The gradual decrease in the learning rate helps stabilize the training dynamics in the later stages, resulting in fewer oscillations.
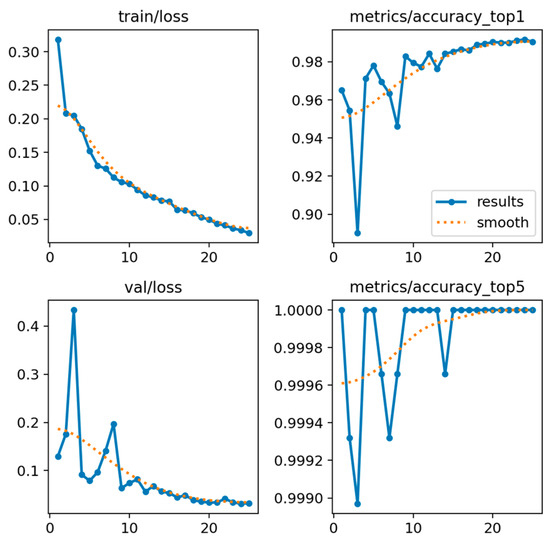
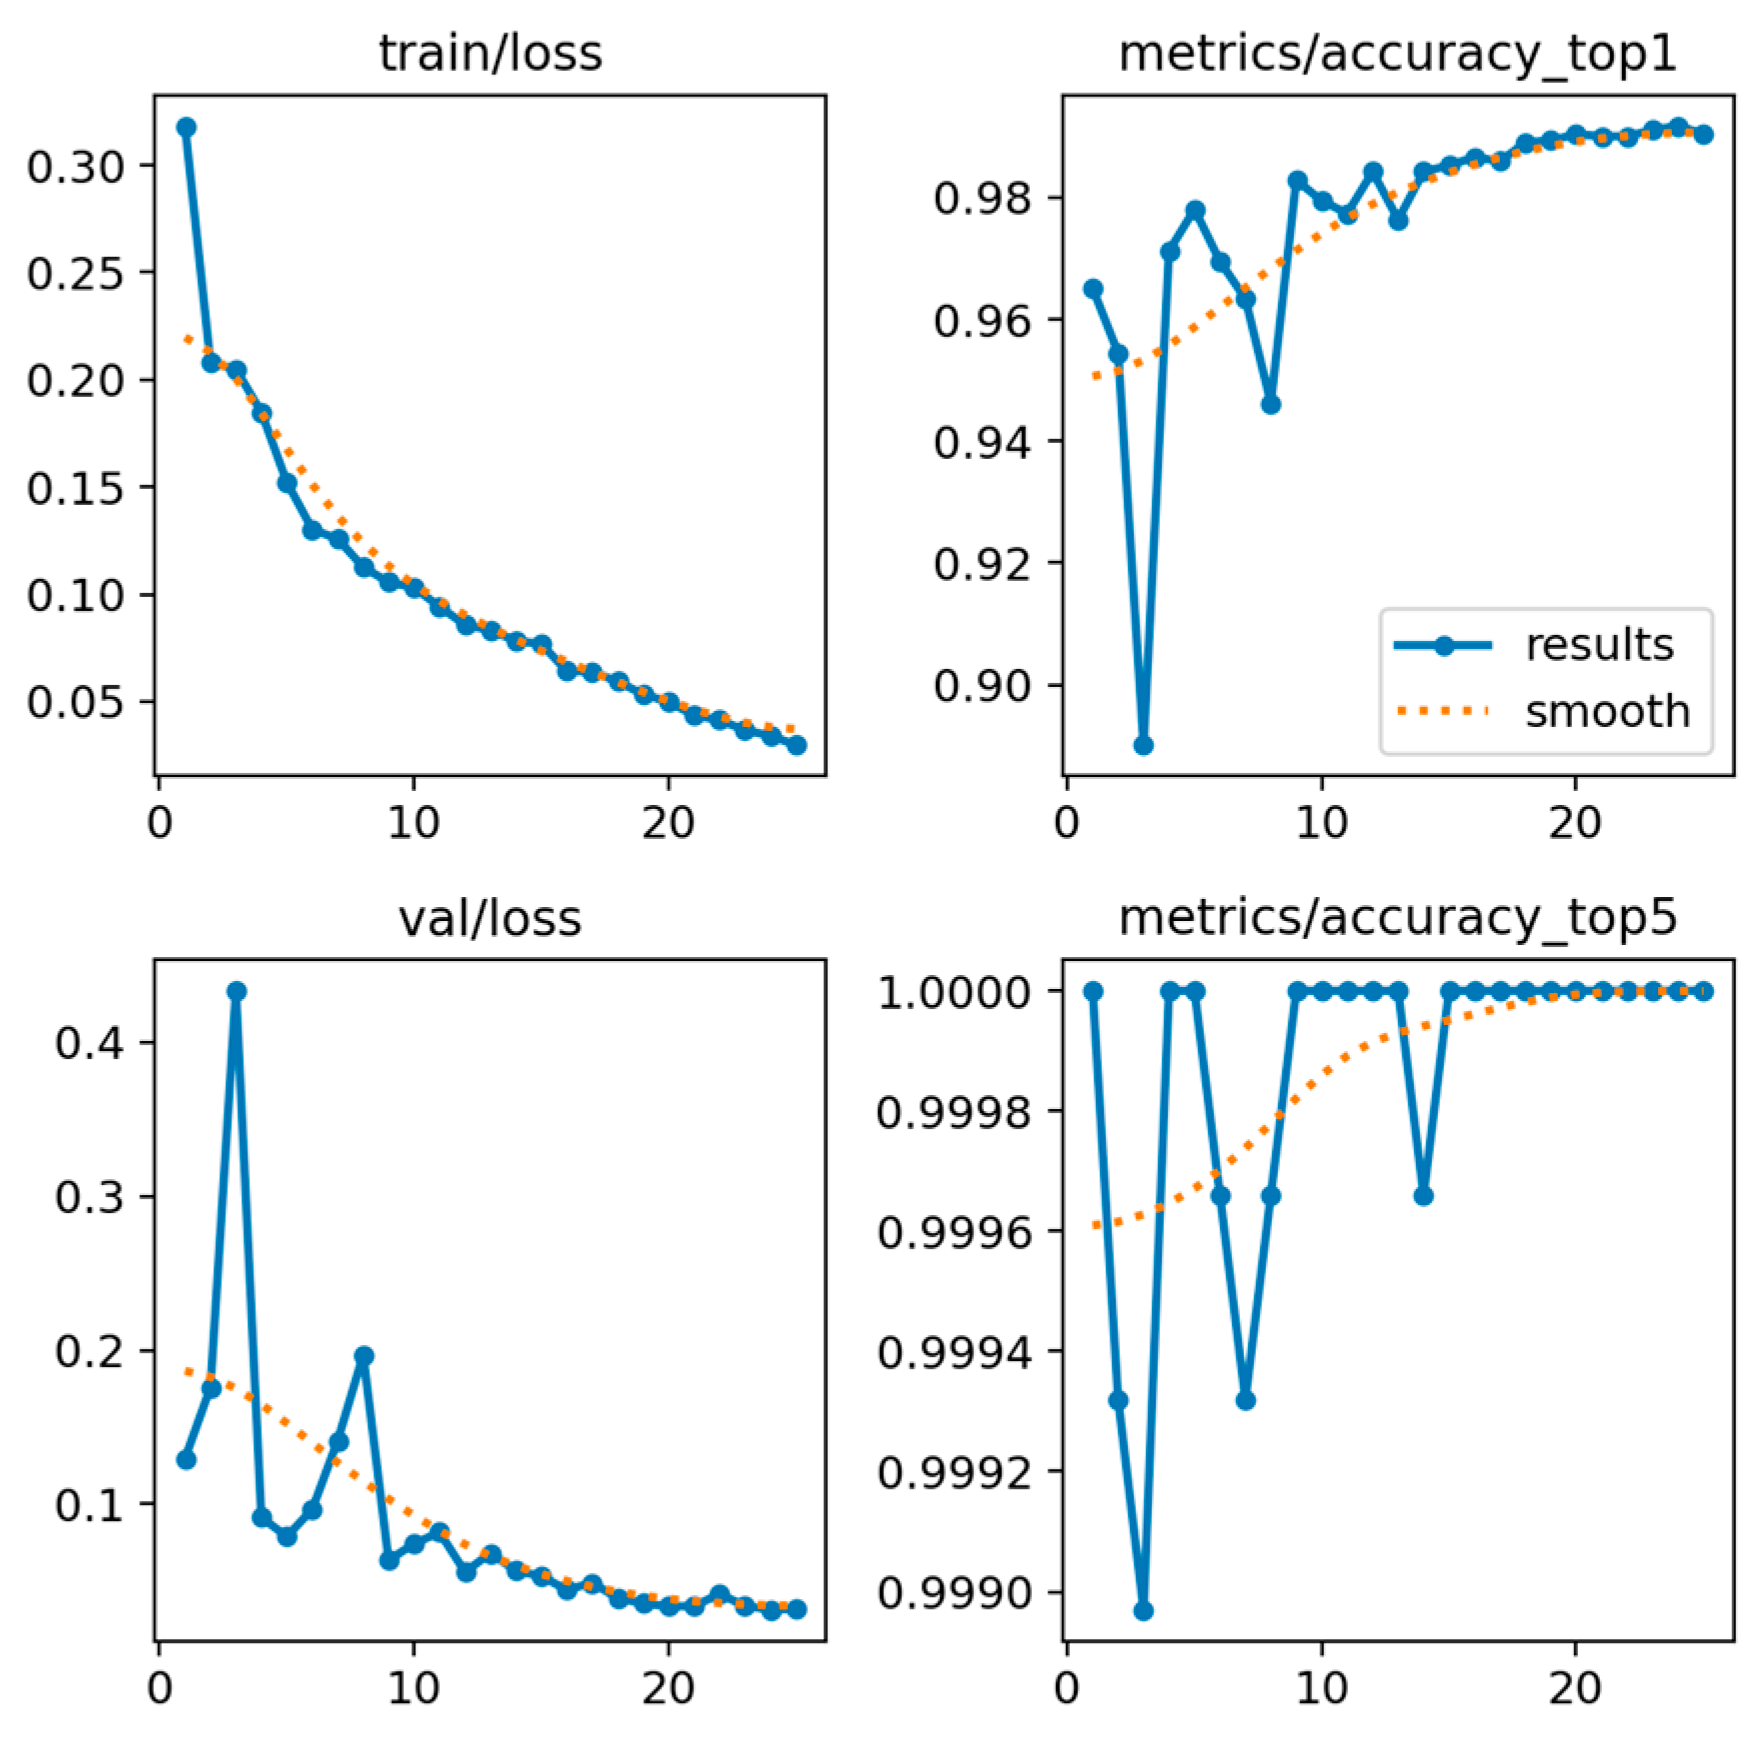
While Figure 7 describes the training process of the baseline CNN models, it is also necessary to evaluate the training process of the newly proposed YOLOv11x architecture. Unlike typical CNN-based classification models, the newly proposed YOLOv11x architecture has a different feature extraction and optimization process, and it is expected that such differences will affect the performance and training process of the model. Therefore, the training and validation loss, and top-1 and top-5 accuracy of the newly proposed YOLOv11x model were evaluated (Figure 8).
Figure 8.
Training dynamics of the proposed YOLOv11x model, illustrating training and validation loss and top-1 and top-5 accuracy trends across training epochs.
As can be seen from Figure 8, the optimization behavior of the proposed YOLOv11x model was stable during the training process. This was demonstrated by the smooth reduction in the training and validation loss curves, which remained close to each other throughout the training process, implying convergence without any signs of overfitting. At the same time, the top-1 and top-5 accuracy values increased smoothly during the training process and converged to stable values, implying the consistency of the generalization performance of the proposed model.
3.4. Degradation Sensitivity Analysis of CNN Baselines
Degradation experiments, like Gaussian noise and motion blur, were performed on the baseline models of CNN architectures like EfficientNet-B1, DenseNet-201, and ResNet-152. The YOLOv11x model was not included in the degradation experiments because of computational issues.
3.4.1. Gaussian Noise Sensitivity (CNN Baselines)
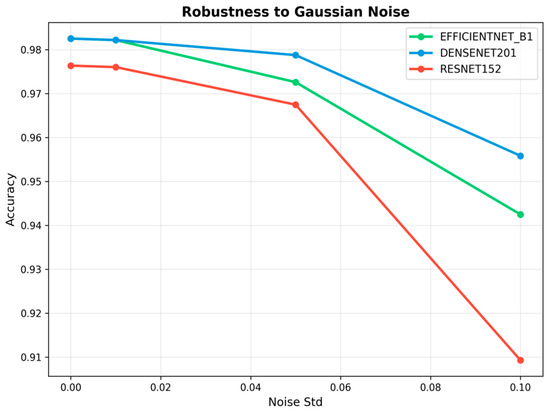
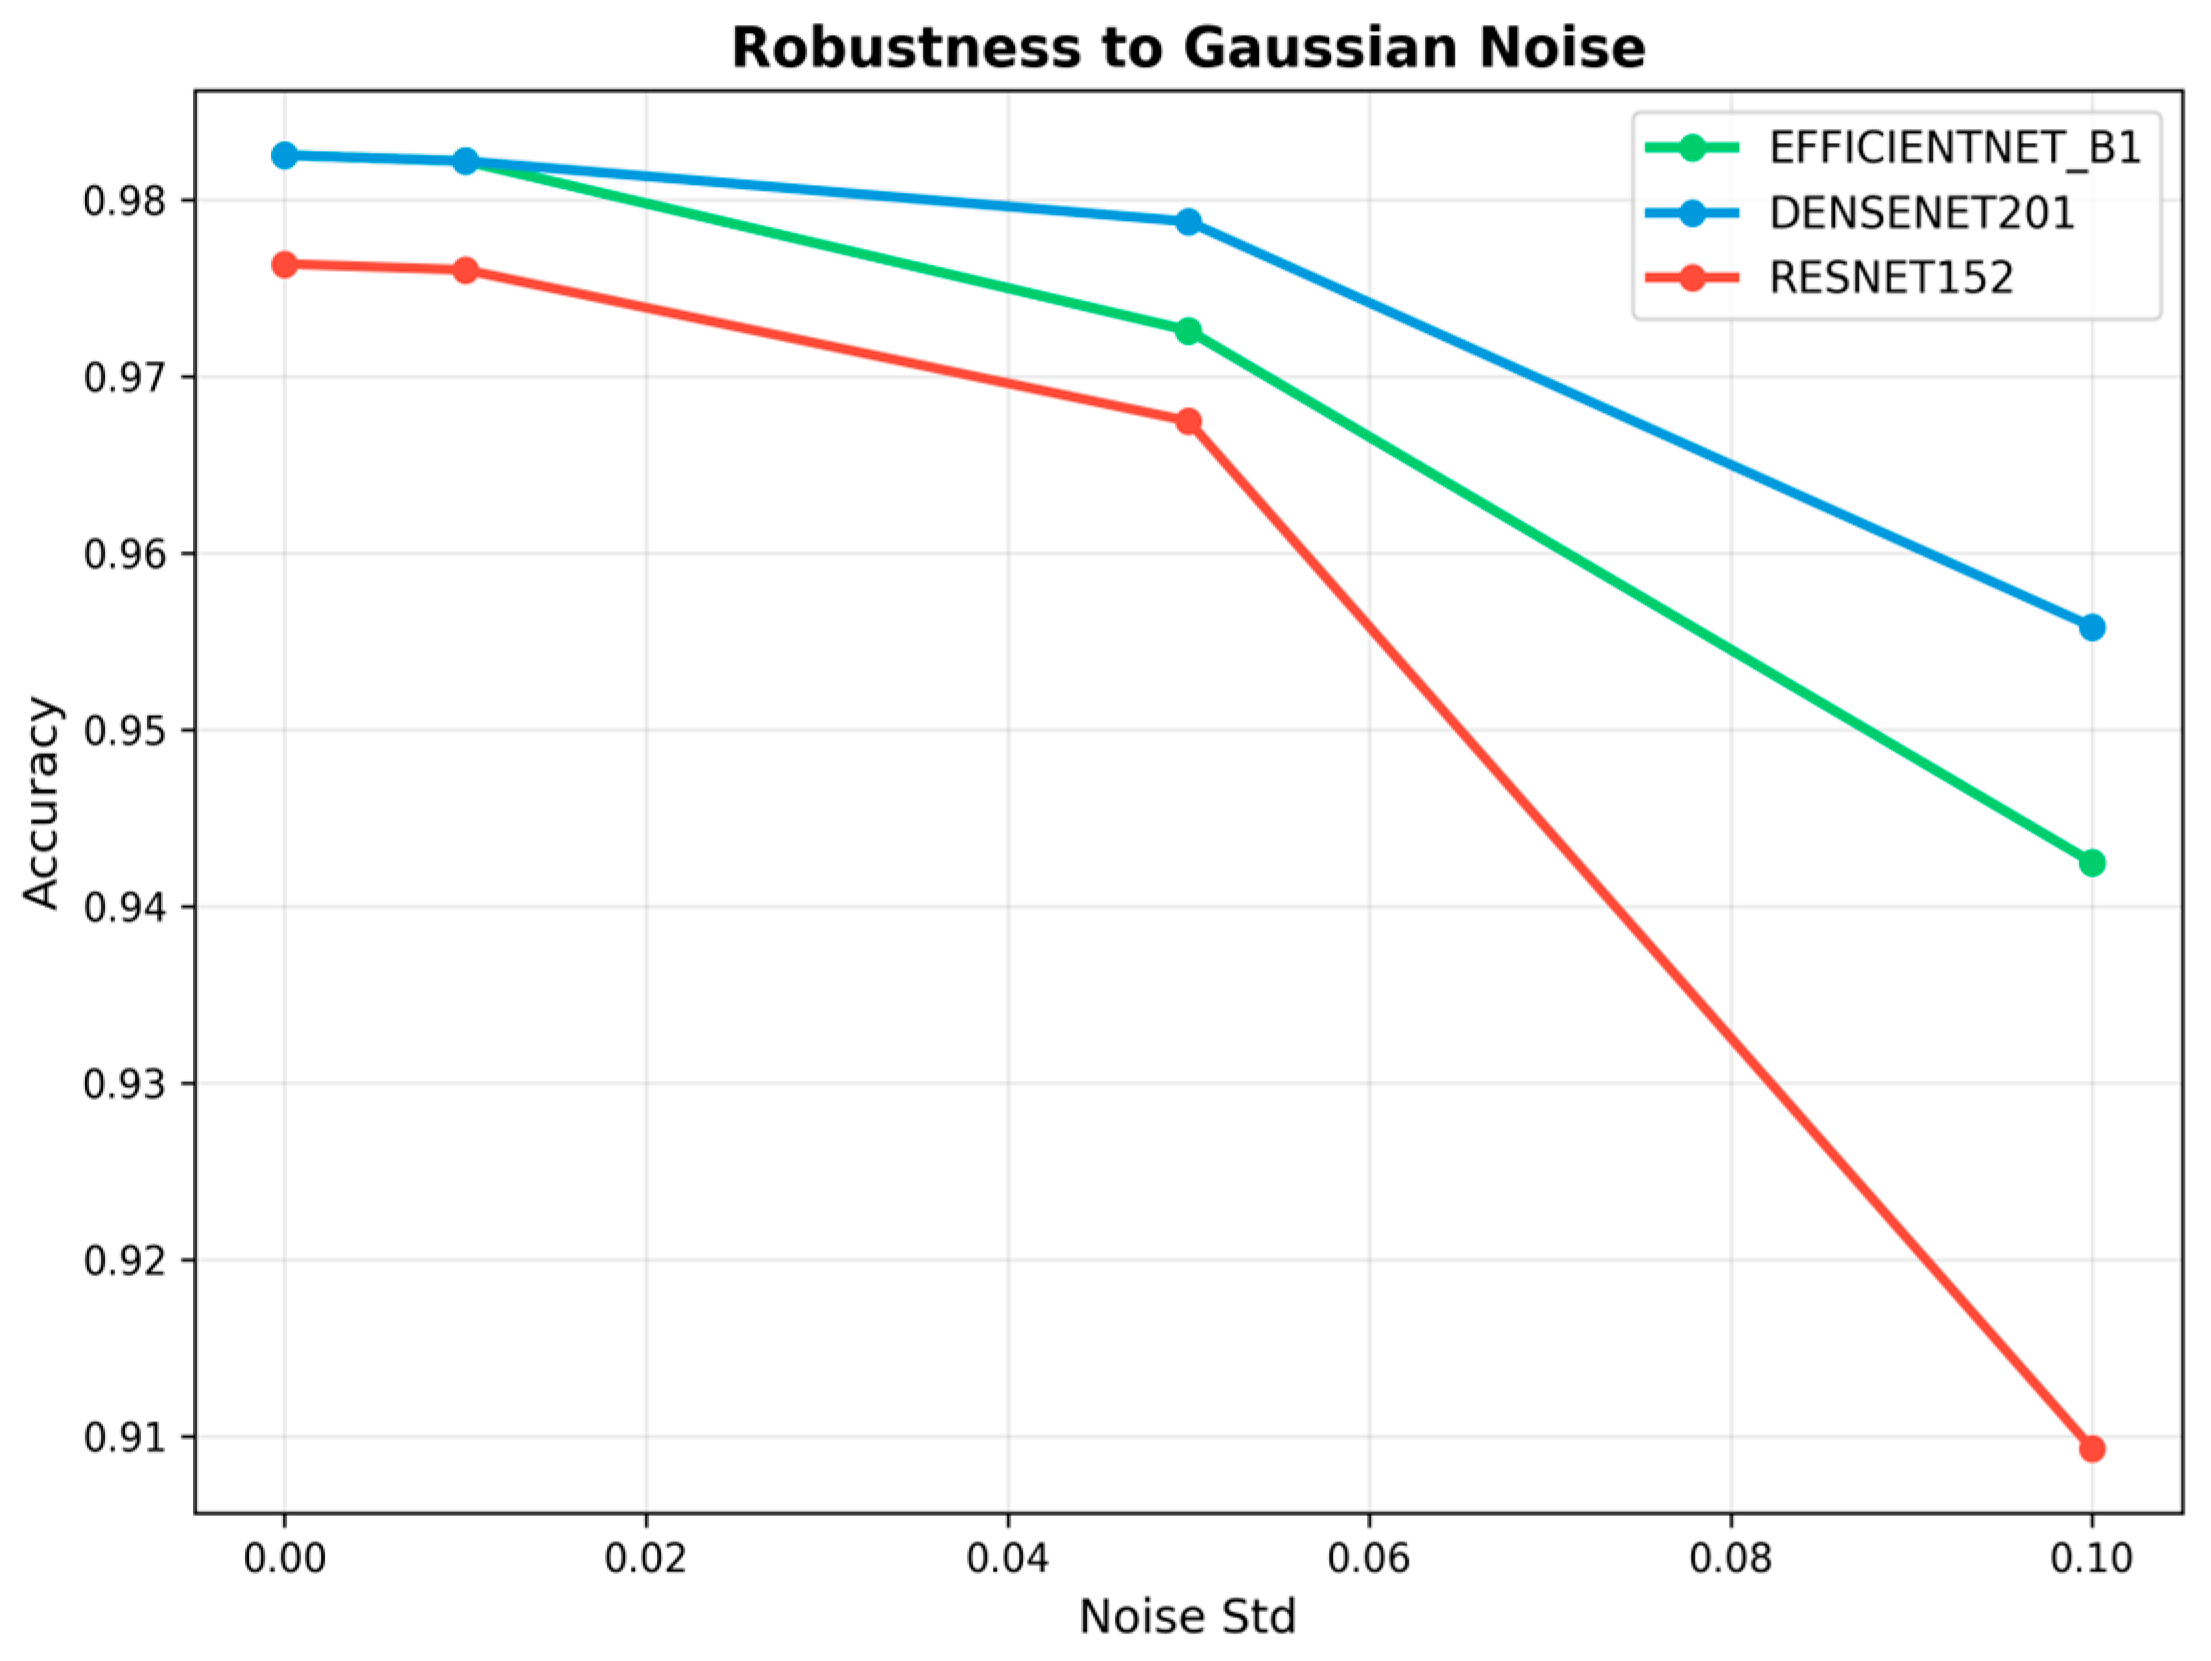
In order to evaluate the degradation sensitivity of the CNN baseline models in the presence of noise that may be introduced during the process of acquiring the images, the validation images were intentionally corrupted by the addition of Gaussian noise at various increasing levels. The noise levels were implemented by adding Gaussian noise with standard deviations of σ = 0.01, 0.05, and 0.10. The models that were evaluated in the presence of noise were the EfficientNet-B1, DenseNet-201, and ResNet-152. The performance of the models in the presence of noise was compared with the performance of the baseline model that was evaluated on clean data. The results, as seen in Table 6 and Figure 9, show that the CNN baseline models had stable performance under various conditions of noise, maintaining accuracy greater than 94%. Out of the tested models, the EfficientNet-B1 model showed the best classification performance stability under various conditions of increased noise. It was able to achieve an accuracy of 96.75% under the worst conditions of noise. The DenseNet-201 model showed moderate performance stability, while the ResNet-152 model was more sensitive to the effects of noise. This shows that models that are more efficient, such as those using compound scaling, are more tolerant to the effects of noise during image acquisition compared to deeper residual networks.
Table 6.
Classification accuracy (%) under Gaussian noise perturbation.
Figure 9.
Accuracy under increasing Gaussian noise levels.
3.4.2. Gaussian Blur Sensitivity (CNN Baselines)
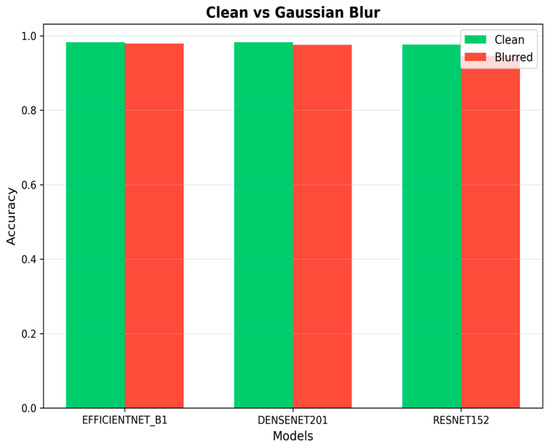
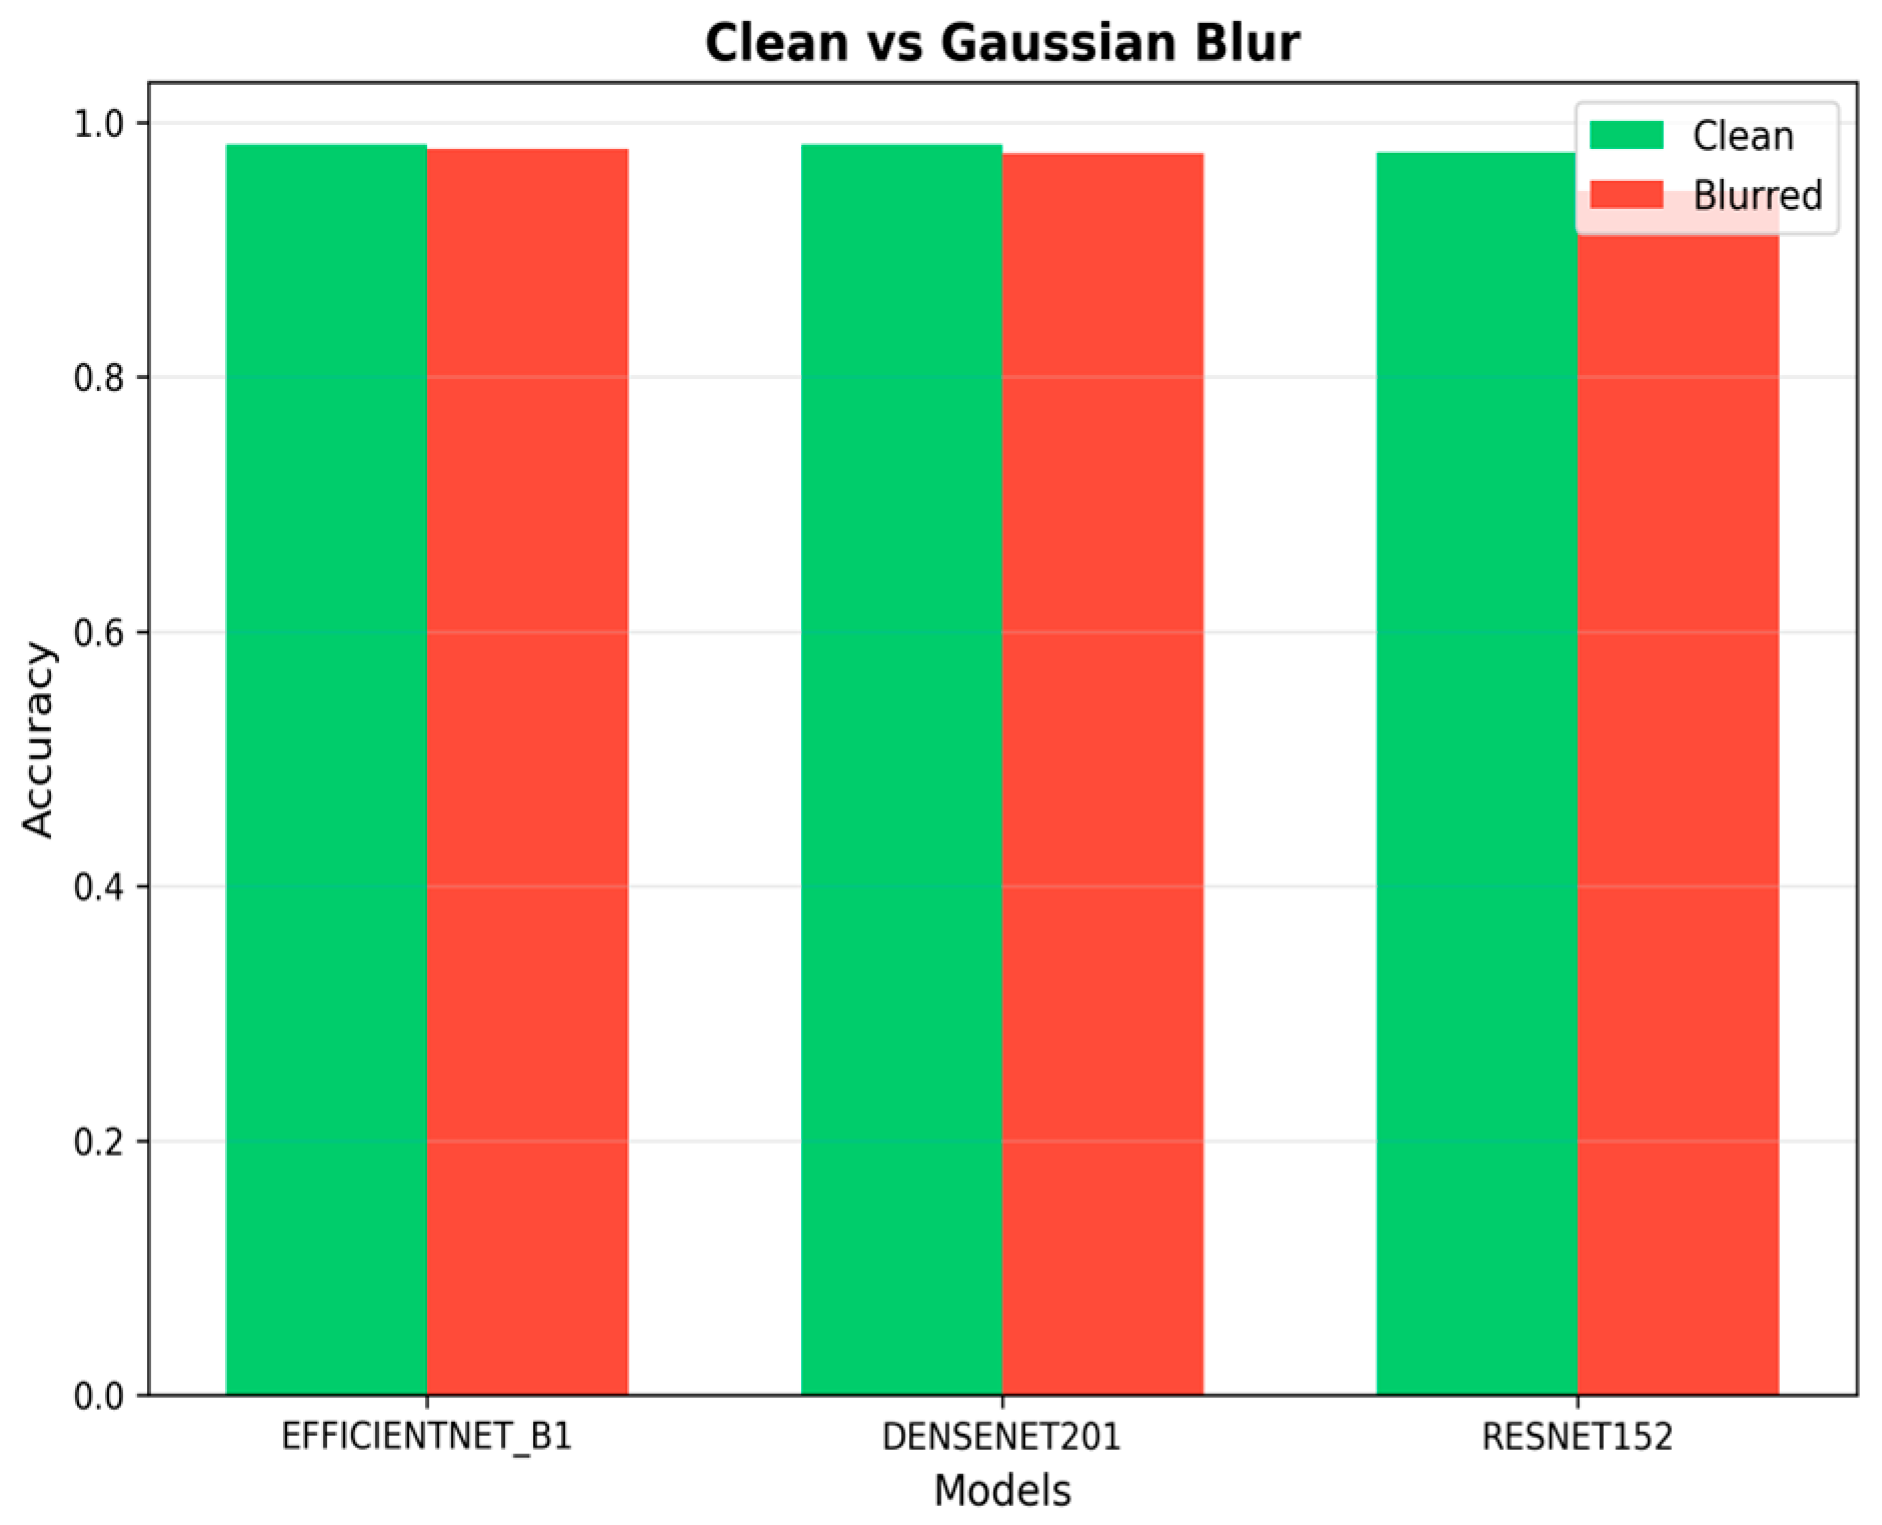
In addition, the degradation sensitivity of the CNN baseline models was evaluated with respect to Gaussian blur perturbations, which mimic the possible defocus and motion effects experienced during image acquisition in realistic environments. The validation set was processed with a Gaussian blur filter, and the classification accuracy was compared with the clean baseline model.
The experimental results, as presented in Table 7 and Figure 10, show that EfficientNet-B1 has consistent performance under blurred conditions, with minimal degradation in accuracy. DenseNet-201 has slightly higher degradation, while ResNet-152 has the maximum degradation, with an accuracy drop of 2.6% compared to the clean baseline model.
Table 7.
Classification accuracy (%) under Gaussian blur degradation.
Figure 10.
Accuracy comparison between clean and Gaussian-blurred images.
The results indicate that the efficiency-oriented CNN models, such as EfficientNet-B1, are more robust under image degradation effects, while deeper residual network models are affected by the blur perturbations.
3.4.3. Ablation Study: V1, V2, V3 Configurations
An ablation study was performed to investigate the impact of different data distribution approaches on the classification performance. Three different configurations were considered: V1 (Hybrid Balanced), V2 (Imbalanced Baseline), and V3 (Physical 3× Augmentation). All the configurations were conducted under the same hyperparameters and experimental settings. Performance differences were attributed to the data distribution strategy, as all other experimental conditions were kept identical. The data distribution approaches were as follows:
- -
- V1 (Hybrid Balanced): Majority class imbalance was handled using downsampling to 1100–1200 images per class. Minority classes were handled using the proposed data augmentation pipeline. The final data set was balanced with 10,028 images.
- -
- V2 (Imbalanced Baseline): The original data set with 14,582 images was used. No balancing was performed.
- -
- V3 (Physical 3× Augmentation): The original data set was used with all images. Each image was augmented with three more images using the physically inspired data augmentation. The feature diversity was increased with the same class proportion.
The quantitative results are shown in Table 8. From the results, the highest accuracy is obtained using the YOLOv11x configuration under V3 with 99.18% compared to V2 with 99.01% and V1 with 98.87%. DenseNet-201 and ResNet-152 also obtained the highest accuracy using the V3 configuration. However, the EfficientNet-B1 configuration obtained the highest accuracy using the V2 configuration.
Table 8.
Ablation study results for identical training settings across different data configurations (V1, V2, and V3).
These findings indicate that for most evaluated architectures, increasing realistic feature diversity through physical augmentation (V3) provides more consistent performance improvements than resampling-based balancing (V1).
Yang et al. [12] achieved 99.11% accuracy on the AppleLeaf9 dataset with a model called EfficientNetMG with Multi-Scale Feature Fusion and GELU activation. This indicates that this model is also effective with a lightweight and edge-oriented design. However, the YOLOv11x model achieved a slightly higher accuracy of 99.18% with a different configuration known as V3. It incorporates CSP-based feature extraction and physically motivated data augmentation. The accuracy gap is 0.07%, which is statistically negligible. This further indicates that this model is effective despite its different design approach.
It is clear that although there is a slight accuracy difference between these approaches, their accuracy is almost similar. However, it is worth noting that there is a significant difference in their methodologies, as one approach focuses on parameter efficiency, edge-oriented deployment, and direct interaction with the imbalanced dataset, while the YOLOv11x model focuses on maximal classification accuracy, fine-grained disease discrimination, and a physically motivated approach. It is also worth noting that although a different approach was used, the YOLOv11x model was more effective in fine-grained disease discrimination, as reflected by its lower misclassification rate. For example, in Rust and Scab, where these diseases often overlap, the YOLOv11x model only misclassified a single image (1%). However, ResNet-152 and DenseNet-201 misclassified eight and seven images, respectively, corresponding to 5% and 4%, respectively. The evidence suggests that although a different approach was used, a significantly higher accuracy rate was achieved by the YOLOv11x model for fine-grained disease discrimination. In conclusion, the approaches have similar performance on the given dataset, but the YOLOv11x model has stronger fine-grained discrimination performance. The approaches have different designs, but the results are highly comparable.
3.5. Visual Prediction Examples
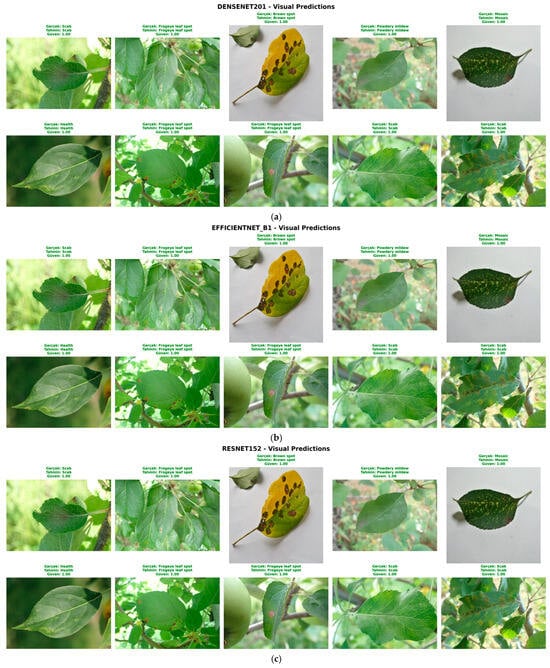
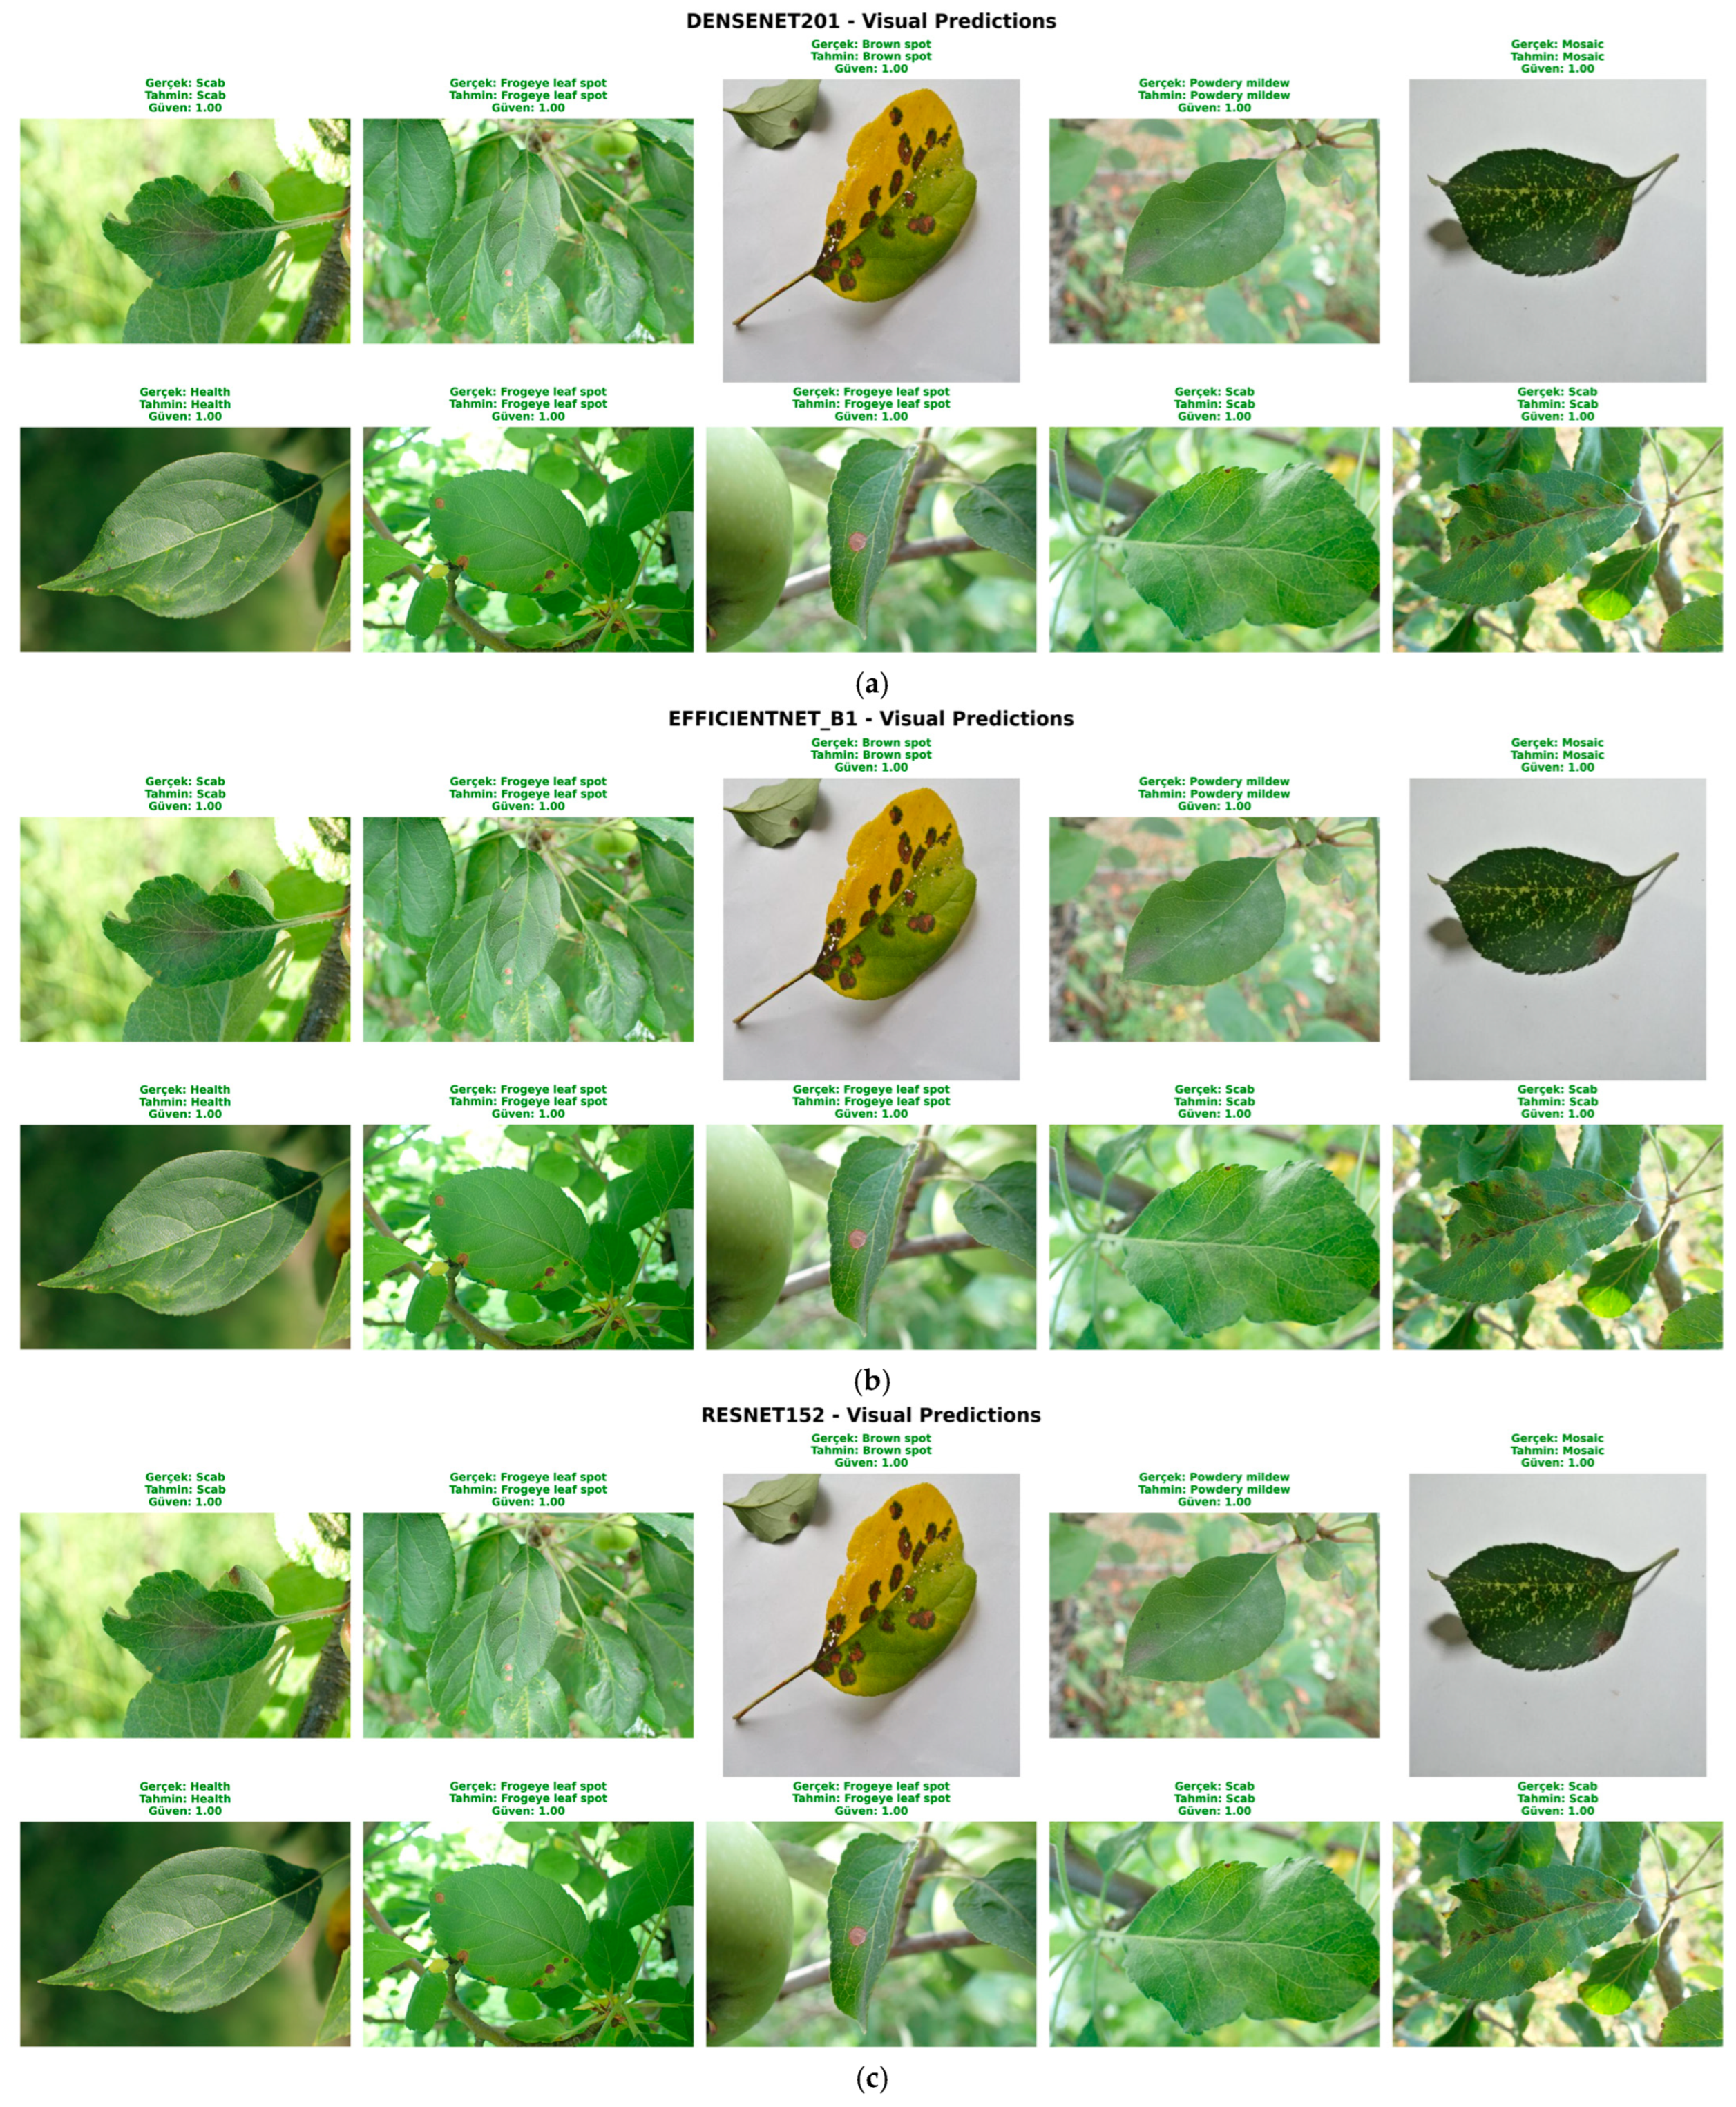
This section provides a qualitative analysis of how the evaluated models behave when making predictions, where test images from the AppleLeaf9 dataset were used. By viewing the predictions of these models, we can gain a better understanding of how confident each of these models is when making predictions and how their predictions vary across different disease categories that have varying features. Figure 11 illustrates the selection of visual predictions of YOLOv11x, EfficientNet-B1, DenseNet-201, and ResNet-152 when they were evaluated on the test dataset. For disease categories that have clearly distinguishable features, such as Brown Spot, Healthy, Scab, and Powdery Mildew, all of these models exhibited high confidence levels when making predictions. This is because these diseases have very distinguishable features, where the shapes of the lesions, color distribution, and textures of the infected leaves are all very specific.
Figure 11.
Visual prediction examples on representative AppleLeaf9 test images, illustrating high-confidence correct classifications, challenging yet correctly predicted cases, and rare misclassification examples with associated confidence scores: (a) DenseNet-201 visual predictions, (b) EfficientNet-B1 visual predictions, and (c) ResNet-152 visual predictions.
On the other hand, disease classes that do not differ much in appearance, such as the case of Grey Spot, Mosaic, and Alternaria Leaf Spot, had a small drop in confidence even when the predictions were correct. This is due to the fact that the classes appear almost the same in the pictures. The spots differ in size and color, making them almost indistinguishable. However, the drop in confidence is small.
Only a few misclassifications were found in the visual predictions, which were mainly related to visually similar classes such as Rust and Scab or Alternaria Leaf Spot and Brown Spot. These misclassifications occur due to similar visual characteristics, such as color and texture of the lesions. The misclassifications were limited and had low confidence, demonstrating the model’s uncertainty with similar visuals. The visual predictions were also consistent with the quantitative results, showing the high discriminative ability of the model across the different classes of diseases. The qualitative analysis indicates high accuracy of the predictions with proper handling of visual ambiguity. These qualitative observations further reinforce the quantitative evaluation, demonstrating that high aggregate metrics are reflected in consistent and reliable class-level predictions.
4. Discussion
From the experimental results, the interaction of architecture and data distribution strategy plays a crucial role in determining the classification performance of apple leaf diseases. The ablation study of the different configurations of V1, V2, and V3 reveals that the hybrid balancing strategy of V1 did not necessarily yield better performance than the imbalanced baseline strategy of V2, despite achieving high minority class F1-scores, such as 96.20% for Grey Spot. The results suggest that extreme downsampling of the majority classes may cause the removal of valuable high-frequency features, thereby compromising global feature diversity. The high-capacity YOLOv11x architecture, which relies on learning complex decision boundaries, may be disadvantaged by reduced diversity.
In addition, the physical data augmentation strategy of V3 achieves the best performance. Unlike the hybrid balancing strategy of V1, the physical data augmentation strategy of V3 preserves the original amount of data while increasing intra-class diversity using physically motivated perturbations such as illumination, geometric, and noise transformations. The results reveal that increasing the amount of data and diversity of features may be more effective than artificial balancing of the data distribution.
Architectural interactions of the different configurations of YOLOv11x and EfficientNet-B1 reveal interesting results. YOLOv11x achieves excellent fine-grained discrimination performance, particularly for visually similar classes of apple leaf diseases. However, the performance gains are configuration-dependent rather than architecture-dependent. EfficientNet-B1 achieves the best performance using the imbalanced baseline strategy of V2. The performance of EfficientNet-B1 slightly declines when using the heavy data augmentation strategy of V3. The performance of EfficientNet-B1 may be attributed to compound scaling, which jointly scales depth, width, and resolution during architecture optimization. As a compact and parameter-efficient architecture, EfficientNet-B1 may be operating at or near its optimal capacity using the original data distribution. Excessive data augmentation may cause mild calibration instabilities.
From an applied point of view, the choice between V1 and V3 should be based on specific constraints in each particular application. For example, V1 may be used in environments where there is a significant class imbalance and limited computational resources, since downsampling can be used to reduce the size and training cost of the dataset. However, when computational resources are not a problem and diversity in features is important for fine-grained discrimination, V3 can be seen as a more reliable option.
Moreover, although in the degradation experiments, Gaussian noise and motion blur were used to simulate acquisition-level changes, other environmental changes, such as occlusion, partially visible leaves, and illumination extremes, were not explicitly investigated. The extension of this framework to include more general environmental perturbations and generalization to new domains is an important area to be explored.
5. Conclusions
This study presents a systematic ablation study to evaluate the impact of different data distribution approaches on apple leaf disease classification performance. The study considered three different approaches under controlled experimental conditions: V1, which used hybrid balancing with majority downsampling and minority augmentation; V2, which used the imbalanced baseline; and V3, which used data-preserving physical 3× augmentation.
The results show that performance improvement is not guaranteed with resampling-based balancing approaches. Although V1 achieved higher minority-class F1-scores, it failed to improve overall accuracy compared to the imbalanced baseline (V2). This suggests that aggressive downsampling of the majority class may compromise the diversity of features and, as a result, the model’s ability to learn rich global representations.
On the other hand, the data-preserving physical augmentation strategy proposed in the current study was found to yield better performance in combination with the YOLOv11x model, yielding an accuracy of 99.18%. This indicates that, unlike resampling-based strategies, the physical augmentation strategy is more effective for high-capacity models like YOLOv11x, as it improves feature variability while maintaining the original distribution of classes.
Interaction effects were also observed for the models. While the best performance for YOLOv11x and other deep models was achieved with the physical augmentation strategy (V3), the best performance for the EfficientNet-B1 model was achieved with the imbalanced baseline (V2). This indicates the potential for compound scaling models to be more susceptible to distribution shifts resulting from augmentation strategies.
The overall results suggest the potential for more effective performance from realistic and physical augmentation strategies compared to resampling-based balancing strategies for fine-grained disease discrimination tasks. Future work will focus on applying the framework for domain generalization scenarios and the inclusion of other realistic perturbations, such as occlusion and extreme illumination conditions commonly found in orchard environments.
Author Contributions
E.F. and S.A. helped in conceptualisation, software, validation, writing—original draft, resources, and data curation. P.D. and I.B. helped in methodology, writing—review and editing, supervision, funding acquisition, and formal analysis. All authors have read and agreed to the published version of the manuscript.
Funding
This research was funded by the Scientific Research Projects Commission of Aydın Adnan Menderes University, grant number MF-25005 (Principal Investigator: Ismail Bogrekci).
Institutional Review Board Statement
Not applicable.
Informed Consent Statement
Not applicable.
Data Availability Statement
The raw data supporting the conclusions of this article will be made available by the authors on request.
Acknowledgments
The authors thank Scientific Research Projects Coordination Unit (BAP) of Aydin Adnan Menderes University for institutional support.
Conflicts of Interest
Emrah Fidan is a computer engineer at Alprobotics Inc. Serra Aksoy is a computer engineering student at LMU and a temporary software programming intern at Alprobotics Inc. Pinar Demircioglu and Ismail Bogrekci are co-founders of Alprobotics Inc. and consultants at Alpler Agricultural Machinery Inc. R&D Center. The authors declare that they have no known competing financial interests or personal relationships that could have appeared to influence the work submitted for publication.
References
- Askr, H.; Darwish, A.; Hassanien, A.E. Apple Leaf Diseases Classification Using DenseNet Based on Copula Entropy-Based Golden Jackal Optimization. In Innovative AI Technologies Driving Sustainable Farming: Strategies for Improving Food Security; Hassanien, A.E., Darwish, A., Eds.; Studies in Systems, Decision and Control; Springer Nature Switzerland: Cham, Switzerland, 2026; Volume 634, pp. 25–49. ISBN 978-3-032-05700-6. [Google Scholar]
- Kaur, R.; Farahmand, N. Artificial Intelligence Driven Smart Agriculture: A Comprehensive Review on Apple Leaf Disease Detection. 2025.
- Liu, Z.; Li, X. An Improved YOLOv5-Based Apple Leaf Disease Detection Method. Sci. Rep. 2024, 14, 17508. [Google Scholar] [CrossRef] [Scilit] [PubMed]
- Jiang, P.; Chen, Y.; Liu, B.; He, D.; Liang, C. Real-Time Detection of Apple Leaf Diseases Using Deep Learning Approach Based on Improved Convolutional Neural Networks. IEEE Access 2019, 7, 59069–59080. [Google Scholar] [CrossRef] [Scilit]
- Zhong, Y.; Zhao, M. Research on Deep Learning in Apple Leaf Disease Recognition. Comput. Electron. Agric. 2020, 168, 105146. [Google Scholar] [CrossRef] [Scilit]
- Ojo, M.O.; Zahid, A. Improving Deep Learning Classifiers Performance via Preprocessing and Class Imbalance Approaches in a Plant Disease Detection Pipeline. Agronomy 2023, 13, 887. [Google Scholar] [CrossRef] [Scilit]
- Khan, A.I.; Quadri, S.M.K.; Banday, S.; Latief Shah, J. Deep Diagnosis: A Real-Time Apple Leaf Disease Detection System Based on Deep Learning. Comput. Electron. Agric. 2022, 198, 107093. [Google Scholar] [CrossRef] [Scilit]
- Sun, H.; Xu, H.; Liu, B.; He, D.; He, J.; Zhang, H.; Geng, N. MEAN-SSD: A Novel Real-Time Detector for Apple Leaf Diseases Using Improved Light-Weight Convolutional Neural Networks. Comput. Electron. Agric. 2021, 189, 106379. [Google Scholar] [CrossRef] [Scilit]
- Mohanty, S.P.; Hughes, D.P.; Salathé, M. Using Deep Learning for Image-Based Plant Disease Detection. Front. Plant Sci. 2016, 7, 1419. [Google Scholar] [CrossRef] [Scilit] [PubMed]
- Doutoum, A.S.; Tugrul, B. A Systematic Review of Deep Learning Techniques for Apple Leaf Diseases Classification and Detection. PeerJ Comput. Sci. 2025, 11, e2655. [Google Scholar] [CrossRef] [Scilit] [PubMed]
- Aksoy, S.; Demircioglu, P.; Bogrekci, I. Web-Based AI System for Detecting Apple Leaf and Fruit Diseases. AgriEngineering 2025, 7, 51. [Google Scholar] [CrossRef] [Scilit]
- Yang, Q.; Duan, S.; Wang, L. Efficient Identification of Apple Leaf Diseases in the Wild Using Convolutional Neural Networks. Agronomy 2022, 12, 2784. [Google Scholar] [CrossRef] [Scilit]
- Bi, C.; Wang, J.; Duan, Y.; Fu, B.; Kang, J.-R.; Shi, Y. MobileNet Based Apple Leaf Diseases Identification. Mobile Netw. Appl. 2022, 27, 172–180. [Google Scholar] [CrossRef] [Scilit]
- Yan, Q.; Yang, B.; Wang, W.; Wang, B.; Chen, P.; Zhang, J. Apple Leaf Diseases Recognition Based on An Improved Convolutional Neural Network. Sensors 2020, 20, 3535. [Google Scholar] [CrossRef] [Scilit] [PubMed]
- Pradhan, P.; Kumar, B.; Mohan, S. Comparison of Various Deep Convolutional Neural Network Models to Discriminate Apple Leaf Diseases Using Transfer Learning. J. Plant Dis. Prot. 2022, 129, 1461–1473. [Google Scholar] [CrossRef] [Scilit]
- AppleLeaf9. Available online: https://github.com/JasonYangCode/AppleLeaf9 (accessed on 10 February 2026).
- Jocher, G.; Chaurasia, A.; Qiu, J. Ultralytics YOLO (Version 11). Available online: https://github.com/ultralytics/ultralytics (accessed on 10 February 2026).
- Lin, T.-Y.; Dollár, P.; Girshick, R.; He, K.; Hariharan, B.; Belongie, S. Feature Pyramid Networks for Object Detection 2016. In Proceedings of the IEEE Conference on Computer Vision and Pattern Recognition, Las Vegas, NV, USA, 27–30 June 2016. [Google Scholar]
- Wang, C.-Y.; Liao, H.-Y.M.; Yeh, I.-H.; Wu, Y.-H.; Chen, P.-Y.; Hsieh, J.-W. CSPNet: A New Backbone That Can Enhance Learning Capability of CNN. In Proceedings of the IEEE/CVF Conference on Computer Vision and Pattern Recognition Workshops, Long Beach, CA, USA, 16–17 June 2019. [Google Scholar]

Disclaimer/Publisher’s Note: The statements, opinions and data contained in all publications are solely those of the individual author(s) and contributor(s) and not of MDPI and/or the editor(s). MDPI and/or the editor(s) disclaim responsibility for any injury to people or property resulting from any ideas, methods, instructions or products referred to in the content. |
© 2026 by the authors. Licensee MDPI, Basel, Switzerland. This article is an open access article distributed under the terms and conditions of the Creative Commons Attribution (CC BY) license.