


Abstract
For high-value-added products such as matcha, scientific confirmation of the origin is essential for quality assurance and fraud prevention. In this study, three nondestructive analytical techniques, specifically fluorescence (FF), near-infrared (NIR), and Fourier transform infrared (FT-IR) spectroscopy, were combined with machine learning algorithms to accurately identify the origin of Japanese matcha. FF data were analyzed using convolutional neural networks (CNNs), whereas NIR and FT-IR spectral data were analyzed using k-nearest neighbors (KNNs), random forest (RF), logistic regression (LR), and support vector machine (SVM) models. The FT-IR–RF model demonstrated the highest accuracy (99.0%), followed by the NIR–KNN (98.7%) and FF–CNN (95.7%) models. Functional group absorption in FT-IR, moisture and carbohydrates in NIR, and amino acid and polyphenol fluorescence in FF contributed to the identification. These findings indicate that the selection of an algorithm appropriate for the characteristics of the spectroscopic data is effective for improving accuracy. This method can quickly and nondestructively identify the origin of matcha and is expected to be applicable to other teas and agricultural products. This new approach contributes to the verification of the authenticity of food and improvement in its traceability.
1. Introduction
Food authenticity and accuracy-of-origin labeling are key concerns in the food industry. Mislabeling and fraud, especially for high-value agricultural products such as matcha, can undermine consumer trust and regional brand value. In response, a method combining rapid, nondestructive spectroscopic analysis with machine learning is gaining attention as an effective approach for increasing transparency and quality assurance in the food supply chain.
According to ISO 20715:2023 [1], matcha is defined as tea powder from the Chinese variety (var. sinensis) of Camellia sinensis (tea plant) grown under shade, obtained from young leaves, buds, and shoots after steam treatment to inactivate enzymes and drying without rolling, followed by fine grinding of the leaves. This definition clarifies that matcha is a unique and exclusive product that is distinct from other green and powdered teas. Because the quality and market value of matcha depend heavily on its place of geographical origin, a method for objectively identifying its origin is essential for protecting regional brands and ensuring fair trade. Traditional certification methods rely on sensory evaluation and labeling, which leave the risk of subjectivity and mislabeling or fraud. Therefore, developing scientific, data-driven origin identification technology is crucial for increasing supply chain transparency and maintaining consumer trust.
Numerous spectroscopic studies have been conducted on various types of tea, including 1H NMR [2], NIR/VIS-NIR spectroscopy [3,4,5,6,7], fluorescence spectroscopy including EEM and FF [8,9,10,11], and FT-IR spectroscopy combined with chemometrics and clustering techniques [12,13,14,15,16,17], to attempt to identify origin, quality, and classification of tea. While these studies demonstrate the effectiveness of spectroscopic analysis in tea research, most of them have focused on determining type, grade, and authenticity rather than origin identification, and no research has been conducted specifically on matcha. Most existing studies have not evaluated the robustness of these spectroscopic methods across different production years, cultivation conditions, or processing environments, which represents a limitation of current research. Therefore, there remains a clear need for a comprehensive comparison of multiple spectroscopic techniques for matcha origin identification using standardized measurement and machine learning approaches.
The number of spectroscopic studies on matcha has increased in recent years. Ouyang et al. [18,19] combined VIS-NIR hyperspectral imaging with a colorimetric sensor array to quantify the main components and distinguish grades of matcha. Hu et al. [20] and Luo et al. [21] used hyperspectral imaging and machine learning to evaluate the quality and sensory characteristics of matcha nondestructively. Xu et al. [22] used three-dimensional FF spectroscopy and distance discrimination to identify the producers and grades of Chinese matcha. Cui et al. [23] used metabolomic analysis to reveal regional differences in the chemical composition of matcha from four regions in China and Japan. These studies covered quality evaluation and component analysis; however, to date, no research has combined spectroscopic data and machine learning to identify the origin of matcha.
Previous studies have also combined spectroscopic techniques with machine learning algorithms to identify the geographical origin of teas. Akiyama et al. [24] demonstrated that a combination of FF fingerprinting and machine learning can accurately identify the origin of green tea. Matcha has unique production steps and a powdered form that differ from typical green tea, which may influence its spectral characteristics. However, matcha is produced differently from sencha (a typical form of green tea), undergoing unique processes such as shade cultivation, enzyme inactivation with steam, and grinding without rolling. As a result, its component composition, including the distribution of catechins and polyphenols and the amount of free amino acids, and the resulting spectral characteristics, including the increased surface area due to powdering, may differ substantially from those of green tea. Therefore, origin identification methods that are effective for green tea may not be directly applicable to matcha, and it is important to explore more accurate approaches. FF spectroscopy sensitively detects subtle differences in fluorescent components such as amino acids and catechins, enabling differentiation based on compounds characteristic of matcha [25,26,27]. NIR spectroscopy nondestructively captures bulk information reflecting major components such as water, carbohydrates, and proteins, making it suitable for evaluating the overall chemical composition of matcha [28,29]. FT-IR spectroscopy provides absorption patterns derived from functional groups and molecular structures, offering detailed chemical fingerprints that represent the fine molecular features of matcha powder [30,31]. Taken together, these complementary spectroscopic properties suggest that integrating multiple techniques may enhance the accuracy of geographical origin identification for matcha. In this study, three types of spectroscopic data were compared: FF, NIR, and FT-IR spectroscopy.
Based on the above, the purpose of this study was to establish a more accurate and versatile method for identifying the origin of matcha by combining spectroscopic data from FF, NIR, and FT-IR spectroscopy with multiple machine learning algorithms. In particular, the aim is to compare the discrimination performance of the three types of spectroscopy and to determine which combination of spectroscopic information and algorithm is most effective. These results are expected to provide a scientific basis for verifying the authenticity of matcha, prevent mislabeling and counterfeiting, and contribute to strengthening traceability and quality assurance systems in the food industry. Despite the growing interest in tea authentication, origin identification specifically for matcha has rarely been investigated. This study provides the first systematic comparison of three spectroscopic techniques (FF, NIR, and FT-IR) applied to the same set of matcha samples, highlighting the unique contribution of our approach. Unlike previous studies such as Hu et al. [20] and Akiyama et al. [24], which focused on a single spectroscopic modality, this study provides the first integrated evaluation of FF, NIR, and FT-IR for matcha origin identification using standardized measurements and consistent machine learning frameworks.
2. Materials and Methods
2.1. Target Foods
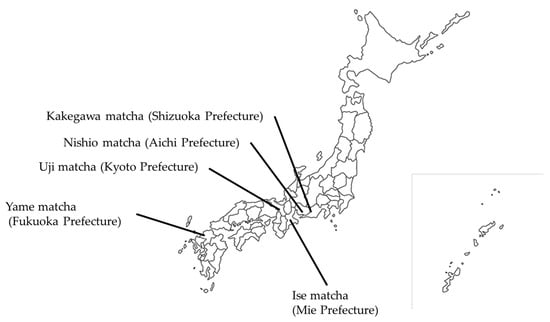
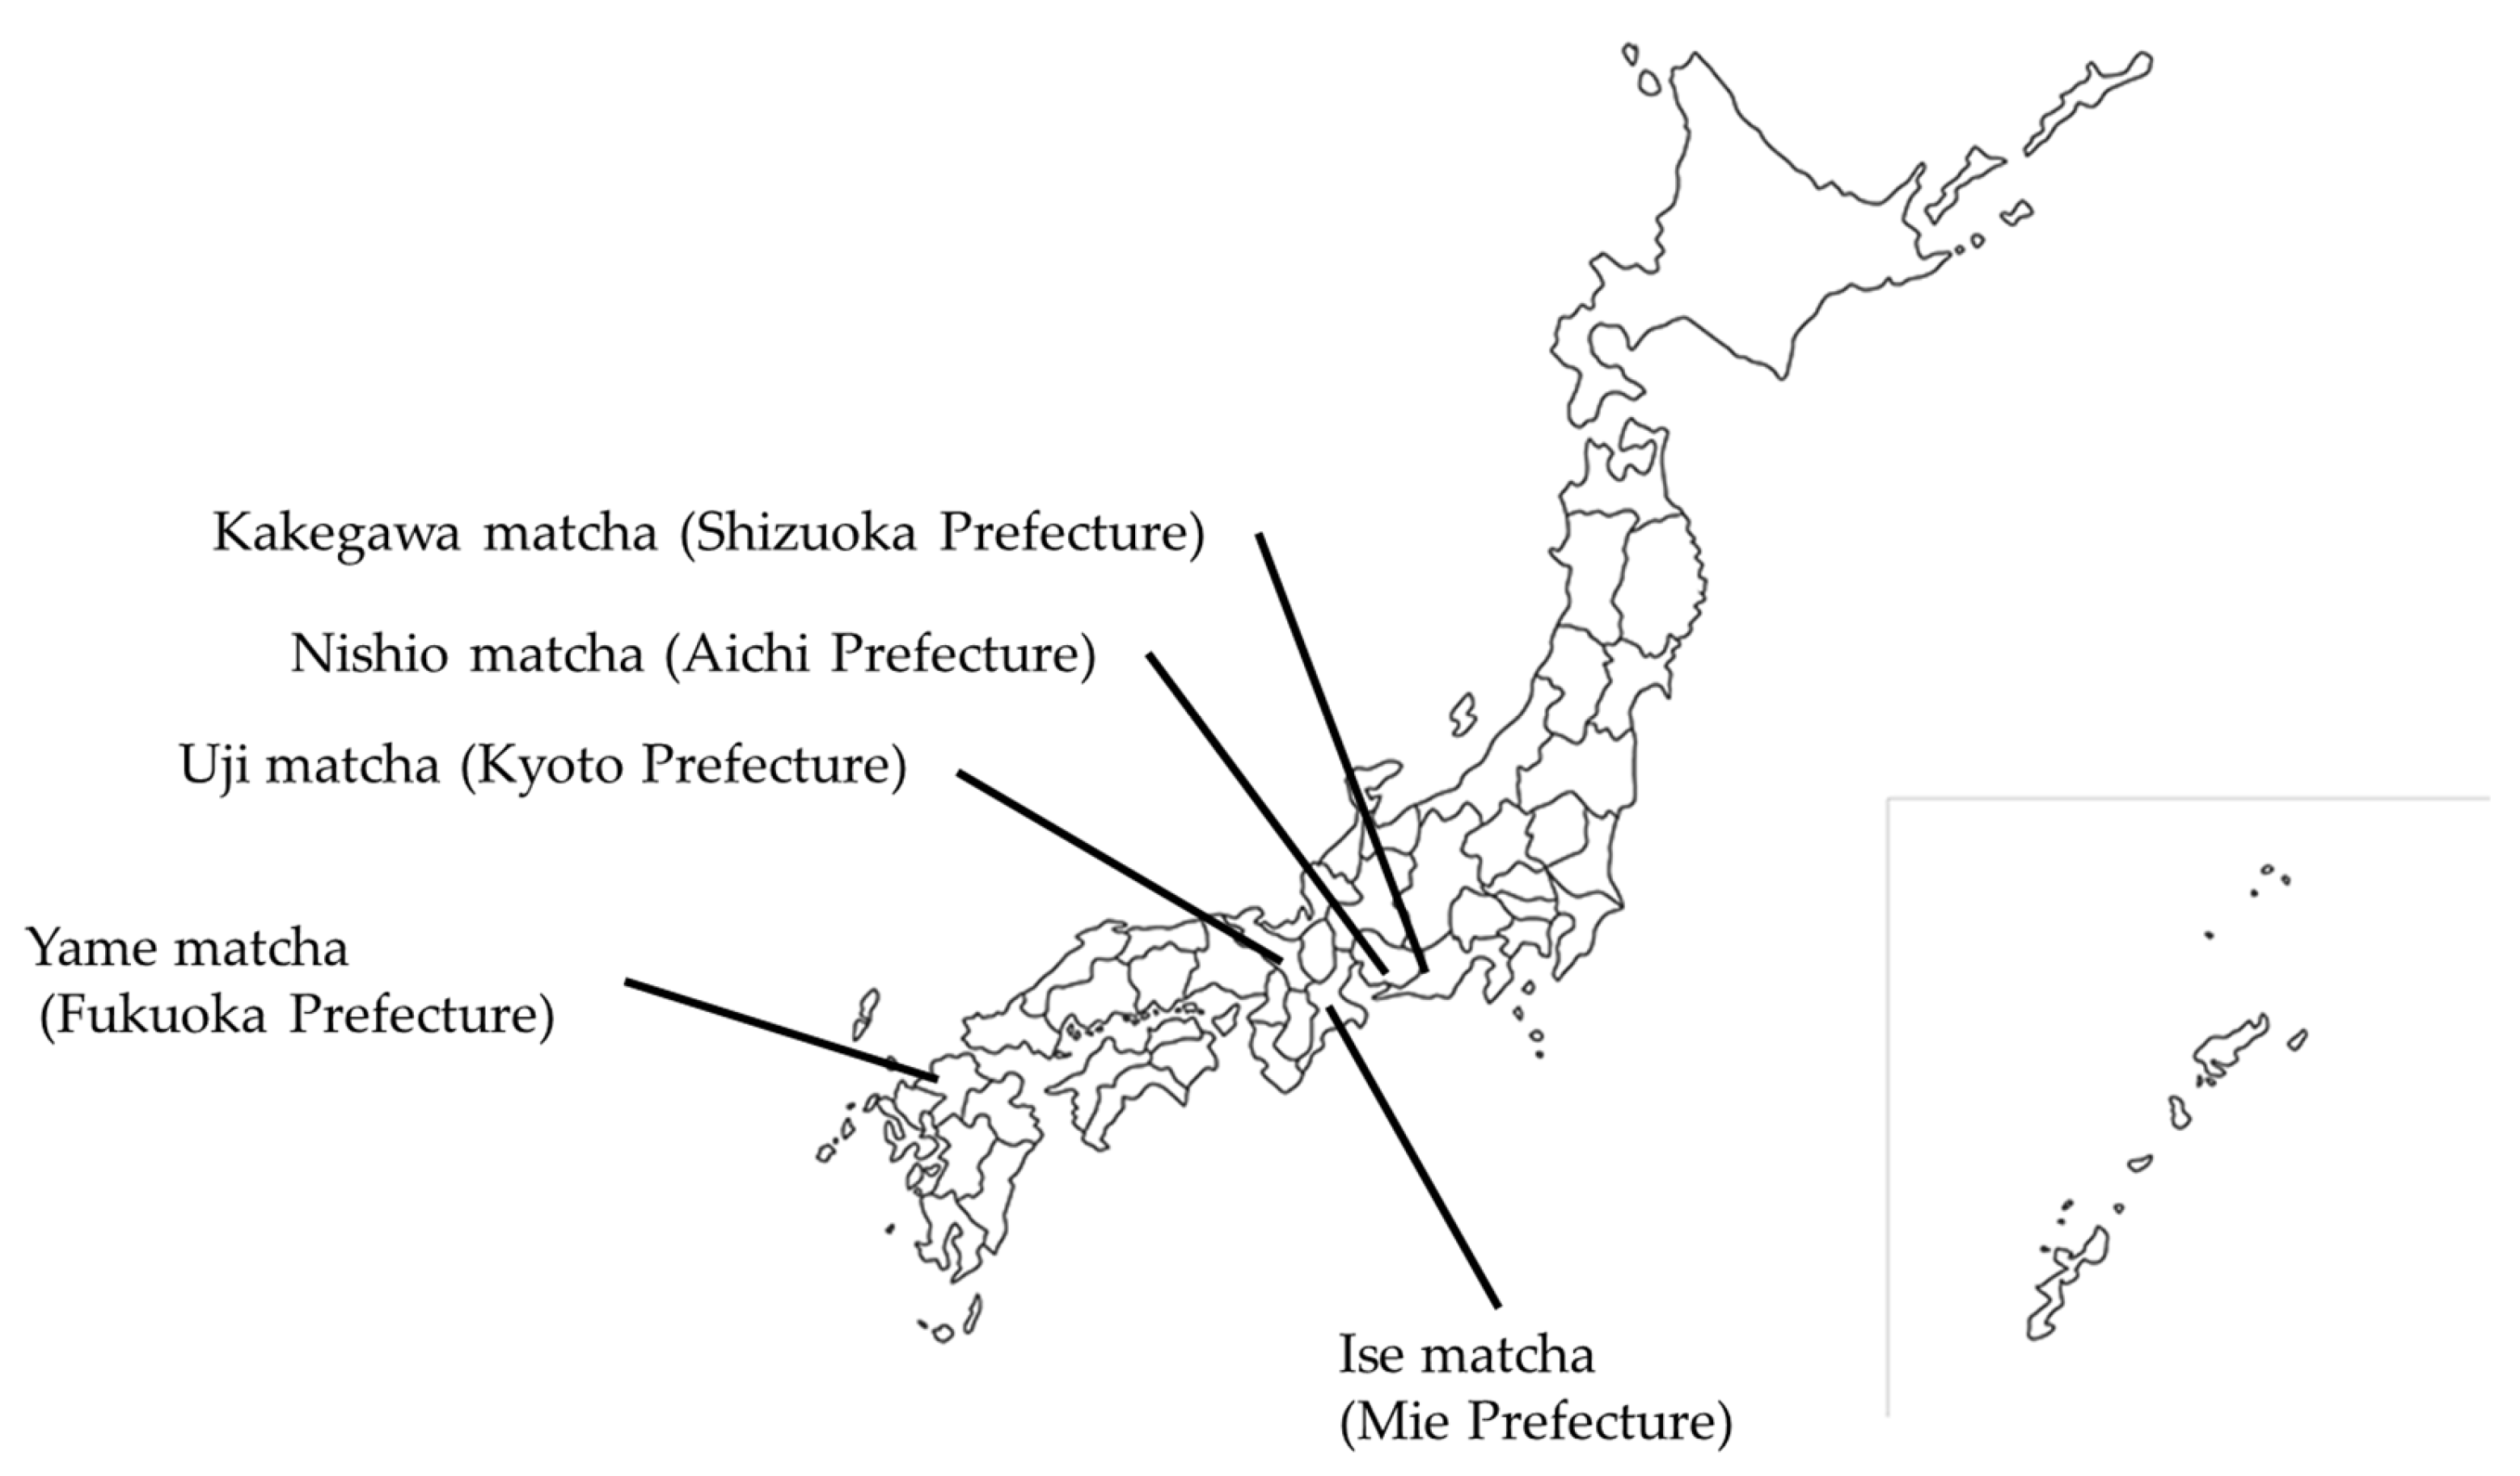
This study used matcha samples from five major matcha-producing regions in Japan: Uji, Nishio, Kakegawa, Ise, and Yame matcha from Kyoto, Aichi, Shizuoka, Mie, and Fukuoka Prefectures, respectively [32,33]. All samples were in powder form, with a moisture content typically ranging from 3% to 5%, consistent with commercially available matcha products. To ensure sample diversity, three types of products were purchased from different processors or sellers in each production region. To facilitate product identification, each product was assigned a number ranging from 1 to 15, hereafter referred to as product numbers. Samples were stored at room temperature (approximately 25 °C) and sealed after opening to prevent deterioration due to oxygen and moisture. After opening for measurement, the samples were immediately resealed in an airtight condition to prevent oxidation and moisture absorption. The original commercial packaging, made of materials with low gas permeability, served as an airtight container during storage and measurement. No pretreatment was required before measurement. Table 1 lists the production region, matcha type, and product number of each sample, and Figure 1 shows the geographic distribution of the areas within Japan where samples were collected.
Table 1.
Specimen variety and origin.
Figure 1.
Geographic locations of sample sources throughout Japan.
2.2. Acquisition of EEM Spectra and Generation of Two-Dimensional Images
EEM spectral data for the matcha samples were obtained using a FF spectrophotometer (F-7100; Hitachi High-Tech Science, Ibaraki, Japan). To ensure accuracy and re-liability, the instrument was subjected to maintenance inspections, including annual calibrations by the manufacturer, and zero adjustments were made before each measurement. One hundred independent measurements were performed for each product, resulting in 1500 EEM spectral data points. A “data point” in this context refers to one complete spectrum obtained from a single measurement. Each matcha product was regarded as one independent sample (15 samples in total). The 100 measurements obtained from each product were treated as technical replicates to capture within-product variability, not as individual biological samples. Measurement conditions were as follows: excitation wavelength range, 250–500 nm; emission wavelength range, 200–750 nm; ex-citation sampling interval, 5.0 nm; fluorescence sampling interval, 5.0 nm; excitation slit width, 5.0 nm; fluorescence slit width, 10.0 nm; photomultiplier voltage, 620 V.
A three-dimensional fluorescence matrix (FD3 file) was created from each EEM spectral data point, and the FD3 file was converted to text format (TXT file) using FL Solutions 4.2 (Hitachi High-Tech Science) analytic software. Next, a custom program created in the Python (version 3.12.12) language was used to convert the TXT files into two-dimensional images (PNG files).
The following two preprocessing steps were performed in the conversion from TXT files to two-dimensional images: (1) removal of scattered light (removing primary and secondary light at 35 nm), and (2) application of a common FF-intensity scale to all images by extraction of the maximum (10,000) and minimum FF-intensity values (52) from across all images; images were then scaled based on this value.
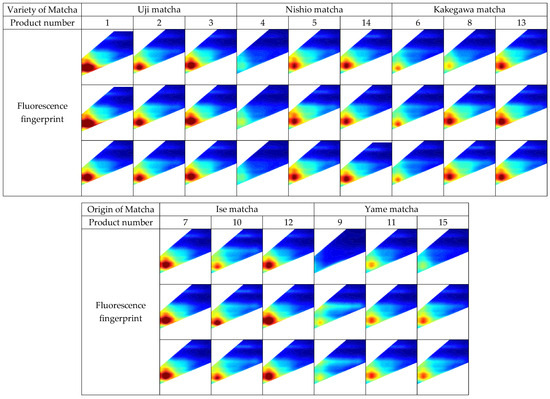
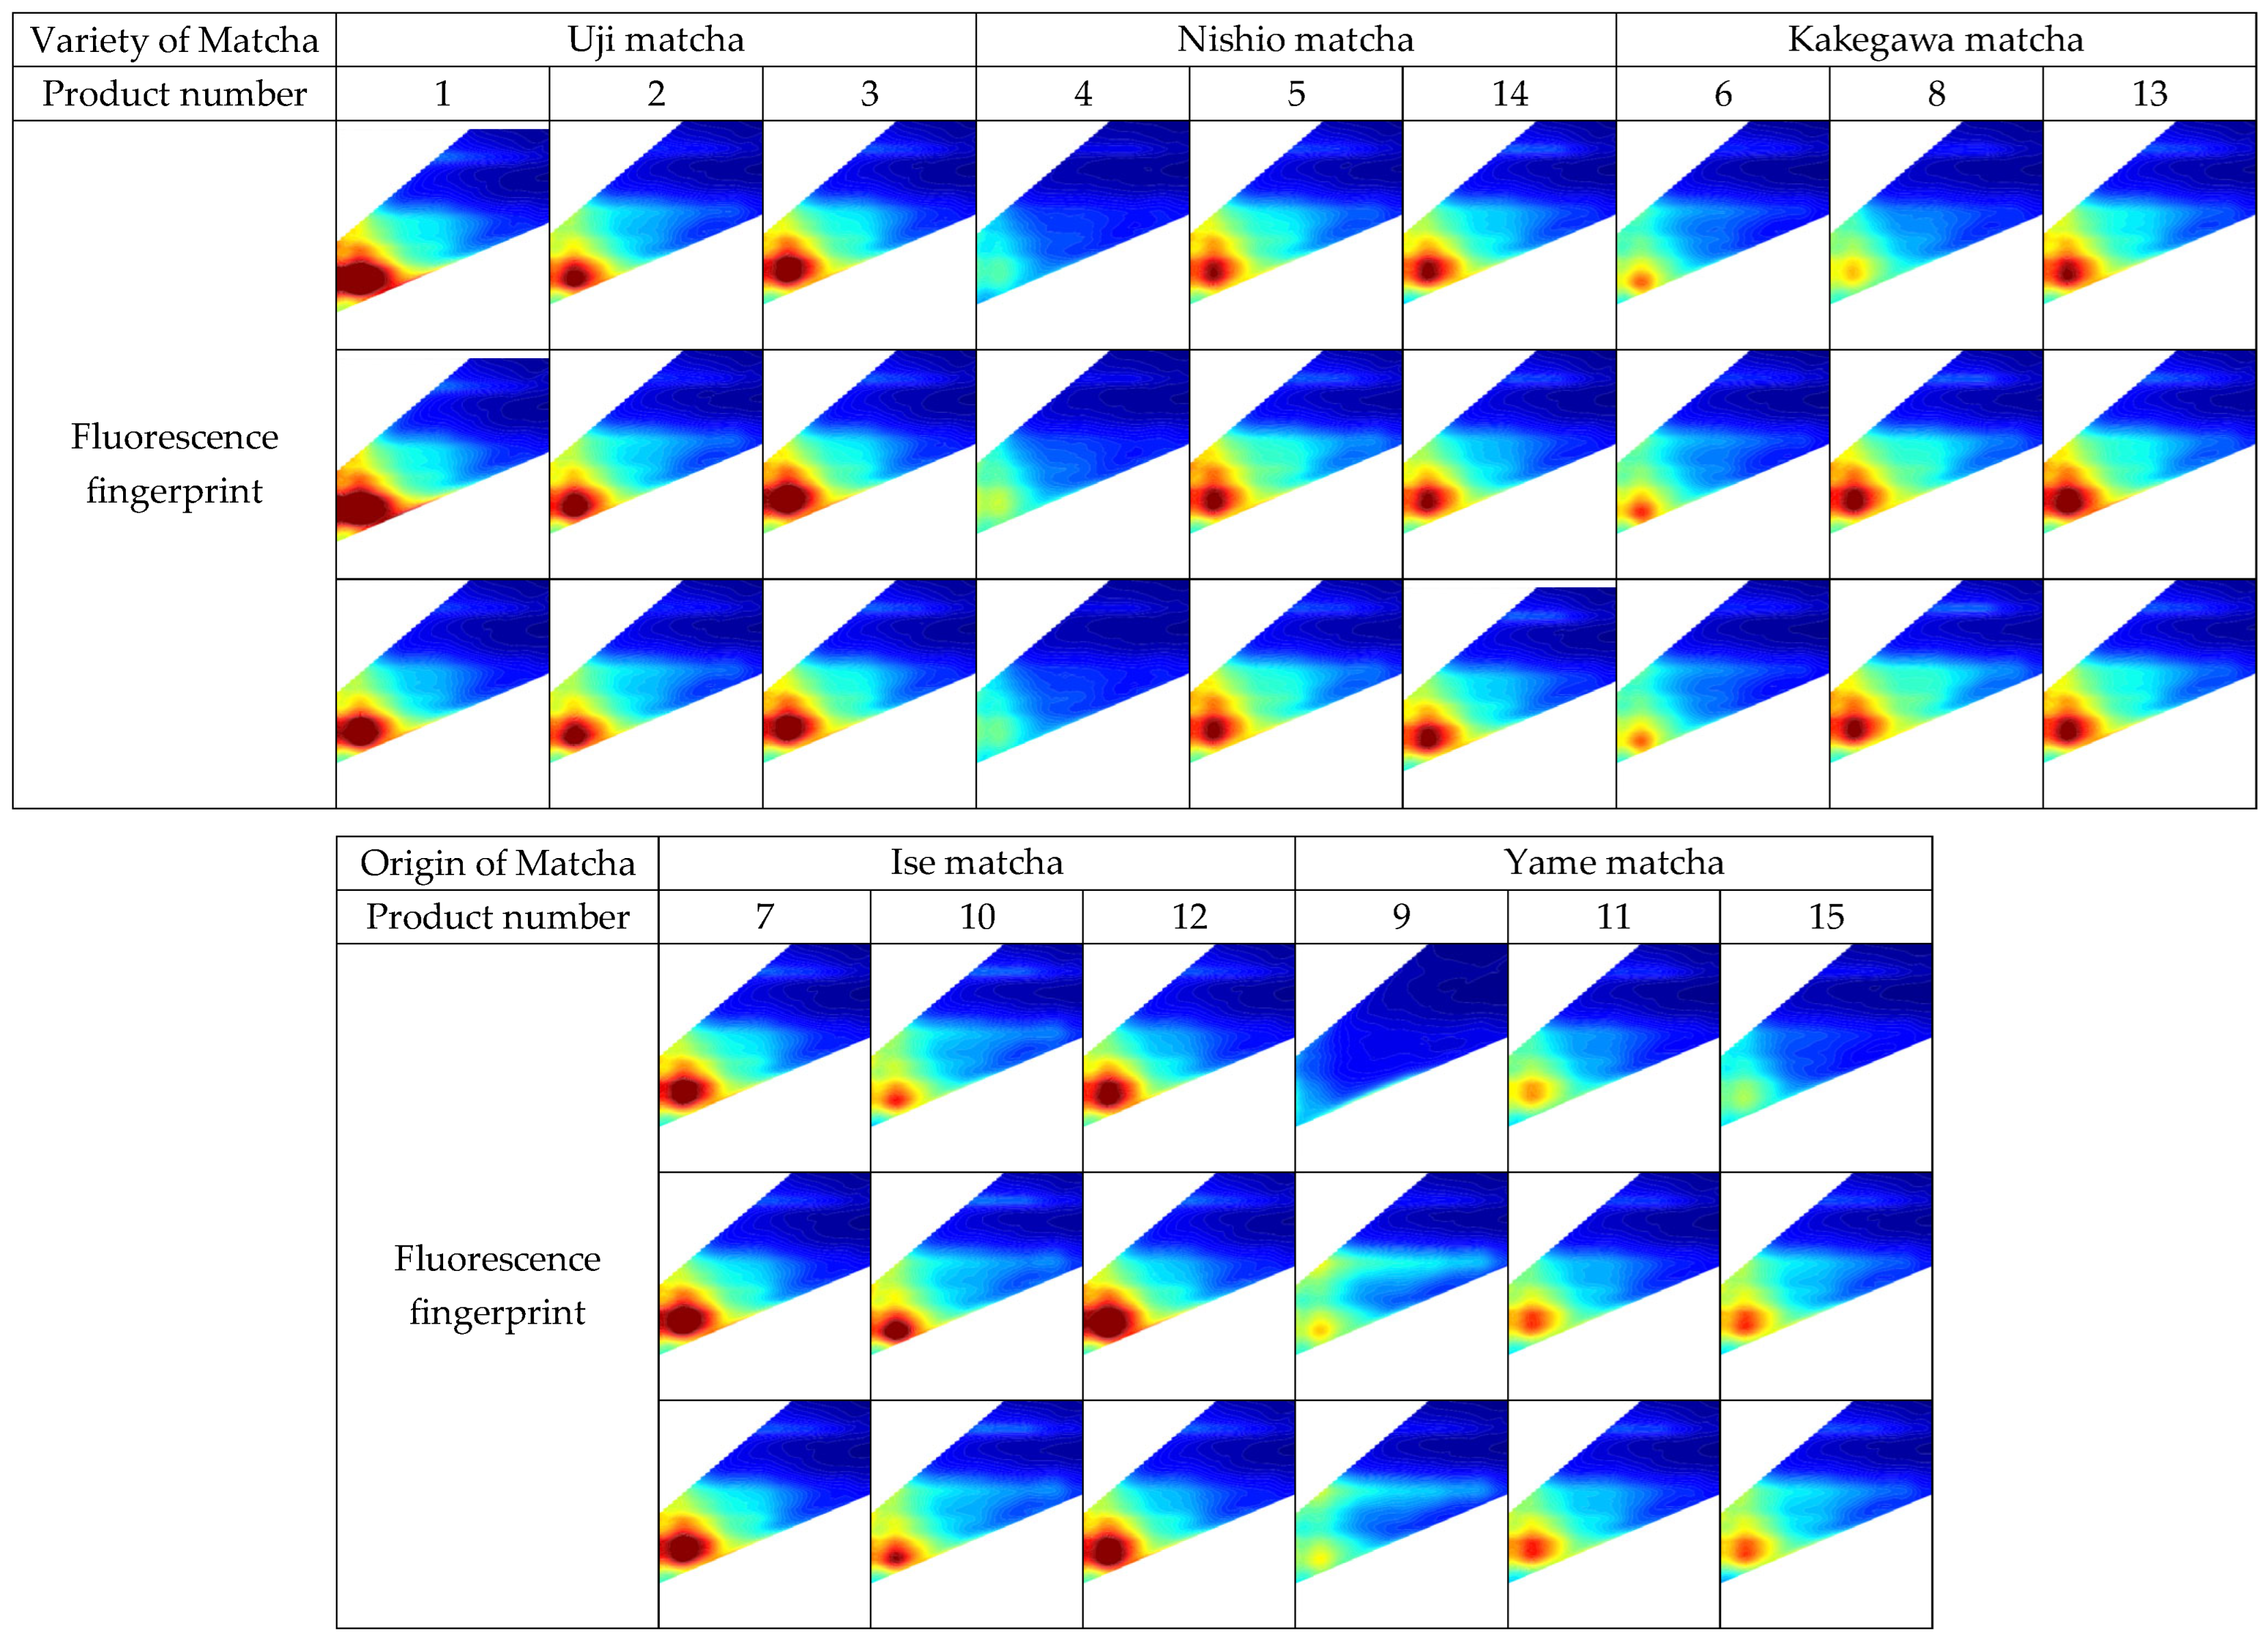
Finally, a Python program was used to crop all two-dimensional images to a uniform size of 360 × 360 pixels to unify the scale and remove unnecessary blank areas. The generated two-dimensional images were assigned file names consisting of four consecutive digits ranging from 0001 to 1500. CSV files were also created to associate the file number, origin class, and product number of each image. These two-dimensional images and CSV files were used as input data for a machine learning model. Figure 2 shows a representative two-dimensional image.
Figure 2.
Representative example of a 2D image (cropped). From left to right, the three rows show Uji, Nishio, Kakegawa, Ise, and Yame matcha. Each row indicates a different product. The x- and y-axes represent excitation (range: 250–500 nm) and emission (range: 750 nm) wavelengths, respectively.
2.3. Acquisition of NIR Spectroscopic Data
A NIR spectrometer (NIR Meter; Spectra Co-op, Tokyo, Japan) was used to measure the NIR spectra in diffuse reflectance mode. Matcha powder was measured directly without any pretreatment or the use of KBr pellets or optical fibers. Measurements were performed in the wavelength range of 900–1700 nm. A total of 100 independent measurements were performed for each product, resulting in a total of 1500 NIR spectral data points. All acquired data were compiled into a single CSV file and used as input data for a ma-chine-learning model.
Measurement conditions were as follows: wavelength range, 900–1700 nm; data type, absorbance; measurement delay time, 1.000 s; interval time, 1.000 s. Each measurement was performed with ten integrations, and no data filtering was performed. The exposure time was 0.635 ms, with one averaged scan per measurement, and the gain was set to auto. The wavelength bandwidth was set to 5.85 nm, number of divisions to 228, and interpolation interval to 1.0 nm.
2.4. Acquisition of FT-IR Spectroscopic Data
FT-IR spectral data for the matcha samples were obtained using a FT-IR spectrophotometer (IRSpirit-T; Shimadzu Corporation, Kyoto, Japan) equipped with an ATR accessory. Matcha powder was placed directly on the ATR crystal without KBr pellet preparation or other pretreatment. Measurements were performed in the wavenumber range of 400–4000 cm−1. One hundred independent measurements were performed for each product, resulting in a total of 1500 FT-IR spectral data points. Atmospheric correction was performed on the obtained spectra to eliminate the effects of atmospheric carbon dioxide and water vapor absorption. The FT-IR spectral data were corrected for atmospheric effects (e.g., CO2 and water vapor), compiled into a single Excel file, and used as input for the machine learning model. The measurement conditions were as follows: measurement mode, absorbance; apodization function, Happ–Genzel; number of integrations, forty-five; and resolution, 4.0 cm−1.
2.5. Machine Learning Model Development
All machine learning models were developed and evaluated in a Python platform (version 3.13.2) using TensorFlow (version 2.18.0), Keras (version 3.9), and Scikit-learn (version 1.5.1) as the main libraries. To identify the origin of matcha, conventional machine learning algorithms such as k-nearest neighbors (KNN), RFs, logistic regression (LR), and support vector machines (SVM) were used. Convolutional neural networks (CNNs), a deep-learning algorithm with excellent image recognition capabilities, were also used, and the EEM spectral data acquired using an FF spectrophotometer were input as two-dimensional images. The FF measurements were used as two-dimensional fingerprint images generated from the EEM matrices, whereas the NIR and FT-IR measurements were treated as one-dimensional spectral profiles. These formats served as the inputs for the respective machine learning models. Each matcha product was treated as one independent sample, and the 100 spectral measurements obtained from each product were considered technical replicates to capture within-product variability rather than separate biological samples. Matcha powder is highly homogeneous because of its fine particle size. For each product, the 100 spectra were acquired by repeatedly taking small portions of the powder from different locations within the container prior to each measurement. This procedure ensured that each scan reflected a slightly different micro-area of the sample and minimized potential spatial bias. For the model that did not use a CNN algorithm, 1500 measurement data points (FF intensity or absorbance) were stratified based on the product number to reduce bias in the origin and product, and then divided into training and test data in an 8:2 ratio (training data: 1200; test data: 300). The split was performed using stratified sampling (stratified train–test split) to ensure proportional representation of all origins and product numbers. Each combination of data type and model was tested once.
For the model that used a CNN, 1500 measurement data points were similarly stratified based on the product number and first divided into training/validation data (combined) and test data at an 8:2 ratio. The combined training/validation data were further divided at an 8:2 ratio, resulting in 960 training, 240 validation, and 300 test data points. To ensure reproducibility of each split, the seed for the random state was set to 42. Ten trials were performed for each algorithm and data-type combination, and the average of the 10 evaluation metrics was used to evaluate algorithm performance.
This architecture consisted of three convolutional layers and two fully connected layers, with rectified linear unit (ReLU) activation and max pooling applied to each convolutional block. L2 regularization and dropout layers were introduced to prevent overfitting. The training conditions were as follows: optimizer, Adam; loss function, categorical cross-entropy; evaluation metric, accuracy; epochs, 100; batch size, sixteen.
The KNN, RF, LR, and SVM architectures were implemented using the Python scikit-learn library. All parameters were set to default settings. For these traditional machine learning models, no hyperparameter tuning was performed beyond the default settings. For the CNN model, the architecture was fixed based on preliminary experiments, and only the learning rate was adjusted according to validation performance.
To evaluate the model performance, precision, recall, and the F1-score (harmonic mean) in addition to classification accuracy were used. These performance metrics were calculated from true positives (TP), false positives (FP), and false negatives (FN). In addition, support for a class is the number of samples included in that class (corresponding to origin in this study), and was used to supplement the distribution bias when interpreting values such as precision and recall.
3. Results
3.1. Comparison of Classification Performance Among Different Spectroscopic Methods
Three types of spectroscopic data (FF, NIR, and FT-IR) were used to identify the origin of matcha by applying the optimal machine learning algorithm to each. Table 2, Table 3, Table 4, Table 5, Table 6, Table 7, Table 8 and Table 9 present the classification accuracies, confusion matrixes, and key evaluation metrics (precision, recall, F1-score, and support) of each model.
Table 2.
Classification accuracy of machine learning models using fluorescence fingerprint data (single algorithm case).
Table 3.
Performance metrics (Convolutional neural network using fluorescence fingerprint data).
Table 4.
Average confusion matrix (Convolutional neural network using fluorescence fingerprint data).
Table 5.
Comparison of classification accuracy across algorithms for NIR and FT-IR spectroscopy. (single algorithm case).
Table 6.
Confusion matrix (NIR, KNN).
Table 7.
Precision–recall (NIR, KNN).
Table 8.
Confusion matrix (FT-IR, RF).
Table 9.
Precision–recall (FT-IR, RF).
When using FF fingerprint data, the CNN model demonstrated the highest classification performance, with an average accuracy of 0.9573 across 10 independent experiments (Table 2). The CNN effectively learned the spatial and spectral features of the EEM data represented as two-dimensional images, outperforming the other algorithms (accuracies of the other algorithms: KNN, 0.9266; RF, 0.9433; LR, 0.7733; SVM, 0.5266). Precision, recall, and F1-score all exhibited high values, averaging around 0.93 (Table 3), with particularly high recall rates (>0.95 for Uji and Ise matcha samples). However, Kakegawa matcha was most frequently misclassified as Nishio matcha (an average of 4.4 out of 300 test samples across 10 trials), and the F1-scores for Kakegawa and Yame matcha samples tended to be slightly lower than those for matcha from other localities (Table 4).
For NIR spectral data, the KNN model demonstrated the highest classification performance, achieving a test accuracy of 0.9866 (Table 5). The RF model was next at 0.9800, whereas the LR (0.6100) and SVM (0.7266) models exhibited significantly lower accuracies. The average precision, recall, and F1-score were all very high, at 0.99 (Table 6), and Uji, Nishio, and Yame matcha were perfectly distinguished. However, as shown in the confusion matrix (Table 7), Kakegawa matcha was most frequently misclassified as Yame matcha, with an average of 2.5 out of 300 test samples across 10 trials, and the F1-scores for Nishio and Kakegawa matcha tended to be slightly lower than those for matcha from other regions.
For FT-IR spectral data, the RF model demonstrated the highest accuracy (0.9900), followed by the KNN model (0.9866) (Table 5). These models appear to have accurately extracted origin-specific chemical signatures from absorption spectra from molecular vibrations and functional groups in powdered matcha. The precision, recall, and F1-score were extremely high, at approximately 0.99 (Table 8), confirming the stability and reliability of the classification results. Yame matcha was most frequently misclassified as Ise matcha (1.5 times on average), and the F1-scores for Ise matcha and Yame matcha tended to be slightly lower than those for matcha from other origins (Table 9). In contrast, Uji matcha exhibited the highest F1-score across all spectroscopic methods, with almost no misclassification as originating from other localities.
Overall, the FT-IR–RF model had the highest classification accuracy (99.0%), followed by the NIR–KNN (98.7%) and FF–CNN (95.7%) models. Across all the spectroscopic methods, the KNN and RF algorithms performed better than the LR and SVM algorithms. The precision, recall, and F1-score were all above 0.93, confirming high re-producibility and versatility. These results indicate that the tendency for misclassification differed depending on the type of spectroscopic data used and also suggest that the most readily distinguishable spectral characteristics differ depending on the origin. In particular, Uji matcha maintained a high F1-score across all the spectroscopic data, demonstrating the most stable identification results. These results demonstrate that selecting the optimal algorithm according to the characteristics of the spectroscopic method is effective for maximizing the accuracy of matcha origin identification.
3.2. Feature Importance in NIR and FT-IR Models
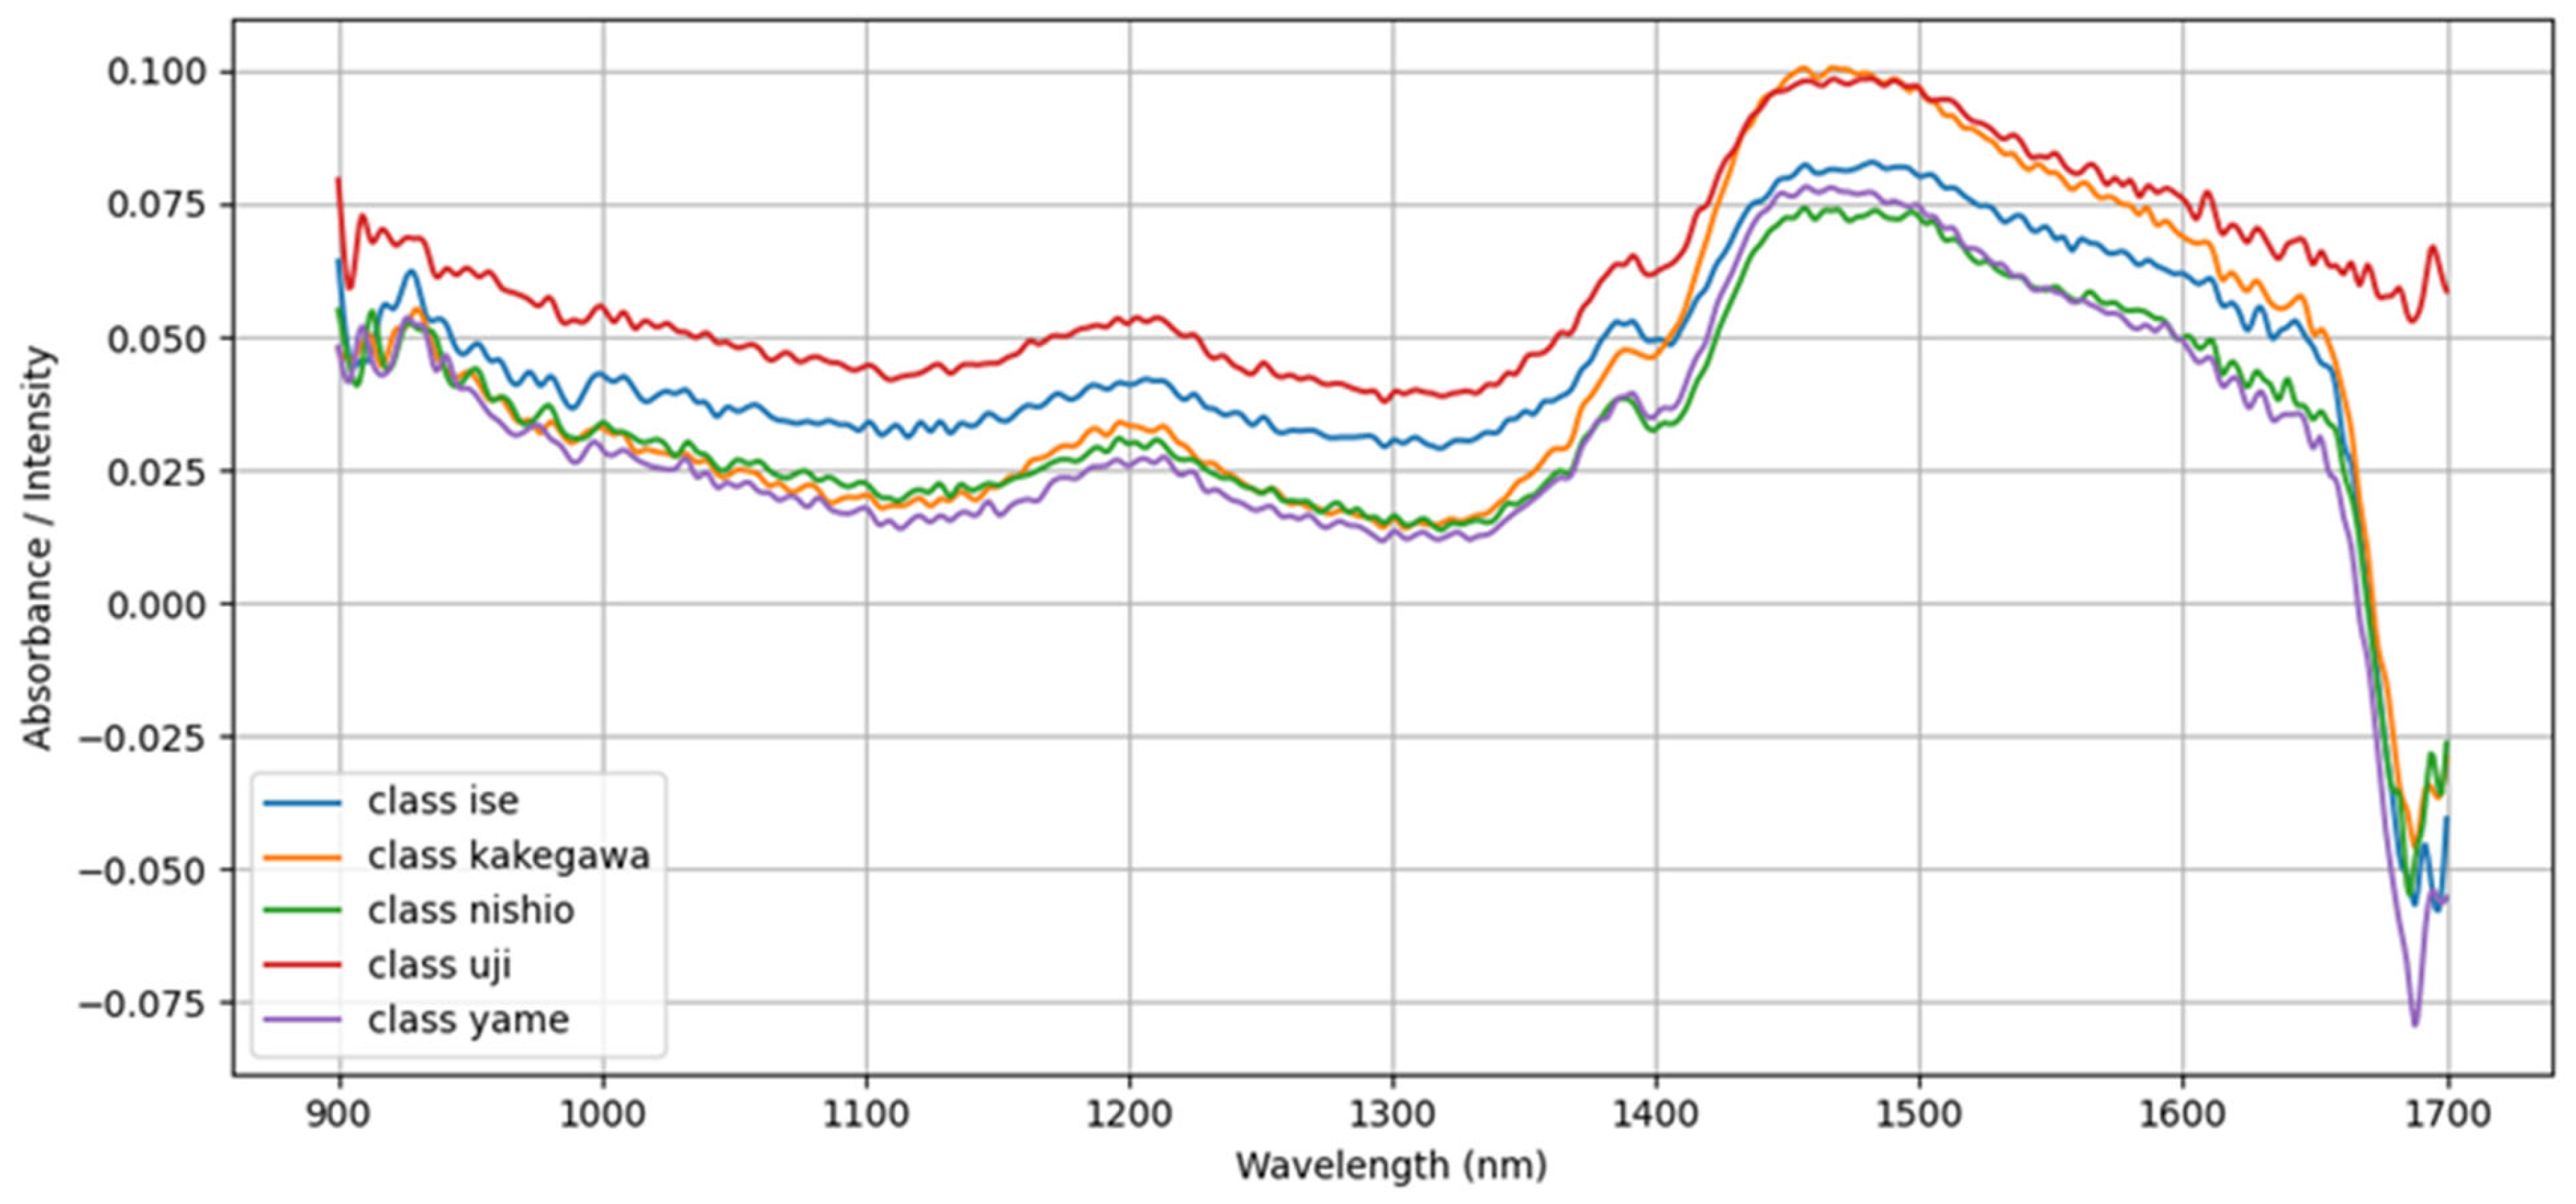
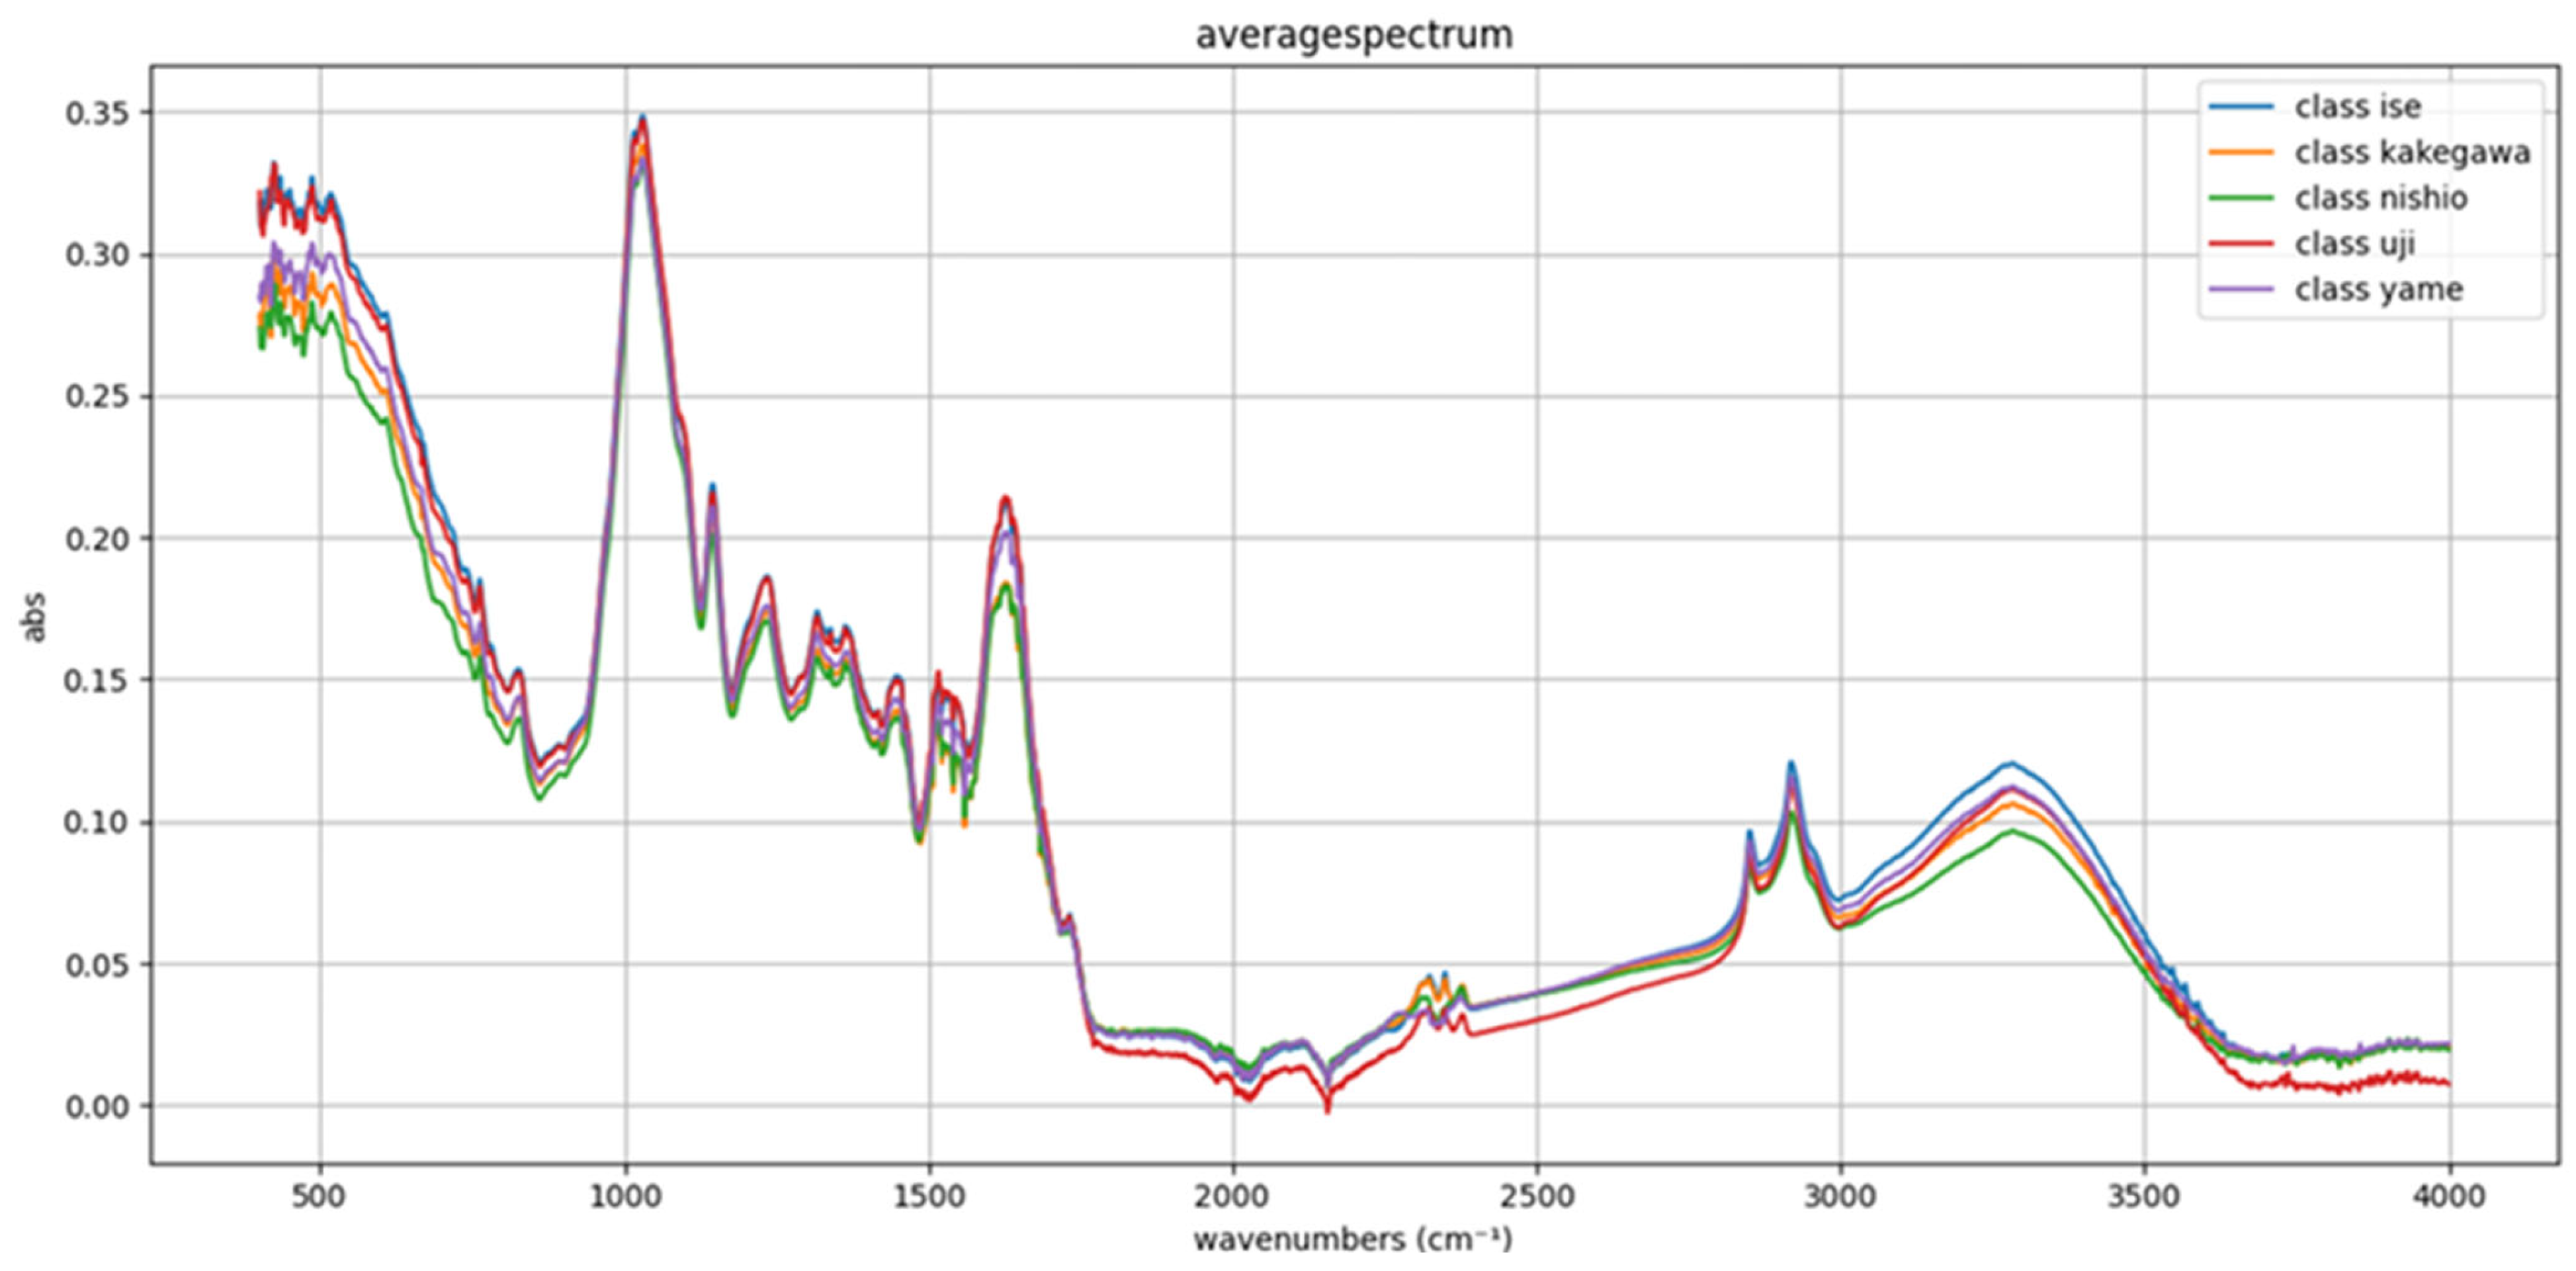
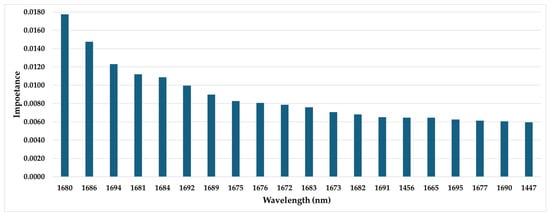
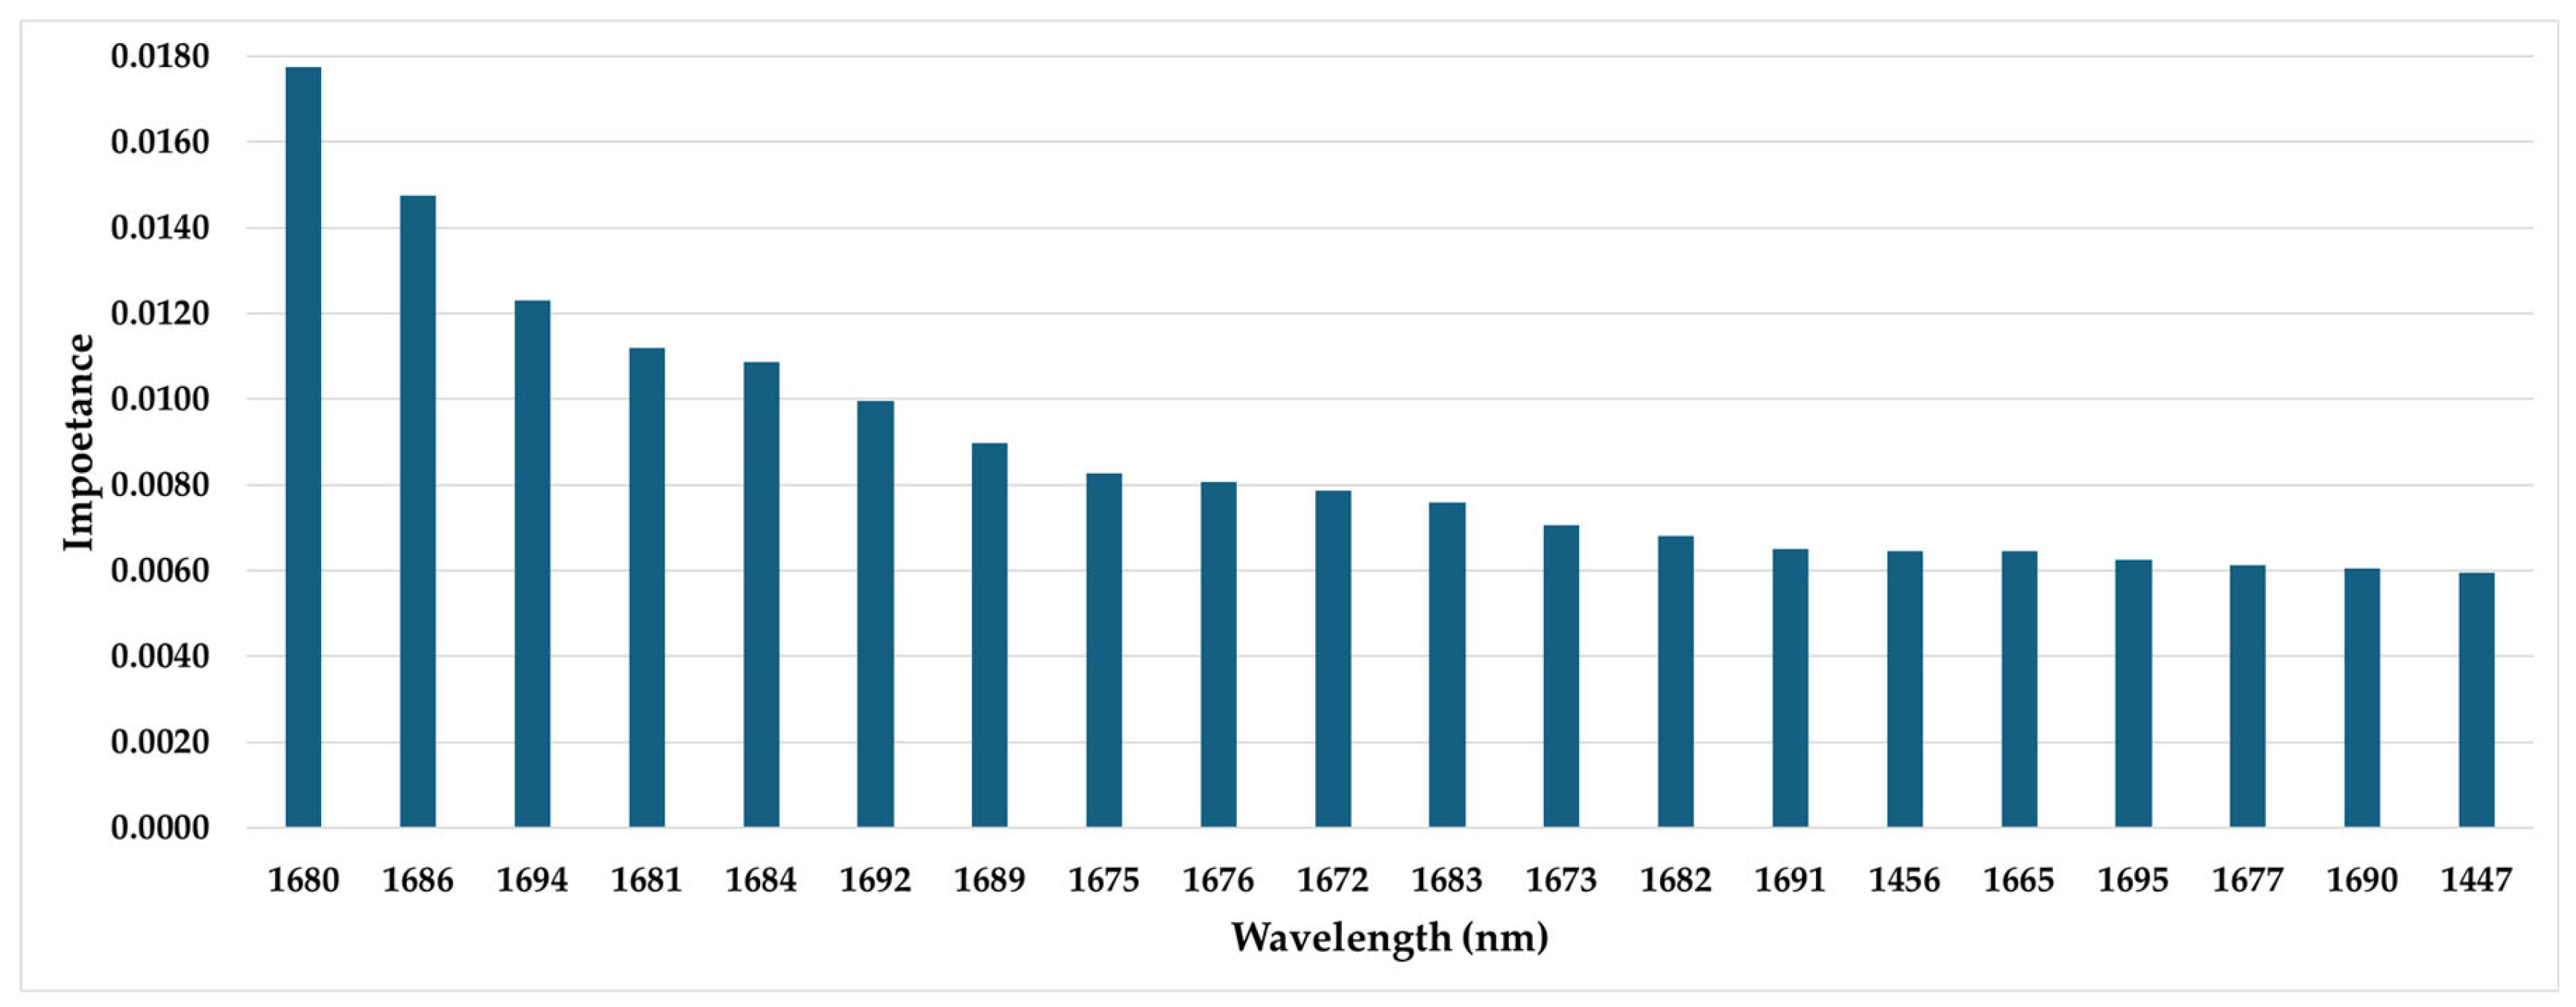
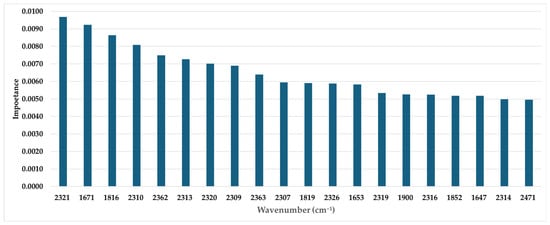
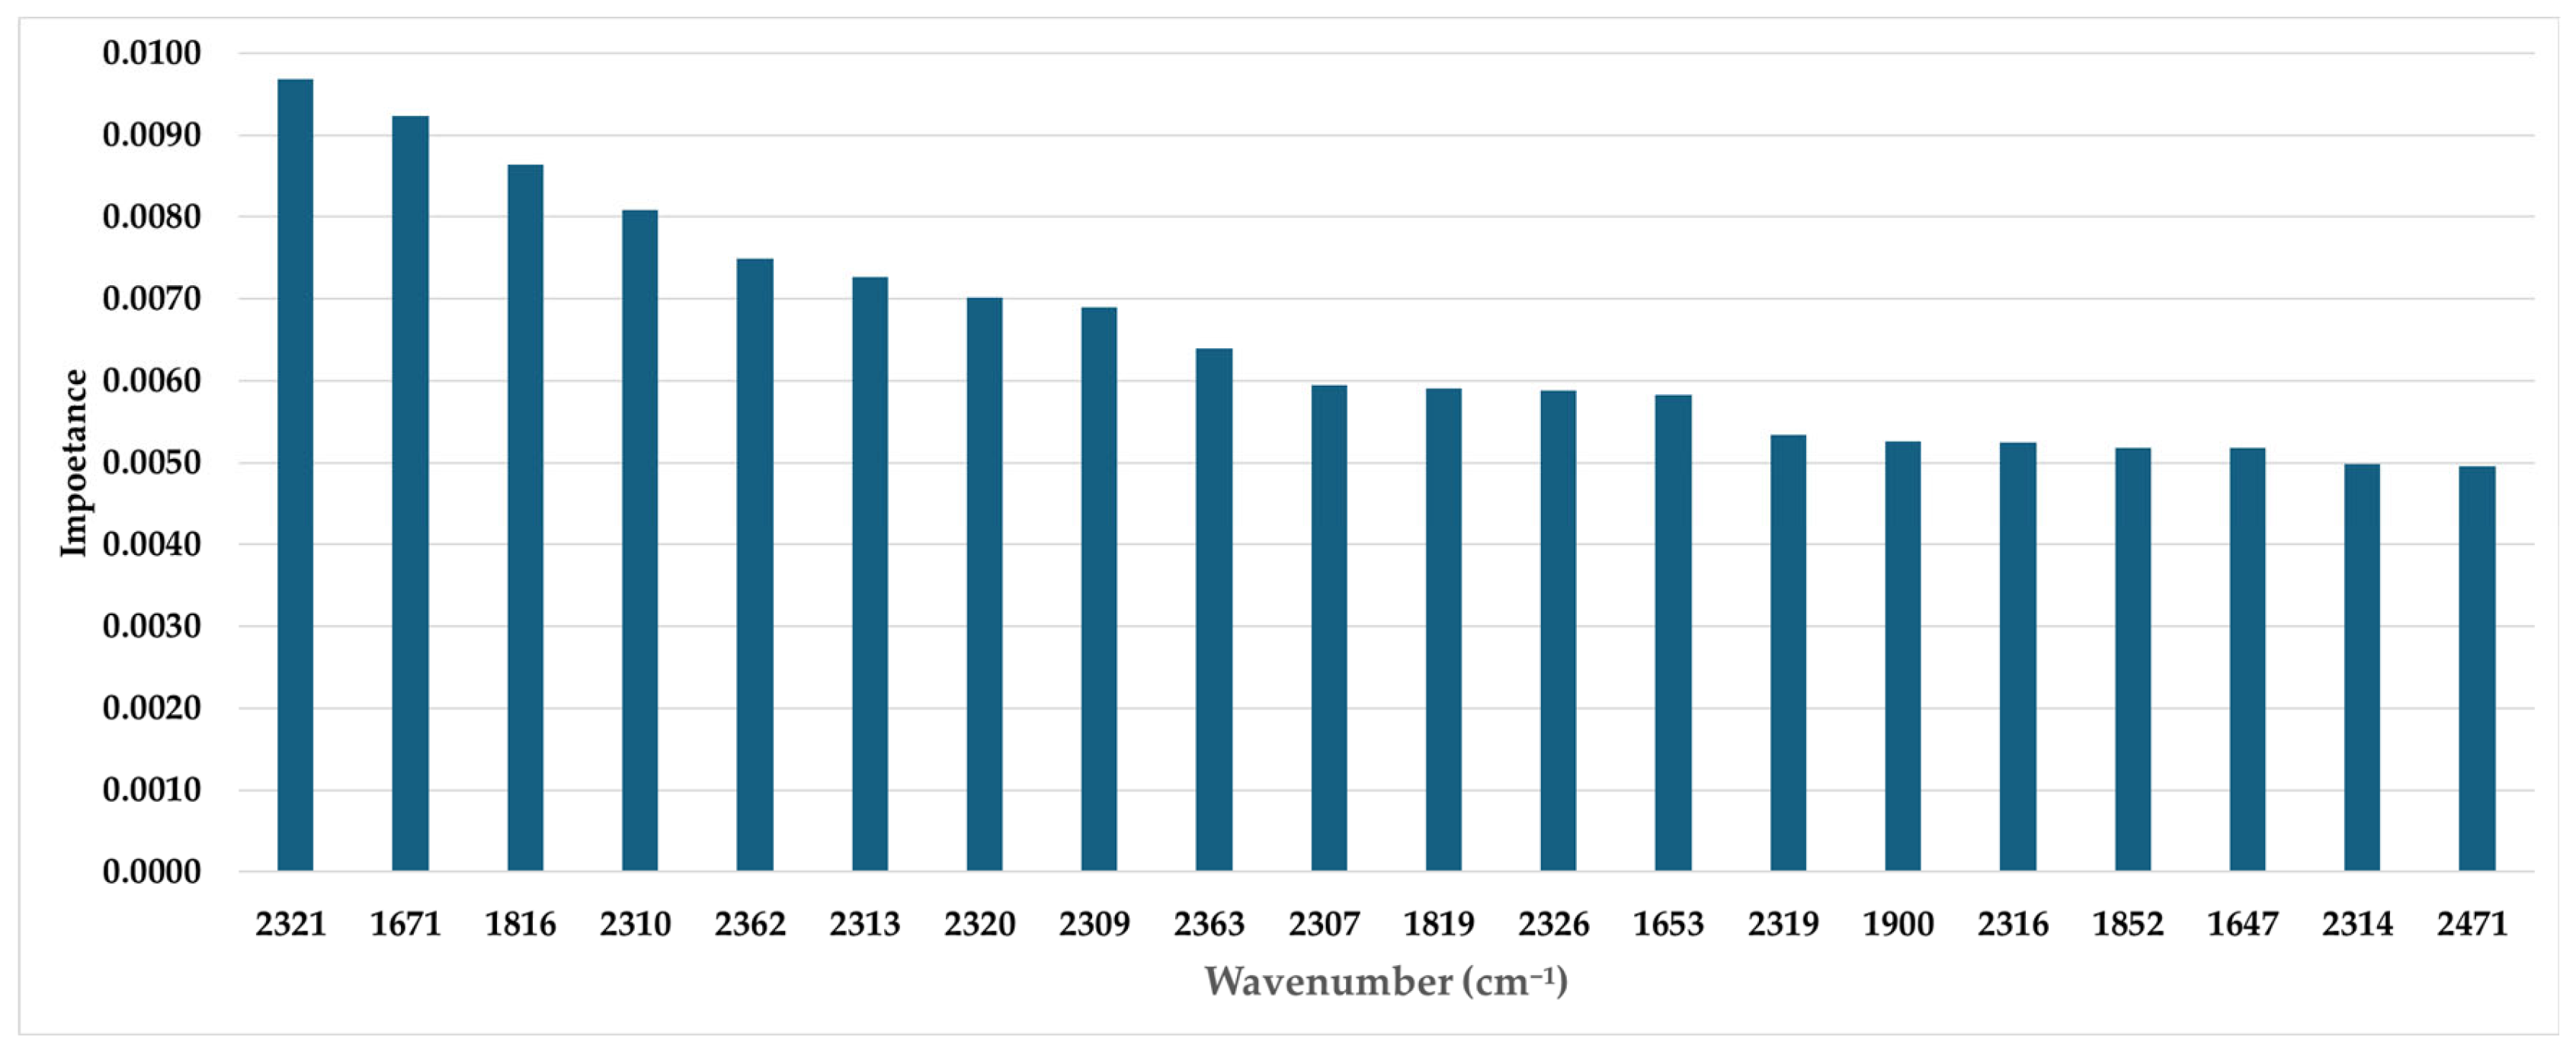
Figure 3 and Figure 4 show the average NIR and FT-IR spectra, respectively. Figure 5 and Figure 6 show the feature importances of wavelength and wavenumber, respectively, for RF model. feature importance was calculated based on the mean decrease in impurity (Gini importance) in the RF model, which quantifies the relative contribution of each variable to the model’s classification accuracy. A higher importance value indicates that the corresponding wavelength or wavenumber plays a more significant role in distinguishing the production regions.
Figure 3.
Near-infrared spectral analysis using k-nearest neighbors algorithm. The x-axis represents wavelength (nm, 900–1700 nm), and the y-axis represents absorbance.
Figure 4.
Feature importance profile obtained from the random forest model using FT-IR spectral data for origin identification. The x-axis represents wavenumber (cm−1), and the y-axis represents feature importance.
Figure 5.
Feature importance profile obtained from the random forest model using NIR spectral data for origin identification. The x-axis represents wavelength (nm), and the y-axis represents feature importance.
Figure 6.
Feature importance profile obtained from the random forest model using fluorescence fingerprint (FF) data for origin identification. The x-axis represents wavelength (nm), and the y-axis represents feature importance.
In the NIR spectrum (Figure 3), multiple absorption peaks were observed in the 900–1700 nm range, with clear absorption bands particularly appearing near 1000–1300 and 1450–1550 nm. These wavelength ranges are regions of overlap between the ab-sorption bands of O–H and C–H bonds. Feature importance values in the RF model (Figure 5) were generally low, with a maximum of less than 0.018. Specific wavelengths did not exhibit particularly high contributions, and the importance was distributed across a wide wavelength range.
In the FT-IR spectrum (Figure 4), characteristic absorption bands were observed around 1000–1800 and 2800–3000 cm−1. The former region encompasses absorption bands related to functional groups such as C=O, C–N, C–O, and O–H, whereas the latter corresponds to the region of C–H stretching vibrations. The maximum importance value was less than 0.010 (Figure 6), and, as with NIR, no tendency toward specific wavenumbers having greater importance was observed. Importance showed a localized increase mainly in the 1000–1800 cm−1 range, with gradual fluctuations also observed in the 2800–3000 cm−1 range.
These results confirm that in both the NIR and FT-IR data, no contributions concentrated at specific wavelengths or wavenumbers were present, and that spectral in-formation across a wide range contributed to the performance of the RF model.
4. Discussion
Of the three methods in combination with different machine learning algorithms, the FT-IR–RF model demonstrated the highest classification accuracy (99.0%), followed by the NIR–KNN (98.7%) and FF–CNN (95.7%) models. The differences in accuracy can be attributed to the type of chemical information emphasized by each spectroscopic method. FT-IR captures functional-group vibrations that reflect subtle compositional differences among regions, NIR reflects bulk components such as moisture and carbohydrates, and FF highlights fluorescent compounds such as amino acids and catechins. These distinctions explain the variation in model performance. This result indicates that the differences in the chemical sensitivity of each spectroscopic method and the combination of algorithm characteristics substantially affect the identification accuracy. The FT-IR bands contributing to discrimination overlap with functional groups associated with polyphenols, catechins, and amino acids, while the important NIR wavelengths correspond to O–H and C–H overtone and combination bands related to moisture, carbohydrates, and proteins. These chemical features reflect regional differences in key constituents of matcha and help explain the discriminatory power observed across the models.
The high accuracy of the FT-IR method is attributed to its ability to distinguish subtle differences in the molecular structures of amino acids, sugars, lipids, and other components of matcha through functional group absorption bands such as C=O, C–N, C–O, and O–H observed around 1000–1800 cm−1 and 2800–3000 cm−1. These characteristic absorption bands are clearly visible in the average FT-IR spectrum (Figure 4), indicating the main functional groups that contribute to the identification of geographic origin. Furthermore, the feature importance of the random forest model (Figure 6) also emphasized similar wavenumber regions, confirming that these absorption characteristics functioned as chemical fingerprints of regional differences.
In contrast, as shown in Figure 3 and Figure 5, the NIR method showed relatively large contributions from the absorption bands around 1000–1300 and 1450–1550 nm. These regions are associated with O–H and C–H bonds and are likely dominated by signals reflecting moisture and carbohydrates. Differences in leaf moisture content and drying conditions during processing are likely responsible for these differences [28,29]. The moisture content of all matcha samples was approximately 3–5%, which is within the normal range for commercial matcha products; thus, the observed spectral variations may reflect subtle differences in water-binding states rather than bulk moisture content. These results demonstrate that NIR and FT-IR are complementary because they can extract structural information on the main chemical components of matcha nondestructively.
A CNN model applied to FF spectroscopy also demonstrated a high discrimination accuracy of over 95%. FF fingerprint images reflect the distribution of fluorescent compounds such as amino acids (especially tryptophan and tyrosine), catechins, and polyphenols. This is likely attributable to the image-analysis-specific ability of CNNs to effectively learn both spectral patterns and spatial intensity distributions [25,26,27]. In particular, the peak near the 280-nm excitation wavelength suggested the fluorescence of amino acids, whereas the peaks near 340–440 nm suggested the fluorescence of glycation end-products and polyphenols. These chemical differences provided the basis for origin identification.
The frequent misclassification between Kakegawa and Nishio matcha samples may be due to the similarity in their chemical compositions, resulting from warm climates and similar tea-making processes (steaming and drying conditions) in both regions. Conversely, Uji matcha showed the highest F1-scores for both spectroscopic methods, suggesting that the consistency of its chemical properties, derived from its longstanding traditional covered cultivation and unique steaming method, contributed to its high identification accuracy.
All data analyses and model developments were performed in a unified Python environment, and different spectroscopic methods were compared under the same conditions, which allowed for a pure evaluation of the performance differences between the algorithms.
Although all samples were purchased commercially in 2025, this can also be considered a strong point of the present study, as it reflects the actual variability of market products. Differences in harvest year, storage conditions, and processing conditions among the samples likely existed; however, the evaluated models showed robust classification performance under these realistic conditions. Differences in climatic conditions (rainfall, sunshine duration, and average temperature) and production period may have affected the spectral characteristics through changes in the concentrations of catechins, theanine, chlorophyll, polyphenols, etc., in tea leaves. Therefore, the identification accuracy obtained in this study should be interpreted as a relative comparison for the same year and conditions. Future work will require the collection of data from multiple years and harvesting seasons to develop models that consider annual variations and differences between production lots. The number of independent products was limited to 15, and the applicability of the models to additional regions or production years has not yet been verified. These factors should be considered as limitations when interpreting the results. Because all measurements were acquired using a single instrument for each spectroscopic technique, the transferability of the developed models to other spectrometers has not yet been examined. Future work will require evaluating instrument dependence and exploring calibration-transfer or standardization methods to ensure broader applicability.
Furthermore, multimodal analysis integrating three spectroscopic techniques (FF + NIR + FT-IR) has the potential to improve identification accuracy and versatility by leveraging the complementary characteristics of each method. In particular, hybrid learning that integrates different types of spectroscopic information (e.g., feature fusion and ensemble learning) is expected to be effective in food authenticity assessment and quality traceability applications.
The results of this study can be applied not only to matcha, but also to other agricultural products and processed foods. They provide a technological foundation for verifying product authenticity, certifying origin, and protecting brand value through rapid nondestructive analysis. In the future, this may contribute to preventing recalls, combating food fraud, and strengthening international food traceability.
5. Conclusions
High accuracy in identifying the origin of Japanese matcha was achieved by combining three nondestructive spectroscopic methods (FF, NIR, and FT-IR) with multiple machine learning algorithms. Among these, the FT-IR–RF model showed the highest accuracy (99.0%), followed by NIR–KNN and FF–CNN, indicating that each spectroscopic method captures different chemical characteristics of matcha. NIR reflects absorption bands related to moisture and carbohydrates, FT-IR captures functional-group-based molecular structures, and FF represents fluorescent components such as amino acids and catechins. Leveraging these differences enabled rapid and nondestructive origin identification that is difficult to achieve with conventional chemical analysis.
Future challenges include validating samples from multiple years and developing models that account for temporal variations. The proposed approach may also be applicable to other teas, agricultural products, and processed foods for authenticity verification and traceability enhancement. Overall, combining nondestructive spectroscopic analysis with machine learning offers a promising analytical platform for food quality assurance and origin certification.
Author Contributions
Conceptualization, T.M.; methodology, M.T.; software, M.T., R.A. and T.M.; validation, T.M.; data curation, M.T. and M.K.; writing—original draft preparation, M.T.; review, M.Y. and Y.L.; writing—review and editing, T.M.; project administration, T.M.; funding acquisition, T.M. All authors have read and agreed to the published version of the manuscript.
Funding
This work was supported by JSPS KAKENHI (grant number JP25K05727; https://www.jsps.go.jp/j-grantsinaid/16_rule/rule.html (accessed on 30 September 2025).
Institutional Review Board Statement
Not applicable.
Informed Consent Statement
Not applicable.
Data Availability Statement
The raw data supporting the conclusions of this article will be made available by the authors on request.
Conflicts of Interest
The authors declare no conflicts of interest.
Abbreviations
The following abbreviations are used in this manuscript:
| CNN | convolutional neural network |
| FF | fluorescence |
| FT-IR | Fourier transform infrared |
| KNN | k-nearest neighbor algorithm |
| LR | logistic regression |
| NIR | near-infrared spectroscopy |
| RF | random forest |
| SVM | support vector machine |
References
- ISO 20715:2023; Tea—Classification of Tea Types. ISO: Geneva, Switzerland, 2023. Available online: https://www.iso.org/obp/ui/en/#iso:std:iso:20715:ed-1:v1:en (accessed on 30 September 2025).
- Hou, Z.; Jin, O.; Gu, Z.; Zhang, R.; Su, Z.; Liu, S. 1H NMR spectroscopy combined with machine-learning algorithm for origin recognition of Chinese famous green tea Longjing tea. Foods 2024, 13, 2702. [Google Scholar] [CrossRef] [Scilit] [PubMed]
- Chen, Q.; Zhao, J.; Fang, C.H.; Wang, D. Feasibility study on identification of green, black and Oolong teas using near-infrared reflectance spectroscopy based on support vector machine (SVM). Spectrochim. Acta Part A 2007, 66, 568–574. [Google Scholar] [CrossRef] [Scilit] [PubMed]
- Yang, J.; Wang, J.; Lu, G.; Fei, S.; Yan, T.; Zhang, C.; Lu, X.; Yu, Z.; Li, W. Deep learning on near-infrared spectroscopy (NIR) data for the assurance of tea quality. Comput. Electron. Agric. 2021, 190, 106431. [Google Scholar] [CrossRef] [Scilit]
- Li, X.; He, Y. Discriminating varieties of tea plant based on Vis/NIR, spectral characteristics and using artificial neural networks. Biosyst. Eng. 2008, 99, 313–321. [Google Scholar] [CrossRef] [Scilit]
- Luo, X.; Sun, C.; He, Y.; Zhu, F.; Li, X. Cross-cultivar prediction of quality indicators of tea based on VIS-NIR hyperspectral imaging. Ind. Crops Prod. 2023, 202, 117009. [Google Scholar] [CrossRef] [Scilit]
- Zhu, M.Z.; Wen, B.; Wu, H.; Li, J.; Lin, H.; Li, Q.; Li, Y.; Huang, J.; Liu, Z. The quality control of tea by near-infrared reflectance (NIR) spectroscopy and chemometrics. J. Spectrosc. 2019, 2019, 8129648. [Google Scholar] [CrossRef] [Scilit]
- Yamazaki, K.; Murakami, T.; Okada, N.; Terai, H.; Miyase, T.; Sano, M. Fluorescence characteristics of Pu-erh tea. Nippon Shokuhin Kagaku Kogaku Kaishi 2013, 60, 87–95. (In Japanese) [Google Scholar] [CrossRef] [Scilit]
- Zou, Z.; Wu, Q.; Long, T.; Zou, B.; Zhou, M.; Wang, Y.; Liu, B.; Luo, J.; Yin, S.; Zhao, Y.; et al. Classification and adulteration of Mengding Mountain green tea varieties based on fluorescence hyperspectral image method. J. Food Compos. Anal. 2023, 117, 105141. [Google Scholar] [CrossRef] [Scilit]
- Hu, X.C.; Yu, H.; Deng, Y.; Chen, Y.; Zhang, X.H.; Gu, H.W.; Yin, X.L. Rapid authentication of green tea grade by excitation-emission matrix fluorescence spectroscopy coupled with multi-way chemometric methods. Eur. Food Res. Technol. 2023, 249, 767–775. Available online: https://link.springer.com/article/10.1007/s00217-022-04174-w (accessed on 30 September 2025). [CrossRef] [Scilit]
- Fang, H.; Wang, T.; Chen, L.; Wang, X.Z.; Wu, H.L.; Chen, Y.; Yu, R.Q. Rapid authenticity identification of high-quality Wuyi Rock tea by multidimensional fluorescence spectroscopy coupled with chemometrics. J. Food Compos. Anal. 2024, 135, 106632. [Google Scholar] [CrossRef] [Scilit]
- Yan, X.; Xie, Y.; Chen, J.; Yuan, T.; Leng, T.; Chen, Y.; Xie, J.; Yu, Q. NIR spectrometric approach for geographical origin identification and taste related compounds content prediction of Lushan Yunwu tea. Foods 2022, 11, 2976. [Google Scholar] [CrossRef] [Scilit]
- Cai, J.X.; Wang, Y.F.; Xi, X.; Li, H.; Wei, X. Using FTIR spectra and pattern recognition for discrimination of tea varieties. Int. J. Biol. Macromol. 2015, 78, 439–446. [Google Scholar] [CrossRef] [Scilit]
- Wu, X.; Zhu, J.; Wu, B.; Sun, J.; Dai, C. Discrimination of tea varieties using FTIR spectroscopy and allied Gustafson-Kessel clustering. Comput. Electron. Agric. 2018, 147, 64–69. [Google Scholar] [CrossRef] [Scilit]
- Zhou, H.; Fu, H.; Wu, X.; Wu, B.; Dai, C. Discrimination of tea varieties based on FTIR spectroscopy and an adaptive improved possibilistic c-means clustering. J. Food Process. Preserv. 2020, 44, 14795. [Google Scholar] [CrossRef] [Scilit]
- Tew, W.Y.; Ying, C.; Wujun, Z.; Baocai, L.; Yoon, T.L.; Yam, M.F.; Jingying, C. Application of FT-IR spectroscopy and chemometric technique for the identification of three different parts of Camellia nitidissima and discrimination of its authenticated product. Front. Pharmacol. 2022, 13, 931203. [Google Scholar] [CrossRef] [Scilit]
- Song, H.J.; Kim, Y.D.; Jeong, M.J.; Ahn, M.S.; Kim, S.W.; Liu, J.R.; Choi, M.S. Rapid selection of theanine-rich green tea (Camellia sinensis L.) trees and metabolites profiling by Fourier transform nearinfrared (FT-IR) spectroscopy. Plant Biotechnol. Rep. 2015, 9, 55–65. Available online: https://link.springer.com/article/10.1007/s11816-015-0344-9 (accessed on 30 September 2025). [CrossRef] [Scilit]
- Ouyang, Q.; Wang, L.; Park, B.; Kang, R.; Chen, Q. Simultaneous quantification of chemical constituents in matcha with visible-near infrared hyperspectral imaging technology. Food Chem. 2021, 350, 129141. [Google Scholar] [CrossRef] [Scilit]
- Ouyang, Q.; Rong, Y.; Wu, J.; Wang, Z.; Lin, H.; Chen, Q. Application of colorimetric sensor array combined with visible near-infrared spectroscopy for the matcha classification. Food Chem. 2023, 420, 136078. [Google Scholar] [CrossRef] [Scilit]
- Hu, Y.; Yu, H.; Song, X.; Chen, W.; Ding, L.; Chen, J.; Liu, Z.; Guo, Y.; Xu, D.; Zhu, X.; et al. Comprehensive assessment of matcha qualities and visualization of constituents using hyperspectral imaging technology. Food Res. Int. 2024, 196, 115110. [Google Scholar] [CrossRef] [Scilit]
- Luo, Y.; Zhang, Y.; Qu, F.; Qian, W.; Wang, P.; Zhang, X.; Zhang, X.; Hu, J. Variations of main quality components of matcha from different regions in the Chinese market. Front. Nutr. 2023, 10, 1153983. Available online: https://www.frontiersin.org/journals/nutrition/articles/10.3389/fnut.2023.1153983/full (accessed on 30 September 2025). [CrossRef] [Scilit]
- Cui, H.; Zhao, Y.; Li, H.; Ye, M.; Yu, J.; Zhang, J. Effect of geographic regions on the flavor quality and non-volatile compounds of Chinese matcha. Foods 2025, 14, 97. [Google Scholar] [CrossRef] [Scilit] [PubMed]
- Xu, Y.; Zhou, X.; Lei, W. Identifying the producer and grade of matcha tea through three-dimensional fluorescence spectroscopy analysis and distance discrimination. Foods 2023, 12, 3614. [Google Scholar] [CrossRef] [Scilit] [PubMed]
- Akiyama, R.; Suzuki, K.; Llave, Y.; Matsumoto, T. Fluorescence spectroscopy and a convolutional neural network for high-accuracy Japanese green tea origin identification. AgriEngineering 2025, 7, 95. [Google Scholar] [CrossRef] [Scilit]
- Momin, A.; Kondo, N.; Riza, D.F.A.; Ogawa, Y.; Obenland, D. A methodological review of fluorescence imaging for quality assessment of agricultural products. Agriculture 2023, 13, 1433. [Google Scholar] [CrossRef] [Scilit]
- Yuan, Y.; Ji, Z.; Fan, Y.; Xu, Q.; Shi, C.; Lyu, J.; Ertbjerg, P. Deep learning-assisted fluorescence spectroscopy for food quality and safety analysis. Trends Food Sci. Technol. 2025, 156, 104821. [Google Scholar] [CrossRef] [Scilit]
- Singh, M.; Zhang, M.; Espinal-Ruiz, M.; Rathnayake, S.; Xue, J.; Shi, J.; Liu, X.; Hanner, R.; Corradin, M.G. Maple syrup adulteration: Fluorescence fingerprints as a source of information for enhanced detection. J. AOAC Int. 2025, 109, 10–21. [Google Scholar] [CrossRef] [Scilit]
- Pandiselvam, R.; Prithviraj, V.; Manikantan, M.R.; Kothakota, A.; Rusu, A.V.; Trif, M.; Khaneghah, A.M. Recent advancements in NIR spectroscopy for assessing the quality and safety of horticultural products: A comprehensive review. Front. Nutr. 2022, 9, 973457. [Google Scholar] [CrossRef] [Scilit]
- Suran, P. Use of near-infrared spectrometry in temperate fruit: A review. Hortic. Sci. 2024, 51, 169–188. [Google Scholar] [CrossRef] [Scilit]
- Qi, W.; Tian, Y.; Lu, D.; Chen, B. Research progress of applying infrared spectroscopy technology for detection of toxic and harmful substances in food. Foods 2022, 11, 930. [Google Scholar] [CrossRef] [Scilit]
- Saji, R.; Ramani, A.; Gandhi, K.; Seth, R.; Sharma, R. Application of FTIR spectroscopy in dairy products: A systematic review. Food Humanit. 2024, 2, 100239. [Google Scholar] [CrossRef] [Scilit]
- National Tea Producers Association and National Tea-Producing Prefectural Agricultural Cooperative Association Liaison Council. Types of Tea and Their Production Areas. Available online: https://www.zennoh.or.jp/bu/nousan/tea/dekiru03.htm (accessed on 30 September 2025).
- Japanese Matcha Association. Learn About Matcha. Available online: https://matcha.or.jp/en/details/ (accessed on 30 September 2025).

Disclaimer/Publisher’s Note: The statements, opinions and data contained in all publications are solely those of the individual author(s) and contributor(s) and not of MDPI and/or the editor(s). MDPI and/or the editor(s) disclaim responsibility for any injury to people or property resulting from any ideas, methods, instructions or products referred to in the content. |
© 2026 by the authors. Licensee MDPI, Basel, Switzerland. This article is an open access article distributed under the terms and conditions of the Creative Commons Attribution (CC BY) license.