Article

A Recommendation Engine for Multimodal Transport Route Planning Using Shared Vehicles of Different Types


by
Efthymios Chondrogiannis
*,
Leonidas Avdelas
,
Antonis Litke
* and
Theodora Varvarigou
Institute of Communication and Computer Systems, Zografou Campus, Ir. Politechniou Str. 9, 15773 Athens, Greece
*
Authors to whom correspondence should be addressed.
Smart Cities 2026, 9(5), 78; https://doi.org/10.3390/smartcities9050078
Submission received: 2 February 2026 / Revised: 19 April 2026 / Accepted: 25 April 2026 / Published: 29 April 2026

Highlights

What are the main findings?
  • A layered architecture for personalized multimodal environment- and traffic-aware route-planning recommendations built upon existing services, systems, and pre-trained LLMs.
  • An advanced route-planning mechanism for heterogeneous station-based and dockless shared vehicles, evaluated using simulated data.
What are the implications of the main findings?
  • Facilitates the daily travel of smart city citizens by considering a wide range of transport options, including shared vehicles of different types and conventional modes of transport.
  • Contributes to sustainable transformation by promoting the use of environmentally friendly shared vehicles that can be easily integrated with conventional means of transport.

Abstract
Vehicle-sharing platforms are constantly gaining ground in smart cities around the world, reducing the number of traditional fuel-based vehicles on the roads in busy areas and thus contributing to the development of a sustainable environment. On the other hand, the availability of a plethora of shared vehicles of different types across a city increases the need for their seamless combination, so that they are considered part of a unified transportation system within a smart city rather than independent solutions. In this work, we present a system that enables authorized users to gain access to shared vehicles of different transport modalities, allowing them to reach their destination without relying on a private car or public transport. For this purpose, we have used existing systems and techniques from different fields, such as recommendation systems, machine learning, and route planning, which provide appropriate multimodal routes while taking into consideration several parameters, including user demographics, vehicle status, environmental conditions, and road traffic congestion. The evaluation of the system using simulated data showed that it enables users to identify suitable multimodal routes, either through explicit preferences or by inferring them from historical data, and revealed limitations to be addressed in future work.

Graphical Abstract

1. Introduction

Vehicle sharing is constantly gaining ground [1], including micro-vehicles such as e-scooters and e-bikes, as well as larger vehicles such as cars and even sea vessels. Each of these vehicle types has its own advantages and limitations, which are strongly related to user preferences, environmental conditions, traffic levels, and city infrastructure. Hence, their efficient combination and usage by members of a community is rather challenging, given the plethora of issues that need to be addressed. For instance, car driving is directly affected by traffic conditions and the availability of parking spaces. On the other hand, e-scooters and sea vessels are highly affected by environmental conditions. In any case, these vehicles can improve access to public transport and simultaneously reduce the usage of private vehicles and road traffic, thus contributing to the development of a sustainable environment.
In this work, we present the system developed for sharing vehicles provided by the partners involved in the EcoMobility [2] project among members of a community, with particular focus on identifying the most appropriate route for each user, taking into consideration the unique characteristics of the vehicles, users’ profiles, environmental conditions, such as weather and traffic levels. For this purpose, we have used existing systems and services, such as OpenStreetMap database [3], as well as pre-trained large language models (LLMs) such as Qwen3 [4], to efficiently process user data, identify feasible routes, and rank them so that the most appropriate options appear at the top of the list. The evaluation of the developed system using simulated data, involving different types of vehicles and users in Istanbul, indicated that it can accurately identify suitable multimodal routes based on a set of informative route features, while also highlighting its strengths and areas for further improvement.
The document is organized as follows. In Section 2, we present the state of the art in two distinct but highly relevant fields, namely recommendation systems and route planning, along with the use of machine learning (ML) and deep learning (DL) techniques in these areas. In Section 3, we analytically describe the proposed approach and the developed system, which enables authorized users to identify appropriate routes using multiple means of transport, considering their demographic characteristics, environmental conditions, and relevant events such as traffic jams. An example is presented in Section 4, providing further details on the algorithms implemented in each layer based on the distribution of several vehicles around Istanbul, and relevant issues are discussed. In Section 5, we present the evaluation of the proposed system using simulated data, and the lessons learned through this process are summarized. The limitations of the developed system and its underlying background mechanism are further discussed in Section 6. Finally, in the last section, we highlight the main contributions of this paper and outline future work.

2. Related Work

2.1. Recommendation Systems and AI Techniques

Recommendation systems have been in the market for more than 30 years. However, the techniques used have significantly changed, taking into consideration the technological advancements occurred during this period.
Recommendation systems can be organized into three broad categories, namely content-based filtering, collaborative filtering, and hybrid systems [5]. Content-based filtering systems rely on the attributes of the items already selected by the user to recommend new ones. Collaborative filtering systems are based on evaluation data explicitly or implicitly provided by users to identify their preferences, and they can be further divided into memory-based and model-based recommendation systems. Hybrid recommendation systems combine two or more techniques to improve their performance, usually in order to address the cold-start problem. Burke [6] has presented different ways in which two or more techniques can be combined. The simplest approach is to apply weighting schemes. Alternatively, the system may choose which technique to use each time or combine the recommendations produced independently by each technique, among other options.
The ideal context-aware recommendation system should reliably label each user action with the appropriate context and effectively tailor the system output for the user in the given context. Adomavicius et al. [7] focused on how context can be defined and used in a recommendation system to provide more intelligent and useful recommendations. More precisely, they have focused on specific contextual factors such as time, location, and purchasing purpose, what a recommendation system may know about these factors (i.e., the extent to which this information is available or observable to the system), and how they change over time (i.e., some factors remain stable, whereas others vary over time). Contextual information can be obtained explicitly (i.e., directly from users and/or sensors) or implicitly through the analysis of historical data, and it can be used at various stages of the recommendation process, such as filtering the input data (i.e., contextual pre-filtering) and ranking the results according to user preferences. Therefore, AI/ML techniques [8] can be used to learn from historical data (e.g., static unobservable and/or dynamic observable contextual information) and to leverage the resulting ML models within the recommendation process.
Over the past decades, recommendation systems have used traditional data mining techniques, such as text mining (e.g., TF-IDF), data clustering (e.g., the K-means algorithm [9]), and matrix factorization [10], to analyze the characteristics of users and items, and especially the relationships and patterns among them. In the big data era [11], where the information available about both users and items has increased significantly, neural networks have been widely adopted in recommendation systems, benefiting from improvements in hardware computing power and from recent deep learning advances, such as transformers and self-attention mechanisms [12].
Deep neural networks (DNNs) [13,14] can be used to identify complex patterns among users and items that traditional ML techniques and recommendation systems cannot adequately model or capture. Based on the survey conducted by Zhang et al. [15], standard deep learning (DL) techniques such as multilayer perceptrons (MLPs), convolutional neural networks (CNNs), recurrent neural networks (RNNs), including long short-term memory (LSTM) and gated recurrent unit (GRU) networks, restricted Boltzmann machines (RBMs), and autoencoders (AEs), as well as more contemporary DL architectures such as generative adversarial networks (GANs), transformer-based architectures (using attention mechanisms), deep reinforcement learning (DRL), and graph neural networks (GNNs), have been incorporated into recommendation systems. These techniques have demonstrated tremendous success in both supervised and unsupervised learning tasks. Moreover, in some cases, recommendation systems have utilized more than one of the aforementioned approaches.
Xu et al. [16] studied how multimedia information can improve recommendation systems (e.g., increase performance and mitigate the cold-start problem), particularly through feature extraction from multimedia data and the incorporation of these features at different stages of the recommendation process. Based on their survey, different application scenarios encompass varying types of modality information, leading to diverse datasets with distinct multimodal features. Nevertheless, most datasets include at least three primary modalities, namely interaction, visual, and textual. Within the visual domain, convolutional architectures are widely used for feature extraction, whereas in the text domain, both traditional methods such as TF-IDF and more sophisticated neural network approaches are used. In particular, after the introduction of transformers with self-attention mechanisms, existing pre-trained DNNs, including large language models (LLMs) [17,18], have been widely adopted for this purpose. The stage at which information from different modalities is integrated (e.g., before or after the encoding process), as well as the integration method used (e.g., concatenation or element-wise operations, with or without weighting), can also affect recommendation performance.

2.2. Multimodal Transportation and Route Planning

Route planning aims to identify the optimal path between two locations and is closely related to graph theory. A road network can be represented as a graph, where intersections are modeled as nodes and roads as edges, which can then be searched to determine the shortest path. In road networks, the best route often depends on the departure time in a predictable way [19]. For example, certain roads are consistently congested during rush hours, and certain buses or trains operate with different frequencies throughout the day. Therefore, the duration of each intermediate step can be represented in the graph (e.g., as edge weights), allowing the quickest route to be identified using a shortest-path algorithm such as Dijkstra, Bellman–Ford, or A*, among others. A similar approach can also be applied to public transit networks. Nevertheless, the exact process depends on the model used to incorporate the temporal dimension into the graph (e.g., time-expanded or time-dependent).
Detecting the appropriate path may be quite complicated, since it is often necessary to take into consideration multiple parameters, such as travel time and monetary cost. In such cases, we can either use an algorithm that supports multiple criteria (e.g., RAPTOR [20]) or compute a linear combination of different costs (often referred to as generalized cost [21]) and handle the problem accordingly as an earliest-arrival problem using a shortest-path algorithm. In case of public transport networks, precomputing transfer patterns can significantly improve the efficiency of routing queries, even in very large and poorly structured networks, as shown by Bast et al. [22]. When several different modes of transport need to be considered, a multimodal graph can be obtained by first constructing individual graphs for each transportation mode and then merging them by introducing appropriate links to enable modal transfers. The complexity of both the graph and the algorithm increases, especially when additional parameters, such as uncertainty and delays, must also be taken into account.
Wu et al. [23] focused on the use of ML techniques for providing personalized recommendations in multimodal transportation. More precisely, they defined the problem and the required data so that supervised ML techniques can be used to learn user behavior based on historical data, and the resulting ML model can then be applied to select appropriate modes of transport and/or rank them. According to their work, it is necessary to consider the origin and destination (i.e., query data), the responses previously proposed by the system (i.e., candidate data), and the options selected by users, along with user attributes and road traffic conditions, in order to extract appropriate features that serve the intended purpose. However, these data should be further processed before being used by supervised ML techniques.
To detect the most appropriate route(s), it is often necessary to generate all alternatives (i.e., the choice set) and then either select the most appropriate one or determine the order in which they should be presented to the user. In the latter case, Path Size Logit (PSL) route choice models [24] are often used, especially in public transport [25]. These models are based on logit models (i.e., logistic regression) and take into consideration the correlations among the available options (i.e., common parts of the routes). On the other hand, they depend on the structure of the utility functions, which must be specified in advance by the modeler and are often defined as a linear combination of relevant parameters (e.g., duration and cost).
Deep neural networks (DNNs) can capture more complex interactions among variables and have recently been used in route planning. Marra and Corman [26] presented a DNN that takes into account all available options (i.e., their feature vectors), along with additional parameters (e.g., weather conditions), and applies several convolutional layers with multiple filters and a non-linear activation function in order to learn the utility function. The adopted approach and the structure of the DNN architecture ensure that the system provides the same results regardless of the order in which the available options are given (i.e., permutation invariance). On the other hand, the developed DL-route model, like any other DNN, is not easily interpretable.
Hydra [27] is a personalized and context-aware multimodal transportation recommendation system used by Baidu Maps [28] that leverages existing unimodal route engines to generate feasible routes across different transport modes. For multimodal transportation, a network is constructed (i.e., a graph in which nodes represent locations and links represent travel actions associated with a specific mode), which Hydra then searches to identify feasible paths while taking into account the required number of modal transfers. For each path, several features are computed that are closely related to the origin and destination, the stations and other points of interest (POIs) in the surrounding area, the routes that users are expected to follow, and the city region(s) they traverse. These features, together with the user profile, temporal constraints, and meteorological data, are used to compute a score based on a pre-trained ML model which is finally used by Hydra to recommend the appropriate mode.
Deep reinforcement learning (DRL) algorithms have also been used to address a variety of transportation problems [29], including autonomous energy-efficient driving, adaptive traffic signal control, and vehicle route planning. Furthermore, several new DRL techniques have been proposed to solve routing problems based on encoder–decoder architectures with attention mechanisms and graph embedding networks [30]. However, processing data generated through direct user interaction with the system is costly and risky. Therefore, in many studies, DRL has been applied offline to learn an appropriate policy based on historical data, which is subsequently leveraged in the online version of the recommendation system [31].
Multimodal transportation also encompasses the use of micro-vehicles, that is, vehicles with a mass of no more than 350 kg and a design speed of no more than 45 km/h [32]. Human-powered and electrically assisted micro-vehicles, such as bicycles, e-bikes, and e-scooters, can improve access to public transport by addressing, to some extent, the first- and last-mile problem [33]. Apart from privately owned micro-vehicles, such as bicycles, which have been used as a mode of transport for a long time, micro-vehicle sharing systems (e.g., Lime and Bird for e-scooters) are constantly gaining popularity in many urban cities around the world [34]. The micro-vehicles in these systems may be located at predefined stations (i.e., station-based systems), or parked almost everywhere (i.e., dockless systems) within specific zones or areas which complicate the route planning process. Especially in the case of electric vehicles, this process becomes more complicated because the system must also consider battery levels, vehicle range, and charging-station availability [35].
Vehicle sharing is, to some extent, conceptually related to carpooling and ride-sharing. In carpooling or ride-sharing, a driver and one or more riders share part of a common trip using the driver’s car, offering clear economic and ecological benefits. On the other hand, carpooling complicates the route planning process, since there are no fixed stops and drivers are often willing to make short detours. To address this problem, Huang et al. [36] modeled public transport and carpooling as two independent time-expanded graphs, which were subsequently merged into a single graph while taking into account the fuzziness and flexibility introduced by carpooling. The output of this process is a time-dependent multimodal graph that can be searched to identify potential routes from origin to destination using standard route planning algorithms, while also considering the departure or arrival time range, when specified. Deep reinforcement learning (DRL) algorithms have also been applied to freight delivery and, in particular, to on-demand ride-sharing problems [29], including order dispatching (i.e., matching rider requests with available vehicles), vehicle repositioning (i.e., proactively repositioning idle vehicles from one zone to another in order to balance vehicle supply and rider demand), and joint decision-making for order dispatching and vehicle repositioning.

3. Methodology

3.1. Approach Followed and System Developed

To facilitate the daily mobility of citizens in a smart city, we developed a system that enables them to identify the route that best suits their needs by using multiple transportation modes, each with its own capabilities and characteristics. In this work, we focus on four different means of transport, namely walking, using an e-scooter, traveling by car, and traveling by sea vessel. All vehicles considered in this work are being developed by organizations involved in the EcoMobility project [37], and they are, to a great extent, autonomous and environmentally friendly. These vehicles are intended to be temporarily shared among members of a community under a specific pricing scheme. Nevertheless, the proposed approach can be extended to encompass additional private vehicles and public means of transport, such as cars, bikes, buses, metro, trains, and airplanes.
Citizens can use the developed system to identify the most appropriate means of transport for reaching their final destination, taking into account vehicle availability, environmental conditions, and traffic levels. To meet the requirements of a real-world scenario, the system distinguishes three different types of users, each with different capabilities and interaction methods. System administrators are responsible for initializing the system, such as registering available vehicles and entering additional information about them, as well as monitoring their overall status (e.g., problem reports). Data collected from sensors installed on vehicles and/or at different locations within a smart city can provide information about the current location of vehicles, as well as weather conditions and traffic levels on roads. Regular users (or simply users) can interact with the system using their smartphones in order to reach their final destinations. Therefore, they can register in the system, receive recommendations regarding the paths or routes they should follow, reserve relevant vehicles in advance (by paying the required amount), and release them at the end of the trip or even earlier.
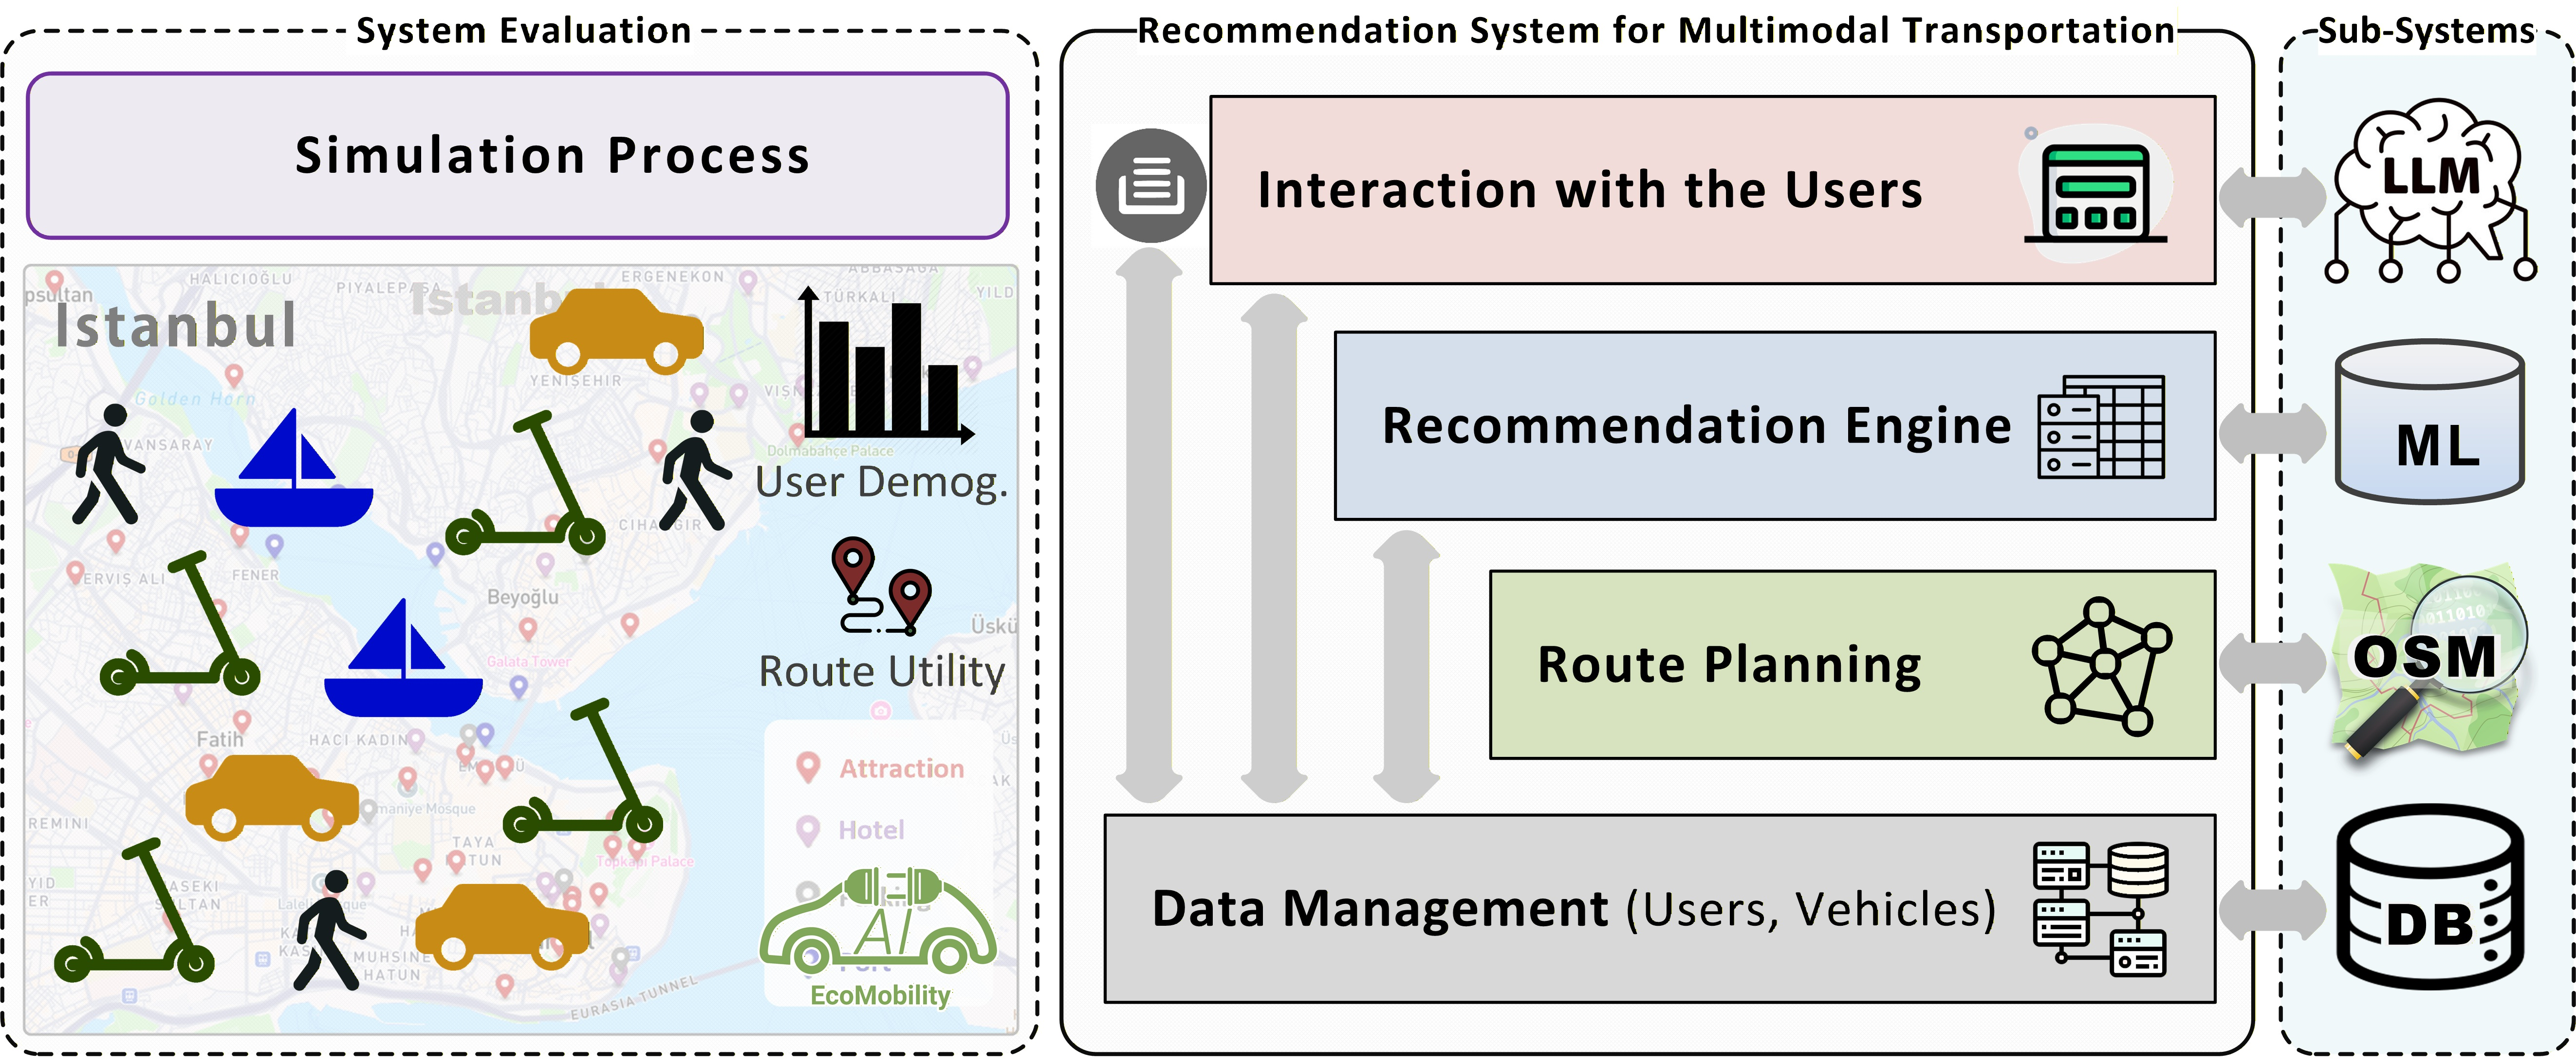
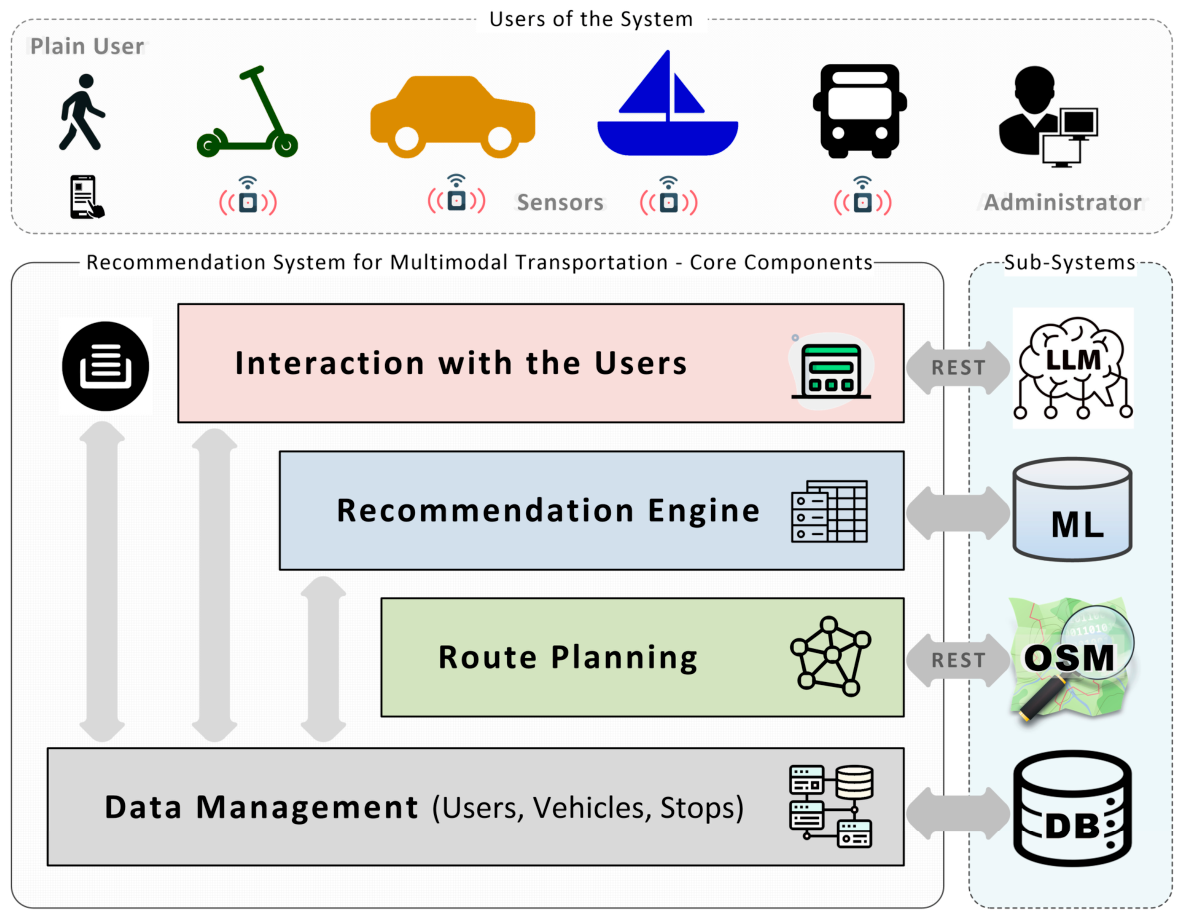
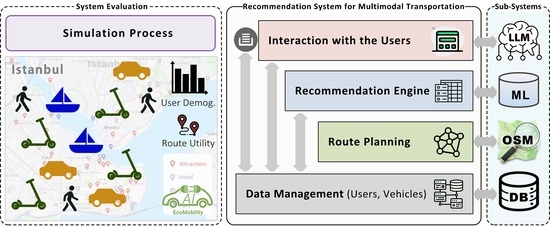
The architecture of the developed system, along with the involved user types, is presented in Figure 1. The upper layer facilitates the interaction between end users and the system, whereas the bottom layer handles data management. The two intermediate layers detect the available means of transport, identify the route(s) that can be followed using a combination of different transportation modes (route planning), and rank them according to the user’s profile and goals or preferences (recommendation engine). This constitutes the most challenging part of the system; therefore, in the remainder of this paper, we focus on the algorithms implemented in these two software components.
Users (either regular users or administrators) interact with the system through the GUI by invoking the corresponding REST APIs. In contrast, sensors communicate with the system via an MQTT [38] broker by publishing messages to the appropriate queue, which are then further processed by the system. In both cases, the exchanged data are provided in JSON [39] format and must comply with a predefined schema. For user convenience, registered users can also submit requests using natural language, and the system can automatically extract the required technical details (e.g., the latitude and longitude of the destination) before interacting with the underlying components of the architecture through the corresponding REST APIs.
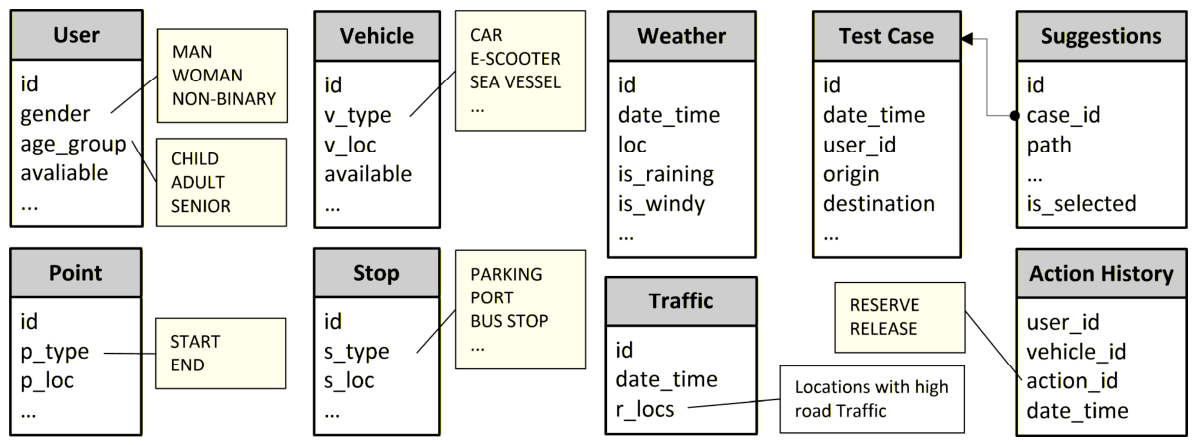
The recommendation engine generates the available options for reaching the final destination in an appropriate order, taking into consideration the characteristics of the users, their origin and destination, as well as any additional parameters specified. From a technical perspective, users must provide their unique IDs, the latitude and longitude of their origin and destination, and an additional object describing their preferences (e.g., searching for trips with minimum total duration) and any restrictions that eligible paths should satisfy (e.g., avoiding the use of a sea vessel). However, these additional parameters are optional. The system relies on data stored in the data source to retrieve further information about users (e.g., demographic characteristics) and vehicles (e.g., capabilities and status), as well as their current locations on Google Maps [40]. Moreover, it takes into account current weather conditions and road traffic levels, ensuring that the routes proposed by the system are feasible and satisfy the specified constraints. More information about the data management and the data structures used is available in Appendix A.
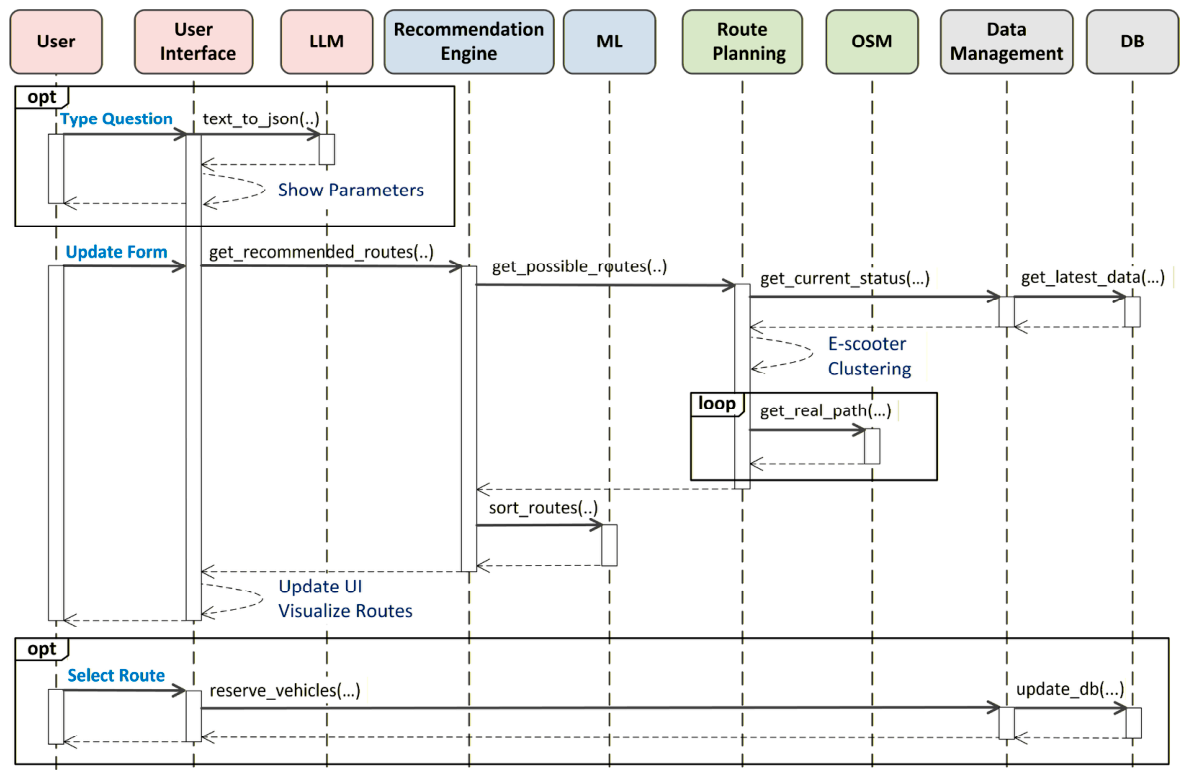
For efficient processing of the input data, the system is based on widely used models, services, and software components, enabling it to take advantage of existing knowledge available on the web. In our work, a smaller version of Qwen3 [41] LLM with 4 billion parameters was used to transform user requests expressed in natural language into JSON format, so that they can be further processed by the underlying software components. In addition, the OpenStreetMap [42] API was used to identify the route that should be followed for moving from one location to another using a particular mode of transport (e.g., on foot or by car). Regarding data storage, SQLite v.3 [43] was used in combination with an appropriate object–relational mapping (ORM) library. Furthermore, a ML model was developed based on historical data and subsequently used to rank the suggested paths before presenting them to the end user. The interaction among entities along with the technologies used are available in Appendix B.
Before proceeding to the description of the algorithms, we describe the assumptions made for the different means of transport, and in particular for the vehicles supported by the system. First, we assume that a user can walk from one location to another under any conditions, provided that a valid path exists between them and the distance does not exceed a predefined threshold. All e-scooters are considered identical and may be available almost everywhere. Therefore, a user can rent an e-scooter and leave it at a convenient location (e.g., close to an intermediate or final destination), provided that weather conditions are suitable (i.e., no rainfall) and the travel distance does not exceed a second predefined threshold. For car travel and considering the difficulty of finding a free on-street parking space, especially near busy areas, we assume that cars should be parked in predefined parking areas. Thus, cars can be used for traveling between different parking locations or areas independently of weather conditions, on condition that there is empty space in the parking area and the travel distance does not exceed another predefined threshold. Nevertheless, drivers may leave the vehicle at a different location when this is feasible. Car trips are also strongly affected by traffic congestion. Regarding sea vessels, we assume that travel between ports is possible provided that there are no strong winds and that a valid route exists between the corresponding ports. Furthermore, we assume that vehicles cannot be carried using another vehicle. For example, users cannot take an e-scooter with them when traveling by car or sea vessel. Consequently, a vehicle must be released before switching to another mode of transport. Finally, it is assumed that each vehicle, including both cars and sea vessels, can be used by only one user at any given time.

3.2. Route Planning

This software component identifies the feasible routes that users can follow to reach their destination and computes several parameters for each alternative, so that the system can subsequently use this information to select the most appropriate one. This is a rather complex process, given the large number of available options and the multiple parameters that must be considered. To address this challenge, we apply a novel approach in which feasible routes are progressively detected and refined. The process begins with an abstract representation of the entities within a given area and the links among them, enabling the system to identify a set of candidate routes. These candidates are then further processed and filtered to determine the concrete elements of each route and ensure that all relevant constraints are satisfied.
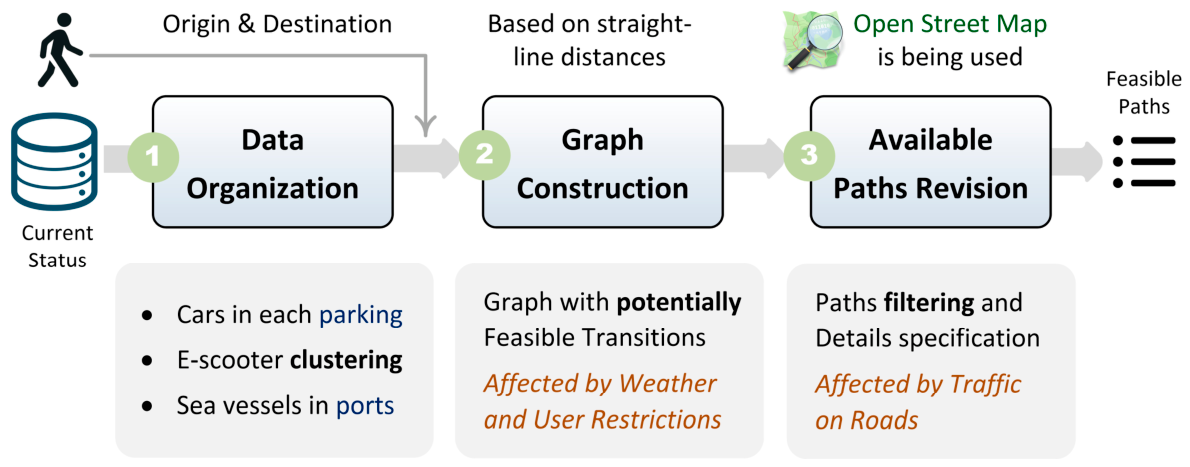
The proposed approach consists of three consecutive steps, which are illustrated in Figure 2. First, the system identifies the functional vehicles that are registered and not currently in use by any other user (available vehicles), the existing car parking areas and sea-vessel ports (stops), the current weather conditions, and the road segments affected by traffic congestion. Next, the system examines the current locations of cars and sea vessels to determine the stop to which they are parked (note that a car may also be parked outside the predefined car parking locations), so that the system is aware of vehicle availability at the corresponding locations as well as their occupancy. The scooters are clustered using DBSCAN [44], and a representative scooter located near the center of each cluster is subsequently selected (referred to as an e-scooter representative or e-scooter area).
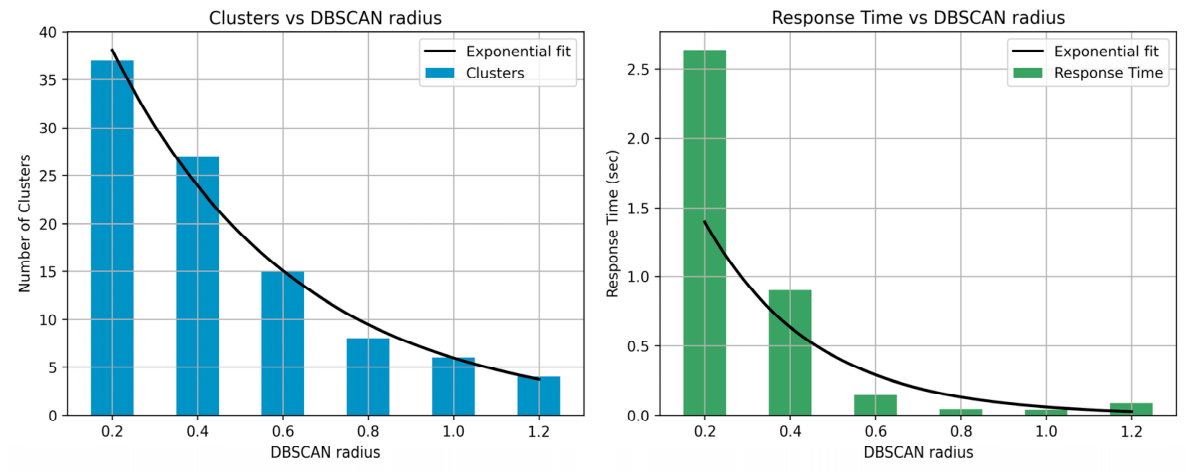
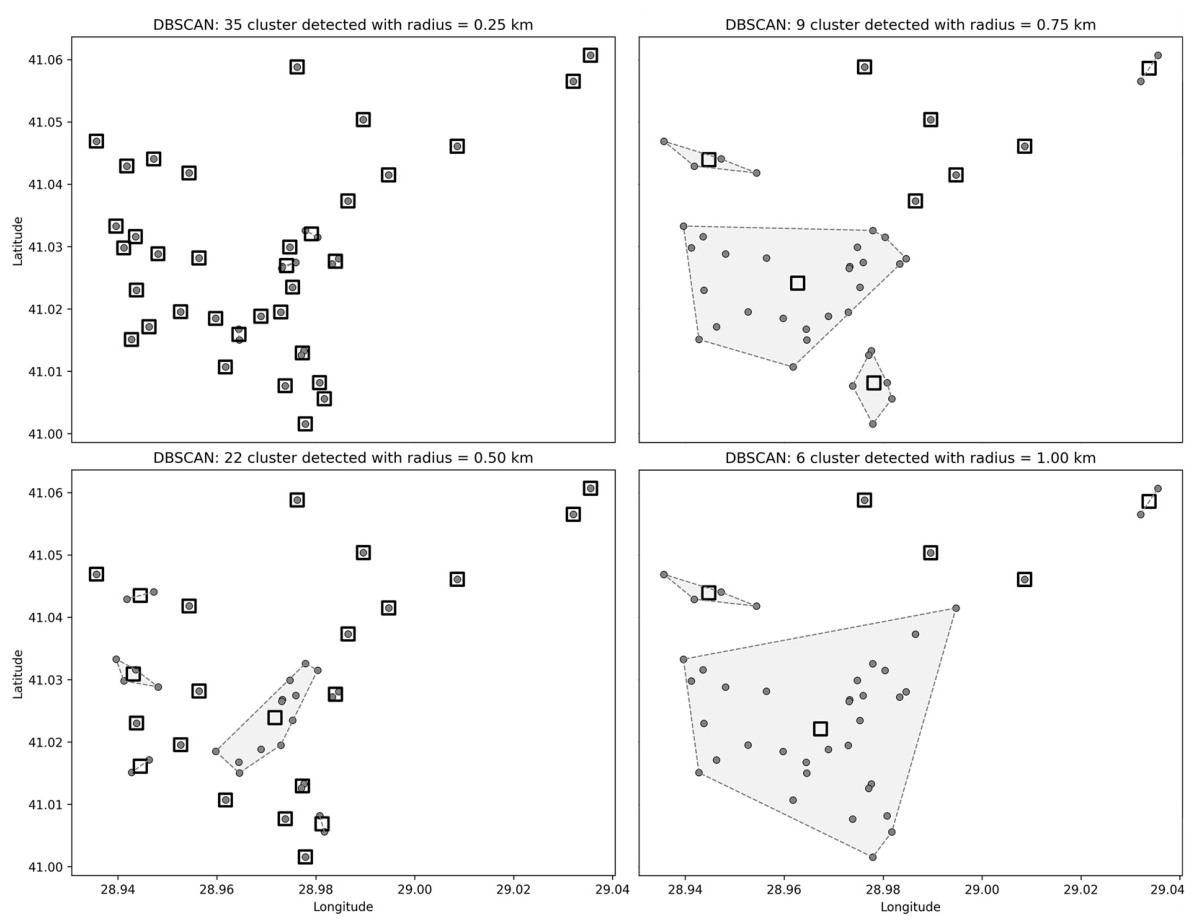
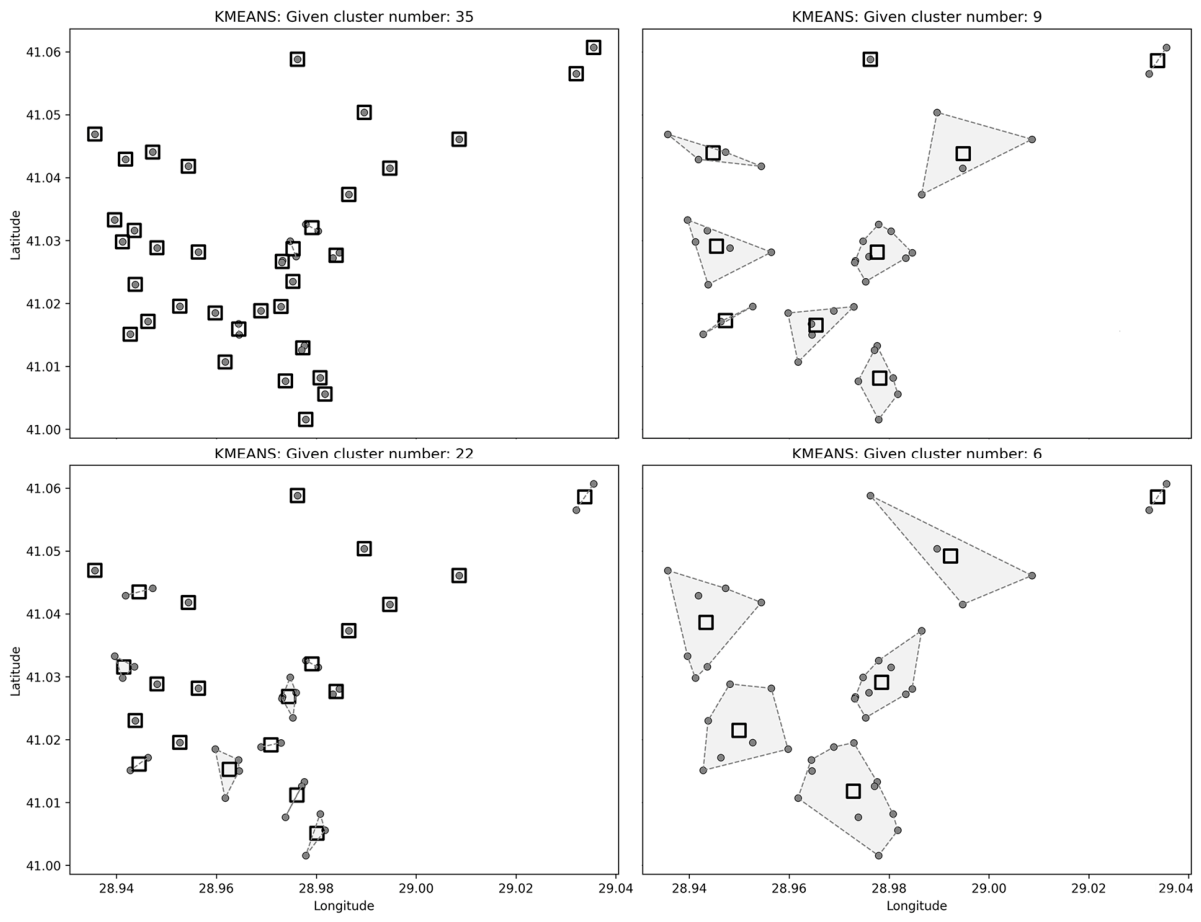
In this work, DBSCAN was selected over K-means, as it does not require the prior specification of the number of clusters. The minimum number of e-scooters per cluster was set to one to ensure that isolated vehicles are identified and incorporated into the route planning process. The radius parameter was set to 0.5 km, as this value reduces the number of clusters while preserving spatial proximity among e-scooters within each cluster. This approach enables each cluster to be effectively represented by the e-scooter closest to its centroid during route planning. Detailed experimental results are provided in Appendix C.
Then, the system constructs a graph that represents all available means of transport, along with links among the relevant entities, so that it can be used to identify candidate routes for reaching the destination. This graph includes the user’s origin and destination, as well as intermediate stops where the user may change the mode of transport, including parking areas, ports, and e-scooter areas. The links between the nodes of the graph are defined based on the characteristics of each node. More precisely, travel from one parking area to another is allowed provided that a car is available at the origin parking area, there is empty space for at least one car in the destination parking area, and the distance is within the allowable driving limits. The same assumption applies to sea vessels. In addition, walking between two nodes is permitted if the distance is within a predefined walking threshold. For e-scooters, since they can be left almost anywhere, they can be used to travel to any other node, provided that the travel distance does not exceed a predefined threshold. During the construction of the graph, straight-line distances are used to quickly obtain a rough estimation of the potential travel distance and filter infeasible links. However, the thresholds used for filtering links are slightly smaller than those specified during system configuration, since the actual distance between them (if it exists) is expected to be shorter. Finally, for each link included in the graph, we record the associated mode of transport and the corresponding straight-line distance.
It should be noted in advance that the construction of this graph is highly affected by environmental conditions and user restrictions or preferences. More precisely, e-scooters cannot be used in cases of heavy rain, and sea vessels cannot be used in the presence of strong winds in the corresponding areas. In addition, users may explicitly specify that one or more means of transport should be avoided; therefore, the corresponding links are not introduced into the graph during the aforementioned process. Using this graph, the system can identify all feasible paths that can potentially be followed to reach the destination. However, each candidate path must be further examined to determine the actual route (if one exists) and estimate the actual distance and expected duration of each step.
For each path, we initially compute a pattern that consists of the sequence of transportation modes it includes, so that it can be used to quickly reject inappropriate alternatives before proceeding to the next steps, which are more complex and time-consuming. For example, we reject paths in which the same mode of transport is used in two consecutive steps without justification, such as walking to a parking area and then walking again to another location instead of switching to a car. Next, we examine the intermediate steps of each path to determine the concrete route for the specified transportation modes, as well as the expected distance, duration, and cost, among other parameters. During this process, the OpenStreetMap (OSM) service is used to verify that the transition between two points is feasible using the selected mode of transport and to retrieve route details, along with estimations of the expected travel distance and duration, which are further evaluated based on the specified thresholds. In the case of e-scooters, if the travel distance exceeds the specified threshold, we additionally examine whether the remaining distance can be covered on foot. The cost depends on the specific mode of transport used at that step, as well as the corresponding travel distance and duration, and is analytically described in the example presented in Section 4.
For each of the remaining paths, we compute several features, such as the total distance, duration, and cost. In addition, we compute the number of edges, the set of distinct transportation modes used, and the total distance and duration covered by each mode separately. In case a car or a sea vessel is used, the total duration is slightly increased to account for the additional time required to pick up and return the vehicle at the corresponding locations. In contrast, e-scooter usage is relatively straightforward and does not introduce a significant delay. Traffic conditions are also considered. In particular, when car travel is involved, we examine whether a route passes through high-traffic areas and, if so, we increase the estimated travel duration accordingly.
Following the above process, we obtain a list of feasible paths, each associated with multiple parameters, including distance, duration, cost as well as comfort and safety. The latter are significantly influenced by the modes of transport employed (e.g., scooters are generally perceived as less safe than other transport modes), as well as by environmental conditions and traffic levels. These alternatives can then be presented to the end user, either in full or as a subset, often ranked in ascending order of total duration. However, this ranking is not always optimal, since users may have different goals and preferences. Therefore, in order to increase the likelihood that the recommendations are useful and selected, routes must be ranked by taking multiple parameters into account, as described in Section 3.3.

3.3. Recommendation Engine

The aim of the recommendation engine is to refine the feasible routes generated by the route planning component and present them to the end user in an appropriate order, so that the most suitable routes appear at the top of the list. To achieve this, the system offers users two main options. First, it allows users to specify their preferences regarding the parameter(s) of particular importance (e.g., prioritizing total duration) as well as any restrictions (e.g., avoiding the use of a scooter), so that this information can be used to filter and subsequently rank the available routes. The specified restrictions are Boolean expressions that define conditions the routes must satisfy (e.g., the route should not include a scooter and/or the total walking distance should be below a threshold) and are therefore used to filter the routes identified in the previous step. The preferred parameter(s) are expressed as an ordered list of one or more route features, which are then used to sort the remaining eligible routes before they are presented to the user. For example, an adult user may specify that, at a given moment, they are interested in the route with the minimum total duration, without necessarily requiring the use of a car or a sea vessel.
It should be noted in advance that the above parameters are optional and may be specified by users each time they interact with the system. This approach may be daunting for some users, since they are required to provide not only their origin and destination, but also additional information at every request. Moreover, this mechanism does not always allow the system to fully capture user intent, as it focuses on individual parameters and constraints rather than the user’s needs as a whole and the complex dependencies among the computed features. For this reason, a second option is provided, allowing users to avoid specifying additional information each time. Under this approach, the system learns from historical data to automatically determine the order in which feasible options should be presented. Nevertheless, user preferences remain important for two main reasons. First, they are particularly useful during the initial phase of system deployment, when limited historical data are available. Second, they are also relevant when users seek routes that differ from their typical behavior. For example, a senior citizen may generally avoid using e-scooters due to safety concerns. However, in a specific situation, the same user may decide to use an e-scooter, if necessary, in order to reach their destination on time.
Provided that an adequate amount of historical data is available, the recommendation engine can automatically rank feasible routes by taking into account each user’s profile and their past decisions. To support this process, each time a user interacts with the system, we record both the recommendations generated by the system and the route selected by the user, along with additional parameters collected upon completion of the trip. This information can then be used to model user behavior. The developed ML model is used by the recommendation engine to rank the eligible routes identified in the previous step. The input to the ML model consists of the user profile and a subset of the features computed for each route. The output is a value in the range [0, 1], indicating the suitability of each route. This value is subsequently used to order the routes, so that the most appropriate options appear at the top of the list. The development of the ML model is almost completely automated so that it can be periodically updated, if necessary, to capture changes in user behavior.
For the development of the ML model, a dataset was constructed containing information from five different sources: (a) temporal data regarding the date and time the system was used, (b) user demographic characteristics specified during registration, (c) route features automatically computed by the system, (d) routes selected by users before starting their trip, and (e) additional route features automatically computed by the system upon trip completion. An additional column was included in the dataset to indicate whether each route was selected or not. The dataset was split into two subsets, namely training and validation sets, which serve different purposes. In this work, a relatively simple ML model was employed, namely a Random Forest classifier [45], due to the limited amount of available data and computational resources. Random Forest is an ensemble learning method that aggregates the predictions of multiple Decision Trees, each trained on different subsets of features, enabling it to effectively capture non-linear relationships while achieving strong predictive performance and enhanced generalization. Nevertheless, more advanced ML models can be incorporated without substantially modifying the overall process. The proposed model predicts not only the class label (i.e., whether a route is selected or not), but also the corresponding probability of selection. This probability is particularly useful, since higher values indicate more suitable routes, and it can therefore be used to rank the available alternatives.

3.4. LLM-Enabled User Interface

User interaction with the system is supported through a user interface that enables authorized users to specify the origin and destination (mandatory), along with additional optional parameters when needed, and to view the suggested routes ranked in an appropriate order. Users can then select the most suitable option, reserve the corresponding vehicles, and release them upon disembarkation. The data provided by users through the web interface are expressed in JSON format so that they can be further processed by the system’s REST [46] services.
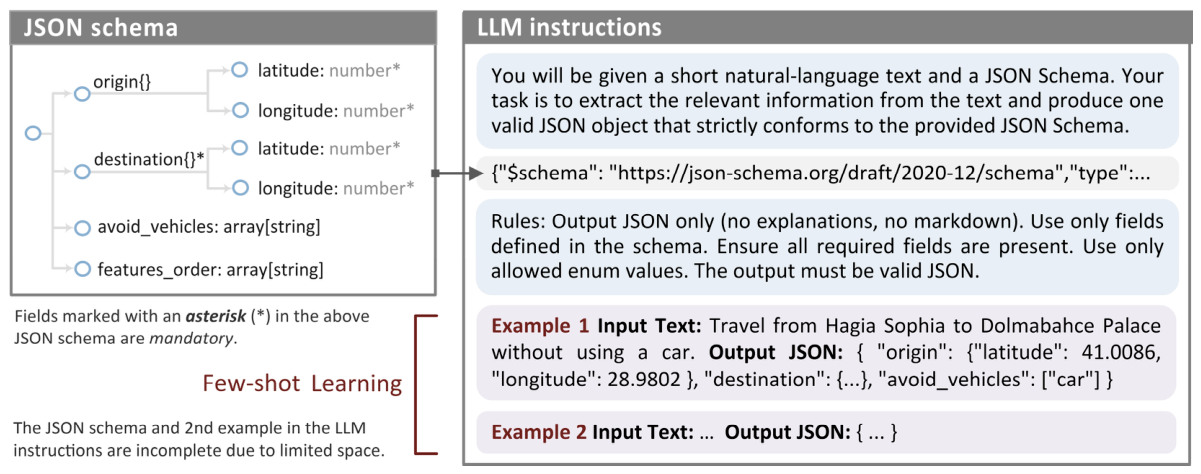
To facilitate user interaction with the system, a pre-trained LLM was also incorporated. More precisely, the system allows users to express requests in natural language and automatically converts those requests into valid JSON messages that can be processed by the underlying components. To achieve this, we first developed a JSON schema [47] that defines the structure of both mandatory and optional parameters, along with the possible values for each field (e.g., route features and constraints), as illustrated in Figure 3. Using prompt engineering, we then provided this schema to the LLM together with a set of instructions and a small number of examples [48], enabling the model to automatically convert user input into a valid JSON message. Finally, the system can automatically determine the user’s origin, provided that this information is available on the device (e.g., computer or mobile phone) on which the user interface is deployed.
As can be observed in the above figure, the JSON schema used is slightly different from the one required for expressing user requests. First, we excluded the “user_id” parameter, since it can be automatically assigned by the system. In addition, we made the origin field optional, as it may not always be explicitly specified by the user. In such cases, the user’s current location, which can be automatically detected, is used instead. Finally, user preferences were expressed in a more straightforward manner to ensure that they can be correctly interpreted by the LLM, even when using a model with limited size and capabilities, such as the Qwen3-4B (Q8) adopted in this work.

4. Example of Usage and Discussion

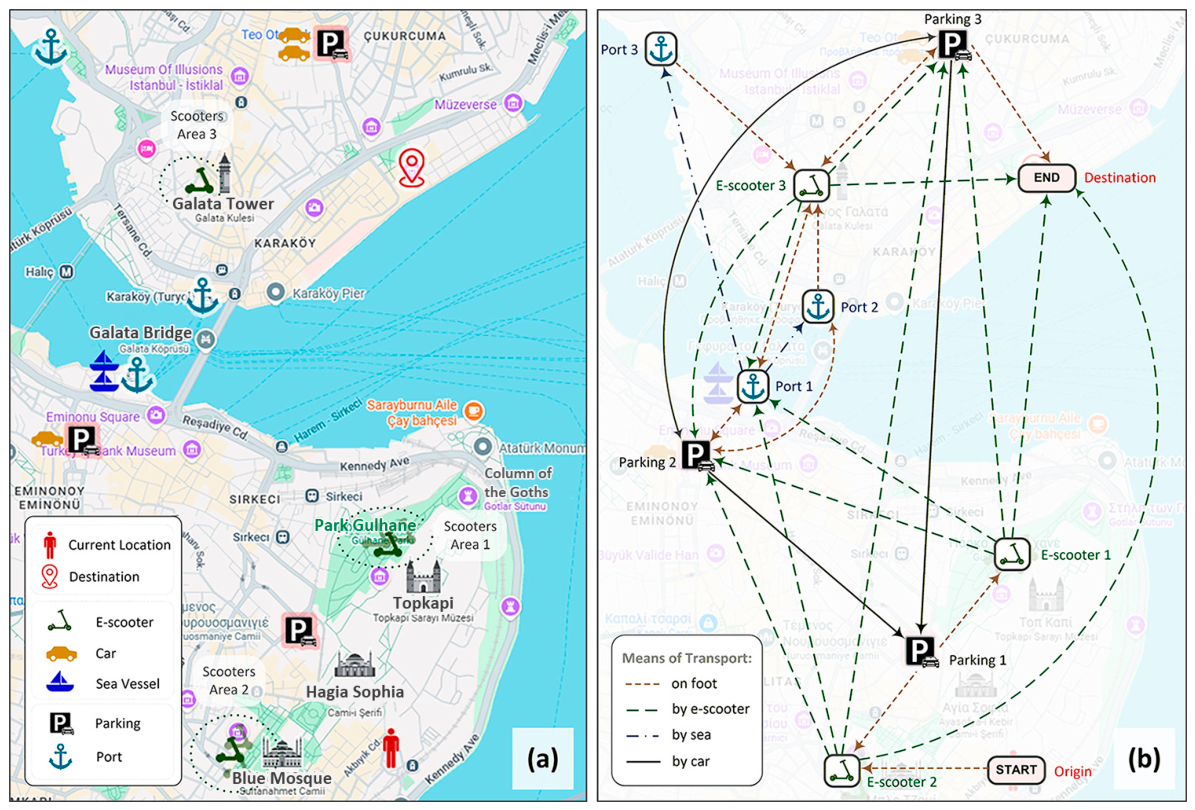
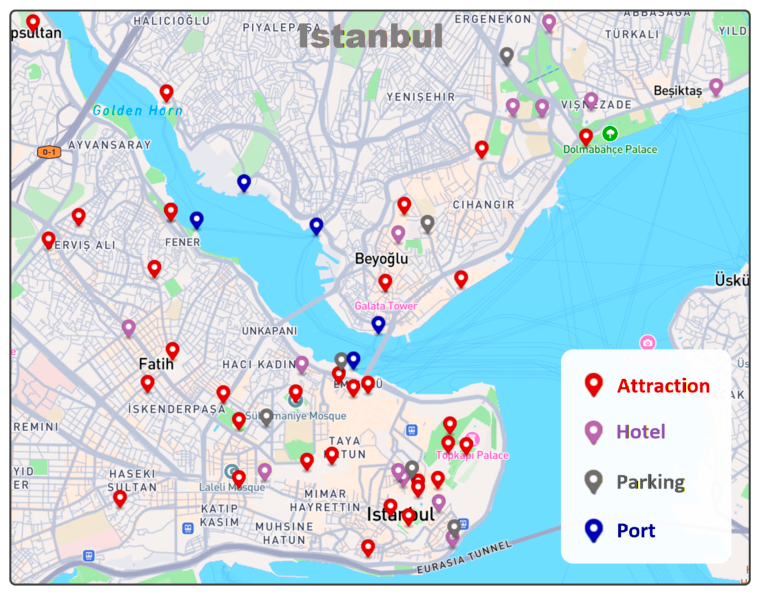
In this section, we focus on the multimodal transportation algorithm and illustrate its operation through an example. In this scenario, we assume that a set of vehicles is distributed across Istanbul and can be used to reach a given destination. More precisely, three cars are parked in two out of the three available parking areas, eight e-scooters are distributed around well-known Istanbul attractions (i.e., the Blue Mosque, Topkapi Palace, and Galata Tower), and two sea vessels are anchored at the port near the Galata Bridge (i.e., one out of the three predefined ports), as shown in Figure 4a. We further assume that the user is located near Hagia Sophia (origin) and intends to visit the Istanbul Modern Art Museum (destination). In addition, we assume favorable weather conditions and no significant traffic congestion. With respect to system configuration, the maximum walking distance per step is set to 1 km, while e-scooters and cars are limited to 4 km and 15 km, respectively. Sea vessels can travel between any of the predefined ports. Furthermore, all parking areas and ports have available capacity.

4.1. Route Planning Algorithm Demonstration

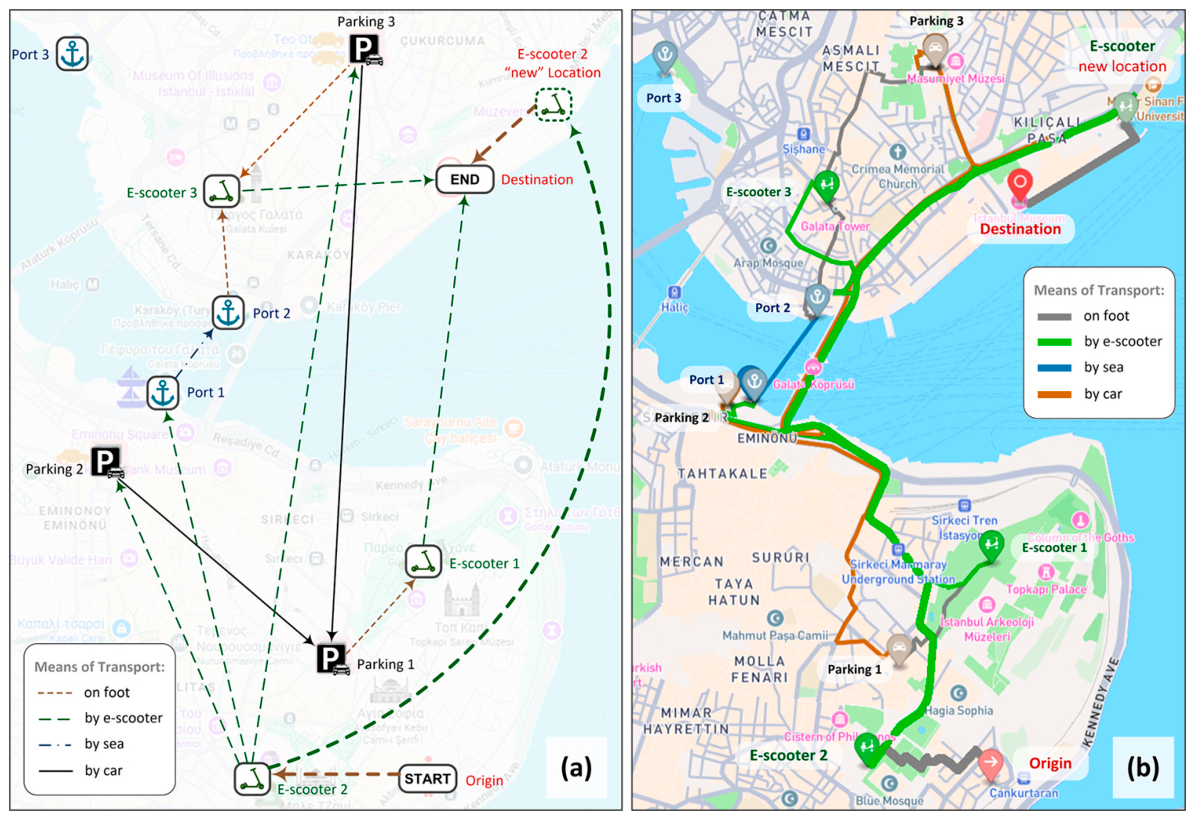
Based on the algorithm described in Section 3.2, we first identify the vehicles available at each stop. We then cluster the available e-scooters according to their locations on Google Maps and construct a directed graph consisting of the relevant entities and the links among them. These links correspond to straight-line distances that satisfy the system constraints and represent potentially feasible transitions. As a result, the graph contains 11 nodes, namely the origin and destination, the three representative scooters selected after the clustering process, the three car parking areas, and the three ports, as well as 31 edges, as shown in Figure 4b.
As illustrated in Figure 4b, the user can travel from the origin (start location) to e-scooter 2 and parking area 1, but not to e-scooter 1, since it is too far away based on the maximum walking distance defined in the system configuration. In addition, the graph allows a transition from parking area 2 to parking area 1, but not in the opposite direction, since no car is available in parking area 1 at that time. A similar constraint applies to transitions among ports. Finally, e-scooters are connected to a larger number of nodes, including more distant ones, since they can generally cover several kilometers, as defined by the maximum scooter distance in the system configuration.
Based on the constructed graph, the system identified 54 potential paths that could be followed to reach the destination. However, not all of them are feasible. More precisely, the system quickly rejected most of them (in this example, 46 out of 54) based on the sequence of entities involved in each path. For instance, there is no need to walk from the initial position to parking area 1 and then continue walking towards e-scooter 2. Similarly, there is no need to travel by car from parking area 2 to parking area 3 and then use a car again to travel to parking area 1. For the remaining eight paths, OpenStreetMap was used to compute the actual routes and the corresponding travel distances required when moving between consecutive nodes using different transportation modes. This process further reduced the candidate paths to five, as shown in Table 1, and ensured that the suggested routes satisfy the specified constraints.
The total cost of the trip depends on the transportation modes used and is computed according to the following formulas. Apart from duration and distance, all other parameters are defined within the system configuration.
t r i p _ c o s t = c o s t _ e s c o o t e r i + c o s t _ c a r i + c o s t _ s e a v e s s e l i
c o s t _ e s c o o t e r i = e s c o o t e r _ r e n t _ f e e + e s c o o o t e r _ c o s t _ p e r _ min   ×   e s c o o t e r _ d u r a t i o n i
c o s t _ c a r i = c a r _ r e n t _ f e e + c a r _ c o s t _ p e r _ km   ×   c a r _ d i s t a n c e i
c o s t _ s e a v e s s e l i = s e a v e s s e l _ t i c k e t
It should be noted that traveling from the current location of e-scooter 2 to the destination using the scooter for the entire route was not feasible, since the required distance exceeded the maximum distance that can be covered using an e-scooter. Therefore, the system suggested using the scooter for as long as possible and then continuing on foot (path no. 1), given that the destination was within walking distance from that point, as shown in Figure 5a. Alternative options could also be considered (e.g., leaving the scooter earlier and continuing on foot), but they were deliberately ignored to reduce the complexity of the algorithm. As shown in Table 1, the fastest way to reach the destination is to use e-scooter 2 (path no. 1). This route is also illustrated in Figure 5b using thicker lines.
In the above example, we assumed good weather conditions and, therefore, all available means of transport could be used. In the presence of strong winds, sea vessels cannot be used; however, this does not affect the system’s recommendations in the specific scenario considered, since the top-ranked route will remain the same. In the case of rainfall, e-scooters cannot be used (according to the assumptions adopted during the system design), and consequently no feasible path exists, since the remaining means of transport are located too far away. We also assumed normal traffic conditions; therefore, the suggested routes involving car usage are not affected. In the case of a traffic congestion in a specific area (e.g., near the Galata Bridge), the system identifies the routes passing through this area and significantly increases their estimated travel duration. However, it should be noted that, in our example, we only examine the route returned by OpenStreetMap and whether it passes through the high-traffic area. Ideally, all possible alternative car routes between two locations should be considered. This was deliberately omitted in this work, since our focus is on multimodal transportation rather than optimizing routing for a specific mode of transport. Nevertheless, a brief discussion of traffic modeling and its impact on road transportation networks is provided in Section 6.2.

4.2. Recommendations Based on User’s Preferences

Regarding the routes proposed by the system, it returns, by default, the quickest route among those identified in the previous step. However, as described in Section 3.3, the system can be instructed to operate differently either by explicitly specifying user preferences (as illustrated in the following example) or by automatically learning user behavior from historical data. For instance, if a user (e.g., a child) is not willing or not allowed to use a car and prefers to walk as little as possible, the system suggests using e-scooter 2 to reach port 1, then taking a sea vessel to port 2, and finally using e-scooter 3 to reach the destination (i.e., path no. 5 in Table 1). In contrast, if a user (e.g., a senior citizen) wishes to avoid using e-scooters, the system cannot identify a feasible path, as previously mentioned.
It should be noted that some user-specified restrictions, namely those indicating that a particular mode of transport should be avoided, are passed to the route planning algorithm to reduce the number of entities introduced into the graph and, consequently, accelerate the overall process. In contrast, user-defined constraints that require the computation of additional features to support decision making (e.g., limiting e-scooter usage to at most two times), as well as the features used to rank the remaining routes, are handled by the recommendation engine. The use of the ML model for ranking suggested routes presumes the availability of historical data and is therefore addressed in Section 5 (particularly Section 5.3), which examines system performance using simulated data.

4.3. JSON-Schema Driven Data Extraction

Users can submit the above requests to the system using natural language. More precisely, they can write one or more sentences expressing their goals, and the system can automatically identify the corresponding parameters and encode them according to the provided JSON schema so that they can be further processed by the recommendation engine. For example, when submitting the request “I would like to travel from Hagia Sophia to Galata Tower without using a car”, the system correctly identifies the locations (latitude, longitude) of both the origin and destination, along with the specified restriction, even when a few grammatical or lexical errors are deliberately introduced for testing purposes. Similarly, when submitting the request “I’d like to go to Topkapi Palace as quick as possible”, the system correctly identifies the location (latitude, longitude) of the destination and infers that “total duration” should be used to rank the suggested routes, even though this preference is not explicitly stated. However, in this case, the origin is not specified, as expected.
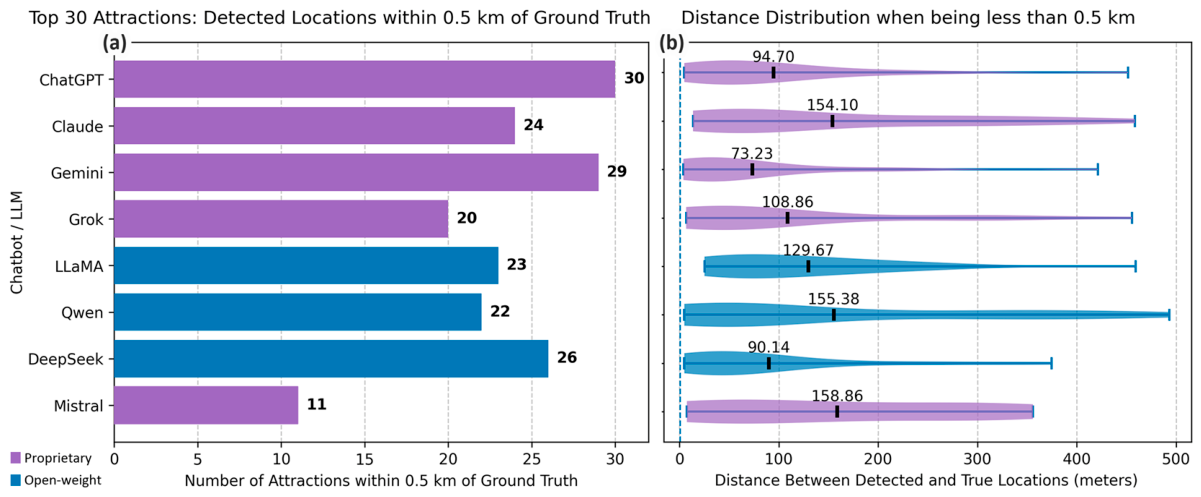
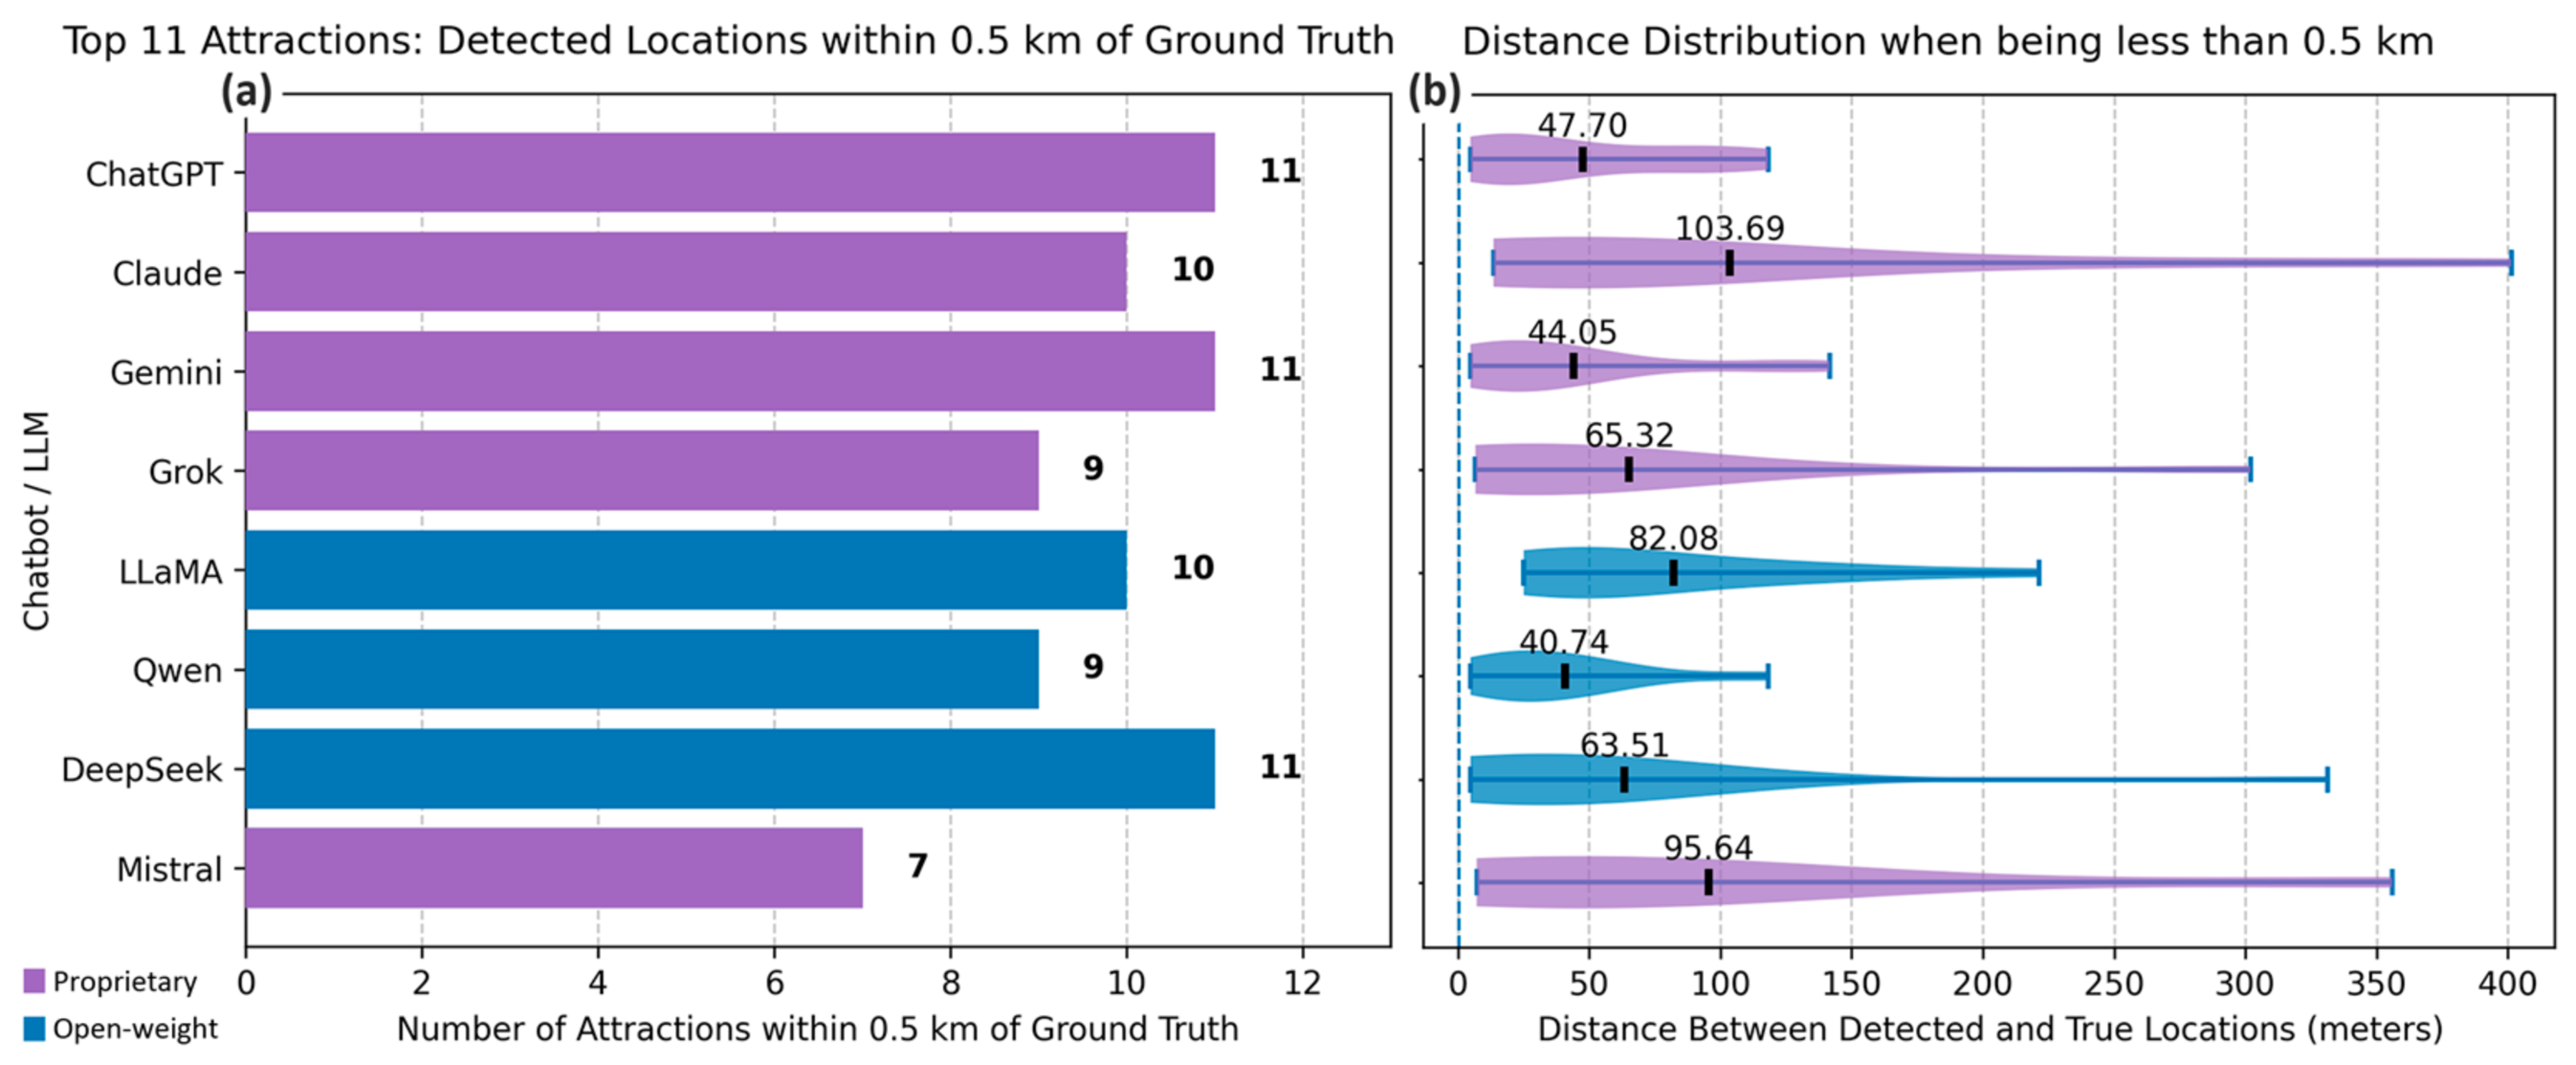
Since LLMs have a distinct role in our work, we evaluated the output of widely used LLMs (via their corresponding online chatbot), with particular emphasis on the one integrated into the developed system. This analysis also provided useful information on points of interest (POIs) in Istanbul, which was subsequently used to generate simulated data for testing purposes. Initially, we examined the locations identified by LLMs. To this end, we posed the same query to eight LLMs (five proprietary and three open-weight), requesting the top attractions in Istanbul along with their geographic coordinates in a structured format. Overall, the most popular attractions were consistently identified across models, with strong agreement in their assigned popularity. However, the reported locations (latitude and longitude) were slightly different from the ground truth in over 80% of cases, although the deviation was typically small (less than 0.2 km). In case of popular attractions, the reported locations were within 0.1 km of the ground truth in nearly 90% of cases. Further details are provided in Appendix D.
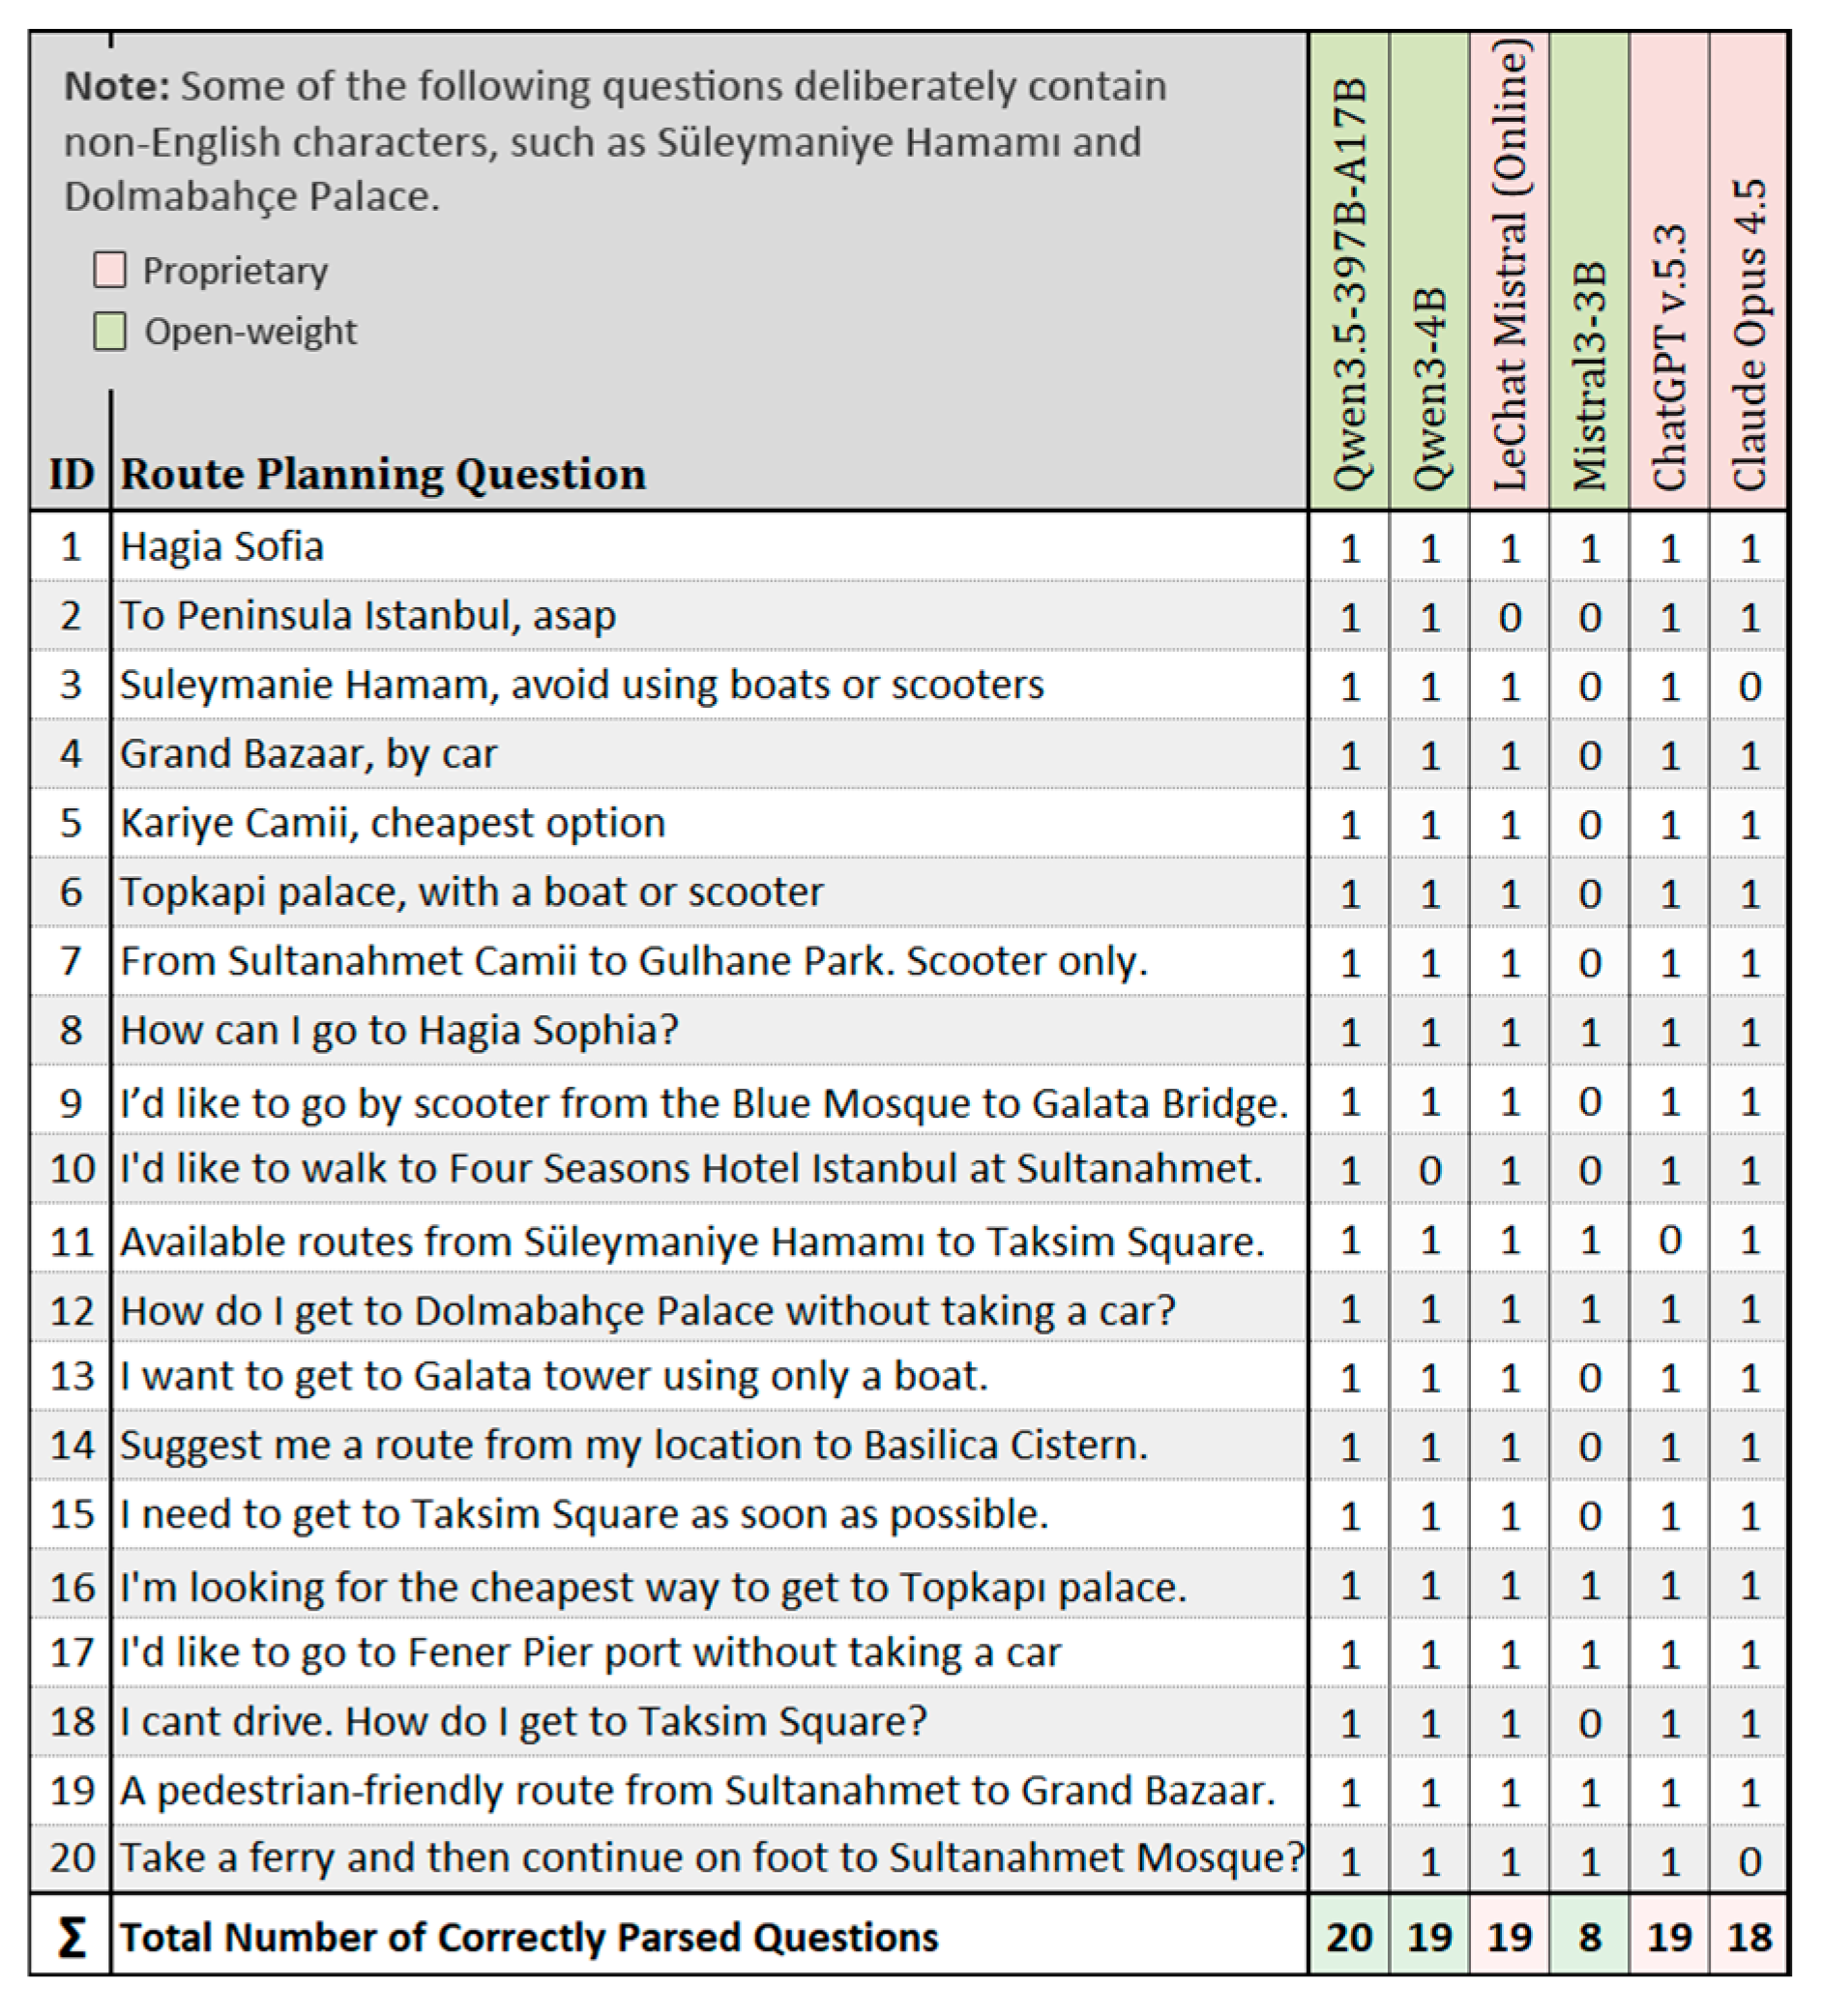
We then evaluated the extent to which LLMs can interpret users’ queries. To this end, we prepared a set of 20 route planning questions for Istanbul and prompted both proprietary and open-weight LLMs (including Qwen) to generate structured JSON outputs based on the provided data, following the process described earlier. For the open-weight models, we also deployed locally smaller variants (i.e., LLMs with approximately four billion parameters) and compared their performance. The results indicate that the smaller version of the Qwen3 model (i.e., Qwen3-4B-Q8) successfully identified the parameters of interest in 19 out of 20 queries, producing valid JSON outputs that adhere to the predefined schema. However, this model exhibits a notable computational overhead, requiring approximately 38 s on average per query. This latency is substantially higher than that observed for significantly larger LLMs accessed online via their respective chatbot interfaces, which typically generate responses almost instantaneously. Further details are provided in Appendix E.
Based on the experiments conducted, the selected LLM should be considered an assistant rather than a replacement for a user-friendly interface, which enables users to visually inspect and, if necessary, correct the identified parameters (including locations). Regarding origin and destination identification, LLMs often fail to provide precise geographic coordinates. In terms of parsing route planning queries, the smaller variant of Qwen3 was able to identify the key components of the queries in nearly all cases. However, this performance comes at the cost of increased inference time. Specifically, due to the absence of conversational history, the same instructions must be provided with each query. This results in a larger input context that the model must process repeatedly, thereby increasing the computational overhead and overall response time.

5. Study System Behavior Using Simulated Data

5.1. Simulated Data Generation

To test the behavior of the system over time, we developed an additional software program that initializes the system with a configurable number of users and vehicles within a specific area of Istanbul. The program then generates multiple user requests over an extended period and collects the data produced by the system for further analysis. To create a realistic scenario, we randomly positioned the aforementioned entities around real locations that may be encountered in practice. For this purpose, we identified popular attractions in Istanbul, widely visited hotels, as well as several parking areas and ports using several widely used LLMs. These models have been trained on a massive amount of publicly available data and are therefore capable of detecting not only the appropriate points of interest (POIs), but also their popularity and their locations on Google Maps (i.e., latitude and longitude). For completeness, the evaluation of the output generated by the LLMs and the POIs selected and used in our experiments are available in Appendix D.
Initially, the program generated a predefined number of users and randomly distributed them around the selected POIs. Men and women were assumed to be almost equally represented in Istanbul. With respect to age, according to publicly available statistics [50], approximately 20% of Istanbul citizens are children, 72% are adults, and 8% are senior (or elderly) citizens. Nevertheless, whether the generated data follow these proportions was configurable within the system. Furthermore, the program generated a predefined number of vehicles (i.e., cars, e-scooters, and sea vessels) and randomly distributed them within the selected area of Istanbul. More precisely, cars were randomly assigned to a predefined set of parking locations, and sea vessels were distributed across the predefined ports provided that the parking and port capacity constrains were satisfied. For e-scooters, since they can be available almost anywhere, their initial locations were sampled around known POIs by adding random spatial noise. The generated locations were then filtered by retaining only those located close to road segments, using the OpenStreetMap API.
In our experiments, we tacitly assumed that all vehicles of the same type are identical. For simplicity, we deliberately ignored the battery and/or fuel level of vehicles. Moreover, we assumed that cars and sea vessels can be released only at specific locations (e.g., predefined stops such as parking areas and ports, provided that there is available capacity) without additional cost, in the sense that this cost is included in the rental fee. The cost associated with vehicle use differs across modes of transport. In particular, the cost of using e-scooters depends on travel time, whereas the cost of using a car depends on the distance covered. For sea vessels, a fixed rental fee was assumed. With respect to environmental conditions, we assumed that the weather in the area of interest is favorable (i.e., a sunny and windless day) and that there is no significant traffic congestion. Nevertheless, these parameters can be easily modified when needed.
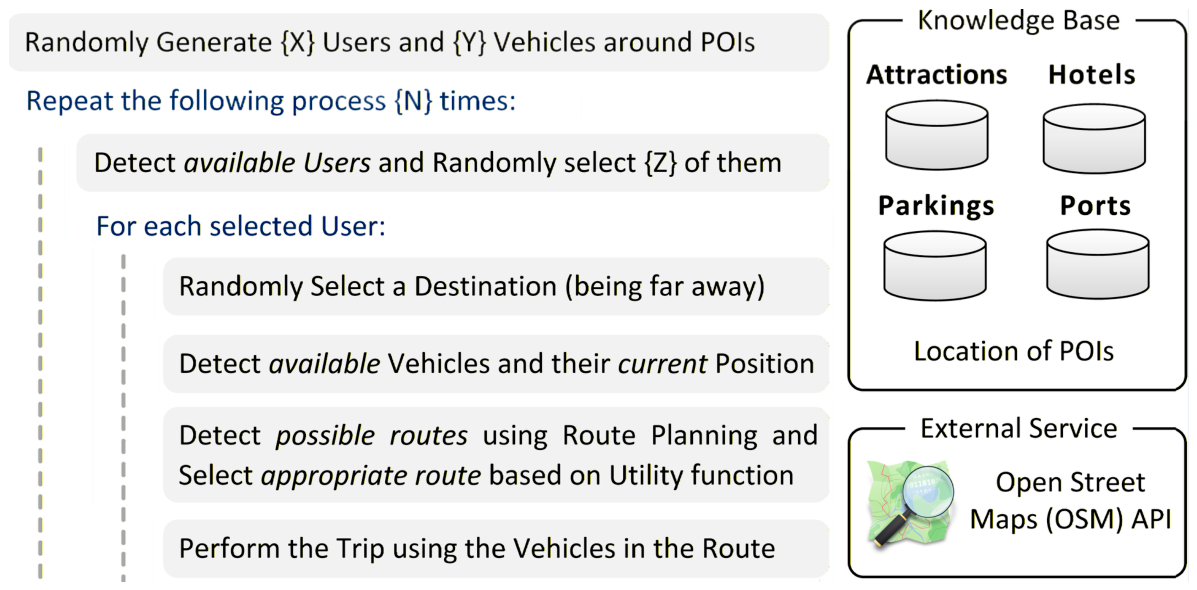
To test the behavior of the system over a given period of time, the program periodically generated a few user requests at fixed intervals (i.e., once per minute) and simulated the corresponding transitions, as described by the algorithm presented in Figure 6.
At each iteration, we randomly selected a subset of available users (i.e., users who were not already traveling) and initiated new trips. More precisely, for each selected user, we randomly assigned a destination among the available POIs and then used the system to obtain route recommendations for reaching that destination. To ensure that at least one vehicle would be required, destinations were selected sufficiently far away so that they could not be reached on foot. Subsequently, we selected the first route proposed by the system (if any), based on its utility, by choosing the route with the maximum utility value. This value depends on several features combined according to a mathematical formula (i.e., the observable component of the utility function), plus a small random term, as presented in Appendix F. In this work, we assumed that users followed the suggested routes using the reserved vehicles and released them immediately when they were no longer needed. Nevertheless, in real-world settings, this behavior may not always occur.
Each time a user initiates a trip based on a selected route, both the user and the corresponding vehicles become unavailable (i.e., reserved), so that they cannot be assigned to another user. The user becomes available again at the new location only after the trip is completed. In contrast, the reserved vehicles may become available earlier, since the user releases each of them during the trip when switching to another mode of transport. To simulate this behavior, we computed the expected trip duration as well as the expected release time for each vehicle, adding a small random noise. These values were temporarily stored in two separate dictionaries, which maintain the list of users and vehicles to be released at the end of each minute, together with their updated locations. Therefore, at the end of each minute, we examined these dictionaries to identify the users and vehicles that should become available, updated their status accordingly, and replaced their current location with the new one.

5.2. Data Analysis and Discussion

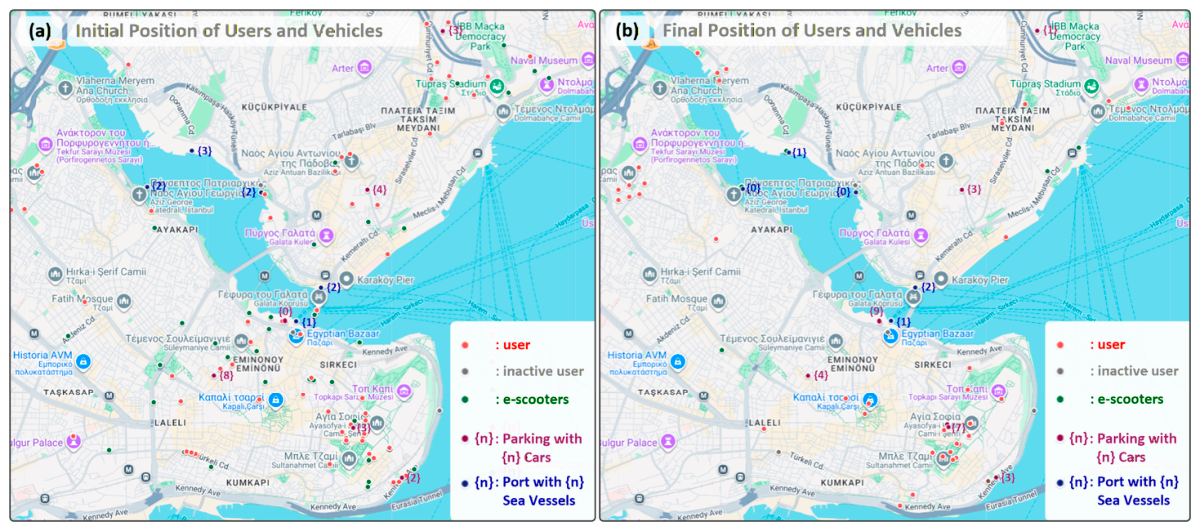
Following the aforementioned process, we recorded the data produced over a specific period of time using a predefined number of users and vehicles. According to the conducted experiment and the selected configuration (duration: 3 h, users: 80, and vehicles: 90), the database contains information about 197 trips performed by 71 distinct users within this time interval. Figure 7 presents the initial locations of both users and vehicles, as well as their locations at the end of the simulation. As can be observed, the number of users (and vehicles) shown on the right side of the figure is lower, since some users were still traveling when the simulation ended and were therefore unavailable at that time (the same applies to the corresponding vehicles). In addition, a few users (approximately 11%) were not involved in the simulation due to imposed restrictions (e.g., children and many other citizens do not hold a driving license and therefore cannot use a car), which prevented them from identifying an eligible route (e.g., because they were located too far from the remaining available vehicles), as reflected in the statistics reported in Table 2. Another reason was that a few users deliberately chose not to use any of the suggested routes for safety reasons, as using an e-scooter was required for part of their trip.
Table 2 provides summary statistics regarding the number of different types of entities at the beginning and at the end of the simulation process, further supporting the above observations. For instance, when the simulation ended, 32 users were still traveling, and 41 vehicles were reserved for these trips. Note that some vehicles used earlier during these trips had already been released during intermediate steps. For this reason, the number of unavailable users is slightly higher than the number of reserved vehicles, even though more than one means of transport may be used during their trip.
Further analysis of the collected data indicated that the system requires a considerable amount of time to identify an appropriate route when at least one feasible route exists (mean: 2.39 s, standard deviation: 5.32 s). Nevertheless, a significant fraction of the response time can be attributed to interactions with the OSM API (mean: 1.22 s, standard deviation: 1.88 s). Furthermore, the system responds rapidly when no route is available (mean: 0.17 s, standard deviation: 0.38 s). As a result, the overall average response time is below one second on average. With respect to vehicle usage patterns, users frequently used e-scooters alongside walking to reach their destination. Nevertheless, the results indicate that, in several cases, users adopted multimodal strategies, combining e-scooters with cars or sea vessels in varying sequences, as presented in Table 3.
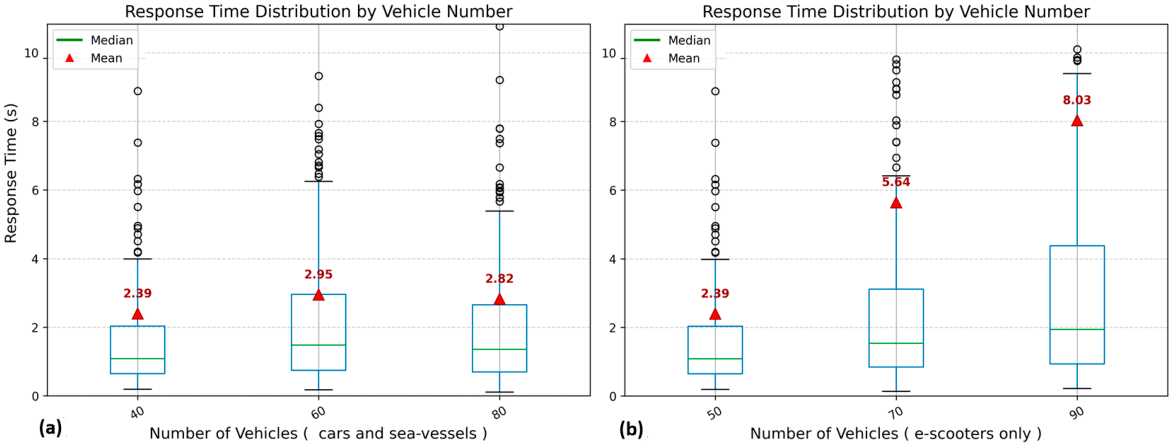
It should be noted that we repeated the above process multiple times under different configurations (i.e., varying vehicle numbers) to further evaluate system behavior under different conditions. More precisely, we examined how the total execution time is affected by the number of available vehicles, including cars, e-scooters, and sea vessels. First, we repeated the simulation three times while increasing only the number of cars and sea vessels by 20 in total. We then repeated the simulation three additional times while increasing only the number of e-scooters by 20. The results are shown in Figure 8.
As expected, increasing the number of cars and sea vessels does not significantly affect the system response time. This occurs because the complexity of the constructed graph does not increase, since the graph structure (i.e., its nodes) is driven by the predefined car parking areas and sea-vessel ports rather than by the number of vehicles located at these stops. On the other hand, having more vehicles at these locations increases the probability that at least one vehicle is available and, consequently, increases the number of feasible links introduced into the graph, which may slightly increase the number of candidate paths. In contrast, when the number of e-scooters increases, the response time increases significantly, approximately in a linear manner with a relatively steep slope. This is because e-scooters can be located almost anywhere, thus increasing the number of nodes and edges introduced into the graph and, consequently, the overall complexity of the algorithm. Nevertheless, this behavior is strongly affected by the clustering process and, in particular, by the clustering radius used in DBSCAN.
To evaluate the impact of the DBSCAN radius on e-scooter clustering and route planning, we analyzed the system output for a representative case using different radius values. As shown in Figure 9, increasing the radius value reduces the number of detected clusters and, consequently, the execution time. However, larger radius values also produce clusters that cover broader areas, thereby affecting the route planning process and potentially leading to suboptimal routes.
In addition to DBSCAN, we evaluated the clustering results produced by K-means for the same cases. Specifically, we examined how e-scooters are grouped when K-means is configured to generate the same number of clusters as DBSCAN. The analysis indicates that both methods produce similar results when the data are partitioned into many clusters. However, for a smaller number of clusters, K-means yields more suitable results, as it produces spherical or ellipsoidal clusters that enable more accurate representation by their centroids (or by nearby e-scooters) in the route planning process. Further details are provided in Appendix C.

5.3. ML Development and Evaluation

Following the previous process, we collected a considerable amount of data from multiple hypothetical use cases under different configurations. During these experiments, we assumed that users select an appropriate route from those suggested by the system by evaluating multiple attributes, which are incorporated into a predefined mathematical specification of the utility function, consisting of a systematic (observable) component and a stochastic (random) error term. We then investigated whether such behavior can be modeled using a traditional ML technique. As described in Section 3.3, a ML model can be developed for this purpose and can be used to rank the routes identified by the system, so that the most suitable options appear at the top of the list. In this section, we present the evaluation of the developed ML model using the simulated data generated through the above process. The goal is to automatically rank the suggested routes in an appropriate order, without requiring users to explicitly specify their preferences.
The development of the ML model was based on a dataset generated from five different simulation runs, in which the number of registered vehicles varied. This dataset contains 8925 records, each described by 25 features, including a label indicating whether the suggested route was selected by the user. The demographic characteristics of the simulated users are aligned with population statistics of Istanbul, with approximately 20% children, 70% adults, and 10% senior citizens. Nevertheless, the dataset is imbalanced, since in each interaction only one route was selected. To address this issue, we applied oversampling by duplicating the records corresponding to the selected routes, which represent the minority class. Alternatively, more advanced techniques could be applied, such as SMOTE [51].
With respect to the input features, we examined their discriminative power using the mutual information score, as well as the correlations among them. This analysis suggested that the demographic characteristics of users were not informative and could therefore be omitted. However, this finding was misleading, as some of these features (e.g., possession of a driver’s license) were directly utilized by the route planning mechanism to exclude certain transportation modes, such as cars, from the search process. Consequently, the suggested routes did not include these options. The selection of the appropriate route was largely driven by the observed utility value, which emerged as the most informative feature among all considered variables. Nevertheless, this feature was excluded from further analysis to focus on the remaining features and to investigate whether, and to what extent, the appropriate route can be predicted by a ML model based solely on them. System configuration parameters, such as the total number of available cars, e-scooters, and sea vessels, were found to be uninformative and have therefore been omitted. For the remaining features, we removed those representing the number of vehicles of each type included in a route, since they were strongly correlated with the distance covered using the corresponding transportation modes.
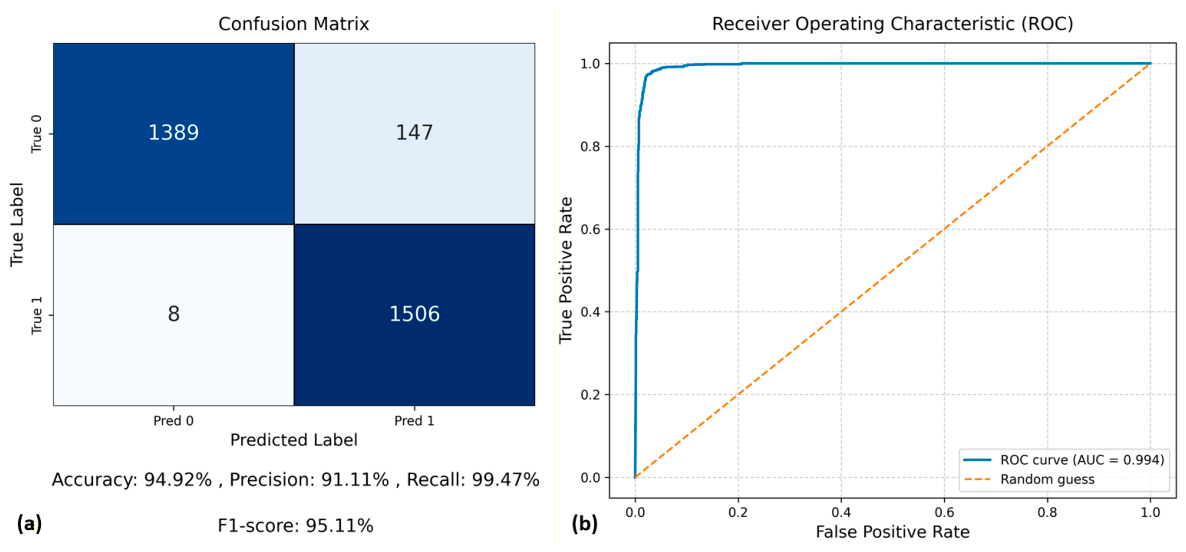
The final dataset used for ML model development is balanced and contains 15,246 records, each represented by 10 numeric features. This dataset was further split into three distinct subsets, namely training (contains 10,671 records, i.e., 70%), validation (contains 1525 records, i.e., 10%), and testing (contains 3050 records, i.e., 20%), which were used during the ML model development process. In our work, we employed a Random Forest classifier, which includes several hyperparameters, such as the number of estimators and the maximum depth of the generated trees that must be specified before training. To select appropriate values, we examined different hyperparameter combinations using grid search and chose the configuration that maximized accuracy on the validation set. We then evaluated the resulting model using the testing set. The results indicate that the model can accurately distinguish selected from non-selected routes (accuracy: 94.92%), as shown in Figure 10.
Since the developed ML model was primarily designed to rank the suggested routes, we further examined the extent to which this objective can be achieved based on the predicted selection probabilities. For this purpose, we executed the simulation process again using slightly different configuration parameters and compared the recommendations produced by the system with those produced by the ML model. More precisely, we examined whether the top-ranked route in the two lists was the same, namely the route selected versus the route ranked highest by the ML model. The evaluation indicated that the developed ML model could correctly predict the appropriate route in 218 out of 224 cases (i.e., accuracy: 97.32%), each of which included, on average, 29 different alternatives. These results indicate that the model performs much better when applied to selecting the optimal route from the set of available alternatives within a given case.

6. Further Discussion and Future Directions

6.1. Strengths and Limitations of the System

The developed system enables users to identify the most appropriate routes to their destinations by combining multiple shared vehicles of different types. These vehicles may be station-based (e.g., sea vessels), dockless (e.g., e-scooters), or support a hybrid operational model, such as cars that can be parked either in predefined parking locations or in designated free parking areas. The system further accounts for various parameters related to the vehicles and users, as well as weather conditions and traffic levels, so that it can propose the most appropriate routes for each situation. However, the proposed system has certain limitations regarding the supported vehicles and the underlying mechanisms, which should be addressed in future work.

6.1.1. Route Planning and Data Clustering

In this work, we assumed that vehicles such as cars and e-scooters have sufficient battery or fuel capacity to complete a trip and, if necessary, can automatically return to the nearest charging station. As a result, users can complete a trip (i.e., cover the maximum specified distance) without requiring intermediate charging. Alternatively, charging-station availability could be explicitly incorporated into the route-planning algorithm to support longer trips [35]. In addition, we assumed single-user vehicle usage. However, certain vehicle types can accommodate multiple passengers (e.g., cars and small sea vessels), potentially reducing travel cost. This setting increases the complexity of route planning, especially for cars, since pick-up and drop-off locations are not fixed. Therefore, carpooling [36] and ride-sharing [52] approaches should be considered in future extensions. Private cars and public transport, which have been deliberately ignored in this work, should be taken into consideration in future extensions of the system. Nevertheless, given the adopted approach, which supports both station-based and dockless vehicles, their integration into the system is relatively straightforward.
The proposed system can provide personalized services to each user individually, rather than processing requests coming from multiple users (e.g., within a short time period) collectively. The latter approach could enable more informed decisions regarding potential traffic congestion, for example by avoiding the recommendation of cars to many independent users traveling to the same destination simultaneously [23]. Moreover, integrating the proposed system with existing infrastructure and/or private vehicles (e.g., via sensors or camera-based monitoring) could enhance its understanding of user demand and traffic conditions, thereby enabling improved, environmentally friendly routing decisions and increasing user satisfaction.
The suggestions provided by the developed routing system are based on the current status of the vehicles (e.g., availability and location), as well as prevailing weather and/or traffic conditions. Consequently, the system does not take into account nearby social events, such as concerts and sports games, which may significantly increase road traffic. Moreover, sudden changes in weather conditions, which may also affect a trip (especially when “vulnerable” vehicles are used at a later stage of a trip), are ignored. The system could provide improved suggestions by forecasting these factors (e.g., predicting weather conditions for the next hour) and by considering relevant events that may directly affect them. To support this functionality, the integration of external services and registries would be necessary.
Regarding the underlying mechanism used to identify eligible routes, we observed that it requires considerable time. Accelerating this process is feasible by maintaining the graph in memory, reducing the number of edges (and hence paths) introduced during the initial steps of route planning, deploying and using external services locally, and executing independent time-consuming processes in parallel (e.g., route detection using OpenStreetMap). Furthermore, e-scooters could be organized into predefined regions (as in Hydra [27]) to keep the number of clusters stable. Alternatively, e-scooters could be initially grouped into coarse clusters (e.g., using K-means to find a small number of clusters) and then refined into smaller ones (e.g., using DBSCAN with a small radius value) only when the corresponding coarse clusters are involved in feasible routes, enabling faster and more targeted vehicle selection. Response time can be further improved by precomputing potential paths between distinct areas of a city and frequently used means of transport (as in work [22]), thereby limiting the number of graph nodes and, consequently, the number of edges that must be considered when a new routing request arrives.

6.1.2. User Behavior and Route Selection

Studying user behavior is essential for informed decision-making. In this work, a utility function was developed for route selection purposes during the simulation process based on insights from the literature rather than empirical data. In general, two main approaches can be employed to analyze user behavior: directly eliciting preferences through targeted questions or inferring preferences from observed data [53]. In the former case, user preferences are derived from statements about hypothetical scenarios involving different transport options, commonly referred to as stated preferences (SP). In the latter case, known as revealed preferences (RP), user behavior is inferred from actual decisions made in real-world contexts, alongside contextual data collected during the use of various transport modes. Currently, a substantial amount of both SP and RP data exists for various cities and transport modes worldwide. Nevertheless, leveraging such data for route evaluation in a multimodal context, as well as transferring the derived insights across different urban environments, remains a significant challenge.
The route selection process is influenced by multiple factors, including travel time and travel cost, both of which depend on the specific transport modes involved in a trip. The importance of these features may vary across individuals within a population, depending on their demographic and socioeconomic characteristics, such as age, gender, education level, and income. In addition, users consider qualitative attributes, including comfort, safety, and environmental sustainability, which may themselves be influenced by external conditions such as weather and traffic levels. Travel time is particularly critical, as it is often subject to variability [54]. This variability may be predictable, for example due to recurring congestion during peak hours, or unpredictable, such as delays resulting from accidents. Consequently, travel time reliability emerges as a key parameter in the decision-making process, as it is closely associated with the unpredictable component of travel time variability.
For ranking feasible routes, we developed a Random Forest classifier trained on historical data, capable of accurately distinguishing selected routes from non-selected ones. Alternative methods, such as logistic regression and k-Nearest Neighbor (kNN), were considered but not adopted in this work. Logistic regression, while feasible, may not adequately capture complex patterns in the data, whereas kNN is computationally expensive at inference time, as it requires comparisons with all training instances. Artificial neural network (ANN)-based approaches, such as MLPs or LSTMs, were deliberately not employed due to the limited dataset size, which increases the risk of overfitting. These approaches can be particularly effective when the system is deployed in a real-world urban environment, where large volumes of data with rich feature sets are available. Given the purpose this model serves, its performance could be further improved by employing DL techniques that directly optimize route ranking [55], rather than independently predicting route eligibility for each user.
In this work, the ML model was trained using data collected from the entire user population rather than from individual users. This approach enables the system to provide meaningful recommendations even for new users who have just entered the system, provided that their behavior is similar to that of other users within the same group. Alternatively, training a separate ML model for each user could also be considered, assuming that sufficient user-specific data are available. This approach would enable software systems to account for individual user preferences and the relative importance assigned to route features, which may not be accurately inferred solely from the user characteristics recorded in the system. To leverage the advantages of both approaches, system recommendations could be derived by combining their outputs.

6.1.3. LLMs and Data Management

Large language models (LLMs) can significantly enhance user–system interaction by enabling communication through natural language. Even smaller-scale LLMs are capable of accurately interpreting user intent. However, to precisely determine the locations of POIs, LLMs should be integrated with external services. Smaller LLMs deployed locally may require considerable execution time, as they must process both system instructions and user queries. Fine-tuning these models could help accelerate this process. Alternatively, a hybrid approach could be adopted, in which locally deployed smaller LLMs perform named entity recognition to anonymize sensitive parts of user queries, allowing an online LLM to handle the remaining processing. This approach may offer a viable solution and should be explored in future work.
LLMs can also support route planning and selection by efficiently processing information from relevant sources, such as public transport schedules, in combination with user profiles derived from data stored on mobile devices. This would enable the generation of more personalized and context-aware route recommendations. Furthermore, LLMs can analyze content from social networks to identify events that may impact routing decisions, such as traffic congestion or changes in public transport services, thereby improving the adaptability and reliability of the route planning process. On the other hand, LLMs must be used with caution, as they are prone to generating hallucinations.
In the current system implementation, a substantial volume of user data is collected, including demographic attributes and travel behavior, with the aim of enhancing system performance. However, this practice introduces significant privacy and security concerns. To mitigate these risks, all collected data should be systematically evaluated, and any parameters that do not contribute to the development or performance of the ML model should be eliminated. For the remaining data, values should be recorded at the minimum level of detail required to serve their intended purpose. For instance, age groups may be stored instead of exact ages, and geographic coordinates may be reduced in precision to represent broader areas rather than exact locations. Furthermore, data retention should be strictly limited, with information stored only for a defined period (e.g., one year) and automatically deleted thereafter. All retained data must be safeguarded using state-of-the-art security measures and access should be restricted to authorized entities, including the corresponding users and the software components responsible for model optimization. In accordance with the General Data Protection Regulation (GDPR), users must be clearly informed about the nature and purpose of data collection, granted the right to access their personal data, and provided with the ability to request its deletion at any time [56]. Additionally, relevant national data protection laws and regulations should be considered.

6.2. Sustainable Transportation and Urban Infrastructure

There is also a growing need for the development of environmentally sustainable transportation solutions [57]. Traditional transport planning primarily focuses on aligning transport demand with supply through the provision of transportation services. In contrast, sustainable urban mobility shifts the emphasis toward enhancing accessibility and improving overall quality of life within cities. Its key objectives include promoting broader accessibility, reducing dependence on private automobiles, improving energy efficiency, and lowering carbon emissions, ultimately contributing to more livable urban environments [58]. In this work, we focused on vehicles developed within the EcoMobility project, which are environmentally sustainable by design, as they rely on electric power (e.g., e-scooters) or reduce the use of fossil fuels (e.g., cars and sea vessels). Consequently, we did not incorporate additional sustainability-related factors such as energy consumption, carbon dioxide emissions, and noise pollution. These factors should be considered, particularly when conventional vehicles are integrated into the system (e.g., public transportation and private vehicles), since most of them still depend on fuel-powered engines.
Road traffic congestion is a major problem in urban areas (including Istanbul) and is often exacerbated by the limited availability of free parking spaces. This can increase trip duration and cost, as well as energy consumption and carbon dioxide emissions [59]. In this work, we adopted a simplified approach to traffic modeling by primarily focusing on roads experiencing high congestion (i.e., traffic jams), where travel times are adjusted accordingly. While this assumption enables efficient route computation and supports basic traffic-aware recommendations, it does not capture more detailed traffic dynamics at the microscopic and network levels. In particular, it does not account for dynamic traffic assignment mechanisms, such as Dynamic User Equilibrium, nor does it consider the spatial and temporal propagation of congestion across the road network. Furthermore, time-dependent variations in traffic conditions and complex traffic flow interactions are not explicitly modeled. Therefore, future work should incorporate more detailed and realistic traffic models [60], capable of representing these phenomena, to improve the accuracy and robustness of the proposed route-planning mechanism.
Multimodal transportation is also relevant to Park and Ride (P&R) systems. A P&R system [61] provides a set of facilities distributed throughout the urban environment of a city to establish connection points, or modal interchanges, between private vehicle users, such as cars, and more sustainable modes of transport, such as public transport. These systems are particularly useful for users living in areas outside the urban perimeter, where there are few or no direct connections to public transport, who travel daily to a central business district with high traffic and limited parking availability. The facilities included in a P&R system are important, and several parameters must be taken into consideration (e.g., their location and cost) in order for the system to succeed. On the other hand, the complexity of the corresponding recommendation systems is relatively limited, compared to general multimodal transportation systems, since they focus on specific transport modes for which transitions take place at predefined locations (e.g., metro or train stations).
The infrastructures and services needed for micro-vehicles are also important [34]. In the case of private micro-vehicles, they usually need to be stored at both ends of a trip, and therefore the availability of parking areas near public transport stations and other points of interest (e.g., shopping centers) is essential. In the case of shared micro-vehicles, their availability at the aforementioned locations, along with designated areas to temporarily park them, is particularly important. Furthermore, the existence of a safe, comfortable, and continuous network of dedicated and protected lanes for micro-vehicles is critical for the successful use of both private and shared micro-vehicles by city residents for their daily transportation needs. For electric vehicles, charging station locations are essential for enabling longer trips. Additional factors should also be considered, including the technologies used by the relevant software platforms (e.g., real-time data), the condition and status of micro-vehicles, and the pricing scheme.

7. Conclusions

In this work, we presented a system that enables authorized users to identify the most appropriate route from an origin to a destination using multiple transportation modes. The proposed system supports both station-based and dockless shared vehicles, allowing users to identify routes that best match their needs, which may be specified either explicitly or inferred from historical data. To this end, the system considers the status of shared vehicles, user demographic characteristics, environmental conditions, and contextual factors such as traffic congestion to generate feasible routes and rank them, ensuring that the most appropriate options appear at the top of the recommendation list. The evaluation of the proposed system using simulated data indicated that it responds within a reasonable time, while the developed ML model predicts suitable routes with a high degree of accuracy, thereby supporting the ranking of available alternatives. The evaluation also highlighted several limitations that should be addressed in future work, particularly those related to user interaction and the underlying mechanisms and ML models employed for vehicle clustering, route planning, and recommendation.
In this work, we focused on the vehicles being developed by the partners directly involved in the EcoMobility project, namely cars, e-scooters, and sea vessels, which can be shared among members of a community. The proposed approach and the developed system can be extended to support additional transportation modes, including private and public vehicles, with minor modifications. Our work mainly focuses on identifying the most appropriate combination of transport modalities rather than on precisely estimating trip start and end times or designing the billing mechanisms required for such services. These aspects are particularly important when shared vehicles are integrated with public transport (e.g., buses and trains), which typically operate according to fixed timetables. With respect to payment, additional systems would be required to support a unified and user-friendly billing process that covers all involved transportation services, including those operated by external providers (e.g., public transport), which may follow different pricing policies and payment infrastructures.

Author Contributions

The work presented in this document was carried out by E.C., who conducted the relevant study, implemented the core components of the system (route planning and recommendation engine), described the approach followed and background mechanism being used and performed the experimental evaluation. L.A. developed the data management module as well as the web application used for user interaction. The manuscript was reviewed by A.L. and T.V. All authors have read and agreed to the published version of the manuscript.

Funding

This research was funded by the European Commission under the Horizon Europe project EcoMobility, grant number 101112306.

Data Availability Statement

The data presented in this study are available on reasonable request from the corresponding authors. The data are not publicly available due to ethical considerations.

Conflicts of Interest

The authors declare no conflicts of interest.

Appendix A. Data Management

The data management component ensures the persistent storage of the data generated and collected throughout the two main phases of the system. During system initialization, it enables system administrators to register new vehicles, such as e-scooters, cars, and sea vessels, along with additional information related to them, such as car parking locations and sea-vessel ports. It also supports the registration of regular users, including their demographic characteristics. During the operational phase, when citizens of a smart city use the system for their daily transportation needs, the system enables different entities (e.g., sensors and regular users) to update vehicle status information (e.g., current location and availability), environmental conditions (e.g., weather conditions and high-traffic areas), as well as other relevant data generated during system usage. In particular, the system provides the necessary functionality to record the recommendations generated by the system, including the computed features for each alternative, as well as the routes ultimately selected by users. This layer also enables registered users to reserve or release a vehicle upon embarkation or disembarkation, respectively.
The data structures used are presented in Figure A1. The system records information about users, vehicles, stops (e.g., car parking areas), environmental conditions (e.g., weather and road traffic), as well as data generated through user interaction with the system (e.g., recommendations produced, routes selected, and actions performed). In our work, only a limited number of parameters were recorded for each of the aforementioned entities. With respect to user demographic characteristics, we recorded gender and the corresponding age group. For the latter, we adopted a simple and coarse classification scheme that groups users into three categories, namely children, adults, and senior citizens, which was sufficient for the needs of our experiments. We also followed a simplified approach for modeling weather conditions and road traffic. More precisely, we recorded whether it was raining or not, and whether strong winds were present at a given time and location. For road traffic, we recorded the locations of traffic jams, assuming that routes passing through these areas (i.e., areas around the corresponding points) would experience significant delays.
Figure A1. Data structures of the main entities of the system.
Smartcities 09 00078 g0a1

Appendix B. Interaction Among Entities and Used Technologies

The interaction among the system components is illustrated in the Figure A2. Users interact with the user interface (UI) to specify their origin, destination, and, if necessary, additional preferences. If user queries are expressed in natural language, a large language model (LLM) is employed to interpret them. The recommendation engine then communicates with the route planning component to retrieve feasible routes for the user. These routes are ranked according to a developed machine learning (ML) model. The route planning component, in turn, interacts with the data management layer to obtain real-time information, including vehicle locations, weather conditions, traffic levels, and the availability of parking spaces and ports. Subsequently, the system clusters vehicles (currently focusing on e-scooters) and constructs a graph representation. In combination with the Open Street Map (OSM) API, it identifies possible routes and enriches them with additional relevant information (e.g., expected duration, number of transportation mode changes). Finally, users can reserve the vehicles associated with their selected route.
The system was developed in Python 3.11 using several libraries, including OpenRouteService (ORS) [62] for integration with the OpenStreetMap API, SQLAlchemy [63] for data storage in an SQLite database, and geojson for representing data in GeoJSON format [64], which is supported by various publicly available visualization tools. For data clustering and ML model development, we used the scikit-learn library, which provides implementations of multiple ML algorithms, along with NumPy, pandas, and matplotlib, among others. In addition, the system functionality was exposed to relevant entities through REST services implemented using the FastAPI [65] library. Finally, interaction with the locally hosted LLM was conducted via the OpenAI API [66].
Figure A2. Sequence diagram for getting recommendations.
Smartcities 09 00078 g0a2

Appendix C. E-Scooter Clustering

In this study, we also examined e-scooter clusters identified in a representative case using DBSCAN under varying radius values. The minimum number of entities per cluster was set to one, enabling the detection of clusters containing only one or two entities. Despite their small size, such clusters indicate the presence of e-scooters in each area and are therefore as important for route planning as larger clusters. As shown in Figure A3, a radius of 0.25 km results in many small clusters, each containing one or a few e-scooters. In contrast, a radius of 1 km produces a single large cluster covering a significant area of Istanbul, along with a few smaller clusters containing limited numbers of e-scooters. These findings indicate that increasing the radius leads to overly large clusters that, when represented as single nodes, fail to capture spatial detail and may result in suboptimal routing. Therefore, smaller radius values are better suited for route planning, although a trade-off remains between computational efficiency and routing optimality.
Since DBSCAN does not always produce clusters that are well-suited for route planning, we additionally evaluated clustering using K-means. Specifically, we examined the grouping of entities when K-means is configured to produce the same number of clusters as those identified by DBSCAN. The results are presented in Figure A4. When the number of clusters is set to 35, both methods yield comparable groupings. However, when the number of clusters is reduced to six, K-means produces clusters that are more suitable for route planning, as they exhibit more regular (circular or elliptical) shapes and provide better spatial coverage of the corresponding areas.
Figure A3. E-scooter clustering using DBSCAN for various radius values. In these figures, bullets represent the real location of e-scooters, the gray areas the clusters detected, and the squares their center.
Smartcities 09 00078 g0a3
Figure A4. E-scooter clustering using K-means with different number of clusters. In these figures, bullets represent the real location of e-scooters, the gray areas the clusters detected and the squares their center.
Smartcities 09 00078 g0a4

Appendix D. Attractions and Other POIs

We evaluated the output of eight widely used LLMs (Table A1) by requesting the top 30 attractions in Istanbul, along with their popularity and geographic coordinates (latitude and longitude). We then identified the unique attractions and analyzed their assigned popularity, with particular focus on the locations provided by each LLM. For validation, the ground truth locations were manually recorded using Google Maps, along with variations in naming.
Table A1. LLMs used in our experiments.
UIDOrganizationChatbotLLMType
ChatGPTOpenAIChatGPTGPT-5.3-Instantproprietary
ClaudeAnthropicClaudeSonnet 4.6proprietary
GeminiDeepMindGoogle GeminiGemini Flashproprietary
GrokxAIGrokGrok 4.20 Autoproprietary
LLaMAMeta AILLaMALLaMA 3 (70B)open-weight
QwenAlibabaQwen ChatQwen3.5-397B-A17Bopen-weight
DeepSeekDeepSeekAI chatbotDeepSeek-V3.2open-weight
MistralMistral AILeChat MistralMistral Largeproprietary
In total, the LLMs identified 60 semantically distinct attractions. The most popular attractions (11 out of 30) were consistently reported by all models, whereas less popular ones were mentioned by only a subset of them. Minor discrepancies were observed in the assigned popularity, increasing slightly for less prominent attractions. To assess location accuracy, we computed the geodesic distance between the reported and real coordinates of each attraction. The results presented in Figure A5 indicate that LLMs do not consistently provide precise locations. However, in many cases, the error was below 500 m.
Figure A5. Locations of the top 30 attractions detected by different LLMs. (a) Number of attractions within 0.5 km of the ground truth; (b) distribution of distances for these attractions.
Smartcities 09 00078 g0a5
Further analysis of the data for the 11 attractions identified by all examined LLMs highlighted that these were the most popular attractions, and that location accuracy was significantly higher compared to the location of the rest sites identified by the respective LLMs, as shown in Figure A6 (especially in comparison with Figure A5). For instance, the geographical locations of the 30 attractions returned by ChatGPT are, on average, 95 m away from the expected ones, whereas when focusing on the top 11 attractions, this distance is reduced to 38 m.
Figure A6. Locations of the 11 attractions detected by all LLMs. (a) Number of attractions within 0.5 km of the ground truth; (b) distribution of distances for these attractions.
Smartcities 09 00078 g0a6
Based on the conducted analysis, Gemini [67], DeepSeek [68], and ChatGPT [69] provide satisfactory results, with the average distance between the predicted and actual locations being less than 100 m. When focusing on popular attractions, Qwen [70] also demonstrates good performance with average distance of attractions within 0.5 km of ground truth being less than 40 m on average. In contrast, Mistral [71] exhibits the lowest accuracy.
A similar process was followed for studying hotels, ports and parking areas with similar outcomes. A subset of the data was selected for our experiments. Providing an exhaustive list of these locations is beyond the scope of this document. Nevertheless, we include a visual representation of the selected POIs in Figure A7 to illustrate the covered area, as users and vehicles were randomly distributed around these points.
Figure A7. Points of interest used in the simulation process.
Smartcities 09 00078 g0a7

Appendix E. LLMs for Route Planning Questions

To assess the ability of LLMs to correctly process user queries, we prepared a set of 20 route-planning questions and evaluated the outputs generated by widely used open-weight and proprietary LLMs, including smaller variants of these models, with a particular focus on Qwen. During the design of these questions, we considered different modes of user interaction. Specifically, typed queries are typically concise and may include grammatical or lexical errors, whereas spoken queries (transcribed into text) tend to be longer, more descriptive, and grammatically well-formed. The questions and the corresponding evaluation results are presented in Figure A8. It should be noted that the number of queries is limited and the evaluation was conducted manually, introducing a degree of subjectivity. Nevertheless, the results provide useful insights into the expected performance of the examined LLMs.
Figure A8. Route planning questions and LLM outcome evaluation. In this figure, 1 indicates that the questions have been correctly parsed by the LLM, whereas 0 indicates that at least one error has been detected.
Smartcities 09 00078 g0a8
Based on the experiments conducted, both proprietary and open-weight LLMs with hundreds of billions of parameters are capable of correctly parsing the majority of the evaluated route planning queries. Among the smaller open-weight models tested, Qwen3-4B demonstrated reliable parsing performance, whereas Mistral3-3B (Smaller-scale Mistral models are open-weight LLMs, whereas Mistral Medium and Large are proprietary LLMs) failed to consistently interpret the given questions accurately.
Furthermore, we evaluated the inference time required by the smaller Qwen model to generate responses for the same set of route planning queries. The results indicate that the Qwen3-4B (Q8) requires an average of 38 s per query. However, the response time exhibits substantial variability, with a standard deviation of 33.9 s. It is important to note that all experiments were conducted on a laptop equipped with an NVIDIA GeForce RTX 2060 GPU featuring 6 GB of memory. This hardware configuration was sufficient to load and run the 8-bit quantized Qwen3-4B model entirely on the GPU using LM studio v.0.4.8 [72].

Appendix F. Utility Function for Trip Assessment

The utility function adopted in this study (Equations (A1) and (A2)) was developed based on the analysis of relevant publications rather than transportation data. In line with the established literature [53,54,73], travel time and travel cost are expected to negatively influence user utility, whereas qualitative service attributes, such as comfort, safety, and environmental friendliness, are assumed to contribute positively to the overall utility of an alternative. In our work we have also assumed that the cost and safety of trips is affected by user demographics and especially their age group. The relative magnitudes of the parameters were determined based on commonly reported ranges in the literature, as well as value-of-time considerations, ensuring consistency between time and cost sensitivities. It should be noted that, in the absence of revealed or stated preference data for model calibration, these coefficients are not estimated but rather assumed to provide a reasonable approximation of user behavior for testing purposes.
Equation (A1) presents the utility function used in our experiments. The utility function consists of two components: the observable part (i.e., Vij whose mathematical formulation is presented in Equation (A2)) and an error term (i.e., εij) which represents the unobservable part.
Uij = Vij + εij
Vij = −0.1 × Duration − (1.0 + 0.5 × Young) × Cost + (1.0 + 0.5 × Elderly) × Safety + 0.7 × Comfort + 0.5 × Env
The definitions of the independent variables presented in Equation (A2) are provided in Table A2. It should be noted that the above utility function was developed solely for testing purposes. In particular, it was used during the simulation process to generate realistic route choices. In this function, the error term is represented by a random value drawn from a predefined range.
Table A2. Utility function parameters. The value of these parameters is affected by weather conditions and traffic levels.
ParameterDescription
DurationA numerical variable representing the total travel time from origin to destination for a given transport alternative, expressed in minutes.
CostA numerical variable representing the total monetary cost of traveling from origin to destination for a given transport alternative, in euros.
YoungA binary variable indicating whether the user belongs to the young age group, based on demographic characteristics (1 if young, 0 otherwise).
SafetyA binary variable indicating whether a trip is considered safe (1) or unsafe (0). In this study, trips involving the use of e-scooters are classified as unsafe.
ElderlyA binary variable indicating whether the user belongs to the elderly age group, based on demographic characteristics (1 if elderly, 0 otherwise).
ComfortA binary variable indicating whether a trip is considered comfortable (1) or uncomfortable (0). In this study, trips involving the use of e-scooters or sea vessels are classified as uncomfortable.
EnvA binary variable indicating whether a trip is considered environmentally friendly (1) or not (0). In this study, trips that exclusively involve the use of e-scooters are classified as environmentally friendly.

References

  1. Liao, F.; Correia, G. Electric carsharing and micromobility: A literature review on their usage pattern, demand, and potential impacts. Int. J. Sustain. Transp. 2022, 16, 269–286. [Google Scholar] [CrossRef] [Scilit]
  2. EcoMobility Project. Available online: https://www.ecomobility-project.eu/ (accessed on 24 April 2026).
  3. Vargas-Munoz, J.E.; Srivastava, S.; Tuia, D.; Falcao, A.X. OpenStreetMap: Challenges and opportunities in machine learning and remote sensing. IEEE Geosci. Remote Sens. Mag. 2020, 9, 184–199. [Google Scholar] [CrossRef] [Scilit]
  4. Yang, A.; Li, A.; Yang, B.; Zhang, B.; Hui, B.; Zheng, B.; Qiu, Z. Qwen3 technical report. arXiv 2025, arXiv:2505.09388. [Google Scholar] [CrossRef] [Scilit]
  5. Ko, H.; Lee, S.; Park, Y.; Choi, A. A survey of recommendation systems: Recommendation models, techniques, and application fields. Electronics 2022, 11, 141. [Google Scholar] [CrossRef] [Scilit]
  6. Burke, R. Hybrid web recommender systems. Adapt. Web Methods Strateg. Web Pers. 2007, 4321, 377–408. [Google Scholar]
  7. Adomavicius, G.; Tuzhilin, A. Context-aware recommender systems. In Recommender Systems Handbook; Springer: Boston, MA, USA, 2010; pp. 217–253. [Google Scholar]
  8. Zhang, Q.; Lu, J.; Jin, Y. Artificial intelligence in recommender systems. Complex Intell. Syst. 2021, 7, 439–457. [Google Scholar] [CrossRef] [Scilit]
  9. Jain, A.K. Data clustering: 50 years beyond K-means. Pattern Recognit. Lett. 2010, 31, 651–666. [Google Scholar] [CrossRef] [Scilit]
  10. Koren, Y.; Bell, R.; Volinsky, C. Matrix factorization techniques for recommender systems. Computer 2009, 42, 30–37. [Google Scholar] [CrossRef] [Scilit]
  11. McAfee, A.; Brynjolfsson, E.; Davenport, T.H.; Patil, D.J.; Barton, D. Big data. Manag. Revolut. Harv. Bus. Rev. 2012, 90, 61–67. [Google Scholar]
  12. Vaswani, A.; Shazeer, N.; Parmar, N.; Uszkoreit, J.; Jones, L.; Gomez, A.N.; Polosukhin, I. Attention is all you need. arXiv 2017, arXiv:1706.03762. [Google Scholar] [CrossRef] [Scilit]
  13. Goodfellow, I.; Bengio, Y.; Courville, A.; Bengio, Y. Deep Learning; MIT Press: Cambridge, UK, 2016; Volume 1. [Google Scholar]
  14. LeCun, Y.; Bengio, Y.; Hinton, G. Deep learning. Nature 2015, 521, 436–444. [Google Scholar] [CrossRef] [Scilit]
  15. Zhang, S.; Yao, L.; Sun, A.; Tay, Y. Deep learning based recommender system: A survey and new perspectives. ACM Comput. Surv. (CSUR) 2019, 52, 1–38. [Google Scholar] [CrossRef] [Scilit]
  16. Xu, J.; Chen, Z.; Yang, S.; Li, J.; Wang, W.; Hu, X.; Ngai, E. A Survey on Multimodal Recommender Systems: Recent Advances and Future Directions. arXiv 2025, arXiv:2502.15711. [Google Scholar] [CrossRef] [Scilit]
  17. Kim, S.; Kang, H.; Choi, S.; Kim, D.; Yang, M.; Park, C. Large language models meet collaborative filtering: An efficient all-round llm-based recommender system. In Proceedings of the 30th ACM SIGKDD Conference on Knowledge Discovery and Data Mining, Barcelona, Spain, 25–29 August 2024. [Google Scholar]
  18. Zhao, W.X.; Zhou, K.; Li, J.; Tang, T.; Wang, X.; Hou, Y.; Wen, J.R. A survey of large language models. arXiv 2023, arXiv:2303.18223. [Google Scholar]
  19. Bast, H.; Delling, D.; Goldberg, A.; Müller-Hannemann, M.; Pajor, T.; Sanders, P.; Werneck, R.F. Route planning in transportation networks. In Algorithm Engineering: Selected Results and Surveys; Springer International Publishing: Cham, Switzerland, 2016; pp. 19–80. [Google Scholar]
  20. Delling, D.; Pajor, T.; Werneck, R.F. Round-based public transit routing. Transp. Sci. 2015, 49, 591–604. [Google Scholar] [CrossRef] [Scilit]
  21. Koopmans, C.; Groot, W.; Warffemius, P.; Annema, J.A.; Hoogendoorn-Lanser, S. Measuring generalised transport costs as an indicator of accessibility changes over time. Transp. Policy 2013, 29, 154–159. [Google Scholar] [CrossRef] [Scilit]
  22. Bast, H.; Carlsson, E.; Eigenwillig, A.; Geisberger, R.; Harrelson, C.; Raychev, V.; Viger, F. Fast routing in very large public transportation networks using transfer patterns. In European Symposium on Algorithms; Springer: Berlin/Heidelberg, Germany, 2010; pp. 290–301. [Google Scholar]
  23. Wu, F.; Lyu, C.; Liu, Y. A personalized recommendation system for multi-modal transportation systems. Multimodal Transp. 2022, 1, 100016. [Google Scholar] [CrossRef] [Scilit]
  24. Duncan, L.C.; Watling, D.P.; Connors, R.D.; Rasmussen, T.K.; Nielsen, O.A. Path Size Logit route choice models: Issues with current models, a new internally consistent approach, and parameter estimation on a large-scale network with GPS data. Transp. Res. Part B Methodol. 2020, 135, 1–40. [Google Scholar] [CrossRef] [Scilit]
  25. Nielsen, O.A.; Eltved, M.; Anderson, M.K.; Prato, C.G. Relevance of detailed transfer attributes in large-scale multimodal route choice models for metropolitan public transport passengers. Transp. Res. Part A Policy Pract. 2021, 147, 76–92. [Google Scholar] [CrossRef] [Scilit]
  26. Marra, A.D.; Corman, F. Modelling route choice in public transport with deep learning. Transportation 2025, 1–31. [Google Scholar] [CrossRef] [Scilit]
  27. Liu, H.; Tong, Y.; Zhang, P.; Lu, X.; Duan, J.; Xiong, H. Hydra: A personalized and context-aware multi-modal transportation recommendation system. In Proceedings of the 25th ACM SIGKDD International Conference on Knowledge Discovery & Data Mining, Anchorage, AK, USA, 4–8 August 2019. [Google Scholar]
  28. Baidu Maps. Available online: https://map.baidu.com/ (accessed on 24 April 2026).
  29. Farazi, N.P.; Zou, B.; Ahamed, T.; Barua, L. Deep reinforcement learning in transportation research: A review. Transp. Res. Interdiscip. Perspect. 2021, 11, 100425. [Google Scholar] [CrossRef] [Scilit]
  30. Goyal, P.; Ferrara, E. Graph embedding techniques, applications, and performance: A survey. Knowl.-Based Syst. 2018, 151, 78–94. [Google Scholar] [CrossRef] [Scilit]
  31. Rossiiev, O.D.; Shapovalova, N.N.; Rybalchenko, O.H.; Striuk, A.M. A Comprehensive Survey on Reinforcement Learning-Based Recommender Systems: State-of-the-Art, Challenges, and Future Perspectives; CEUR Workshop Proceedings: Aachen, Germany, 2025; pp. 428–440. [Google Scholar]
  32. Møller, T.H.; Simlett, J.; Mugnier, E. Micromobility: Moving Cities Into a Sustainable Future. Safe Micromobility; International Transport Forum OECD/ITF: Paris, France, 2020. [Google Scholar]
  33. Grosshuesch, K. Solving the first mile/last mile problem: Electric scooters and dockless bicycles are positioned to provide relief to commuters struggling with a daily commute. Wm. Mary Envtl. L. Pol’y Rev. 2019, 44, 847. [Google Scholar]
  34. Oeschger, G.; Carroll, P.; Caulfield, B. Micromobility and public transport integration: The current state of knowledge. Transp. Res. Part D Transp. Environ. 2020, 89, 102628. [Google Scholar] [CrossRef] [Scilit]
  35. Schneider, M.; Stenger, A.; Goeke, D. The electric vehicle-routing problem with time windows and recharging stations. Transp. Sci. 2014, 48, 500–520. [Google Scholar] [CrossRef] [Scilit]
  36. Huang, H.; Bucher, D.; Kissling, J.; Weibel, R.; Raubal, M. Multimodal route planning with public transport and carpooling. IEEE Trans. Intell. Transp. Syst. 2018, 20, 3513–3525. [Google Scholar] [CrossRef] [Scilit]
  37. Bongiovanni, L.; Armengaud, E.; Jover, S.F.; Yalcin, I.K.; Rossini, E.; Mamei, M.; Litke, A. Smart City Pilots: Advancing Sustainable Mobility and Urban Innovation. In 2025 Smart Systems Integration Conference and Exhibition (SSI); IEEE: Piscataway, NJ, USA, 2025; pp. 1–6. [Google Scholar]
  38. Message Queuing Telemetry Transport (MQTT) Protocol. Available online: https://mqtt.org/ (accessed on 24 April 2026).
  39. JavaScript Object Notation (JSON). Available online: https://www.json.org/json-en.html (accessed on 24 April 2026).
  40. Google Maps. Available online: https://www.google.com/maps (accessed on 24 April 2026).
  41. Qwen3. Available online: https://lmstudio.ai/models/qwen3 (accessed on 24 April 2026).
  42. OpenStreetMap. Available online: https://www.openstreetmap.org/ (accessed on 24 April 2026).
  43. SQLite. Available online: https://sqlite.org/ (accessed on 24 April 2026).
  44. Schubert, E.; Sander, J.; Ester, M.; Kriegel, H.P.; Xu, X. DBSCAN revisited, revisited: Why and how you should (still) use DBSCAN. ACM Trans. Database Syst. (TODS) 2017, 42, 1–21. [Google Scholar] [CrossRef] [Scilit]
  45. Breiman, L. Random forests. Mach. Learn. 2001, 45, 5–32. [Google Scholar] [CrossRef] [Scilit]
  46. REpresentational State Transfer (REST) API. Available online: https://restfulapi.net/ (accessed on 24 April 2026).
  47. JSON Schema. Available online: https://json-schema.org/ (accessed on 24 April 2026).
  48. Brown, T.; Mann, B.; Ryder, N.; Subbiah, M.; Kaplan, J.D.; Dhariwal, P.; Amodei, D. Language models are few-shot learners. Adv. Neural Inf. Process. Syst. 2020, 33, 1877–1901. [Google Scholar]
  49. geojson.io Website. Available online: https://geojson.io/ (accessed on 24 April 2026).
  50. Istanbul City Population. Available online: https://www.citypopulation.de/en/turkey/istanbulcity/ (accessed on 24 April 2026).
  51. Chawla, N.V.; Bowyer, K.W.; Hall, L.O.; Kegelmeyer, W.P. SMOTE: Synthetic minority over-sampling technique. J. Artif. Intell. Res. 2002, 16, 321–357. [Google Scholar] [CrossRef] [Scilit]
  52. Agatz, N.; Erera, A.; Savelsbergh, M.; Wang, X. Optimization for dynamic ride-sharing: A review. Eur. J. Oper. Res. 2012, 223, 295–303. [Google Scholar] [CrossRef] [Scilit]
  53. Andrejszki, T.; Torok, A.; Csete, M. Identifying the utility function of transport services from stated preferences. Transp. Telecommun. J. 2015, 16, 138–144. [Google Scholar]
  54. Carrion, C.; Levinson, D. Value of travel time reliability: A review of current evidence. Transp. Res. Part A Policy Pract. 2012, 46, 720–741. [Google Scholar] [CrossRef] [Scilit]
  55. Varun, B.; Raghuvaran, K.; Chandrakanth Rao, M.; Hemanth Kumar, G.; Sanjay Ramdas, B. A Review of Machine Learning Ranking Systems: Methods, Applications, and Challenges. J. Contemp. Edu. Theo. Artific. Intel. JCETAI-119 2025, 4, 100119. [Google Scholar]
  56. Voigt, P.; Von dem Bussche, A. The EU General Data Protection Regulation (Gdpr). A Practical Guide, 1st ed.; Springer International Publishing: Cham, Switzerland, 2017; Volume 10, pp. 10–5555. [Google Scholar]
  57. Shah, K.J.; Pan, S.Y.; Lee, I.; Kim, H.; You, Z.; Zheng, J.M.; Chiang, P.C. Green transportation for sustainability: Review of current barriers, strategies, and innovative technologies. J. Clean. Prod. 2021, 326, 129392. [Google Scholar] [CrossRef] [Scilit]
  58. Canitez, F.; Alpkokin, P.; Kiremitci, S.T. Sustainable urban mobility in Istanbul: Challenges and prospects. Case Stud. Transp. Policy 2020, 8, 1148–1157. [Google Scholar] [CrossRef] [Scilit]
  59. Assemi, B.; Baker, D.; Paz, A. Searching for on-street parking: An empirical investigation of the factors influencing cruise time. Transp. Policy 2020, 97, 186–196. [Google Scholar] [CrossRef] [Scilit]
  60. Alghamdi, T.; Mostafi, S.; Abdelkader, G.; Elgazzar, K. A comparative study on traffic modeling techniques for predicting and simulating traffic behavior. Future Internet 2022, 14, 294. [Google Scholar] [CrossRef] [Scilit]
  61. Ortega, J.; Tóth, J.; Péter, T. Planning a park and ride system: A literature review. Future Transp. 2021, 1, 82–98. [Google Scholar] [CrossRef] [Scilit]
  62. Openrouteservice (ORS). Available online: https://openrouteservice.org/ (accessed on 24 April 2026).
  63. SQLAlchemy. Available online: https://www.sqlalchemy.org/ (accessed on 24 April 2026).
  64. GeoJSON Format. Available online: https://geojson.org/ (accessed on 24 April 2026).
  65. FastAPI. Available online: https://fastapi.tiangolo.com/ (accessed on 24 April 2026).
  66. OpenAI API. Available online: https://developers.openai.com/ (accessed on 24 April 2026).
  67. Gemini. Available online: https://gemini.google.com/ (accessed on 24 April 2026).
  68. DeepSeek. Available online: https://www.deepseek.com/ (accessed on 24 April 2026).
  69. ChatGPT. Available online: https://chatgpt.com/ (accessed on 24 April 2026).
  70. Qwen. Available online: https://qwen.ai/ (accessed on 24 April 2026).
  71. Mistral. Available online: https://mistral.ai/ (accessed on 24 April 2026).
  72. LM Studio. Available online: https://lmstudio.ai/ (accessed on 24 April 2026).
  73. Al-Salih, W.Q.; Esztergár-Kiss, D. Linking mode choice with travel behavior by using logit model based on utility function. Sustainability 2021, 13, 4332. [Google Scholar] [CrossRef] [Scilit]
Figure 1. Layered system architecture and user roles.
Smartcities 09 00078 g001
Figure 2. The three main steps of the route planning algorithm.
Smartcities 09 00078 g002
Figure 3. JSON schema and LLM instructions (few-shot learning).
Smartcities 09 00078 g003
Figure 4. Map of a selected area in Istanbul showing (a) the current locations of the POIs and (b) the constructed multimodal transportation graph.
Smartcities 09 00078 g004
Figure 5. Graph demonstrating the five feasible options: (a) using links and (b) with suggested Google Maps routes. The second figure prepared using geojson.io [49].
Smartcities 09 00078 g005
Figure 6. Algorithm for simulating data generation in a multimodal transportation system.
Smartcities 09 00078 g006
Figure 7. Locations of available users and vehicles in the study area (a) before and (b) after the simulation process was completed.
Smartcities 09 00078 g007
Figure 8. Response time distribution (when at least one feasible route is available) as the number of vehicles increases: (a) cars and sea vessels increase by 20 (total) per step, and (b) e-scooters increase by 20 per step.
Smartcities 09 00078 g008
Figure 9. Number of clusters and total execution time for different radius values.
Smartcities 09 00078 g009
Figure 10. Evaluation of the developed ML model: (a) confusion matrix together with standard performance metrics and (b) ROC curve.
Smartcities 09 00078 g010
Table 1. Suggested paths along with a small subset of the computed features.
IDPathDistance (km)Duration (min)Cost
(€)
1START → Scooter-2 → Stop (before reaching our destination) → END5.3629.235.39
2START → Scooter-2 → Car in Parking-2 → Parking-1 → Scooter-1 → END10.1650.0012.88
3START → Scooter-2 → Car in Parking-2 → Parking-3 → Scooter-3 → END10.4549.1113.00
4START → Scooter-2 → Car in Parking-3 → Parking-1 → Scooter-1 → END12.9855.4813.13
5START → Scooter-2 → Sea Vessel in Port-1 → Port-2 → Scooter-3 → END7.2039.8511.66
Table 2. Available users and vehicles before and after simulation. Their total numbers are presented in bold and further organized into subgroups below each category.
ParameterBefore SimulationAfter Simulation
Number of Available Users8048
Number of Available “Active” Users7139
Number of Available “Inactive” Users99
Number of Available Vehicles9049
Number of Available Cars3027
Number of Available E-scooters5018
Number of Available Sea Vessels104
Table 3. Top ten vehicle combinations detected and their frequency of usage.
IDPatternCount
1FOOT-ESCOOTER-FOOT70
2FOOT-ESCOOTER17
3FOOT-ESCOOTER-SEAVESSEL-FOOT-ESCOOTER-FOOT16
4FOOT-ESCOOTER-SEAVESSEL-FOOT-ESCOOTER15
5FOOT-ESCOOTER-CAR-FOOT14
6FOOT-CAR-FOOT-ESCOOTER-FOOT11
7FOOT-CAR-FOOT-ESCOOTER11
8FOOT-CAR-FOOT8
9FOOT-ESCOOTER-FOOT-SEAVESSEL-FOOT-ESCOOTER6
10FOOT-ESCOOTER-CAR-FOOT-ESCOOTER5
Disclaimer/Publisher’s Note: The statements, opinions and data contained in all publications are solely those of the individual author(s) and contributor(s) and not of MDPI and/or the editor(s). MDPI and/or the editor(s) disclaim responsibility for any injury to people or property resulting from any ideas, methods, instructions or products referred to in the content.