


Abstract
Class II biological safety cabinets (BSCs) are designed to protect the user, the product, and the laboratory environment by maintaining HEPA-filtered airflow; however, their fans, alarms, and structural resonances introduce acoustic and vibrational stimuli that may confound mechanosensitive cell-culture assays. In this study, we characterized the vibroacoustic environment of a cell-culture laboratory and a Class II BSC, selected representative tray locations based on measured and modeled stimuli, and evaluated in vitro wound closure in HaCaT keratinocytes using a scratch assay under alarm-induced acoustic exposure. Wound closure after 24 h was quantified using a relative area-closure metric defined as one minus the ratio of wound area at 24 h to wound area at 0 h. For each biological replicate (one flask and one scratch), two non-overlapping image regions were treated as technical subsamples and averaged to obtain a single flask-level value. Three independent experimental runs were performed, each including one flask per tray point, yielding n equals 3 independent flasks per tray point. Mean wound closure values were 73.7 percent plus or minus 15.6 percent, 75.6 percent plus or minus 7.2 percent, and 79.4 percent plus or minus 14.8 percent for tray points P1, P5, and P6, respectively (mean plus or minus standard deviation). No statistically significant differences were detected among points (one-way ANOVA on flask-level values, F equals 0.15, p equals 0.86). These findings highlight that BSC-associated acoustic and vibration stimuli should be documented when interpreting scratch-assay outcomes and motivate larger, sham-controlled studies to resolve small effect sizes relevant for assay reproducibility.
1. Introduction
Biological safety cabinets (BSCs) are cornerstone engineering controls in life-science laboratories, providing containment for aerosols and protecting both personnel and biological materials [1,2,3]. The evolution of BSCs has been driven by biosafety needs and standardization efforts, culminating in widely adopted performance standards such as EN 12469 (Europe) and NSF/ANSI 49 (North America). These standards emphasize protection efficacy and include noise limits (typically 65 dB for EN 12469, and 67 dB for NSF/ANSI 49, under specified measurement conditions), whereas vibration is addressed indirectly through stability and performance requirements [4,5].
For cell-culture workflows, BSCs are commonly assumed to be “neutral” platforms. In practice, their fans, motors, airflow turbulence, and audible alarms may introduce periodic mechanical excitation and sound-pressure fluctuations at frequencies spanning from tens of hertz (structural vibration) to kilohertz (alarm tones). As mechanotransduction pathways in adherent cells can respond to subtle mechanical cues, BSC-associated stimuli could become confounding variables in mechanosensitive assays such as the scratch (wound-healing) assay [6]. This potential confounding is particularly relevant because cell-culture studies are a fundamental component of efficacy and safety evaluation during drug development. Cell culture-based models are used not only in preclinical drug development studies and clinical trials, but also in patient-derived organoid research, contributing to precision medicine approaches [7]. More broadly, controlled acoustic and ultrasonic exposures have been reported to induce measurable, cell-type-specific functional changes, including ultrasound-mediated piezoelectric differentiation of neuron-like PC12 cells on PVDF membranes [8], enhanced exosome generation regulated by calcium-dependent mechanisms [9], and increased motility in relatively immotile human sperm under high-frequency ultrasound [10].
A growing body of literature indicates that mechanical and acoustic/vibroacoustic stimulation can modulate cell behavior, including migration and cytoskeletal organization [11,12]. Studies have reported altered fibroblast migration under acoustic vibration [13], and surface acoustic waves have been shown to influence collective migration in in vitro wound models [14,15]. In clinical contexts, vibration therapy has been reviewed as a potential adjunct for hard-to-heal wounds [16]. Nevertheless, the specific case of incidental acoustic/vibration exposure arising from standardized laboratory equipment, such as a Class II BSC, remains underexplored. Beyond “stimulation,” acoustics is also widely used as a contactless cell-manipulation modality: in standing-wave or acoustofluidic systems, interference generates structured pressure fields, and cells can be translated toward pressure nodes under acoustic radiation forces, with the resulting motion governed by a balance of acoustic radiation and fluid-dynamic drag/streaming effects [17,18,19]. In tissue-engineering contexts, for example, ultrasound standing waves have been used to organize myoblast populations into aligned constructs, and short exposures did not measurably alter metabolic activity in alamarBlue testing under the reported conditions [17]. At the same time, reviews emphasize that biological outcomes can be heterogeneous and that long-term/parameter-sensitive effects require careful characterization [11,19]. Consistent with this caution, a standing-wave study reported that outcomes can be sensitive to exposure conditions—highlighting that shorter exposures and small temperature/drive changes may become detrimental and motivating robust protocols and temperature control when applying acoustic fields to cells [20]. Relatedly, rhythmic vertical vibration paradigms built using audio-signal workflows (e.g., controlled pulses) have been characterized in terms of acceleration and estimated shear stress, and were associated with measurable cytoskeletal (F-actin) changes and cell-cycle effects under some conditions [12]. Collectively, these findings support the premise that incidental acoustic/vibration stimuli from laboratory equipment—such as tonal alarms and mechanically coupled tray/flask vibrations in a Class II BSC—could inadvertently reproduce elements of these mechanostimulatory environments, and should therefore be documented and controlled when interpreting mechanosensitive assays.
Scratch assays and other migration readouts are inherently mechanosensitive, because collective motion depends on cell–substrate and cell–cell force balance and can be biased by weak external mechanical cues [21].
Acoustic excitation can couple into adherent monolayers through substrate-borne vibration and deformation, as well as pressure-field and flow (streaming/shear) perturbations in the culture vessel, which have been shown to regulate migration directionality and wound-like assays under acoustic-wave actuation [14,15,22,23]. Consequently, routine BSC operation (motor harmonics, tonal alarms) and room-acoustic conditions (reverberation and modal structure) can act as uncontrolled experimental factors. The present work therefore frames the BSC not only as a biosafety device, but also as a potential source of structured mechanical/acoustic stimuli that should be documented and, when possible, controlled in mechanobiology and drug-screening contexts.
The aim of this work is twofold: (i) to characterize the vibroacoustic environment of a cell-culture laboratory and a Class II BSC, including relevant resonances (room, BSC cavity, and culture flask), and (ii) to assess HaCaT keratinocyte wound closure at selected BSC tray locations under alarm-induced acoustic exposure. To strengthen the biological measurement pipeline, wound closure is quantified using a relative area-based closure metric and analyzed at the flask level to avoid pseudo-replication.
2. Materials and Methods
Experiments were conducted in the İstanbul Atlas University cell culture laboratory using a Class II A2 BSC (Nüve, Ankara, Türkiye). A series of acoustic evaluations were carried out, including room noise and reverberation characterization, modal estimates for rectangular enclosures, and vibration measurements on the BSC working tray. These measurements informed the selection of representative tray locations for the scratch assay.
2.1. Noise and Reverberation Measurements
Noise levels within the laboratory were measured using a calibrated micW i436 microphone (IEC 61672-1 Class 2 compliance [24]) and SignalScope Pro 2018 (iOS) for acquisition and analysis.
Measurements were taken at 1 m from the BSC front aperture and at multiple positions in the laboratory using the same acquisition chain and analysis settings to ensure comparability across conditions. Reverberation time () was estimated using balloon-pop impulse responses and processed according to EN ISO 3382-2 [25].
2.2. Rectangular-Cavity Mode Estimates
For rectangular enclosures (laboratory and BSC cavity), resonant frequencies were estimated using
where c is the speed of sound in air; , , and are enclosure dimensions; and are mode indices.
2.3. Flask Cavity Modal Analysis
To investigate how BSC-generated sound may couple into culture flasks, a three-dimensional acoustic model of a 25 cm2 flask cavity was constructed. Acoustic modal analysis was performed with the finite element method (FEM) using FEniCS (version 2019.1.0); the flask geometry was generated in Gmsh. The first ten modes were inspected, and mode shapes near the BSC alarm spectral content were highlighted.
2.4. Vibration Measurements on the BSC Tray
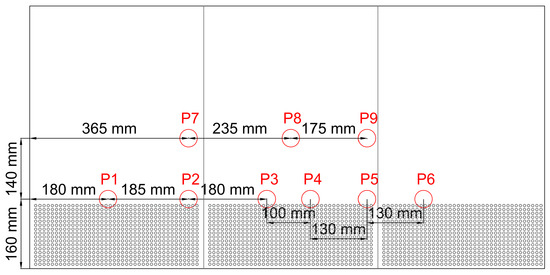
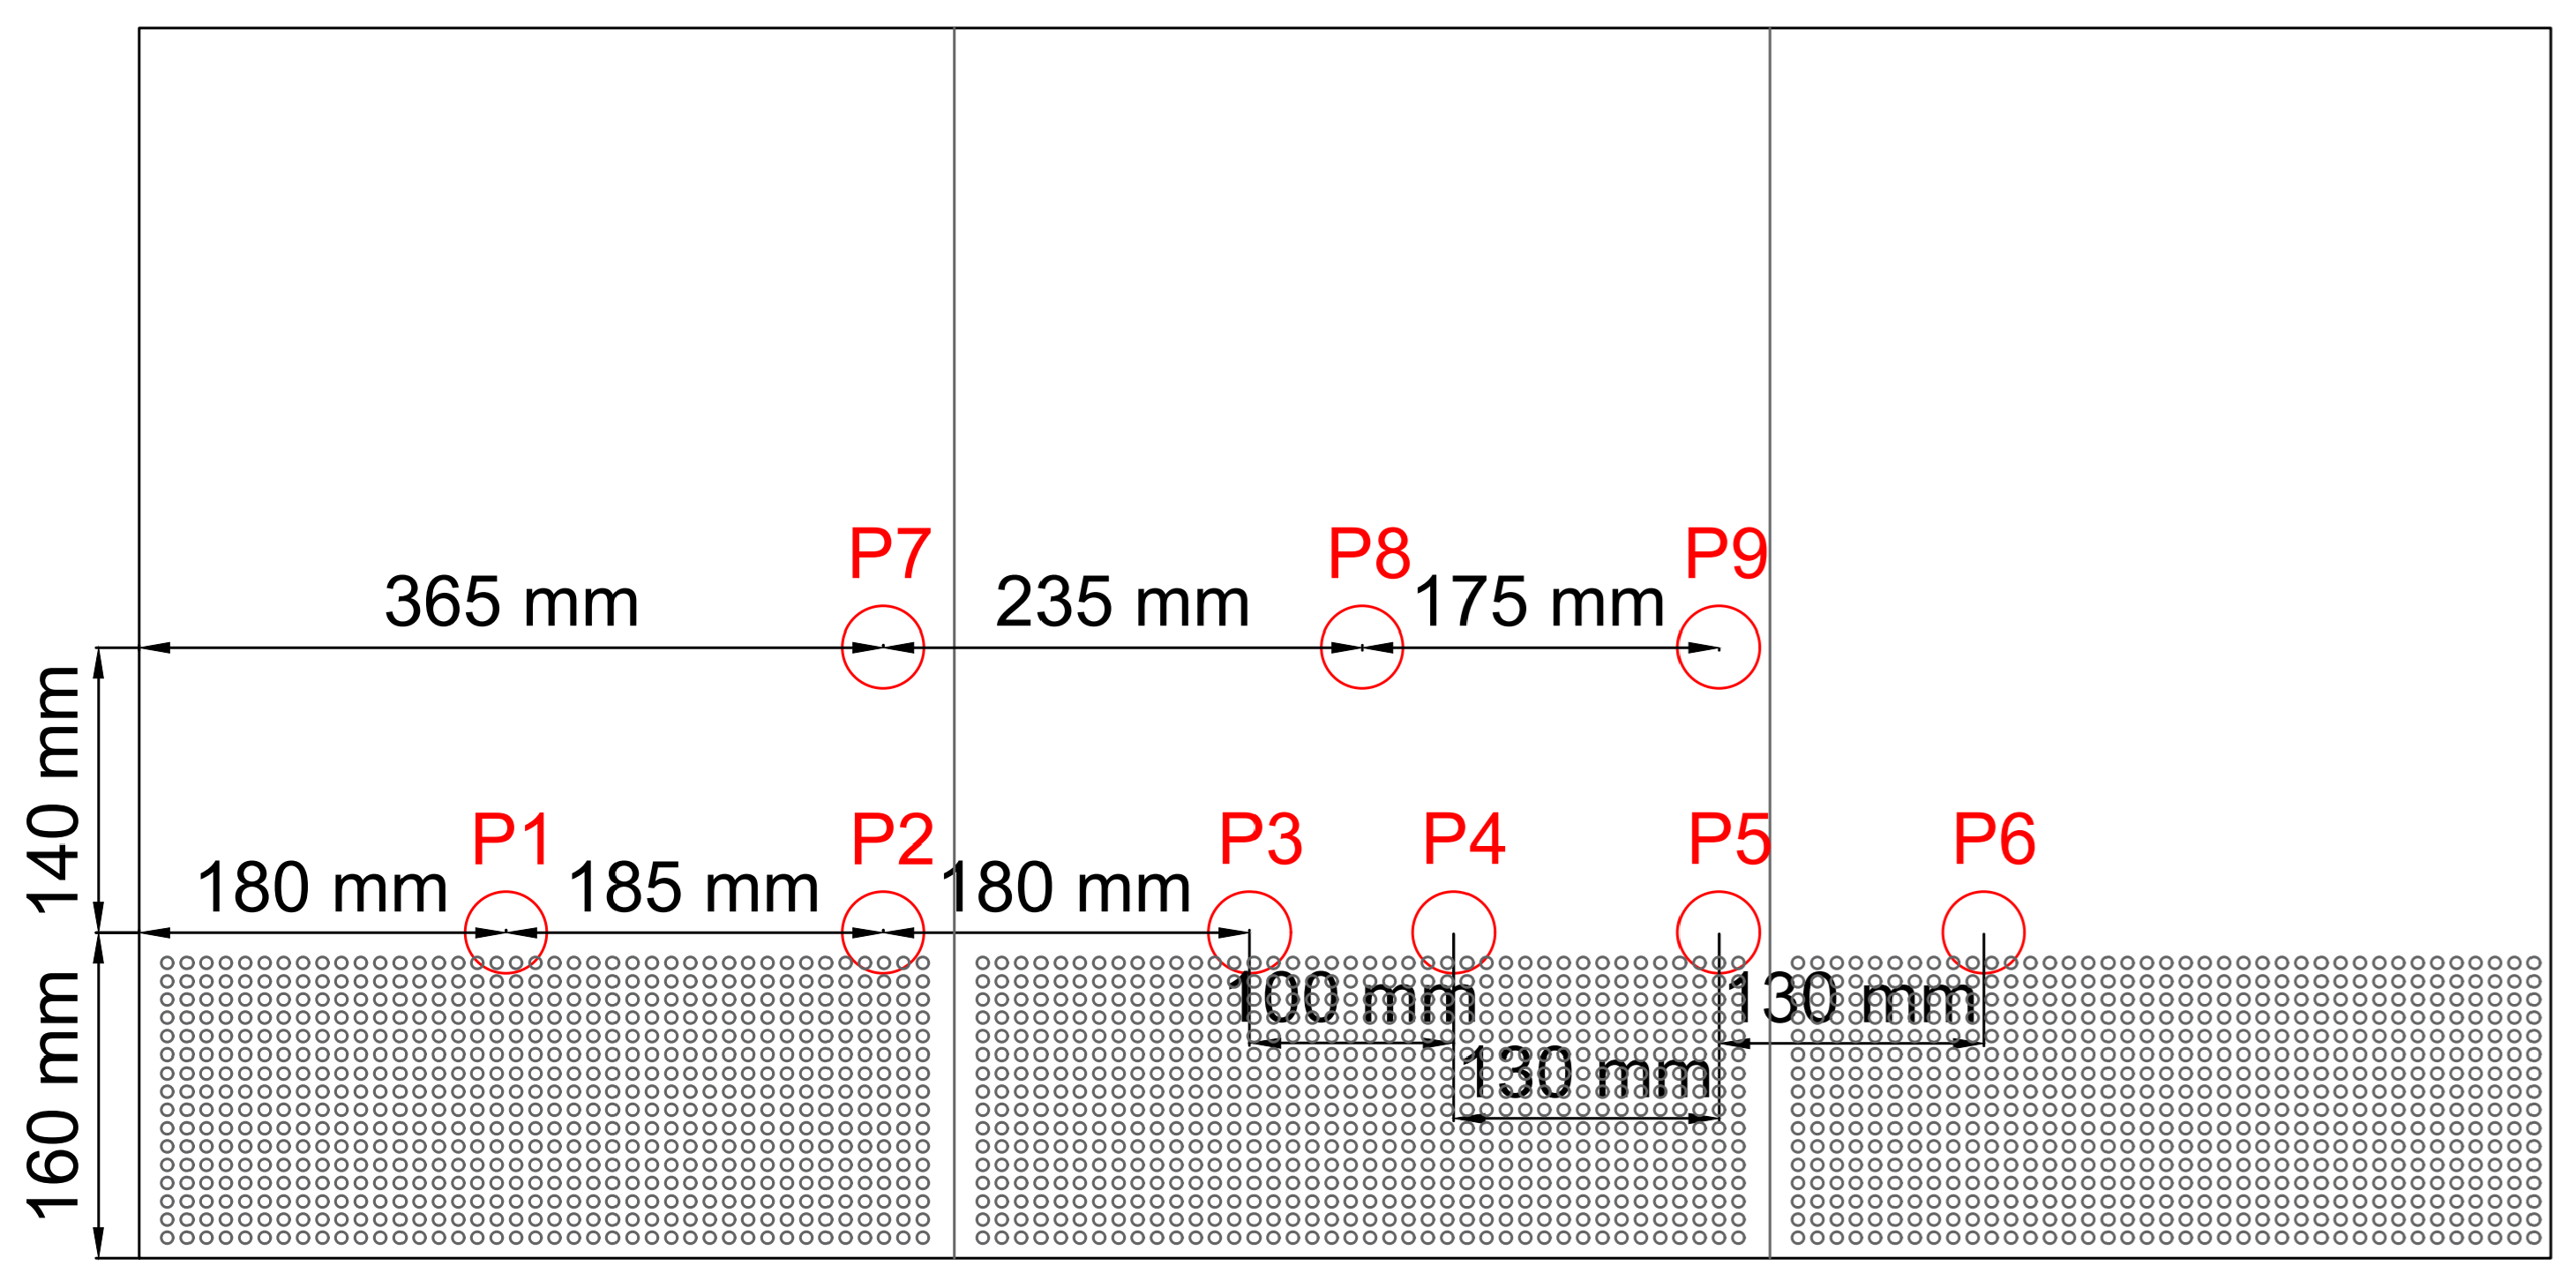
Vibration was measured at nine positions on the perforated working tray using a 333D01 Digiducer® USB Digital Accelerometer (The Modal Shop, Inc., Cincinnati, OH, USA) and SignalScope Pro 2018. Measurement points were selected to represent typical flask placement locations. The acquisition procedure followed ISO 4866:2010 [26] guidelines for vibration monitoring. The measurement locations on the BSC working tray are shown in Figure 1.
Figure 1.
Accelerometer measurement locations (P1–P9) on the working tray of the Class II BSC. The lower shaded region indicates the perforated part of the tray. Dimensions shown are in millimetres and correspond to the measurement layout used during vibration mapping.
2.5. Cell Culture and Scratch Assay
HaCaT keratinocytes were maintained at 37 °C and 5% CO2 in DMEM supplemented with 10% fetal bovine serum and 1% penicillin–streptomycin. Cells were seeded into 25 cm2 flasks and grown to confluence. A linear scratch was made using a sterile 5 mL serological pipette tip. Detached cells were washed with PBS and fresh medium was added. The flask bottom was marked to ensure imaging of the same region at 0 h and 24 h. Images were acquired with an inverted microscope (×4 magnification) and a digital camera.
2.6. Acoustic Exposure Protocol
All flasks were exposed concurrently under identical ambient laboratory conditions (same room, duration, placement/orientation on the tray), and were returned to the incubator immediately after the 30 min exposure. Flasks were placed vertically at predetermined tray points (P1, P5, P6). Cells were exposed to the BSC alarm sound for 30 min at room temperature. Room temperature was monitored to ensure that all samples experienced comparable conditions during exposure.
2.7. Wound Quantification
Wound closure was quantified from paired phase-contrast images acquired at 0 h and 24 h using an area-based relative closure metric, consistent with established in vitro wound-healing/scratch assay workflows and quantification approaches [27,28,29]. For each flask (one scratch), two non-overlapping fields of view (Region 1 and Region 2) were imaged along the same scratch line. These regions were treated as technical subsamples (i.e., repeated measurements from the same biological replicate), and therefore were not considered independent observations in statistical testing.
For each region and time point, the wound area was segmented in Paint.NET 5.0.13 using the “magic wand” tool with a manually adjusted tolerance to account for contrast differences between images [30]. The relative wound area closure () at 24 h was then computed as follows [29]:
The resulting values were first obtained separately for Region 1 and Region 2. To avoid pseudo-replication, a single flask-level closure value was computed by averaging the available region values within each biological replicate (one flask per tray point per experimental run), and all group comparisons were performed using these flask-level means. All images were acquired at fixed magnification (4×) and constant pixel resolution; therefore, no geometric scaling was required.
Image files were anonymized prior to analysis so that the operator performing segmentation was blinded to tray point and experiment date. For each image, the tolerance was selected to capture the full wound region while minimizing inclusion of adjacent cell-covered regions; segmentation outputs were visually checked for consistency across the paired 0 h and 24 h images.
2.8. Statistics
Data are reported as mean ± standard deviation (SD). Because Region 1 and Region 2 are technical subsamples from the same flask, statistical comparisons across tray points were performed using flask-level mean values (one value per tray point per experimental run). Group differences were tested using a one-way analysis of variance (ANOVA); was considered statistically significant. The effective sample size for each tray point was the number of independent biological replicates (flasks), i.e., flasks per tray point obtained from three independent experimental runs (performed on separate dates).
3. Results
To assess whether BSC-associated acoustic and vibrational stimuli may influence scratch-assay outcomes, we first characterized the laboratory and BSC environment and then quantified at the selected tray points.
3.1. Acoustic and Vibration Characterization
To determine the vibrational and acoustic factors affecting cell culture, data were collected from room acoustics to BSC cavity acoustics, and from cell culture flask vibrations to BSC tray vibrations. The aim was to examine the effect of dominant frequencies that might interact with cells under normal operating conditions.
3.1.1. Noise and Reverberation Measurements
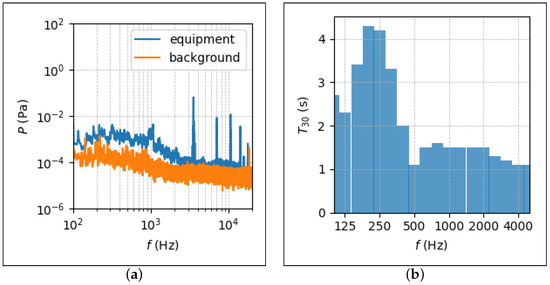
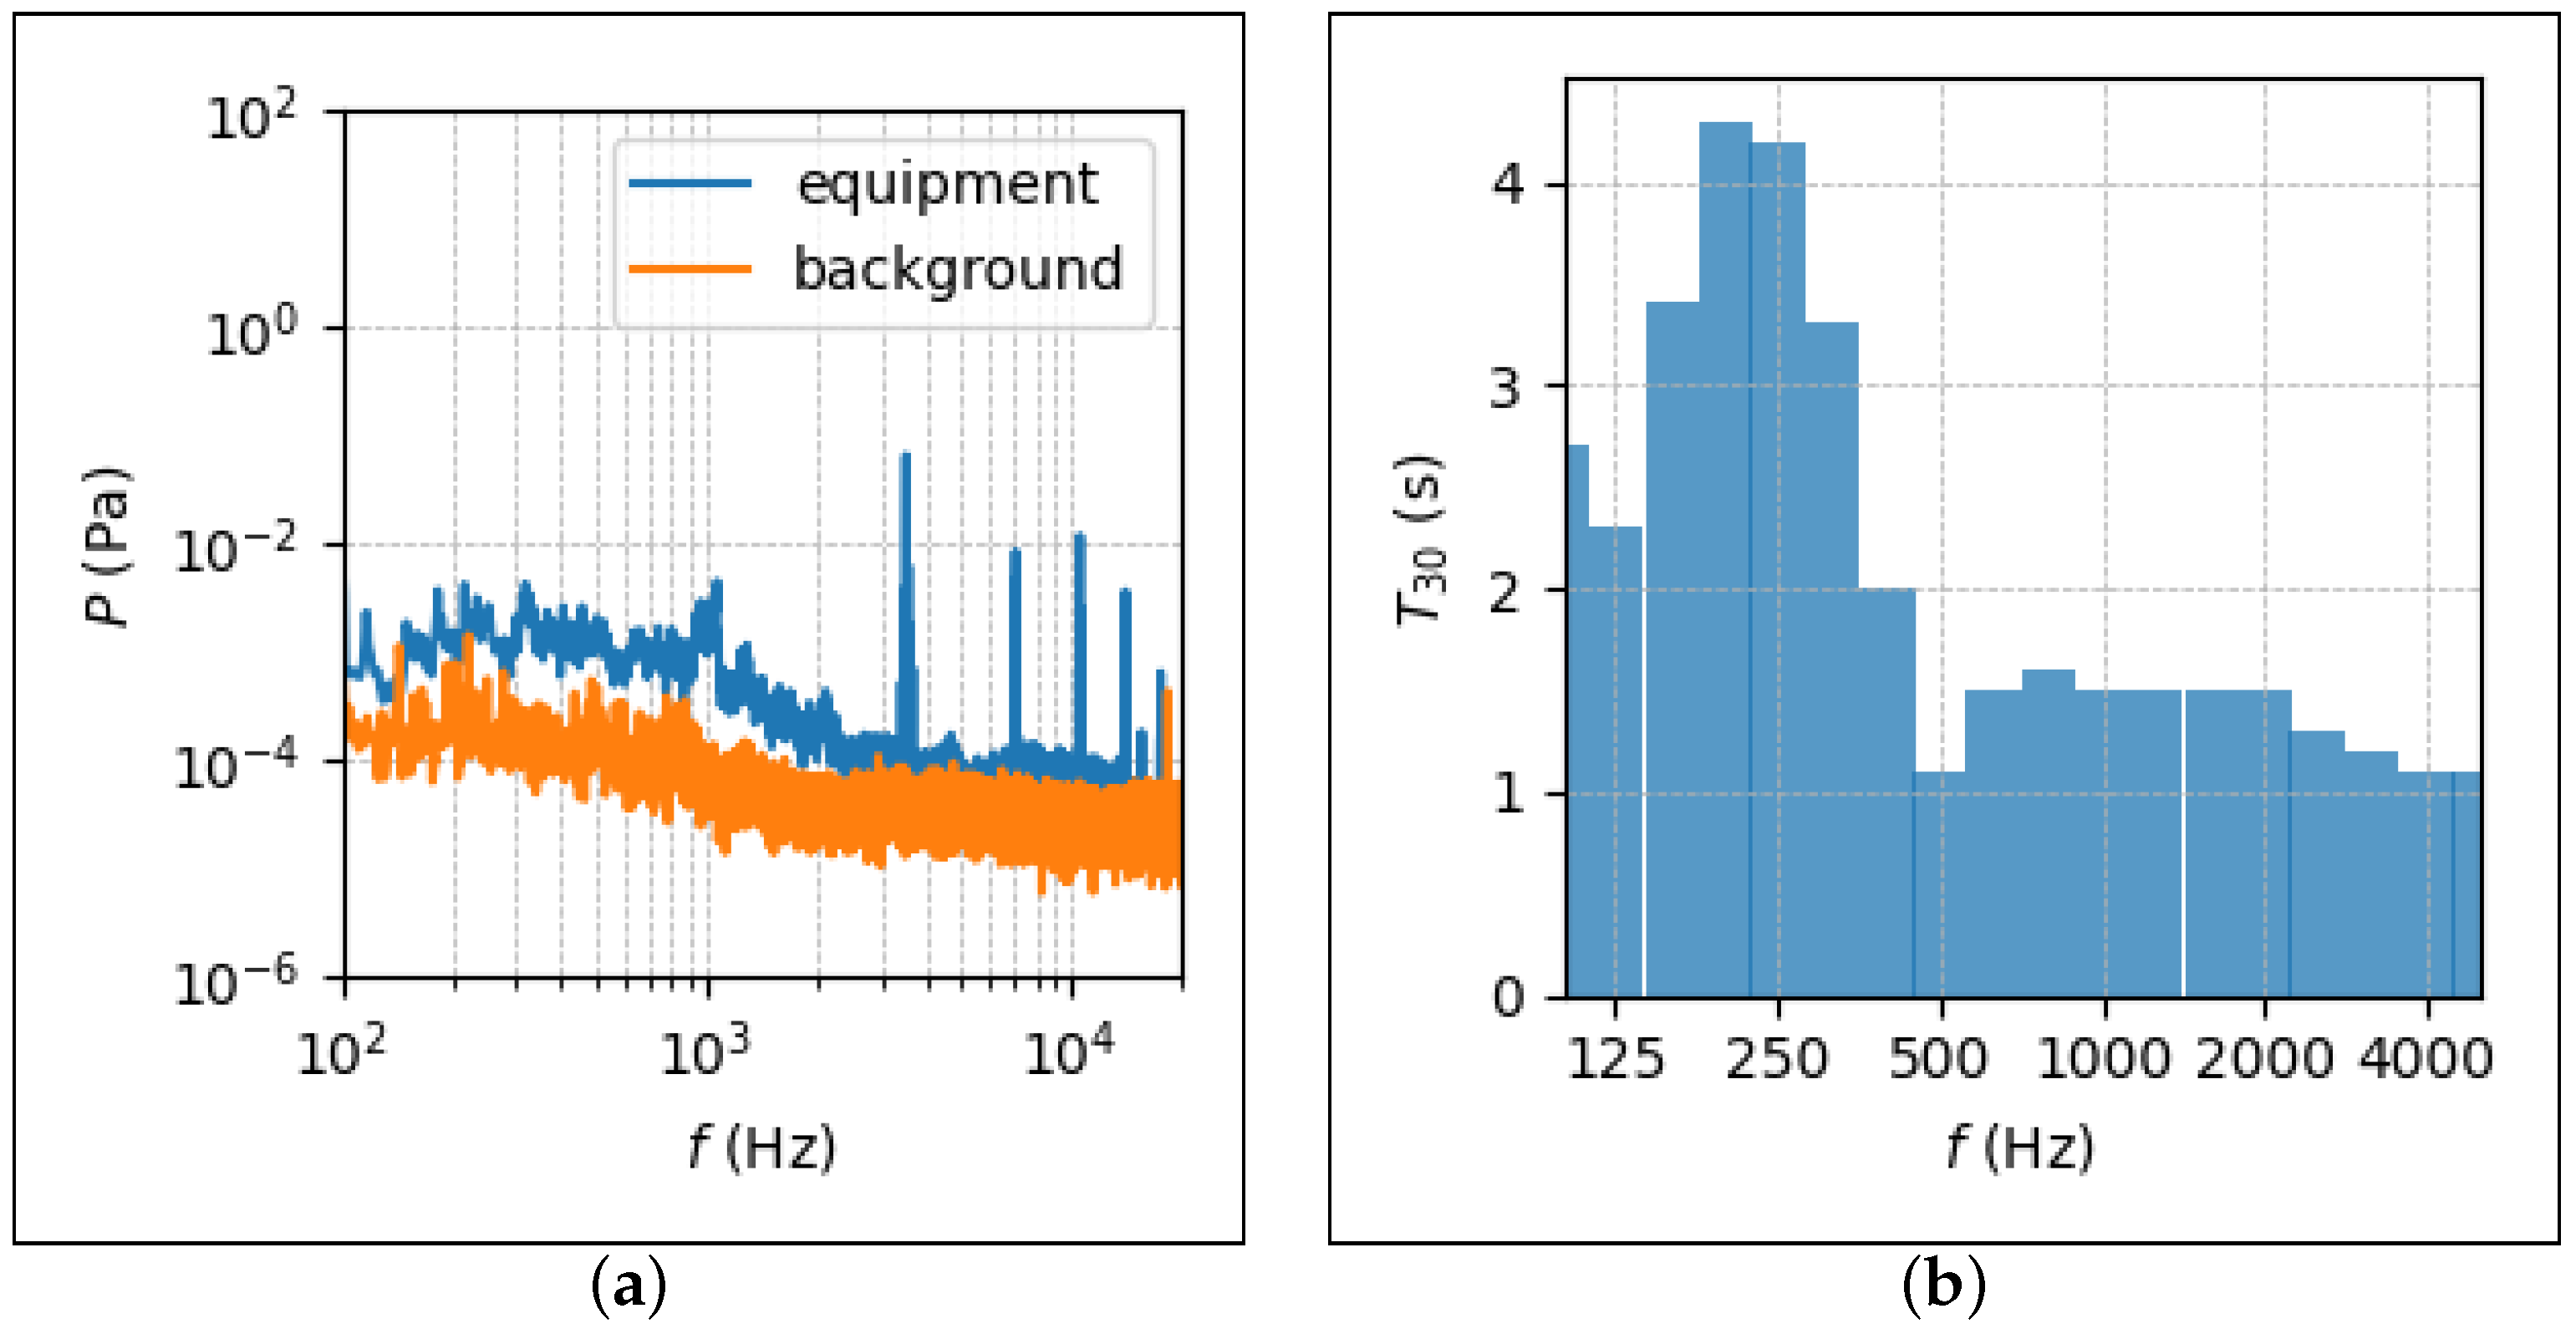
The spectral measurement in Figure 2a reveals a distinct alarm-related tonal component centered at approximately 3526 Hz, superimposed on the broadband operational noise of the laboratory. Under background conditions, the A-weighted equivalent sound pressure level was measured as 48 dB (A), while activation of the BSC alarm increased the overall level to 77 dB (A), indicating a substantial acoustic perturbation during alarm events.
Figure 2.
Acoustic measurements of the cell culture laboratory showing (a) the measured noise spectrum under background and operational conditions, and (b) the frequency-dependent reverberation characteristics expressed as one-third-octave-band .
The reverberation time measurements in Figure 2b show elevated values in the low- to mid-frequency range, particularly between 135 Hz and 315 Hz, where reverberation times exceed typical laboratory design targets. The overall reverberation time of the space was measured as s, indicating a relatively reflective acoustic environment.
Although the alarm-related spectral peak lies in the kilohertz range, the combination of high sound pressure levels and extended reverberation suggests an increased likelihood of acoustic energy persistence and structural coupling, motivating further analysis of flask acoustic modes and tray vibration responses.
3.1.2. Rectangular-Cavity Mode Estimates
Room dimensions were m × m × m. First room mode starts from Hz, and for the first modes, Bonello criteria are provided. Other mode frequencies that will be considered after vibration measurement results are Hz and Hz.
The BSC tray had dimensions of m × m × m. For a volume of this size, the first axial mode was observed to occur at Hz. It should be noted that this acoustic mode was also taken into account in subsequent analyses due to its direct effect on the tray and consequently on the flask.
3.1.3. Flask Cavity Modal Analysis
The first ten acoustic modes of the cell culture flask were examined using finite element modal analysis. Particular attention was given to these lower-order modes, as they are expected to produce higher spatially coherent acoustic pressure fields and therefore exert a stronger mechanical influence on the cell culture.
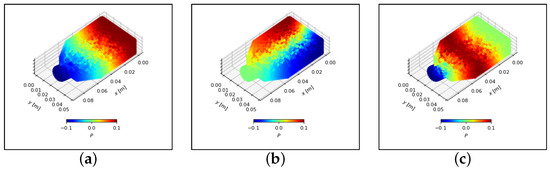
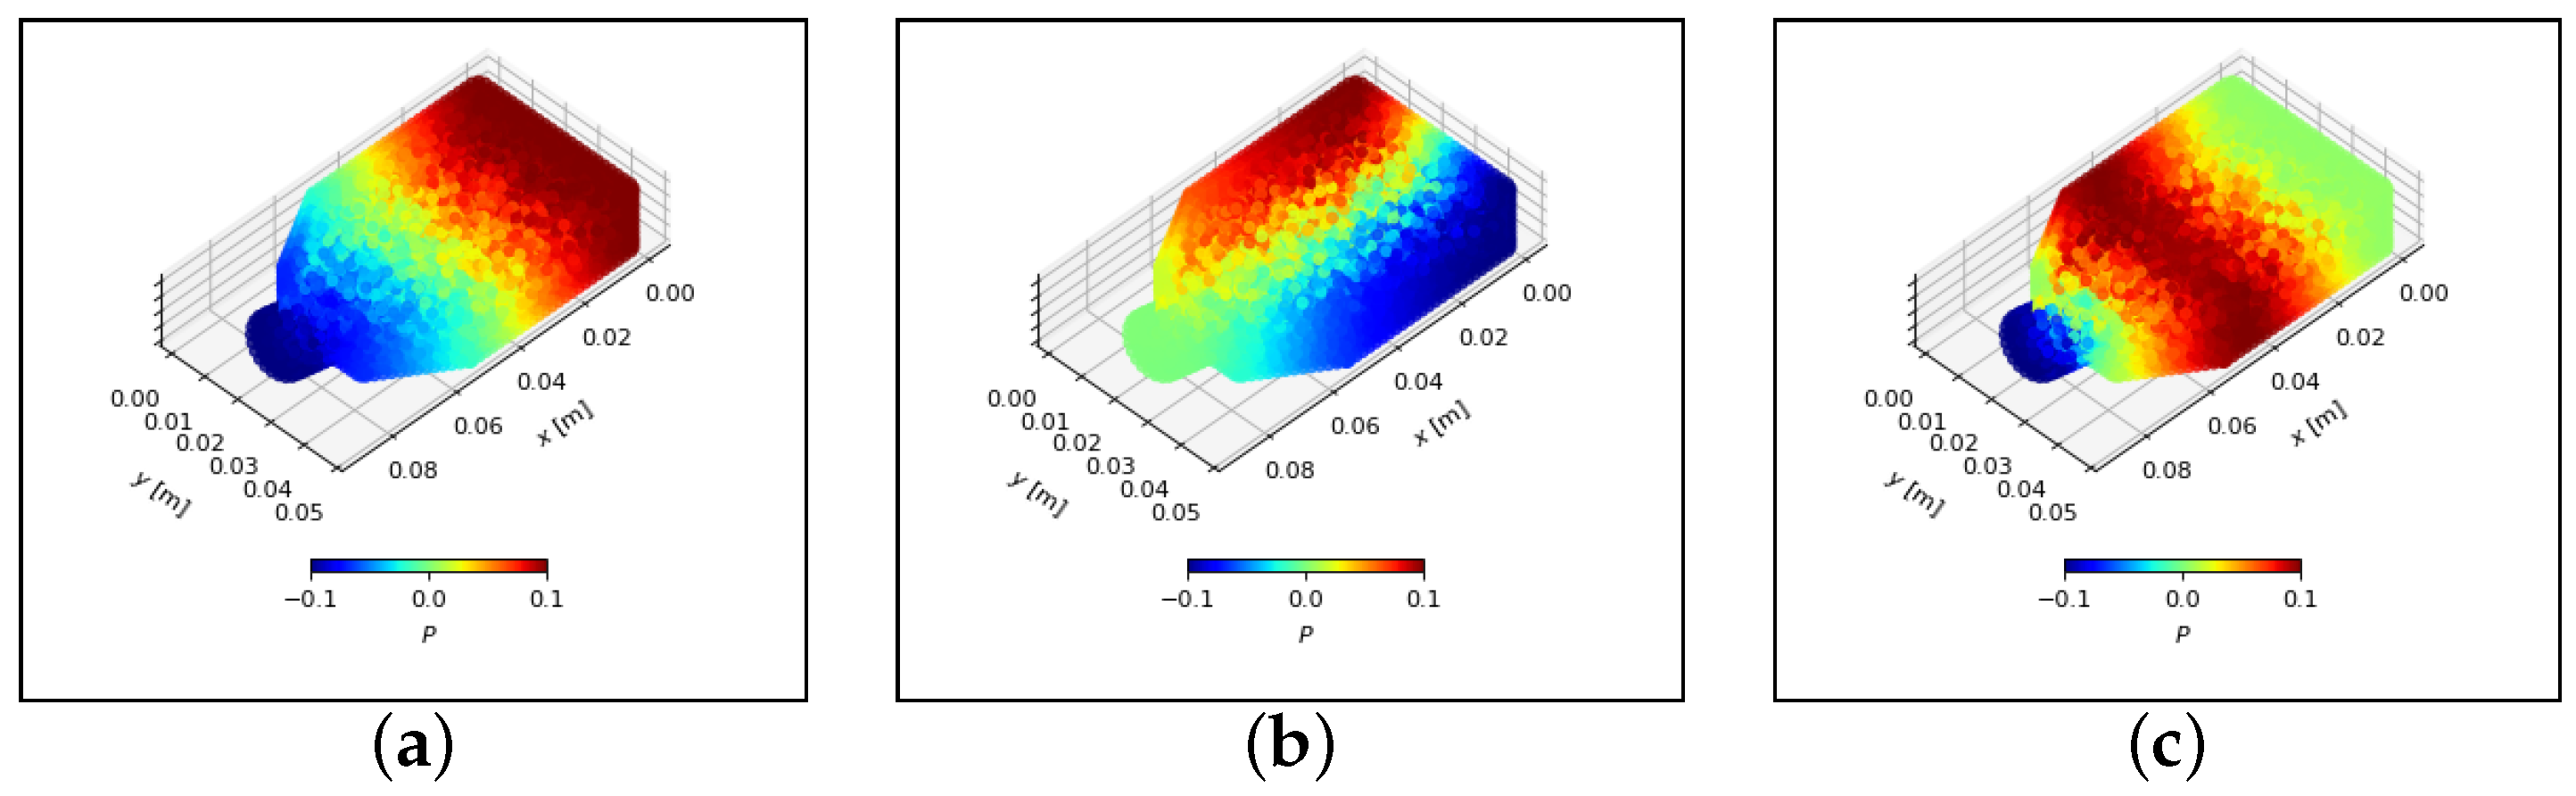
Figure 3 illustrates representative pressure distributions for selected modes: (a) the first axial mode at Hz, (b) the second axial mode at Hz, and (c) the first tangential mode at Hz. Among these, the tangential mode at approximately 3700 Hz is particularly noteworthy, as its resonance frequency lies close to the dominant alarm-related spectral peak observed in the laboratory measurements (Figure 2).
Figure 3.
Example acoustic pressure distributions inside the cell culture flask obtained from FEM-based modal analysis: (a) first axial mode ( Hz); (b) second axial mode ( Hz); (c) first tangential mode ( Hz). acoustic pressure distributions inside the cell culture flask obtained from FEM-based modal analysis.
The spatial pressure patterns indicate that excitation near this frequency band can produce non-uniform pressure distributions within the flask cavity, potentially leading to localized mechanical stimulation of the cell layer. This frequency proximity provided further justification for focusing on alarm-induced acoustic excitation when selecting tray positions and designing the biological experiments. The coincidence between alarm-dominated acoustic energy and flask resonance frequencies suggests a plausible pathway by which BSC alarms may indirectly influence in vitro mechanobiological experiments.
3.1.4. Vibration Measurements on the BSC Tray
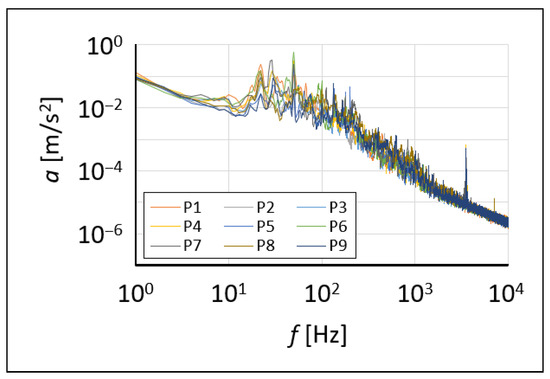
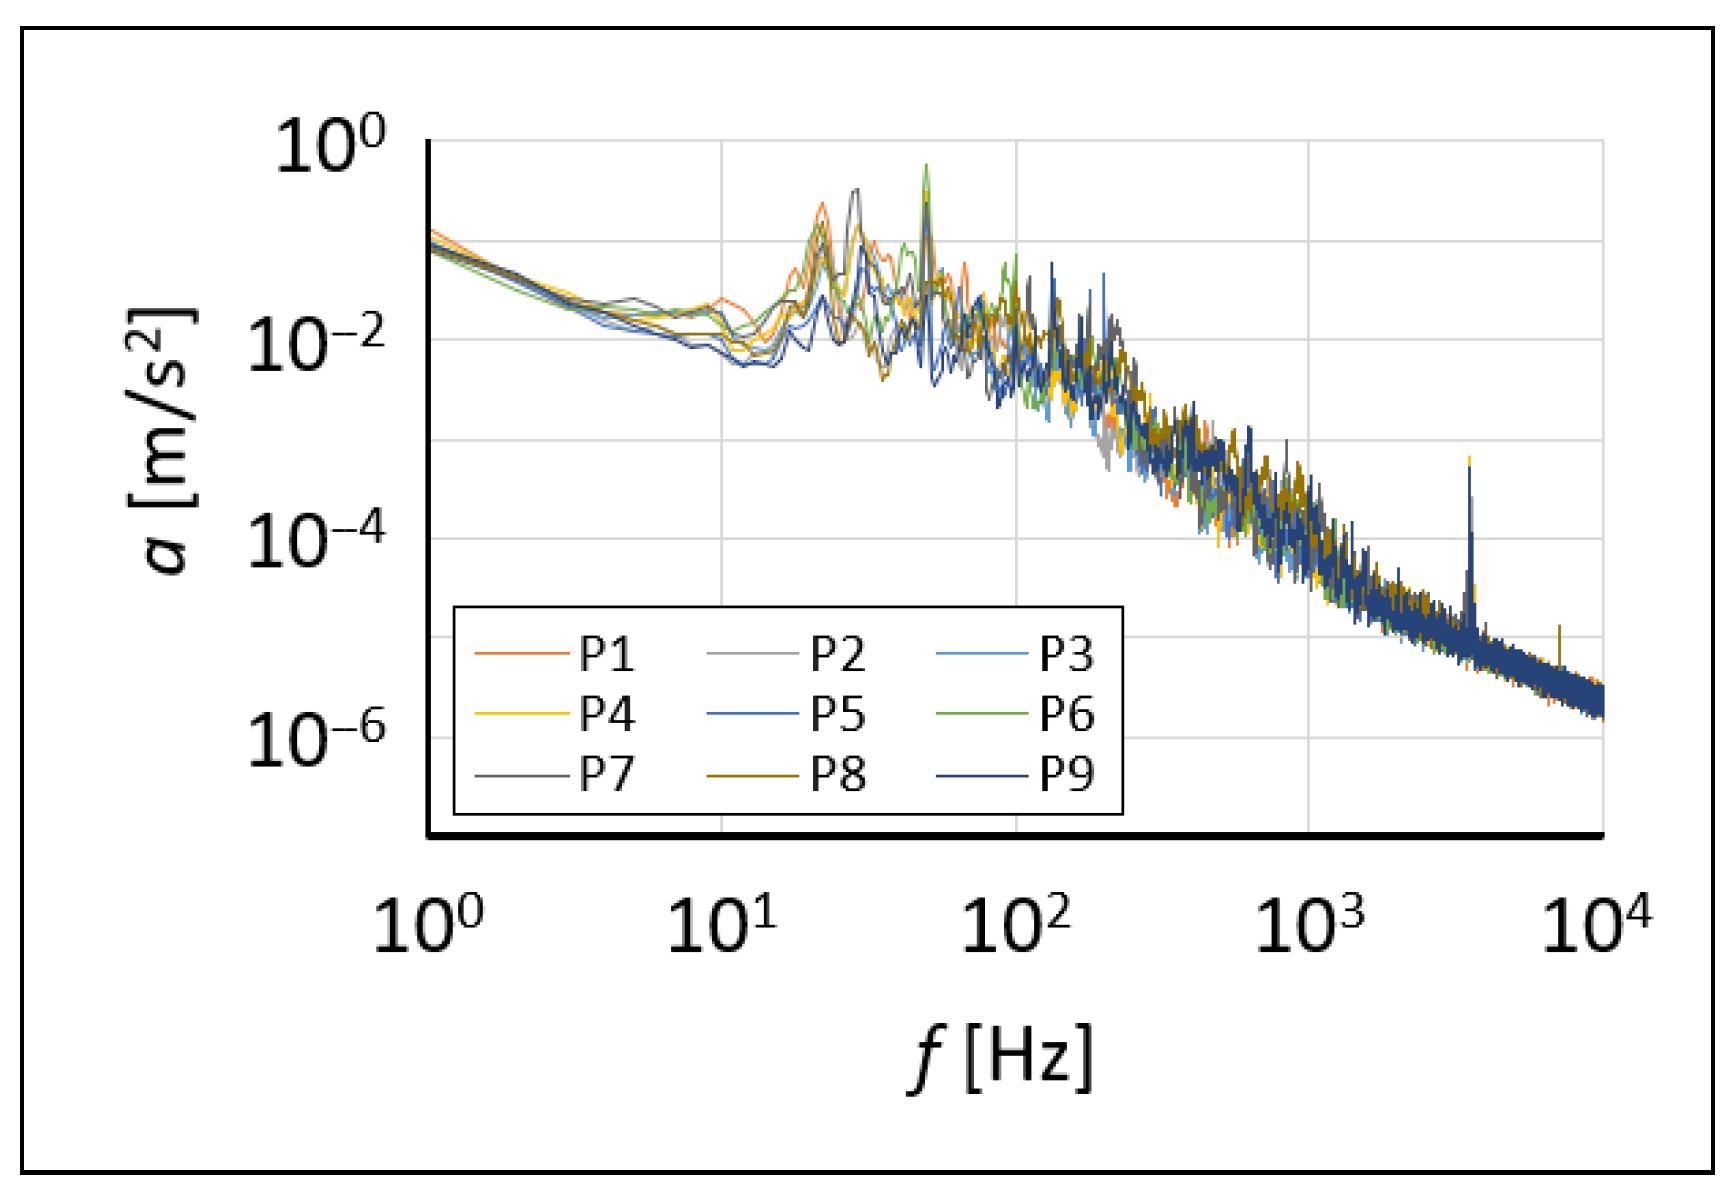
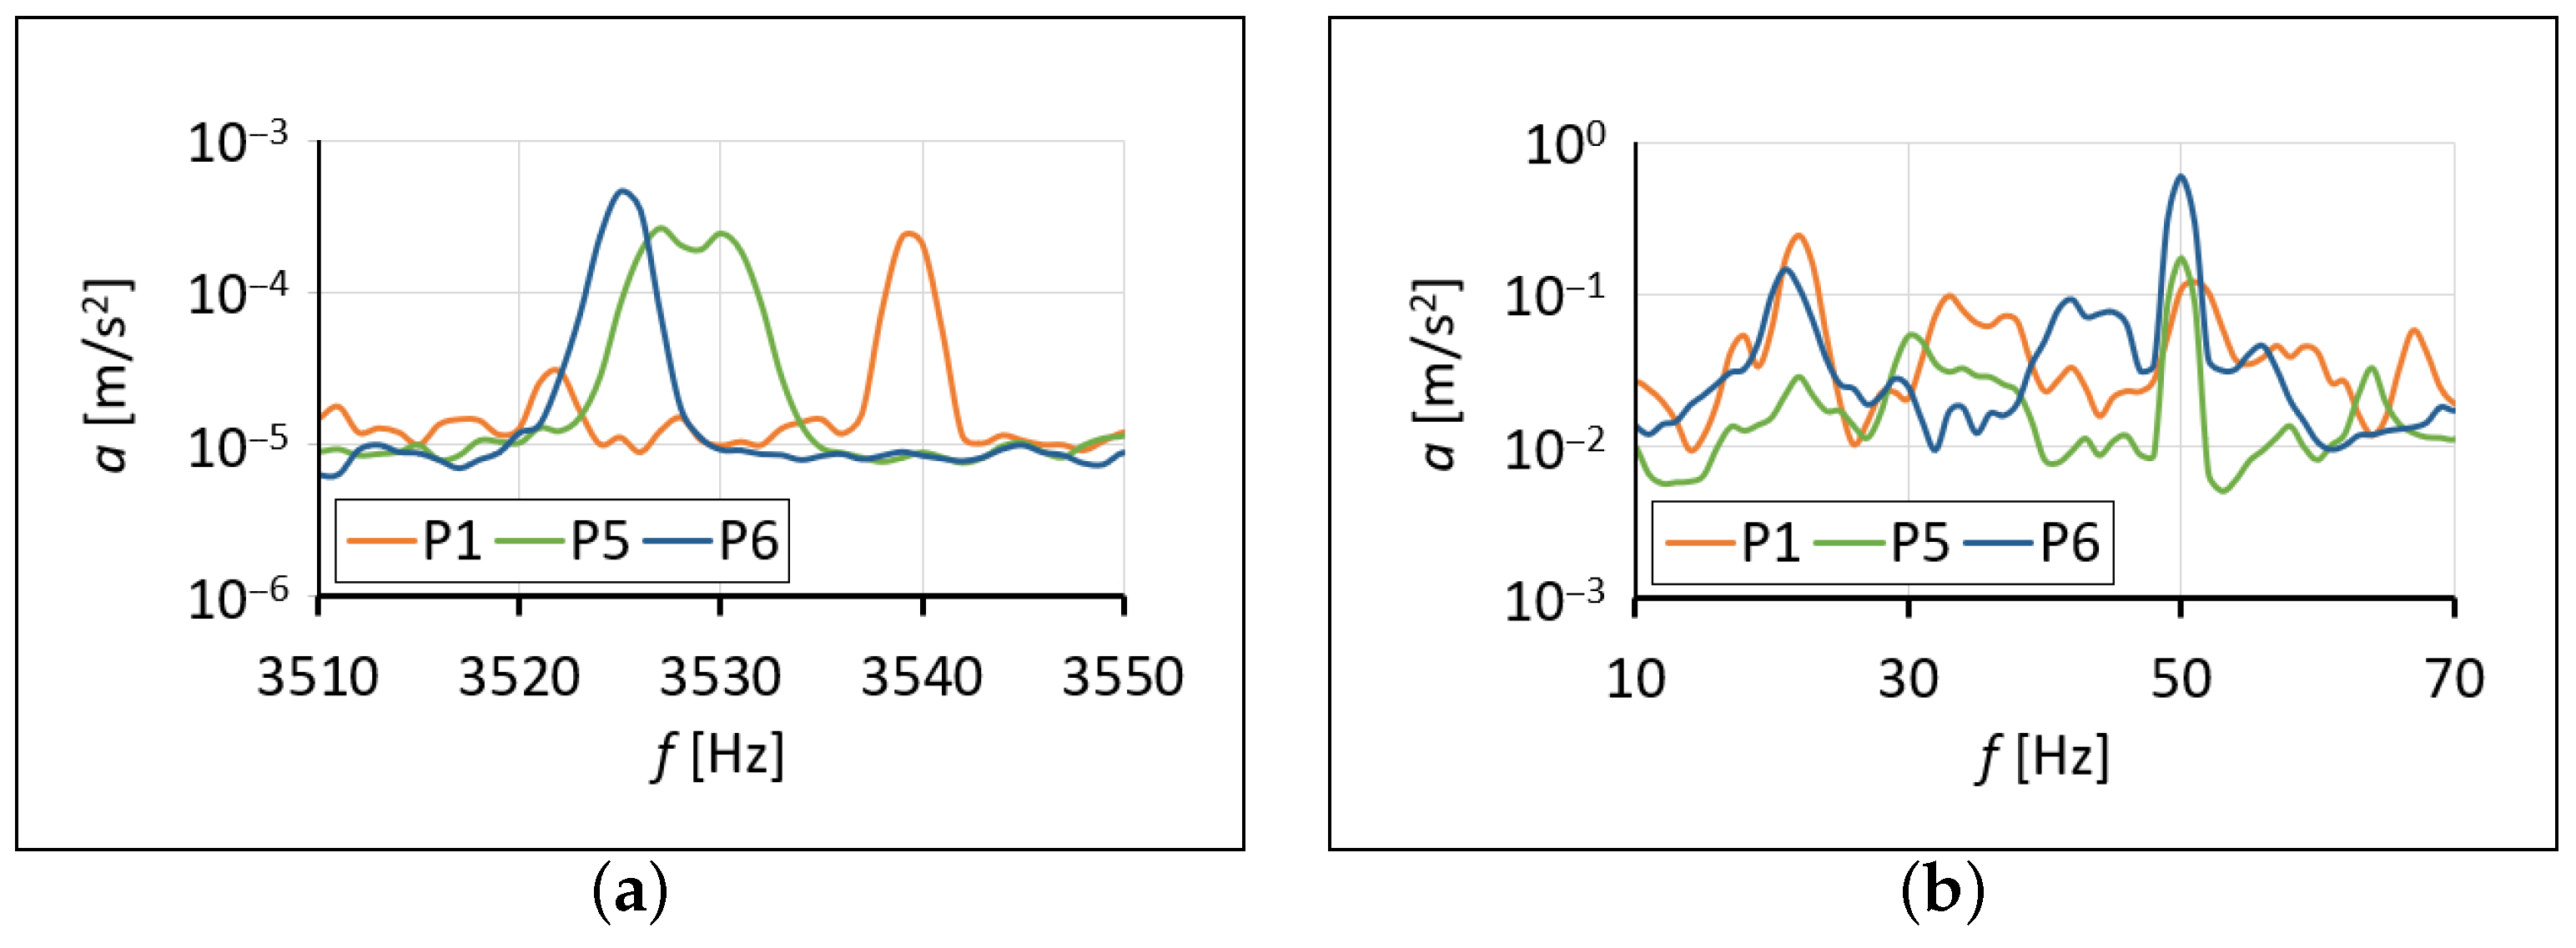
Vibration acceleration results obtained from all measurement points while the BSC motor and alarm were operating were plotted between 1 Hz and 10 kHz as shown in Figure 4. High-acceleration vibrations can thus be seen on the tray for different flask placement points. These measurements revealed peaks relative to the background vibration acceleration, particularly at frequencies of 22 Hz, 30 Hz, 50 Hz, 135 Hz, 178 Hz, 200 Hz, and 3525 Hz.
Figure 4.
Measurement results of the vibrations on the working tray with BSC motor and alarm on.
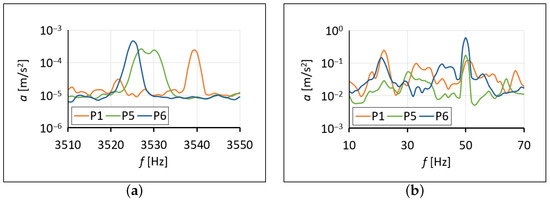
Three locations, P1, P5, and P6, stood out as being sensitive to both alarm sounds and room and BSC cavity mode frequencies. It was observed that these points generated peak vibration accelerations, particularly between 20 Hz and 50 Hz due to structural and BSC sources, and between 3520 Hz and 3550 Hz due to alarm sounds as shown in Figure 5.
Figure 5.
Measurement results of the vibrations on the working tray with BSC motor and alarm on for flask points P1, P5 and P6 showing (a) alarm induced, (b) structural and BSC induced vibrations.
Based on these analyses, the dominant vibration components and their likely origins are summarized in Table 1.
Table 1.
Dominant vibration-frequency components observed on the BSC working tray (motor and alarm operating) and their likely sources/interpretations.
Tray locations P1, P5, and P6 for the scratch assay were selected by jointly considering (i) the BSC alarm and motor disturbance characteristics, (ii) the measured spatial variability of tray vibration, and (iii) the proximity of flask acoustic modes to the alarm spectral peak(s).
3.2. Scratch Assay Outcomes
Based on the vibroacoustic characterization, three tray locations (P1, P5, and P6) were selected to represent distinct regions of the working tray and to coincide with frequencies of interest identified in the alarm spectrum, room/BSC cavity estimates, and tray vibration response. Scratch assays were then performed at these locations.
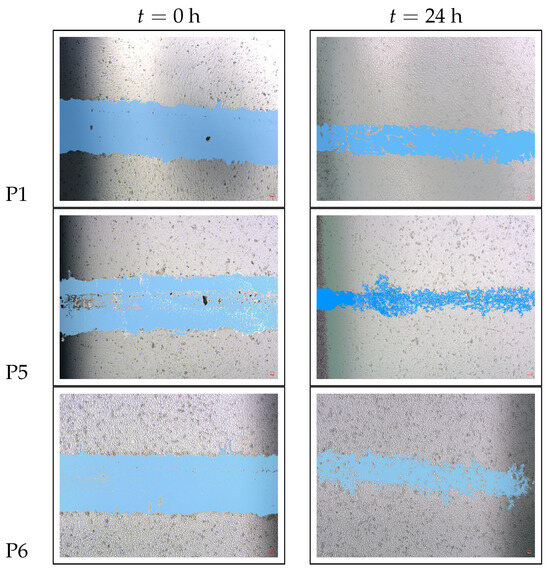
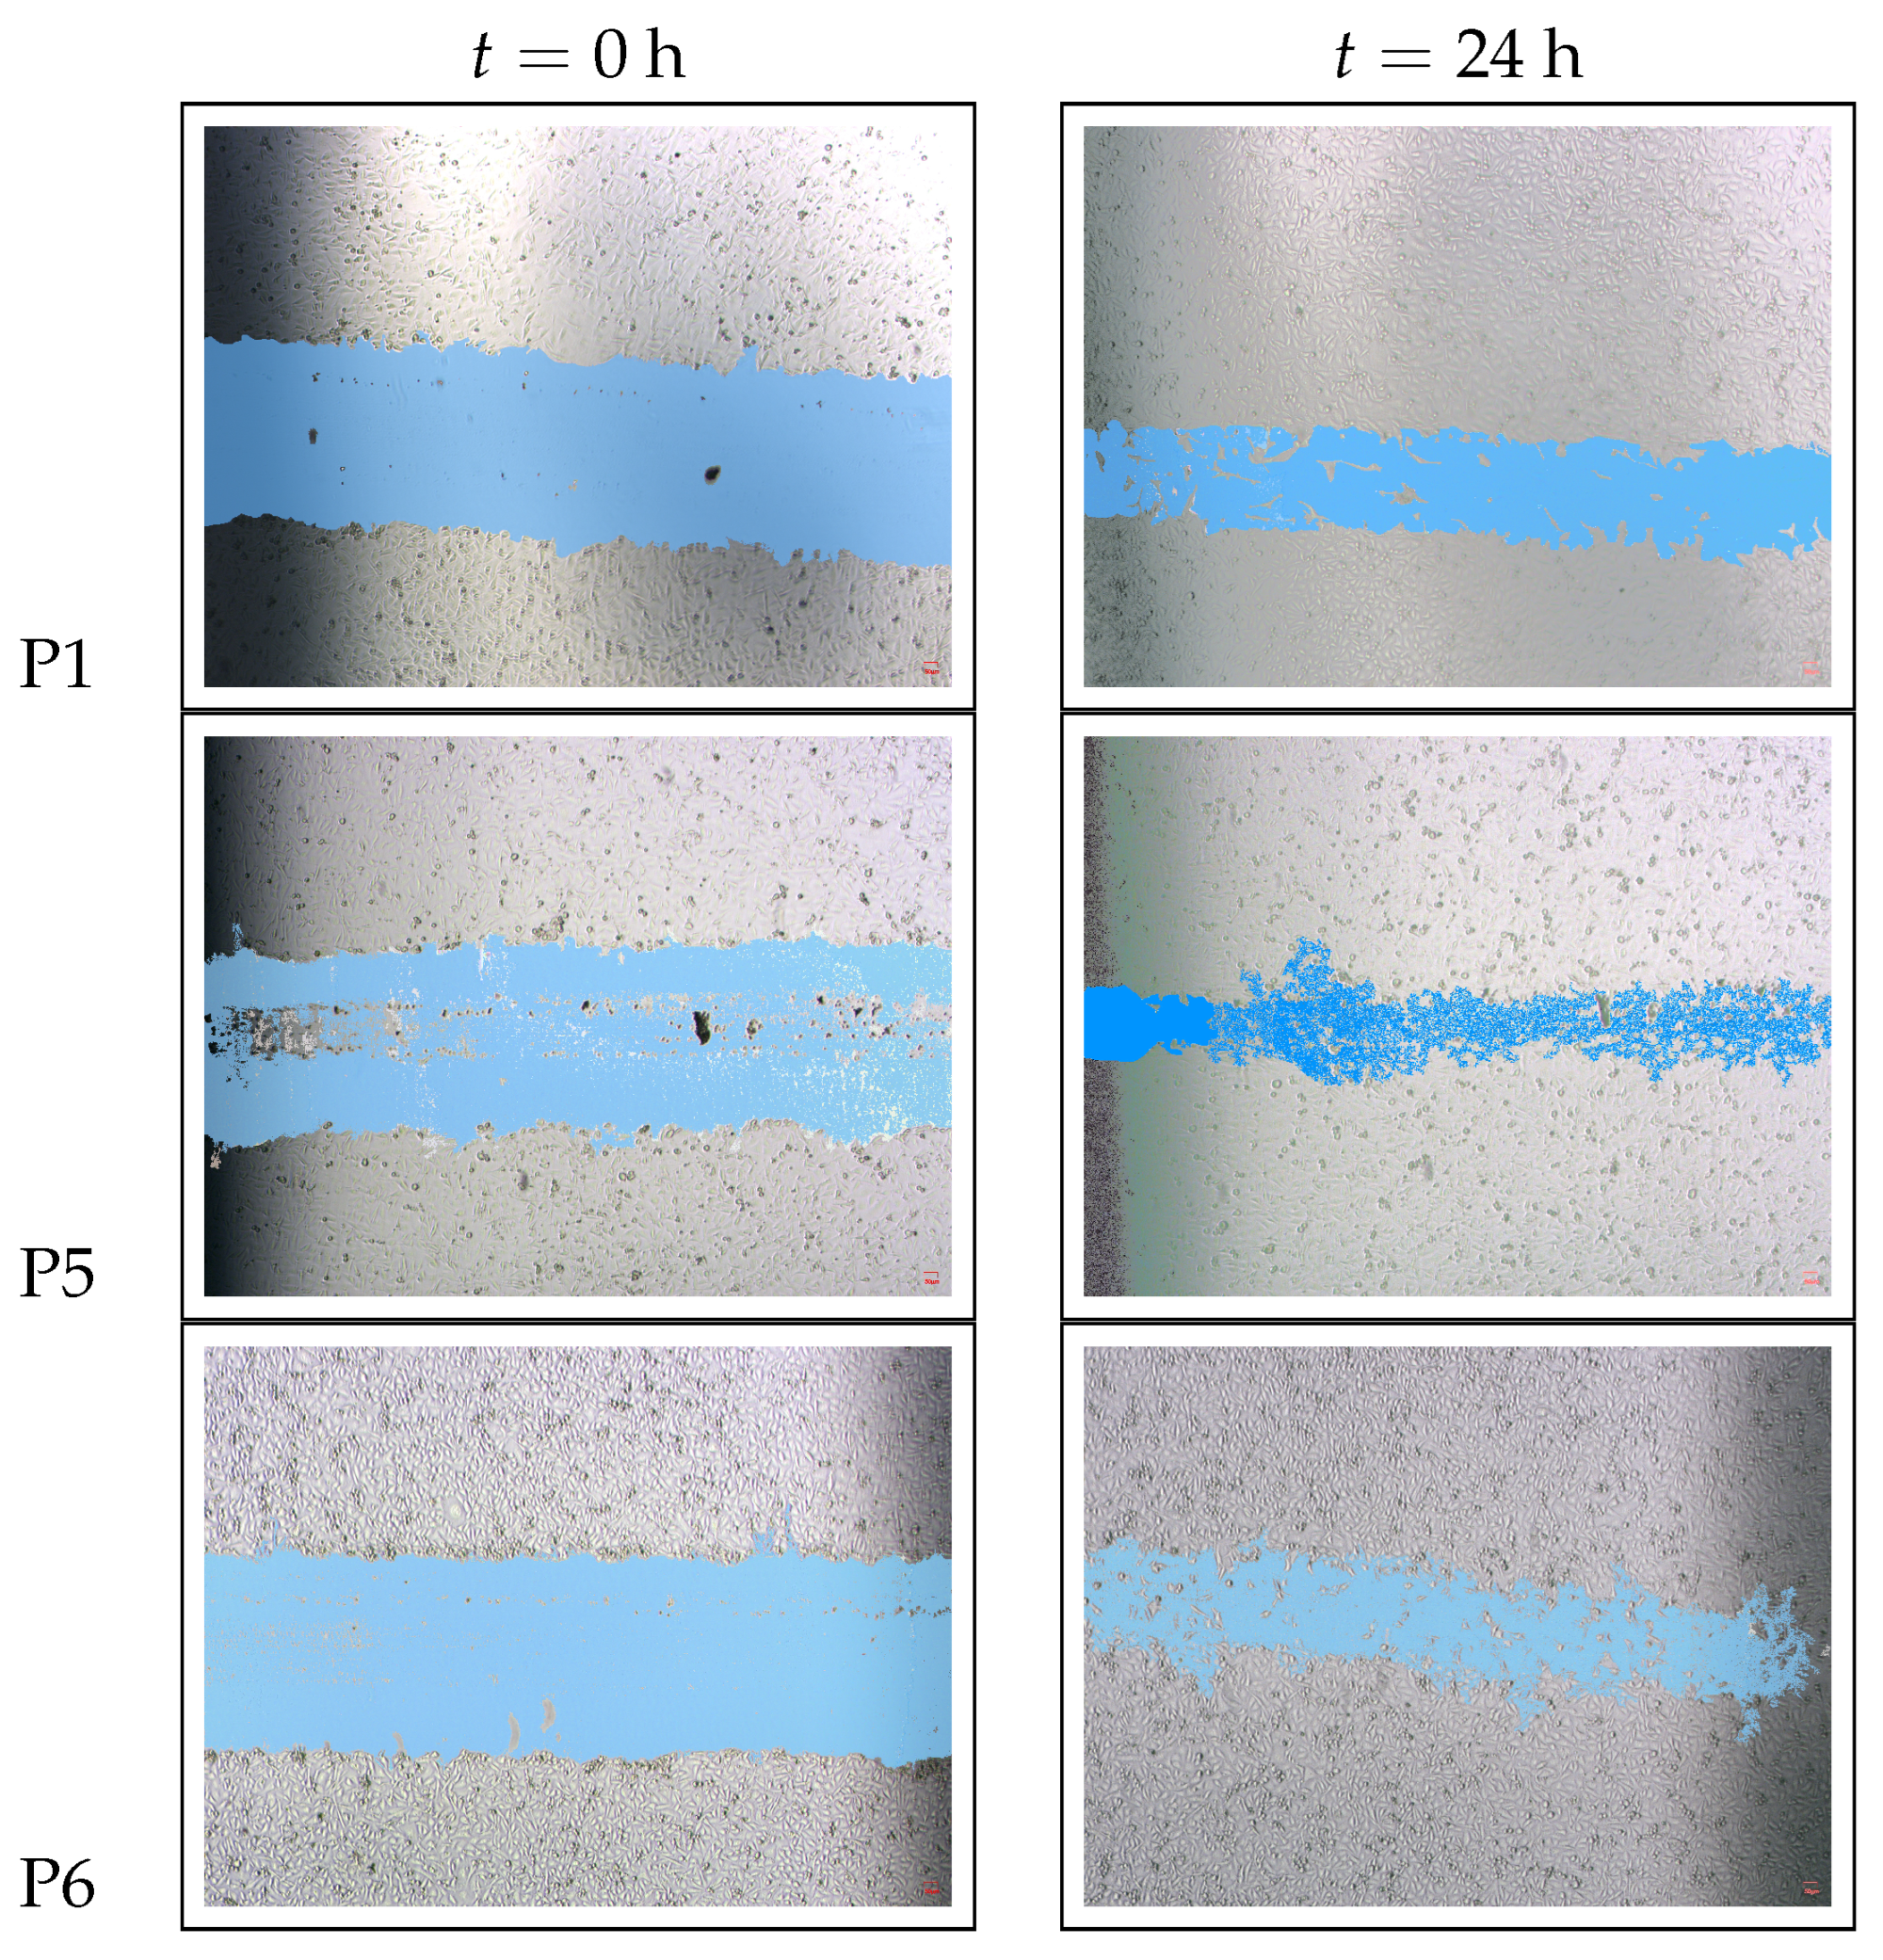
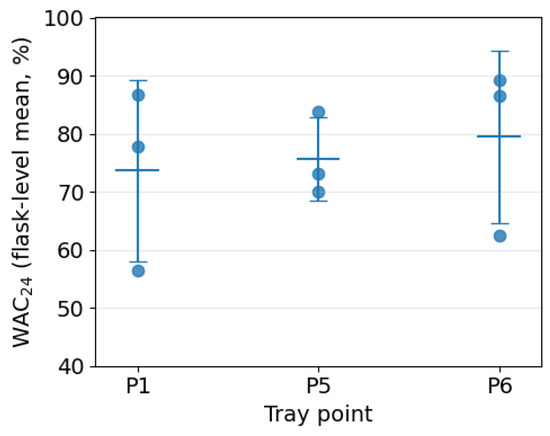
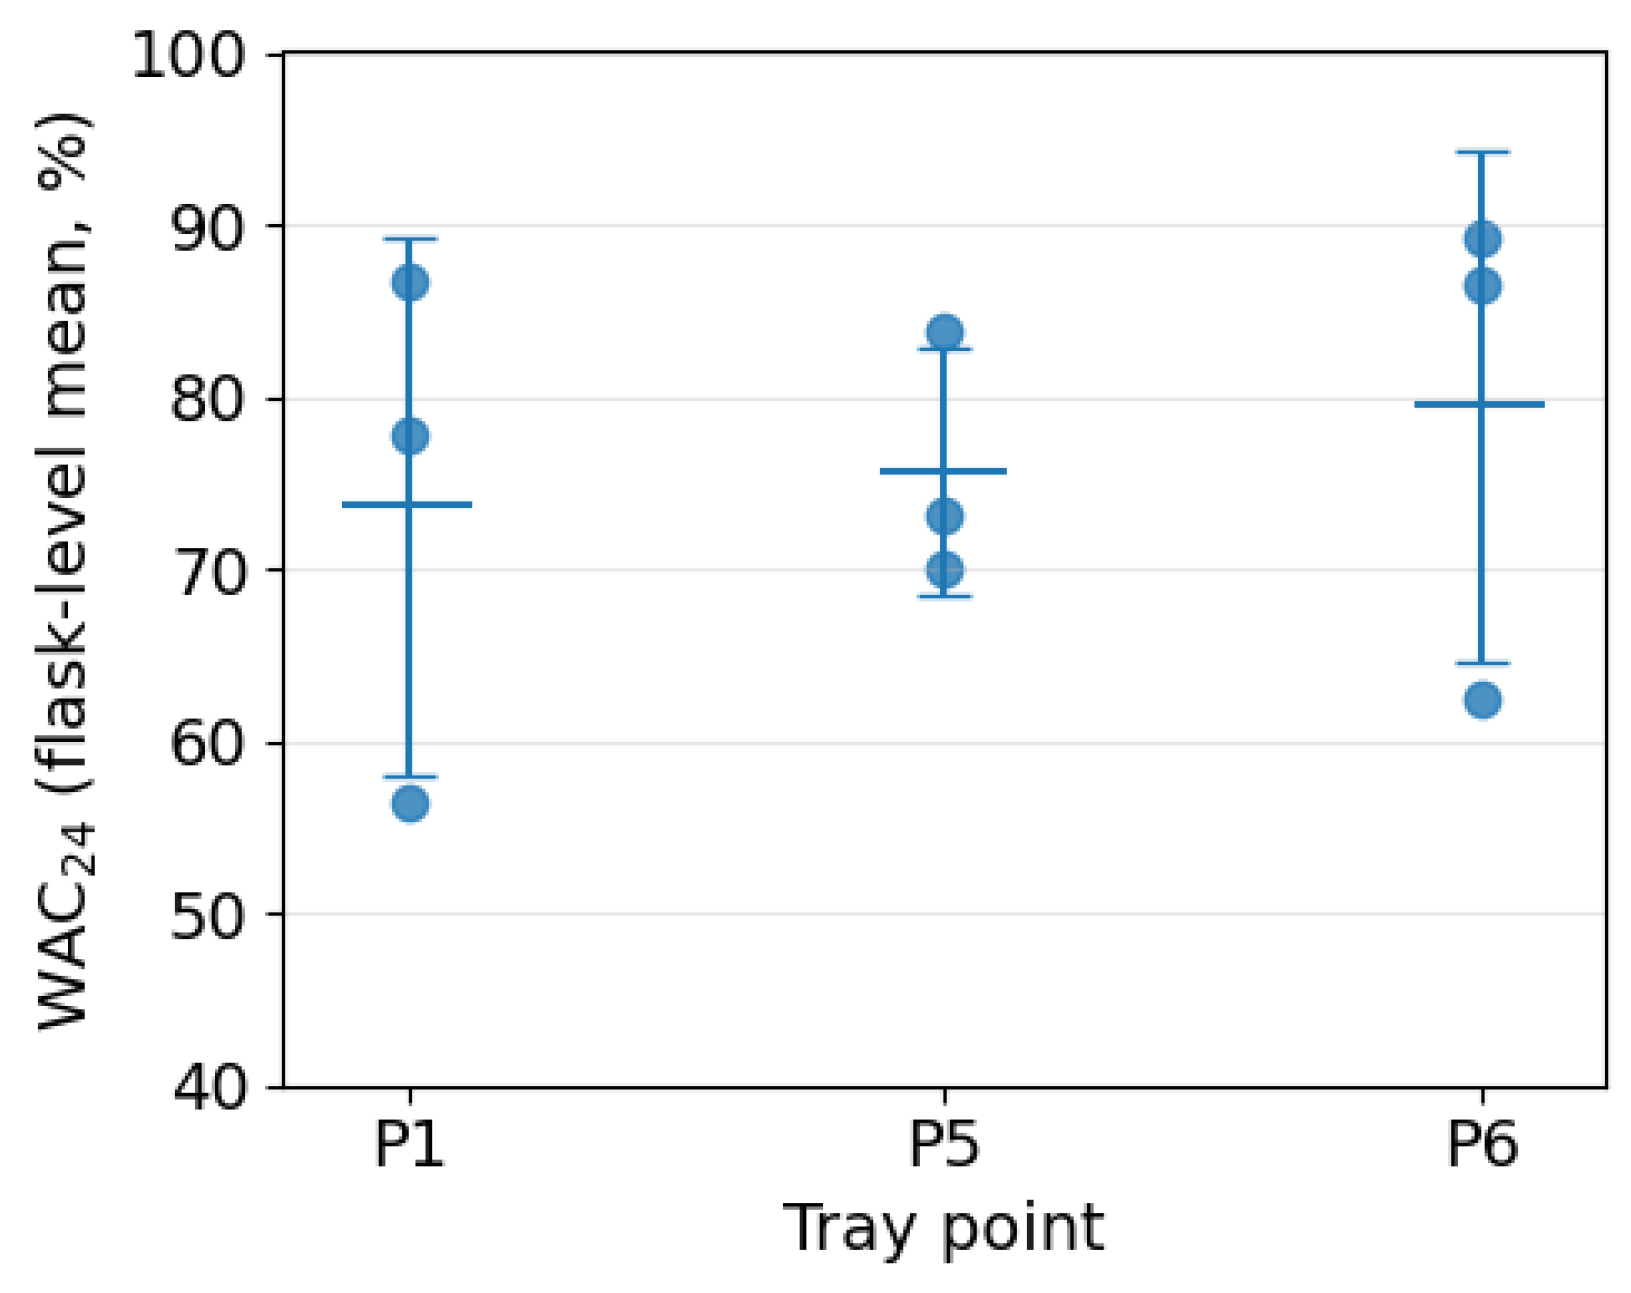
Figure 6 shows representative images at 0 h and 24 h, and flask-level values are summarized in Figure 7 and Table 2. Wound closure was quantified using the relative area closure metric (Equation (2)). Using flask-level means (regions averaged within each flask; independent flasks per tray point from three independent experimental runs conducted on separate dates), closure at 24 h was 73.7 (15.6)% for P1, 75.6 (7.2)% for P5, and 79.4 (14.8)% for P6. No statistically significant differences were detected among tray points (one-way ANOVA on flask-level values, , ).
Figure 6.
Representative scratch assay images for HaCaT keratinocytes at tray points P1, P5, and P6 at t = 0 h and t = 24 h (4× magnification).
Figure 7.
Flask-level values (; independent flasks per tray point from three independent experimental runs conducted on separate dates) shown as individual points with group mean ± SD.
Table 2.
Relative wound area closure at 24 h quantified by . Two image regions (Region 1–2) were acquired per flask per experimental run when available. was computed per region and then averaged within each flask (). Group mean and SD (, ) are computed across flask-level values (; independent flasks per tray point from three independent experimental runs conducted on separate dates).
4. Discussion
This study connects laboratory acoustics and equipment-generated vibration to a mechanosensitive biological readout: in vitro scratch closure in HaCaT keratinocytes. Using a relative area closure metric () and flask-level inference to avoid pseudo-replication, closure values at 24 h were of similar magnitude across the selected tray points (P1, P5, P6), and no statistically significant point-to-point differences were detected in this pilot dataset. Importantly, the measurement campaign nevertheless revealed structured vibroacoustic conditions, including spatial variability in tray vibration and a spectral proximity between BSC alarm content and a flask cavity mode, which together provide plausible coupling routes by which routine BSC operation could act as an unrecognized experimental factor in mechanosensitive assays [6]. This interpretation is consistent with prior studies showing that externally applied vibration or acoustically mediated mechanical stimulation can alter migration-related or mechanobiological cellular outcomes and cytoskeletal organization in adherent cultures [12,13,14,15,22]. Beyond migration and wound models, carefully characterized acoustic stimulation has also been shown to drive cell-type-specific functional changes under controlled exposure conditions (e.g., piezoelectric-substrate differentiation, exosome generation, and restoration of motility), reinforcing that frequency content, dose, and coupling can be biologically meaningful [8,9,10].
Importantly, the present measurements characterize the environmental vibroacoustic field (room spectrum and reverberation, tray vibration spectra, and modeled cavity/flask modes), but do not directly quantify the mechanical dose at the adherent cell layer (e.g., local wall deformation, media motion, or shear stress at the monolayer). Therefore, coupling routes (tray-to-flask vibration transfer, flask-wall deformation, and pressure-field modulation within the vessel) are presented as plausible hypotheses that motivate direct near-flask measurements and coupled vibroacoustic–biomechanical modeling in follow-up work.
The exposure paradigm in this pilot study consisted of a single 30 min alarm event followed by a 24 h endpoint. Prior work indicates that cellular responses to acoustic/mechanical stimulation can depend strongly on exposure duration, repetition pattern, and temporal regularity, and that some effects may be transient rather than persistent at long post-exposure time points. Accordingly, the absence of detectable differences here may reflect limited biological replication, insufficient effective dose, or a response that does not persist to the 24 h readout under the present conditions.
4.1. Limitations and Future Work
Limitations include (i) the absence of a no-alarm (sham) control within the same experimental block, which prevents isolating alarm exposure effects from baseline scratch-closure dynamics in HaCaT cultures; (ii) the selected tray locations were chosen as vibration/acoustically sensitive points and did not include a deliberately low-exposure comparator position; (iii) limited characterization of the acoustic field at the flask surface (e.g., spatial SPL mapping) and the use of a single-axis accelerometer rather than triaxial measurements; and (iv) the potential influence of environmental conditions during the 30min exposure period outside the incubator (e.g., temperature, CO2, pH, and handling), even though temperature was monitored and all flasks were exposed simultaneously. Future studies should incorporate matched sham exposure, increase biological replication, and use controlled sound/vibration sources with quantified dose metrics to test frequency-specific hypotheses aligned with predicted room/BSC/flask resonances.
Prior work emphasizes that cellular outcomes under acoustic exposure can be sensitive to protocol details and secondary effects, and therefore require careful characterization of exposure conditions to disentangle primary acoustic effects from confounders [20,31]. Similarly, multi-axis measurements and mechanical-dose estimation (e.g., acceleration and induced flow/shear proxies) provide a clearer mechanistic link between an imposed vibration signal and the stimuli experienced by adherent cells [12]. At a broader level, sonomechanobiology studies reinforce that vibration/acoustic stimuli can interact with cell function through multiple mechanical pathways [11].
4.2. Sample-Size Planning and Independence of Replicates
Because the objective is to detect potentially confounding effects of incidental BSC-induced stimuli, even small differences in (e.g., 5 percentage points) may be practically relevant for assay reproducibility and downstream drug-screening interpretation. We therefore provide pilot-based sample-size estimates for a two-sided comparison of mean between two tray points, noting that is estimated from a small pilot dataset and should be updated as additional replicates become available. Assuming a common standard deviation , equal group sizes, significance level , and target power , the required number of independent biological replicates (flasks) per group is approximated by
where is the minimum detectable absolute difference in mean closure (e.g., for 5 percentage points). Using the pilot flask-level variability (), the required sample size is per tray point for and per tray point for , at and 80% power. Controlling family-wise error across three pairwise comparisons (Bonferroni, ) increases these requirements to approximately 144 and 36 per tray point, respectively. Finally, multiple image regions acquired from the same flask are technical subsamples rather than independent replicates; inference should therefore be based on flask-level means or mixed-effects models with flask as a random effect.
A key implication of this pilot study is that the absence of statistically significant differences in across tray points should not be interpreted as evidence that vibroacoustic stimuli are irrelevant. Rather, our measurements demonstrate that multiple coupled mechanisms are simultaneously present (BSC motor excitation, room reverberation and modes, tray spatial variability, BSC cavity modes, and flask-cavity resonances near alarm-related tones). In such a multi-factor environment, small but practically meaningful shifts in scratch-closure outcomes may be difficult to resolve with typical low-n experimental designs, even if the underlying effect exists. This is consistent with the broader observation that acoustic/vibration–cell interactions can depend on interacting parameters (e.g., frequency content, amplitude, exposure time, and setup-dependent secondary effects), which motivates combining carefully controlled experiments with mechanistic modeling [11,20,31].
5. Conclusions
This work shows that a Class II BSC can generate structured acoustic and vibrational stimuli with spatial variability across the working tray and with spectral components that can coincide with flask resonances. While the present pilot biological dataset does not resolve point-to-point differences in , the measured vibroacoustic environment and the resulting power analysis indicate that detecting small effect sizes would require substantially larger numbers of independent biological replicates. These findings support treating BSC vibroacoustics as a potentially relevant confounding factor in mechanosensitive assays and motivate future sham-controlled experiments informed by coupled vibroacoustic and biomechanical modeling.
Author Contributions
Writing—original draft, Conceptualization, Data Curation, Formal analysis, Investigation, Methodology, Software, Visualization, M.Ö.; Writing—review & editing, Conceptualization, Data Curation, Investigation, Methodology, Project administration, Z.G.Ö. All authors have read and agreed to the published version of the manuscript.
Funding
This research received no external funding.
Institutional Review Board Statement
Not applicable.
Informed Consent Statement
Not applicable.
Data Availability Statement
The data presented in this study are available in a publicly accessible repository: Zenodo (DOI: 10.5281/zenodo.19061337).
Acknowledgments
During the preparation of this work, the authors used ChatGPT 5.2 (Auto) to improve the readability and language of the manuscript. After using this tool, the authors reviewed and edited the content as needed and take full responsibility for the content of the published article.
Conflicts of Interest
The authors declare no conflicts of interest.
References
- Kruse, R.H.; Puckett, W.H.; Richardson, J.H. Biological safety cabinetry. Clin. Microbiol. Rev. 1991, 4, 207–241. [Google Scholar] [CrossRef]
- Cieslak, T.J.; Kortepeter, M.G. A brief history of biocontainment. Curr. Treat. Options Infect. Dis. 2016, 8, 251–258. [Google Scholar] [CrossRef] [Scilit]
- Dondelinger, R. Biological safety cabinets. Biomed. Instrum. Technol. 2013, 47, 333–338. [Google Scholar] [CrossRef] [Scilit]
- EN 12469:2000; Biotechnology—Performance Criteria for Microbiological Safety Cabinets. European Committee for Standardization (CEN): Brussels, Belgium, 2000.
- NSF/ANSI 49-2022; Biosafety Cabinetry: Design, Construction, Performance, and Field Certification. NSF International: Ann Arbor, MI, USA; American National Standards Institute (ANSI): Washington, DC, USA, 2022.
- Stamm, A.; Reimers, K.; Strauß, S.; Vogt, P.; Scheper, T.; Pepelanova, I. In vitro wound healing assays–state of the art. BioNanoMaterials 2016, 17, 79–87. [Google Scholar] [CrossRef] [Scilit]
- Biala, G.; Kedzierska, E.; Kruk-Slomka, M.; Orzelska-Gorka, J.; Hmaidan, S.; Skrok, A.; Kaminski, J.; Havrankova, E.; Nadaska, D.; Malik, I. Research in the field of drug design and development. Pharmaceuticals 2023, 16, 1283. [Google Scholar] [CrossRef] [Scilit]
- Hoop, M.; Chen, X.Z.; Mushtaq, F.; Siringil, E.; Hu, C.; Nelson, B.J.; Pané, S. Ultrasound-mediated piezoelectric differentiation of neuron-like PC12 cells on PVDF membranes. Sci. Rep. 2017, 7, 4028. [Google Scholar] [CrossRef] [Scilit]
- Ambattu, L.A.; Ramesan, S.; Dekiwadia, C.; Hanssen, E.; Li, H.; Yeo, L.Y. High frequency acoustic cell stimulation promotes exosome generation regulated by a calcium-dependent mechanism. Commun. Biol. 2020, 3, 553. [Google Scholar] [CrossRef] [Scilit] [PubMed]
- Vafaie, A.; Raveshi, M.R.; Devendran, C.; Nosrati, R.; Neild, A. Making immotile sperm motile using high-frequency ultrasound. Sci. Adv. 2024, 10, eadk2864. [Google Scholar] [CrossRef] [Scilit] [PubMed]
- Ambattu, L.A.; Yeo, L.Y. Sonomechanobiology: Vibrational stimulation of cells and its therapeutic implications. Biophys. Rev. 2023, 4, 021301. [Google Scholar] [CrossRef] [Scilit]
- Kwak, D.; Combriat, T.; Jensenius, A.R.; Olsen, P.A. Characterization of Mechanical and Cellular Effects of Rhythmic Vertical Vibrations on Adherent Cell Cultures. Bioengineering 2023, 10, 811. [Google Scholar] [CrossRef] [Scilit] [PubMed]
- Mohammed, T.; Murphy, M.F.; Lilley, F.; Burton, D.R.; Bezombes, F. The effects of acoustic vibration on fibroblast cell migration. Mater. Sci. Eng. C 2016, 69, 1256–1262. [Google Scholar] [CrossRef] [Scilit] [PubMed]
- Stamp, M.E.; Brugger, M.S.; Wixforth, A.; Westerhausen, C. Acoustotaxis–in vitro stimulation in a wound healing assay employing surface acoustic waves. Biomater. Sci. 2016, 4, 1092–1099. [Google Scholar] [CrossRef] [Scilit]
- Imashiro, C.; Kang, B.; Lee, Y.; Hwang, Y.H.; Im, S.; Kim, D.E.; Takemura, K.; Lee, H. Propagating acoustic waves on a culture substrate regulate the directional collective cell migration. Microsyst. Nanoeng. 2021, 7, 90. [Google Scholar] [CrossRef] [Scilit] [PubMed]
- Haba, D.; Itabashi, M.; Tamai, N.; Tobe, H.; Sanada, H.; Nakagami, G. Effectiveness of Vibration Therapy for Hard-to-Heal Wounds in Clinical Study: A Scoping Review. Chronic Wound Care Manag. Res. 2024, 11, 1–12. [Google Scholar] [CrossRef] [Scilit]
- Armstrong, J.P.; Puetzer, J.L.; Serio, A.; Guex, A.G.; Kapnisi, M.; Breant, A.; Zong, Y.; Assal, V.; Skaalure, S.C.; King, O.; et al. Engineering anisotropic muscle tissue using acoustic cell patterning. Adv. Mater. 2018, 30, 1802649. [Google Scholar] [CrossRef] [Scilit] [PubMed]
- Wu, Z.; Pan, M.; Wang, J.; Wen, B.; Lu, L.; Ren, H. Acoustofluidics for cell patterning and tissue engineering. Eng. Regen. 2022, 3, 397–406. [Google Scholar] [CrossRef] [Scilit]
- Guex, A.; Di Marzio, N.; Eglin, D.; Alini, M.; Serra, T. The waves that make the pattern: A review on acoustic manipulation in biomedical research. Mater. Today Bio 2021, 10, 100110. [Google Scholar] [CrossRef] [Scilit]
- Levario-Diaz, V.; Bhaskar, P.; Carmen Galan, M.; Barnes, A.C. Effect of acoustic standing waves on cellular viability and metabolic activity. Sci. Rep. 2020, 10, 8493. [Google Scholar] [CrossRef] [Scilit]
- Dawson, J.E.; Sellmann, T.; Porath, K.; Bader, R.; van Rienen, U.; Appali, R.; Köhling, R. Cell-cell interactions and fluctuations in the direction of motility promote directed migration of osteoblasts in direct current electrotaxis. Front. Bioeng. Biotechnol. 2022, 10, 995326. [Google Scholar] [CrossRef] [Scilit]
- Brugger, M.S.; Baumgartner, K.; Mauritz, S.C.; Gerlach, S.C.; Röder, F.; Schlosser, C.; Fluhrer, R.; Wixforth, A.; Westerhausen, C. Vibration enhanced cell growth induced by surface acoustic waves as in vitro wound-healing model. Proc. Natl. Acad. Sci. USA 2020, 117, 31603–31613. [Google Scholar]
- Kurashina, Y.; Imashiro, C.; Hirano, M.; Kuribara, T.; Totani, K.; Ohnuma, K.; Friend, J.; Takemura, K. Enzyme-free release of adhered cells from standard culture dishes using intermittent ultrasonic traveling waves. Commun. Biol. 2019, 2, 393. [Google Scholar] [CrossRef] [Scilit] [PubMed]
- IEC 61672-1:2013; Electroacoustics—Sound level meters—Part 1: Specifications. International Electrotechnical Commission (IEC): Geneva, Switzerland, 2013.
- EN ISO 3382-2:2008; Acoustics—Measurement of Room Acoustic Parameters—Part 2: Reverberation Time in Ordinary Rooms. European Committee for Standardization (CEN): Brussels, Belgium, 2008.
- ISO 4866:2010; Mechanical Vibration and Shock—Vibration of Fixed Structures—Guidelines for the Measurement of Vibrations and Evaluation of Their Effects on Structures. International Organization for Standardization (ISO): Geneva, Switzerland, 2010.
- Bartold, P.M.; Raben, A.; Marshall, M.D. Growth factor modulation of fibroblasts in simulated wound healing model. J. Periodontal Res. 1996, 31, 205–216. [Google Scholar] [CrossRef] [Scilit]
- Liang, C.C.; Park, A.Y.; Guan, J.L. In vitro scratch assay: A convenient and inexpensive method for analysis of cell migration in vitro. Nat. Protoc. 2007, 2, 329–333. [Google Scholar] [CrossRef] [Scilit] [PubMed]
- Suárez-Arnedo, A.; Torres Figueroa, F.; Clavijo, C.; Arbeláez, P.; Cruz, J.C.; Muñoz-Camargo, C. An image J plugin for the high throughput image analysis of in vitro scratch wound healing assays. PLoS ONE 2020, 15, e0232565. [Google Scholar] [CrossRef] [Scilit] [PubMed]
- Brewster, R. Paint.NET–Download. Available online: https://www.getpaint.net/download.html (accessed on 13 January 2018).
- Kwak, D.; Combriat, T.; Wang, C.; Scholz, H.; Danielsen, A.; Jensenius, A.R. Music for cells? A systematic review of studies investigating the effects of audible sound played through speaker-based systems on cell cultures. Music Sci. 2022, 5, 20592043221080965. [Google Scholar] [CrossRef] [Scilit]

Disclaimer/Publisher’s Note: The statements, opinions and data contained in all publications are solely those of the individual author(s) and contributor(s) and not of MDPI and/or the editor(s). MDPI and/or the editor(s) disclaim responsibility for any injury to people or property resulting from any ideas, methods, instructions or products referred to in the content. |
© 2026 by the authors. Licensee MDPI, Basel, Switzerland. This article is an open access article distributed under the terms and conditions of the Creative Commons Attribution (CC BY) license.