Article

Noise Characteristics and Multi-Dimensional Sound Quality Evaluation of High-Frequency Transformers Under Non-Sinusoidal Excitation


1
The School of Electrical Engineering, Southwest Jiaotong University, Chengdu 611756, China
2
State Key Laboratory of Polymer Materials Engineering, Sichuan University, Chengdu 610065, China
3
Electric Power Research Institute, Guangdong Power Grid Co., Ltd., Guangzhou 510620, China
4
Zhuhai Power Supply Bureau, Guangdong Power Grid Co., Ltd., Zhuhai 519000, China
5
The State Key Laboratory of Rail Transit Vehicle System, Southwest Jiaotong University, Chengdu 610031, China
*
Author to whom correspondence should be addressed.
Acoustics 2026, 8(2), 28; https://doi.org/10.3390/acoustics8020028
Submission received: 24 March 2026 / Revised: 19 April 2026 / Accepted: 23 April 2026 / Published: 26 April 2026

Abstract

High-frequency transformer (HFT) noise is a pivotal indicator of equipment performance. To conduct a comprehensive evaluation, this study systematically performed testing and evaluation on the noise generated by a 70 kW HFT under no-load conditions. Acoustic data were collected using acoustic sensors and a head-and-torso simulator, followed by an analysis of noise characteristics focusing on the impacts of voltage levels and operating frequencies. A multi-dimensional evaluation of HFT noise was carried out using sound quality parameters to unravel its intrinsic attributes under electrical parameter excitation. The key findings are as follows: HFT noise exhibits steady-state time-domain behavior and distinct tonal frequency-domain features; the dominant frequency is twice the operating frequency, with prominent harmonics. The noise intensity increases with the voltage levels (~47.0 dB (A) at 200 V to ~72.0 dB (A) at 750 V at 5 kHz) but decreases with the operating frequencies (~82.0 dB (A) at 4 kHz to ~47.0 dB (A) at 10 kHz at 750 V). This study establishes correlations between the electrical parameters and sound quality metrics; the loudness, sharpness, tone-to-noise ratio and prominence ratio are sensitive to the electrical parameters of HFT. Single-frequency noise from HFT exhibits remarkable perceptual salience, exacerbating the perceived annoyance. Thus, HFT design should prioritize reducing single-frequency noise to alleviate such issues.

1. Introduction

As power electronic transformers are increasingly deployed in medium-to high-voltage AC-DC grids, research and development on high-frequency transformers (HFTs) has progressively intensified. Their development focuses on high efficiency, power density, and reliability to improve the economic performance and engineering applicability of power electronic systems [1,2,3]. Furthermore, the widespread integration of such highly efficient power infrastructure is a critical enabler for electrified transportation systems, which are essential for mitigating greenhouse gas emissions from the long-distance travel sector [4]. However, the noise associated with HFTs is significantly pronounced [5,6,7]. High-frequency vibrations undermine the operational reliability of HFTs, and their noise also exerts substantial adverse effects on the surrounding environment and human health [8]. Accordingly, effectively mitigating HFT noise and ensuring long-term stable operation have become key challenges in HFT design.
The vibration and noise mechanisms of HFTs are more complex than those of conventional transformers, primarily owing to non-sinusoidal excitation and high-frequency operation conditions. Noise control for HFTs is both a key industry challenge and a core performance indicator reflecting equipment advancement. Traditionally, transformer vibration and noise optimization have involved obtaining acoustic parameters (e.g., sound pressure, intensity, power) via noise measurements, studying noise characteristics, and combining simulation analysis to identify noise distribution and transmission paths for control and structural optimization [9,10,11,12]. However, systematic research on HFT noise remains insufficient. Chen et al. [13,14] developed an electromagnetic–structural–acoustic multi-physical field numerical model for HFTs, investigating vibration and noise under sinusoidal and square-wave excitation, and designed a multi-layer resonant composite sound-absorbing structure to determine the optimal parameters. These studies, however, focused mainly on physical noise features, with little attention to subjective human perception. Currently, electrical equipment noise assessment relies on the A-weighted sound pressure level (LA) as its sole metric. LA is a widely used frequency-weighted indicator in environmental, industrial and product noise assessment, which corrects measurements via an A-weighting network to simulate human auditory characteristics and align with the actual perception. Despite its simplicity, this approach is irrational in electrical equipment noise assessment. Previous studies confirmed that noise generated by transformer-type equipment has distinct tonal and harmonic characteristics [15], and many studies indicate that A-weighting will underrate the subjective annoyance that such noise brings to humans [16,17,18]. Therefore, it is urgent to develop HFT noise evaluation metrics that are consistent with human subjective perception, so as to improve noise evaluation systems in the power industry.
Sound quality evaluation methodologies, which effectively characterize human subjective perceptions, have been extensively applied and developed in recent years [19,20,21,22]. The introduction and advancement of sound quality concepts have provided new insights and frameworks for noise management: noise control should not only reduce the sound pressure level (SPL) but also adjust the noise’s sound quality attributes to achieve targeted noise reduction. As early as 1978, Broner [23] studied noise’s effects on humans, showing that subjective annoyance cannot be fully described by a single objective parameter. Fastl [24] noted that sound quality evaluation bridges physical measurements and subjective perceptions, summarizing systematic assessment approaches. Ma et al. [25] developed an innovative sound quality evaluation technique to address electric vehicle noise issues, significantly improving abnormal noise diagnosis accuracy. Gwak et al. [26] explored unmanned aerial vehicle noise’s auditory features via sound quality methods, finding that drone noise irritation strongly correlates with multiple sound quality parameters. Mian et al. [27] proposed a bearing fault detection method based on sound quality indicators and verified its effectiveness in identifying faulty vibration characteristics. Beyond the application of sound quality metrics in specific noise scenarios, advanced acoustic data analysis has evolved to incorporate physical constraints into sophisticated predictive models to interpret field data [28]. In traditional transformers, there have been some explorations regarding the evaluation of sound quality. Di et al. [29] took transformer noise as an example and investigated the influence of low-frequency noise with tonal components on human subjective annoyance. The results show that at the same A-weighted sound level, noise from 220 kV transformers is more annoying than that from 500 kV transformers, which is mainly caused by differences in the sharpness, roughness and tonality of the noise. Li et al. [30] constructed a sound quality prediction model for urban substations via subjective and objective analyses. Currently, well-established practical sound quality parameters include loudness, sharpness, tone-to-noise ratio (TNR), prominence ratio (PR), roughness, and fluctuation strength, which correlate significantly with human subjective perceptions. Sound quality evaluation methods have not yet been explored for HFT noise evaluation. Traditional single indicators fail to characterize human subjective auditory perception and the multi-dimensional characteristics of noise. Given the growing demand for low-noise power equipment, this critical limitation cannot be ignored. Exploring the application of sound quality methods in the power industry not only enriches the theoretical system of electrical equipment noise evaluation but also provides feasible support for the design optimization of power equipment. Therefore, this exploration holds significant theoretical and practical value.
To enable more scientific and rational evaluation of HFT noise in engineering practice, this paper proposes introducing sound quality evaluation approaches into HFT noise assessment. Specifically, the research first conducts noise testing on a single-phase 70 kW HFT, collecting noise data via a sound quality head-and-torso simulator (HATS) and microphones. The noise characteristics of the transformer under typical operating conditions are then analyzed, with a focus on their variation patterns with voltage levels and operating frequencies. More importantly, this work integrates a sound quality evaluation method into the HFT noise evaluation and establishes correlations between electrical parameters and sound quality metrics.

2. Materials and Methods

2.1. Technical Parameters of HFT

To systematically investigate the noise characteristics and evaluation methods of HFTs, this study takes a 70 kW/5 kHz single-phase HFT with a nanocrystalline alloy core as the research object and noise tests are carried out under no-load operating conditions. The main technical parameters of the HFT are listed in Table 1.
This HFT is powered by an integrated HFT test power supply. It has a full-load power of 70 kW, and it can operate at capacities of 70 kW or below. Its rated frequency is 5 kHz and its rated voltage is 750 V. This platform can support tests for transformers that are up to 70 kW in capacity, with switching frequencies below 20 kHz and a transformation ratio of 1:1. During the test, the primary and secondary voltages must not exceed 750 V. The HFT has an insulation class of H and is cooled via natural convection.
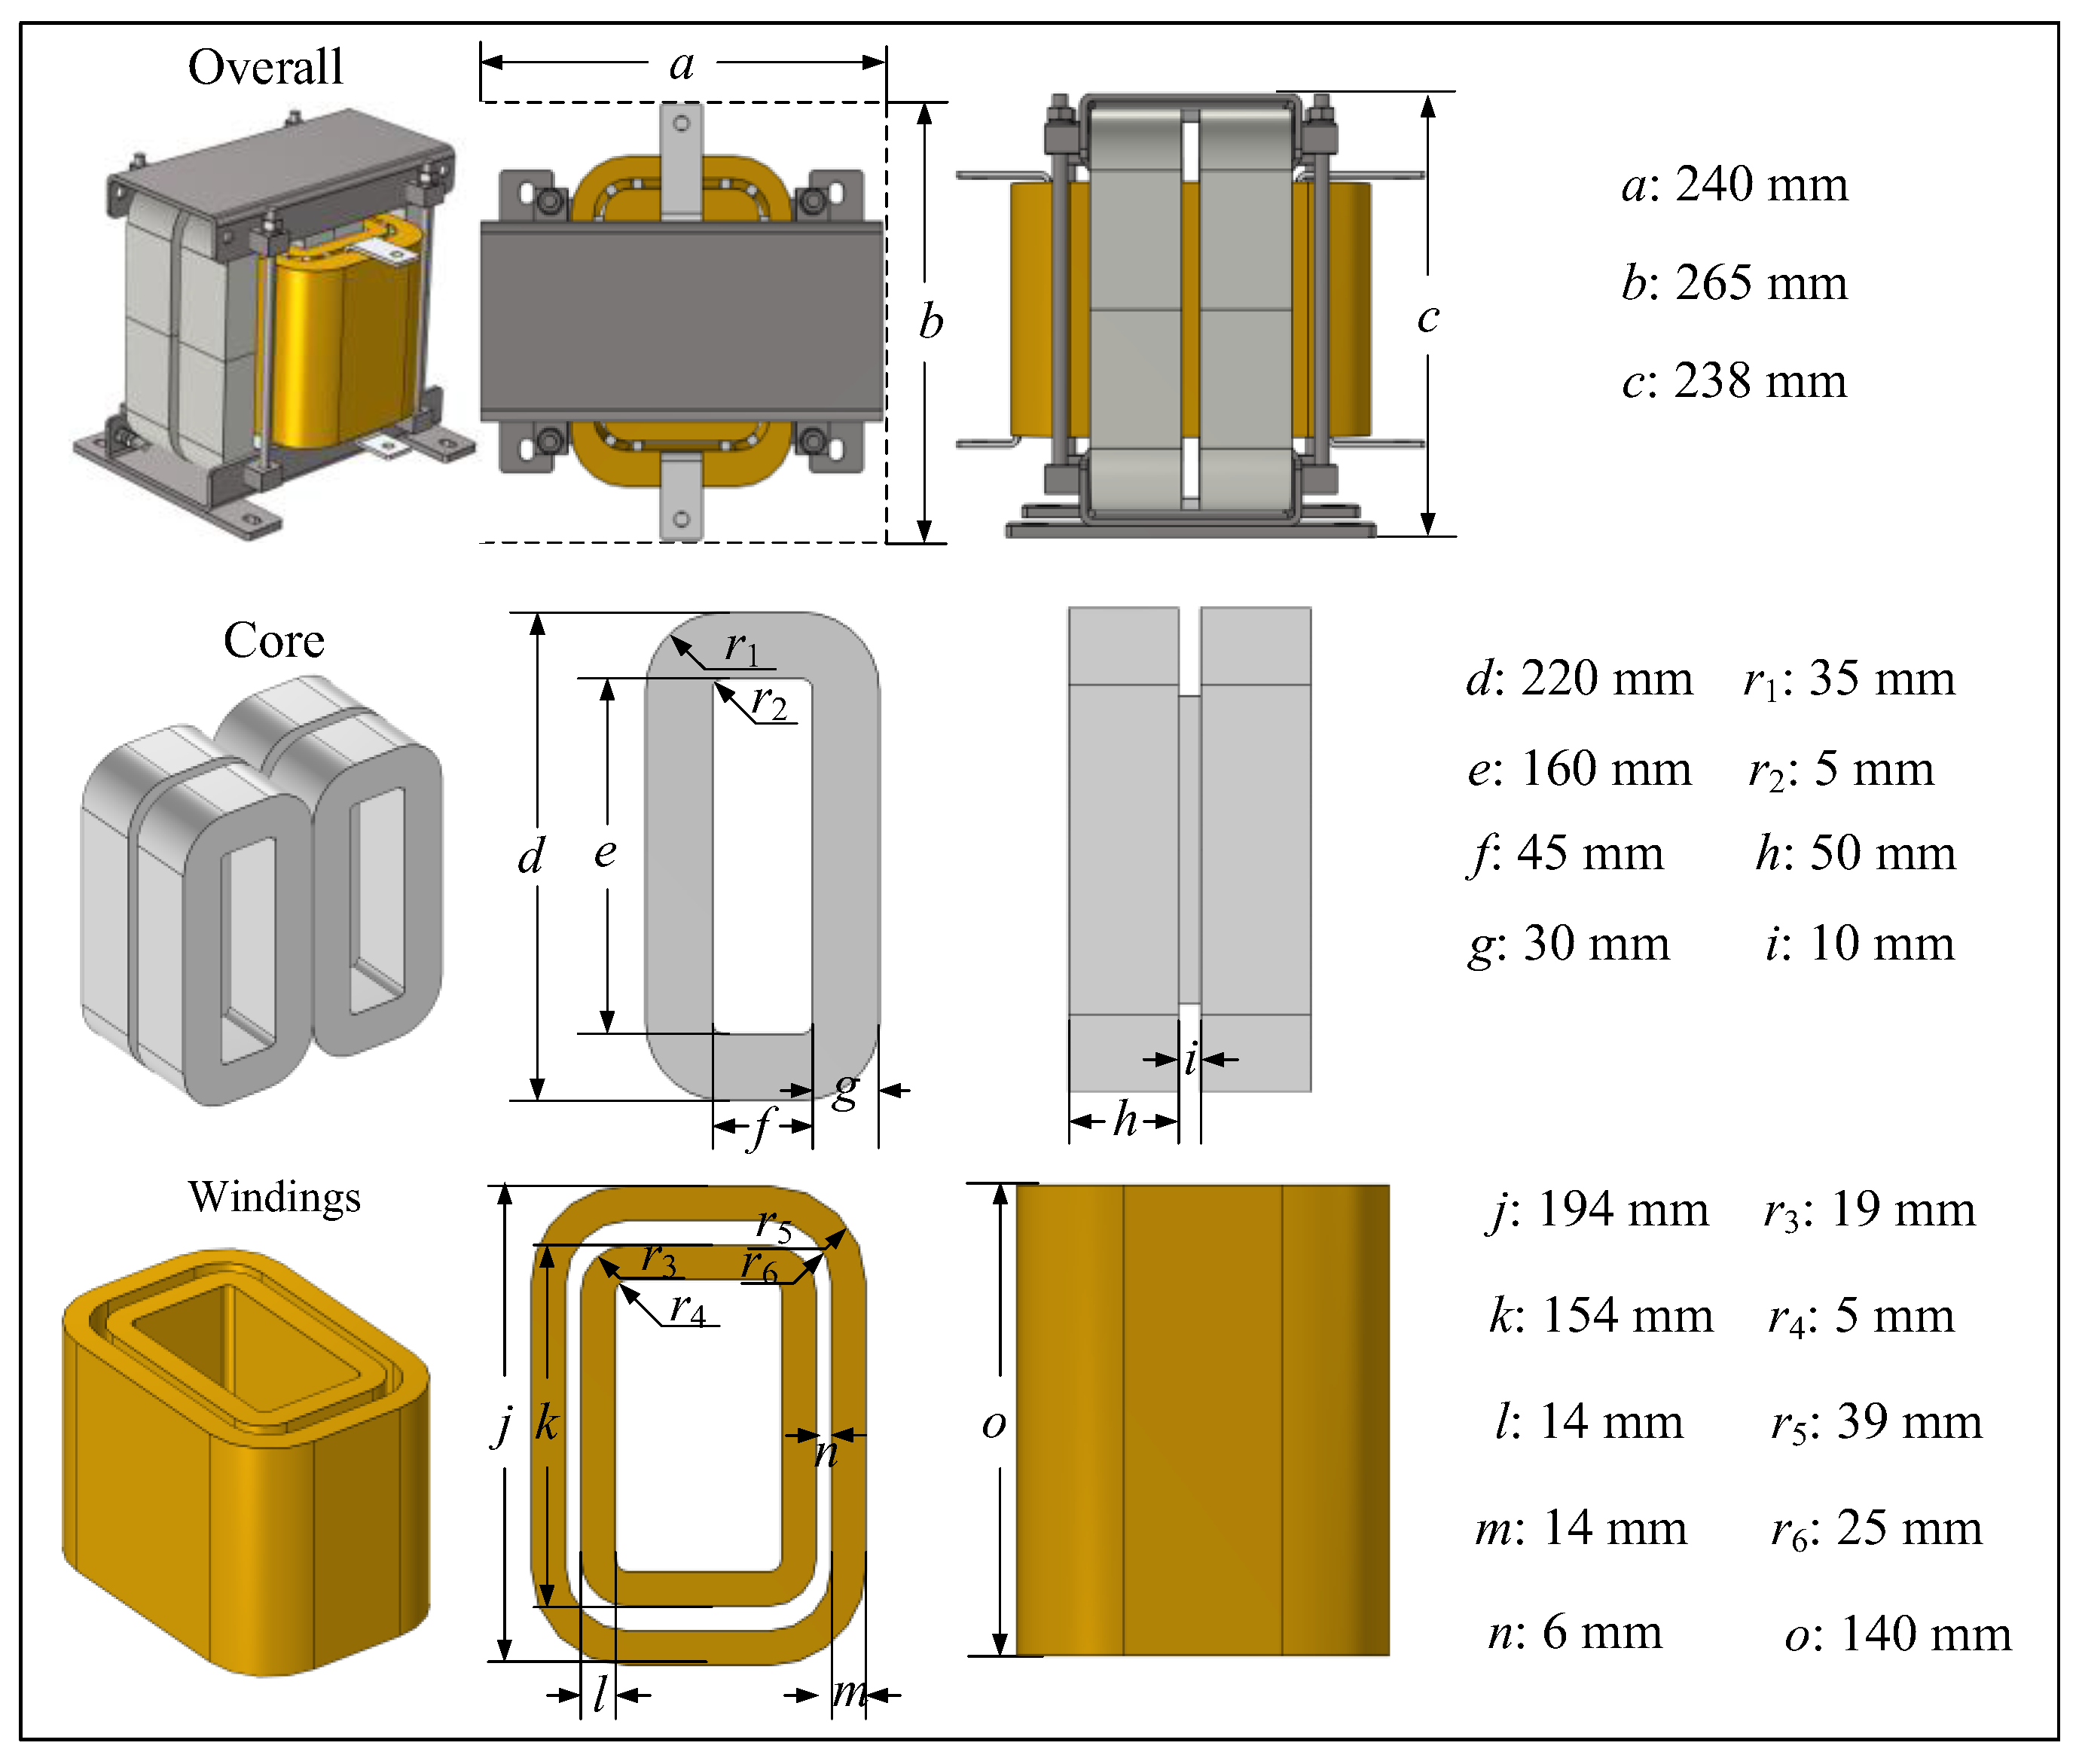
Figure 1 presents the geometric size specifications of the HFT, including the detailed size information of the overall frame, core, and windings. The geometric configuration and structural characteristics of the HFT can be clearly observed from this figure.

2.2. Equipment Specifications and Measurement Scheme

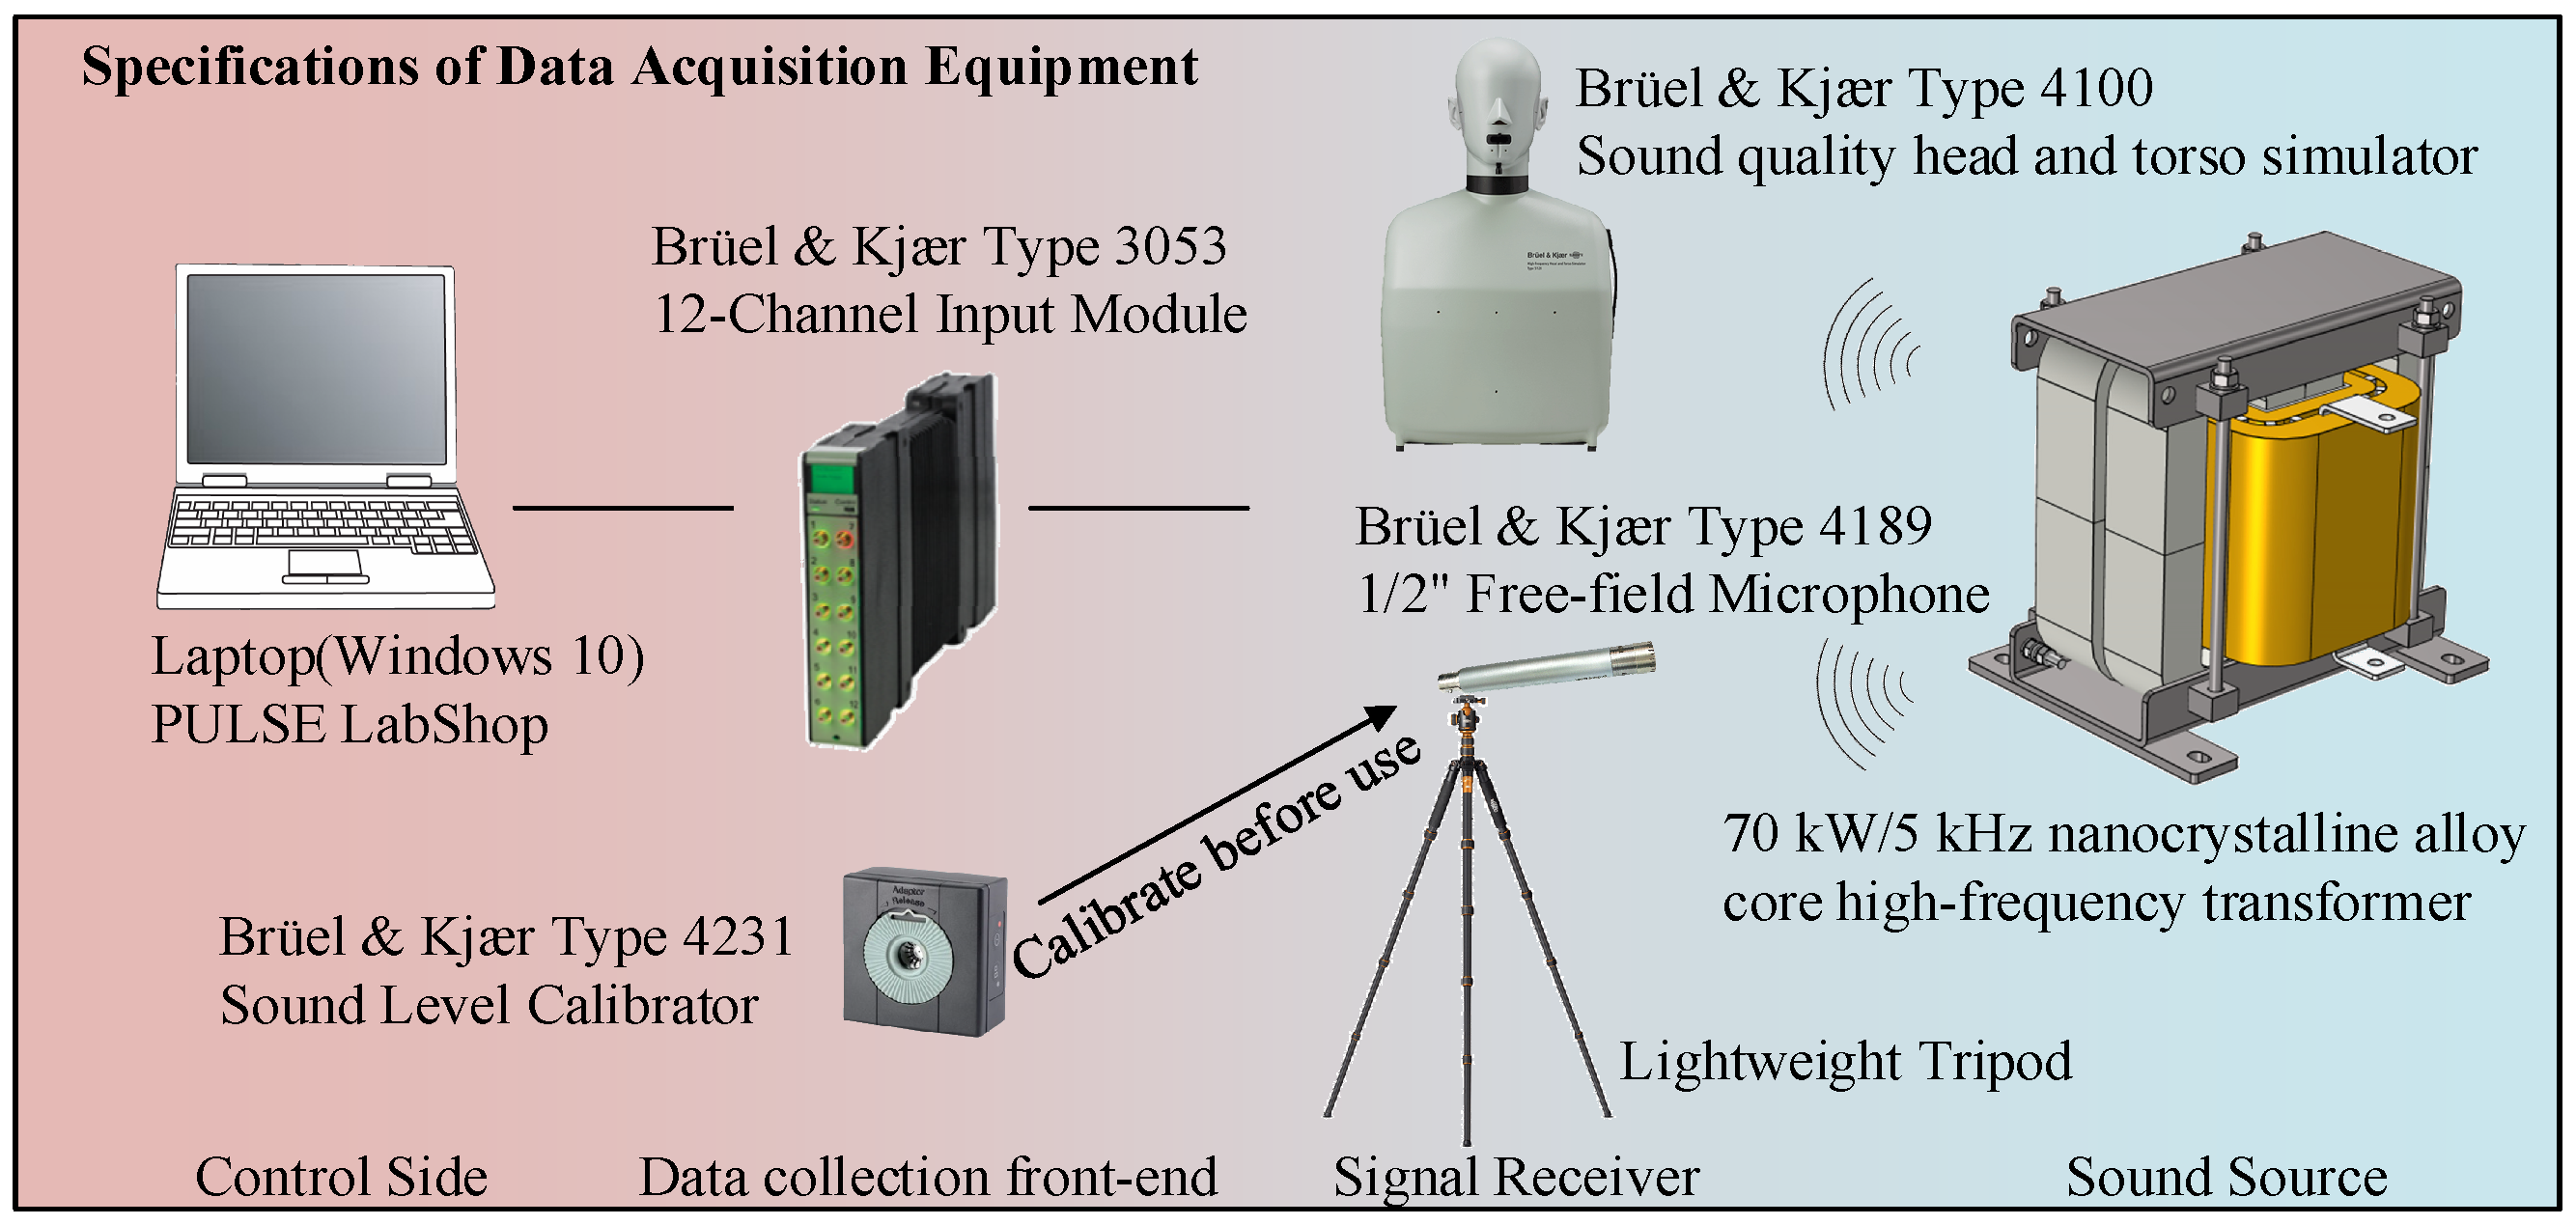
Noise tests were conducted in a semi-anechoic chamber with dimensions of 2 m × 2 m × 2.5 m (length × width × height). The equipment specifications are shown in Figure 2. The data acquisition used PULSE Labshop acoustic testing platform from Denmark’s Brüel and Kjær company, comprising a laptop, Model 3053 multi-channel data acquisition module, Model 4189 free-field acoustic sensor, Model 4231 acoustic calibrator, and Model 4100 HATS. The Model 4100 HATS incorporates two microphones positioned at the entrances to its ear canals, mimicking the separation effect of human ears. This facilitates the acquisition of acoustic signals that include the interference patterns induced by the head and upper body, thereby enabling high-precision three-dimensional binaural recording. Each microphone is fitted with a silicone ear simulator to replicate the acoustic response of the human ear. The upper torso of the HATS is covered by a sound-insulating fabric shroud. This cover alters the reflection and diffraction of noise by the torso and shoulders, replicating the actual human noise reception process, enabling the accurate and authentic replication of an average adult’s head and torso acoustic characteristics, and covering the full audible frequency range.
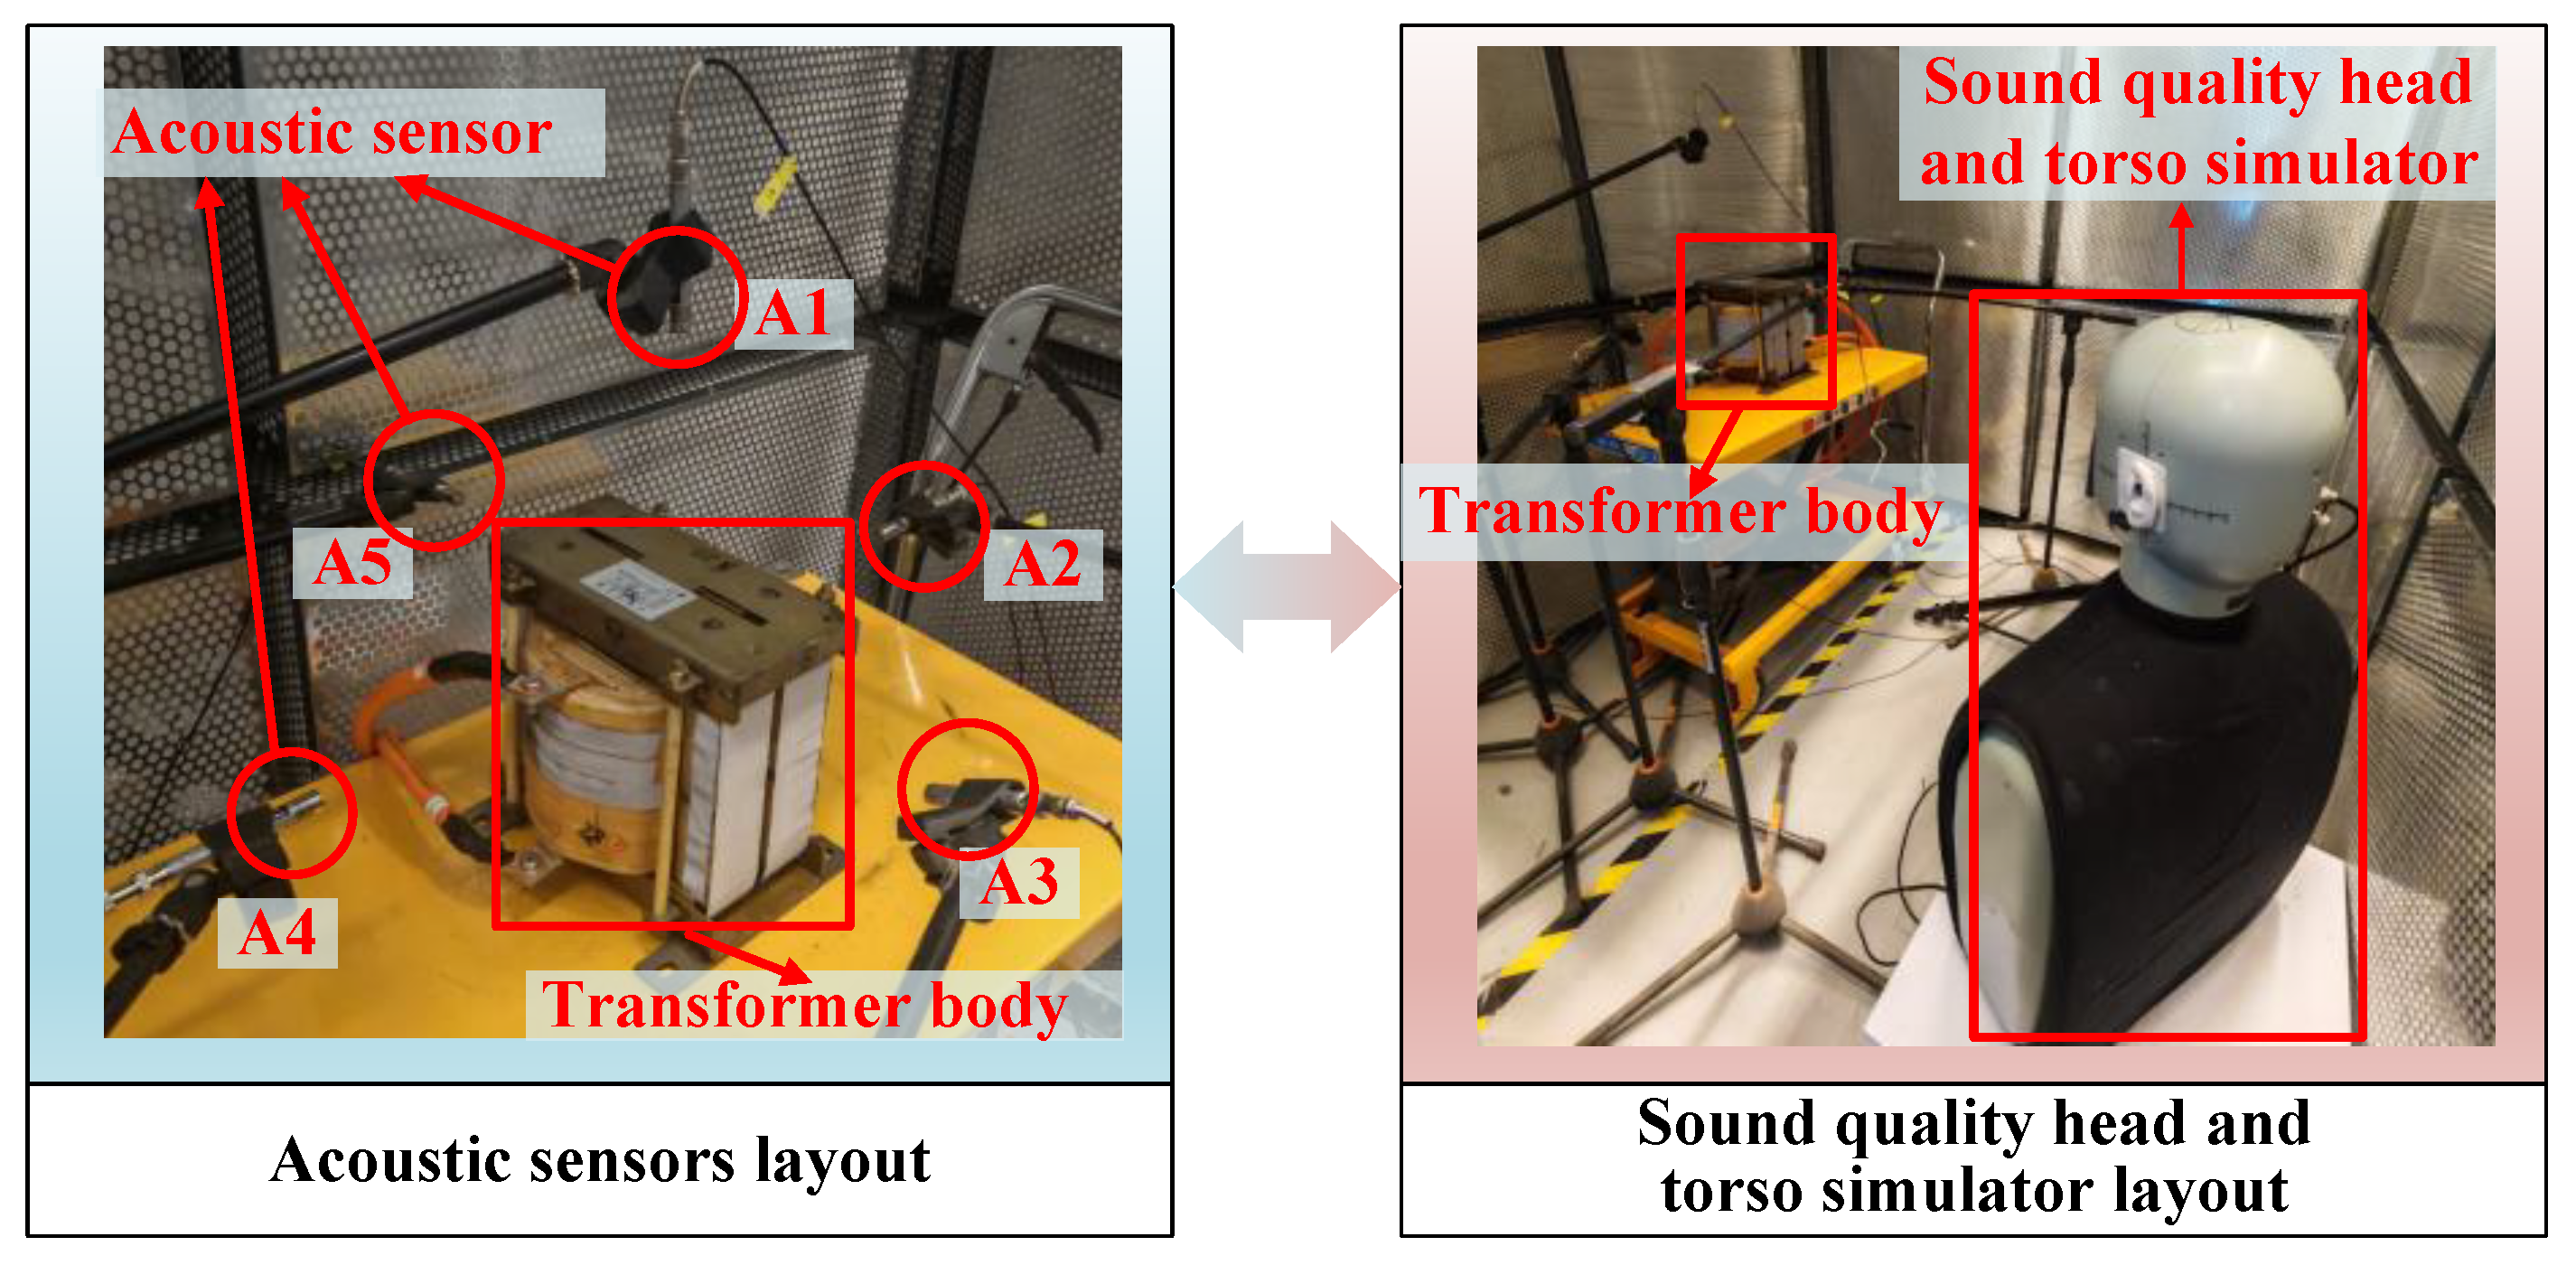
To enhance the data reliability, before each measurement, every acoustic sensor—including the microphones integrated into both ears of the HATS as well as all independent microphones—was calibrated using a Type 4231 acoustic calibrator. Figure 3 presents the layout of the noise measurement points and the HATS. The HFT was mounted on a platform, with its geometric center 1 m above the ground. Five noise measurement points were arranged (A1–A5): four on the four side surfaces of the HFT and one on the top surface. Each microphone was positioned 30 mm away from the transformer’s surface contour and aligned with the center of the corresponding surface. To simulate the process by which humans perceive noise in a real-world scenario, the HATS was placed at a 45° angle relative to the side of the HFT to obtain the maximum distance under the test conditions of this study. In this layout, the distance between the HATS and the HFT was approximately 1.8 m. The HATS was located on the direct radiation axis of the HFT. Specifically, the ear height of the HATS was aligned with the geometric central axis of the HFT.
During the testing procedure, an integrated HFT test power supply was employed to apply a symmetrical square wave to the transformer under test. Simultaneously, a high-voltage probe and a current probe were utilized to monitor the winding voltage and current in real time, ensuring the validity of the test. During the measurement, the sampling frequency for the electrical signals was set to 2 MS/s to ensure the validity and integrity of the monitored signals. In terms of data collection, all measurement points, including microphones and HATS, are synchronously collected via the communication interface. Thirty seconds of data collection per operating condition is sufficient to ensure valid data for subsequent analysis. Additionally, the analysis frequency range is set to 0–25.6 kHz, which fully covers the entire human auditory range (20 Hz–20 kHz).

3. Results and Discussion

3.1. Noise Characteristics of High-Frequency Transformer

The noise generation mechanism of HFTs is complex, involving multiple domains: electromagnetics, structural mechanics, and acoustics. The HFT noise source has been systematically elucidated in previous studies [4,5,6,12]. Building on these cumulative research efforts, the core conclusions regarding the primary noise sources of HFTs can be summarized as follows: core vibration, the primary noise source, stems mainly from core magnetostriction in alternating magnetic fields and the influence of Maxwell electromagnetic forces. Additionally, windings in alternating magnetic fields experience Lorentz forces (acting on current-carrying conductors in magnetic fields), triggering vibrations that further amplify noise radiation. To examine the noise spectrum distribution, identify dominant frequency bands, and understand the effects of voltage levels and operating frequencies on noise, analyzing noise characteristics is crucial. Based on Faraday’s law of electromagnetic induction, the voltage equation for the primary side of the transformer may be expressed as follows:
u 1 = N 1 d Φ d t + R 1 i 1
where u1 indicates a square-wave voltage; Φ denotes the main magnetic flux; N1 signifies the number of turns on the primary side; R1 is the resistance of the primary winding, which is typically small and therefore negligible; and i1 represents the current in the primary winding, namely the no-load current.
The expression of a symmetrical square wave within one period is stated as follows:
u 1 ( t ) = + U m , 0 t < T 2 U m , T 2 t < T
where T is the period of the symmetrical square wave and Um represents the amplitude of the square wave voltage.
After ignoring R1, we integrate it with Equation (1):
Φ ( t ) = 1 N 1 u 1 ( t ) d t
As indicated in Equation (3), when u1 = +Um, Φ increases linearly with time; when u1 = −Um, Φ decreases linearly over time, giving the main magnetic flux a triangular waveform. For an unsaturated core, the current maintains a linear relationship with the main magnetic flux, so the current waveform mirrors the flux waveform: both are triangular. When the core saturates and the magnetization curve enters the nonlinear region, the current rises sharply to sustain the flux growth once Φ reaches saturation, causing significant distortion and spikes in the current waveform.
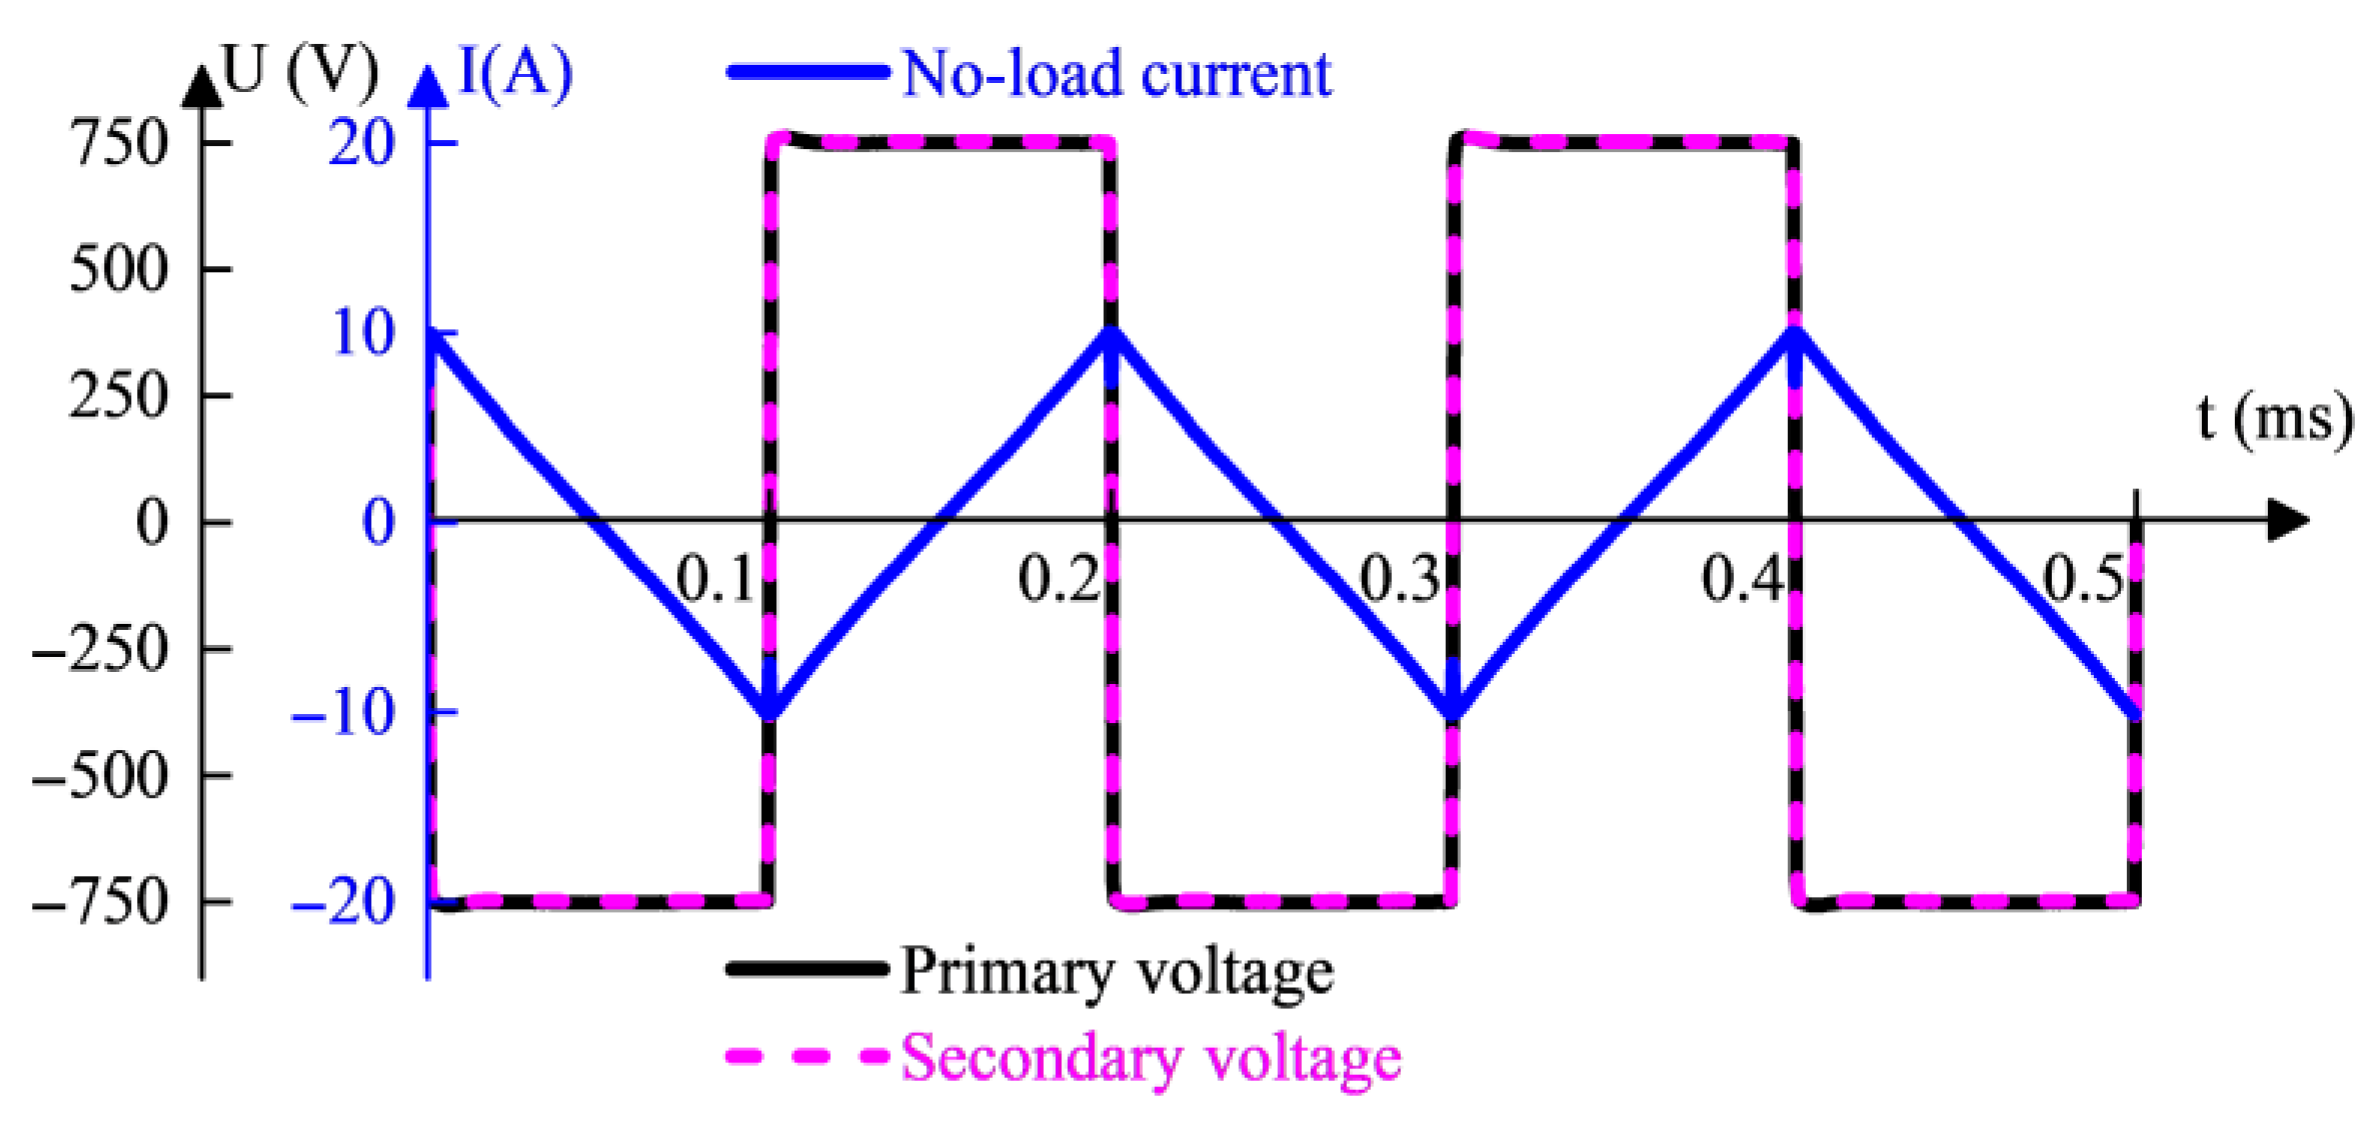
This study used 750 V, 5 kHz symmetrical square-wave excitation for valid data analysis. Primary and secondary voltage waveforms, collected and shown in Figure 4, exhibit characteristic patterns: the voltages are regular, symmetrical square waves, while the current is a standard triangular wave. This confirms undistorted voltage/current signals and core operation in an unsaturated, safe region, indicating good power quality. Thus, a reliable dataset for noise characteristic analysis is obtained, ensuring test data validity.

3.1.1. Time-Domain and Frequency-Domain Characteristics

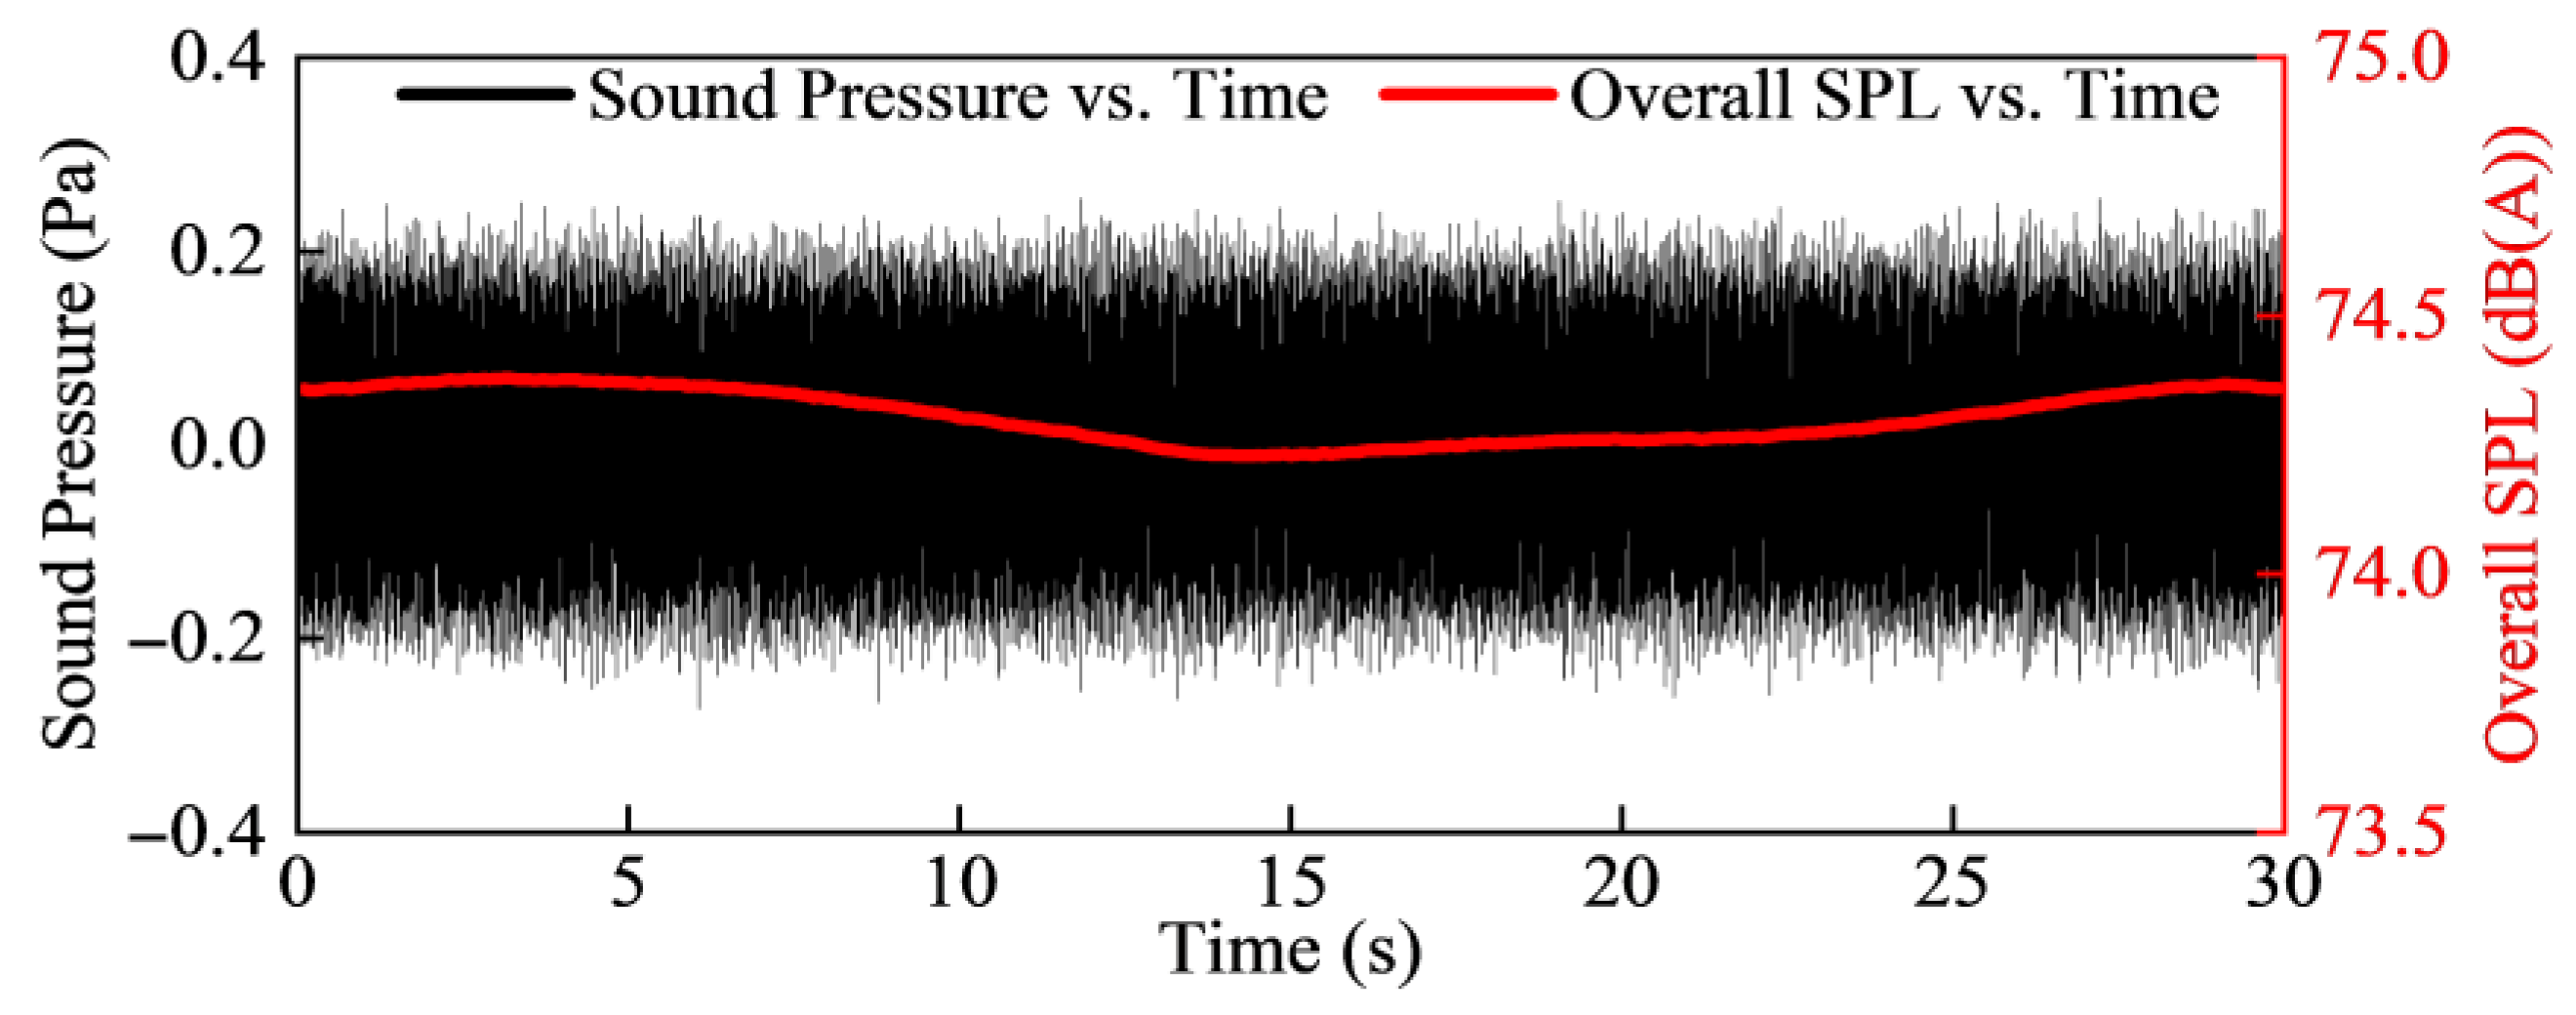
Taking measurement point A1 as an illustration, Figure 5 shows the time-domain noise data and the overall SPL curve over time under a 750 V, 5 kHz symmetrical square-wave excitation.
As shown in the figure, the time-domain signal of the HFT noise is stable, with its overall SPL remaining in the range of 74.0 dB (A) to 74.5 dB (A). This indicates that the HFT noise exhibits distinct steady-state characteristics in the time domain, with negligible temporal variation in its overall level.
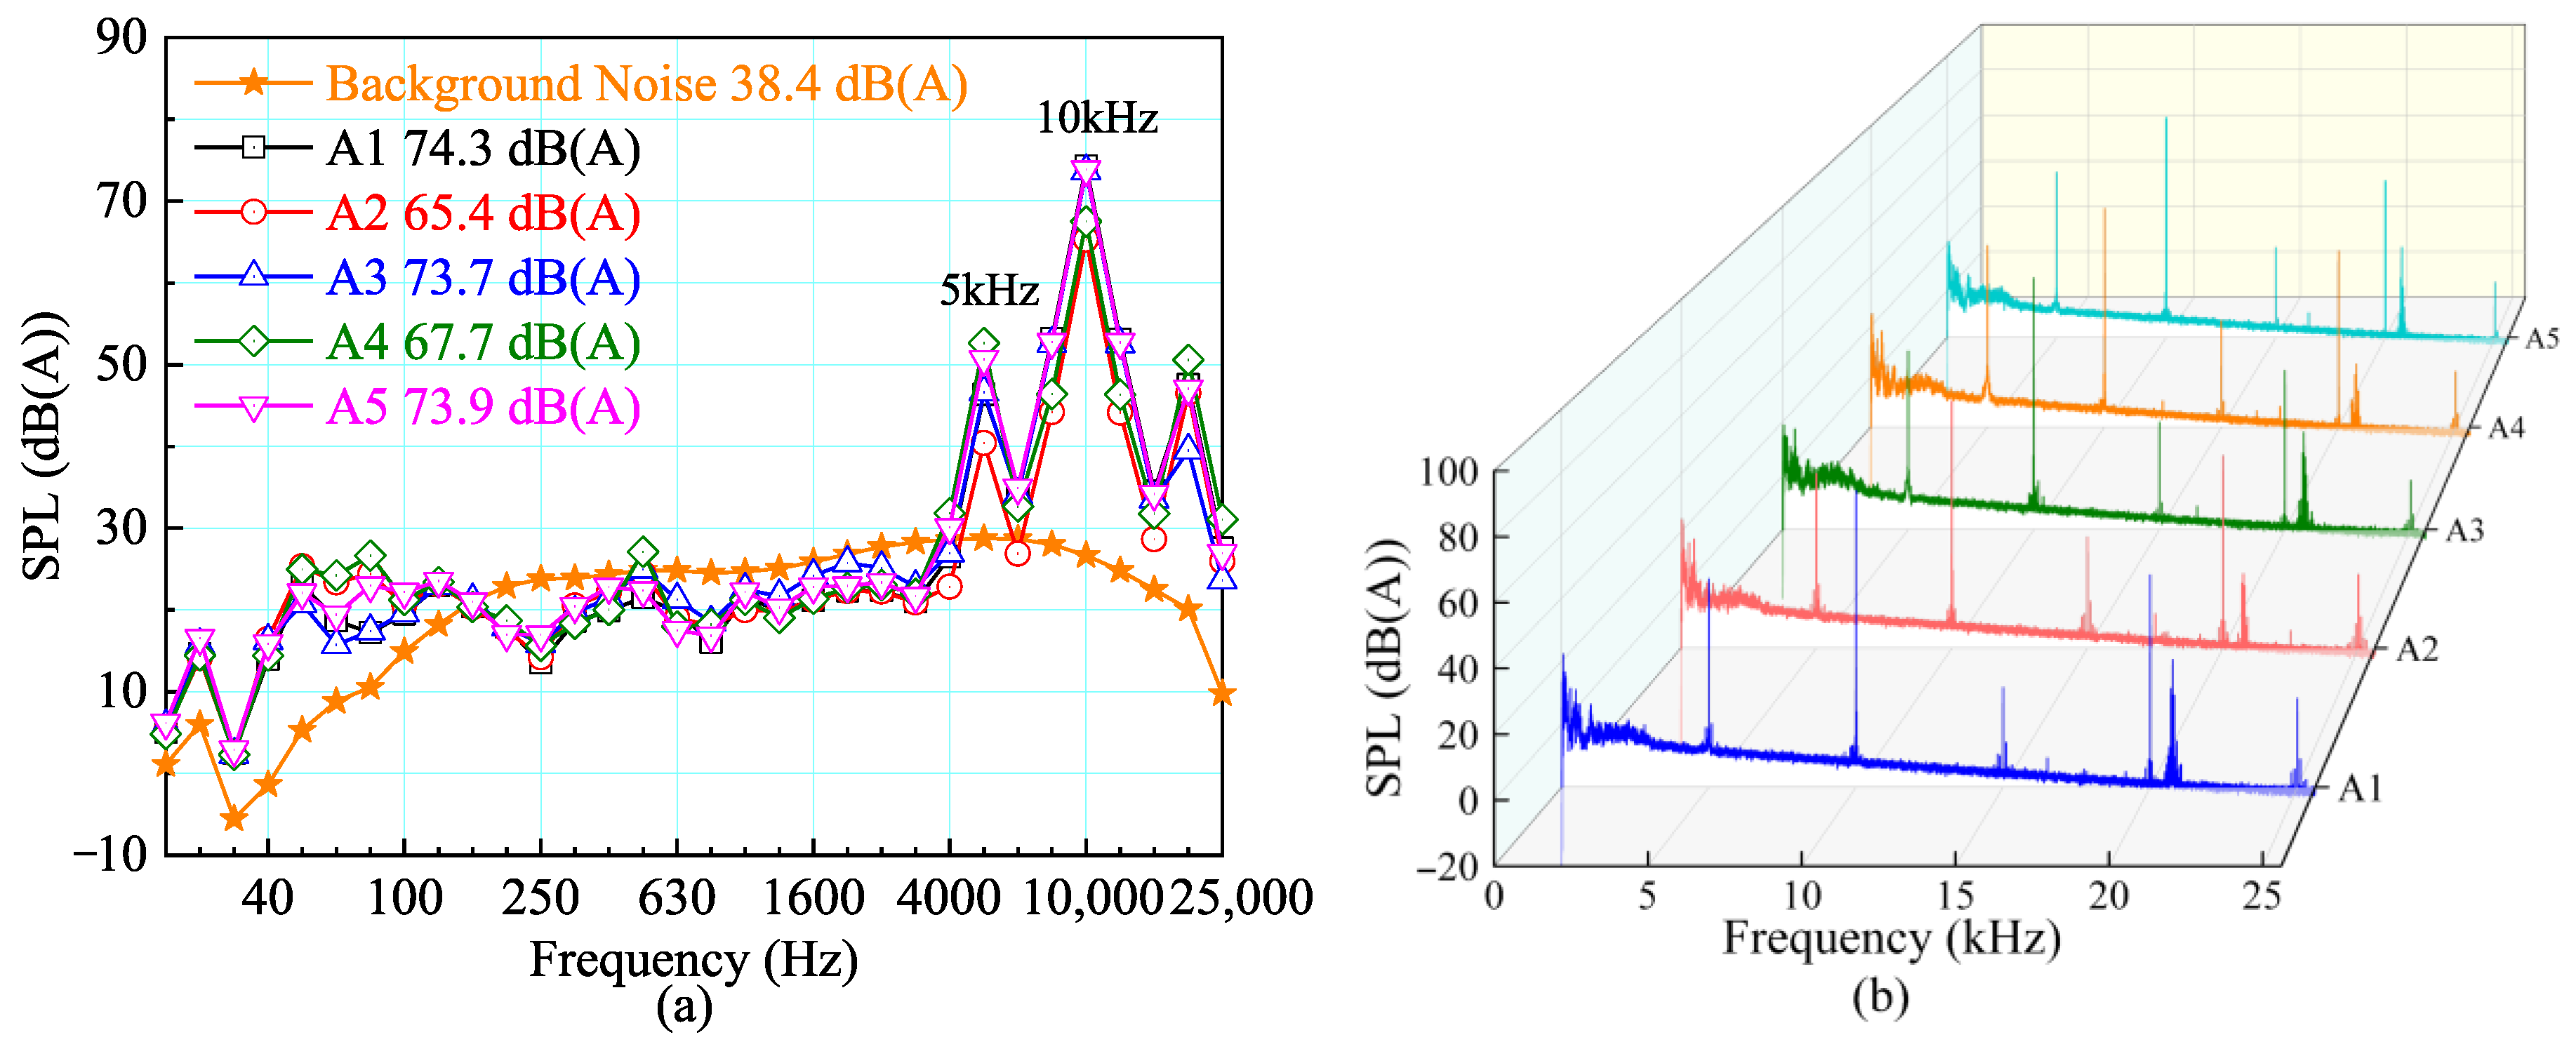
Spectral analysis was conducted on an HFT’s noise under 750 V with 5 kHz excitation. The narrowband frequency spectrum was obtained using the fast Fourier transform (FFT). The FFT processing frequency range was set to 25.6 kHz, with an FFT block size of 25,600 points. A Hanning window was adopted to suppress spectral leakage, and the overlap ratio between the consecutive time blocks was 66.7%. Under these parameters, the corresponding frequency resolution Δf of the calculated narrowband spectrum was 1 Hz. Figure 6 shows the noise spectra: (a) 1/3-octave spectrum and (b) narrowband spectrum, with an analysis frequency range of 0–25.6 kHz.
In the 1/3-octave frequency spectrum, distinct spectral peaks appear at 5 kHz and 10 kHz, consistent with the harmonics of the 5 kHz excitation signal. During testing, the LA at HFT measurement points ranged from 65.4 dB (A) to 74.3 dB (A), with a maximum difference of 8.9 dB (A). Notably, the LA at A2 and A5 (near the windings) was significantly lower than at others. This distribution aligns with HFTs’ primary noise source mechanism: core vibration dominates the noise emission, while winding noise (from electromagnetic force-induced vibrations) contributes secondarily. The LA differences across measurement points directly reflect the strong acoustic directivity of HFT noise: vibrations originating from the core propagate more intensely along specific paths, resulting in an uneven sound pressure distribution.
The narrowband spectrum identifies prominent peaks at discrete frequencies: 5 kHz, 10 kHz, 15 kHz, and 20 kHz. These frequencies correspond to the fundamental excitation frequency (5 kHz) and its integer multiples (2nd, 3rd, 4th harmonics), confirming the tonal characteristic of HFT noise. SPL at non-peak frequencies is extremely low, indicating that noise energy is predominantly concentrated at these harmonic frequencies. The dominance of the 10 kHz component (twice the 5 kHz excitation frequency) underscores the strong harmonic characteristics of the HFT noise, consistent with the magnetic field-induced vibration mechanisms.

3.1.2. Variation Characteristics with Respect to Excitation

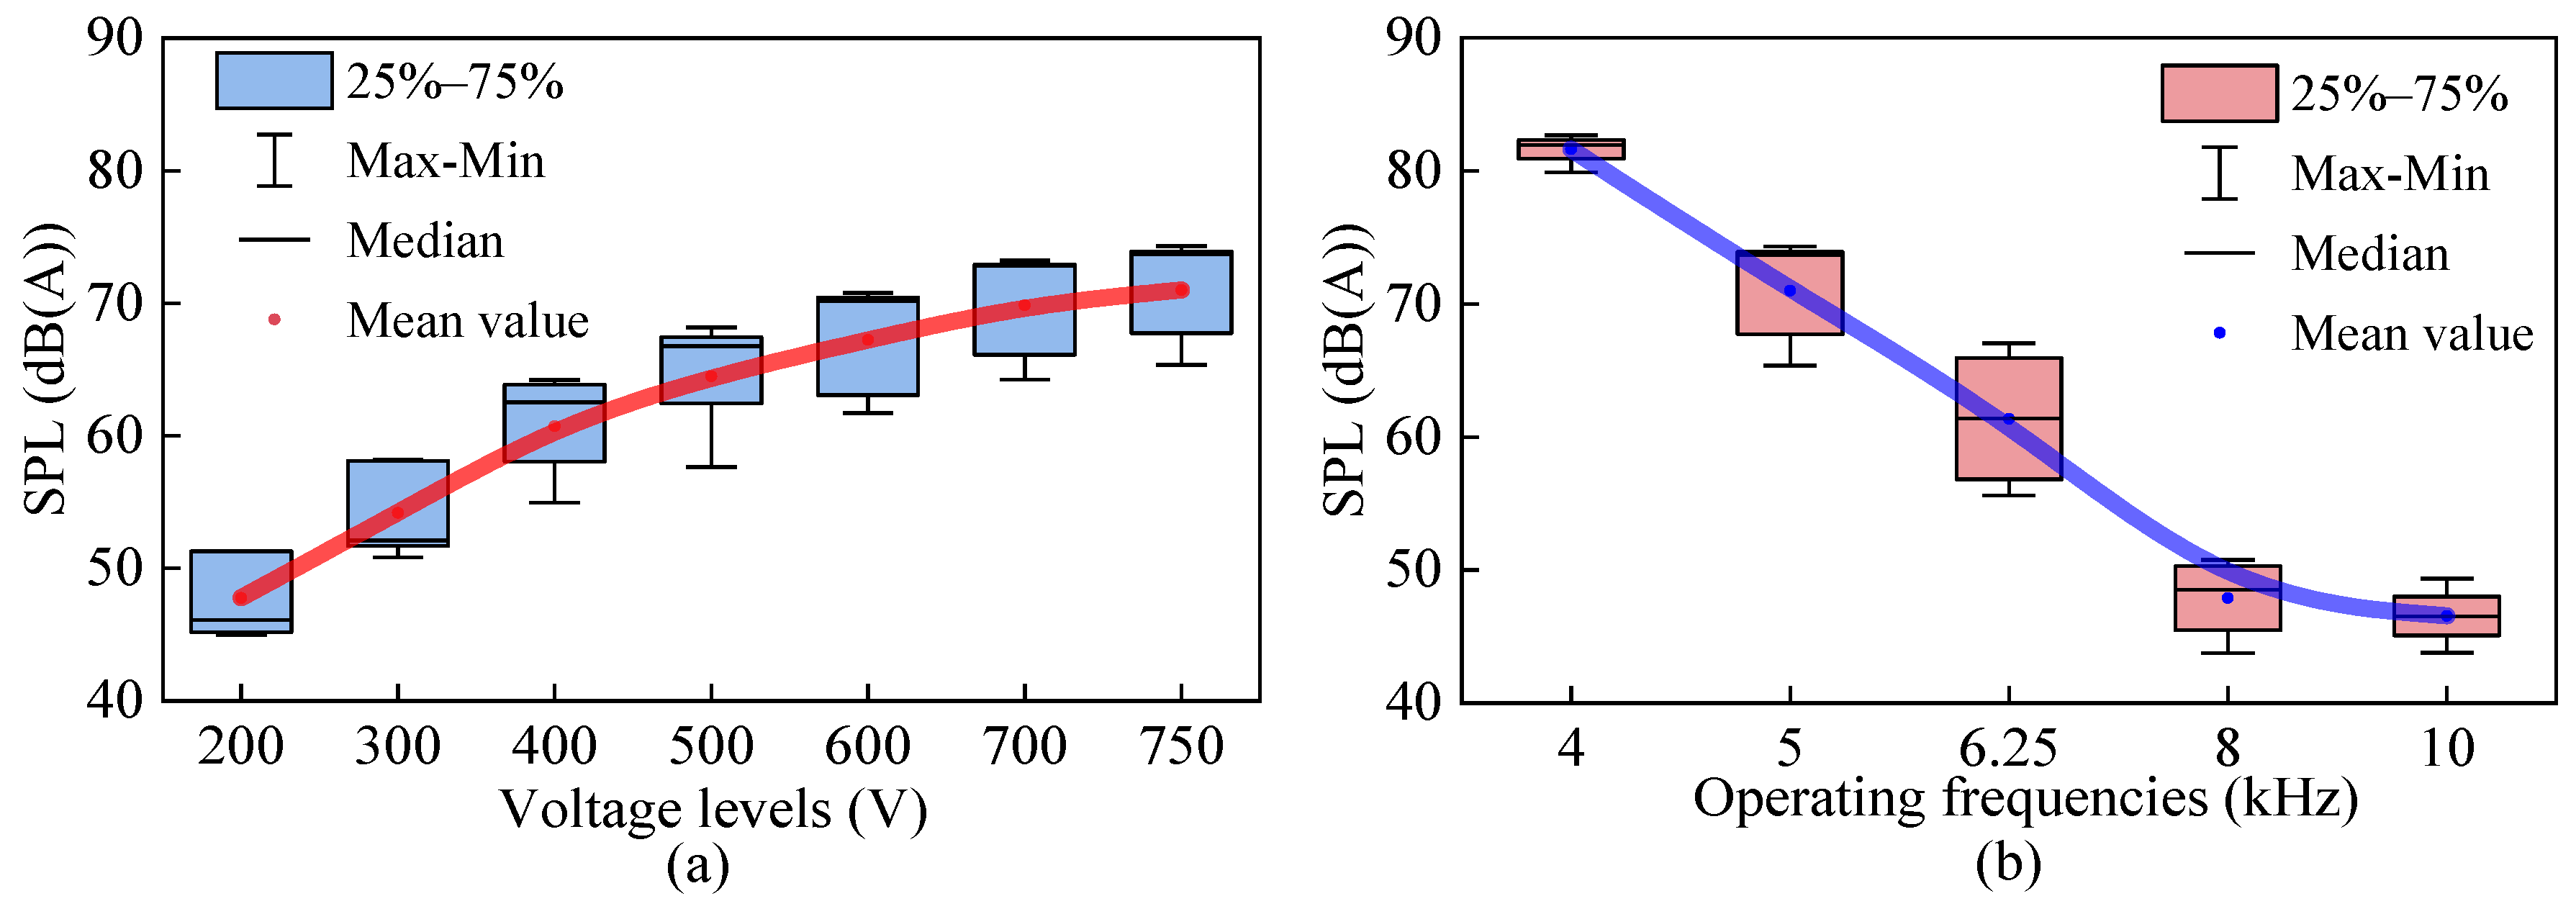
Figure 7 presents the variation trend of SPL with voltage levels and operating frequencies.
Under 5 kHz excitation, the variation trend of the LA with voltage levels is illustrated in Figure 7a. This box-plot visualization incorporates multiple statistical metrics: the blue boxes represent the interquartile range (25–75% of data), the whiskers denote the maximum–minimum range, the black lines indicate the medians, and the red dots mark the mean values. As the red mean value curve shows, LA exhibits a significant monotonic increase from approximately 47.0 dB (A) to 72.0 dB (A) as voltage levels rise from 200 V to 750 V. Mechanistically, a higher voltage amplifies the magnetic flux density in the core, intensifying the magnetostriction and electromagnetic force-induced vibrations. These effects directly enhance the noise radiation from the core and windings. A linear fit to the mean values (coefficient of determination R2 ≈ 0.94) confirms a strong linear correlation, with a slope of ~0.038 dB (A)/V. This demonstrates that under constant-frequency excitation, voltage level is a critical factor governing the noise output, as it directly modulates core-related vibration and radiation mechanisms.
Figure 7b depicts LA’s variation with operating frequencies under 750 V excitation. From the blue mean-value curve, LA shows a pronounced monotonic decline (from ~82.0 dB (A) at 4 kHz to 47.0 dB (A) at 10 kHz) as the frequency increases from 4 kHz to 10 kHz. In terms of the mechanism, the increasing frequency lowers the core’s magnetic flux density, weakening the magnetostrictive effects and electromagnetic forces. This in turn reduces the noise radiation from the component. Fitting a linear model to the mean values (R2 ≈ 0.91) reveals a strong negative linear correlation, with a slope of ~−5.99 dB (A)/kHz. This result indicates that under constant-voltage conditions, increasing the operating frequency effectively reduces the noise level.
Based on the comprehensive analysis above, the HFT noise exhibits steady-state characteristics in the time domain, while in the frequency domain, it is featured by high-frequency components and prominent discrete tonal attributes. Specifically, the noise energy is almost entirely concentrated at discrete frequencies, with significantly lower SPLs observed in other frequency bands. This leads to potential limitations when the traditional LA is adopted as the sole evaluation indicator for HFT noise. For this reason, merely focusing on the noise characteristics under A-weighting is insufficient, which highlights the importance of incorporating sound quality metrics such as sharpness, TNR, and PR into the noise evaluation system of HFTs.

3.2. Multi-Dimensional Evaluation of Sound Quality

Sound quality evaluation is rooted in psychoacoustics, an interdisciplinary field combining acoustics and psychophysics. The core of sound quality evaluation lies in the relationship between acoustic signals and human auditory perception. Sound quality evaluation methods include objective and subjective evaluation. Compared with subjective evaluation, objective evaluation is more time-efficient, does not require large numbers of professional acousticians, and is easier to implement for large sample sizes. To comprehensively assess HFT noise’s impacts on the surrounding residents and substation workers, this paper adopts sound quality parameters for a multi-dimensional objective evaluation of HFT noise. Unlike monaural hearing, binaural hearing typically perceives sound direction, reflecting the ability of the human auditory system to process and correlate signals that are incident on each ear. Since many psychoacoustic effects stem from distinct stimuli received by each ear [31], this study incorporates binaural hearing differences in objective psychoacoustic analysis.

3.2.1. Loudness

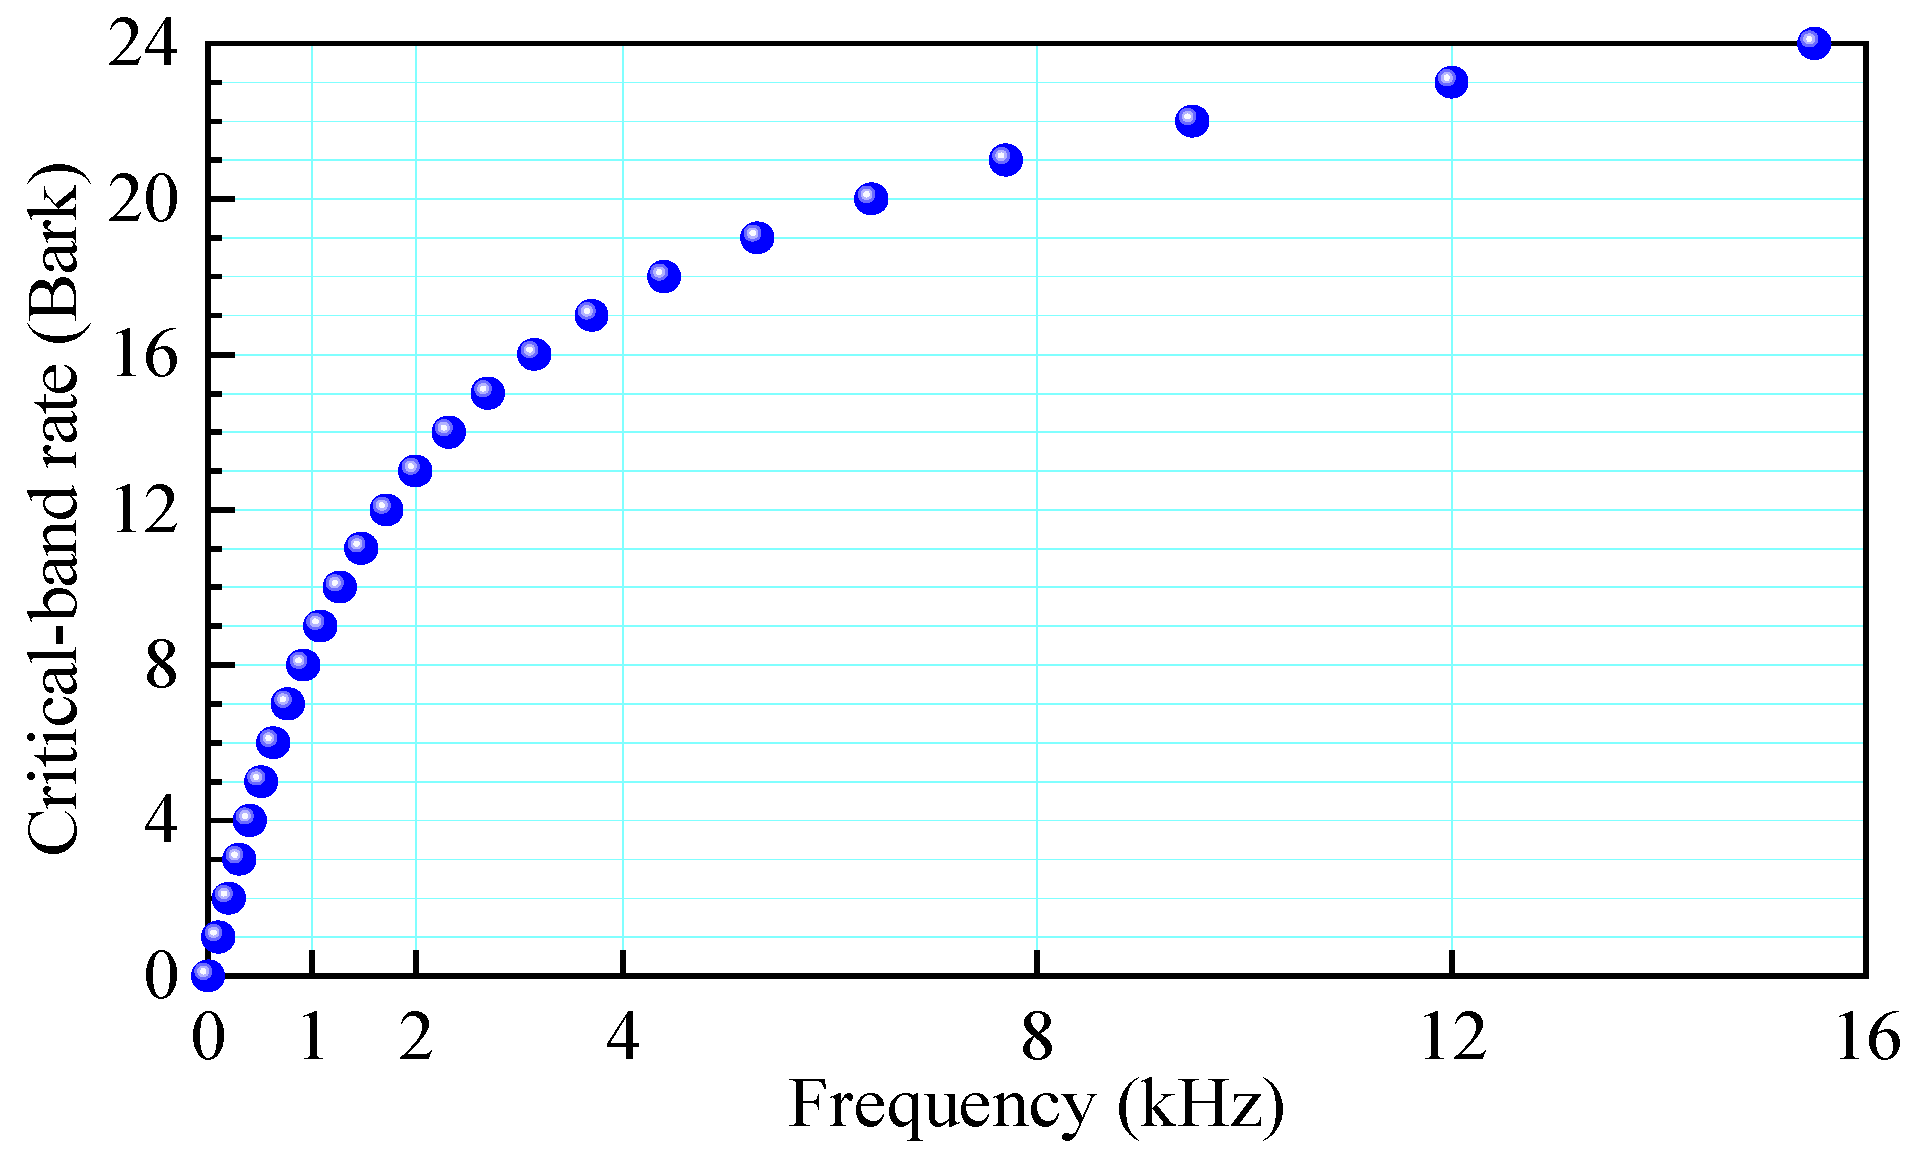
Loudness, a psychoacoustic metric characterizing the human ear’s perception of sound intensity, merges the physical traits of sound with the physiological reactions of the auditory system. The critical-band rate plays a pivotal role in depicting auditory perception in loudness models. The critical-band rate unit is the Bark. Physiologically, 1 Bark corresponds to the frequency bandwidth associated with a given length of the human basilar membrane, underscoring its physiological relevance in acoustics. Compared to the “Hz” frequency scale, the critical-band rate scale more accurately represents human subjective auditory perception. The critical-band rate range of 0–24 Bark directly corresponds to the frequency range of 0–15.5 kHz, as shown in Figure 8.
Specific loudness is defined as the loudness of noise within a critical-band rate, with the unit sone/Bark. Its calculation formula is presented as the following equation [31]:
N = 0.08 ( E T Q / E 0 ) 0.23 [ ( 0.5 + 0.5 E / E T Q ) 0.23 1 ]
where N’ represents specific loudness; E denotes noise excitation; ETQ represents the excitation at the auditory threshold of the human ear in a quiet environment; and E0 stands for the excitation corresponding to the reference sound intensity (10−12 W/m2).
This research adopts Zwicker’s loudness calculation approach, in which loudness (unit: sone) is defined as the integral of specific loudness over the entire critical-band rate. This procedure can be expressed by the following equation [31]:
N = 0 24 B a r k N ( z ) d z
where N represents loudness and z represents the critical-band rate.
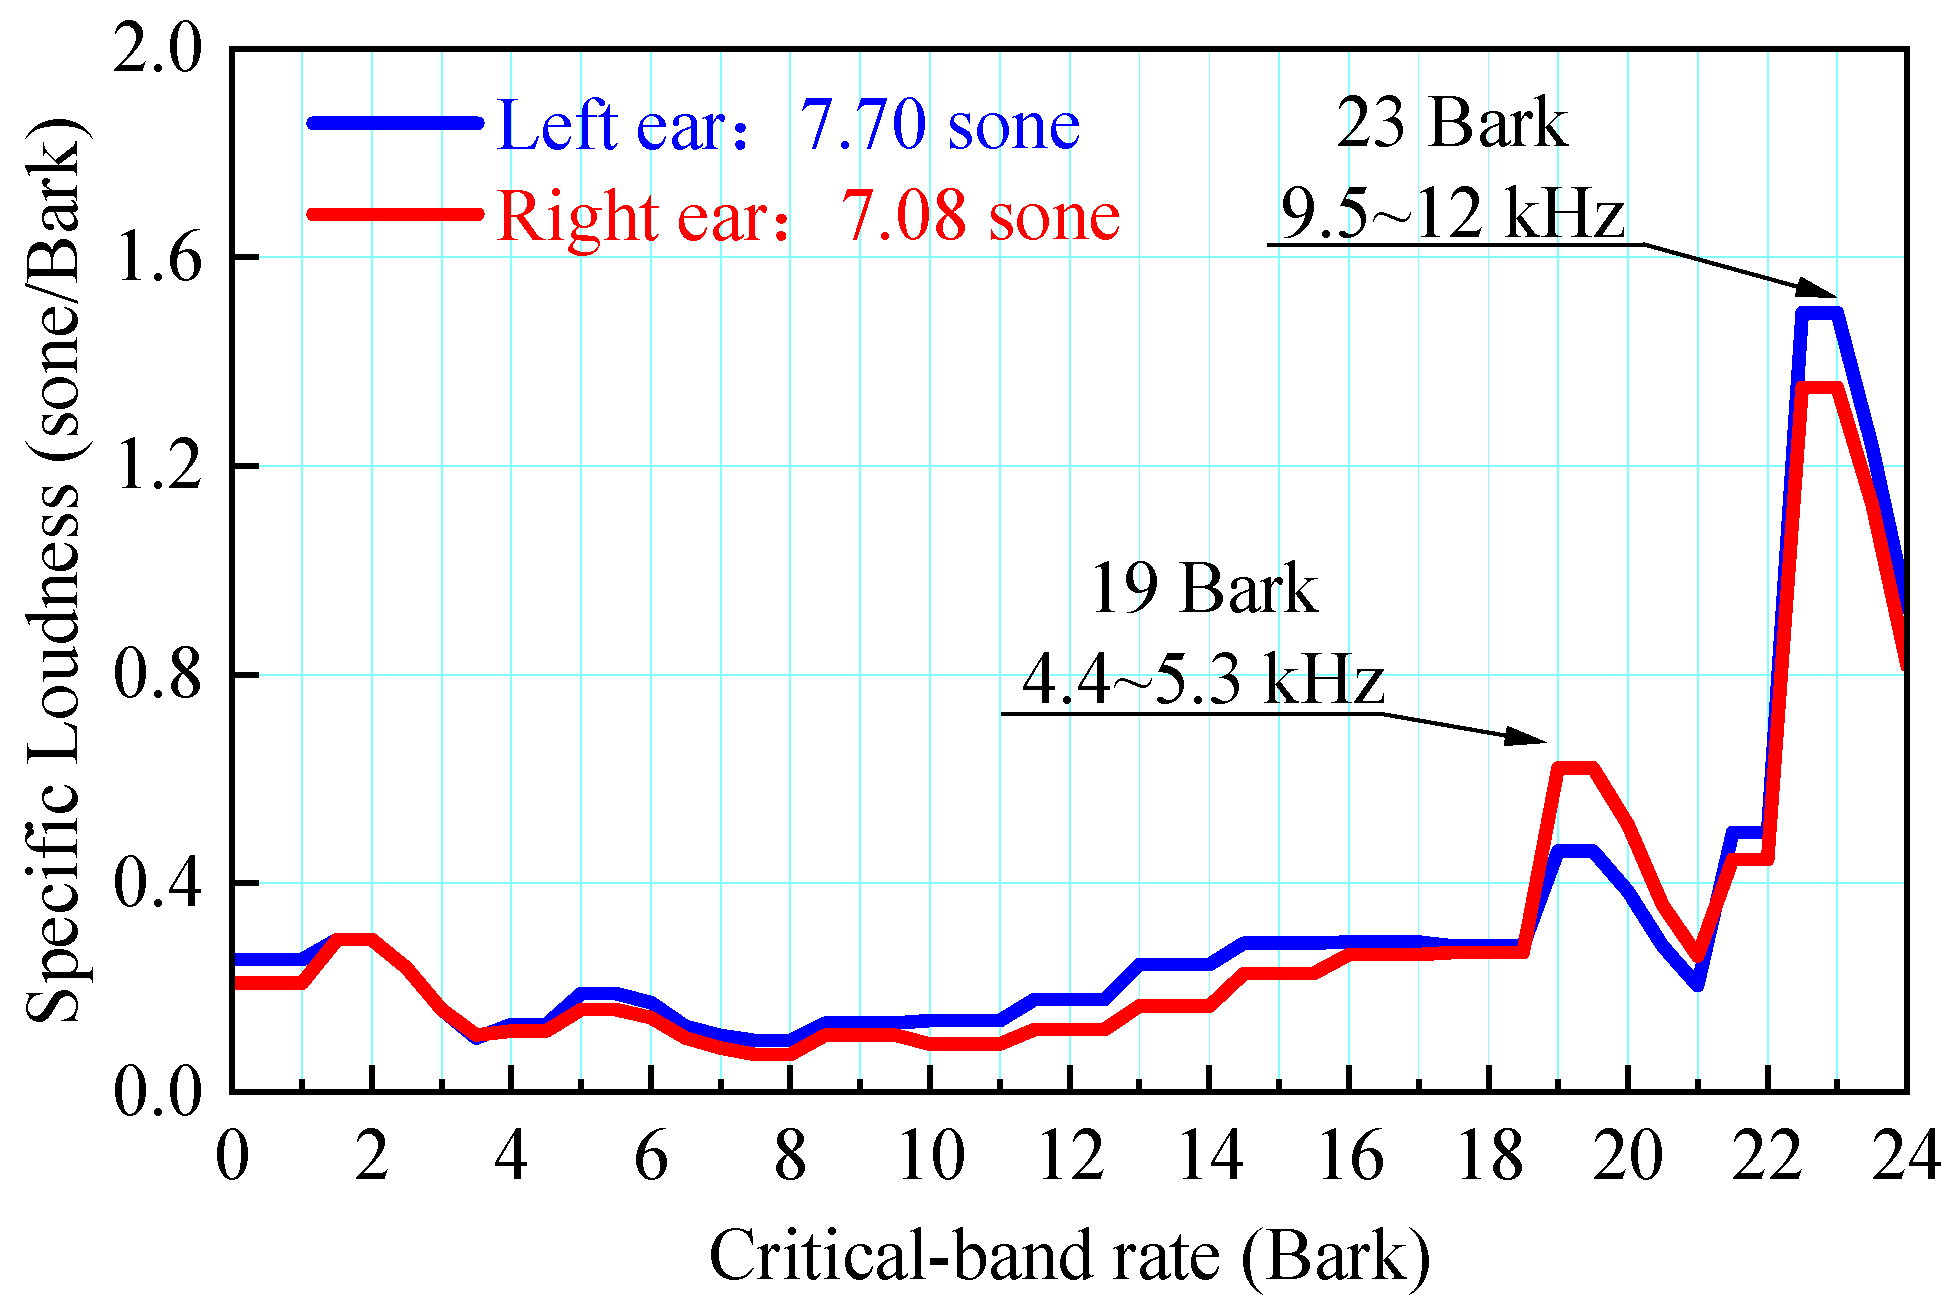
To accurately reproduce the actual perception of noise by the human ear and clearly reveal the differences in binaural specific loudness, this study analyzes the binaural specific loudness characteristics. Figure 9 illustrates the binaural specific loudness curves of HATS under 750 V/5 kHz excitation. The horizontal axis represents the critical-band rate, while the vertical axis indicates the specific loudness. These curves clearly distinguish the loudness perception characteristics of the left and right ears.
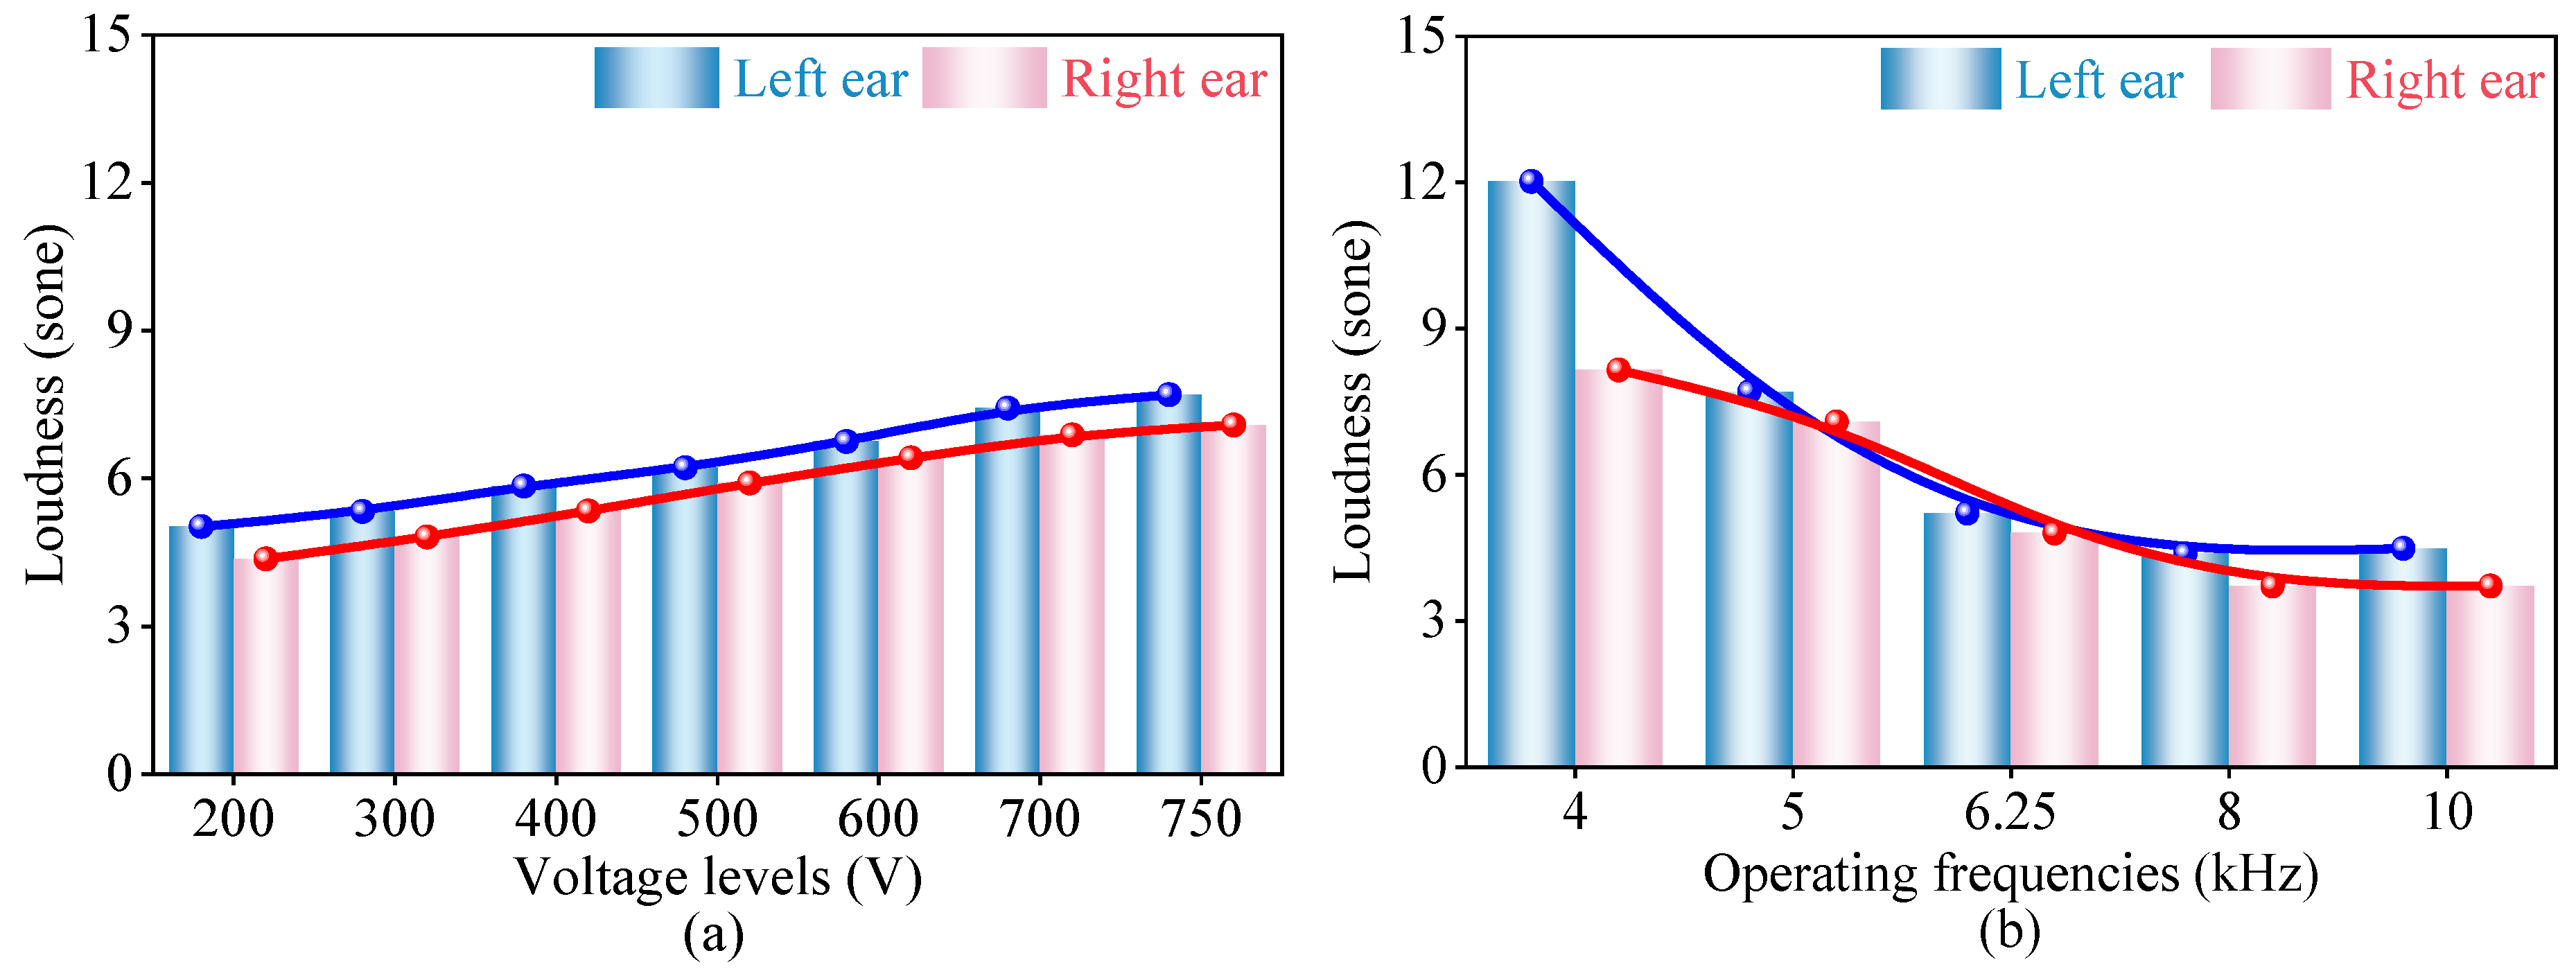
A maximum appears at 23 Bark (corresponding to the 9.5–12 kHz frequency range, which contains the dominant 10 kHz noise component), and a prominent peak is observed at 19 Bark (corresponding to 4.4–5.3 kHz, including the 5 kHz excitation frequency). At 19 Bark, the loudness of the right ear surpasses that of the left ear; at 23 Bark, the loudness of the left ear is greater than that of the right ear. This phenomenon reveals frequency-dependent differences in human loudness perception. The total loudness values for the left and right ears are 7.7 sone and 7.08 sone, respectively, signifying variations in subjective loudness perception during binaural noise reception. This specific loudness curve provides a visual depiction of these discrepancies, further illustrating the necessity of binaural analysis in noise evaluation. Figure 10 illustrates the variation trends of loudness as a function of voltage levels (under 5 kHz excitation) and operating frequencies (under 750 V excitation), elucidating the coupling effects of electrical parameters on the auditory perception of HFT noise.
Figure 10a shows the loudness response to voltage variations under constant 5 kHz excitation. As the voltage increases from 200 V to 750 V, the loudness values for both the left and right ears rise monotonically: left ear loudness increases from ~5.0 sone to 7.7 sone, and right ear loudness increases from ~4.4 sone to 7.1 sone. The left ear consistently exhibits higher loudness than the right, with strong linear correlations (left ear: R2 ≈ 0.99; right ear: R2 ≈ 0.99), indicating that voltage-induced SPL changes dominate loudness modulation, which is consistent with psychoacoustic intensity-perception principles.
Figure 10b shows loudness variation with an operating frequency under fixed 750 V excitation. The total loudness declines non-linearly as the frequency increases from 4 kHz to 10 kHz: it drops sharply at 4 kHz–6.25 kHz (left ear: ~12 sone to ~5 sone; right ear: ~8 sone to ~4 sone) and stabilizes gradually above 6.25 kHz. This frequency dependence aligns with the auditory system’s critical-band theory: 4 kHz–6.25 kHz overlaps with the basilar membrane’s sensitive region, where spectral energy redistribution amplifies perceived loudness changes.
These findings indicate that the operating conditions (voltage/frequency) of HFT modulate noise loudness via two mechanisms: (1) an increase in voltage raises the SPL, resulting in a nearly linear increase in loudness, and (2) frequency shifts alter the spectral distribution, interacting with auditory critical bands to reshape the loudness perception. Consistent left-right ear loudness discrepancies (~0.5–1.5 sone) originate from the strong acoustic directivity of HFTs, reflecting the anatomical asymmetries of the auditory pathways and head-related transfer functions across operating conditions. This underscores the necessity of binaural analysis in HFT noise assessment. Thus, loudness serves as a sensitive parameter of human perceptual changes for HFT noise under diverse operating scenarios, enabling targeted electrical parameter optimization to mitigate noise-induced discomfort.
It should be noted that although the spectral analysis of HFT noise in this study extends to 25.6 kHz, the fact that the Zwicker loudness model does not cover this full frequency range does not make its application unreasonable. In fact, the human ear is highly insensitive to high-frequency noise above 15.5 kHz, the upper frequency limit of the 24th Bark, and such components are generally inaudible under most practical conditions. Their contribution to psychoacoustic parameters such as loudness is therefore negligible, and excluding them does not result in significant underestimation of subjectively perceived loudness. Furthermore, the focus of the sound quality analysis in this study is to establish the correlation between psychoacoustic indicators including loudness and electrical operating parameters, rather than to obtain precise absolute subjective loudness values. The conclusions drawn in this study thus remain reliable and meaningful.

3.2.2. Sharpness

Sharpness denotes an objective auditory perception metric, quantified in acum. Typically, the more prominent the loudness of high-frequency components, the higher the sharpness value, and the more piercing the subjective auditory perception becomes. Within Zwicker’s sharpness model, sharpness can be formulated with the following equation [31]:
S = 0.11 0 24 Bark N g ( z ) z d z N
where S represents sharpness and g (z) denotes the sharpness weighting factor, a function of the critical-band rate. Its expression is given below [31]:
g ( z ) = 1                                                   , z 15.8 0.15 exp [ 0.42 ( z 15.8 ) ] + 0.85 , z > 15.8
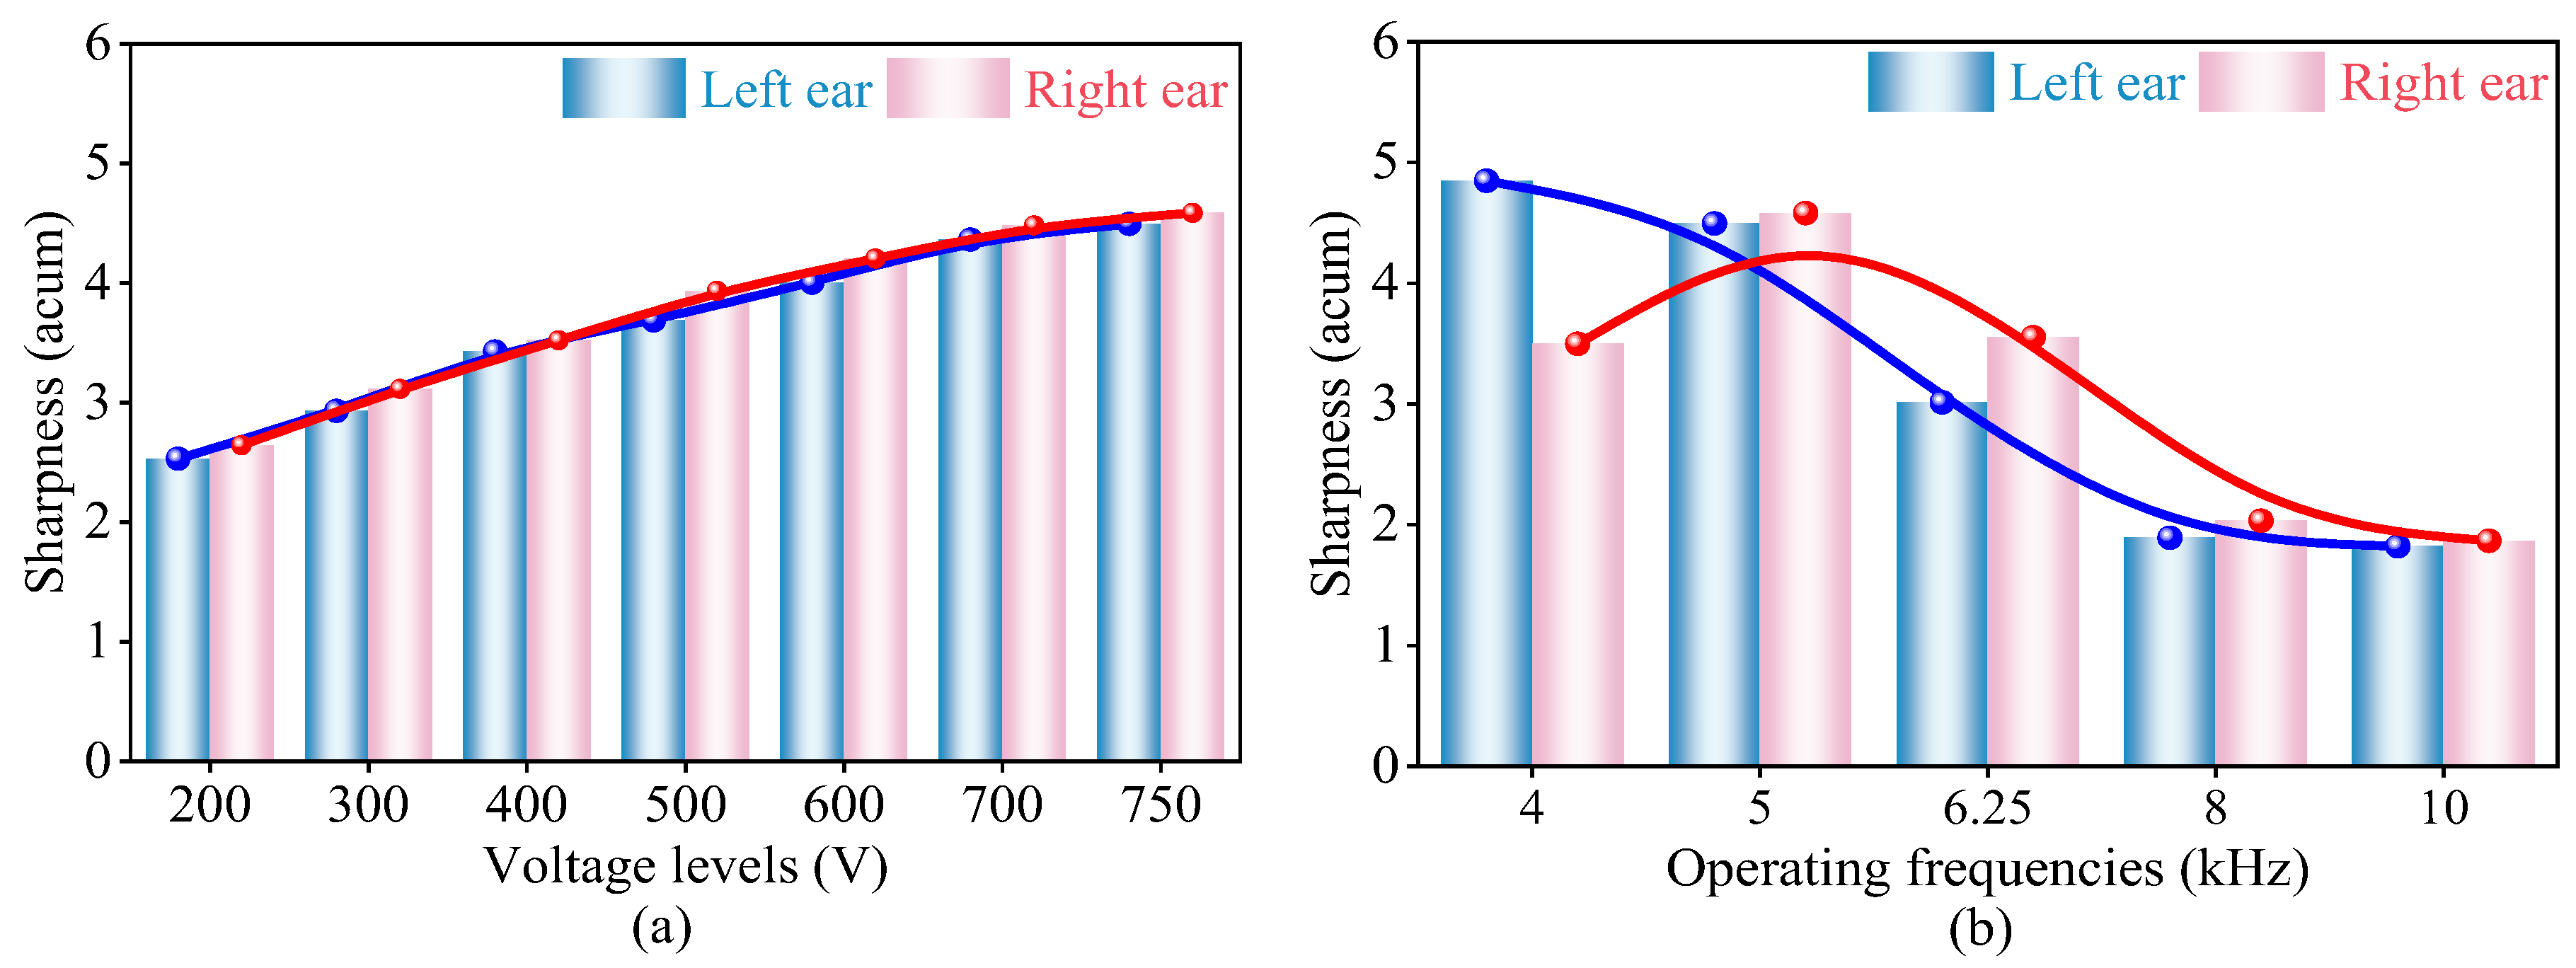
Figure 11 elucidates the variation trends of sharpness as a function of voltage levels and operating frequencies, revealing the coupling effects of electrical parameters on the psychoacoustic perception of HFT noise.
Figure 11a shows the sharpness response to voltage variations under constant 5 kHz excitation. As the voltage increases from 200 V to 750 V, the perceived sharpness by both ears rises continuously: the left-ear sharpness increases from ~2.5 acum to 4.5 acum, and the right from 2.6 acum to 4.6 acum. The right ear consistently exhibits slightly higher sharpness (mean difference ≈ 0.15 acum) than the left, stemming from the HFT noise’s strong acoustic directivity.
Figure 11b depicts sharpness variation with operating frequencies under fixed 750 V excitation, revealing a non-linear decline as the frequency rises from 4 kHz to 10 kHz. At 4 kHz, the right ear’s sharpness is significantly lower (~1.3 acum) than the left, correlating with its lower loudness at this frequency (consistent with Figure 10b). This confirms that sharpness is closely related to both frequency and loudness, in accordance with Zwicker’s sharpness model incorporating spectral energy distribution and loudness weighting. Notably, sharpness remains elevated (≥3.5 acum) between 4 kHz and 5 kHz, before dropping rapidly above 5 kHz. This interval aligns with the auditory system’s critical-band sensitivity to high-frequency energy: 4–5 kHz overlaps with the basilar membrane region, where high-frequency components dominate the perceived sharpness. Therefore, high-frequency noise in this band is more likely to cause a harsh subjective feeling.
These findings highlight sharpness as a sensitive indicator of the psychoacoustic impact of HFT noise, modulated by the voltage (via SPL enhancement) and frequency (via spectral energy redistribution across auditory critical bands). Persistent binaural sharpness differences underscore the need for binaural analysis in HFT noise assessment, while the 4–5 kHz sharpness plateau identifies a target range for mitigating piercing sensations through electrical parameter optimization. Thus, sharpness is a sensitive indicator for measuring the impact of HFT noise on the auditory system under changes in electrical parameters.

3.2.3. TNR and PR

Noise containing a single high-frequency component elicits greater annoyance and impairs the overall perception of sound quality [32]. Thus, this study utilizes the TNR and PR to quantify the influence of single-frequency noise on human perception.
The TNR denotes the ratio of tonal energy to noise energy within the critical band [33], and its unit is dB. The TNR may be computed using the following formula:
Δ L T = 10 lg ( X t X n )
where Δ L T represents TNR; Xt represents the mean square sound pressure of the single-frequency noise; and Xn denotes the mean square sound pressure of background noise within its critical band. The total TNR may be computed using the following formula:
L T = 10 lg i = 1 n 10 Δ L T ( i ) 10
where L T represents the total TNR and Δ L T ( i ) represents the TNR of the i-th peak component.
The PR is defined as the ratio of the total noise energy in the critical band containing the single-frequency noise to the average energy of the two adjacent critical bands, and its unit is dB. It may be computed via the following equation:
Δ L P = 10 lg X M ( X L + X U ) × 0.5
where Δ L P represents PR; XM signifies the mean square sound pressure of the middle critical band; and XL and XU denote the mean square sound pressures of the preceding and subsequent critical bands, respectively. The total PR may be computed using the following formula:
L P = 10 lg i = 1 n 10 Δ L P ( i ) 10
where L P represents total PR and Δ L P ( i ) represents the PR of the i-th peak component.
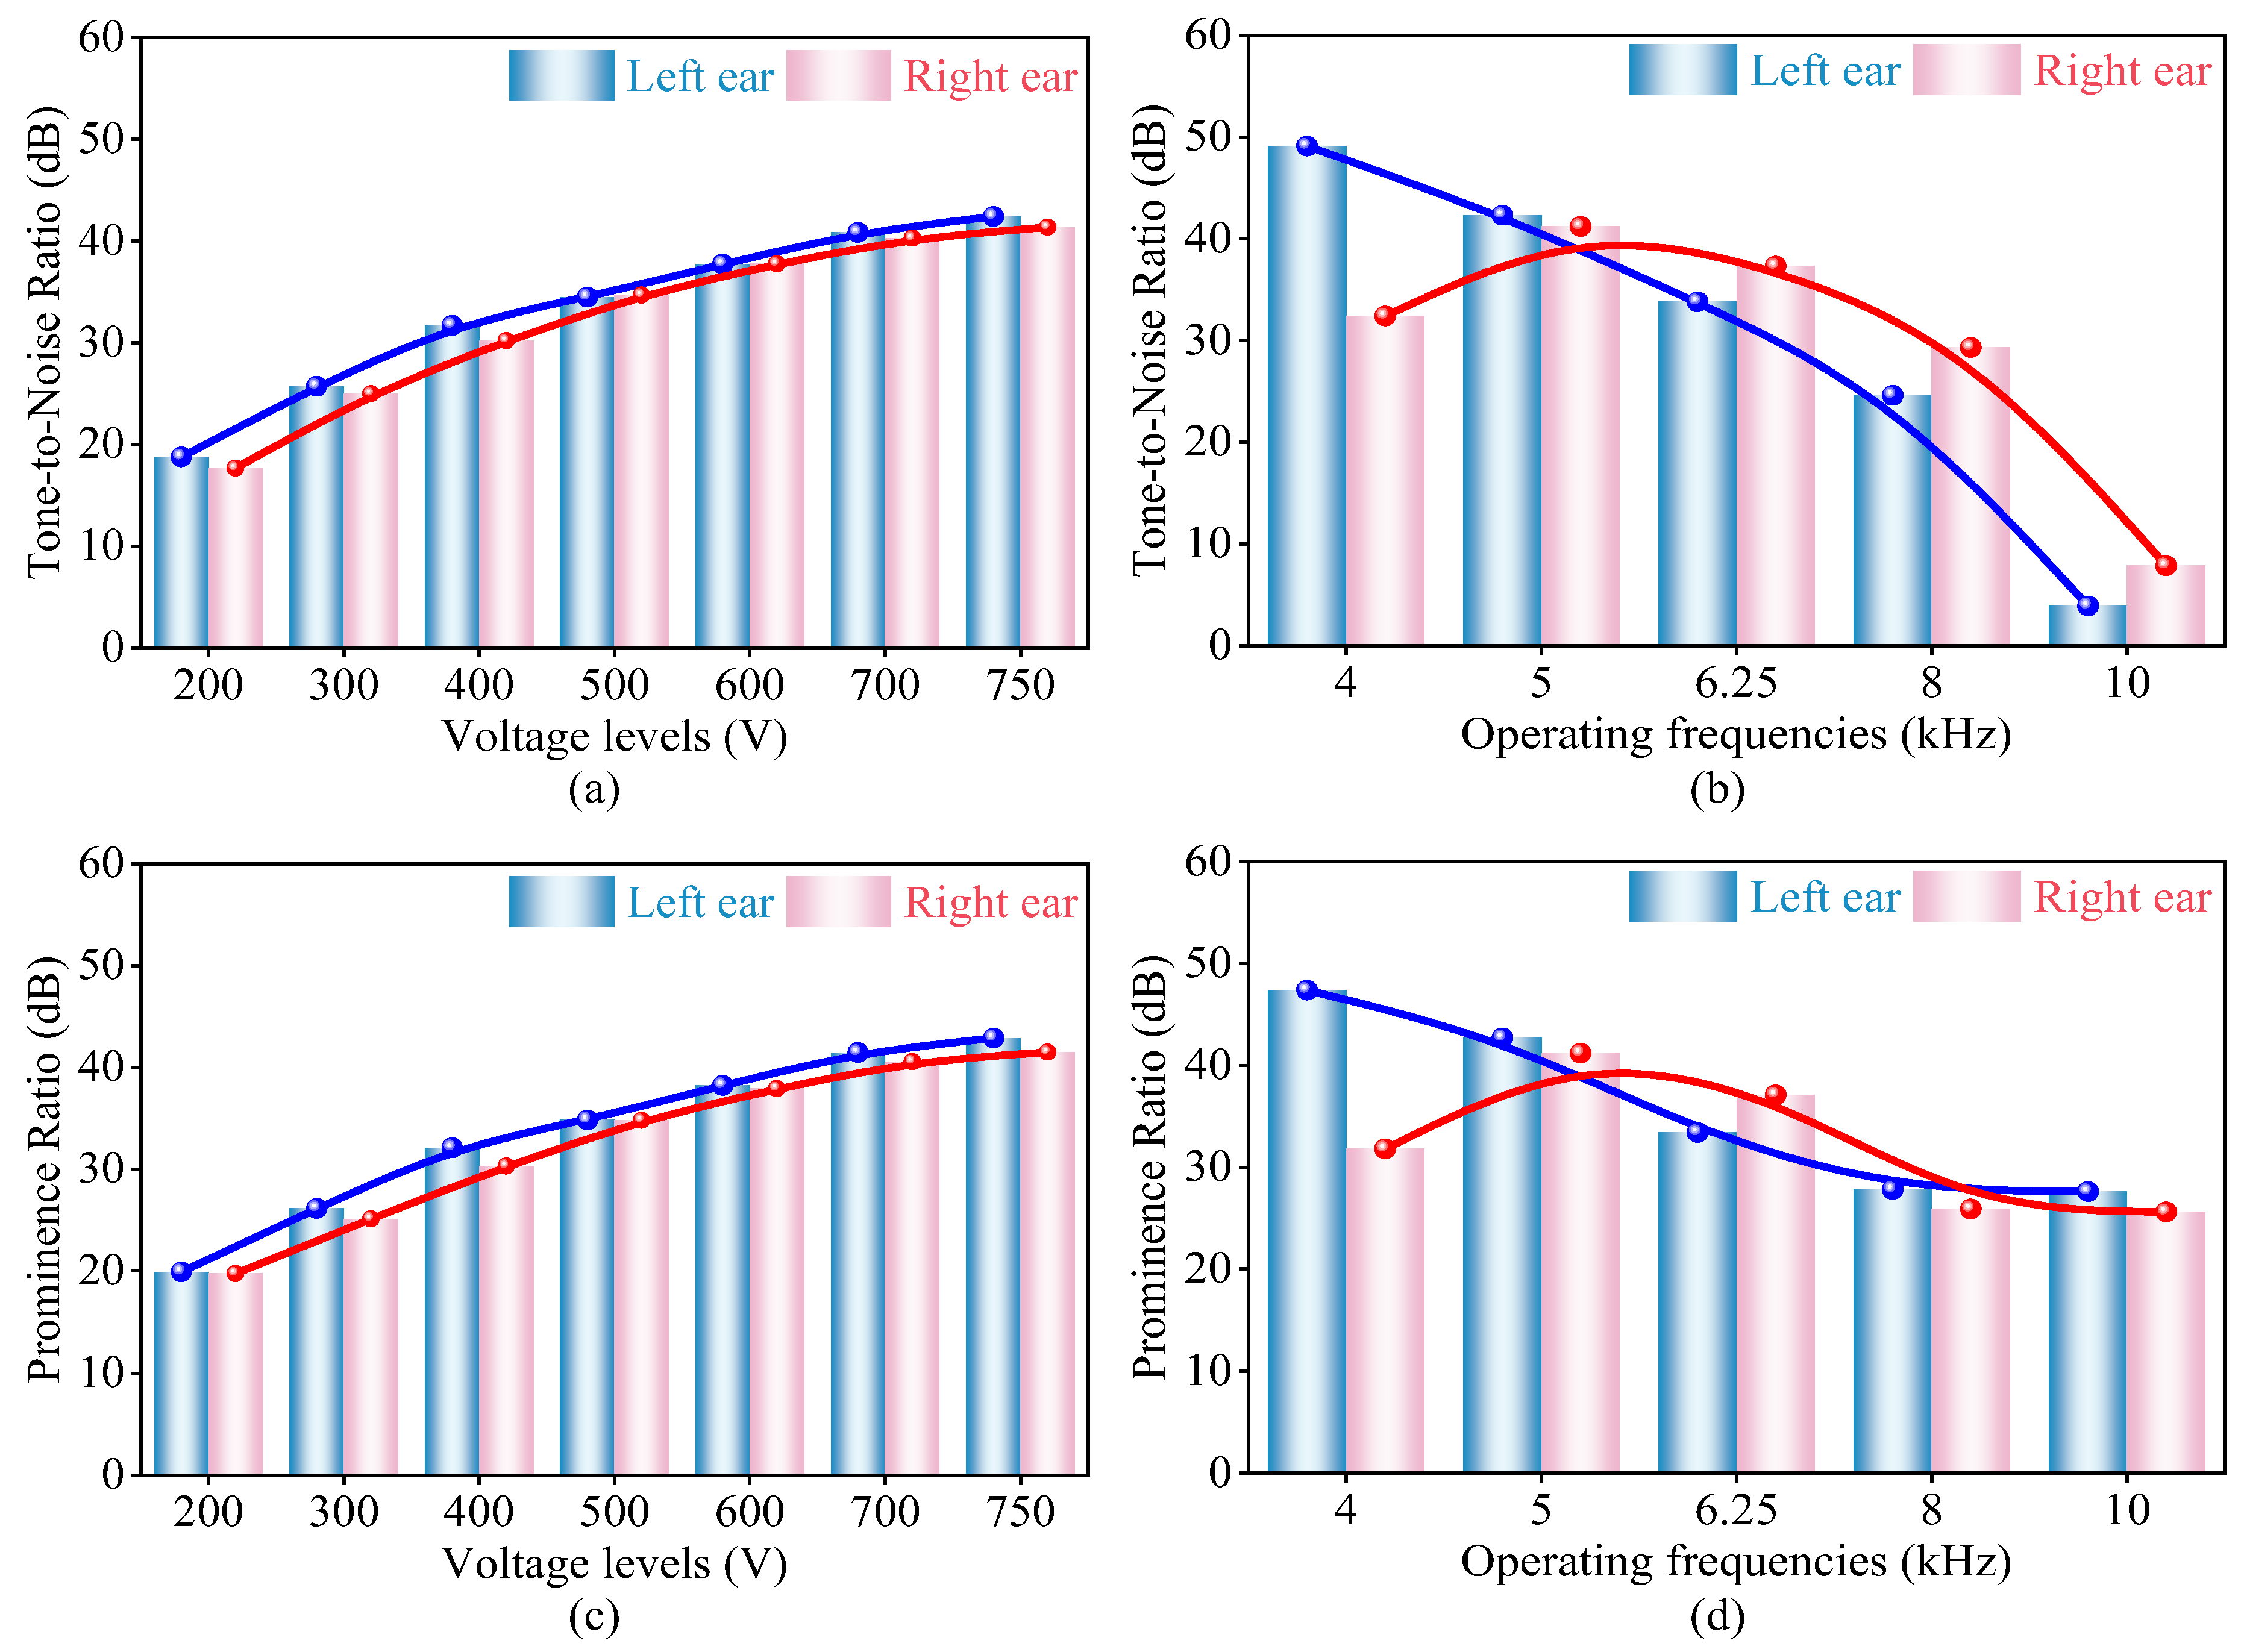
Figure 12 elucidates the calculation results of the total TNR and total PR, revealing the coupling effects of the voltage levels and operating frequencies on the perceptual salience of single-frequency components in HFT noise.
The two ratios show highly consistent trends across the subfigures. Figure 12a,c illustrate the TNR and PR responses to voltage fluctuations under constant 5 kHz excitation. As the voltage increases from 200 V to 750 V, both TNR and PR rise continuously: the left ear TNR increases from 18.8 dB to 42.4 dB and the right ear from 17.8 dB to 41.3 dB; the left ear PR rises from 19.9 dB to 42.9 dB and the right ear from 19.7 dB to 41.5 dB. This trend reflects that higher voltages boost single-frequency noise SPL more significantly than background noise, increasing the energy contrast between tonal and non-tonal components. This aligns with the psychoacoustic principle that the perceptual salience of tonal noise scales with SPL differentials.
Figure 12b,d depict the variations in TNR and PR with operating frequencies under fixed 750 V excitation. Both ratios decrease as the frequency rises from 4 kHz to 10 kHz, with the sharpest decline being between 4 kHz and 6.25 kHz. This aligns with the human auditory system’s critical-band characteristics: narrower critical bands at lower frequencies enhance the separation between single-frequency and background noise energy, while broader bands at higher frequencies reduce the prominence of tonal components.
Persistent left-right ear differences (mean TNR difference ≈ 2.9 dB; mean PR difference ≈ 2.5 dB) stem from HFTs’ strong acoustic directivity, reflecting auditory pathway anatomical asymmetries and head-related transfer functions, underscoring the need for binaural analysis in quantifying HFT noise perception. These findings confirm TNR and PR as sensitive indicators of single-frequency noise salience, modulated by the voltage and frequency.
Changes in HFT operating conditions significantly alter the prominence of single-frequency noise, showing distinct linear trends with voltage and frequency. Table 2 quantifies the left/right ear TNR and PR values at 5 kHz and 10 kHz under 5 kHz/750 V excitation—critical frequencies where HFT noise components are salient.
The Table 2 analysis shows the following: at 5 kHz, left ear TNR is 12.8 dB and right ear is 18.4 dB; left ear PR is 12.4 dB and right ear is 17.9 dB. At 10 kHz, TNR reaches 42.4 dB (left) and 41.3 dB (right), with PR at 42.9 dB (left) and 41.5 dB (right). These results confirm that the single-frequency noise of HFT exhibits significant perceptual salience, particularly at 10 kHz.
This perceptual salience arises from single-frequency components whose energy greatly exceeds that of ambient background noise, thereby overcoming the auditory masking effect. The human auditory system has a limited ability to mask high-energy tonal signals within broadband noise: such signals are distinctly resolved by cochlear mechanics and neural processing, even in complex acoustic environments. As a result, the tonal noise’s dissonant quality intensifies subjective annoyance, as tonal components are more intrusive and disruptive than broadband noise.
Integrating the above analysis, the TNR and PR effectively characterize the prominence of single-frequency components in HFT noise. They show distinct variations with voltage and frequency, notably maintaining elevated perceptual prominence at salient frequencies (e.g., 5 kHz, 10 kHz). Thus, the TNR and PR serve as robust indicators of human perceptual changes in HFT tonal noise across operating conditions, linking electrical parameter variations to psychoacoustic responses.

3.2.4. Fluctuation Strength and Roughness

Fluctuation strength and roughness are perceptual metrics that characterize human auditory responses to transient variations in sound signals. Specifically, low-frequency modulations induce fluctuation strength, while high-frequency modulations evoke roughness.
Fluctuation strength (unit: vacil) and roughness (unit: asper) may be computed using the following equations [24]:
F = 0.008 0 24 Bark Δ L ( z ) d z f mod / 4 + 4 / f mod
R = 0.0003 f mod 0 24 Bark Δ L ( z ) d z
where F represents fluctuation strength; R represents roughness; fmod denotes the modulation frequency; and ΔL denotes the masking depth.
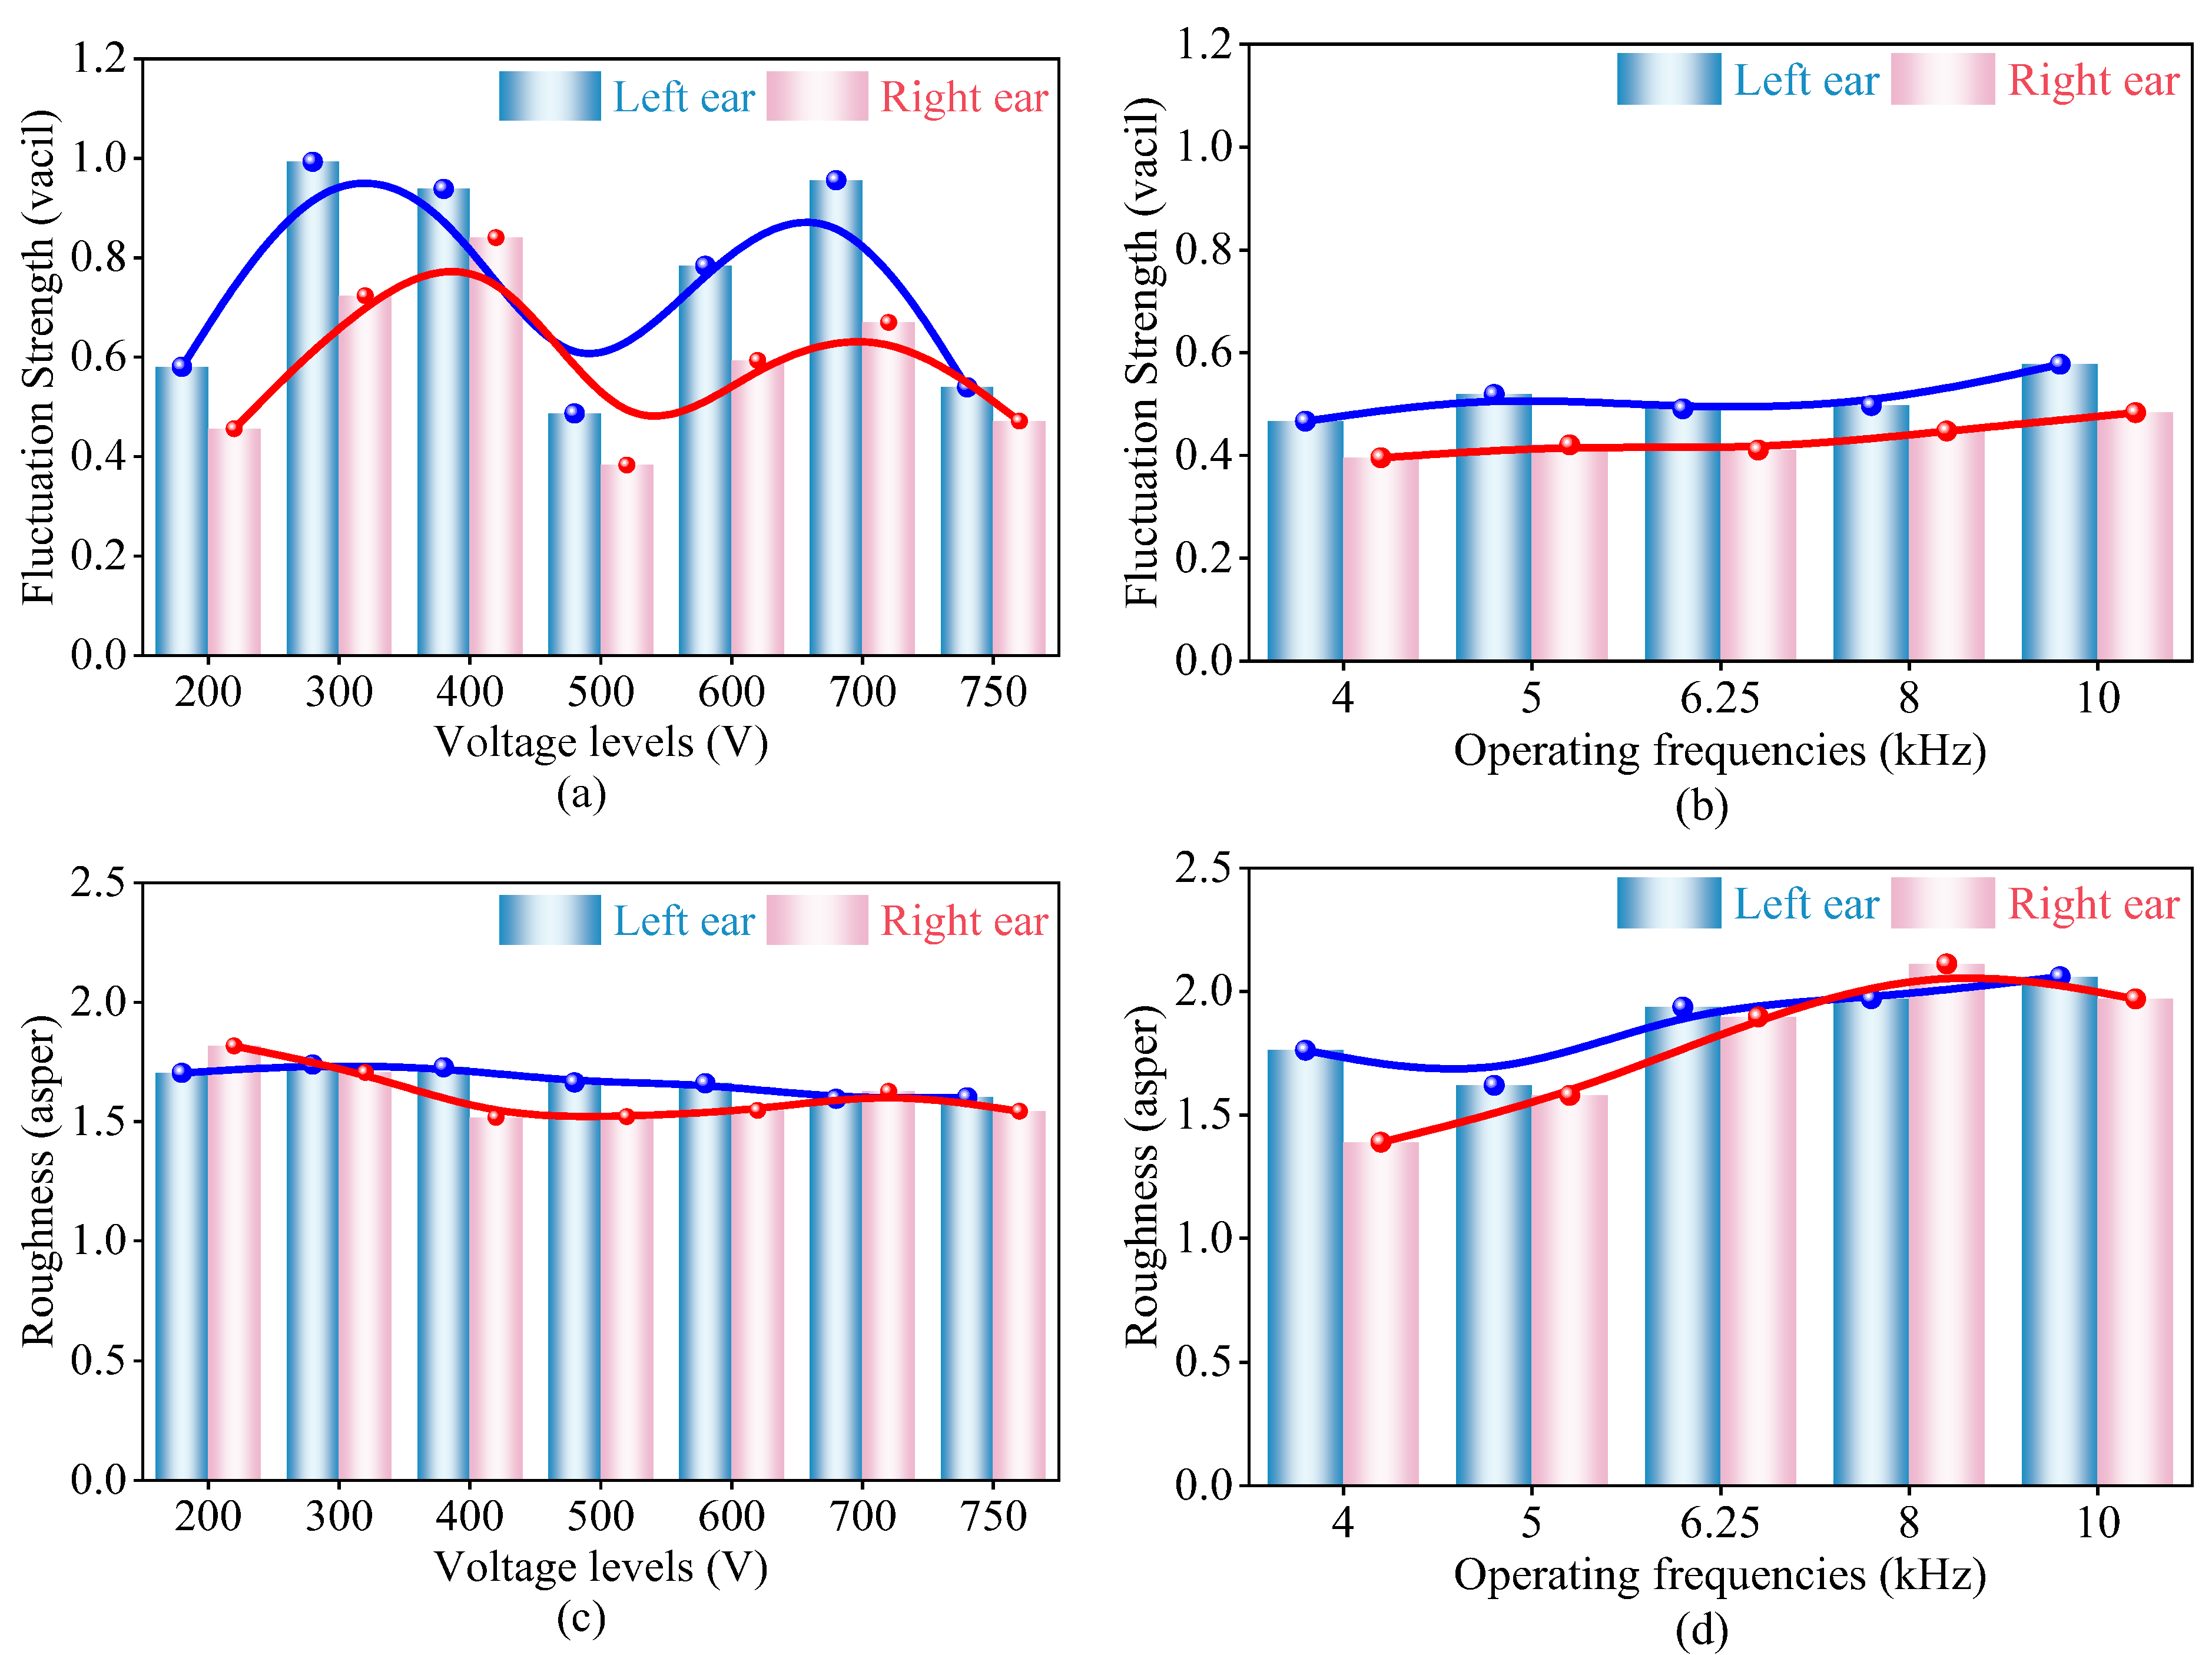
Figure 13 elucidates the variation trends of fluctuation strength and roughness with the voltage levels and operating frequencies.
Figure 13a,c show the responses of the fluctuation strength and roughness to voltage variations under constant 5 kHz excitation. Both metrics fluctuate irregularly as the voltage increases from 200 V to 750 V. For fluctuation strength, the left ear peaks at ~1.0 vacil at 300 V and 700 V, while the right ear peaks at ~0.9 vacil at 400 V, with binaural differences of ~0.1–0.3 vacil across voltages. Roughness remains near 1.5 asper for both ears, with maximal deviations of ~0.2 asper. These irregularities arise because voltage-induced noise modulations lack a consistent frequency signature, disrupting stable perceptual cues.
Figure 13b,d depict the variations in fluctuation strength and roughness with operating frequencies under fixed 750 V excitation. Both show a weak upward trend with frequency (4–10 kHz) but notable nonlinearity. Fluctuation strength rises from ~0.5 vacil (4 kHz) to ~0.6 vacil (10 kHz), plateauing at 5–8 kHz. Roughness increases from ~1.5 asper (4 kHz) to ~2.0 asper (8 kHz) then stabilizes. This aligns with the limited auditory sensitivity to high-frequency modulations: above 5 kHz, broader critical bands reduce transient perception resolution, which is consistent with the masking depth (ΔL) dependence of these metrics.
Irregular voltage responses and weak, nonlinear frequency trends indicate that fluctuation strength and roughness fail to capture consistent transient perception cues. Dependent on stable modulation frequencies and masking depth to produce distinct perceptual sensations, these metrics are undermined by the unstructured variability of HFT noise, suggesting that they lack sufficient sensitivity to variations in electrical parameters.
The comprehensive analysis demonstrates that this study has effectively established the correlation between sound quality parameters and electrical parameters. Parameters including loudness, sharpness, TNR and PR present significant and regular variation trends with changes in voltage and frequency, indicating that these indicators are sensitive to the electrical excitation conditions of HFT. In contrast, fluctuation strength and roughness exhibit no obvious variation patterns, suggesting that they are insensitive to electrical excitation conditions. This provides guidance for the noise evaluation and optimization of HFT. By utilizing the sensitivity of sound quality parameters to electrical parameters, the adjustment and matching of electrical parameters can be further guided to achieve a reasonable balance between equipment performance and sound quality. This represents the significance of establishing the correlation between sound quality parameters and electrical parameters in this work. Furthermore, to validate the effectiveness of the present work, noise tests and corresponding analyses under load conditions were conducted, which confirms the validity of the results obtained in this paper. The corresponding analyses and results under load conditions are included in the Supplementary Material. Although the qualitative trends of noise characteristics are instructive for similar medium and high-frequency transformers, due to the consistent noise generation mechanism, quantitative evaluation for other HFT still requires targeted tests.

4. Conclusions

This study conducts comprehensive noise measurements, multi-dimensional sound quality evaluation, and in-depth analysis of a 70 kW HFT under non-sinusoidal excitation, drawing the following conclusions:
(1)
Systematic clarification of HFT noise characteristics: HFT noise exhibits time-domain steady-state behavior with negligible temporal SPL fluctuations. In the frequency domain, it features prominent single-frequency peaks and distinct harmonic characteristics, with the dominant frequency at twice the operating frequencies and energy concentrated in harmonic components. Noise intensity correlates strongly linearly with voltage, increasing monotonically from ~47.0 dB (A) (200 V) to ~72.0 dB (A) (750 V) at 5 kHz. Conversely, it decreases significantly with the rising frequency, falling from ~82.0 dB (A) (4 kHz) to ~47.0 dB (A) (10 kHz) at 750 V, driven by reduced magnetostrictive effects and electromagnetic forces at higher frequencies.
(2)
Multi-dimensional sound quality evaluation has determined the correlation with the electrical parameters: This study incorporates the sound quality evaluation method into the HFT noise evaluation and establishes correlations between electrical parameters (voltage, frequency) and sound quality metrics. Among the sound quality metrics, loudness, sharpness, TNR and PR exhibit significant and regular trends with variations in voltage and frequency, indicating that they are sensitive to the electrical excitation conditions of HFTs. In contrast, fluctuation strength and roughness show no obvious regular patterns and are insensitive to such excitation conditions. This provides a useful reference for the noise evaluation and optimization of HFTs.
(3)
Single-frequency noise drives subjective annoyance, guiding targeted mitigation: HFT single-frequency noise exhibits significant perceptual salience, overcoming background masking to enable clear auditory resolution and intensifying annoyance. Persistent left-right ear differences underscore the need for binaural analysis. HFT noise optimization should prioritize mitigating single-frequency components to reduce sharpness and tonal prominence, thereby alleviating subjective discomfort.
This study advances the understanding of the noise mechanisms associated with HFT, reveals the objective physical properties of HFT noise through rigorous experimentation, and more importantly, introduces the subjective perceptual dimension of sound quality and establishes correlations between electrical parameters (voltage, frequency) and sound quality metrics. The conclusions of this research provide direct and scientific evidence for guiding the optimal design of low-noise HFT. However, this work still has certain limitations. Future research efforts will focus on the following aspects: conducting noise characteristic and sound quality analyses for various models of medium- and high-frequency transformers, summarizing their typical sound quality features, and verifying the universality of the conclusions obtained in this paper. Furthermore, subjective evaluation experiments will be performed on the noise of HFTs to clarify the correlation between sound quality indicators and human subjective perceptions, so as to further develop a sound quality prediction model that is more suitable for HFTs.

Supplementary Materials

The following supporting information can be downloaded at: https://www.mdpi.com/article/10.3390/acoustics8020028/s1. Figure S1: Binaural specific loudness curves of the HATS under loaded conditions; Figure S2: The influence of voltage levels and operating frequency on loudness under loaded conditions. (a) Variation trend of loudness with voltage levels; (b) Variation trend of loudness with operating frequencies; Figure S3: The influence of voltage levels and operating frequencies on sharpness under loaded conditions. (a) Variation trend of sharpness with voltage levels; (b) Variation trend of sharpness with operating frequencies; Figure S4: The effect of voltage levels and operating frequencies on the TNR and PR under loaded conditions. (a) Variation trend of the TNR with voltage levels; (b) Variation trend of the TNR with operating frequencies; (c) Variation trend of the PR with voltage levels; (d) Variation trend of the PR with operating frequencies; Figure S5: Effect of voltage levels and operating frequencies on fluctuation strength and roughness under loaded conditions. (a) Variation trend of fluctuation strength with voltage levels; (b) Variation trend of fluctuation strength with operating frequencies; (c) Variation trend of roughness with voltage levels; (d) Variation trend of roughness with operating frequencies; Table S1: TNR and PR at salient frequencies.

Author Contributions

Conceptualization, C.Z., L.L. and J.Z.; Methodology, C.Z., L.L., Y.Z. and X.X.; Investigation, L.L., X.D., J.Z. and X.H.; Validation, Y.Z. and X.D.; Writing—original draft, C.Z.; Supervision, X.H. and X.X.; Writing—review and editing, C.Z., X.D., X.X. and X.H. All authors have read and agreed to the published version of the manuscript.

Funding

The present work is supported by the Science and Technology Project of China Southern Power Grid (No. GDKJXM20231462).

Institutional Review Board Statement

Not applicable.

Informed Consent Statement

Not applicable.

Data Availability Statement

The original contributions presented in this study are included in the article. Further inquiries can be directed to the corresponding author.

Conflicts of Interest

Li Li is from Electric Power Research Institute, Guangdong Power Grid Co., Ltd., and Yexin Zhu is from Zhuhai Power Supply Bureau, Guangdong Power Grid Co., Ltd., but they declare no conflicts of interest.

References

  1. Santos, N.; Chaves, M.; Gamboa, P.; Cordeiro, A.; Santos, N.; Pinto, S.F. High frequency transformers for solid-state transformer applications. Appl. Sci. 2023, 13, 7262. [Google Scholar] [CrossRef]
  2. Battal, F.; Balci, S.; Sefa, I. Power electronic transformers: A review. Measurement 2021, 171, 108848. [Google Scholar] [CrossRef]
  3. Sun, K.; Lu, S.; Yi, Z.; Cao, G.; Wang, Y.; Li, Y. A review of high-power high-frequency transformer technology for power electronic transformer applications. Proc. CSEE 2021, 41, 8531–8546. [Google Scholar] [CrossRef]
  4. Li, R.; Kockelman, K.; Lee, J. Reducing Greenhouse Gas Emissions from Long-Distance Business Travel: How Far Can We Go? Transp. Res. Rec. 2022, 2676, 472–486. [Google Scholar] [CrossRef]
  5. Zhang, P.; Yang, Y.; Liu, Z.; Wang, N.; Li, C.; Zhang, J. Simulation and experimental verification of vibration and noise characteristics of nanocrystalline high-frequency transformer. IEEE Trans. Power Electron. 2025, 40, 9429–9438. [Google Scholar] [CrossRef]
  6. Li, Y.; Yang, Z.; Zhang, C.; Mu, S. Vibration and noise measurement of medium-high frequency transformer cores under non-sinusoidal excitation. IEEE Trans. Magn. 2022, 58, 8401405. [Google Scholar] [CrossRef]
  7. Zhang, P.; Liu, Z.; Guo, Z.; Wang, N.; Zhan, Y.; Zhang, J. Research on the vibration and noise characteristics and rapid simulation model of high frequency transformer with nanocrystalline alloy cores. Electr. Power Syst. Res. 2025, 248, 111965. [Google Scholar] [CrossRef]
  8. Dou, Y.; Li, Y.; Chen, T.; Liu, X.; Zhu, J. Vibration and noise characteristics of nanocrystalline cores under high-frequency and non-sinusoidal excitation. IEEE Trans. Magn. 2024, 60, 8401405. [Google Scholar] [CrossRef]
  9. Wang, G.; Zeng, X.; Zhao, Y. Research on the effect of core joints on transformer noise. IEEE Trans. Magn. 2021, 57, 8401806. [Google Scholar] [CrossRef]
  10. Zhao, T.; Liang, J.; Zou, L.; Zhang, L. A new FXLMS algorithm with offline and online secondary-path modeling scheme for active noise control of power transformers. IEEE Trans. Ind. Electron. 2017, 64, 6432–6442. [Google Scholar] [CrossRef]
  11. Yoshida, K.; Hoshino, T.; Murase, S.; Murakami, H.; Miyashita, T. Analysis of load noise components in small core-form transformers. IEEE Trans. Power Deliv. 2021, 36, 2694–2704. [Google Scholar] [CrossRef]
  12. Jiang, P.; Yin, F.; Wang, L. Modeling, simulation and measurement of converter transformer winding multi-frequency vibration Based on electromagnetic structure coupling. Int. J. Electr. Power Energy Syst. 2025, 166, 110587. [Google Scholar] [CrossRef]
  13. Chen, B.; Shen, C.; Liu, Y.; Jin, Y.; Wan, N. Solution and characteristic analysis of high frequency transformer based on electromagnetic field-structural force field-acoustic field. High Volt. Eng. 2024, 50, 4459–4474. [Google Scholar] [CrossRef]
  14. Chen, B.; Shen, C.; Zhang, T.; Liu, Y.; Jin, Y.; Wan, N. Optimization and design of multi-layer resonance composite sound-absorbing structure for high frequency transformer. High Volt. Eng. 2025, 51, 5648–5660. [Google Scholar] [CrossRef]
  15. Noubissi, R.K.; Liu, D.; Du, B. Study on vibration displacement and noise for amorphous metal alloy dry-type transformer. IEEE Trans. Power Del. 2025, 40, 314–322. [Google Scholar] [CrossRef]
  16. Miao, X.; Jiang, P.; Pang, F.; Tang, Y.; Li, H.; Qu, G. Numerical analysis and experimental research of vibration and noise characteristics of oil-immersed power transformers. Appl. Acoust. 2023, 203, 109189. [Google Scholar] [CrossRef]
  17. Sun, P.; Qin, J.; Qiu, W. Development and validation of a new adaptive weighting for auditory risk assessment of complex noise. Appl. Acoust. 2016, 103, 30–36. [Google Scholar] [CrossRef]
  18. Yonemura, M.; Sakamoto, S. Subjective evaluation of loudness of noise containing a low-frequency tonal component. Appl. Acoust. 2025, 229, 110380. [Google Scholar] [CrossRef]
  19. Alamir, M.A.; Hansen, K.L.; Zajamsek, B.; Catcheside, P. Subjective responses to wind farm noise: A review of laboratory listening test methods. Renew. Sust. Energ. Rev. 2019, 114, 109317. [Google Scholar] [CrossRef]
  20. Hong, J.Y.; Lam, B.; Ong, Z.T.; Ooi, K.; Gan, W.S.; Lee, S. A multidimensional assessment of construction machinery noises based on perceptual attributes and psychoacoustic parameters. Autom. Constr. 2022, 140, 104295. [Google Scholar] [CrossRef]
  21. Yao, D.; Zhang, J.; Wang, R.; Chen, C.; Zhang, Y.; Zhao, Y.; Pang, J. A systematic evaluation of helicopter cabin noise: Case study of Robinson R44 RAVEN II. Chin. J. Aeronaut. 2025, 38, 103314. [Google Scholar] [CrossRef]
  22. Cerkovnik, N.; Murovec, J.; Novaković, T.; Prezelj, J. A psychoacoustic evaluation and predictive model for computer axial fan sound quality. Appl. Acoust. 2025, 237, 110749. [Google Scholar] [CrossRef]
  23. Broner, N. The effects of low frequency noise on people—A review. J. Sound Vib. 1978, 58, 483–500. [Google Scholar] [CrossRef]
  24. Fastl, H. Psycho-Acoustics and Sound Quality. In Communication Acoustics; Blauert, J., Ed.; Springer: Berlin/Heidelberg, Germany, 2005; pp. 139–162. [Google Scholar] [CrossRef]
  25. Ma, C.; Li, Q.; Deng, L.; Chen, C.; Liu, Q.; Gao, H. A novel sound quality evaluation method of the diagnosis of abnormal noise in interior permanent-magnet synchronous motors for electric vehicles. IEEE Trans. Ind. Electron. 2017, 64, 3883–3891. [Google Scholar] [CrossRef]
  26. Gwak, D.Y.; Han, D.; Lee, S. Sound quality factors influencing annoyance from hovering UAV. J. Sound Vib. 2020, 489, 115651. [Google Scholar] [CrossRef]
  27. Mian, T.; Choudhary, A.; Fatima, S. An efficient diagnosis approach for bearing faults using sound quality metrics. Appl. Acoust. 2022, 195, 108839. [Google Scholar] [CrossRef]
  28. Zhan, W.; Chen, Y.; Liu, Q.; Li, J.; Sacchi, M.; Zhuang, M.; Liu, Q. Simultaneous prediction of petrophysical properties and formation layered thickness from acoustic logging data using a modular cascading residual neural network (MCARNN) with physical constraints. J. Appl. Geophys. 2024, 224, 105362. [Google Scholar] [CrossRef]
  29. Di, G.; Zhou, X.; Chen, X. Annoyance response to low frequency noise with tonal components: A case study on transformer noise. Appl. Acoust. 2014, 91, 40–46. [Google Scholar] [CrossRef]
  30. Li, J.; Li, L.; Zhang, Y.; Chu, Z.; Fan, X. Annoyance evaluation of noise emitted by urban substation. J. Low Freq. Noise Vib. Act. Control 2021, 40, 2106–2114. [Google Scholar] [CrossRef]
  31. Fastl, H.; Zwicker, E. Psychoacoustics: Facts and Models, 3rd ed.; Springer: Berlin/Heidelberg, Germany, 2007. [Google Scholar] [CrossRef]
  32. Huang, X. Design and Development of NVH for Electric Vehicle; China Machine Press: Beijing, China, 2020. [Google Scholar]
  33. ISO 7779:2018; Acoustics—Measurement of Airborne Noise Emitted by Information Technology and Telecommunications Equipment. ISO: Geneva, Switzerland, 2018.
Figure 1. The size specifications of HFT.
Acoustics 08 00028 g001
Figure 2. Noise test scheme for HFT.
Acoustics 08 00028 g002
Figure 3. Layout of on-site measurement points.
Acoustics 08 00028 g003
Figure 4. Voltage and current waveform diagram.
Acoustics 08 00028 g004
Figure 5. Changes in time-domain sound pressure and overall SPL.
Acoustics 08 00028 g005
Figure 6. Noise spectrum diagram of HFT: (a) 1/3-octave spectrum and (b) narrowband spectrum.
Acoustics 08 00028 g006
Figure 7. The influence of voltage levels and operating frequencies on LA. (a) Variation trend of LA with voltage levels under 5 kHz excitation. (b) Variation trend of LA with operating frequencies under 750 V excitation.
Acoustics 08 00028 g007
Figure 8. The relationship between critical-band rate and frequency.
Acoustics 08 00028 g008
Figure 9. Binaural specific loudness curves of the HATS.
Acoustics 08 00028 g009
Figure 10. The influence of voltage levels and operating frequencies on loudness: (a) variation trend of loudness with voltage levels and (b) variation trend of loudness with operating frequencies.
Acoustics 08 00028 g010
Figure 11. The influence of voltage levels and operating frequencies on sharpness: (a) variation trend of sharpness with voltage levels and (b) variation trend of sharpness with operating frequencies.
Acoustics 08 00028 g011
Figure 12. The effect of the voltage levels and operating frequencies on the TNR and PR. (a) Variation trend of the TNR with voltage levels; (b) variation trend of the TNR with operating frequencies; (c) variation trend of the PR with voltage levels; and (d) variation trend of the PR with operating frequencies.
Acoustics 08 00028 g012
Figure 13. Effect of voltage levels and operating frequencies on fluctuation strength and roughness. (a) Variation trend of fluctuation strength with voltage levels; (b) variation trend of fluctuation strength with operating frequencies; (c) variation trend of roughness with voltage levels; and (d) variation trend of roughness with operating frequencies.
Acoustics 08 00028 g013
Table 1. Main technical parameters of the HFT.
IndexDetails
Rated capacity70 kW
Rated frequency5 kHz
Rated voltage750 V
Turns ratio1:1 (18:18)
Insulation gradeH-grade
Type of coolingNatural cooling
Table 2. TNR and PR at salient frequencies.
Frequency (kHz)TNR (dB)PR (dB)
Left EarRight EarLeft EarRight Ear
512.818.412.417.9
1042.441.342.941.5
Disclaimer/Publisher’s Note: The statements, opinions and data contained in all publications are solely those of the individual author(s) and contributor(s) and not of MDPI and/or the editor(s). MDPI and/or the editor(s) disclaim responsibility for any injury to people or property resulting from any ideas, methods, instructions or products referred to in the content.